Attached files
| file | filename |
|---|---|
| 8-K - FORM 8-K - Lumber Liquidators Holdings, Inc. | tv506470_8k.htm |
Exhibit 99.1

Lumber Liquidators Investor Presentation November 2018

The following information includes statements of our expectations, intentions, plans and beliefs that constitute “forward - looking statements” within the meanings of the Private Securities Litigation Reform Act of 1995 . These statements, which may be identified by words such as “may,” “will,” “should,” “expects,” “intends,” “plans,” “anticipates,” “believes,” “thinks,” “estimates,” “seeks,” “predicts,” “could,” “projects,” “potential” and other similar terms and phrases, are based on the beliefs of our management, as well as assumptions made by, and information currently available to, our management as of the date of such statements . These statements are subject to risks and uncertainties, all of which are difficult to predict and many of which are beyond our control . Forward - looking statements may include, without limitation, statements regarding : government investigations and related legal proceedings ; other current and former legal proceedings ; obligations under various settlement agreements and other compliance matters ; impact of liquidity in the settlement of legal proceedings ; new laws and regulations, including tariffs ; maintenance of valuation allowances on deferred tax assets and the impacts thereof ; the ability to open new stores ; capital expenditures ; anticipating consumer trends ; competition ; internal controls ; funding of the remaining portion of the obligation for the multidistrict litigation ; increased transportation costs ; damage to our assets ; disruption in our ability to finish and distribute our products ; disruptions related to our corporate headquarters relocation ; operating stores in Canada and an office in China ; managing third - party installers and product delivery companies ; renewing store and warehouse leases ; having sufficient suppliers ; disruption in our ability to obtain products from our suppliers ; our, and our suppliers’, compliance with complex and evolving rules, regulations, and laws at the federal, state, and local level ; impact of the Tax Cuts and Jobs Act ; product liability claims ; obtaining products from abroad, including effects of tariffs, as well as effects of antidumping and countervailing duties ; disruption in our ability to operate our business due to the impacts from severe weather ; availability of suitable hardwood ; changes in economic conditions, both domestic and abroad ; sufficient insurance coverage ; access to capital ; managing growth ; disruption due to cybersecurity threats ; handling of confidential customer information ; management information systems disruptions ; alternative e - commerce offerings ; our advertising strategy ; impact of changes in accounting guidance ; impact of installation revenue growth on net sales ; stock price volatility ; and anti - takeover provisions . We specifically disclaim any obligation to update these statements, which speak only as of the dates on which such statements are made, except as may be required under the federal securities laws . Information regarding these and other additional risks and uncertainties is contained in our other reports filed with the Securities and Exchange Commission, including the Item 1 A, “Risk Factors,” section of the Form 10 - K for the year ended December 31 , 2017 , and Item 1 A, “Risk Factors,” section of the Form 10 - Q for the quarter ended September 30 , 2018 . Please also refer to the financial statements and notes and management discussion included in our annual report on Form 10 - K and our quarterly reports on Form 10 - Q for definitions of key terms including comparable store net sales, average sale, comparable store traffic and Selling, General and Administrative ( SG&A) expenses . Safe Harbor 2

To supplement the financial measures prepared in accordance with GAAP, we use the following non - GAAP financial measures : (i) Adjusted Gross Margin ; (ii) Adjusted SG&A ; (iii) Adjusted SG&A (percentage of sales) ; (iv) Adjusted Operating Margin ; and (v) Adjusted Earnings Per Share (EPS) . The non - GAAP financial measures should be viewed in addition to, and not in lieu of, financial measures calculated in accordance with GAAP . These supplemental measures may vary from, and may not be comparable to, similarly titled measures by other companies . The non - GAAP financial measures are presented because management uses these non - GAAP financial measures to evaluate our operating performance and to determine incentive compensation . Therefore, we believe that the presentation of non - GAAP financial measures provides useful supplementary information to, and facilitates additional analysis by, investors . The presented non - GAAP financial measures exclude items that management does not believe reflect our core operating performance, which include regulatory and legal settlements and associated legal and operating costs, and changes in antidumping and countervailing duties, as such items are outside of our control or due to their inherent unusual, non - operating, unpredictable, non - recurring, or non - cash nature . See Non - GAAP reconciliation set forth in the Appendix contained herein . Non - GAAP Financial Measures 3

Leading North American multi - channel specialty retailer providing a complete purchasing solution and broad product selection to the hard surface flooring market • Founded in 1994; IPO in 2007 • NYSE: LL; recent market cap: ~$360M • 409 stores in 47 states and Canada, as of September 30, 2018 • Extensive assortment: solid and engineered hardwoods, laminates, vinyl, bamboo, cork, porcelain tile • Enhanced customer experience enabled by smaller store format and 1:1 engagement with knowledgeable and trained store associates • Bicoastal distribution centers total over 1.5M square feet • Headquartered in Toano , Virginia • Relocating to Richmond, VA in 4Q 2019 Lumber Liquidators 4

Differentiated Business Model Growth Potential Favorable Industry Dynamics • Strong U.S. employment and housing market support remodel spending • Demand for hard surface flooring still supporting LL categories • Increasing desire for knowledgeable sales support and services (installation) fits the LL model Investment Highlights 5 • Quality products, wide selection, and attractive prices • Knowledgeable store and pro team members, showroom stores • Improving online customer interface, and qualified installers to complete the job • Investments in customer web experience designed to drive traffic to LL website and tools (Floor Finder, Store Locator, Product Merchandising, scheduling) • Analytics and techniques to improve reach and effectiveness of advertising spend • Installation network developed with the ability to serve Do - It - For - Me customers in every state • Opportunity to enhance web functionality and experience through installation phase • Pro business expanding with appropriate products, service offerings, and loyalty and pricing programs Improving Financials • Good liquidity and low level of debt; opportunity to accelerate top line growth • Gross margin opportunity in sourcing, transportation costs, assortment • Leverage of SG&A with improved corporate infrastructure and more effective marketing spend Strong Management Team • Strategic leadership team • Balance of retail, home improvement, and multi - channel expertise

Large and growing store network 6 Store Network Characteristics • Small stores with attentive and knowledgeable service • Testing both larger Pro - oriented stores and small market stores • Expect to open 20 - 25 stores per year • 409 stores as of September 30, 2018; potential to reach 500+ stores within 5 years 100 200 300 400 2010 2011 2012 2013 2014 2015 2016 2017 2018 Total Store Count – 409 as of 9/30/2018 Far Reaching National Store Network 409

Consumer Preference of Hard - Surface and Vinyl Plank Categories Continues 7 13% 16% 20% 18% 18% 18% 18% 20% 20% 21% 7% 7% 9% 13% 15% 17% 17% 15% 14% 14% 2% 4% 5% 5% 4% 4% 4% 4% 4% 3% 2% 4% 4% 5% 6% 8% 9% 17% 11% 9% 8% 9% 8% 8% 7% 8% 8% 7% 67% 64% 56% 52% 50% 49% 48% 46% 45% 38% 1997 2002 2007 2012 2013 2014 2015 2016 2017 2023(P) Ceramic Tile/Stone Wood Laminate LVT/LVP/EVP Resilient-Other Carpet Source: 2018 Catalina Research, ‘Floor Covering Industry Trends’ Carpet & Rugs Other Resilient Laminate Wood Ceramic Tile/Stone Floor Covering Product $ Mix [Catalina Research – Manf. Sales Estimate] LVT/LVP/EVP
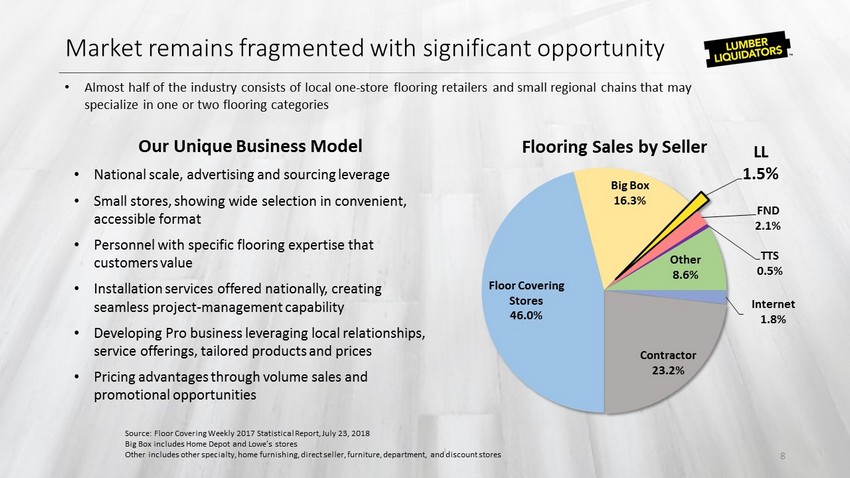
Market remains fragmented with significant opportunity 8 Source: Floor Covering Weekly 2017 Statistical Report, July 23, 2018 Big Box includes Home Depot and Lowe’s stores Other includes other specialty, home furnishing, direct seller, furniture , department, and discount stores • Almost half of the industry consists of local one - store flooring retailers and small regional chains that may specialize in one or two flooring categories Floor Covering Stores 46.0% Big Box 16.3% LL 1.5% FND 2.1% TTS 0.5% Other 8.6% Internet 1.8% Contractor 23.2% Flooring Sales by Seller Our Unique Business Model • National scale, advertising and sourcing leverage • Small stores, showing wide selection in convenient, accessible format • Personnel with specific flooring expertise that customers value • Installation services offered nationally, creating seamless project - management capability • Developing Pro business leveraging local relationships, service offerings, tailored products and prices • Pricing advantages through volume sales and promotional opportunities

Sales: Resilient and g rowing 9 $482 $545 $620 $682 $813 $1,000 $1,047 $979 $961 $1,028 2008 2009 2010 2011 2012 2013 2014 2015 2016 2017 $1,090 (Forecast) $ millions Store Count 150 186 223 263 288 318 352 370 383 393 415 Store Growth 29.3% 24.0% 19.9% 17.9% 9.5% 10.4% 10.7% 5.1% 3.5% 3.1% 5 - 7% Total % Chg. 19.0% 12.9% 13.9% 9.9% 19.3% 23.0% 4.7% (6.5%) (1.8%) 7.1% 5 - 7% Comp % 1.6% FLAT 2.1% (2.0)% 11.4% 15.8% (4.3)% (11.1%) (4.6%) 5.4% 2.5 - 3.5% 2018 Forecast +5 to +7% Revenue rebounded beginning in 2017 after being impacted by issues in 2015 and assortment optimization in 2016.

Hardwood Flooring Manufactured Flooring Moldings and Accessories Installation and Delivery Services Product diversification enhances competitive position 10 • Solid hardwood migration to engineered continues – LL now better balanced with industry • Have maintained laminate business, balanced with growing and profitable vinyl plank business • Installation Services emerging as part of strategy to expand customer base among do - it - for - me shoppers Category Category Composition Hardwood Flooring Includes solid hardwoods (domestic and exotic), engineered, and bamboo products Manufactured Flooring Includes laminate, vinyl plank, and porcelain tile Molding s and Accessories Includes moldings, tools, tiles, and other accessories Installation and Delivery Includes installation and delivery services 2018 YTD Sales Mix, as of September 30, 2018 35% 35% 18% 12%

Quarterly sales trends 11 $150 $170 $190 $210 $230 $250 $270 $290 $310 Millions Quarterly Net Sales $500 $550 $600 $650 $700 Thousands Quarterly Net Sales per Store • Our unique store experience, expanded Installation and Pro businesses, and broader product assortment continue to drive comparable store growth • Significant opportunity remains to increase sales per store and leverage investments made in store personnel and training

Comparable store sales and traffic trends 12 • Comparable store growth expected to continue in the low single digits (2.5 to 3.5%) through 2018. • Installation services contributed approximately 3 points of comp growth through 3Q in 2018. As this expansion matures, we will need to accelerate merchandise growth to offset the reduced contribution. -20% -15% -10% -5% 0% 5% 10% 15% 20% Q1 Q2 Q3 Q4 Q1 Q2 Q3 Q4 Q1 Q2 Q3 Q4 Q1 Q2 Q3 Q4 Q1 Q2 Q3 Q4 Q1 Q2 Q3 Comparable Store Sales Growth % Var. to Prior Year 2013 2014 2016 2015 2017 2018 2018 Guidance: 2.5 - 3.5% -20% -10% 0% 10% Q1 Q2 Q3 Q4 Q1 Q2 Q3 Q4 Q1 Q2 Q3 Q4 Q1 Q2 Q3 Average Ticket & Traffic Growth vs. Prior Year Comp Store Traffic to LY Avg. Ticket to LY 2015 2016 2017 2018

Operating and profitability metrics continue to improve 13 • Adjusted gross margin was 36.2% and 36.0% for the three months ended September 30, 2018 and 2017, respectively, due to a favorable product mix and reduced promotional expenses, among other factors. • Adjusted SG&A increased $1.7 million, or 1.9% of sales, primarily as a result of increased store occupancy costs as the Company has added 22 stores since one year ago. • Gradual leveraging of SG&A contributes to Operating Margin expansion. • See reconciliation to GAAP in the Appendix hereto. 20% 25% 30% 35% 40% 45% 50% Q1 Q2 Q3 Q4 Q1 Q2 Q3 Q4 Q1 Q2 Q3 Q4 Q1 Q2 Q3 Gross Margin by Quarter Adjusted Gross Margin Gross Margin (GAAP) 2015 2016 2017 2018 20% 25% 30% 35% 40% 45% 50% Q1 Q2 Q3 Q4 Q1 Q2 Q3 Q4 Q1 Q2 Q3 Q4 Q1 Q2 Q3 SG&A (% of Sales) Adjusted SG&A SG&A (GAAP) 2015 2016 2017 2018 -20% -15% -10% -5% 0% 5% 10% 15% Q1 Q2 Q3 Q4 Q1 Q2 Q3 Q4 Q1 Q2 Q3 Q4 Q1 Q2 Q3 Operating Margin Adjusted Op Margin Operating Margin (GAAP) 2015 2016 2017 2018 2018 Guidance: 1.6 - 2.0%

Strong Balance Sheet provides stable platform 14 • Inventory increases in 2018 were due to an initiative to increase in - store stock levels in the first half, and strategic build in response to potential 25% tariffs beginning in January 2019. • Strong liquidity and minimal debt supports increased capital investment in strategic initiatives and new store growth. - $ 10.0 $ 20.0 $ 30.0 $ 40.0 $ 50.0 $ 60.0 $ 70.0 $ 80.0 1Q15 2Q15 3Q15 4Q15 1Q16 2Q16 3Q16 4Q16 1Q17 2Q17 3Q17 4Q17 1Q18 2Q18 3Q18 Debt ($ in millons) - 20,000 40,000 60,000 80,000 100,000 120,000 140,000 160,000 1Q15 2Q15 3Q15 4Q15 1Q16 2Q16 3Q16 4Q16 1Q17 2Q17 3Q17 4Q17 1Q18 2Q18 3Q18 Liquidity ($ in millions) Cash & Equivalents Revolver Availablity - $ 50.0 $ 100.0 $ 150.0 $ 200.0 $ 250.0 $ 300.0 $ 350.0 1Q15 2Q15 3Q15 4Q15 1Q16 2Q16 3Q16 4Q16 1Q17 2Q17 3Q17 4Q17 1Q18 2Q18 3Q18 Inventory ($ in millions)
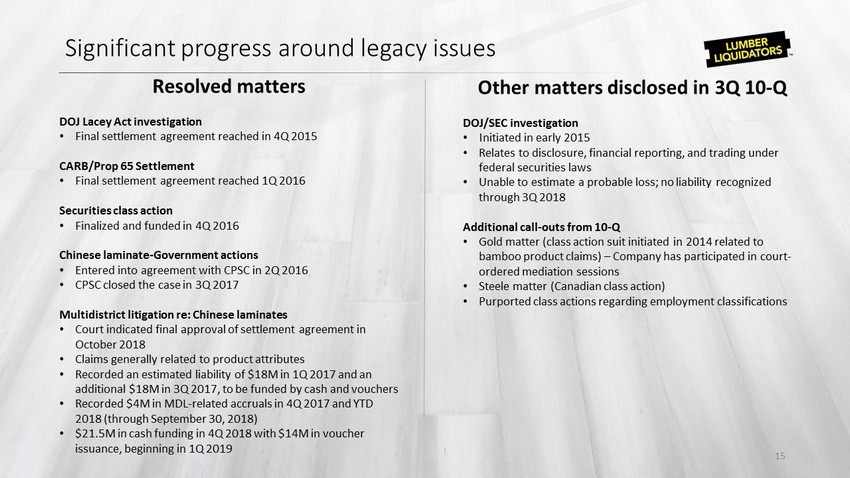
Significant progress around legacy issues Resolved matters DOJ Lacey Act investigation • Final settlement agreement reached in 4Q 2015 CARB/Prop 65 Settlement • Final settlement agreement reached 1Q 2016 Securities class action • Finalized and funded in 4Q 2016 Chinese laminate - Government actions • Entered into agreement with CPSC in 2Q 2016 • CPSC closed the case in 3Q 2017 Multidistrict litigation re: Chinese laminates • Court indicated final approval of settlement agreement in October 2018 • Claims generally related to product attributes • Recorded an estimated liability of $18M in 1Q 2017 and an additional $18M in 3Q 2017, to be funded by cash and vouchers • Recorded $ 4 M in MDL - related accruals in 4Q 2017 and YTD 2018 (through September 30, 2018) • $21.5M in cash funding in 4Q 2018 with $14M in voucher issuance, beginning in 1Q 2019 Other matters disclosed in 3Q 10 - Q DOJ/SEC investigation • Initiated in early 2015 • Relates to disclosure, financial reporting, and trading under federal securities laws • U nable to estimate a probable loss; no liability recognized through 3Q 2018 Additional call - outs from 10 - Q • Gold matter (class action suit initiated in 2014 related to bamboo product claims ) – Company has participated in court - ordered mediation sessions • Steele matter (Canadian class action) • Purported class actions regarding employment classifications 15

Strategic Priorities

Our Mission: “From inspiration to installation, our passion is to make beautiful flooring possible and easy for all” We execute against this through four key strategies: Strategic priorities 17 Enhance the Customer Experience Opportunistically Expand the Business Continue to Enhance Sourcing Capabilities Continue to Improve Operational Effectiveness STRENGTHEN • Invest in customer - facing technology, such as web experience and site performance • Strengthen digital marketing platform and improve e - commerce effectiveness • Continue to enhance the assortment and product available to our customer • Continue to invest and focus on installation services and the do - it - for - me customer • Grow Pro business by targeting key segments and refining service offerings • Expand store base • Continue to use risk assessments to ensure compliant sourcing from around the globe • Maintain rigorous testing and certification processes to ensure each facility and product meets regulatory and safety standards • Implement solutions that allow more store associate selling time and focus on the customer • Continue to improve store environment • Invest in tools and resources that will increase conversion G R O W

Investments in omnichannel initiatives and store will lead to an enhanced customer experience, both in - store and on digital platforms. Omnichannel strategy • Digitally support customer inspiration and project management • Simplify sales and installation process (measures, scheduling ) • Integrate data analytics to support shopper identification • Enhance inventory visibility and order readiness We continue to invest in the purchase and installation processes to make them easier, quicker and seamless to our customers, regardless of the channel Enhance the customer experience 18 Available Assortment • Extend existing product lines • Pursue complementary products • Integrated e - com, store, and services shopping experience Improved in - store experience • Continue training and Saturday team huddles to develop new associates into flooring experts • Refine our associates’ knowledge and capabilities regarding product features, relevant accessories, and financing

We look for opportunities to align our offering and sales approach to meet the dynamic needs of the home improvement customer. Do - It - For - Me Pro/ commercial Store expansion • We have opened 16 new stores in 2018 (as of September 30, 2018) • We are targeting a total 22 new stores by the end of 2018, and expect to reach 500 stores within 5 years • A larger and growing segment of customers seek installation support and a one - stop floor solution • We have installation available nationally, and began national advertising in 2018 • We are building out a suite of services and products most desired by the Pro • We have a range of products well - suited to commercial applications Opportunistically expand the business 19

We aim to expand and improve our technology, team and tactics to ensure we are delivering a best - in - class customer experience for the flooring consumer while driving significantly improved business results. Enhanced Consumer Website Experience Installation and Pro Website Functionality Improved Digital Marketing • Robust analytics, measurement and marketing automation • Budget and mix optimization to drive traffic and orders • New partnerships to improve efficiency and efficacy • Hiring digital experts to drive accelerated growth • Test and learn approach used to enhance current experience • Improved customer data capture and communication • Mobile experience with uncluttered look, feel and functionality • National brand that is locally - focused and optimized • Build the LL Installation Portal & digitize the installation experience • Provide the ability to view project status along the journey to installers and customer s Digital Strategy 20 We aim to aggressively expand and optimize both the digital marketing portfolio and the online customer experience to deliver an exceptional experience.

Enhance responsible, compliant sourcing and quality assurance 21 • In 2015, Lumber Liquidators began to systematically enhance compliance and sustainability practices everywhere we do business through a multitiered approach • We maintain a rigorous quality assurance program to ensure our products meet our demanding quality and safety requirements Risk - based assessments We utilize a combination of internal and external certification, testing and auditing teams to ensure our facilities and products meet regulatory and safety standards. Vendor validation & monitoring We conduct in - person facility and desk audits, process reviews and document assessments for new and existing flooring vendor partners to ensure consistent compliance and address corrective actions. Purchase order review We use purchase order review to ensure compliance in the supply chain. Quality assurance We perform product testing inspections at the site of manufacture and random monitoring of in - bound products for both quality and safety elements.

Sourcing diversification enhances competitive position 22 North America • Solid and engineered hardwoods • Laminates Europe • Laminates South America • Solid and engineered hardwoods • Wood - look ceramic tile Asia • Vinyl and EVP • Engineered hardwood • Solid and engineered bamboo North America 41% Europe 8% South America 6% Asia 45% • Solid and growing relationships with suppliers around the world • Strong compliance protocols built and in place across all vendors * 9 months ended September 30, 2018

Experienced and motivated leadership team 23 Dennis Knowles Chief Executive Officer Charles Tyson Chief Customer Experience Officer Marty Agard Chief Financial Officer Lee Reeves Chief Legal Officer & Corporate Secretary Carl Daniels Chief Supply Chain Officer Mark Gronemeyer Senior Vice President, Store Operations Chris Thomsen Senior Vice President, Chief Information Officer Jennifer Bohaty Senior Vice President, Chief Ethics & Compliance Officer Team with strong leadership and compelling experience within the home improvement and retail sectors

Appendix

Financial highlights 25 $ in millions 2014 FY FY 1Q 2Q 3Q 4Q FY 1Q 2Q 3Q 4Q FY 1Q 2Q 3Q Income Statement: Net Sales 1,047.4$ 978.8$ 233.5$ 238.1$ 244.1$ 244.9$ 960.6$ 248.4$ 263.5$ 257.2$ 259.9$ 1,029.0$ 261.8$ 283.5$ 270.5$ Gross Margin 418.2 278.9 76.1 70.6 76.7 80.5 303.9 86.8 97.5 92.7 92.1 369.1 95.0 101.3 100.7 Gross Margin as a % of Sales 39.9% 28.5% 32.6% 29.7% 31.4% 32.9% 31.6% 34.9% 37.0% 36.0% 35.4% 35.9% 36.3% 35.7% 37.2% SG&A* 314.1 362.1 117.2 89.9 100.7 89.7 397.5 112.2 92.3 110.0 91.5 406.0 96.4 102.2 94.0 SG&A as a % of Sales 30.0% 37.0% 50.2% 37.8% 41.3% 36.6% 41.4% 45.2% 35.0% 42.8% 35.2% 39.5% 36.8% 36.1% 34.7% Pre-Tax Profit (Loss) 104.1$ (83.2)$ (41.1)$ (19.3)$ (24.0)$ (9.2)$ (93.6)$ (25.4)$ 5.1$ (17.3)$ 0.6$ (37.0)$ (1.4)$ (0.9)$ 6.7$ Cash Flows: Cash Flow from Operations 57.1 9.2 (8.2) (15.5) 13.5 (17.4) (27.6) (29.8) 13.0 38.0 19.8 41.1 (14.9) (6.7) (4.3) Memo: Impact of change in net Inv. & A/P - 50.2 1.3 5.3 4.3 (3.0) 7.9 (32.7) 6.4 (5.2) 18.2 (13.3) (18.1) (10.7) (16.9) Cash Flow from Investing Activities (71.1) (22.5) (2.4) (0.9) (4.4) (0.6) (8.3) (2.5) (1.1) (1.1) (1.7) (6.4) (3.0) (3.5) (3.5) Cash Flow from Financing Activities (46.2) 19.7 4.9 7.2 (0.9) 19.6 30.8 32.3 (15.2) (26.6) (17.1) (26.6) 10.1 8.7 8.4 Effect of Exchange Rates (0.1) (0.0) 1.0 (0.1) (0.1) (0.1) 0.7 0.6 0.0 0.1 0.1 0.8 - - - Total GAAP Cash Flow (60.3) 6.4$ (4.7) (9.2) 8.1$ 1.5$ (4.4) 0.7$ (3.3) 10.5$ 1.1$ 8.9$ (7.8) (1.5) 0.6$ Balance Sheet: Inventory 301.5$ 244.4$ 240.0$ 254.9$ 253.4$ 301.9$ 301.9$ 301.3$ 275.1$ 252.9$ 262.3$ 262.3$ 273.4$ 296.8$ 304.7$ AP 63.6 55.2 52.2 72.4 75.1 120.6 120.6 87.4 67.6 40.2 67.7 67.7 60.7 73.4 64.4 Net 237.9 189.2 187.8 182.5 178.3 181.2 181.2 214.0 207.6 212.7 194.6 194.6 212.7 223.4 240.3 Change in net Inv. & A/P (50.2) (1.3) (5.3) (4.3) 3.0 (7.9) 32.7 (6.4) 5.2 (18.2) 13.3 18.1 10.7 16.9 Total Debt 20.0$ 20.0$ 25.0$ 32.0$ 20.0$ 40.0$ 40.0$ 72.0$ 57.0$ 32.0$ 15.0$ 15.0$ 26.0$ 35.0$ 43.0$ Liquidity 0.3$ 93.9$ 83.6$ 65.3$ 118.0$ 101.0$ 101.0$ 71.2$ 82.8$ 119.0$ 137.1$ 137.1$ 118.8$ 108.3$ 101.0$ 2015 2016 2017 2018

Non - GAAP reconciliation 26 1 We recognized countervailing and antidumping income of $2.8 million and $4.9 million associated with applicable prior - year shipm ents of engineered hardwood from China for the three and nine months ended September 30, 2018, respectively, and $2.8 million of income for the nin e months ended September 30, 2017. 2 In the second quarter 2017, we reduced the reserve that had been established in a prior period for estimated costs to be incu rre d related to our indoor air quality testing program by approximately $1 million. This reserve was recorded in other current liabilities in the condensed co nsolidated balance sheet. 000's FY 2015 1Q16 2Q16 3Q16 4Q16 FY 2016 1Q17 2Q17 3Q17 4Q17 FY 2017 1Q18 2Q18 3Q18 Gross Profit Reported Gross Profit $ 278,858 $ 76,110 $ 70,584 $ 76,689 $ 80,487 $ 303,869 $ 86,799 $ 97,455 $ 92,687 $ 92,120 $ 369,061 $ 94,972 $ 101,310 $ 100,682 Less: Anti - Dumping Adjustments (1) 4,921 - 5,450 - - 5,450 - (2,797) - - (2,797) - (2,126) (2,822) Indoor Air Quality Testing Program (2) 9,445 2,895 3,292 - - 6,187 - (993) - - (993) - - - Inventory Impairments 29,051 - - - - - - - - - - - - - Adjusted Gross Profit $ 322,276 $ 79,004 $ 79,326 $ 76,689 $ 80,487 $ 315,506 $ 86,799 $ 93,665 $ 92,687 $ 92,120 $ 365,271 $ 94,972 $ 99,184 $ 97,860

Non - GAAP reconciliation (continued) 27 (3) This amount represents the charge to earnings in 2017 related to the Formaldehyde MDL and Abrasion MDL settlements and charges in 2018 fo r c ertain Related Laminate Matters. (4) Represents charges to earnings related to our defense of certain significant legal actions during the period. This does not include all legal costs incurred by the Company. (5) This amount represents the net charge to earnings related to the stock - based element of our settlement in the securities cl ass action lawsuit in addition to $2.5 million related to our derivatives class action lawsuit. (6) Represents settlement accruals related to the completed DOJ - Lacey Act investigation in 2016 (7) All Other in 2016 relates primarily to a retention initiative and the net impact of the CARB and Prop 65 settlements. All Oth er in 2017 represents costs to dispose of certain Chinese laminate products whose sales were discontinued in 2015, and an impair men t of certain assets related to a vertical integration initiative we have discontinued. All Other in 3Q 2018 reflects the impairment of certain assets related to our decision to exit the finishing business. FY 2015 1Q16 2Q16 3Q16 4Q16 FY 2016 1Q17 2Q17 3Q17 4Q17 FY 2017 1Q18 2Q18 3Q18 SG&A Reported SG&A $ 362,051 $ 117,236 $ 89,900 $ 100,661 $ 89,707 $ 397,504 $ 112,214 $ 92,335 $ 109,962 $ 91,515 $ 406,027 $ 96,418 $ 102,223 $ 93,988 Less: Multi - District Litigation (3) - - - - - - (18,000) - (18,000) (960) (36,960) (250) (2,701) - Legal & Professional Fees (4) (21,059) (10,414) (8,294) (6,321) (3,385) (28,414) (2,408) (3,526) (2,940) (2,440) (11,314) (3,067) (3,325) (2,991) Securities & Derivatives Class Action (5) - (18,520) 600 (4,250) 2,910 (19,260) - - - - - - - - Lacy / DOJ Settlement (6) (13,155) - - - - - - - - - - - - - All Other (7) (11,089) (1,275) (945) (580) - (2,800) - - (1,459) (1,687) (3,146) - - (1,769) Adjusted Total SG&A $ 316,748 $ 87,027 $ 81,261 $ 89,510 $ 89,232 $ 347,030 $ 91,806 $ 88,809 $ 87,563 $ 86,428 $ 354,606 $ 93,101 $ 96,197 $ 89,227

Non - GAAP reconciliation (continued) 28 000's FY 2015 1Q16 2Q16 3Q16 4Q16 FY 2016 1Q17 2Q17 3Q17 4Q17 FY 2017 1Q18 2Q18 3Q18 Operating (Loss) Income, GAAP $ (83,193) $ (41,127) $ (19,316) $ (23,972) $ (9,220) $ (93,635) $ (25,415) $ 5,120 $ (17,275) $ 605 $ (36,966) $ (1,446) $ (913) $ 6,695 Gross Margin Total 43,147 2,895 8,742 - - 11,637 - (3,790) - - (3,790) - (2,126) (2,822) SG&A Total 45,303 30,209 8,639 11,151 475 50,474 20,408 3,526 22,399 5,087 51,420 3,317 6,026 4,760 Adjusted Operating Profit $ 5,257 $ (8,023) $ (1,935) $ (12,821) $ (8,745) $ (31,524) $ (5,007) $ 4,856 $ 5,124 $ 5,692 $ 10,664 $ 1,871 $ 2,986 $ 8,633 Adjusted Operatin g Profit Margin 0.5% (2.2%) (0.8%) (5.2%) (3.6%) (3.0%) (1.8%) 2.3% 2.2% 2.4% 1.3% 0.9% 1.2% 3.3% Net (Loss) Income $ (56,433) $ (32,402) $ ( 12,230) $ (18,438) $ (5,493) $ (68,563) $ (26,372) $ 4,475 $ ( 18,915 ) $ (2,989) $ (43,801) $ ( 1,972) $ (1,454) $ 5,923 Net (Loss) Income per Diluted Share (EPS) $ (0.90) $ (1.20) $ (0.50) $ (0.70) $ (2.50) $ (1.20) $ (0.90) $ 0.20 $ (0.70) $ (1.30) $ (0.70) $ (0.10) $ (0.10) $ 0.21 Adjusted Net Income $ 33,465 $ 141 $ 5,151 $ (7,287) $ (4,457) $ (6,452) $ (5,964) $ 4,211 $ 3,484 $ 2,098 $ 3,829 $ 1,345 $ 2,446 $ 7,861 Adjusted EPS* $ 0.30 $ (0.36) $ 0.19 $ (0.42) $ (0.17) $ (0.76) $ (0.21) $ 0.15 $ 0.12 $ 0.07 $ 0.03 $ 0.05 $ 0.09 $ 0.27 * In order to calculate Adjusted EPS, the Company considered the tax impact related to the required pre - tax adjustments. The Comp any recorded a full valuation allowance against its net deferred tax assets beginning in 1Q 2017, which effectively offset its federal taxes. Therefore, the Company did not identify any tax impact due to these adjust men ts during those periods. Adjusted EPS for the periods 3Q 2015 through 4Q 2016 properly includes the tax impact at each quarter’s marginal tax rate . (Totals may not foot due to rounding)

Lumber Liquidators Investor contacts Steve Calk & Jackie Marcus ir@lumberliquidators.com