Attached files
| file | filename |
|---|---|
| EX-32.1 - EX-32.1 - Lumber Liquidators Holdings, Inc. | ll-20191231ex3216e4912.htm |
| EX-31.2 - EX-31.2 - Lumber Liquidators Holdings, Inc. | ll-20191231ex312313ea5.htm |
| EX-31.1 - EX-31.1 - Lumber Liquidators Holdings, Inc. | ll-20191231ex31128ca16.htm |
| EX-23.1 - EX-23.1 - Lumber Liquidators Holdings, Inc. | ll-20191231ex231d91451.htm |
| EX-21.1 - EX-21.1 - Lumber Liquidators Holdings, Inc. | ll-20191231ex211512b26.htm |
| EX-10.46 - EX-10.46 - Lumber Liquidators Holdings, Inc. | ll-20191231ex1046e95d9.htm |
| EX-10.45 - EX-10.45 - Lumber Liquidators Holdings, Inc. | ll-20191231ex1045f0aa8.htm |
| EX-4.2 - EX-4.2 - Lumber Liquidators Holdings, Inc. | ll-20191231ex42e19112b.htm |
UNITED STATES
SECURITIES AND EXCHANGE COMMISSION
Washington, D.C. 20549
FORM 10-K
☒ ANNUAL REPORT PURSUANT TO SECTION 13 OR 15(d) OF THE SECURITIES EXCHANGE ACT OF 1934
For the fiscal year ended December 31, 2019
OR
☐ TRANSITION REPORT PURSUANT TO SECTION 13 OR 15(d) OF THE SECURITIES EXCHANGE ACT OF 1934
For the transition period from to
Commission file number: 001‑33767

Lumber Liquidators Holdings, Inc.
(Exact Name of Registrant as Specified in its Charter)
|
Delaware |
27‑1310817 |
|
(State or other jurisdiction of incorporation or organization) |
(I.R.S. Employer Identification No.) |
|
|
|
|
4901 Bakers Mill Lane, Richmond, Virginia |
23230 |
|
(Address of principal executive offices) |
(Zip Code) |
(804) 463‑2000
(Registrant’s telephone number, including area code)
Securities registered pursuant to Section 12(b) of the Act:
|
Title of each class |
|
Name of each exchange on which registered |
|
Common Stock, par value $0.001 per share |
|
New York Stock Exchange |
Trading Symbol: LL
Securities registered pursuant to Section 12(g) of the Act: None
Indicate by check mark if the registrant is a well-known seasoned issuer, as defined in Rule 405 of the Securities Act. Yes ☐ No ☒
Indicate by check mark if the registrant is not required to file reports pursuant to Section 13 or Section 15(d) of the Act. Yes ☐ No ☒
Indicate by check mark whether the registrant: (1) has filed all reports required to be filed by Section 13 or 15(d) of the Securities Exchange Act of 1934 during the preceding 12 months (or for such shorter period that the registrant was required to file such reports), and (2) has been subject to such filing requirements for the past 90 days. Yes ☒ No ☐
Indicate by check mark whether the registrant has submitted electronically every Interactive Data File required to be submitted pursuant to Rule 405 of Regulation S-T (§232.405 of this chapter) during the preceding 12 months (or for such shorter period that the registrant was required to submit such files). Yes ☒ No ☐
Indicate by check mark whether the registrant is a large accelerated filer, an accelerated filer, a non-accelerated filer, a smaller reporting company or an emerging growth company. See definitions of “large accelerated filer,” “accelerated filer,” “smaller reporting company” and “emerging growth company” in Rule 12b-2 of the Exchange Act. (Check one):
|
Large accelerated filer ☐ |
☒ Accelerated filer |
☐ Non-accelerated filer |
☐ Smaller reporting company |
☐ Emerging growth company |
If an emerging growth company, indicate by check mark if the registrant has elected not to use the extended transition period for complying with any new or revised financial accounting standards provided pursuant to Section 13(a) of the Exchange Act. ☐
Indicate by check mark whether the registrant is a shell company (as defined in Rule 12b‑2 of the Act). Yes ☐ No ☒
As of June 28, 2019, the last business day of the registrant’s most recent second quarter, the aggregate market value of the registrant’s common stock held by non-affiliates of the registrant was $325.1 million based on the closing sale price as reported on the New York Stock Exchange.
Indicate the number of shares outstanding of each of the registrant’s classes of common stock as of February 20, 2020:
|
Title of Class |
Number of Shares |
|
Common Stock, $0.001 par value |
28,724,931 |
DOCUMENTS INCORPORATED BY REFERENCE
Part III incorporates certain information by reference from the registrant’s proxy statement for the 2020 annual meeting of stockholders, which will be filed no later than 120 days after the close of the registrant’s fiscal year ended December 31, 2019.
LUMBER LIQUIDATORS HOLDINGS, INC.
ANNUAL REPORT ON FORM 10‑K
2
CAUTIONARY NOTE REGARDING FORWARD-LOOKING STATEMENT
This report includes statements of the Company’s expectations, intentions, plans and beliefs that constitute “forward-looking statements” within the meanings of the Private Securities Litigation Reform Act of 1995. These statements, which may be identified by words such as “may,” “will,” “should,” “expects,” “intends,” “plans,” “anticipates,” “believes,” “thinks,” “estimates,” “seeks,” “predicts,” “could,” “projects,” “potential” and other similar terms and phrases, are based on the beliefs of the Company’s management, as well as assumptions made by, and information currently available to, the Company’s management as of the date of such statements. These statements are subject to risks and uncertainties, all of which are difficult to predict and many of which are beyond the Company’s control. These risks include, without limitation, the impact of any of the following:
|
· |
obligations related to and impacts of new laws and regulations, including pertaining to tariffs and exemptions; |
|
· |
the outcomes of legal proceedings, and the related impact on liquidity; |
|
· |
reputational harm; |
|
· |
obtaining products from abroad, including the effects of a pandemic, including Coronavirus and tariffs, as well as the effects of antidumping and countervailing duties; |
|
· |
obligations under various settlement agreements and other compliance matters; |
|
· |
disruptions due to cybersecurity threats, including any impacts from a network security incident; |
|
· |
inability to open new stores, find suitable locations for our new store concept, and fund other capital expenditures; |
|
· |
inability to execute on our key initiatives or such key initiatives do not yield desired results; |
|
· |
managing growth; |
|
· |
transportation costs; |
|
· |
damage to our assets; |
|
· |
disruption in our ability to distribute our products, including due to disruptions from the impacts of severe weather; |
|
· |
operating stores in Canada and an office in China; |
|
· |
managing third-party installers and product delivery companies; |
|
· |
renewing store, warehouse, or other corporate leases; |
|
· |
having sufficient suppliers; |
|
· |
our, and our suppliers’, compliance with complex and evolving rules, regulations, and laws at the federal, state, and local level; |
|
· |
disruption in our ability to obtain products from our suppliers; |
|
· |
product liability claims; |
|
· |
availability of suitable hardwood, including due to disruptions from the impacts of severe weather; |
|
· |
changes in economic conditions, both domestic and abroad; |
|
· |
sufficient insurance coverage, including cybersecurity insurance; |
|
· |
access to and costs of capital; |
|
· |
the handling of confidential customer information, including the impacts from the California Consumer Privacy Act; |
|
· |
management information systems disruptions; |
|
· |
alternative e-commerce offerings; |
|
· |
our advertising and overall marketing strategy; |
|
· |
anticipating consumer trends; |
|
· |
competition; |
|
· |
impact of changes in accounting guidance, including implementation guidelines and interpretations; |
|
· |
maintenance of valuation allowances on deferred tax assets and the impacts thereof; |
|
· |
internal controls; |
|
· |
stock price volatility; and |
|
· |
anti-takeover provisions. |
3
The Company specifically disclaims any obligation to update these statements, which speak only as of the dates on which such statements are made, except as may be required under the federal securities laws. These risks and other factors include those listed in this Item 1A. “Risk Factors” and elsewhere in this report.
References to “we,” “our,” “us,” “the Company” and “Lumber Liquidators” generally refers to Lumber Liquidators Holdings, Inc. and its consolidated subsidiaries collectively and, where applicable, individually.
Overview
Lumber Liquidators is one of the leading specialty retailers of hard-surface flooring in North America. We feature more than 400 varieties of floors including waterproof vinyl plank, solid and engineered hardwood, laminate, bamboo, porcelain tile and cork flooring. Additionally, we provide a wide selection of flooring enhancements and accessories to complement, install and maintain new floors. Every location is staffed with flooring experts who can provide advice, pro services and installation options for all of Lumber Liquidators' products, much of which is in stock and ready for delivery. We offer delivery and in-home installation services through third-party independent contractors for customers who purchase our floors. We sell primarily to homeowners or to contractors on behalf of homeowners, as well as to commercial (“Pro”) customers through a network of store locations and online. We operate as a single business segment, with our customer relationship center, website and customer service network supporting our retail store and online operations.
We believe we have achieved a reputation for offering great value, superior service and a broad selection of high-quality, hard-surface flooring products. With a balance of selection, quality, availability, service and price, we believe our value is the most complete within a highly fragmented hard-surface flooring market. The foundation for our value is strengthened by the industry expertise of our people, our singular focus on hard-surface flooring, and our advertising reach and frequency.
Lumber Liquidators is a Delaware corporation with its headquarters in Richmond, Virginia. We were founded in 1994 and our initial public offering was in November 2007. Our common stock trades on the New York Stock Exchange under the symbol “LL.” We operate in a holding company structure with Lumber Liquidators Holdings, Inc. serving as our parent company and certain direct and indirect subsidiaries, including Lumber Liquidators, Inc., Lumber Liquidators Services, LLC, Lumber Liquidators Production, LLC, and Lumber Liquidators Canada, ULC, conducting our operations.
Our Business
Market
According to the July 2019 Issue of Floor Covering Weekly, United States installed floor covering product sales in 2018 were $42 billion, not including labor. Within this market, United States hardwood, laminate and vinyl flooring sales accounted for 39% of the total. Flooring sales are driven by a number of factors including discretionary income and the housing market. Including installation, the overall flooring industry has grown at a compound annual growth rate of 3.7% from 2014 through 2018. Over the same period, hardwood, laminate and vinyl flooring sales, including the cost of installation grew at a compound annual growth rate of 6%. We believe improvements in the quality and construction of certain products, increasing resiliency and water-tolerance of products, ease of installation, availability in a broad range of retail price points, and movement away from soft surfaces will drive continued hard-surface flooring share gain versus soft surface flooring in the future.
4
Competition
We compete for customers in a highly fragmented marketplace, where we believe no one retailer has captured more than a 21% share of the consumer market for flooring (including carpet). Although the market includes the national home improvement warehouse chains, national specialty retailers, warehouse clubs and online retailers, we believe nearly half of the industry consists of local one-store flooring retailers, small chains of stores that may specialize in one or two flooring categories, and a limited number of regional chains.
Customers
We target several distinct customer groups who each have varied needs with respect to their flooring purchases, including do-it-yourself (“DIY”) customers, do-it-for-me (“DIFM”) customers, and Pro customers. We believe that each of the customer groups we serve is passionate about their flooring purchase and value our wide assortment of flooring products, availability, and the quality of those products. While our offering to each of these groups begins with the same broad assortment and knowledgeable store associates, each of these customer groups requires unique service components based on the ability of our associates to share detailed product knowledge and preferred installation methods. We offer DIFM customers installation services, while our DIY and Pro customers receive more personal attention when completing their purchase, including dedicated call center resources. All customer groups are offered delivery services.
Products and Services
Product Selection
We offer an extensive assortment of hard-surface flooring under more than 15 proprietary brand names, led by our flagship, Bellawood®. We have invested significant resources developing these national brand names. Our hard-surface flooring products are available in various widths and lengths and are generally differentiated in terms of quality and price based on wood versus manufactured materials, the species, wood grade and durability of finish. Prefinished floors are the dominant choice for residential customers over unfinished wood planks that have a finish applied after installation. We also offer an assortment of flooring enhancements, installation services and accessories, including moldings, underlayments, adhesives and tools.
Direct Sourcing
We source directly from mills and other vendors which enables us to offer a broad assortment of high-quality proprietary products to our customers at a consistently competitive cost. We seek to establish strong, long-term relationships with our vendors around the world. In doing so, we look for vendors that have demonstrated an ability to meet our demanding specifications, our rigorous compliance standards and the capability to provide sustainable and growing supplies of high-quality, innovative, trend-right products. We source from both domestic and international vendors, and in 2019, approximately 47% of our product was sourced from Asia, 6% was sourced from Europe and Australia, and 5% was sourced from South America.
Supply Chain
Our supply chain is wholly focused on delivering a complete assortment of products to our customers in an efficient manner. We own a one million square foot distribution center on approximately 100 acres of land in Henrico County, Virginia, which serves the stores located in the easternmost two-thirds of the United States and Ontario, Canada. We operate a 500,000 square foot leased distribution center in Pomona, California as the primary distribution center for the stores located in the westernmost one-third of the United States. A number of our vendors maintain certain inventory levels for shipment directly to our stores or our customers. Our product is generally transported boxed and palletized, and the weight of our product is a key driver of our supply chain costs.
5
Compliance and Quality Control
Our compliance programs are designed to ensure the products we sell are safe and responsibly sourced, and meet all regulatory and statutory requirements, including, without limitation, requirements associated with the Lacey Act, United States Environment Protection Agency ("EPA") and the California Air Resources Board (“CARB”). We utilize a variety of due diligence processes and controls, including supplier audits, periodic on-site visits, and product testing to ensure such compliance. We utilize a risk-based approach to implement and operate the various aspects of our compliance program. Our compliance program considers, among other things, product risk, the level of vertical integration at our suppliers’ mills, legality concerns noted by both private and government parties, and the results of on-site audits that we perform. Our evaluation of sourcing risk is a key component in our allocation of resources to ensure we meet our standards for product compliance and safety. Compliance and Quality Control teams located in the United States and in China are supplemented with external resources that provide independent analyses, which are incorporated into our review processes and monitor our sourcing efforts across all areas from which we source product. Compliance programs and functions are continually under review, updated and enhanced as appropriate to stay current with statutory and regulatory requirements. Our compliance and regulatory affairs committee of the board of directors provides oversight of our compliance programs.
Additionally, we maintain and operate a 1,500 square foot lab within our distribution center on the east coast. The lab features two temperature and humidity controlled conditioning rooms and two emission chambers correlated to a CARB-approved Third-Party Certifier standard. We believe this equipment mirrors the requirements of CARB and capabilities of other state-of-the-art emission testing facilities. This lab, along with our third-party providers, supports our process to ensure compliance with CARB and EPA requirements.
Installation
Approximately one in 10 of our customers purchase professional installation services through us to measure and install our flooring at competitive prices. We offer these services at all of our stores. As of December 31, 2019, we utilized a network of associates to perform certain customer-facing, consultative services and coordinate the installation of our flooring products by third-party independent contractors. Service revenue for installation transactions we control along with freight is included in net services sales, with the corresponding costs in cost of services sold. We believe our greater interaction with the customer and strong relationships with the third-party independent contractors ultimately results in a better customer experience and higher utilization by the customer.
Store Model
As of December 31, 2019, we operated 419 retail stores, with 411 located in 47 states in the United States and eight in Ontario, Canada. We opened 11 new stores and closed 5 stores in 2019. We are able to adapt a range of existing buildings to our format, from freestanding buildings to strip centers to small shopping centers. Our stores are typically 6,500 to 7,500 square feet. We enter into short leases, generally for a base term of five to seven years with renewal options, to maximize our real estate flexibility.
We routinely evaluate our store site selection criteria and are currently targeting retail corridors within a market over the more industrial locations we historically sought. We consistently monitor performance of current stores as well as the market opportunity for new locations, adjusting as needed to optimize the profitability and growth potential of our network. We continue to explore alternative store prototypes to determine how to best serve customers.
Sales Approach
We strive to have an integrated multi-channel sales model that enables our stores, call center, website and catalogs to work together in a coordinated manner. We believe that due to the average size of the sale and the general infrequency of a flooring purchase, many of our customers conduct extensive research using multiple channels before making a purchase decision. Though our customers utilize a range of these channels in the decision-making process, the final sale is most often completed in the store, working with our flooring experts. Our customers typically plan well in advance for the inconvenience of removing old flooring and installing new flooring. In larger, more complex projects,
6
greater lead time and preparation is often required. Our research indicates that the length of a hard-surface flooring purchase can vary significantly from initial interest to final sale.
Our objective is to help the customer through the entire purchase cycle from inspiration to installation, whether in our store or in their home. Our goal is to provide our customers with everything needed to complete their flooring project – to remove the existing floor, install the new floor with complementary moldings and accessories, and finally, maintain the floor for its lifetime.
Our sales strategy emphasizes customer service by providing superior, convenient, educational tools for our customers to learn about our products and the installation process. We invest heavily in training our store associates on all of our products and install techniques. Flooring samples for most of the products we offer are available in our stores, or can be ordered through our call center and website. Once an order is placed, customers may choose to either have their purchases delivered or pick them up at a nearby store location.
We are committed to responding to our customers in a timely manner. Our call center is staffed by flooring experts cross-trained in sales, customer service and product support. In addition to receiving telephone calls, our call center associates chat online with visitors to our website, respond to emails from our customers and engage in telemarketing activities. Customers can contact our call center to place an order, to make an inquiry, or to order a catalog.
Knowledgeable Salespeople
We believe a large segment of residential homeowners are in need of a trusted expert, whether as a guide through a range of flooring alternatives and services or as a resource to both DIY and DIFM customers. We train and position our store management and associates to establish these individual customer relationships, which often last beyond the current purchase to subsequent purchases of additional flooring.
We place an emphasis on identifying, hiring and empowering employees who share a passion for our business philosophy where possible. Many of our store managers have previous experience with the home improvement, retail flooring or flooring installation industries. We provide ongoing training focused on selling techniques and in-depth product knowledge for our store associates, who, we believe, are a key driver in a customer’s purchasing decision.
Digital / Omni-Channel
Our website contains a broad range of information on our products and services, including a comprehensive knowledge base on all things related to flooring. We have recently launched several tools, including Picture It! and Floor Finder, to assist customers in their flooring purchase. We also offer extensive product reviews, before and after photos from previous customers, product information and how-to installation videos. A customer also has the ability to chat live with a flooring expert, either online or over the phone, regarding questions about a flooring purchase or installation. We continue to develop new features and functionality to assist customers, and to ensure they have robust tools at their disposal that are effective at helping them make the ideal flooring choice as they move between online and offline channels. We also have an active presence on Facebook, Instagram, Pinterest, YouTube and Twitter.
Advertising and Financing
Advertising: We utilize a mix of traditional and online media, ecommerce, direct mail, email, and social media to balance product, service and value messaging. We also utilize advertising to build brand consideration and to educate customers on the flooring category. Overall, we proactively manage the mix of our media to ensure we efficiently drive sales while effectively building awareness of our brand value proposition. We continue to invest in enhanced digital capabilities.
Financing: We offer our residential customers a financing alternative through a proprietary credit card, the Lumber Liquidators credit card, underwritten by a third-party financial institution, generally with no recourse to us. This program serves the dual function of providing financial flexibility to our customers and offering us promotional
7
opportunities featuring deferred interest, which we often combine with product promotions. Our customers may also use their Lumber Liquidators credit card for installation services. We also offer our Pro customers a financing alternative, which is also underwritten by a third-party financial institution, generally with no recourse to us. The commercial credit program provides our Pro customers a range of additional services that we believe add flexibility to their businesses.
Employees
As of December 31, 2019, we had approximately 2,200 employees, 95% of whom were full-time and none of whom were represented by a union. Of these employees, 73% work in our stores, 18% work in corporate store support infrastructure or similar functions (including our call center employees) and 9% work in one of our distribution centers. We believe that we have good relations with our employees.
Seasonality and Quarterly Results
Our quarterly results of operations can fluctuate depending on the timing of our advertising and the timing of, and income contributed by, our new stores. Our net sales fluctuate slightly as a result of seasonal factors, and we adjust merchandise inventories in anticipation of those factors, causing variations in our build of merchandise inventories. Generally, we experience higher-than-average net sales in the spring and fall, when more home remodeling activities typically are taking place, and lower-than-average net sales in the colder winter months and during the hottest summer months.
Intellectual Property and Trademarks
We have a number of marks registered in the United States, including Lumber Liquidators®, Hardwood Floors For Less!®, Floor Finder®, Bellawood®, 1‑800‑HARDWOOD®, Quickclic®, Virginia Mill Works Co. Hand Scraped and Distressed Floors®, Morning Star Bamboo Flooring®, Dream Home Laminate Floors®, Builder’s Pride®, Avella®, Coreluxe®, Tranquility Resilient Flooring®, Lisbon Cork Co. Ltd. ®, Colston Hardwood Flooring ®, Clover Lea Plantation ®, ReNature™, AquaSeal ™ and other product line names. We have also registered certain marks in jurisdictions outside the United States, including the European Union, Canada, China, Australia and Japan. We regard our intellectual property as having significant value and these names are an important factor in the marketing of our brands. Accordingly, we take steps intended to protect our intellectual property including, where necessary, the filing of lawsuits and administrative actions to enforce our rights.
Government Regulation
We are subject to extensive and varied federal, provincial, state and local government regulations in the jurisdictions in which we operate, including laws and regulations relating to our relationships with our employees and customers, independent third-party installers, public health and safety, zoning, accommodations for persons with disabilities, and fire codes. We are also subject to a number of compliance obligations pursuant to various settlement agreements we have entered into over the past few years. We operate each of our stores, offices and distribution centers in accordance with standards and procedures designed to comply with all applicable laws, codes, licensing requirements and regulations. Certain of our operations and properties are also subject to federal, provincial, state and local laws and regulations relating to the use, storage, handling, generation, transportation, treatment, emission, release, discharge and disposal of hazardous materials, substances and wastes and relating to the investigation and cleanup of contaminated properties, including off-site disposal locations. We do not currently incur significant costs complying with the laws and regulations related to hazardous materials. However, we could be subject to material costs, liabilities or claims relating to compliance in the future, especially in the event of changes in existing laws and regulations or in their interpretation, as well as the passage of new laws and regulations.
Our suppliers are subject to the laws and regulations of their home countries, as well as those relative to the import of their products into the United States, including, in particular, laws regulating labor, forestry and the environment. Our suppliers are subject to periodic compliance audits, onsite visits and other reviews, as appropriate, in efforts to ensure that they are in compliance with all laws and regulations. We also support social and environmental responsibility among our supplier community and our suppliers agree to comply with our expectations concerning
8
environmental, labor and health and safety matters. Those expectations include representations and warranties that our suppliers comply with the laws, rules and regulations of the countries in which they operate.
Products that we import into the United States and Canada are subject to laws and regulations imposed in conjunction with such importation, including those issued and/or enforced by United States Customs and Border Protection and the Canadian Border Services Agency. In addition, certain of our products are subject to laws and regulations relating to the importation, acquisition or sale of illegally harvested plants and plant products and the emissions of hazardous materials. We work closely with our suppliers to address the applicable laws and regulations in these areas.
Available Information
We maintain a website at www.lumberliquidators.com. The information on or available through our website is not, and should not be considered, a part of this annual report on Form 10‑K. You may access our annual reports on Form 10‑K, quarterly reports on Form 10‑Q, current reports on Form 8‑K and amendments to those reports, as well as other reports relating to us that are filed with, or furnished to, the United States Securities and Exchange Commission (“SEC”) free of charge on our website as soon as reasonably practicable after such material is electronically filed with, or furnished to, the SEC. The SEC also maintains an Internet site, www.sec.gov, which contains reports, proxy and information statements, and other information that we file electronically with the SEC.
The risks described below could materially and adversely affect our business, results of operations, financial condition and cash flows. These risks are not the only risks that we face. Our business operations could also be affected by additional factors that apply generally to companies operating in the United States and globally, as well as other risks that are not presently known to us or that we currently consider to be immaterial.
Risks Related to Our Operations
Unfavorable allegations, government investigations and legal actions surrounding our products or us could harm our reputation and impair our ability to grow or sustain our business.
We have been involved in a number of government investigations and legal actions, many of which have resulted from unfavorable allegations regarding our products and us. Negative publicity surrounding these government investigations and legal actions could continue to harm our reputation and the demand for our products. Additional unfavorable allegations, government investigations and legal actions involving our products and us could also affect our perception in the market and our brands and negatively impact our business and financial condition. For instance, unfavorable allegations with certain regulators surrounding the compliance of our laminates that had previously been sourced from China has negatively affected and could continue to negatively affect our operations. If this negative impact is significant, our ability to maintain our liquidity and grow or sustain our business could be jeopardized. The cost to defend ourselves and our former employees has been and could continue to be significant.
We are involved in a number of legal proceedings and, while we cannot predict the outcomes of these proceedings and other contingencies with certainty, some of the outcomes of these proceedings could adversely affect our business and financial condition.
We are, or may become, involved in legal proceedings, government and agency investigations, and consumer, employment, tort and other litigation (see discussion of Legal Proceedings in Item 3 of this Annual Report). While we have accrued for material liabilities in connection with certain of these proceedings, we cannot predict with certainty the ultimate outcomes. The outcome of some of these legal proceedings could require us to take actions which could be costly to implement or otherwise negatively affect our operations or could require us to pay substantial amounts of money that could have a material adverse effect on our liquidity, financial condition and results of operations and could affect our ability to obtain capital or access our revolving loan and continue as a going concern. Additionally, defending
9
against lawsuits and legal proceedings involves significant expense and diversion of management’s attention and resources.
Our overall compliance program, including the Lacey Compliance Plan, is complex and costly to maintain. A failure to manage these programs could adversely affect our ability to conduct business, result in significant fines and other penalties, damage our brand and reputation, and, consequently, negatively impact our financial position and results of operations.
As disclosed in October, 2015, we reached a settlement with the United States Department of Justice (“DOJ”) regarding our compliance with the Lacey Act. In connection with that settlement, we agreed to implement the Lacey Compliance Plan, and we are subject to a probation period of five years. Our implementation of the Lacey Compliance Plan, together with requirements resulting from other settlement agreements we have entered into over the past few years (including the Deferred Prosecution Agreement (the “DPA”) with the United States Attorney’s Office for the Eastern District of Virginia (the “U.S. Attorney”) and the DOJ entered into on March 12, 2019), is costly and, if the implementation costs are more than we anticipate, could adversely affect our operating results. In the event we breach the DPA, there is a risk the U.S. Attorney and the DOJ would seek to impose remedies provided for in the DPA, including criminal prosecution. Further, the failure to properly manage our overall compliance program and fully comply with the obligations imposed upon us by these various settlement agreements or implement any of the compliance requirements arising from these obligations could adversely affect our ability to conduct business, result in significant fines and other penalties, damage our brand and reputation and negatively impact our financial position and results of operations.
Our insurance coverage and self-insurance reserves may not cover existing or future claims.
With the large number of recent cases and government investigations, we may be required to defend ourselves and our officers, directors and former employees and we may be subject to financial harm in the event such cases or investigations are adversely determined and insurance coverage will not, or is not sufficient to, cover any related losses. We maintain various insurance policies, including directors and officers insurance, as well as the following:
|
· |
We are self-insured on certain health insurance plans and workers’ compensation coverage and are responsible for losses up to a certain limit for these respective plans. |
|
· |
We continue to be responsible for losses up to a certain limit for general liability and property damage insurance. |
|
· |
Our professional liability and cyber security insurance policies contain limitations on the amount and scope of coverage. |
For policies under which we are responsible for losses, we record a liability that represents our estimated cost of claims incurred and unpaid as of the balance sheet date. Unanticipated changes may produce materially different amounts of expense than those recorded, which could adversely impact our operating results. Additionally, our experience could limit our ability to obtain satisfactory insurance coverage, subjecting us to further loss, or could require significantly increased premiums.
Federal, provincial, state or local laws and regulations, including tariffs, or our failure to comply with such laws and regulations, and our obligations under certain settlement agreements related to our products could increase our expenses, restrict our ability to conduct our business and expose us to legal risks.
We are subject to a wide range of general and industry-specific laws and regulations imposed by federal, provincial, state and local authorities in the countries in which we operate, including those related to tariffs, customs, foreign operations (such as the Foreign Corrupt Practices Act), truth-in-advertising, consumer protection, privacy, zoning and occupancy matters as well as the operation of retail stores and warehouse, production and distribution facilities and provision of installation services. In addition, various federal, provincial and state laws govern our relationship with and other matters pertaining to our employees, including wage and hour-related laws. If we fail to
10
comply with these laws and regulations, we could be subject to legal risk, our operations could be impacted negatively and our reputation could be damaged. Likewise, if such laws and regulations should change, our costs of compliance may increase, thereby impacting our results and hurting our profitability.
Certain portions of our operations are subject to laws and regulations governing hazardous materials and wastes, the remediation of contaminated soil and groundwater, and the health and safety of employees. If we are unable to comply with, extend or renew a material approval, license or permit required by such laws, or if there is a delay in renewing any material approval, license or permit, our net sales and operating results could deteriorate or otherwise cause harm to our business.
With regard to our products, we spend significant resources in order to comply with applicable advertising, importation, exportation, environmental and health and safety laws and regulations. If we should violate these laws and regulations, we could experience delays in shipments of our goods, be subject to fines, penalties, criminal charges, or other legal risks, be liable for costs and damages, or suffer reputational harm, which could reduce demand for our merchandise and hurt our business and results of operations. Further, if such laws and regulations should change we may experience increased costs in order to adhere to the new standards. We are also subject to a number of settlement agreements that impose certain obligations on us with respect to the operation of our business. If we fail to comply with these obligations, we may experience additional costs and expenses and could be subject to additional legal risks.
Our growth strategy depends in part on our ability to open new stores and is subject to many unpredictable factors.
As of December 31, 2019, we had 419 stores throughout the United States and Canada. Assuming the continued success of our store model and satisfaction of our internal criteria, we plan to continue our selective approach to future openings over the next several years. This growth strategy and the investment associated with the development of each new store may cause our operating results to fluctuate and be unpredictable or decrease our profits. Our future results and ability to implement our growth strategy will depend on various factors, including the following:
|
· |
as we open more stores, our rate of expansion relative to the size of our store base will decline; |
|
· |
consumers in new markets may be less familiar with our brands, and we may need to increase brand awareness in those markets through additional investments in advertising; |
|
· |
new stores may have higher construction, occupancy or operating costs, inventory requirements, or may have lower average store net sales, than stores opened in the past; |
|
· |
competitive pressures could cause changes to our store model and making necessary changes could prove costly; |
|
· |
newly opened stores may reach profitability more slowly than we expect in the future, as we enter more mid-sized and smaller markets and add stores to larger markets where we already have a presence; and |
|
· |
our Canadian stores may require additional investment in advertising due to our limited penetration in the Canadian market. |
Failure to manage our growth effectively could harm our business and operating results.
Our plans call for our selective approach in the addition of new stores over the next several years, and increased orders from our website, call center and catalogs. Our existing management information systems, including our store management systems, compliance procedures and financial and reporting controls, may be unable to support our expansion. Managing our growth effectively will require us to continue to enhance these systems, procedures and controls and to hire, train and retain regional and store managers and personnel for our compliance and financial and
11
reporting departments. We may not respond quickly enough to the changing demands that our expansion will impose on us. Any failure to manage our growth effectively could harm our business and operating results.
Increased transportation costs could harm our results of operations.
The efficient transportation of our products through our supply chain is a critical component of our operations. If the cost of fuel or other costs, such as import tariffs, duties and international container rates rise it could result in increases in our cost of sales due to additional transportation charges and fees. Additionally, there are a limited number of delivery companies capable of efficiently transporting our products from our suppliers. Consolidation within this industry could result in increased transportation costs. A reduction in the availability of qualified drivers and an increase in driver regulations could continue to increase our costs. We may be unable to increase the price of our products to offset increased transportation charges, which could cause our operating results to deteriorate.
Damage, destruction or disruption of our distribution centers could significantly impact our operations and impede our ability to distribute certain of our products.
We have two distribution centers which house products for the direct shipment of flooring to our stores or to our customers. If either of our distribution centers or our inventory held in those locations were damaged or destroyed by fire, wood infestation or other causes, our distribution processes would be disrupted, which could cause significant delays in delivery. This could impede our ability to stock our stores and deliver products to our customers, and cause our net sales and operating results to deteriorate.
The operation of stores in Canada and our representative office in China may present increased legal and operational risks.
We currently operate eight store locations in Canada. As a result of our limited penetration in the Canadian market, these stores may continue to be less successful than we expect. Additionally, investments in advertising and promotional activity may be required to continue to build brand awareness in that market.
We also have a representative office in Shanghai, China to facilitate our product sourcing in Asia. We have limited experience with the legal and regulatory environments and market practices outside of the United States and cannot guarantee that we will be able to operate profitably in these markets or in a manner and with results similar to those in the United States. We may also incur increased costs in complying with applicable Canadian and Chinese laws and regulations as they pertain to our products, operations and related activities. Further, if we fail to comply with applicable laws and regulations, we could be subject to, among other things, litigation and government and agency investigations.
Failure to effectively manage our third-party installers may present increased legal and operational risks.
We manage third-party installers who provide installation services to some of our customers. In some jurisdictions, we are subject to regulatory requirements and risks applicable to general contractors, which include management of licensing, permitting and quality of our third-party installers. We have established procedures designed to manage these requirements and ensure customer satisfaction with the services provided by our third-party installers. If we fail to manage these procedures effectively or provide proper oversight of these services, we may be subject to regulatory enforcement and litigation and our net sales and our profitability and reputation could be harmed.
Our founder is the lessor on a significant number of our leases and the satisfactory renewal of these as each comes due is a risk to our occupancy costs and store count.
As of December 31, 2019, we leased 28 of our store locations from entities owned, in whole or in part, by Tom Sullivan, our founder. Although our percentage of total stores leased from such entities has decreased, this concentration of leases subjects us to the risk of increased costs or reduction of store count in the event of an adverse action or inaction by Mr. Sullivan or such entities. Mr. Sullivan is not an employee or a director of the Company.
12
Our success depends upon the retention of our personnel.
We believe that our success has depended and continues to depend on the efforts and capabilities of our employees. The loss of the services of employees due to any negative market or industry perception, our stock price, and/or litigation may prevent us from achieving operational goals and harm our reputation.
Risks Related to Our Suppliers, Products and Product Sourcing
Our ability and cost to obtain cost-effective products, especially from China and other international suppliers, and the operations of many of our international suppliers are subject to risks that may be beyond our control and that could harm our operations and profitability.
We rely on a select group of international suppliers to provide us with imported flooring products that meet our specifications. In 2019, our imported product was sourced from Asia, Europe, Australia and South America. As a result, we are subject to risks associated with obtaining products from abroad, including:
|
· |
the imposition of duties (including antidumping and countervailing duties), tariffs, taxes and/or other charges on exports or imports; |
|
· |
political unrest, terrorism and economic instability resulting in the disruption of trade from foreign countries where our products originate; |
|
· |
currency exchange fluctuations; |
|
· |
the impact of a pandemic, including the Coronavirus; |
|
· |
the imposition of new laws and regulations, including those relating to environmental matters and climate change issues, labor conditions, quality and safety standards, trade restrictions, and restrictions on funds transfers; |
|
· |
disruptions or delays in production, shipments, delivery or processing through ports of entry; and |
|
· |
differences in product standards, acceptable business practices and legal environments of the country of origin. |
In 2019, approximately 46% of our product was sourced from China. Beginning in September 2018, tariffs on goods coming from China received an additional 10% tariff. Beginning in June 2019, the tariffs increased to 25%. On November 7, 2019, the United States Trade Representative (“USTR”) ruled on a request made by certain interested parties, including the Company, and retroactively excluded certain flooring products imported from China from these Section 301 tariffs. The granted exclusion applies retroactively from the date the tariffs were originally implemented on September 24, 2018 through August 7, 2020. It is uncertain if the flooring products that are currently excluded will continue to be excluded after August 7, 2020. Potential costs and any attendant impact on pricing arising from these tariffs could have a material adverse effect on our results of operations, financial condition and liquidity.
In early 2020, the Chinese New Year holiday was extended and governments across Asia imposed significant restrictions on the movement of people and of goods both among provinces as well as into and out of countries due to the Coronavirus. These added measures could have a material adverse effect on suppliers both within China and other countries in the form of labor shortages, delays in our suppliers’ own supply chain for raw materials, and difficulty in shipping products to ports.
These and other factors beyond our control could disrupt the ability of our suppliers to ship certain products to us cost-effectively or at all, which could harm our operations. If our product costs and consumer demand are adversely
13
affected by foreign trade issues (including pandemic-related delays, import tariffs and other trade restrictions with China), our sales and profitability may suffer.
Failure to identify and develop relationships with a sufficient number of qualified suppliers could affect our ability to obtain products that meet our high quality standards.
We purchase flooring directly from mills located around the world. We believe that these direct supplier relationships are important to our business. In order to retain the competitive advantage that we believe results from these relationships, we need to continue to identify, develop and maintain relationships with qualified suppliers that can satisfy our high standards for quality and our requirements for the delivery of hard-surface materials in a timely and efficient manner. We expect the need to develop new relationships to be particularly important as we seek to expand our operations, enhance our product offerings, and expand our product assortment and geographic source of origin in the future. Any inability to do so could reduce our competitiveness, slow our plans for further expansion and cause our net sales and operating results to deteriorate.
We rely on a concentrated number of suppliers for a significant portion of our supply needs. We generally do not have long-term contracts with our suppliers. In the future, our suppliers may be unable to supply us, or supply us on acceptable terms, due to various factors, which could include political instability in the supplier’s country, insufficient production capacity, product line failures, collusion, a supplier’s financial instability, inability or refusal to comply with applicable laws, trade restrictions, tariffs or our standards, duties, insufficient transport capacity and other factors beyond our control. In these circumstances, we could experience deterioration in our net sales and operating results.
The failure of our suppliers to comply with applicable laws, use ethical practices, and meet our quality standards could result in our suspending purchasing from them, negatively impacting net sales, and could expose us to reputational and legal risks.
While our suppliers agree to operate in compliance with applicable laws and regulations, we do not control our suppliers. Accordingly, despite our continued investment in compliance and quality control, we cannot guarantee that they comply with such laws and regulations or operate in a legal, ethical and responsible manner. While we monitor our suppliers’ adherence to our compliance and quality standards, there is no guarantee that we will be able to identify non-compliance. Moreover, the failure of our suppliers to adhere to applicable legal requirements and the quality standards that we set for our products could lead to government investigations, litigation, write-offs and recalls, any of which could damage our reputation and our brands, increase our costs, and otherwise hurt our business. Additionally, our ability to travel and monitor suppliers due to the Coronavirus could cause delays in bringing product to market.
Product liability claims could adversely affect our reputation, which could adversely affect our net sales and profitability.
We have faced and continue to face the risk of exposure to product liability claims in the event that the use of our products is alleged to have resulted in economic loss, personal injury, property damage, violated environmental or other laws. In the event that any of our products proves to be defective or otherwise in violation of applicable laws, we may be required to recall or redesign such products. Further, in such instances, we may be subject to legal action. We maintain insurance against some forms of product liability claims, but such coverage may not be available or adequate for the liabilities actually incurred. A successful claim brought against us in excess of available insurance coverage, or any claim or product recall that results in significant adverse publicity against us, may have a material adverse effect on our net sales and operating results.
Our ability to offer hardwood flooring, particularly products made of more exotic species of hardwood, depends on the continued availability of sufficient suitable hardwood at reasonable cost.
Our business strategy depends on offering a wide assortment of hardwood flooring to our customers. We sell flooring made from species ranging from domestic maple, oak and pine to imported cherry, koa, mahogany and teak. Some of these species are scarce, and we cannot be assured of their continued availability. Our ability to obtain an adequate volume and quality of hard-to-find species depends on our suppliers’ ability to furnish those species, which, in
14
turn, could be affected by many things including events such as forest fires, insect infestation, tree diseases, prolonged drought and other adverse weather and climate conditions. Government regulations relating to forest management practices also affect our suppliers’ ability to harvest or export timber, and changes to regulations and forest management policies, or the implementation of new laws or regulations, could impede their ability to do so. If our suppliers cannot deliver sufficient hardwood and we cannot find replacement suppliers, our net sales and operating results may be negatively impacted.
The cost of the various species of hardwood that are used in our products is important to our profitability. Hardwood lumber costs fluctuate as a result of a number of factors including changes in domestic and international supply and demand, labor costs, competition, market speculation, product availability, environmental restrictions, government regulation and trade policies, duties, weather conditions, processing and freight costs, and delivery delays and disruptions. We generally do not have long-term supply contracts or guaranteed purchase amounts. As a result, we may not be able to anticipate or react to changing hardwood costs by adjusting our purchasing practices, and we may not always be able to increase the selling prices of our products in response to increases in supply costs. If we cannot address changing hardwood costs appropriately, it could cause our operating results to deteriorate.
Risks Related to Economic Factors and Our Access to Capital
Cyclicality in the home flooring industry, coupled with our lack of diversity in our lines of business, could cause volatility and risk to our business.
The hard-surface flooring industry is highly dependent on the remodeling of existing homes and new home construction. Remodeling and new home construction are cyclical and depend on a number of factors which are beyond our control, including interest rates, tax policy, real estate prices, employment levels, consumer confidence, credit availability, demographic trends, weather conditions, natural disasters and general economic conditions.
In the event of a decrease in discretionary spending, home remodeling activity or new home construction, demand for our products, including hard-surface flooring, could be impacted negatively and our business and operating results could be harmed.
The inability to access our Revolving Credit Facility or other sources of capital, could cause our financial position, liquidity, and results of operations to suffer.
We have relied on and expect to continue to rely on a bank credit agreement to fund our seasonal needs for working capital. During 2019, we entered into an amended and restated credit agreement to increase the amounts available under this Revolving Credit Facility, and we may need to access additional sources of capital to satisfy our liquidity needs. Our access to the Revolving Credit Facility depends on our ability to meet the conditions for borrowing, including that all representations are true and correct at the time of the borrowing. Our failure to meet these requirements or obtain additional or alternative sources of capital could impact:
|
· |
our ability to fund working capital, capital expenditures, store expansion and other general corporate purposes; |
|
· |
our ability to meet our liquidity needs, arising from, among other things, legal matters; and |
|
· |
our flexibility in planning for, or reacting to, changes in our business and the industry in which we operate. |
15
Risks Related to Our Information Technology
If our management information systems, including our website or our call center, experience disruptions, it could disrupt our business and reduce our net sales.
We depend on our management information systems to integrate the activities of our stores, website and call center, to process orders, to respond to customer inquiries, to manage inventory, to purchase merchandise and to sell and ship goods on a timely basis. We may experience operational problems with our information systems as a result of system failures, viruses, computer “hackers” or other causes. We may incur significant expenses in order to repair any such operational problems. Any significant disruption or slowdown of our systems could cause information, including data related to customer orders, to be lost or delayed, which could result in delays in the delivery of products to our stores and customers or lost sales. For example, as we previously disclosed in August 2019, we experienced a malicious network security incident that prevented access to several of our information technology systems and data within our networks. Based on the nature of the network security incident, the impact on our information technology systems and the results of the forensic IT analysis, we do not believe confidential customer, employee or company data was lost or disclosed. Moreover, our entire corporate network, including our telephone lines, is on an Internet-based network, which is vulnerable to certain risks and uncertainties, including changes in the required technology interfaces, website downtime and other technical failures, security breaches and customer privacy concerns. Accordingly, if our network is disrupted or if we cannot successfully maintain our website and call center in good working order, we may experience delayed communications within our operations and between our customers and ourselves, and may not be able to communicate at all via our network, including via telephones connected to our network.
We may incur costs and losses resulting from security risks we face in connection with our electronic processing, transmission and storage of confidential customer information.
We accept electronic payment cards for payment in our stores and through our call center. In addition, our online operations depend upon the secure transmission of confidential information over public networks, including information permitting cashless payments. As a result, we may become subject to claims for purportedly fraudulent transactions arising out of the actual or alleged theft of credit or debit card information, and we may also be subject to lawsuits or other proceedings relating to these types of incidents. Further, a compromise of our security systems that results in our customers’ personal information being obtained by unauthorized persons could adversely affect our reputation with our customers and others, as well as our operations, results of operations and financial condition, and could result in litigation against us or the imposition of penalties. A security breach could also require that we expend significant additional resources related to the security of information systems and could result in a disruption of our operations, particularly our online sales operations.
Additionally, privacy and information security laws and regulations change, and compliance with them may result in cost increases due to necessary systems changes and the development of new administrative processes. If we fail to comply with these laws and regulations or experience a data security breach, our reputation could be damaged, possibly resulting in lost future business, and we could be subjected to additional legal risk as a result of non-compliance.
Alternative e-commerce and online shopping offerings may erode our customer base and adversely affect our business.
Our long-term future depends heavily upon the general public’s willingness to use our stores as a means to purchase goods. In recent years, e-commerce has become more widely accepted as a means of purchasing consumer goods and services, which could adversely impact customer traffic in our stores. Additionally, certain of our competitors offer alternative e-commerce and online shopping. If consumers use alternative e-commerce and online shopping offerings to conduct business as opposed to our store locations, it could materially adversely impact our net sales and operating results.
16
Risks Relating to Our Competitive Positioning
A tarnished brand or ineffectiveness of our advertising strategy could result in reduced customer traffic, thereby impacting net sales and profitability.
We believe that our growth thus far was achieved in part through our successful investment in local and national advertising. Historically, we have used extensive advertising to encourage customers to drive to our stores, which were generally located some distance from population centers in areas that have lower rents than traditional retail locations. Further, a significant portion of our advertising was directed at the DIY and DIFM customers. While our brand and marketing strategies continue to evolve, we have broadened the content of our advertising to increase the awareness of our great value, superior service and broad selection of high-quality, hard-surface flooring products. If there is are negative perceptions about the evolution of our brand strategies, our advertisements fail to draw customers in the future, or if the cost of advertising or other marketing materials increases significantly, we could experience declines in our net sales and operating results.
Competition could cause price declines, decrease demand for our products and decrease our market share.
We operate in the hard-surface flooring industry, which is highly fragmented and competitive. We face significant competition from national and regional home improvement chains, national and regional specialty flooring chains, Internet-based companies and privately owned single-site enterprises. We compete on the basis of price, customer service, store location and the range, quality and availability of the hard-surface flooring that we offer our customers. If our positioning with regard to one or more of these factors should erode, deteriorate, fail to resonate with consumers or misalign with demand or expectations, our business and results may be negatively impacted.
Our competitive position is also influenced by the availability, quality and cost of merchandise, labor costs, distribution and sales efficiencies and our productivity compared to that of our competitors. Further, as we expand into new and unfamiliar markets, we may face different competitive environments than in the past. Likewise, as we continue to enhance and develop our product offerings, we may experience new competitive conditions.
Some of our competitors are larger organizations, have existed longer, are more diversified in the products they offer and have a more established market presence with substantially greater financial, marketing, personnel and other resources than we have. In addition, our competitors may forecast market developments more accurately than we do, develop products that are superior to ours, produce similar products at a lower cost or adapt more quickly to new technologies or evolving customer requirements than we do. Intense competitive pressures from one or more of our competitors could cause price declines, decrease demand for our products and decrease our market share.
Hard-surface flooring may become less popular as compared to other types of floor coverings in the future. For example, our products are made using various hardwood species, including rare exotic hardwood species, and concern over the environmental impact of tree harvesting could shift consumer preferences towards synthetic or inorganic flooring. In addition, hardwood flooring competes against carpet, vinyl sheet, vinyl tile, ceramic tile, natural stone and other types of floor coverings. If consumer preferences shift toward types of floor coverings that we do not sell, we may experience decreased demand for our products.
All of these competitive factors may harm us and reduce our net sales and operating results.
Risks Related to Accounting Standards and Internal Controls
Changes in accounting standards, subjective assumptions, estimates and judgments by management related to complex accounting matters, and failures in internal control could significantly affect our financial results.
Generally accepted accounting principles and related accounting pronouncements, implementation guidelines and interpretations with regard to a wide range of matters that are relevant to our business, including but not limited to, consolidation, revenue recognition, stock-based compensation, lease accounting, sales returns reserves, inventories, self-insurance, income taxes, deferred taxes, valuation allowances, unclaimed property laws and litigation, are highly
17
complex and involve many subjective assumptions, estimates and judgments by our management. Changes in these rules or their interpretation or changes in underlying assumptions, estimates or judgments by our management could significantly change our reported or expected financial performance, which may have a material effect on our results of operation.
Failure to maintain effective systems of internal and disclosure control could have a material adverse effect on our results of operation and financial condition.
Effective internal and disclosure controls are necessary for us to provide reliable financial reports and effectively prevent fraud, and to operate successfully as a public company. If we cannot provide reliable financial reports or prevent fraud, our reputation and operating results would be harmed. As part of our ongoing monitoring of internal control, we may discover material weaknesses or significant deficiencies in internal control that require remediation.
We have in the past discovered, and may in the future discover, areas of internal controls that need improvement, and we continue to work to remediate and improve our internal controls. We cannot be certain that these measures will ensure that we implement and maintain adequate controls over our financial processes and reporting in the future. Any failure to maintain effective controls or to timely implement any necessary improvement of our internal and disclosure controls could, among other things, result in losses from fraud or error, harm our reputation, or cause investors to lose confidence in the reported financial information, all of which could have a material adverse effect on our results of operation and financial condition.
Risks Relating to Our Common Stock
Our common stock price may be volatile and all or part of any investment in our common stock may be lost.
The market price of our common stock could fluctuate significantly based on various factors, including, but not limited to:
|
· |
unfavorable market reactions to allegations regarding the safety of our products and the related litigation and/or government investigations resulting therefrom, as well as any payments, judgments or other losses in connection with such allegations and any resultant lawsuits and/or investigations; |
|
· |
trading activity of our current or future stockholders, including common stock transactions by our directors and executive officers; |
|
· |
industry-related trends and growth prospects; and |
|
· |
our concentration in the cyclical home furnishings industry. |
In addition, the stock market may experience significant price and volume fluctuations. These fluctuations may be unrelated to the operating performance of particular companies but may cause declines in the market price of our common stock. The price of our common stock could fluctuate based upon factors that have little or nothing to do with us or our performance.
Our quarterly operating results may fluctuate significantly and could fall below the expectations of research analysts and investors due to various factors.
Research analysts and investors develop expectations on how we may perform using a variety of metrics, including, but not limited to, sales, comparable store sales and gross profit. However, in any given quarter, actual performance may vary from these expectations, causing significant fluctuations in our stock price.
18
Our anti-takeover defense provisions may cause our common stock to trade at market prices lower than it might absent such provisions.
Our certificate of incorporation and bylaws contain provisions that may make it more difficult or expensive for a third party to acquire control of us without the approval of our board of directors. These provisions include a staggered board, the availability of “blank check” preferred stock, provisions restricting stockholders from calling a special meeting of stockholders or from taking action by written consent and provisions that set forth advance notice procedures for stockholders’ nominations of directors and proposals of topics for consideration at meetings of stockholders. Our certificate of incorporation also provides that Section 203 of the Delaware General Corporation Law, which relates to business combinations with interested stockholders, applies to us. These provisions may delay, prevent or deter a merger, or other transaction that might otherwise result in our stockholders receiving a premium over the market price for their common stock. In addition, these provisions may cause our common stock to trade at a market price lower than it might absent such provisions.
Item 1B. Unresolved Staff Comments.
None.
As of February 20, 2020, we operated 419 stores located in 47 states and Canada, with no new store openings or closings since December 31, 2019. In addition to our eight stores in Ontario, Canada, the table below sets forth the locations (alphabetically by state) of our 411 United States stores in operation as of February 20, 2020.
|
State |
|
Stores |
|
State |
|
Stores |
|
State |
|
Stores |
|
State |
|
Stores |
|
Alabama |
|
6 |
|
Iowa |
|
3 |
|
Nebraska |
|
2 |
|
Rhode Island |
|
1 |
|
Arizona |
|
6 |
|
Kansas |
|
3 |
|
Nevada |
|
4 |
|
South Carolina |
|
10 |
|
Arkansas |
|
2 |
|
Kentucky |
|
5 |
|
New Hampshire |
|
5 |
|
South Dakota |
|
1 |
|
California |
|
44 |
|
Louisiana |
|
6 |
|
New Jersey |
|
14 |
|
Tennessee |
|
6 |
|
Colorado |
|
10 |
|
Maine |
|
3 |
|
New Mexico |
|
1 |
|
Texas |
|
29 |
|
Connecticut |
|
8 |
|
Maryland |
|
10 |
|
New York |
|
22 |
|
Utah |
|
3 |
|
Delaware |
|
4 |
|
Massachusetts |
|
10 |
|
North Carolina |
|
15 |
|
Vermont |
|
1 |
|
Florida |
|
31 |
|
Michigan |
|
11 |
|
North Dakota |
|
1 |
|
Virginia |
|
16 |
|
Georgia |
|
11 |
|
Minnesota |
|
7 |
|
Ohio |
|
14 |
|
Washington |
|
9 |
|
Idaho |
|
2 |
|
Mississippi |
|
3 |
|
Oklahoma |
|
3 |
|
West Virginia |
|
4 |
|
Illinois |
|
14 |
|
Missouri |
|
7 |
|
Oregon |
|
8 |
|
Wisconsin |
|
6 |
|
Indiana |
|
9 |
|
Montana |
|
1 |
|
Pennsylvania |
|
20 |
|
|
|
|
We lease all of our stores as well as our corporate headquarters, at our new location in Richmond, Virginia. We relocated to the new headquarters location during the fourth quarter of 2019. The new headquarters location is an existing building of approximately 53,000 square feet. We currently lease space near the new headquarters location as a satellite office for various administrative functions and expect to continue that lease or lease similar property in Richmond, Virginia for our call center operations.
In addition, we own a one million square foot distribution center on approximately 100 acres of land in Henrico County, Virginia. We lease a 504,016 square foot facility in Pomona, California, which, along with our facility in Virginia, serve as our primary distribution facilities.
Litigation Relating to Bamboo Flooring
On or about December 8, 2014, Dana Gold filed a purported class action lawsuit in the United States District Court for the Northern District of California alleging that the Morning Star bamboo flooring that the Company sells is
19
defective (the “Gold Litigation”). Plaintiffs narrowed the complaint to the Company’s Morning Star Strand Bamboo flooring (the “Strand Bamboo Product”) sold to residents of California, Florida, Illinois, Minnesota, Pennsylvania and West Virginia for personal, family or household use. The Gold Litigation alleges that the Company engaged in deceptive trade practices in conjunction with the sale of the Strand Bamboo Products. The plaintiffs did not quantify any alleged damages in their complaint but, in addition to attorneys’ fees and costs, the plaintiffs sought a declaration that the Company’s actions violate the law and that it is financially responsible for notifying all purported class members, injunctive relief requiring the Company to replace and/or repair all of the Strand Bamboo Product installed in structures owned by the purported class members and a declaration that the Company must disgorge, for the benefit of the purported classes, all or part of the profits received from the sale of the allegedly defective Strand Bamboo Product and/or to make full restitution to the plaintiffs and the purported class members.
On September 30, 2019, the parties finalized a settlement agreement that is consistent with the terms of the Memorandum of Understanding previously disclosed by the Company, which would resolve the Gold Litigation on a nationwide basis. Under the terms of the settlement agreement, the Company will contribute $14 million in cash (the “Gold Cash Payment”) and provide $14 million in store-credit vouchers, with a potential additional $2 million in store-credit vouchers based on having a claim’s percentage of more than 7%, for an aggregate settlement of up to $30 million. The settlement agreement makes clear that the settlement does not constitute or include an admission by the Company of any fault or liability and the Company does not admit any fault, wrongdoing or liability. On December 18, 2019, the court issued an order that, among other things, granted preliminary approval of the settlement agreement. Following the preliminary approval, and pursuant to the terms of the settlement agreement, in December 2019, the Company paid $1 million for settlement administrative costs, which is part of the Gold Cash Payment, to the plaintiff’s settlement escrow account. A Final Approval and Settlement Hearing is currently scheduled for September 24, 2020. The settlement agreement is subject to certain contingencies, including court approval. There can be no assurance that a settlement will be finalized and approved by the court at the Final Approval and Settlement Hearing or as to the ultimate outcome of the litigation. If a final, court approved settlement is not reached, the Company will defend the matter vigorously and believes there are meritorious defenses and legal standards that must be met for, among other things, success on the merits. The Company has notified its insurance carriers and continues to pursue coverage, but the insurers to date have denied coverage. As the insurance claim is still pending, the Company has not recognized any insurance recovery related to the Gold Litigation.
The Company recognized a charge to earnings of $28 million within selling, general and administrative expense during the fourth quarter of 2018 as its loss became probable and estimable with the offset in the caption “Accrual for Legal Matters and Settlements Current” on its Consolidated Balance Sheet related to this settlement as of December 31, 2018. If the settlement agreement is not approved by the court or the Company incurs additional losses with respect to the Bamboo Flooring Litigation (as defined below), the actual losses that may result from these actions may exceed this amount. Any such losses could, potentially, have a material adverse effect, individually or collectively, on the Company’s results of operations, financial condition and liquidity.
In addition, there are a number of individual claims and lawsuits alleging damages involving Strand Bamboo Product (the “Bamboo Flooring Litigation”). While the Company believes that a loss associated with the Bamboo Flooring Litigation is reasonably possible, the Company is unable to reasonably estimate the amount or range of possible loss. Any such losses could, potentially, have a material adverse effect, individually or collectively, on the Company’s results of operations, financial condition and liquidity. The Company disputes the claims in the Bamboo Flooring Litigation and intends to defend such matters vigorously.
Litigation Relating to Chinese Laminates
Formaldehyde-Abrasion MDLs
Beginning on or about March 3, 2015, numerous purported class action cases were filed in various United States federal district courts and state courts involving claims of excessive formaldehyde emissions from the Company’s Chinese-manufactured laminate flooring products. The purported classes consisted of all United States consumers that purchased the relevant products during certain time periods. Plaintiffs in these cases challenged the Company’s labeling of its products as compliant with the California Air Resources Board Regulation and alleged claims for fraudulent concealment, breach of warranty, negligent misrepresentation and violation of various state consumer protection statutes.
20
The plaintiffs sought various forms of declaratory and injunctive relief and unquantified damages, including restitution and actual, compensatory, consequential and, in certain cases, punitive damages, as well as interest, costs and attorneys’ fees incurred by the plaintiffs and other purported class members in connection with the alleged claims. The United States Judicial Panel on Multidistrict Litigation (the “MDL Panel”) transferred and consolidated the federal cases to the United States District Court for the Eastern District of Virginia (the “Virginia Court”). The consolidated case in the Virginia Court is captioned In re: Lumber Liquidators Chinese-Manufactured Flooring Products Marketing, Sales, Practices and Products Liability Litigation (the “Formaldehyde MDL”).
Beginning on or about May 20, 2015, multiple class actions were filed in the United States District Court for the Central District of California and other district courts located in the place of residence of each non-California plaintiffs consisting of United States consumers who purchased the Company’s Chinese-manufactured laminate flooring products challenging certain representations about the durability and abrasion class ratings of such products. These plaintiffs asserted claims for fraudulent concealment, breach of warranty and violation of various state consumer protection statutes. The plaintiffs did not quantify any alleged damages in these cases; however, in addition to attorneys’ fees and costs, they did seek an order (i) certifying the action as a class action, (ii) adopting the plaintiffs’ class definitions and finding that the plaintiffs are their proper representatives, (iii) appointing their counsel as class counsel, (iv) granting injunctive relief to prohibit the Company from continuing to advertise and/or sell laminate flooring products with false abrasion class ratings, (v) providing restitution of all monies the Company received from the plaintiffs and class members and (vi) providing damages (actual, compensatory and consequential), as well as punitive damages. On October 3, 2016, the MDL Panel transferred and consolidated the abrasion class actions to the Virginia Court. The consolidated case is captioned In re: Lumber Liquidators Chinese-Manufactured Laminate Flooring Durability Marketing and Sales Practices Litigation (the “Abrasion MDL”).
On March 15, 2018, the Company entered into a settlement agreement to jointly settle the Formaldehyde MDL and the Abrasion MDL. Under the terms of the settlement agreement, the Company agreed to fund $22 million (the “MDL Cash Payment”) and provide $14 million in store-credit vouchers for an aggregate settlement amount of $36 million to settle claims brought on behalf of purchasers of Chinese-manufactured laminate flooring sold by the Company between January 1, 2009 and May 31, 2015. The $36 million aggregate settlement amount was accrued in 2017. On June 16, 2018, the Virginia Court issued an order that, among other things, granted preliminary approval of the settlement agreement. Following the preliminary approval, and pursuant to the terms of the settlement agreement, in June 2018, the Company paid $0.5 million for settlement administration costs, which is part of the MDL Cash Payment, to the plaintiffs’ settlement escrow account. Subsequent to the Final Approval and Fairness Hearing held on October 3, 2018, the Court approved the settlement on October 9, 2018 and, as a result, the Company paid $21.5 million in cash into the plaintiffs’ settlement escrow account.
On November 8, 2018, an individual filed a Notice of Appeal in the United States Court of Appeals for the Fourth Circuit (the “Appeals Court”) challenging the settlement. On December 14, 2018, another individual filed a Notice of Appeal in the Appeals Court. Subsequently, the Appeals Court consolidated both appeals and briefing is now complete. Vouchers, which generally have a three-year life, will be distributed by the administrator upon order of the Virginia Court. At December 31, 2019, the Company’s obligations related to Formaldehyde MDL and Abrasion MDL consisted of a short-term payable of $36 million with $14 million expected to be satisfied by the issuance of vouchers. If the appeals were to result in the settlement being set aside, the Company would receive $21.5 million back from the escrow agent. Accordingly, the Company has accounted for the payment of $21.5 million as a deposit in the caption “Deposit for Legal Settlements” on it Consolidated Balance Sheets. The Company has no liability accrued related to the appeals.
In addition to those purchasers who elected to opt out of the above settlement (the “Opt Outs”), there are a number of individual claims and lawsuits alleging personal injuries, breach of warranty claims or violation of state consumer protection statutes that remain pending (collectively, the “Related Laminate Matters”). Certain of these Related Laminate Matters were settled in 2019 and 2018. The Company recognized charges to earnings of $0.4 million and $2.9 million for the years ended December 31, 2019 and 2018, respectively, within selling, general and administrative expenses for these Related Laminate Matters. As of December 31, 2019, the remaining accrual related to these matters was $0.1 million, which has been included in the caption “Accrual for Legal Matters and Settlements Current” on the condensed consolidated balance sheet. While the Company believes that a further loss associated with
21
the Opt Outs and Related Laminate Matters is possible, the Company is unable to reasonably estimate the amount or range of possible loss beyond what has been provided. Any such losses could, potentially, have a material adverse effect, individually or collectively, on the Company’s results of operations, financial condition and liquidity.
Canadian Litigation
On or about April 1, 2015, Sarah Steele (“Steele”) filed a purported class action lawsuit in the Ontario, Canada Superior Court of Justice against the Company. In the complaint, Steele’s allegations include strict liability, breach of implied warranty of fitness for a particular purpose, breach of implied warranty of merchantability, fraud by concealment, civil negligence, negligent misrepresentation and breach of implied covenant of good faith and fair dealing relating to the Company’s Chinese-manufactured laminate flooring products. Steele did not quantify any alleged damages in her complaint, but seeks compensatory damages, punitive, exemplary and aggravated damages, statutory remedies, attorneys’ fees and costs. While the Company believes that a further loss associated with the Steele litigation is possible, the Company is unable to reasonably estimate the amount or range of possible loss.
Employment Cases
Mason Lawsuit
In August 2017, Ashleigh Mason, Dan Morse, Ryan Carroll and Osagie Ehigie filed a purported class action lawsuit in the United States District Court for the Eastern District of New York on behalf of all current and former store managers, store managers in training, installation sales managers and similarly situated current and former employees (collectively, the “Mason Putative Class Employees”) alleging that the Company violated the Fair Labor Standards Act (“FLSA”) and New York Labor Law (“NYLL”) by classifying the Mason Putative Class Employees as exempt. The alleged violations include failure to pay for overtime work. The plaintiffs sought certification of the Mason Putative Class Employees for (i) a collective action covering the period beginning three years prior to the filing of the complaint (plus a tolling period) through the disposition of this action for the Mason Putative Class Employees nationwide in connection with FLSA and (ii) a class action covering the period beginning six years prior to the filing of the complaint (plus a tolling period) through the disposition of this action for members of the Mason Putative Class Employees who currently are or were employed in New York in connection with NYLL. The plaintiffs did not quantify any alleged damages but, in addition to attorneys’ fees and costs, the plaintiffs seek class certification, unspecified amounts for unpaid wages and overtime wages, liquidated and/or punitive damages, declaratory relief, restitution, statutory penalties, injunctive relief and other damages.
In November 2018, the plaintiffs filed a motion requesting conditional certification for all store managers and store managers in training who worked within the federal statute of limitations period. In May 2019, the magistrate judge granted plaintiffs’ motion for conditional certification. The litigation is in the discovery stage, which currently closes in May 2020.
The Company disputes the Mason Putative Class Employees’ claims and intends to defend the matter vigorously. Given the uncertainty of litigation, the preliminary stage of the case and the legal standards that must be met for, among other things, class certification and success on the merits, the Company cannot estimate the reasonably possible loss or range of loss, if any, that may result from this action and therefore no accrual has been made related to this. Any such losses could, potentially, have a material adverse effect, individually or collectively, on the Company’s results of operations, financial condition and liquidity.
Kramer Lawsuit
In November 2017, Robert J. Kramer, on behalf of himself and all others similarly situated (collectively, the “Kramer Plaintiffs”) filed a purported class action lawsuit in the Superior Court of California, County of Sacramento on behalf of all current and former store managers, all others with similar job functions and/or titles and all current and former employees classified as non-exempt or incorrectly classified as exempt and who worked for the Company in the State of California (collectively, the “CSM Employees”) alleging violation of the California Labor Code including, among other items, failure to pay wages and overtime and engaging in unfair business practices (the “Kramer matter”).
22
The Kramer Plaintiffs seek certification of the CSM Employees for a class action covering the prior four-year period prior to the filing of the complaint through the disposition of this action for the CSM Employees who currently are or were employed in California (the “California SM Class”). On or about February 19, 2019, the Kramer Plaintiffs filed a first amended complaint adding a claim for penalties under the California Private Attorney General Act for the same substantive alleged violations asserted in the Complaint. The Kramer Plaintiffs did not quantify any alleged damages but, in addition to attorneys’ fees and costs, the Kramer Plaintiffs seek unspecified amounts for unpaid wages and overtime wages, liquidated and/or punitive damages, declaratory relief, restitution, statutory penalties, injunctive relief and other damages.
On September 9, 2019, the Company entered into an agreement to settle the Kramer matter, consistent with the terms of the Memorandum of Understanding previously disclosed by the Company. Under the terms of the settlement agreement, the Company will pay $4.75 million to settle the claims asserted in the Kramer matter (or which could have been asserted in the Kramer matter) on behalf of all current and/or former store managers and store managers in training employed by the Company at any time between November 17, 2013 and September 19, 2019. The settlement agreement was preliminarily approved by the court on September 19, 2019, and granted final approval on January 17, 2020. The Company recognized a net charge to earnings of approximately $4.75 million within selling general and administrative expense in its second quarter 2019 financial statements.
Antidumping and Countervailing Duties Investigation
In October 2010, a conglomeration of domestic manufacturers of multilayered wood flooring (“Petitioners”) filed a petition seeking the imposition of antidumping (“AD”) and countervailing duties (“CVD”) with the United States Department of Commerce (“DOC”) and the United States International Trade Commission (“ITC”) against imports of multilayered wood flooring from China. This ruling applies to companies importing multilayered wood flooring from Chinese suppliers subject to the AD and CVD orders. The Company’s multilayered wood flooring imports from China accounted for approximately 6% and 7% of its flooring purchases in 2019 and 2018, respectively. The Company’s consistent view through the course of this matter has been, and remains, that its imports are neither dumped nor subsidized.
As part of its processes in these proceedings, following the original investigation, the DOC conducts annual administrative reviews of the CVD and AD rates. In such cases, the DOC will issue preliminary rates that are not binding and are subject to comment by interested parties. After consideration of the comments received, the DOC will issue final rates for the applicable period, which may lag by a year or more. As rates are adjusted through the administrative reviews, the Company adjusts its payments prospectively based on the final rate. The Company will begin to pay the finalized rates on each applicable future purchase when recognized by United States Customs and Border Protection.
The DOC made its initial determinations in the original investigation regarding CVD and AD rates on April 6, 2011 and May 26, 2011, respectively. On December 8, 2011, orders were issued setting final AD and CVD rates at a maximum of 3.3% and 1.5%, respectively. These rates became effective in the form of additional duty deposits, which the Company has paid, and applied retroactively to the DOC initial determinations.
Following the issuance of these orders, a number of appeals were filed by several parties, including the Company, with the Court of International Trade (“CIT”) challenging, among other things, certain facts and methodologies that may impact the validity of the AD and CVD orders and the applicable rates. The Company participated in appeals of both the AD order and CVD order. On February 15, 2017, the Court of Appeals for the Federal Circuit (“CAFC”) vacated the CIT’s prior decision and remanded with instructions to the DOC to recalculate its AD rate. On remand, the DOC granted a 0% AD rate to eight Chinese suppliers, but did not exclude them permanently from the AD order. Nor did the CIT terminate the AD order. In July 2018, the CIT issued a judgment sustaining the DOC’s calculation of 0% for the eight suppliers, but also excluded three of them from the AD order. Certain Chinese suppliers and the Petitioners have appealed this judgment to the CAFC. The Company is evaluating the impact of the CIT’s judgment on its previously recorded expense related to the AD rates in the original investigation and subsequent annual reviews discussed below. Because of the length of time for finalization of rates as well as appeals, any subsequent
23
adjustment of CVD and AD rates typically flows through a period different from those in which the inventory was originally purchased and/or sold.
In the first DOC annual review in this matter, AD rates for the period from May 26, 2011 through November 30, 2012, and CVD rates from April 6, 2011 through December 31, 2011, were modified to a maximum of 5.92% and a maximum of 0.83%, respectively, which resulted in an additional payment obligation for the Company, based on best estimates and shipments during the applicable window, of $0.8 million. The Company recorded this as a long-term liability on its accompanying condensed consolidated balance sheet and in cost of sales in its second quarter 2015 financial statements. These AD rates were appealed to the CIT by several parties, including the Company. On remand from the CIT, the DOC has reduced the AD rate to a maximum of 0.73%. In June 2018, the CIT sustained the reduced AD rate of a maximum of 0.73% but did remand back to the DOC the issue regarding the calculation of the electricity rate, which, depending on that outcome, may cause a revision to the final AD rate. That remand from the DOC is expected to proceed in the spring of 2020 with the CIT’s lifting of a stay pending the final disposition of the appeal of the original investigation by the CAFC which issued its decision on January 10, 2020. This ruling from the CIT resulted in the Company reversing the $0.8 million accrual and recording a receivable of approximately $1.3 million during the second quarter of 2018.
The second annual review of the AD and CVD rates was initiated in February 2014. Pursuant to the second annual review, in early July 2015, the DOC finalized the AD rate for the period from December 1, 2012 through November 30, 2013 at a maximum of 13.74% and the CVD rate for the period from January 1, 2012 through December 31, 2012 at a maximum of 0.99%. The Company believes the best estimate of the probable additional amounts owed was $4.1 million for shipments during the applicable time periods, which was recorded as a long-term liability on its accompanying condensed consolidated balance sheet and included in cost of sales in its second quarter 2015 financial statements. Beginning in July 2015, the Company began depositing these rates on each applicable purchase. The Company and other parties appealed the AD rates relating to this second annual review to the CIT. In June 2018, the court remanded the case back to the DOC to recalculate several of its adjustments. In its June 2019 remand, the DOC reduced the AD rate to 6.55%. The CIT is expected to rule on the DOC’s remand by early 2020. If the final ruling remains at 6.55%, the Company’s liability of $4.1 million would decrease by $2.8 million to $1.3 million in the period in which the ruling is finalized.
The third annual review of the AD and CVD rates was initiated in February 2015. The third AD review covered shipments from December 1, 2013 through November 30, 2014. The third CVD review covered shipments from January 1, 2013 through December 31, 2013. In May 2016, the DOC issued the final CVD rate in the third review, which was a maximum of 1.38%. On July 13, 2016, the DOC set the final AD rate at a maximum of 17.37%. The Company appealed the AD rates to the CIT. In November 2018, the CIT issued an opinion sustaining the DOC’s results, and that decision was appealed to the CAFC by certain plaintiff interveners in January 2019. That CAFC decision is expected to be issued by the fall of 2020. The Company’s best estimate of the probable additional amounts owed associated with AD and CVD is approximately $5.5 million for shipments during the applicable time periods. During the quarter ended June 30, 2016, the Company recorded this amount in other long-term liabilities in its balance sheet and as a charge to earnings in cost of sales on its statement of operations. After payments during 2019, the remaining liability was $4.7 million as of December 31, 2019, included in the caption “Other Long-Term Liabilities” on the Consolidated Balance Sheets.
The fourth annual period has been resolved including appeals.
The DOC initiated the fifth annual review of AD and CVD rates in February 2017. The AD review covers shipments from December 1, 2015 through November 30, 2016. The CVD review covers shipments from January 1, 2015 through December 31, 2015. In June 2018, the DOC issued the final CVD rate in the fifth review, which was a maximum of 0.85% (with one company having a maximum rate of 0.11%). In July 2018, the DOC issued the final AD rate in the fifth review, which was a maximum of 0.00% and, the Company recorded a receivable in the amount of $2.6 million in other current assets in its balance sheet. Due to payments during the fourth quarter of 2019, there was no remaining receivable as of December 31, 2019. In connection with the issuance of the final CVD rate, with one company having a maximum rate of 0.11%, the Company recorded a receivable of less than $100 thousand.
24
The DOC initiated the sixth annual review of AD and CVD rates in February 2018. The AD review covers shipments from December 1, 2016 through November 30, 2017. The CVD review covers shipments from January 1, 2016 through December 31, 2016. In July 2019, the DOC issued the final AD rate in the sixth annual review, which was a maximum of 42.57% (with one company having a maximum rate of 0.00%), and the final CVD rate in the sixth annual review, which was a maximum of 3.2%. With the finalization of the AD rate for the sixth annual review, the Company recorded a net liability of $0.8 million during the third quarter of 2019 with a corresponding reduction in cost of sales. The Company received payments during 2019 for the vendor with a final rate of 0.00% and the remaining balance of $0.5 million as of December 31, 2019 was included in other current assets on the consolidated balance sheet. The vendors with a final rate of 42.57% are under appeal and the balance of $1.5 million as of December 31, 2019 was included in other long-term liabilities on the consolidated balance sheet. With the finalization of the CVD rate for the sixth annual review, the Company recorded a liability of $0.4 million during 2019 with a corresponding reduction in sales. After payments during 2019, the remaining balance was approximately $40 thousand as of December 31, 2019. The Company and other parties have appealed the final AD rate ruling to the CIT, which is expected to issue its decision in the fall of 2020. However there was not a stay placed on this period.
The DOC initiated the seventh annual review of the AD and CVD rates in March 2019. The AD review covers shipments from December 1, 2017 through November 30, 2018. The CVD review covers shipments from January 1, 2017 through December 31, 2017. In January 2020, the DOC issued non-binding preliminary results in the sixth annual review for CVD rates and AD rates. The preliminary AD rate was a maximum of 0.00%. The preliminary CVD rate was a maximum of 24.61%. The final CVD and AD rates in the seventh annual review are currently expected to be issued in June 2020. If the preliminary ruling regarding the CVD rate were to be finalized, the Company anticipates it would record a net liability of approximately $2 million. If the preliminary CVD rate were to be finalized, the Company currently expects that it would appeal such ruling.
The DOC is expected to initiate the eighth annual review of AD and CVD rates in February or March of 2020. The AD review will cover shipments from December 1, 2018 through November 30, 2019. The CVD review covers shipments from January 1, 2018 through December 31, 2018.
Outstanding AD and CVD duties are subject to interest based on the IRS quarterly published rate. The Company has recorded a net $0.6 million of interest expense through the line item Other Expense on the Statement of Operations during the year ended December 31, 2019.
Other Matters
The Company is also, from time to time, subject to claims and disputes arising in the normal course of business. In the opinion of management, while the outcome of any such claims and disputes cannot be predicted with certainty, its ultimate liability in connection with these matters is not expected to have a material adverse effect on the Company’s results of operations, financial position or liquidity.
Item 4. Mine Safety Disclosures.
None.
Item 5. Market for Registrant’s Common Equity, Related Stockholder Matters and Issuer Purchases of Equity Securities.
Market Information
Our common stock trades on the New York Stock Exchange (“NYSE”) under the trading symbol “LL.” We are authorized to issue up to 35,000,000 shares of common stock, par value $0.001. Total shares of common stock outstanding at February 20, 2020 were 28,724,931 and we had six stockholders of record.
25
Issuer Purchases of Equity Securities
The following table presents our share repurchase activity for the quarter ended December 31, 2019 (dollars in thousands, except per share amounts):
|
|
|
|
|
|
|
Total Number |
|
Maximum Dollar Value |
|
|
|
|
|
|
|
of Shares |
|
of Shares That May Yet |
|
|
|
|
|
|
|
Purchased as |
|
Be Purchased as |
|
|
|
Total Number |
|
Average |
|
Part of Publicly |
|
Part of Publicly |
|
|
|
of Shares |
|
Price Paid |
|
Announced |
|
Announced |
|
Period |
|
Purchased1 |
|
Per Share1 |
|
Programs2 |
|
Programs2 |
|
October 1, 2019 to October 31, 2019 |
|
— |
|
— |
|
— |
|
— |
|
November 1, 2019 to November 30, 2019 |
|
— |
|
— |
|
— |
|
— |
|
December 1, 2019 to December 31, 2019 |
|
— |
|
— |
|
— |
|
— |
|
Total |
|
— |
|
— |
|
— |
|
— |
1 We repurchased 1,610 shares of our common stock, at an average price of $9.08, in connection with the net settlement of shares issued as a result of the vesting of restricted shares during the quarter ended December 31, 2019.
2 Our initial stock repurchase program, which authorized the repurchase of up to $50 million in common stock, was authorized by our board of directors and publicly announced on February 22, 2012. Our board of directors subsequently authorized two additional stock repurchase programs, each of which authorized the repurchase of up to an additional $50 million in common stock. These programs were publicly announced on November 15, 2012 and February 19, 2014, respectively, and are currently indefinitely suspended until we are better able to evaluate the long-term customer demand and assess our estimates of operations and cash flow. At December 31, 2019, we had approximately $14.7 million remaining under this authorization.
Dividend Policy
We have never paid any dividends on our common stock and do not expect to pay them in the near future.
Securities Authorized for Issuance Under Equity Compensation Plans
See Item 12. “Security Ownership of Certain Beneficial Owners and Management and Related Stockholder Matters” for information regarding securities authorized for issuance under our equity compensation plans.
Performance Graph
The following graph compares the performance of our common stock during the period beginning December 31, 2014 through December 31, 2019, to that of the total return index for the NYSE Composite and a Custom Peer Group whose members are listed below assuming an investment of $100 on December 31, 2014. In calculating total annual stockholder return, reinvestment of dividends, if any, is assumed. The indices are included for comparative
26
purpose only. They do not necessarily reflect management’s opinion that such indices are an appropriate measure of the relative performance of our common stock.
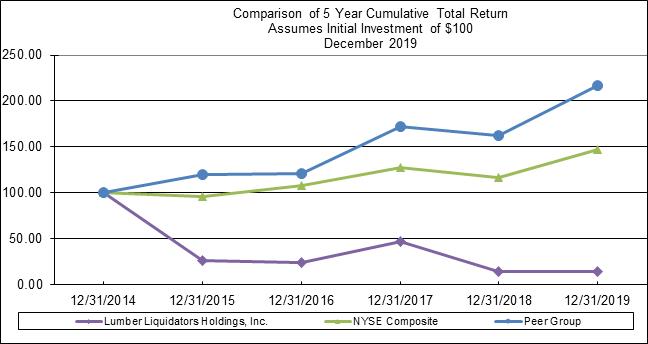
|
|
|
12/31/2014 |
|
12/31/2015 |
|
12/30/2016 |
|
12/30/2017 |
|
12/31/2018 |
|
12/31/2019 |
|
|
|
|
|
|
|
|
|
|
|
|
|
|
|
Lumber Liquidators Holdings, Inc. |
|
100.00 |
|
26.18 |
|
23.74 |
|
47.34 |
|
14.36 |
|
14.73 |
|
|
|
|
|
|
|
|
|
|
|
|
|
|
|
NYSE Composite |
|
100.00 |
|
96.03 |
|
107.62 |
|
127.96 |
|
116.72 |
|
146.76 |
|
|
|
|
|
|
|
|
|
|
|
|
|
|
|
Peer Group1 |
|
100.00 |
|
119.54 |
|
121.43 |
|
171.80 |
|
162.11 |
|
216.75 |
1 The Peer Group consists of industry competitors and other retailers of a similar size to the Company. They include: The Home Depot, Inc., Lowe’s Companies, Inc., Floor & Décor Holdings, Inc., Tile Shop Holdings, Inc., The Sherwin-Williams Company, Pier 1 Imports, Inc., Vitamin Shoppe, Inc., Hibbett Sports, Inc. and Haverty Furniture Companies, Inc.
Item 6. Selected Financial Data.
The selected statements of income data for the years ended December 31, 2019, 2018 and 2017 and the balance sheet data as of December 31, 2019 and 2018 have been derived from our audited consolidated financial statements included in Item 8. “Consolidated Financial Statements and Supplementary Data” of this report. This information should be read in conjunction with those audited financial statements, the notes thereto, and Item 7. “Management’s Discussion and Analysis of Financial Condition and Results of Operations” of this report.
The selected balance sheet data set forth below as of December 31, 2017, 2016 and 2015, and income data for the years ended December 31, 2016 and 2015 are derived from our audited consolidated financial statements contained
27
in reports previously filed with the SEC, which are not included herein. Our historical results are not necessarily indicative of our results for any future period.
|
|
|
Year Ended December 31, |
|
|||||||||||||
|
|
|
2019 1 |
|
2018 2 |
|
2017 3 |
|
2016 4 |
|
2015 5 |
|
|||||
|
|
|
(dollars in thousands, except per share amounts) |
|
|||||||||||||
|
Statement of Income Data |
|
|
|
|
|
|
|
|
|
|
|
|
|
|
|
|
|
Net Sales |
|
$ |
1,092,602 |
|
$ |
1,084,636 |
|
$ |
1,028,933 |
|
$ |
960,588 |
|
$ |
978,776 |
|
|
Comparable Store Net Sales (Decrease) Increase 6 |
|
|
(1.0) |
% |
|
2.6 |
% |
|
5.4 |
% |
|
(4.6) |
% |
|
(11.1) |
% |
|
Cost of Sales |
|
|
688,916 |
|
|
691,696 |
|
|
659,872 |
|
|
656,719 |
|
|
699,918 |
|
|
Gross Profit |
|
|
403,686 |
|
|
392,940 |
|
|
369,061 |
|
|
303,869 |
|
|
278,858 |
|
|
Selling, General and Administrative Expenses |
|
|
386,970 |
|
|
443,513 |
|
|
406,027 |
|
|
397,504 |
|
|
362,051 |
|
|
Operating Income (Loss) |
|
|
16,716 |
|
|
(50,573) |
|
|
(36,966) |
|
|
(93,635) |
|
|
(83,193) |
|
|
Other Expense |
|
|
3,764 |
|
|
2,827 |
|
|
1,591 |
|
|
638 |
|
|
234 |
|
|
Income (Loss) Before Income Taxes |
|
|
12,952 |
|
|
(53,400) |
|
|
(38,557) |
|
|
(94,273) |
|
|
(83,427) |
|
|
Income Tax Expense (Benefit) |
|
|
3,289 |
|
|
979 |
|
|
(734) |
|
|
(25,710) |
|
|
(26,994) |
|
|
Net Income (Loss) |
|
$ |
9,663 |
|
$ |
(54,379) |
|
$ |
(37,823) |
|
$ |
(68,563) |
|
$ |
(56,433) |
|
|
Net Income (Loss) per Common Share: |
|
|
|
|
|
|
|
|
|
|
|
|
|
|
|
|
|
Basic |
|
$ |
0.34 |
|
$ |
(1.90) |
|
$ |
(1.33) |
|
$ |
(2.51) |
|
$ |
(2.08) |
|
|
Diluted |
|
$ |
0.34 |
|
$ |
(1.90) |
|
$ |
(1.33) |
|
$ |
(2.51) |
|
$ |
(2.08) |
|
|
Weighted Average Common Shares Outstanding: |
|
|
|
|
|
|
|
|
|
|
|
|
|
|
|
|
|
Basic |
|
|
28,689 |
|
|
28,571 |
|
|
28,407 |
|
|
27,284 |
|
|
27,082 |
|
|
Diluted |
|
|
28,793 |
|
|
28,571 |
|
|
28,407 |
|
|
27,284 |
|
|
27,082 |
|
1 Results for the year ended December 31, 2019 include: (i) an unfavorable adjustment of antidumping costs and countervailing duties of $1.1 million associated with applicable shipments of engineered hardwood from China in a prior period, (ii) a favorable adjustment of duties related to prior periods of $0.8 million, and (iii) incremental legal and professional fees and settlement expenses, related to our defense of various legal matters of approximately $7.6 million.
2 Results for the year ended December 31, 2018 include: (i) a favorable adjustment of antidumping costs and countervailing duties of $4.9 million associated with applicable shipments of engineered hardwood from China in a prior period, (ii) a favorable adjustment of duties related to prior periods of $1.7 million, (iii) incremental legal and professional fees and settlement expenses, related to our defense of various legal matters of approximately $75.7 million and (iv) other expenses primarily related to an impairment of certain assets related to our decision to exit the finishing business totaling approximately $1.8 million.
3 Results for the year ended December 31, 2017 include: (i) a favorable adjustment of antidumping costs and countervailing duties of $2.8 million associated with applicable shipments of engineered hardwood from China in a prior period, (ii) reduced reserves for estimated costs to be incurred related to our indoor air quality testing program by approximately $1 million, (iii) incremental legal and professional fees and settlement expenses, related to our defense of various legal matters of approximately $48.3 million and (iv) other expenses primarily related to costs to dispose of certain Chinese laminate products whose sales were discontinued in 2015 and an impairment of certain assets related to a vertical integration initiative totaling approximately $3.1 million.
4 Results for the year ended December 31, 2016 include: (i) an unfavorable adjustment of antidumping costs and countervailing duties of $5.5 million associated with applicable shipments of engineered hardwood from China in a prior period, (ii) pre-tax expenses of $6.2 million related to the purchase of testing kits and professional fees in connection with our indoor air quality testing program, (iii) incremental legal and professional fees and settlement expenses, related to our defense of various legal matters of approximately $47.7 million and (iv) other expenses primarily related to employee retention initiatives totaling approximately $2.8 million.
28
5 Results for the year ended December 31, 2015 include: (i) the write down of our laminates and associated moldings sourced from China totaling approximately $22.5 million and other inventory adjustments of $6.6 million, (ii) an adjustment of antidumping costs and countervailing duties of $4.9 million associated with applicable shipments of engineered hardwood from China in a prior period, (iii) pre-tax expenses of $9.4 million related to the purchase of testing kits and professional fees in connection with our indoor air quality testing program, (iv) incremental legal and professional fees and settlement expenses, related to our defense of various legal matters of approximately $34.2 million and (v) other expenses related to the simplification of our business and employee retention totaling approximately $11.1 million.
6 A store is generally considered comparable on the first day of the thirteenth full calendar month after opening.
|
|
|
Year Ended December 31, |
|||||||||||||
|
|
|
2019 |
|
2018 |
|
2017 |
|
2016 |
|
2015 |
|||||
|
|
|
(dollars in thousands) |
|||||||||||||
|
Balance Sheet Data |
|
|
|
|
|
|
|
|
|
|
|
|
|
|
|
|
Cash and Cash Equivalents |
|
$ |
8,993 |
|
$ |
11,565 |
|
$ |
19,938 |
|
$ |
10,271 |
|
$ |
26,703 |
|
Merchandise Inventories |
|
|
286,369 |
|
|
318,272 |
|
|
262,280 |
|
|
301,892 |
|
|
244,402 |
|
Total Assets1 |
|
|
596,009 |
|
|
475,517 |
|
|
410,795 |
|
|
482,544 |
|
|
445,564 |
|
Customer Deposits and Store Credits |
|
|
41,571 |
|
|
40,332 |
|
|
38,546 |
|
|
32,639 |
|
|
33,771 |
|
Total Debt and Capital Lease Obligations |
|
|
82,000 |
|
|
65,000 |
|
|
15,000 |
|
|
40,351 |
|
|
20,000 |
|
Total Stockholders’ Equity |
|
|
161,250 |
|
|
147,398 |
|
|
197,847 |
|
|
230,892 |
|
|
277,568 |
|
Working Capital2 |
|
|
121,007 |
|
|
124,179 |
|
|
119,835 |
|
|
173,683 |
|
|
195,044 |
|
|
|
|
|
|
|
|
|
|
|
|
|
|
|
|
|
|
Other Data |
|
|
|
|
|
|
|
|
|
|
|
|
|
|
|
|
Total Stores in Operation (end of period) |
|
|
419 |
|
|
413 |
|
|
393 |
|
|
383 |
|
|
374 |
|
Average Sale3 |
|
$ |
1,379 |
|
$ |
1,355 |
|
$ |
1,310 |
|
$ |
1,255 |
|
$ |
1,230 |
1 Total Assets were impacted in 2019 by the adoption of ASC 842, as further described in Item 8 Notes 1 and 5, Leases.
2 Working Capital is defined as current assets minus current liabilities.
3 Average Sale is defined as the average invoiced sales order, measured quarterly, excluding returns as well as transactions under $100 (which are generally sample orders or add-on/accessories to existing orders).
Item 7. Management’s Discussion and Analysis of Financial Condition and Results of Operations.
Overview
Lumber Liquidators is one of the leading specialty retailers of hard-surface flooring in North America, offering a complete purchasing solution across an extensive assortment of domestic and exotic hardwood species, engineered hardwood, laminate, resilient vinyl, waterproof vinyl plank and porcelain tile. We also feature the renewable flooring products, bamboo and cork, and provide a wide selection of flooring enhancements and accessories, including moldings, noise-reducing underlayment, adhesives and flooring tools. We offer delivery and in-home installation services through third-party independent contractors for customers who purchase our floors. At December 31, 2019, we sold our products through 419 Lumber Liquidators stores in 47 states in the United States and in Canada, a customer relationship center and website.
We believe we have achieved a reputation for offering great value, superior service and a broad selection of high-quality hard-surface flooring products. With a balance of selection, quality, availability, service and price, we believe our value proposition is the most complete within a highly fragmented hard-surface flooring market. The
29
foundation for our value proposition is strengthened by our unique store model, the industry expertise of our people, our singular focus on hard-surface flooring, and our advertising reach and frequency.
To supplement the financial measures prepared in accordance with GAAP, we use the following non-GAAP financial measures: (i) Adjusted Gross Profit; (ii) Adjusted Gross Margin; (iii) Adjusted SG&A; (iv) Adjusted SG&A as a percentage of sales; (v) Adjusted Operating Income (Loss); (vi) Adjusted Operating Margin and (vii) Adjusted Earnings per Diluted Share. The non-GAAP financial measures should be viewed in addition to, and not in lieu of, financial measures calculated in accordance with GAAP. These supplemental measures may vary from, and may not be comparable to, similarly titled measures by other companies.
The non-GAAP financial measures are presented because management and analysts use these non-GAAP financial measures to evaluate our operating performance and management, in certain cases, uses them to determine incentive compensation and/or to address questions it receives. Therefore, we believe that the presentation of non-GAAP financial measures provides useful supplementary information to, and facilitates additional analysis by, investors. The presented non-GAAP financial measures exclude items that management does not believe reflect our core operating performance, which include regulatory and legal settlements and associated legal and operating costs, and changes in antidumping and countervailing duties from prior periods, as such items are outside of our control or due to their inherent unusual, non-operating, unpredictable, non-recurring, or non-cash nature.
Executive Summary
In 2019, we focused on several key initiatives related to our core business that we believed strengthened our sales and operating margin and provided an improved shopping experience to our customers. These initiatives were driving DIY, DIFM and Pro traffic, enhancing the customer experience and continuing to improve operational effectiveness.
Our results for the year ended December 31, 2019 were as follows:
|
· |
Net sales increased $8 million, or 0.7%, to $1,093 million in 2019 from $1,085 million in 2018, which includes a $19 million increase in non-comparable store net sales partially offset by a decrease of $11 million in comparable store net sales. Net services sales (install and freight) increased 6.1% over the prior year while merchandise sales remained flat. We opened 11 new stores in 2019, closed 5, and as of December 31, 2019, operated 419 stores in the United States and Canada. |
|
· |
Gross margin in 2019 increased to 36.9% from 36.2% in 2018, and when excluding items in the table that follows in Results of Operations, Adjusted Gross Margin (a non-GAAP measure) increased to 37% in 2019 from 35.6% in 2018. This 140 basis point improvement was due to a larger mix of higher-margin manufactured products, reduced discounting in the stores, merchandising cost-out efforts and selective retail price increases. The improvement in Adjusted Gross Margin was achieved despite higher tariff-related costs and an increased mix of lower-margin installation sales. |
|
· |
Selling, general and administrative (“SG&A”) expenses decreased as a percentage of net sales to 35.4% in 2019, compared to 40.9% in 2018. Excluding the items shown in the table that follows in Results of Operations, Adjusted SG&A as a percentage of net sales (a non-GAAP measure) was 34.7% in 2019, an increase of 100 basis points from 33.7% in 2018. The increase in Adjusted SG&A was driven by a combination of higher payroll and occupancy costs, which are primarily related to the 11 new stores opened this year, increases in IT expense, costs related to the headquarters move, and higher advertising. |
|
· |
Included in SG&A were legal-related costs and settlements of $7.6 million and $76 million in 2019 and 2018, respectively. |
30
|
· |
Operating income for the year ended December 31, 2019 was $17 million compared to an operating loss of $51 million for the year ended December 31, 2018, which was heavily influenced by certain legal settlements. Both periods were impacted by the unusual items summarized in the tables that follow in Results of Operations. Excluding these items, Adjusted Operating Income (a non-GAAP measure) was $25 million and Adjusted Operating Margin (a non-GAAP measure) was 2.3% in 2019, compared to $20 million, or 1.9%, in 2018. The primary driver of the increase was the growth in gross margin due to tariff mitigation efforts. |
|
· |
Net income for the year ended December 31, 2019 was $9.7 million, or $0.34 per diluted share, compared to a net loss of $54 million, or $1.90 per diluted share for the year ended December 31, 2018. 2019 benefited from actions taken to improve gross margin while 2018 was adversely affected by legal settlements and other legal costs. Adjusted Earnings per Diluted Share (a non-GAAP measure) was $0.58 in 2019 and $0.57 in 2018. |
|
· |
In August 2019, we experienced a network security incident caused by malware that prevented access to several of our information technology systems and data. Following the discovery of the incident, we promptly took actions to isolate and shut down affected systems based on our existing protocols. We implemented our business continuity plan and undertook actions to recover the affected systems. We believe we were successfully able to restore the operation of the systems without loss of business data. Based on the nature of the network security incident, the impact on our information technology systems and the results of the forensic IT analysis, we do not believe confidential customer, employee, or company data was lost or disclosed. Our stores remained open and operating throughout the incident, but were utilizing manual back-up processes for approximately six days which we believe had an adverse impact on sales. We maintain cyber-security and other insurance and have been working collaboratively with our carriers. As of December 31, 2019, we estimate the equipment replaced and costs associated with the incident to date to be approximately $3.7 million. During 2019, we received an initial recovery from insurance in excess of $2 million, capitalized new equipment, and recorded approximately $0.8 million as a receivable related to further anticipated recovery. The receivable is recorded in “Other Current Assets” on the Consolidated Balance Sheets and does not include any potential business interruption recovery or involuntary gains related to the incident. |
|
· |
Tariffs played a significant role in year-over-year comparisons. Beginning in September 2018, goods coming from China received an additional 10% tariff. Beginning in June 2019, the tariffs increased to 25%. In order to mitigate the impact of tariffs, we reduced discounting in the stores, implemented merchandising cost-out efforts and enacted retail price increases in order to mitigate the impact of tariffs. On November 7, 2019, the United States Trade Representative (“USTR”) ruled on a request made by certain interested parties, including the Company, and retroactively excluded certain flooring products imported from China from the Section 301 tariffs. The granted exclusion applies retroactively from the date the tariffs were originally implemented on September 24, 2018 through August 7, 2020. We recognized approximately $11 million of operating income in the fourth quarter of 2019 related to recoveries associated with relevant products already sold in 2018 and 2019, net of certain other associated costs. We also reduced the carrying cost of inventory by approximately $12 million related to relevant products held for sale and recorded a receivable of $25 million from United States Customs (included in the caption “Tariff Recovery Receivable” on the Consolidated Balance Sheets) related to anticipated recoveries and expect to receive payments throughout the first half of 2020. The recent tariff exclusions had a positive impact on the fourth quarter of 2019 and we expect it will also positively impact 2020. |
The Company obtains nearly half of its merchandise from Asia and most of that is sourced from China. As we enter 2020, we are closely monitoring the Coronavirus situation including the actions taken by authorities to combat the spread of the virus, which includes extended quarantines and restrictions on travel of both people and goods. The near-term risk to the Company is the potential disruption of our supply chain. We are currently unable to predict the full impact of these potential disruptions, how and in what manner our competitors will be affected, or the reaction of our customers. Merchandise on hand and already in route should allow us to avoid a material impact in the first quarter of
31
2020. However, depending on the length and severity of the situation, we could see a material impact beginning in the second quarter, and it could continue for weeks or months. We are monitoring on a daily basis and evaluating what actions to take to respond to potential disruptions.
As we head into 2020, our focus will be on delivering enhanced profitability, driving traffic to our stores and online, and improving the customer experience. Our research indicates that the initial interest in purchasing a floor begins with digital browsing. We believe that by providing an improved digital experience and better website performance, we will not only grow our e-commerce sales, but also drive traffic into our stores. Once customers are in our stores, we believe that our store model provides a competitive advantage by allowing our knowledgeable sales associates to assist customers throughout the project design and purchase process in a more intimate environment, from product selection to installation.
Working capital and liquidity
At December 31, 2019, we had $111 million in liquidity, comprised of $9 million of cash and $102 million in availability under our asset-based revolving loan (the “Revolving Loan”). We also had $286 million in inventory and $60 million in accounts payable, while borrowings against our Credit Agreement were $82 million. At December 31, 2018, we had $80 million in liquidity, comprised of $12 million of cash and $68 million in availability under our Revolving Loan. We also had $318 million in inventory and $73 million in accounts payable, while borrowings against our Revolving Loan were $65 million. The increase in liquidity at December 31, 2019 from the year earlier was driven by the increased borrowing capacity under the Credit Agreement, partially offset by the $33 million of cash paid for the DOJ and SEC settlements discussed in Item 3 along with other, smaller settlements, and $20 million of capital expenditures.
32
Results of Operations
We believe the selected sales data, the percentage relationship between Net Sales and major categories in the Consolidated Statements of Operations and the percentage change in the dollar amounts of each of the items presented below are important in evaluating the performance of our business operations.
|
|
|
|
|
|
|
|
|
% Increase (Decrease) |
|
|
|
|
% of Net Sales |
in Dollar Amounts |
||||||
|
|
|
Year Ended December 31, |
2019 |
|
|||||
|
|
|
2019 |
|
2018 |
|
vs. 2018 |
|
||
|
Net Sales |
|
|
|
|
|
|
|
|
|
|
Net Merchandise Sales |
|
|
87.5 |
% |
|
88.1 |
% |
0.0 |
% |
|
Net Services Sales |
|
|
12.5 |
% |
|
11.9 |
% |
6.1 |
% |
|
Total Net Sales |
|
|
100.0 |
% |
|
100.0 |
% |
0.7 |
% |
|
Gross Profit |
|
|
36.9 |
% |
|
36.2 |
% |
2.7 |
% |
|
Selling, General, and Administrative Expenses |
|
|
35.4 |
% |
|
40.9 |
% |
(12.7) |
% |
|
Operating Loss |
|
|
1.5 |
% |
|
(4.7) |
% |
NM |
|
|
Other Expense |
|
|
0.3 |
% |
|
0.2 |
% |
33.1 |
% |
|
Income (Loss)/ Before Income Taxes |
|
|
1.2 |
% |
|
(4.9) |
% |
NM |
|
|
Income Tax Expense |
|
|
0.3 |
% |
|
0.1 |
% |
NM |
|
|
Net Income (Loss) |
|
|
0.9 |
% |
|
(5.0) |
% |
NM |
|
|
SELECTED SALES DATA |
|
|
|
|
|
|
|
|
|
|
Average Sale1 |
|
$ |
1,379 |
|
$ |
1,355 |
|
1.8 |
% |
|
Average Retail Price per Unit Sold2 |
|
|
0.2 |
% |
|
(0.8) |
% |
|
|
|
Comparable Store Sales (Decrease) Increase (%) |
|
|
(1.0) |
% |
|
2.6 |
% |
|
|
|
|
|
|
|
|
|
|
|
|
|
|
Number of Stores Open, end of period |
|
|
419 |
|
|
413 |
|
|
|
|
Number of Stores Opened in Period, net |
|
|
11 |
|
|
20 |
|
|
|
|
Number of Stores Relocated in Period3 |
|
|
3 |
|
|
1 |
|
|
|
|
|
|
|
|
|
|
|
|
|
|
|
Comparable Stores4 (% change to prior year): |
|
|
|
|
|
|
|
|
|
|
Customers Invoiced5 |
|
|
(2.8) |
% |
|
(0.8) |
% |
|
|
|
Net Sales of Stores Operating for 13 to 36 months |
|
|
8.3 |
% |
|
13.1 |
% |
|
|
|
Net Sales of Stores Operating for more than 36 months |
|
|
(1.3) |
% |
|
2.3 |
% |
|
|
|
|
|
|
|
|
|
|
|
|
|
|
Net Sales in Markets with all Stores Comparable (no cannibalization) |
|
|
(0.3) |
% |
|
3.4 |
% |
|
|
|
1 |
Average Sale is defined as the average invoiced sales order, measured quarterly, excluding returns as well as transactions under $100 (which are generally sample orders or add-on/accessories to existing orders). |
2 Average retail price per unit (square feet for flooring and other units of measures for moldings and accessories) sold is calculated on a total company basis and excludes non-merchandise revenue.
3 A relocated store remains a comparable store as long as it is relocated within the primary trade area.
4 A store is generally considered comparable on the first day of the thirteenth full calendar month after opening.
5 Change in number of customers invoiced is calculated by applying the average sale to total net sales at comparable stores.
A detailed discussion of the 2019 year-over-year changes can be found below and should be read in conjunction with the Consolidated Financial Statements and the Notes to Consolidated Financial Statements presented in this report.
33
A detailed discussion of the 2018 year-over-year changes can be found in “Item 7. Management’s Discussion and Analysis of Financial Condition and Results of Operations” in the Form 10-K filed on March 18, 2019.
Net Sales
Net sales in 2019 increased $8 million, or 0.7%, from 2018 as net sales in comparable stores decreased $11 million, or 1%, and the net sales in non-comparable stores increased $19 million. Comparable store sales declined due to a decrease in store traffic of 2.8% and the 1.8% increase in average ticket was not enough to offset. Net services sales (install and freight) increased 6.1% over the prior year while merchandise sales remained flat. Pro sales growth significantly outpaced total company growth. By major category, manufactured products grew from 36% of sales in 2018 to 41% of sales in 2019, mostly offset by a decline in solid and engineered hardwood products. The vinyl sub-category within manufactured products continues to drive growth due to its outstanding aesthetics, high resilience and waterproof characteristics.
Gross Profit
Gross profit in 2019 increased 2.7% to $404 million from $393 million in 2018. Both years’ gross margins were impacted by the unusual items highlighted in the table that follows. When excluding these items, Adjusted Gross Margin (a non-GAAP measure) improved by 140 basis points driven by a larger mix of higher-margin manufactured products, reduced discounting in the stores, merchandising cost-out efforts and retail price increases. The gross margin improvement was achieved despite tariffs on certain flooring products imported from China as previously discussed.
We believe that each of the items below can distort the visibility of our ongoing performance and that the evaluation of our financial performance can be enhanced by use of supplemental presentation of our results that exclude the impact of these items.
|
|
|
|
|
|||||||||
|
|
|
|
Year Ended December 31, |
|||||||||
|
|
|
|
2019 |
|
2018 |
|
||||||
|
|
|
|
$ |
|
% of Sales |
|
$ |
|
% of Sales |
|
||
|
|
|
|
(dollars in thousands) |
|||||||||
|
Gross Profit/Margin, as reported (GAAP) |
|
|
$ |
403,686 |
|
36.9 |
% |
$ |
392,940 |
|
36.2 |
% |
|
|
|
|
|
|
|
|
|
|
|
|
|
|
|
Antidumping Adjustments 1 |
|
|
|
1,143 |
|
0.1 |
% |
|
(4,948) |
|
(0.5) |
% |
|
HTS Classification Adjustments 2 |
|
|
|
(779) |
|
— |
% |
|
(1,711) |
|
(0.1) |
% |
|
Sub-Total Items above |
|
|
|
364 |
|
0.1 |
% |
|
(6,659) |
|
(0.6) |
% |
|
|
|
|
|
|
|
|
|
|
|
|
|
|
|
Adjusted Gross Profit/Margin (non-GAAP measures) |
|
|
$ |
404,050 |
|
37.0 |
% |
$ |
386,281 |
|
35.6 |
% |
|
1 |
We recognized unfavorable adjustments to countervailing and antidumping duties of $1.1 million in the year ended December 31, 2019 and a favorable $4.9 million in the year ended December 31, 2018 associated with applicable shipments of engineered hardwood from China related to prior periods. |
2 We recognized favorable classification adjustments related to Harmonized Tariff Schedule (“HTS”) duty categorization in prior periods of $0.8 million and $1.7 million during the years ended December 31, 2019 and 2018, respectively.
Selling, General and Administrative Expenses
SG&A expenses in 2019 decreased 13% to $387 million from $444 million in 2018. The decrease in SG&A was primarily attributable to the absence of $61 million in accruals for settlements with the Unites States Attorney’s Office for the Eastern District of Virginia, the Department of Justice, Securities and Exchange Commission and the settlement of the Gold litigation related to the Company’s Morning Star Strand bamboo flooring that were recorded in the fourth quarter of 2018. Excluding the items shown in the table that follows, Adjusted SG&A (a non-GAAP measure) increased $13 million, or 3.6%, primarily driven by increases in payroll of $5.9 million and occupancy of $1.3 million, both of which are primarily related to the 11 new stores opened this year and full-year effects of the 21 stores opened in
34
2018. IT expenses increased $1.4 million from 2018 to 2019. The increase in SG&A expense was also impacted by costs related to the move to our new corporate headquarters and a $0.9 million increase in advertising. Payroll-related costs as a percentage of sales were 14.6% in 2019 and 14.2% in 2018. Other items affecting the increase in payroll included merit increases, executive bonus, retention and severance.
We believe that each of the items below can distort the visibility of our ongoing performance and that the evaluation of our financial performance can be enhanced by use of supplemental presentation of our results that exclude the impact of these items.
|
|
|
Year Ended December 31, |
|||||||||
|
|
|
2019 |
|
2018 |
|
||||||
|
|
|
$ |
|
% of Sales |
|
$ |
|
% of Sales |
|
||
|
|
|
(dollars in thousands) |
|||||||||
|
SG&A, as reported (GAAP) |
|
$ |
386,970 |
|
35.4 |
% |
$ |
443,513 |
|
40.9 |
% |
|
|
|
|
|
|
|
|
|
|
|
|
|
|
Accrual for Legal Matters and Settlements 3 |
|
|
3,475 |
|
0.3 |
% |
|
63,951 |
|
5.9 |
% |
|
Legal and Professional Fees 4 |
|
|
4,169 |
|
0.4 |
% |
|
11,707 |
|
1.1 |
% |
|
All Other 5 |
|
|
— |
|
— |
% |
|
1,769 |
|
0.2 |
% |
|
Sub-Total Items above |
|
|
7,644 |
|
0.7 |
% |
|
77,427 |
|
7.2 |
% |
|
|
|
|
|
|
|
|
|
|
|
|
|
|
Adjusted SG&A (a non-GAAP measure) |
|
$ |
379,326 |
|
34.7 |
% |
$ |
366,086 |
|
33.7 |
% |
|
3 |
2019 Accrual for Legal Matters and Settlements included $5.1 million of expense for the Kramer employment case and certain Related Laminate Matters partially offset by $1.6 million of insurance recoveries in 2019 related to certain significant legal actions. Accrual for Legal Matters and Settlements in 2018 represents the charge to earnings related to the Bamboo Flooring Litigation, the governmental investigations, and Related Laminate Matters in 2018. These matters are described more fully in Item 8. Note 10 to the consolidated financial statements. |
|
4 |
Represents charges to earnings related to our defense of significant legal actions, described in note 3 above, during the period. This does not include all legal costs incurred by the Company. |
|
5 |
All Other in 2018 represents an impairment of certain assets related to our decision to exit the finishing business. |
Operating Loss and Operating Margin
Operating income was $17 million in 2019, compared to an operating loss of $51 million in 2018. 2018 was heavily influenced by certain legal settlements. Adjusted Operating Income (a non-GAAP measure) was $25 million, with Adjusted Operating Margin of 2.3%, in 2019, compared to $20 million, or 1.9%, in 2018. The growth in gross margin due to tariff mitigation efforts was the primary driver of the increase which was partially offset by the 3.6% growth in Adjusted SG&A (a non-GAAP measure).
35
We believe that each of the items below can distort the visibility of our ongoing performance and that the evaluation of our financial performance can be enhanced by use of supplemental presentation of our results that exclude the impact of these items.
|
|
|
Year Ended December 31, |
|||||||||
|
|
|
2019 |
|
2018 |
|
||||||
|
|
|
$ |
|
% of Sales |
|
$ |
|
% of Sales |
|
||
|
|
|
(in thousands) |
|||||||||
|
Operating Income (Loss), as reported (GAAP) |
|
$ |
16,716 |
|
1.5 |
% |
$ |
(50,573) |
|
(4.7) |
% |
|
|
|
|
|
|
|
|
|
|
|
|
|
|
Gross Margin Items: |
|
|
|
|
|
|
|
|
|
|
|
|
Antidumping Adjustments 1 |
|
|
1,143 |
|
0.1 |
% |
|
(4,948) |
|
(0.5) |
% |
|
HTS Classification Adjustments 2 |
|
|
(779) |
|
— |
% |
|
(1,711) |
|
(0.1) |
% |
|
Gross Margin Subtotal |
|
|
364 |
|
0.1 |
% |
|
(6,659) |
|
(0.6) |
% |
|
|
|
|
|
|
|
|
|
|
|
|
|
|
SG&A Items: |
|
|
|
|
|
|
|
|
|
|
|
|
Accrual for Legal Matters and Settlements 3 |
|
|
3,475 |
|
0.3 |
% |
|
63,951 |
|
5.9 |
% |
|
Legal and Professional Fees 4 |
|
|
4,169 |
|
0.4 |
% |
|
11,707 |
|
1.1 |
% |
|
All Other 5 |
|
|
— |
|
— |
% |
|
1,769 |
|
0.2 |
% |
|
SG&A Subtotal |
|
|
7,644 |
|
0.7 |
% |
|
77,427 |
|
7.2 |
% |
|
|
|
|
|
|
|
|
|
|
|
|
|
|
Adjusted Operating Income/Margin (a non-GAAP measure) |
|
$ |
24,724 |
|
2.3 |
% |
$ |
20,195 |
|
1.9 |
% |
1,2 See the Gross Margin section above for more detailed explanations of these individual items.
3,4,5 See the SG&A section above for more detailed explanations of these individual items.
Provision for Income Taxes
We record tax expense each period for income taxes incurred for US federal tax, in certain states, and in foreign jurisdictions resulting in an effective tax rate of 25.4% and (1.8)% for the years ended December 31, 2019 and 2018, respectively. The increase in effective tax rate was driven by the complete depletion of federal net operating loss carryforwards.
We have a full valuation allowance recorded against our net deferred tax assets. We intend to maintain this valuation allowance on our deferred tax assets until there is sufficient evidence to support the reversal of all or some portion of these allowances. A reduction in the valuation allowance could result in a significant decrease in income tax expense in the period that the release is recorded. However, the exact timing and amount of any reduction in our valuation allowance are unknown at this time and will be subject to the earnings level we achieve in future periods.
We file income tax returns with the United States federal government and various state and foreign jurisdictions. In the normal course of business, we are subject to examination by taxing authorities. During 2017, the Internal Revenue Service completed audits of our income tax returns through 2016.
Diluted Earnings per Share
Net income for the year ended December 31, 2019 was $9.7 million, or $0.34 per diluted share. Net loss for the year ended December 31, 2018 was $54 million, resulting in a loss of $1.90 per diluted share. Adjusted Earnings and Adjusted Earnings per Diluted Share (a non-GAAP measure) for the year ended December 31, 2019 were $17 million and $0.58 per diluted share, compared to $16 million and $0.57 per diluted share for the year ended December 31, 2018.
We believe that each of the items below can distort the visibility of our ongoing performance and that the evaluation of our financial performance can be enhanced by use of supplemental presentation of our results that exclude the impact of these items.
36
|
|
|
Year Ended December 31, |
||||
|
|
|
2019 |
2018 |
|||
|
|
|
(in thousands) |
||||
|
Net Income (Loss), as reported (GAAP) |
|
$ |
9,663 |
|
$ |
(54,379) |
|
Net Income (Loss) per Diluted Share (GAAP) |
|
$ |
0.34 |
|
$ |
(1.90) |
|
|
|
|
|
|
|
|
|
Gross Margin Items: |
|
|
|
|
|
|
|
Antidumping Adjustments 1 |
|
|
1,143 |
|
|
(4,948) |
|
HTS Classification Adjustments 2 |
|
|
(779) |
|
|
(1,711) |
|
Gross Margin Subtotal |
|
|
364 |
|
|
(6,659) |
|
|
|
|
|
|
|
|
|
SG&A Items: |
|
|
|
|
|
|
|
Accrual for Legal Matters and Settlements 3 |
|
|
3,475 |
|
|
63,951 |
|
Legal and Professional Fees (2019 is net of taxes) 4 |
|
|
3,085 |
|
|
11,707 |
|
All Other 5 |
|
|
— |
|
|
1,769 |
|
SG&A Subtotal |
|
|
6,560 |
|
|
77,427 |
|
|
|
|
|
|
|
|
|
Adjusted Earnings |
|
$ |
16,587 |
|
$ |
16,389 |
|
Adjusted Earnings per Diluted Share (a non-GAAP measure) |
|
$ |
0.58 |
|
$ |
0.57 |
1,2,3 See the Gross Profit and SG&A sections above for more detailed explanations of these individual items.
|
4 |
Represents charges to earnings related to our defense of certain significant legal actions during the period. This does not include all legal costs incurred by the Company. 2019 items have been tax effected at the Company’s federal statutory rate of 26%. Due to the full valuation allowance of the deferred tax assets as of December 31, 2018, the 2018 adjustments did not have a tax impact during that year. |
|
5 |
All Other in 2018 represents an impairment of certain assets related to the Company’s decision to exit the finishing business. |
Liquidity and Capital Resources
Our principal liquidity and capital requirements are for capital expenditures to maintain and grow our business, for legal settlements, for working capital, and for general corporate purposes. Our principal sources of liquidity at December 31, 2019 were cash from our ongoing operations, $9 million of cash and cash equivalents and $102 million of availability under our Revolving Loan. As December 31, 2019, the outstanding balance of the revolving loan was $57 million and it carried an average interest rate of 3.90%. As of December 31, 2019, the outstanding balance of the first-in-last-out term loan was $25 million and it carried an interest rate of 4.75%.
The DOJ and SEC settlements, discussed in Item 3 of this Form 10-K, totaled $33 million and were paid in the second quarter of 2019 along with other, smaller settlements. Additionally, we funded $1 million of the cash portion of the settlement of the Gold Litigation in the fourth quarter of 2019; the remaining $13 million of the cash portion is expected to be paid subsequent to the court’s final approval, expected to be in 2020. We anticipate funding the $4.75 million Kramer settlement in the first half of 2020 after the court acts. In addition, we anticipate receiving at total of approximately $27 million from United States Customs related to tariff exclusion refunds.
On March 29, 2019, we amended our prior Credit Agreement to add incremental borrowing capacity of up to $50 million and to extend the maturity to 2024, which is described more fully in Item 8 Note 4 to the consolidated financial statements.
We currently expect capital expenditures for 2020 to total between $19 million and $21 million, but we will continue to assess and adjust our level of capital expenditures based on changing circumstances. Included in our capital requirement for 2020, is the funding to open approximately 15 stores and remodel and/or relocate some existing stores.
37
Although certain matters remain outstanding, we have taken significant steps to eliminate uncertainty associated with legal and regulatory matters previously discussed. We believe that cash flow from operations, together with liquidity sources mentioned above, will be sufficient to fund our settlements and operations and anticipated capital expenditures for the next 12 months. We prepare our forecasted cash flow and liquidity estimates based on assumptions that we believe to be reasonable, but are also inherently uncertain. Actual future cash flows could differ from these estimates.
Merchandise Inventories
Merchandise inventory is our most significant asset and is considered either “available for sale” or “inbound in-transit,” based on whether we have physically received and inspected the products at an individual store location, in our distribution centers or in another facility where we control and monitor inspection. During the fourth quarter of 2018, we purposefully purchased inventory in advance of an announced, but subsequently postponed, incremental 15% tariff on purchases of Chinese goods.
Merchandise inventories and available inventory per store in operation on December 31 were as follows:
|
|
|
As of |
|
As of |
||
|
|
|
December 31, 2019 |
|
December 31, 2018 |
||
|
|
|
(in thousands) |
||||
|
Inventory – Available for Sale |
|
$ |
254,812 |
|
$ |
275,036 |
|
Inventory – Inbound In-Transit |
|
|
31,557 |
|
|
43,236 |
|
Total Merchandise Inventories |
|
$ |
286,369 |
|
$ |
318,272 |
|
|
|
|
|
|
|
|
|
Available Inventory Per Store |
|
$ |
608 |
|
$ |
666 |
Available inventory per store at December 31, 2019 was lower than available inventory per store at December 31, 2018. The decrease in merchandise inventories from 2018 was driven by a change in product mix to lower-cost vinyl in 2019 combined with the tariff-related increase in inventory during the fourth quarter of 2018 discussed above and extra inventory carried in 2018 as we transitioned the finishing lines out of our Toano, Virginia facility.
Inbound in-transit inventory generally varies due to the timing of certain international shipments and certain seasonal factors, including international holidays, rainy seasons and specific merchandise category planning.
Cash Flows
The following table summarizes our cash flow activities for the years ended December 31, 2019, 2018 and 2017:
|
|
|
Year Ended December 31, |
||||||
|
|
|
2019 |
|
|
2018 |
|
|
2017 |
|
Net Cash provided by (used in): |
|
|
|
|
|
|
|
|
|
Operating Activities |
$ |
329 |
|
$ |
(42,986) |
|
$ |
39,392 |
|
Investing Activities |
|
(19,484) |
|
|
(13,461) |
|
|
(4,338) |
|
Financing Activities |
|
15,881 |
|
|
49,205 |
|
|
(26,193) |
|
Effect of Exchange Rates |
|
702 |
|
|
(1,131) |
|
|
806 |
|
Total |
$ |
(2,572) |
|
$ |
(8,373) |
|
$ |
9,667 |
Operating Activities. Net cash provided by operating activities was $0.3 million in 2019 and was primarily due to a $15 million decrease in inventory, net of payables. Net income in 2019 of $9.7 million was also a factor for the net cash provided by operating activities. These were mostly offset by payments for legal matters and settlements of $35 million.
38
Net cash used in operating activities was $43 million in 2018 and was primarily due to a $54 million increase in inventory, net of payables, which was the result of the build in inventory previously discussed, as well payments of $22 million on the remaining cash portion of the Formaldehyde MDL and Abrasion MDL obligation. Absent the build in inventory and the settlement payment, cash from operating activities would have been a positive $33 million.
Investing Activities. Net cash used in investing activities was $19 million in 2019 and $13 million in 2018. 2019 included our corporate headquarters move to Richmond, Virginia, and 11 new store openings. For the year ended December 31, 2018, there were 21 new stores openings.
Financing Activities. Net cash provided by financing activities was $16 million in 2019 and was primarily attributable to $17 million in net borrowings on the Credit Agreement. Net cash provided by financing activities was $49 million in 2018 and was primarily attributable to $50 million in net borrowings on the Revolving Loan.
Credit Agreement
On March 29, 2019, we entered into a Fourth Amended and Restated Credit Agreement (the “Credit Agreement”) with Bank of America, N.A. and Wells Fargo Bank, National Association (the “Lenders”). The Credit Agreement amended and restated the Third Amended and Restated Revolving Credit Agreement (the “Prior Agreement”). Under the Credit Agreement, the Lenders increased the maximum amount of borrowings under the revolving credit facility (the “Revolving Credit Facility”) from $150 million under the Prior Agreement to $175 million and added a new first in-last out $25 million term loan (the “FILO Term Loan”) for a total of $200 million, subject to the borrowing bases described below. We also have the option to increase the Revolving Credit Facility to a maximum total amount of $225 million, subject to the satisfaction of the conditions to such increase as specified in the Credit Agreement.
As of December 31, 2019, a total of $57 million was outstanding under the Revolving Credit Facility and $25 million was outstanding under the FILO Term Loan. We also had $3.9 million in letters of credit which factor into its remaining availability.
The Revolving Credit Facility and the FILO Term Loan mature on March 29, 2024 and are secured by security interests in the Collateral (as defined in the Credit Agreement), which includes substantially all of our assets including, among other things, our inventory and accounts receivables, and our East Coast distribution center located in Sandston, Virginia. Under the terms of the Credit Agreement, we have the ability to release the East Coast distribution center from the Collateral under certain conditions.
The Revolving Credit Facility is available to us up to the lesser of (1) $175 million or (2) a revolving borrowing base equal to the sum of specified percentages of our eligible credit card receivables, eligible inventory (including eligible in-transit inventory), and eligible owned real estate, less certain reserves, all of which are defined by the terms of the Credit Agreement (the “Revolving Borrowing Base”). If the outstanding FILO Term Loan exceeds the FILO Borrowing Base (as defined in the Credit Agreement), the amount of such excess reduces availability under the Revolving Borrowing Base.
Loans outstanding under the Credit Agreement can bear interest based on the Base Rate (as defined in the Credit Agreement) or the LIBOR Rate (as defined in the Credit Agreement). Interest on Base Rate loans is charged at varying per annum rates computed by applying a margin ranging from (i) 0.25% to 0.75% over the Base Rate with respect to the FILO Term Loan, in each case depending on the Borrower’s average daily excess borrowing availability under the Revolving Credit Facility during the most recently completed fiscal quarter. Interest on LIBOR Rate loans and fees for standby letters of credit are charged at varying per annum rates computed by applying a margin ranging from (i) 1.25% to 1.75% over the applicable LIBOR Rate with respect to revolving loans and (ii) 2.25% to 3.00% over the applicable LIBOR Rate with respect to the FILO Term Loan, in each case depending on our average daily excess borrowing availability under the Revolving Credit Facility during the most recently completed fiscal quarter.
The Credit Agreement contains a fixed charge coverage ratio covenant that becomes effective only when specified availability under the Revolving Credit Facility falls below the greater of $17.5 million or 10% of the
39
Combined Loan Cap (as defined in the Credit Agreement). This covenant – though not currently in effect – would have been met at December 31, 2019.
Contractual Commitments and Contingencies
Our significant contractual obligations and commitments as of December 31, 2019 are summarized in the following table:
|
|
|
Payments Due by Period |
|||||||||||||
|
|
|
Total |
|
Less Than 1 Year |
|
1 to 3 Years |
|
3 to 5 Years |
|
5+ Years |
|||||
|
|
|
(in thousands) |
|||||||||||||
|
Contractual Obligations |
|
|
|
|
|
|
|
|
|
|
|
|
|
|
|
|
Operating Lease Obligations 1 |
|
$ |
152,558 |
|
$ |
37,855 |
|
$ |
58,287 |
|
$ |
33,733 |
|
$ |
22,683 |
|
Purchase Obligations 2 |
|
|
180 |
|
|
180 |
|
|
— |
|
|
— |
|
|
— |
|
Total Debt Obligations, including current maturities |
|
|
82,000 |
|
|
— |
|
|
— |
|
|
82,000 |
|
|
— |
|
Total Contractual Obligations |
|
$ |
234,738 |
|
$ |
38,035 |
|
$ |
58,287 |
|
$ |
115,733 |
|
$ |
22,683 |
|
1 |
Included in this table is the base period or current renewal period for our operating leases. The operating leases generally contain varying renewal provisions. |
|
2 |
Purchase obligations represent contractual purchase commitments. |
Off-Balance Sheet Arrangements
We do not have any off-balance sheet arrangements or other financing activities with special-purpose entities.
New Accounting Pronouncements
See Summary of Significant Accounting Policies in Note 1 that is included in Item 8 of this Form 10‑K for further information about new accounting pronouncements adopted during 2019 and accounting pronouncements issued but not yet effective.
Critical Accounting Policies and Estimates
Critical accounting policies are those that we believe are both significant and that require us to make difficult, subjective or complex judgments, often because we need to estimate the effect of inherently uncertain matters. We base our estimates and judgments on historical experiences and various other factors that we believe to be appropriate under the circumstances. Actual results may differ from these estimates, and we might obtain different estimates if we used different assumptions or conditions. We believe the following critical accounting policies affect our more significant judgments and estimates used in the preparation of our financial statements.
Loss Contingencies
We are involved in various lawsuits, claims, investigations, and proceedings. Certain of these matters include speculative claims for substantial or indeterminate amounts of damages. We record a liability when we believe that it is both probable that a loss has been incurred and the amount can be reasonably estimated. If we determine that a loss is reasonably possible and a loss or range of the loss can be estimated, we disclose such amounts. Significant judgment is required to determine both probability and the estimated amount of any loss or range of loss. We assess each legal matter and any related provisions at least quarterly and adjust them accordingly to reflect the impact of negotiations, settlements, rulings, advice of legal counsel, and updated information.
Until a final resolution related to loss contingencies for legal and other contingencies is reached, there may be an exposure to loss in excess of the amount we have recorded, and such amounts could be material, either individually or in the aggregate, to our business, consolidated financial position, results of operations, or cash flows. Therefore, if one or
40
more of these matters were resolved against us for amounts in excess of management’s expectations, our results of operations and financial condition, including in a particular reporting period, could be materially adversely affected.
Valuation of Deferred Tax Assets
We account for income taxes and the related accounts in accordance with FASB ASC Topic 740, Income Taxes (“ASC 740”). Deferred tax liabilities and assets are determined based on the difference between the financial statement and tax basis of assets and liabilities using enacted rates expected to be in effect during the year in which the differences reverse. We periodically assess the likelihood that we will be able to recover our deferred tax assets and reflect any changes in estimates in the valuation allowance. Deferred tax assets are reduced by a valuation allowance when, in the opinion of management, it is more likely than not that some portion, or all, of the deferred tax asset will not be realized. At December 31, 2019, we had a valuation allowance of $27 million primarily attributable to the uncertainty related to the realizability of our deferred tax assets. Based upon a consideration of our cumulative loss history in the three-year period ended December 31, 2019, we did not rely upon projections of future taxable income in assessing the recoverability of deferred tax assets and determined that it is not more likely than not that our deferred tax assets will be realized.
Significant management judgment is required in determining our provision for income taxes, deferred tax assets and liabilities and the valuation allowance recorded against our net deferred tax assets, if any. Management considers estimates of the amount and character of future taxable income in assessing the likelihood of realization of deferred tax assets. Our actual effective tax rate and income tax expense could vary from estimated amounts due to the future impacts of various items, including changes in income tax laws, tax planning and the Company’s forecasted financial condition and results of operations in future periods. Although management believes current estimates are reasonable, actual results could differ from these estimates.
Stock-Based Compensation
We currently utilize a single equity incentive plan under which we may grant non-qualified stock options, restricted shares, stock appreciation rights and other equity awards to employees, non-employee directors and other service providers. We recognize expense for our stock-based compensation based on the fair value of the awards that are granted. Compensation expense is recognized only for those awards expected to vest, with forfeitures estimated at the date of grant based on our historical experience and future expectations. Measured compensation cost is recognized ratably over the service period of the entire related stock-based compensation award.
The fair value of stock options was estimated at the date of grant using the Black-Scholes-Merton valuation model. In order to determine the related stock-based compensation expense, we used the following assumptions for stock options granted during 2019:
|
· |
Expected life of 5.5 years; |
|
· |
Expected stock price volatility of 55%; |
|
· |
Risk-free interest rate of 2.1%; and |
|
· |
Dividends are not expected to be paid in any year. |
The expected stock price volatility is based on the historical volatility of our stock price. The volatility is estimated for a period of time equal to the expected term of the related option. The risk-free interest rate is based on the implied yield of United States Treasury zero-coupon issues with an equivalent remaining term. The expected term of the options represents the estimated period of time until exercise and is determined by considering the contractual terms, vesting schedule and expectations of future employee behavior. We have never paid a dividend. Had we arrived at different assumptions of stock price volatility or expected terms of our options, our stock-based compensation expense and results of operations could have been different.
41
Recognition of Net Sales
We recognize net sales for products purchased at the time the customer takes possession of the merchandise. We recognize service revenue, which consists primarily of installation revenue and freight charges for in-home delivery, when the service has been rendered. We report sales exclusive of sales taxes collected from customers and remitted to governmental taxing authorities. Net sales are reduced by an allowance for anticipated sales returns that we estimate based on historical and current sales trends and experience. We believe that our estimate for sales returns is an accurate reflection of future returns. Any reasonably likely changes that may occur in the assumptions underlying our allowance estimates would not be expected to have a material impact on our financial condition or operating performance. Actual sales returns did not vary materially from estimated amounts for 2019, 2018 or 2017.
In addition, customers who do not take immediate delivery of their purchases are generally required to pay a deposit, equal to approximately half of the retail sales value, with the balance payable when the customer takes possession of the merchandise. These customer deposits benefit our cash flow and return on investment capital, because we receive partial payment for our customers’ purchases immediately. We record these deposits as a liability on our balance sheet in Customer Deposits and Store Credits until the customer takes possession of the merchandise.
Merchandise Inventories
We value our merchandise inventories at the lower of cost or net realizable value. We determine merchandise cost using the weighted average method. All of the hardwood flooring we purchase from suppliers is either prefinished or unfinished, and in immediate saleable form. Inventory cost includes the costs of bringing an article to its existing condition and location such as shipping and handling and import tariffs. In determining market value, we make judgments and estimates as to the market value of our products, based on factors such as historical results and current sales trends. Any reasonably likely changes that may occur in those assumptions in the future may require us to record charges for losses or obsolescence against these assets, but would not be expected to have a material impact on our financial condition or operating performance. Actual losses and obsolescence charges did not vary materially from estimated amounts for 2019, 2018 or 2017.
Item 7A. Quantitative and Qualitative Disclosures About Market Risk.
Interest Rate Risk
We are exposed to interest rate risk through the investment of our cash and cash equivalents and our Credit Agreement. We may invest our cash in short-term investments with maturities of three months or less. Changes in interest rates affect the interest income we earn, and therefore impact our cash flows and results of operations. Borrowings under our Credit Agreement are exposed to interest rate risk due to the variable rate of the borrowings. As of December 31, 2019, we had $82 million outstanding under our Credit Agreement. If the interest rate had varied by 1% in either direction throughout 2019, interest expense would have fluctuated by $820,000.
We currently do not engage in any interest rate hedging activity and have no current intention to do so. However, in the future, in an effort to mitigate losses associated with these risks, we may at times enter into derivative financial instruments, although we have not historically done so. We do not, and do not intend to, engage in the practice of trading derivative securities for profit.
Exchange Rate Risk
Less than two percent of our revenue, expense and capital purchasing activities are transacted in currencies other than the United States dollar, including the Euro, Canadian dollar, Chinese yuan and Brazilian real.
We currently do not engage in any exchange rate hedging activity as the vast majority of our foreign purchases are denominated in United States dollars. However, in the future, in an effort to mitigate losses associated with these risks, we may at times engage in transactions involving various derivative instruments to hedge revenues, inventory purchases, assets and liabilities denominated in foreign currencies. If the exchange rate on December 31, 2019 had varied by 10% in either direction, net income from Canadian operations would have fluctuated nominally.
42
Item 8. Consolidated Financial Statements and Supplementary Data.
43
Report of Independent Registered Public Accounting Firm
To the Stockholders and the Board of Directors of Lumber Liquidators Holdings, Inc.
Opinion on the Financial Statements
We have audited the accompanying consolidated balance sheets of Lumber Liquidators Holdings, Inc. (the Company) as of December 31, 2019 and 2018, the related consolidated statements of operations, comprehensive income (loss), stockholders’ equity and cash flows for each of the three years in the period ended December 31, 2019, and the related notes and Financial Statement Schedule II – Analysis of Valuation and Qualifying Accounts (collectively referred to as the “consolidated financial statements”). In our opinion, the consolidated financial statements present fairly, in all material respects, the financial position of the Company at December 31, 2019 and 2018, and the results of its operations and its cash flows for each of the three years in the period ended December 31, 2019, in conformity with U.S. generally accepted accounting principles.
We also have audited, in accordance with the standards of the Public Company Accounting Oversight Board (United States) (PCAOB), the Company’s internal control over financial reporting as of December 31, 2019, based on criteria established in Internal Control-Integrated Framework issued by the Committee of Sponsoring Organizations of the Treadway Commission (2013 framework), and our report dated February 24, 2020 expressed an unqualified opinion thereon.
Adoption of ASU No. 2016-02
As discussed in Note 1 to the consolidated financial statements, the Company changed its method of accounting for leases in 2019 due to the adoption of ASU No. 2016-02, Leases (Topic 842), and the related amendments.
Basis for Opinion
These financial statements are the responsibility of the Company’s management. Our responsibility is to express an opinion on the Company’s financial statements based on our audits. We are a public accounting firm registered with the PCAOB and are required to be independent with respect to the Company in accordance with the U.S. federal securities laws and the applicable rules and regulations of the Securities and Exchange Commission and the PCAOB.
We conducted our audits in accordance with the standards of the PCAOB. Those standards require that we plan and perform the audit to obtain reasonable assurance about whether the financial statements are free of material misstatement, whether due to error or fraud. Our audits included performing procedures to assess the risks of material misstatement of the financial statements, whether due to error or fraud, and performing procedures that respond to those risks. Such procedures included examining, on a test basis, evidence regarding the amounts and disclosures in the financial statements. Our audits also included evaluating the accounting principles used and significant estimates made by management, as well as evaluating the overall presentation of the financial statements. We believe that our audits provide a reasonable basis for our opinion.
/s/ Ernst & Young LLP
We have served as the Company’s auditor since 2003.
Richmond, Virginia
February 24, 2020
44
Report of Independent Registered Public Accounting Firm
To the Stockholders and the Board of Directors of Lumber Liquidators Holdings, Inc.
Opinion on Internal Control Over Financial Reporting
We have audited Lumber Liquidators Holdings, Inc.’s internal control over financial reporting as of December 31, 2019, based on criteria established in Internal Control—Integrated Framework issued by the Committee of Sponsoring Organizations of the Treadway Commission (2013 framework) (the COSO criteria). In our opinion, Lumber Liquidators Holdings, Inc. (the Company) maintained, in all material respects, effective internal control over financial reporting as of December 31, 2019, based on the COSO criteria.
We also have audited, in accordance with the standards of the Public Company Accounting Oversight Board (United States) (PCAOB), the 2019 consolidated financial statements of the Company and our report dated February 24, 2020 expressed an unqualified opinion thereon.
Basis for Opinion
The Company’s management is responsible for maintaining effective internal control over financial reporting and for its assessment of the effectiveness of internal control over financial reporting included in the accompanying Management’s Report on Internal Control over Financial Reporting. Our responsibility is to express an opinion on the Company’s internal control over financial reporting based on our audit. We are a public accounting firm registered with the PCAOB and are required to be independent with respect to the Company in accordance with the U.S. federal securities laws and the applicable rules and regulations of the Securities and Exchange Commission and the PCAOB.
We conducted our audit in accordance with the standards of the PCAOB. Those standards require that we plan and perform the audit to obtain reasonable assurance about whether effective internal control over financial reporting was maintained in all material respects.
Our audit included obtaining an understanding of internal control over financial reporting, assessing the risk that a material weakness exists, testing and evaluating the design and operating effectiveness of internal control based on the assessed risk, and performing such other procedures as we considered necessary in the circumstances. We believe that our audit provides a reasonable basis for our opinion.
Definition and Limitations of Internal Control Over Financial Reporting
A company’s internal control over financial reporting is a process designed to provide reasonable assurance regarding the reliability of financial reporting and the preparation of financial statements for external purposes in accordance with generally accepted accounting principles. A company’s internal control over financial reporting includes those policies and procedures that (1) pertain to the maintenance of records that, in reasonable detail, accurately and fairly reflect the transactions and dispositions of the assets of the company; (2) provide reasonable assurance that transactions are recorded as necessary to permit preparation of financial statements in accordance with generally accepted accounting principles, and that receipts and expenditures of the company are being made only in accordance with authorizations of management and directors of the company; and (3) provide reasonable assurance regarding prevention or timely detection of unauthorized acquisition, use, or disposition of the company’s assets that could have a material effect on the financial statements.
45
Because of its inherent limitations, internal control over financial reporting may not prevent or detect misstatements. Also, projections of any evaluation of effectiveness to future periods are subject to the risk that controls may become inadequate because of changes in conditions, or that the degree of compliance with the policies or procedures may deteriorate.
/s/ Ernst & Young LLP
Richmond, Virginia
February 24, 2020
46
Lumber Liquidators Holdings, Inc.
(in thousands)
|
|
|
December 31, |
|
December 31, |
||
|
|
|
2019 |
|
2018 |
||
|
Assets |
|
|
|
|
|
|
|
Current Assets: |
|
|
|
|
|
|
|
Cash and Cash Equivalents |
|
$ |
8,993 |
|
$ |
11,565 |
|
Merchandise Inventories |
|
|
286,369 |
|
|
318,272 |
|
Prepaid Expenses |
|
|
8,288 |
|
|
6,299 |
|
Deposit for Legal Settlement |
|
|
21,500 |
|
|
21,500 |
|
Tariff Recovery Receivable |
|
|
27,025 |
|
|
— |
|
Other Current Assets |
|
|
6,938 |
|
|
8,667 |
|
Total Current Assets |
|
|
359,113 |
|
|
366,303 |
|
Property and Equipment, net |
|
|
98,733 |
|
|
93,689 |
|
Operating Lease Right-of-Use Assets |
|
|
121,796 |
|
|
— |
|
Goodwill |
|
|
9,693 |
|
|
9,693 |
|
Other Assets |
|
|
6,674 |
|
|
5,832 |
|
Total Assets |
|
$ |
596,009 |
|
$ |
475,517 |
|
|
|
|
|
|
|
|
|
Liabilities and Stockholders’ Equity |
|
|
|
|
|
|
|
Current Liabilities: |
|
|
|
|
|
|
|
Accounts Payable |
|
$ |
59,827 |
|
$ |
73,412 |
|
Customer Deposits and Store Credits |
|
|
41,571 |
|
|
40,332 |
|
Accrued Compensation |
|
|
11,742 |
|
|
9,265 |
|
Sales and Income Tax Liabilities |
|
|
7,225 |
|
|
4,200 |
|
Accrual for Legal Matters and Settlements - Current |
|
|
67,471 |
|
|
97,625 |
|
Operating Lease Liabilities - Current |
|
|
31,333 |
|
|
— |
|
Other Current Liabilities |
|
|
18,937 |
|
|
17,290 |
|
Total Current Liabilities |
|
|
238,106 |
|
|
242,124 |
|
Other Long-Term Liabilities |
|
|
13,757 |
|
|
20,203 |
|
Operating Lease Liabilities - Long-Term |
|
|
100,470 |
|
|
— |
|
Deferred Tax Liability |
|
|
426 |
|
|
792 |
|
Credit Agreement |
|
|
82,000 |
|
|
65,000 |
|
Total Liabilities |
|
|
434,759 |
|
|
328,119 |
|
|
|
|
|
|
|
|
|
Stockholders’ Equity: |
|
|
|
|
|
|
|
Common Stock ($0.001 par value; 35,000 shares authorized; 29,958 and 31,578 shares issued and 28,714 and 28,627 shares outstanding at December 31, 2019 and 2018, respectively) |
|
|
30 |
|
|
32 |
|
Treasury Stock, at cost (1,245 and 2,951 shares, respectively) |
|
|
(142,314) |
|
|
(141,828) |
|
Additional Capital |
|
|
218,616 |
|
|
213,744 |
|
Retained Earnings |
|
|
86,498 |
|
|
76,835 |
|
Accumulated Other Comprehensive Loss |
|
|
(1,580) |
|
|
(1,385) |
|
Total Stockholders’ Equity |
|
|
161,250 |
|
|
147,398 |
|
Total Liabilities and Stockholders’ Equity |
|
$ |
596,009 |
|
$ |
475,517 |
See accompanying notes to consolidated financial statements.
47
Lumber Liquidators Holdings, Inc.
Consolidated Statements of Operations
(in thousands except per share amounts)
|
|
|
|
|
|
|
|
|
|
|
|
|
|
Year Ended December 31, |
|||||||
|
|
|
2019 |
|
2018 |
|
2017 |
|||
|
|
|
|
|
|
|
|
|
||
|
Net Sales |
|
|
|
|
|
|
|
|
|
|
Net Merchandise Sales |
|
$ |
956,041 |
|
$ |
955,949 |
|
$ |
938,269 |
|
Net Services Sales |
|
|
136,561 |
|
|
128,687 |
|
|
90,664 |
|
Total Net Sales |
|
|
1,092,602 |
|
|
1,084,636 |
|
|
1,028,933 |
|
Cost of Sales |
|
|
|
|
|
|
|
|
|
|
Cost of Merchandise Sold |
|
|
586,918 |
|
|
596,411 |
|
|
591,087 |
|
Cost of Services Sold |
|
|
101,998 |
|
|
95,285 |
|
|
68,785 |
|
Total Cost of Sales |
|
|
688,916 |
|
|
691,696 |
|
|
659,872 |
|
Gross Profit |
|
|
403,686 |
|
|
392,940 |
|
|
369,061 |
|
Selling, General and Administrative Expenses |
|
|
386,970 |
|
|
443,513 |
|
|
406,027 |
|
Operating Income (Loss) |
|
|
16,716 |
|
|
(50,573) |
|
|
(36,966) |
|
Other Expense |
|
|
3,764 |
|
|
2,827 |
|
|
1,591 |
|
Income (Loss) Before Income Taxes |
|
|
12,952 |
|
|
(53,400) |
|
|
(38,557) |
|
Income Tax Expense (Benefit) |
|
|
3,289 |
|
|
979 |
|
|
(734) |
|
Net Income (Loss) |
|
$ |
9,663 |
|
$ |
(54,379) |
|
$ |
(37,823) |
|
Net Income (Loss) per Common Share—Basic |
|
$ |
0.34 |
|
$ |
(1.90) |
|
$ |
(1.33) |
|
Net Income (Loss) per Common Share—Diluted |
|
$ |
0.34 |
|
$ |
(1.90) |
|
$ |
(1.33) |
|
Weighted Average Common Shares Outstanding: |
|
|
|
|
|
|
|
|
|
|
Basic |
|
|
28,689 |
|
|
28,571 |
|
|
28,407 |
|
Diluted |
|
|
28,793 |
|
|
28,571 |
|
|
28,407 |
See accompanying notes to consolidated financial statements.
48
Lumber Liquidators Holdings, Inc.
Consolidated Statements of Comprehensive Income (Loss)
(in thousands)
|
|
|
|
|
|
|
|
|
|
|
|
|
|
Year Ended December 31, |
|||||||
|
|
|
2019 |
|
2018 |
|
2017 |
|||
|
|
|
|
|
|
|
|
|
||
|
|
|
|
|
|
|
|
|
|
|
|
Net Income (Loss) |
|
$ |
9,663 |
|
$ |
(54,379) |
|
$ |
(37,823) |
|
Other Comprehensive (Loss) Income: |
|
|
|
|
|
|
|
|
|
|
Foreign Currency Translation Adjustments |
|
|
(195) |
|
|
(233) |
|
|
304 |
|
Total Other Comprehensive (Loss) Income |
|
|
(195) |
|
|
(233) |
|
|
304 |
|
Comprehensive Income (Loss) |
|
$ |
9,468 |
|
$ |
(54,612) |
|
$ |
(37,519) |
See accompanying notes to consolidated financial statements.
49
Lumber Liquidators Holdings, Inc.
Consolidated Statements of Stockholders’ Equity
(in thousands)
|
|
|
|
|
|
|
|
|
|
|
|
|
|
|
|
|
|
|
Accumulated |
|
|
|
|
|
|
|
|
|
|
|
|
|
|
|
|
|
|
|
|
|
|
|
Other |
|
Total |
||
|
|
|
Common Stock |
|
Treasury Stock |
|
Additional |
|
Retained |
|
Comprehensive |
|
Stockholders’ |
||||||||||
|
|
|
Shares |
|
Par Value |
|
Shares |
|
Value |
|
Capital |
|
Earnings |
|
Income (Loss) |
|
Equity |
||||||
|
|
|
|
|
|
|
|
|
|
|
|
|
|
|
|
|
|
|
|
|
|
|
|
|
|
|
|
|
|
|
|
|
|
|
|
|
|
|
|
|
|
|
|
|
|
|
|
|
December 31, 2016 |
|
28,248 |
|
$ |
31 |
|
2,854 |
|
$ |
(139,420) |
|
$ |
202,700 |
|
$ |
169,037 |
|
$ |
(1,456) |
|
$ |
230,892 |
|
|
|
|
|
|
|
|
|
|
|
|
|
|
|
|
|
|
|
|
|
|
|
|
|
Stock-Based Compensation Expense |
|
— |
|
|
— |
|
— |
|
|
— |
|
|
4,582 |
|
|
— |
|
|
— |
|
|
4,582 |
|
Exercise of Stock Options |
|
88 |
|
|
— |
|
— |
|
|
— |
|
|
1,347 |
|
|
— |
|
|
— |
|
|
1,347 |
|
Release of Restricted Shares |
|
154 |
|
|
— |
|
— |
|
|
— |
|
|
— |
|
|
— |
|
|
— |
|
|
— |
|
Common Stock Repurchased |
|
— |
|
|
— |
|
53 |
|
|
(1,455) |
|
|
— |
|
|
— |
|
|
— |
|
|
(1,455) |
|
Translation Adjustment |
|
— |
|
|
— |
|
— |
|
|
— |
|
|
— |
|
|
— |
|
|
304 |
|
|
304 |
|
Net Loss |
|
— |
|
|
— |
|
— |
|
|
— |
|
|
— |
|
|
(37,823) |
|
|
— |
|
|
(37,823) |
|
December 31, 2017 |
|
28,490 |
|
$ |
31 |
|
2,907 |
|
$ |
(140,875) |
|
$ |
208,629 |
|
$ |
131,214 |
|
$ |
(1,152) |
|
$ |
197,847 |
|
|
|
|
|
|
|
|
|
|
|
|
|
|
|
|
|
|
|
|
|
|
|
|
|
Stock-Based Compensation Expense |
|
— |
|
|
— |
|
— |
|
|
— |
|
|
4,346 |
|
|
— |
|
|
— |
|
|
4,346 |
|
Exercise of Stock Options |
|
44 |
|
|
— |
|
— |
|
|
— |
|
|
770 |
|
|
— |
|
|
— |
|
|
770 |
|
Release of Restricted Shares |
|
93 |
|
|
1 |
|
— |
|
|
— |
|
|
(1) |
|
|
— |
|
|
— |
|
|
— |
|
Common Stock Repurchased |
|
— |
|
|
— |
|
44 |
|
|
(953) |
|
|
— |
|
|
— |
|
|
— |
|
|
(953) |
|
Translation Adjustment |
|
— |
|
|
— |
|
— |
|
|
— |
|
|
— |
|
|
— |
|
|
(233) |
|
|
(233) |
|
Net Loss |
|
— |
|
|
— |
|
— |
|
|
— |
|
|
— |
|
|
(54,379) |
|
|
— |
|
|
(54,379) |
|
December 31, 2018 |
|
28,627 |
|
$ |
32 |
|
2,951 |
|
$ |
(141,828) |
|
$ |
213,744 |
|
$ |
76,835 |
|
$ |
(1,385) |
|
$ |
147,398 |
|
|
|
|
|
|
|
|
|
|
|
|
|
|
|
|
|
|
|
|
|
|
|
|
|
Stock-Based Compensation Expense |
|
— |
|
|
— |
|
— |
|
|
— |
|
|
4,872 |
|
|
— |
|
|
— |
|
|
4,872 |
|
Release of Restricted Shares |
|
87 |
|
|
— |
|
— |
|
|
— |
|
|
— |
|
|
— |
|
|
— |
|
|
— |
|
Common Stock Repurchased |
|
— |
|
|
(2) |
|
(1,706) |
|
|
(486) |
|
|
— |
|
|
— |
|
|
— |
|
|
(488) |
|
Translation Adjustment |
|
— |
|
|
— |
|
— |
|
|
— |
|
|
— |
|
|
— |
|
|
(195) |
|
|
(195) |
|
Net Income |
|
— |
|
|
— |
|
— |
|
|
— |
|
|
— |
|
|
9,663 |
|
|
— |
|
|
9,663 |
|
December 31, 2019 |
|
28,714 |
|
$ |
30 |
|
1,245 |
|
$ |
(142,314) |
|
$ |
218,616 |
|
$ |
86,498 |
|
$ |
(1,580) |
|
$ |
161,250 |
See accompanying notes to consolidated financial statements.
50
Lumber Liquidators Holdings, Inc.
Consolidated Statements of Cash Flows
(in thousands)
|
|
|
Year Ended December 31, |
|||||||
|
|
|
2019 |
|
2018 |
|
2017 |
|||
|
|
|
|
|
|
|
|
|
||
|
Cash Flows from Operating Activities: |
|
|
|
|
|
|
|
|
|
|
Net Income (Loss) |
|
$ |
9,663 |
|
$ |
(54,379) |
|
$ |
(37,823) |
|
Adjustments to Reconcile Net Income (Loss): |
|
|
|
|
|
|
|
|
|
|
Depreciation and Amortization |
|
|
17,465 |
|
|
18,425 |
|
|
17,739 |
|
Deferred Income Taxes (Benefit) Provision |
|
|
(366) |
|
|
240 |
|
|
(3,246) |
|
Stock-Based Compensation Expense |
|
|
4,848 |
|
|
4,091 |
|
|
4,735 |
|
Provision for Inventory Obsolescence Reserves |
|
|
1,888 |
|
|
3,108 |
|
|
6,349 |
|
(Gain) Loss on Disposal of Fixed Assets |
|
|
(221) |
|
|
1,818 |
|
|
1,498 |
|
Changes in Operating Assets and Liabilities: |
|
|
|
|
|
|
|
|
|
|
Merchandise Inventories |
|
|
28,941 |
|
|
(59,179) |
|
|
32,614 |
|
Accounts Payable |
|
|
(13,640) |
|
|
4,852 |
|
|
(52,475) |
|
Customer Deposits and Store Credits |
|
|
1,353 |
|
|
1,685 |
|
|
6,001 |
|
Prepaid Expenses and Other Current Assets |
|
|
(27,113) |
|
|
2,902 |
|
|
28,962 |
|
Accrual for Legal Matters and Settlements |
|
|
4,575 |
|
|
63,951 |
|
|
36,960 |
|
Deposit for Legal Settlement |
|
|
— |
|
|
(21,500) |
|
|
— |
|
Payments for Legal Matters and Settlements |
|
|
(34,729) |
|
|
(2,904) |
|
|
(2,522) |
|
Other Assets and Liabilities |
|
|
7,665 |
|
|
(6,096) |
|
|
600 |
|
Net Cash Provided by (Used in) Operating Activities |
|
|
329 |
|
|
(42,986) |
|
|
39,392 |
|
|
|
|
|
|
|
|
|
|
|
|
Cash Flows from Investing Activities: |
|
|
|
|
|
|
|
|
|
|
Purchases of Property and Equipment |
|
|
(19,906) |
|
|
(14,332) |
|
|
(7,411) |
|
Other Investing Activities |
|
|
422 |
|
|
871 |
|
|
3,073 |
|
Net Cash Used in Investing Activities |
|
|
(19,484) |
|
|
(13,461) |
|
|
(4,338) |
|
|
|
|
|
|
|
|
|
|
|
|
Cash Flows from Financing Activities: |
|
|
|
|
|
|
|
|
|
|
Borrowings on Credit Agreement |
|
|
104,500 |
|
|
74,000 |
|
|
40,000 |
|
Payments on Credit Agreement |
|
|
(87,500) |
|
|
(24,000) |
|
|
(65,000) |
|
Proceeds from the Exercise of Stock Options |
|
|
— |
|
|
770 |
|
|
1,347 |
|
Payments on Financed Insurance Obligations |
|
|
— |
|
|
(612) |
|
|
(734) |
|
Other Financing Activities |
|
|
(1,119) |
|
|
(953) |
|
|
(1,806) |
|
Net Cash Provided by (Used in) Financing Activities |
|
|
15,881 |
|
|
49,205 |
|
|
(26,193) |
|
Effect of Exchange Rates on Cash and Cash Equivalents |
|
|
702 |
|
|
(1,131) |
|
|
806 |
|
Net (Decrease) Increase in Cash and Cash Equivalents |
|
|
(2,572) |
|
|
(8,373) |
|
|
9,667 |
|
Cash and Cash Equivalents, Beginning of Year |
|
|
11,565 |
|
|
19,938 |
|
|
10,271 |
|
Cash and Cash Equivalents, End of Year |
|
$ |
8,993 |
|
$ |
11,565 |
|
$ |
19,938 |
|
|
|
|
|
|
|
|
|
|
|
|
Supplemental disclosure of non-cash operating and financing activities: |
|
|
|
|
|
|
|
|
|
|
Tenant Improvement Allowance for Leases |
|
$ |
(2,962) |
|
$ |
— |
|
$ |
— |
|
Financed Insurance Premiums |
|
|
— |
|
|
— |
|
|
1,346 |
|
|
|
|
|
|
|
|
|
|
|
|
|
|
|
|
|
|
|
|
|
|
|
|
|
|
|
|
|
|
|
|
|
See accompanying notes to consolidated financial statements.
51
Lumber Liquidators Holdings, Inc.
Notes to Consolidated Financial Statements
(amounts in thousands, except share data and per share amounts)
Note 1. Summary of Significant Accounting Policies
Nature of Business
Lumber Liquidators Holdings, Inc. and its direct and indirect subsidiaries (collectively and, where applicable, individually, the “Company”) engage in business as a multi-channel specialty retailer of hard-surface flooring, and hard-surface flooring enhancements and accessories, operating as a single operating segment. The Company offers an extensive assortment of exotic and domestic hardwood species, engineered hardwood, laminate, resilient vinyl, waterproof vinyl plank and porcelain tile flooring direct to the consumer. The Company features the renewable flooring products, bamboo and cork, and provides a wide selection of flooring enhancements and accessories, including moldings, noise-reducing underlayment, adhesives and flooring tools. The Company also provides in-home delivery and installation services to its customers. The Company sells primarily to homeowners or to contractors on behalf of homeowners through a network of store locations in metropolitan areas. The Company’s stores spanned 47 states in the United States (“U.S.”) and included eight stores in Canada at December 31, 2019. In addition to the store locations, the Company’s products may be ordered, and customer questions/concerns addressed, through both its customer relationship center in Richmond, Virginia, and its website, www.lumberliquidators.com. Until January 2019, the Company finished the majority of its Bellawood products on its finishing lines in Toano, Virginia, which along with the call center, corporate offices and a distribution center, represented the corporate headquarters until November 2019. In July of 2018, the Company announced its plan to sell its finishing line equipment to an unaffiliated third-party purchaser and to relocate its corporate headquarters to Richmond, Virginia, in 2019. The move of the corporate headquarters to Richmond, Virginia was completed as of November 2019.
Organization and Basis of Financial Statement Presentation
The consolidated financial statements of Lumber Liquidators Holdings, Inc., a Delaware corporation, include the accounts of its wholly owned subsidiaries. All significant intercompany transactions have been eliminated in consolidation.
Use of Estimates
The preparation of financial statements in conformity with accounting principles generally accepted in the U.S. requires management to make estimates and assumptions that affect the amounts reported in the consolidated financial statements and accompanying notes. During 2018, the Company recognized significant liabilities related to various legal and regulatory matters. While the payment of these liabilities in 2019, 2018, and 2017 has had, and is expected to have, a material adverse impact on the Company’s liquidity and cash flow from operations, the Company estimates that it has sufficient liquidity through amounts available under its Revolving Credit Facility and forecasted cash flows from operations to fund its working capital, including these legal and regulatory liabilities. The Company prepares its forecasted cash flow and liquidity estimates based on assumptions that it believes to be reasonable but are also inherently uncertain. Actual future cash flows could differ from these estimates.
Cash and Cash Equivalents
The Company had cash and cash equivalents of $9 million and $12 million at December 31, 2019 and 2018, respectively. The Company considers all highly liquid investments with a maturity date of three months or less when purchased to be cash equivalents, of which there were zero at December 31, 2019 and 2018, respectively. The Company accepts a range of debit and credit cards, and these transactions are generally transmitted to a bank for reimbursement within 24 hours. The payments due from the banks for these debit and credit card transactions are generally received, or settled, within 24 to 48 hours of the transmission date. The Company considers all debit and credit card transactions that
52
settle in less than seven days to be cash and cash equivalents. Amounts due from the banks for these transactions classified as cash equivalents totaled $6.5 million and $7.3 million at December 31, 2019 and 2018, respectively.
Credit Programs
Credit is offered to the Company’s customers through a credit card, underwritten by a third-party financial institution and at no recourse to the Company. A credit line is offered to the Company’s professional customers through the Lumber Liquidators Commercial Credit Program. This commercial credit program is underwritten by a third-party financial institution, generally with no recourse to the Company.
As part of the credit program, the Company’s customers may tender their Lumber Liquidators credit card to receive installation services. As of December 31, 2019, the Company utilized a network of associates to perform certain customer-facing, consultative services and coordinate the installation of its flooring products by third-party independent contractors in all of its stores.
Fair Value of Financial Instruments
The carrying amounts of financial instruments such as cash and cash equivalents, accounts payable and other liabilities approximates fair value because of the short-term nature of these items. The carrying amount of obligations under its Credit Agreement approximates fair value due to the variable rate of interest.
Merchandise Inventories
The Company values merchandise inventories at the lower of cost or net realizable value. The method by which amounts are removed from inventory is weighted average cost. All of the hardwood flooring purchased from vendors is either prefinished or unfinished, and in immediate saleable form. The Company relies on a select group of international suppliers to provide imported flooring products that meet the Company’s specifications. In 2019, approximately 46% of the Company’s product was sourced from China. The Company is subject to near-term risks associated with obtaining products from abroad, including disruptions or delays in production, shipments, delivery or processing as a result of a pandemic, including the Coronavirus. The Company is developing contingency plans to minimize potential disruptions.
Inventory cost includes the costs of bringing an article to its existing condition and location such as shipping and handling and import tariffs. Prior to the sale of the finishing line equipment in 2018, the Company would add the finish to, and box, various species of unfinished product, to produce certain proprietary products, primarily Bellawood. Any finishing and boxing costs were included in the average unit cost of related merchandise inventory. In addition, the Company maintains an inventory reserve for loss or obsolescence based on historical results and current sales trends. This reserve was $6.9 million and $6.8 million at December 31, 2019 and 2018, respectively.
Included in merchandise inventories are tariff related costs, including Section 301 tariffs. In late 2019, the United States Trade Representative (“USTR”) ruled on a request made by certain interested parties, including the Company, and retroactively excluded certain flooring products imported from China from the Section 301 tariffs. The Company has recorded a $27 million receivable related to these tariffs in the caption “Tariff Recovery Receivable” on the Consolidated Balance Sheets and expects to receive payments by the end of 2020.
Impairment of Long-Lived Assets
The Company evaluates potential impairment losses on long-lived assets and right-of-use assets used in operations when events and circumstances indicate that the assets may be impaired, and the undiscounted cash flows estimated to be generated by those assets are less than the carrying amounts of those assets. If impairment exists and the undiscounted cash flows estimated to be generated by those assets are less than the carrying amount of those assets, an impairment loss is recorded based on the difference between the carrying value and fair value of the assets.
During 2018, the Company decided to exit the finishing business and entered into an agreement to sell this equipment to a third party, which altered the Company’s expectations of future cash flows from these long-lived assets.
53
As a result, the Company tested certain long-lived assets for impairment and recorded a $1.8 million impairment charge within selling, general and administrative (“SG&A”) expenses in its accompanying consolidated statements of operations. The charge was measured as the difference between the fair value (Level 2 inputs under ASC 820) of the assets and the carrying value of the related net assets based on the contract to sell to a third party. The Company received $0.8 million in connection with this transaction during 2018 and had $1.0 million in assets held-for-sale, included in Other Current Assets on the Consolidated Balance Sheet as of December 31, 2018. During 2019, the Company received $0.9 million in connection with this transaction and had $0.1 million in assets held-for-sale included in Other Current Assets on the Consolidated Balance Sheet as of December 31, 2019.
During 2017, the Company determined that the carrying value of certain assets that had once been part of a discontinued vertical integration strategy was above their fair value and recorded an impairment charge of $1.5 million within SG&A expenses in the consolidated statements of operations. The charge was measured as the difference between the fair value (Level 2 inputs under ASC-820) of the assets and the carrying value of the related net assets based on a contract to sell to a third party.
Goodwill and Other Indefinite-Lived Intangibles
Goodwill represents the costs in excess of the fair value of net assets acquired associated with acquisitions by the Company. As of December 31, 2019 and 2018, other assets include $0.8 million for an indefinite-lived intangible asset for the phone number 1‑800‑HARDWOOD and related internet domain names. The Company evaluates these assets for impairment on an annual basis, or whenever events or changes in circumstance indicate that the asset carrying value exceeds its fair value. Based on the analysis performed, the Company has concluded that no impairment in the value of these assets has occurred.
Self-Insurance
The Company is self-insured for certain employee health benefit claims and for certain workers’ compensation claims. The Company estimates a liability for aggregate losses below stop-loss coverage limits based on estimates of the ultimate costs to be incurred to settle known claims and claims incurred but not reported as of the balance sheet date. The estimated liability is not discounted and is based on a number of assumptions and factors including historical and industry trends and economic conditions. This liability could be affected if future occurrences and claims differ from these assumptions and historical trends. As of December 31, 2019 and 2018, the Company had accruals of $2.5 million and $2.4 million, respectively, related to estimated claims included in other current liabilities.
Recognition of Net Sales
In May 2014, the FASB issued Accounting Standards Update No. 2014-09 (“Topic 606”), Revenue from Contracts with Customers, which superseded the revenue recognition requirements in Topic 605, Revenue Recognition, including most industry-specific revenue recognition guidance. The core principle of Topic 606 is that an entity recognizes revenue to depict the transfer of promised goods or services to customers in an amount that reflects the consideration to which the entity expects to be entitled in exchange for those goods or services and when control of those goods and services has passed to the customer. The Company adopted Topic 606 as of January 1, 2018 using the modified retrospective transition method. However, because adoption of the standard did not change the timing or amount of the Company’s recognition of revenue and because the Company does not recognize revenues for partial contracts, there was no adjustment to retained earnings needed as part of the adoption of the new standard.
The Company generates revenues primarily by retailing merchandise in the form of hard-surface and porcelain flooring and accessories. Additionally, the Company expands its revenues by offering services to deliver and/or install this merchandise for its customers; it considers these services to be separate performance obligations. The separate performance obligations are detailed on the customer’s invoice(s) and the customer often purchases flooring merchandise without purchasing installation or delivery services. Sales occur through a network of 419 stores, which spanned 47 states, including eight stores in Canada at December 31, 2019. In addition, both the merchandise and services can be ordered through a call center and from the Company’s website, www.lumberliquidators.com. The Company’s agreements with its customers are of short duration (less than a year), and as such the Company has elected
54
not to disclose revenue for partially satisfied contracts that will be completed in the days following the end of a period as permitted by GAAP. The Company reports its revenues exclusive of sales taxes collected from customers and remitted to governmental taxing authorities, consistent with past practice.
Revenue is based on consideration specified in a contract with a customer and excludes any sales incentives from vendors and amounts collected on behalf of third parties. The Company recognizes revenue when it satisfies a performance obligation by transferring control over a product to a customer or performing service for a customer. Revenues from installation and freight services are recognized when the delivery is made or the installation is complete, which approximates the recognition of revenue over time due to the short duration of service provided. The price of the Company’s merchandise and services is specified in the respective contract and detailed on the invoice agreed to with the customer including any discounts. The Company generally requires customers to pay a deposit, equal to approximately half of the retail sales value, when ordering merchandise not regularly carried in a given location or not currently in stock. In addition, the Company generally does not extend credit to its customers with payment due in full at the time the customer takes possession of merchandise or when the service is provided. Customer payments and deposits received in advance of the customer taking possession of the merchandise or receiving the services are recorded as deferred revenues in the accompanying consolidated balance sheet caption Customer Deposits and Store Credits.
The following table shows the activity in this account for the periods noted:
|
|
Year Ended December 31, |
|||||||
|
|
2019 |
|
2018 |
|
2017 |
|||
|
Customer Deposits and Store Credits, Beginning Balance |
$ |
(40,332) |
|
$ |
(38,546) |
|
$ |
(32,639) |
|
New Deposits |
|
(1,163,691) |
|
|
(1,155,019) |
|
|
(1,101,841) |
|
Recognition of Revenue |
|
1,092,602 |
|
|
1,084,636 |
|
|
1,028,933 |
|
Sales Tax included in Customer Deposits |
|
67,029 |
|
|
67,125 |
|
|
66,028 |
|
Other |
|
2,821 |
|
|
1,472 |
|
|
973 |
|
Customer Deposits and Store Credits, Ending Balance |
$ |
(41,571) |
|
$ |
(40,332) |
|
$ |
(38,546) |
Subject to limitations under the Company’s policy, return of unopened merchandise is accepted for 90 days. The amount of revenue recognized for flooring merchandise is adjusted for expected returns, which are estimated based on the Company’s historical data, current sales levels and forecasted economic trends. The Company uses the expected value method to estimate returns because it has a large number of contracts with similar characteristics. The Company previously recognized revenue in full, recorded an allowance for expected returns (contra-revenue) and recorded a separate refund liability for expected returns. The Company reduces revenue by the amount of expected returns and records it within Accrued Expenses and Other on the consolidated balance sheet. The Company continues to estimate the amount of returns based on the historical data. In addition, the Company recognizes a related asset for the right to recover returned merchandise and records it in the Other Current Assets caption of the accompanying consolidated balance sheet. This amount was $1.2 million at December 31, 2019 and 2018. The Company recognizes sales commissions as incurred since the amortization period is less than one year.
We offer hundreds of different flooring products; however, no single flooring product represented a significant portion of our sales mix. By major product category, our sales mix was as follows:
|
|
|
Year Ended December 31, |
|
|||||||||||||
|
|
|
2019 |
|
2018 |
|
2017 |
|
|||||||||
|
Manufactured Products 1 |
|
$ |
452,914 |
|
41 |
% |
$ |
392,512 |
|
36 |
% |
$ |
315,369 |
|
31 |
% |
|
Solid and Engineered Hardwood |
|
|
319,582 |
|
29 |
% |
|
367,026 |
|
34 |
% |
|
423,301 |
|
41 |
% |
|
Moldings and Accessories and Other |
|
|
183,545 |
|
17 |
% |
|
196,411 |
|
18 |
% |
|
199,599 |
|
19 |
% |
|
Installation and Delivery Services |
|
|
136,561 |
|
13 |
% |
|
128,687 |
|
12 |
% |
|
90,664 |
|
9 |
% |
|
Total |
|
$ |
1,092,602 |
|
100 |
% |
$ |
1,084,636 |
|
100 |
% |
$ |
1,028,933 |
|
100 |
% |
1Includes laminate, vinyl, engineered vinyl plank and porcelain tile.
55
Cost of Sales
Cost of sales includes the cost of products sold, including tariffs, the cost of installation services, and transportation costs from vendors to the Company’s distribution centers or store locations. It also includes any applicable finishing costs related to production of the Company’s proprietary brands, transportation costs from distribution centers to store locations, transportation costs for the delivery of products from store locations to customers, certain costs of quality control procedures, warranty and customer satisfaction costs, inventory adjustments including obsolescence and shrinkage, and costs to produce samples, which are net of vendor allowances.
The Company offers a range of limited warranties for the durability of the finish on its prefinished products to its services provided. These limited warranties range from one to 100 years, with lifetime warranties for certain of the Company’s products. Warranty reserves are based primarily on claims experience, sales history and other considerations, including payments made to satisfy customers for claims not directly related to the warranty on the Company’s products. Warranty costs are recorded in cost of sales. This reserve was $0.9 million and $1.4 million at December 31, 2019 and 2018, respectively. The Company seeks recovery from its vendors and third-party independent contractors of installation services for certain amounts paid.
Vendor allowances primarily consist of volume rebates that are earned as a result of attaining certain purchase levels and reimbursement for the cost of producing samples. Vendor allowances are accrued as earned, with those allowances received as a result of attaining certain purchase levels accrued over the incentive period based on estimates of purchases. Volume rebates earned are initially recorded as a reduction in merchandise inventories and a subsequent reduction in cost of sales when the related product is sold. Reimbursement received for the cost of producing samples is recorded as an offset against cost of sales.
Advertising Costs
Advertising costs charged to selling, general and administrative (“SG&A”) expenses, net of vendor allowances, were $75 million, $74 million and $77 million in 2019, 2018 and 2017, respectively. The Company uses various types of media to brand its name and advertise its products. Media production costs are generally expensed as incurred, except for direct mail, which is expensed when the finished piece enters the postal system. Media placement costs are generally expensed in the month the advertising occurs, except for contracted endorsements and sports agreements, which are generally expensed ratably over the contract period. Amounts paid in advance are included in prepaid expenses and totaled $0.4 million and $0.6 million at December 31, 2019 and 2018, respectively.
Store Opening Costs
Costs to open new store locations are charged to SG&A expenses as incurred, net of any vendor support.
Other Vendor Consideration
Consideration from non-merchandise vendors, including royalties and rebates, are generally recorded as an offset to SG&A expenses when earned.
Depreciation and Amortization
Property and equipment is carried at cost and depreciated on the straight-line method over the estimated useful lives. The estimated useful lives for leasehold improvements are the shorter of the estimated useful lives or the remainder of the lease terms. For leases with optional renewal periods for which renewal is not reasonably certain, the Company uses the original lease term, excluding optional renewal periods, to determine the appropriate estimated useful
56
lives. Capitalized software costs are capitalized from the time that technological feasibility is established until the software is ready for use. The estimated useful lives are generally as follows:
|
|
|
Years |
|
Buildings and Building Improvements |
|
7 to 40 |
|
Property and Equipment |
|
3 to 10 |
|
Computer Software and Hardware |
|
3 to 10 |
|
Leasehold Improvements |
|
1 to 10 |
Leases
In February 2016, the FASB issued Accounting Standards Update No. 2016-02 (“ASU 2016-02”), which created ASC Topic 842, Leases, and superseded the lease accounting requirements in Topic 840, Leases. In summary, Topic 842 requires organizations that lease assets to recognize on the balance sheet the assets and liabilities for the rights and obligations created by those leases. In August 2018, the FASB issued ASU 2018-11, Targeted Improvements to ASC 842, which included an option to not restate comparative periods in transition and elect to use the effective date of ASC 842 as the date of initial application of transition, which the Company elected. As a result of the adoption of ASC 842 on January 1, 2019, the Company recorded both operating lease right-of-use (“ROU”) assets of $113 million and lease liabilities of $121 million. The adoption of ASC 842 had an immaterial impact on the Company’s consolidated statements of operations and consolidated statements of cash flows for the year ended December 31, 2019. The Company elected the package of practical expedients permitted under the transition guidance within the new standard which, among other things, allowed the Company to carryforward the historical lease classification.
The Company determines if an arrangement is a lease at inception. Operating leases are included in operating lease ROU assets and operating lease liabilities on the consolidated balance sheet. The operating lease ROU assets and operating lease liabilities are recognized as the present value of the future minimum lease payments over the lease term at commencement date. As most of the leases do not provide an implicit rate, the Company used its incremental borrowing rate based on the information available at commencement date in determining the present value of future payments. The operating lease ROU asset also is adjusted for any lease payments made and excludes lease incentives and initial direct costs incurred. The Company’s lease terms may include options to extend or terminate the lease at certain dates, typically at the Company’s own discretion. The Company regularly evaluates the renewal options and when they are reasonably certain of exercise, the Company includes the renewal period in its lease term. Many of the Company’s leases include both lease (e.g., payments including rent, taxes, and insurance costs) and non-lease components (e.g., common-area or other maintenance costs) which are accounted for as a single lease component as the Company has elected the practical expedient to group lease and non-lease components for all leases. Lease expense for minimum lease payments is recognized on a straight-line basis over the term of the agreement.
The Company made an accounting policy election that payments under agreements with an initial term of 12 months or less will not be included on the consolidated balance sheet but will be recognized in the consolidated statements of operations on a straight-line basis over the term of the agreement.
Additional information and disclosures required by this new standard are contained in “Note 5, Leases.”
Stock-Based Compensation
The Company records compensation expense associated with stock options and other forms of equity compensation in accordance with ASC 718. The Company may issue incentive awards, including performance-based awards, in the form of stock options, restricted shares and other equity awards to employees, non-employee directors and other service providers. The Company recognizes expense for the majority of its stock-based compensation based on the fair value of the awards that are granted. For awards granted to non-employee directors, expense is recognized based on the fair value of the award at the end of a reporting period. For performance-based awards granted to certain members of senior management, the Company recognizes expense after assessing the probability of the achievement of certain financial metrics on a periodic basis. Compensation expense is recognized only for those awards expected to vest, with
57
forfeitures estimated at the date of grant based on historical experience and future expectations. Measured compensation cost is recognized ratably over the requisite service period of the entire related stock-based compensation award.
Foreign Currency Translation
The Company’s Canadian operations use the Canadian dollar as the functional currency. Assets and liabilities are translated at exchange rates in effect at the balance sheet date. Revenues and expenses are translated at the average monthly exchange rates during the year. Resulting translation adjustments are recorded as a component of accumulated other comprehensive income on the consolidated balance sheets.
Income Taxes
Income taxes are accounted for in accordance with ASC 740 (“ASC 740”). Income taxes are provided for under the asset and liability method and consider differences between the tax and financial accounting bases. The tax effects of these differences are reflected on the consolidated balance sheets as deferred income taxes and measured using the effective tax rate expected to be in effect when the differences reverse. ASC 740 also requires that deferred tax assets be reduced by a valuation allowance if it is more likely than not that some portion of the deferred tax asset will not be realized. In evaluating the need for a valuation allowance, the Company takes into account various factors, including the nature, frequency and severity of current and cumulative losses, expected level of future taxable income, the duration of statutory carryforward periods and tax planning alternatives. In future periods, any valuation allowance will be re-evaluated in accordance with ASC 740, and a change, if required, will be recorded through income tax expense in the period such determination is made.
The Company recognizes the tax benefit from an uncertain tax position only if it is more likely than not that the tax position will be sustained on examination by the relevant taxing authorities, based on the technical merits of its position. The tax benefits recognized in the financial statements from such a position are measured based on the largest benefit that has a greater than 50% likelihood of being realized upon ultimate settlement. The Company classifies interest and penalties related to income tax matters as a component of income tax expense.
Net Income per Common Share
Basic net income per common share is determined by dividing net income by the weighted average number of common shares outstanding during the year. Diluted net income per common share is determined by dividing net income by the weighted average number of common shares outstanding during the year, plus the dilutive effect of common stock equivalents, including stock options and restricted shares. Common stock and common stock equivalents included in the computation represent shares issuable upon assumed exercise of outstanding stock options and release of restricted shares, except when the effect of their inclusion would be antidilutive.
Recently Adopted Accounting Pronouncements
In August 2018, the FASB issued Accounting Standards Update No. 2018‑15 (“ASU 2018‑15”), which provides guidance on the accounting for costs of implementation activities performed in a cloud computing arrangement that is a service contract, as initially published in Accounting Standards Update No. 2015‑05, Intangibles—Goodwill and Other— Internal-Use Software: Customer’s Accounting for Fees Paid in a Cloud Computing Arrangement. In summary, the new standard requires customers of cloud computing services to recognize an intangible asset for the software license and, to the extent that payments attributable to the software license are made over time, a liability is also recognized. The new standard also allows customers of cloud computing services to capitalize certain implementation costs. The amendments in ASU 2018‑15 are effective for fiscal years, and interim periods within those fiscal years, beginning after December 15, 2019. The Company adopted the new standard as of the beginning of the fourth quarter of 2019. The adoption of this standard did not have a material impact on the Company’s results of operations or cash flows.
58
Note 2. Property and Equipment
Property and equipment consisted of:
|
|
|
December 31, |
||||
|
|
|
2019 |
|
2018 |
||
|
Land |
|
$ |
4,937 |
|
$ |
4,937 |
|
Building |
|
|
44,395 |
|
|
44,319 |
|
Property and Equipment |
|
|
57,047 |
|
|
53,411 |
|
Computer Software and Hardware |
|
|
51,437 |
|
|
54,375 |
|
Leasehold Improvement |
|
|
54,139 |
|
|
46,297 |
|
Assets under Construction |
|
|
1,549 |
|
|
767 |
|
|
|
|
213,504 |
|
|
204,106 |
|
Less: Accumulated Depreciation and Amortization |
|
|
114,771 |
|
|
110,417 |
|
Property and Equipment, net |
|
$ |
98,733 |
|
$ |
93,689 |
As of December 31, 2019 and 2018, the Company had cumulatively capitalized $42 million and $40 million of computer software costs, respectively. Amortization expense related to these assets was $4.6 million, $4.3 million and $3.9 million for 2019, 2018 and 2017, respectively.
Note 3. Other Liabilities
Other long-term liabilities consisted of:
|
|
|
December 31, |
||||
|
|
|
2019 |
|
2018 |
||
|
Antidumping and Countervailing Duties Accrual, Including Accrued Interest |
|
$ |
12,795 |
|
$ |
11,456 |
|
Deferred Rent |
|
|
— |
|
|
4,850 |
|
Lease Incentive Obligation |
|
|
— |
|
|
2,864 |
|
Other |
|
|
962 |
|
|
1,033 |
|
Other Long Term Liabilities |
|
$ |
13,757 |
|
$ |
20,203 |
Note 4. Credit Agreement
On March 29, 2019, the Company entered into a Fourth Amended and Restated Credit Agreement (the “Credit Agreement”) with Bank of America, N.A. and Wells Fargo Bank, National Association (the “Lenders”). The Credit Agreement amended and restated the Third Amended and Restated Revolving Credit Agreement (the “Prior Agreement”). Under the Credit Agreement, the Lenders increased the maximum amount of borrowings under the revolving credit facility (the “Revolving Credit Facility”) from $150 million under the Prior Agreement to $175 million and added a new first in-last out $25 million term loan (the “FILO Term Loan”) for a total of $200 million, subject to the borrowing bases described below. The Company also has the option to increase the Revolving Credit Facility to a maximum total amount of $225 million, subject to the satisfaction of the conditions to such increase as specified in the Credit Agreement.
As of December 31, 2019, a total of $57 million was outstanding under the Revolving Credit Facility and $25 million was outstanding under the FILO Term Loan. As of December 31, 2019, there was $102 million of availability under the Revolving Credit Facility. The Company also had $3.9 million in letters of credit which factor into its remaining availability.
The Revolving Credit Facility and the FILO Term Loan mature on March 29, 2024, and are secured by security interests in the Collateral (as defined in the Credit Agreement), which includes substantially all assets of the Company including, among other things, the Company’s inventory and accounts receivables, and the Company’s East Coast distribution center located in Sandston, Virginia. Under the terms of the Credit Agreement, the Company has the ability to release the East Coast distribution center from the Collateral under certain conditions.
59
The Revolving Credit Facility is available to the Company up to the lesser of (1) $175 million or (2) a revolving borrowing base equal to the sum of specified percentages of the Borrowers’ eligible credit card receivables, eligible inventory (including eligible in-transit inventory) and eligible owned real estate, less certain reserves, all of which are defined by the terms of the Credit Agreement (the “Revolving Borrowing Base”). If the outstanding FILO Term Loan exceeds the FILO Borrowing Base (as defined in the Credit Agreement), then the amount of such excess reduces availability under the Revolving Borrowing Base.
Loans outstanding under the Credit Agreement can bear interest based on the Base Rate (as defined in the Credit Agreement) or the LIBOR Rate (as defined in the Credit Agreement). Interest on Base Rate loans is charged at varying per annum rates computed by applying a margin ranging from (i) 0.25% to 0.75% over the Base Rate with respect to revolving loans and (ii) 1.25% to 2.00% over the Base Rate with respect to the FILO Term Loan, in each case depending on the Borrowers’ average daily excess borrowing availability under the Revolving Credit Facility during the most recently completed fiscal quarter. Interest on LIBOR Rate loans and fees for standby letters of credit are charged at varying per annum rates computed by applying a margin ranging from (i) 1.25% to 1.75% over the applicable LIBOR Rate with respect to revolving loans and (ii) 2.25% to 3.00% over the applicable LIBOR Rate with respect to the FILO Term Loan, in each case depending on the Company’s average daily excess borrowing availability under the Revolving Credit Facility during the most recently completed fiscal quarter. At December 31, 2019, the Company’s Revolving Credit Facility carried an average interest rate of 3.90% and the FILO Term Loan carried an interest rate of 4.75%.
The Credit Agreement contains a fixed charge coverage ratio covenant that becomes effective only when specified availability under the Revolving Credit Facility falls below the greater of $17.5 million or 10% of the Combined Loan Cap (as defined in the Credit Agreement).
Note 5. Leases
The Company has operating leases for its stores, corporate headquarters in Richmond, Virginia, its distribution center on the west coast, supplemental office facilities and certain equipment. The store location leases generally have five-year base periods with one or more five-year renewal periods. The corporate headquarters in Richmond, Virginia has base terms running through December 31, 2029. The supplemental office facility in Richmond, Virginia has base terms running through November 30, 2020. The distribution center on the west coast has base terms running through October 31, 2024. Total rent expense was $37 million, $34 million and $33 million in 2019, 2018 and 2017, respectively.
The cost components of the Company’s operating leases recorded in SG&A on the consolidated statement of operations were as follows for the periods shown:
|
|
Year Ended December 31, 2019 |
|||||||
|
|
Store Leases |
|
Other Leases |
|
Total |
|||
|
|
|
|
|
|
|
|
|
|
|
Operating lease costs |
$ |
32,759 |
|
$ |
4,078 |
|
$ |
36,837 |
|
Variable lease costs |
|
8,381 |
|
|
1,007 |
|
|
9,388 |
|
Total |
$ |
41,140 |
|
$ |
5,085 |
|
$ |
46,225 |
Variable lease costs consist primarily of taxes, insurance, and common area or other maintenance costs for our leased facilities, which are paid as incurred.
60
Other information related to leases were as follows:
|
|
Year Ended December 31, 2019 |
|
|||||||
|
|
Store Leases |
|
Other Leases |
|
Total |
|
|||
|
|
|
|
|
|
|
|
|
|
|
|
Supplemental Cash Flows Information |
|
|
|
|
|
|
|
|
|
|
Cash paid for amounts included in the measurement of lease liabilities: |
|
|
|
|
|
|
|
|
|
|
Operating cash flows from operating leases |
$ |
33,590 |
|
$ |
4,252 |
|
$ |
37,842 |
|
|
|
|
|
|
|
|
|
|
|
|
|
Right-of-use assets obtained or modified in exchange for operating lease obligations |
$ |
25,745 |
|
$ |
9,828 |
|
$ |
35,573 |
|
|
|
|
|
|
|
|
|
|
|
|
|
Weighted Average Remaining Lease Term (years) |
|
4.81 |
|
|
7.60 |
|
|
5.28 |
|
|
|
|
|
|
|
|
|
|
|
|
|
Weighted Average Discount Rate |
|
5.8 |
% |
|
5.5 |
% |
|
5.7 |
% |
At December 31, 2019, the future minimum rental payments under non-cancellable operating leases were as follows:
|
|
|
Operating Leases |
|||||||
|
|
|
|
|
|
|
|
Total |
||
|
|
|
|
|
|
Other |
|
Operating |
||
|
|
|
Store Leases |
|
Leases |
|
Leases |
|||
|
2020 |
|
$ |
33,752 |
|
|
4,103 |
|
$ |
37,855 |
|
2021 |
|
|
28,460 |
|
|
3,663 |
|
|
32,123 |
|
2022 |
|
|
22,508 |
|
|
3,656 |
|
|
26,164 |
|
2023 |
|
|
16,554 |
|
|
3,733 |
|
|
20,287 |
|
2024 |
|
|
9,853 |
|
|
3,593 |
|
|
13,446 |
|
Thereafter |
|
|
14,443 |
|
|
8,240 |
|
|
22,683 |
|
Total minimum lease payments |
|
|
125,570 |
|
|
26,988 |
|
|
152,558 |
|
Less imputed interest |
|
|
(15,900) |
|
|
(4,855) |
|
|
(20,755) |
|
Total |
|
$ |
109,670 |
|
$ |
22,133 |
|
$ |
131,803 |
Note 6. Stockholders’ Equity
Net Income per Common Share
The following table sets forth the computation of basic and diluted net income per common share:
|
|
|
|
|
|
|
|
|
|
|
|
|
|
Year Ended December 31, |
|||||||
|
|
|
2019 |
|
2018 |
|
2017 |
|||
|
Net Income (Loss) |
|
$ |
9,663 |
|
$ |
(54,379) |
|
$ |
(37,823) |
|
Weighted Average Common Shares Outstanding—Basic |
|
|
28,689 |
|
|
28,571 |
|
|
28,407 |
|
Effect of Dilutive Securities: |
|
|
|
|
|
|
|
|
|
|
Common Stock Equivalents |
|
|
104 |
|
|
— |
|
|
— |
|
Weighted Average Common Shares Outstanding—Diluted |
|
|
28,793 |
|
|
28,571 |
|
|
28,407 |
|
Net Income (Loss) per Common Share—Basic |
|
$ |
0.34 |
|
$ |
(1.90) |
|
$ |
(1.33) |
|
Net Income (Loss) per Common Share—Diluted |
|
$ |
0.34 |
|
$ |
(1.90) |
|
$ |
(1.33) |
61
The following have been excluded from the computation of Weighted Average Common Shares Outstanding—Diluted because the effect would be antidilutive:
|
|
|
|
|
|
|
|
|
|
|
As of December 31, |
||||
|
|
|
2019 |
|
2018 |
|
2017 |
|
Stock Options |
|
604 |
|
643 |
|
653 |
|
Restricted Shares |
|
187 |
|
407 |
|
433 |
Stock Repurchase Program
The Company’s board of directors has authorized the repurchase of up to $150 million of the Company’s common stock. At December 31, 2019, the Company had approximately $14.7 million remaining under this authorization. The Company did not purchase any shares under this program during the three-years ended December 31, 2019.
Note 7. Stock-Based Compensation
Overview
The Company has an equity incentive plan (the “Plan”) for employees, non-employee directors and other service providers from which the Company may grant stock options, restricted shares, stock appreciation rights (“SARs”) and other equity awards. The total number of shares of common stock authorized for issuance under the Plan is 7.8 million. As of December 31, 2019, 2.5 million shares of common stock were available for future grants. Stock options granted under the Plan expire no later than ten years from the date of grant and the exercise price shall not be less than the fair market value of the shares on the date of grant. Vesting periods are assigned to stock options and restricted shares on a grant-by-grant basis at the discretion of the Board. The Company issues new shares of common stock upon exercise of stock options and vesting of restricted shares.
The Company also maintains the Lumber Liquidators Holdings, Inc. Outside Directors Deferral Plan under which each of the Company’s non-employee directors has the opportunity to elect annually to defer certain fees until departure from the Board. A non-employee director may elect to defer up to 100% of his or her fees and have such fees invested in deferred stock units. Deferred stock units must be settled in common stock upon the director’s departure from the Board. There were 158,283 and 132,348 deferred stock units outstanding at December 31, 2019 and 2018, respectively.
62
Stock Options
The following table summarizes activity related to stock options:
|
|
|
|
|
|
|
|
Remaining |
|
|
|
|
|
|
|
|
Weighted |
|
Average |
|
Aggregate |
||
|
|
|
|
|
Average |
|
Contractual |
|
Intrinsic |
||
|
|
|
Shares |
|
Exercise Price |
|
Term (Years) |
|
Value |
||
|
Balance, December 31, 2016 |
|
835,614 |
|
$ |
24.86 |
|
7.5 |
|
$ |
1,167 |
|
Granted |
|
127,984 |
|
|
22.09 |
|
|
|
|
|
|
Exercised |
|
(87,955) |
|
|
15.31 |
|
|
|
|
|
|
Forfeited |
|
(185,975) |
|
|
25.62 |
|
|
|
|
|
|
Balance, December 31, 2017 |
|
689,668 |
|
$ |
25.31 |
|
7.7 |
|
$ |
8,530 |
|
Granted |
|
215,297 |
|
|
20.54 |
|
|
|
|
|
|
Exercised |
|
(43,510) |
|
|
17.70 |
|
|
|
|
|
|
Forfeited |
|
(128,870) |
|
|
33.25 |
|
|
|
|
|
|
Balance, December 31, 2018 |
|
732,585 |
|
$ |
22.97 |
|
7.3 |
|
$ |
— |
|
Granted |
|
110,535 |
|
|
8.47 |
|
|
|
|
|
|
Forfeited |
|
(149,657) |
|
|
25.16 |
|
|
|
|
|
|
Balance, December 31, 2019 |
|
693,463 |
|
$ |
20.18 |
|
7.1 |
|
$ |
144 |
|
|
|
|
|
|
|
|
|
|
|
|
|
Exercisable at December 31, 2019 |
|
361,974 |
|
$ |
24.43 |
|
|
|
$ |
— |
|
Vested and expected to vest December 31, 2019 |
|
693,463 |
|
$ |
20.18 |
|
|
|
$ |
144 |
The aggregate intrinsic value is the difference between the exercise price and the closing price of the Company’s common stock on December 31. There were no stock options exercised during 2019. The intrinsic value of stock options exercised during 2018 and 2017 was $0.3 million and $0.8 million, respectively.
As of December 31, 2019, total unrecognized compensation cost related to unvested options was approximately $1.5 million, net of estimated forfeitures, which is expected to be recognized over a weighted average period of approximately 2.2 years.
The fair value of each stock option award is estimated by management on the date of the grant using the Black-Scholes-Merton option pricing model. The weighted average fair value of options granted during 2019, 2018 and 2017 was $4.32, $10.69 and $11.20, respectively.
The following are the average assumptions for the periods noted:
|
|
|
|
|
|
|
|
|
|
|
|
Year Ended December 31, |
|
||||
|
|
|
2019 |
|
2018 |
|
2017 |
|
|
Expected dividend rate |
|
— |
% |
— |
% |
— |
% |
|
Expected stock price volatility |
|
55 |
% |
55 |
% |
55 |
% |
|
Risk-free interest rate |
|
2.1 |
% |
2.8 |
% |
1.7 |
% |
|
Expected term of options |
|
5.5 |
years |
5.5 |
years |
5.5 |
years |
The expected stock price volatility is based on the historical volatility of the Company’s stock price. The volatilities are estimated for a period of time equal to the expected term of the related option. The risk-free interest rate is based on the implied yield of U.S. Treasury zero-coupon issues with an equivalent remaining term. The expected term of the options represents the estimated period of time until exercise and is determined by considering the contractual terms, vesting schedule and expectations of future employee behavior.
63
Restricted Shares
The following table summarizes activity related to restricted shares:
|
|
|
|
|
Weighted Average |
|
|
|
|
|
|
Grant Date Fair |
|
|
|
|
Shares |
|
Value |
|
|
Nonvested, December 31, 2016 |
|
586,187 |
|
$ |
17.71 |
|
Granted |
|
207,196 |
|
|
19.56 |
|
Released |
|
(205,349) |
|
|
18.31 |
|
Forfeited |
|
(108,288) |
|
|
15.68 |
|
Nonvested, December 31, 2017 |
|
479,746 |
|
$ |
18.71 |
|
Granted |
|
224,835 |
|
|
22.39 |
|
Released |
|
(137,064) |
|
|
18.67 |
|
Forfeited |
|
(80,305) |
|
|
17.98 |
|
Nonvested, December 31, 2018 |
|
487,212 |
|
$ |
20.54 |
|
Granted |
|
661,784 |
|
|
10.35 |
|
Released |
|
(130,721) |
|
|
11.09 |
|
Forfeited |
|
(107,309) |
|
|
14.71 |
|
Nonvested, December 31, 2019 |
|
910,966 |
|
$ |
15.18 |
The fair value of restricted shares released during 2019, 2018 and 2017 was $1.5 million, $2.9 million and $5.2 million, respectively. As of December 31, 2019, total unrecognized compensation cost related to unvested restricted shares was approximately $5.1 million, net of estimated forfeitures, which is expected to be recognized over a weighted average period of approximately 2.4 years.
During 2019, the Company granted 100,281 shares of performance-based restricted stock awards, vesting over a three-year period, with a grant date fair value of approximately $1.1 million. These shares were awarded to certain members of senior management in connection with the achievement of specific key financial metrics measured over a two-year period and vest over a three-year period. The number of awards that will ultimately vest is contingent upon the achievement of these key financial metrics by the end of year two. The Company assesses the probability of achieving these metrics on a quarterly basis. For these awards, the Company recognizes the fair value expense ratably over the performance and vesting period. Once these amounts have been determined, half of the shares will vest at the end of year two and the remaining half will vest at the end of year three. These awards are included above in RSAs Granted.
64
Stock Appreciation Rights
The following table summarizes activity related to SARs:
|
|
|
|
|
|
|
|
Remaining |
|
|
|
|
|
|
|
|
Weighted |
|
Average |
|
Aggregate |
||
|
|
|
|
|
Average |
|
Contractual |
|
Intrinsic |
||
|
|
|
Shares |
|
Exercise Price |
|
Term (Years) |
|
Value |
||
|
Balance, December 31, 2016 |
|
28,668 |
|
$ |
32.63 |
|
7.5 |
|
$ |
6 |
|
Granted |
|
2,899 |
|
|
17.39 |
|
|
|
|
|
|
Exercised |
|
(165) |
|
|
24.35 |
|
|
|
|
|
|
Forfeited |
|
(14,852) |
|
|
45.93 |
|
|
|
|
|
|
Balance, December 31, 2017 |
|
16,550 |
|
$ |
18.10 |
|
8.6 |
|
$ |
251 |
|
Granted |
|
1,738 |
|
|
23.31 |
|
|
|
|
|
|
Exercised |
|
— |
|
|
— |
|
|
|
|
|
|
Forfeited |
|
(335) |
|
|
86.16 |
|
|
|
|
|
|
Balance, December 31, 2018 |
|
17,953 |
|
$ |
17.33 |
|
7.8 |
|
$ |
— |
|
Granted |
|
— |
|
|
— |
|
|
|
|
|
|
Exercised |
|
— |
|
|
— |
|
|
|
|
|
|
Forfeited |
|
(17,708) |
|
|
16.44 |
|
|
|
|
|
|
Balance, December 31, 2019 |
|
245 |
|
$ |
82.08 |
|
3.4 |
|
$ |
— |
|
|
|
|
|
|
|
|
|
|
|
|
|
Exercisable at December 31, 2019 |
|
245 |
|
$ |
82.08 |
|
3.4 |
|
$ |
— |
The fair value method, estimated by management using the Black-Scholes-Merton option pricing model, is used to recognize compensation cost associated with SARs.
Note 8. Income Taxes
The components of income (loss) before income taxes were as follows:
|
|
|
Year Ended December 31, |
|||||||
|
|
|
2019 |
|
2018 |
|
2017 |
|||
|
United States |
|
$ |
13,830 |
|
$ |
(52,473) |
|
$ |
(38,258) |
|
Foreign |
|
|
(878) |
|
|
(927) |
|
|
(299) |
|
Total Income (Loss) before Income Taxes |
|
$ |
12,952 |
|
$ |
(53,400) |
|
$ |
(38,557) |
The expense (benefit) for income taxes consisted of the following:
|
|
|
Year Ended December 31, |
|||||||
|
|
|
2019 |
|
2018 |
|
2017 |
|||
|
Current |
|
|
|
|
|
|
|
|
|
|
Federal |
|
$ |
2,550 |
|
$ |
— |
|
$ |
2,254 |
|
State |
|
|
1,015 |
|
|
607 |
|
|
146 |
|
Foreign |
|
|
90 |
|
|
132 |
|
|
112 |
|
Total Current |
|
|
3,655 |
|
|
739 |
|
|
2,512 |
|
|
|
|
|
|
|
|
|
|
|
|
Deferred |
|
|
|
|
|
|
|
|
|
|
Federal |
|
|
(203) |
|
|
140 |
|
|
(2,087) |
|
State |
|
|
(163) |
|
|
100 |
|
|
(1,159) |
|
Total Deferred |
|
|
(366) |
|
|
240 |
|
|
(3,246) |
|
Income Tax Expense (Benefit) |
|
$ |
3,289 |
|
$ |
979 |
|
$ |
(734) |
65
Tax expense in the amount of $0.5 million and $0.2 million was recognized as a component of income tax expense during 2019 and 2018, respectively, resulting from the exercise of stock options and the release of restricted shares. Prior to the adoption of Accounting Standards Update No. 2016-09, which amends ASC Topic 718, Compensation – Stock Compensation, in 2017, excess tax benefits and shortfalls were recognized as adjustments to additional paid-in capital.
|
|
Year Ended December 31, |
|
|||||||||||||
|
|
2019 |
|
2018 |
|
2017 |
|
|||||||||
|
Income Tax Expense (Benefit) at Federal Statutory Rate |
$ |
2,720 |
|
21.0 |
% |
$ |
(11,214) |
|
21.0 |
% |
$ |
(13,495) |
|
35.0 |
% |
|
|
|
|
|
|
|
|
|
|
|
|
|
|
|
|
|
|
Increases (Decreases): |
|
|
|
|
|
|
|
|
|
|
|
|
|
|
|
|
State Income Taxes, Net of Federal Income Tax Benefit |
|
425 |
|
3.3 |
% |
|
723 |
|
(1.3) |
% |
|
(740) |
|
1.9 |
% |
|
Valuation Allowance |
|
668 |
|
5.2 |
% |
|
3,897 |
|
(7.3) |
% |
|
3,826 |
|
(10.0) |
% |
|
Foreign Operations |
|
90 |
|
0.7 |
% |
|
132 |
|
(0.3) |
% |
|
221 |
|
(0.5) |
% |
|
Uncertain Tax Positions |
|
174 |
|
1.3 |
% |
|
2,919 |
|
(5.5) |
% |
|
— |
|
— |
% |
|
Non-Deductible Fines and Penalties |
|
6 |
|
— |
% |
|
4,011 |
|
(7.5) |
% |
|
1,156 |
|
(3.0) |
% |
|
Federal Rate Change |
|
— |
|
— |
% |
|
— |
|
— |
% |
|
8,088 |
|
(21.0) |
% |
|
Other |
|
(794) |
|
(6.1) |
% |
|
511 |
|
(0.9) |
% |
|
210 |
|
(0.5) |
% |
|
Income Tax Expense (Benefit) |
$ |
3,289 |
|
25.4 |
% |
$ |
979 |
|
(1.8) |
% |
$ |
(734) |
|
1.9 |
% |
The tax effects of temporary differences that result in significant portions of the deferred tax accounts based on a 21% federal rate in both 2019 and 2018, are as follows:
|
|
|
December 31, |
||||
|
|
|
2019 |
|
2018 |
||
|
Deferred Tax Liabilities: |
|
|
|
|
|
|
|
Operating Lease Right-of-Use Assets |
|
$ |
(31,804) |
|
$ |
— |
|
Depreciation and Amortization and Other |
|
|
(9,676) |
|
|
(10,672) |
|
Total Gross Deferred Tax Liabilities |
|
|
(41,480) |
|
|
(10,672) |
|
|
|
|
|
|
|
|
|
Deferred Tax Assets: |
|
|
|
|
|
|
|
Operating Lease Liabilities |
|
|
34,419 |
|
|
— |
|
Stock-Based Compensation Expense |
|
|
2,611 |
|
|
2,348 |
|
Legal Settlement Reserves |
|
|
11,774 |
|
|
14,251 |
|
Other Accruals and Reserves |
|
|
5,054 |
|
|
4,811 |
|
Employee Benefits |
|
|
1,169 |
|
|
1,018 |
|
Inventory Reserves |
|
|
1,311 |
|
|
1,896 |
|
Inventory Capitalization |
|
|
3,194 |
|
|
3,492 |
|
Foreign Net Operating Loss Carryforwards |
|
|
3,341 |
|
|
3,153 |
|
Net Operating Loss Carryforwards |
|
|
2,444 |
|
|
2,445 |
|
Capital Loss Carryforwards and Other |
|
|
2,724 |
|
|
2,784 |
|
Total Gross Deferred Tax Assets |
|
|
68,041 |
|
|
36,198 |
|
Less: Valuation Allowance |
|
|
(26,986) |
|
|
(26,318) |
|
Total Net Deferred Tax Assets |
|
|
41,055 |
|
|
9,880 |
|
Net Deferred Tax Liability |
|
$ |
(425) |
|
$ |
(792) |
The Tax Cuts and Jobs Act (the “Tax Act”) was enacted in the fourth quarter of 2017. Generally, the Tax Act became effective in 2018, and it altered the deductibility of certain items (e.g., certain compensation, interest, entertainment expenses), and allowed qualifying capital expenditures to be deducted fully in the year of purchase. As of December 31, 2018, the Company completed the analysis of the tax effects of the Tax Act based on guidance issued to-date and has reflected all applicable changes in its financial statements.
66
The Company continues to monitor developments by federal and state rulemaking authorities regarding tax law changes and recognizes the impact of these law changes in the period in which they are enacted.
For 2019 and 2018, the Company’s U.S. operations were in a cumulative loss position. As such, the Company has recorded a valuation allowance on its net deferred tax assets. The valuation allowance increased by $1.1 million and $4.7 million for the years ended December 31, 2019 and 2018, respectively. In future periods, the allowance could be reduced if sufficient evidence exists indicating that it is more likely than not that a portion or all of these deferred tax assets will be realized.
For 2019 and 2018, the Company’s Canadian operations were in a cumulative loss position. As such, the Company has recorded a full valuation allowance on the net deferred tax assets in Canada. The valuation allowance decreased by $0.4 million and increased by $0.2 million for the years ended December 31, 2019 and 2018, respectively. In future periods, the allowance could be reduced if sufficient evidence exists indicating that it is more likely than not that a portion or all of these deferred tax assets will be realized.
As of December 31, 2019, a full valuation allowance has been provided against certain deferred tax assets as it is presently deemed more likely than not that the benefit of such net tax assets will not be utilized. Due to recent cumulative losses, the Company did not rely upon projections of future taxable income in assessing the recoverability of deferred tax assets. In future periods, a reduction in the valuation allowance could result in a significant decrease in income tax expense in the period that the release is recorded. However, the exact timing and amount of any reduction in our valuation allowance are unknown at this time and will be subject to the earnings level we achieve in future periods.
As of December 31, 2019, the Company had no remaining U.S. federal net operating loss carryforward. As of December 31, 2018, the Company had a U.S. federal net operating loss carryforward of $12 million. As of December 31, 2019 and 2018, respectively, the Company had state net loss carryforwards of $39 million and $52 million, which begin to expire in 2022. The Company had foreign net operating loss carryforwards of $12 million at December 31, 2019 and 2018, which begin to expire in 2030.
The Company paid income taxes (net of refunds) of $0.2 million in 2019. The Company received income tax refunds (net of payments) of $0.1 million and $29 million in 2018 and 2017, respectively.
As of December 31, 2019 and 2018, the Company had $0.2 million and $3.6 million, respectively of gross unrecognized tax benefits related to Uncertain Tax Positions ($0.2 million and $3.5 million, respectively, net of federal tax benefit). It is reasonably possible that the amount of the unrecognized tax benefit with respect to certain of the uncertain tax positions will increase or decrease during the next 12 months; however, the Company does not expect the change in uncertain tax positions to have a significant effect on its results of operations, financial position or cash flows.
A reconciliation of the beginning and ending amount of gross unrecognized tax benefits, excluding interest and penalties, is as follows:
|
|
Year Ended December 31, |
|||||
|
|
2019 |
2018 |
||||
|
Balance at beginning of year |
$ |
3,610 |
|
$ |
27 |
|
|
Increases for tax positions related to current year |
|
174 |
|
|
3,583 |
|
|
(Decreases) Increases for tax positions related to prior years |
|
(3,443) |
|
|
— |
|
|
Settlements |
|
(116) |
|
|
— |
|
|
Balance at end of year |
$ |
225 |
|
$ |
3,610 |
|
Included in the additions of unrecognized tax benefits in the fiscal year ended December 31, 2019, is approximately $0.2 million for an uncertain tax position related to state income taxes.
The Company files income tax returns with the U.S. federal government and various state and foreign jurisdictions. In the normal course of business, the Company is subject to examination by taxing authorities. As of
67
December 31, 2019, the Internal Revenue Service has completed audits of the Company’s income tax returns through 2016.
Note 9. 401(k) Plan
The Company maintains a plan, qualified under Section 401(k) of the Internal Revenue Code, for all eligible employees. Employees are eligible to participate following the completion of three months of service and attainment of age 21. The plan is a safe harbor plan, with company matching contributions of 100% of the first 3% of employee contributions and 50% of the next 2% of employee contributions. Both deferrals and Roth contributions are allowed up to 50% of an employee’s eligible compensation, subject to annual IRS limits. Additionally, employees are immediately 100% vested in the Company’s matching contributions. The Company’s matching contributions, included in SG&A expenses, totaled $2.8 million, $2.6 million and $2.3 million in 2019, 2018 and 2017, respectively.
Note 10. Commitments and Contingencies
The Company has been actively resolving various legal and other matters that have arisen in recent years. Certain other matters remain outstanding. More detailed discussion of many of the matters noted below are included in this Form 10‑K under the caption “Item 3 Legal Proceedings.”
2019, 2018 and 2017 Settlements and Resolutions
During 2019, 2018 and 2017, the Company recorded accruals in accordance with GAAP related to several legal matters. These include:
|
2019 |
2018 |
2017 |
|
Employee Classification Litigation |
Governmental Investigations |
Formaldehyde-Abrasion MDLs |
|
|
Litigation Related to Bamboo |
|
|
|
|
|
|
|
|
|
Governmental Investigations: DOJ Deferred Prosecution Agreement and SEC Resolution
Beginning in 2015, the Company received subpoenas in connection with a criminal investigation conducted by the DOJ and the SEC. The focus of the investigations related to compliance with disclosure and financial reporting and requirements under the federal securities laws. The Company cooperated with the investigations and produced documents and other information responsive to subpoenas and other requests. In March of 2019, prior to filing its December 31, 2018 Form 10-K, the Company reached an agreement with the U.S. Attorney, the DOJ and SEC regarding the investigation (the “Settlement Agreements”). The Company entered into a Deferred Prosecution Agreement (“DPA”) with the U.S. Attorney and the DOJ and a Cease-and-Desist Order (the “Order”) with the SEC, under which, among other things, the Company (1) paid a fine in the amount of $19.1 million to the United States Treasury, (2) forfeited to the U.S. Attorney and the DOJ the sum of $13.9 million, of which up to $6.1 million was submitted by the Company to the SEC in disgorgement and prejudgment interest under the Order and (3) is required to adopt a new compliance program, or modify its existing one, including internal controls, compliance policies, and procedures in order to ensure that the Company maintains an effective system of internal account controls designed to ensure the making and keeping of fair and accurate books, records and accounts, as well as a compliance program designed to prevent and detect violations of certain federal securities laws throughout its operations.
The Settlement Agreements also provide that the Company will continue to cooperate with the U.S. Attorney, the DOJ and the SEC in all matters relating to the conduct described in the Settlement Agreements and, at the request of the U.S. Attorney, the DOJ or the SEC, the Company will cooperate fully with other domestic or foreign law enforcement authorities and agencies in any investigation of the Company in any and all matters relating to the Settlement Agreements. In the event the Company breaches the DPA, there is a risk the government would seek to impose remedies provided for in the DPA, including instituting criminal prosecution against the Company.
68
The Company accrued a charge of $33 million within selling, general and administrative (SG&A) expenses in its December 31, 2018 financial statements, reflecting the amounts owed under the Settlement Agreements. During the second quarter of 2019, the Company remitted $33 million due to the applicable governmental parties and relieved the applicable portion of the liability in the caption “Accrual for Legal Matters and Settlements Current” on its balance sheet.
Litigation Relating to Bamboo Flooring
In 2014, Dana Gold (“Gold”) filed a purported class action lawsuit alleging that certain bamboo flooring that the Company sells (the “Strand Bamboo Product”) is defective (the “Gold Litigation”). The plaintiffs sought financial damages and, in addition to attorneys’ fees and costs, the plaintiffs wanted a declaration that the Company’s actions violated the law.
On September 30, 2019, the parties finalized a settlement agreement that is consistent with the terms of the Memorandum of Understanding previously disclosed by the Company, which would resolve the Gold Litigation on a nationwide basis. Under the terms of the settlement agreement, the Company will contribute $14 million in cash (the “Gold Cash Payment”) and provide $14 million in store-credit vouchers, with a potential additional $2 million in store-credit vouchers based on obtaining a claim’s percentage of more than 7%, for an aggregate settlement of up to $30 million. The settlement agreement makes clear that the settlement does not constitute or include an admission by the Company of any fault or liability and the Company does not admit any fault, wrongdoing or liability. On December 18, 2019, the court issued an order that, among other things, granted preliminary approval of the settlement agreement. Following the preliminary approval, and pursuant to the terms of the settlement agreement, in December 2019, the Company paid $1 million for settlement of administrative costs, which is part of the Gold Cash Payment, to the plaintiff’s settlement escrow account. A Final Approval and Settlement Hearing is currently scheduled for September 24, 2020. The settlement agreement is subject to certain contingencies, including court approval. There can be no assurance that a settlement will be finalized and approved by the court at the Final Approval and Settlement Hearing or as to the ultimate outcome of the litigation. If a final, court approved settlement is not reached, the Company will defend the matter vigorously and believes there are meritorious defenses and legal standards that must be met for, among other things, success on the merits. The Company has notified its insurance carriers and continues to pursue coverage, but the insurers to date have denied coverage. As the insurance claim is still pending, the Company has not recognized any insurance recovery related to the Gold Litigation.
The Company recognized a charge to earnings of $28 million within selling, general and administrative expense during the fourth quarter of 2018 as its loss became probable and estimable with the offset in the caption “Accrual for Legal Matters and Settlements Current” on its consolidated balance sheet related to this settlement as of December 31, 2018. If the settlement agreement is not approved by the court or the Company incurs additional losses with respect to the Bamboo Flooring Litigation (as defined below), the actual losses that may result from these actions may exceed this amount. Any such losses could, potentially, have a material adverse effect, individually or collectively, on the Company’s results of operations, financial condition and liquidity.
In addition, there are a number of individual claims and lawsuits alleging damages involving Strand Bamboo Product (the “Bamboo Flooring Litigation”). While the Company believes that a loss associated with the Bamboo Flooring Litigation is reasonably possible, the Company is unable to reasonably estimate the amount or range of possible loss. Any such losses could, potentially, have a material adverse effect, individually or collectively, on the Company’s results of operations, financial condition and liquidity. The Company disputes the claims in the Bamboo Flooring Litigation and intends to defend such matters vigorously.
69
Litigation Relating to Chinese Laminates
Formaldehyde-Abrasion MDLs
On March 15, 2018, the Company entered into a settlement agreement with the lead plaintiffs in the Formaldehyde MDL (as defined in Item 3 of this Form 10-K) and Abrasion MDL (as defined in Item 3 of this Form 10-K), cases more fully described in Item 3 of this Annual Report on Form 10-K. Under the terms of the settlement agreement, the Company agreed to fund $22 million in cash and provide $14 million in store-credit vouchers for an aggregate settlement of $36 million to settle claims brought on behalf of purchasers of Chinese-made laminate flooring sold by the Company between January 1, 2009 and May 31, 2015. The Company deposited $22 million into an escrow account administered by the court and plaintiffs’ counsel in accordance with the final settlement. The final approval order by the United States District Court for the Eastern District of Virginia has been appealed and is pending. The Company does not anticipate any change to its obligations, but must wait until the appeals are adjudicated or withdrawn. If the appeals were to result in the settlement being set aside, the Company would receive $21.5 million back from the escrow agent. Accordingly, the Company has accounted for the payment of $21.5 million as a deposit in the accompanying consolidated financial statements. While insurance carriers initially denied coverage with respect to the Formaldehyde MDL and Abrasion MDL, the Company continues to pursue recoveries that the Company believes are appropriate. The $36 million aggregate settlement amount was accrued within SG&A expenses in 2017.
For approximately three years after a final ruling has been reached in this matter, plaintiffs will be able to redeem vouchers for product. Some of the states have alternative expiration dates while others have an indefinite amount of time to redeem vouchers. The Company will account for the sales of these products by relieving the relevant liability, reducing inventory used in the transaction and offsetting SG&A expenses for any profit. The Company does not know the timing or pace of voucher redemption.
In addition to those purchasers who opted out of the above settlement (the “Opt Outs”), there are a number of individual claims and lawsuits alleging personal injuries, breach of warranty claims, or violation of state consumer protection statutes that remain pending (collectively, the “Related Laminate Matters”). Certain of these Related Laminate Matters were settled in 2019 and 2018, while some remain in settlement negotiations. The Company recognized charges to earnings of $1.8 million and $3 million for the years ended December 31, 2019 and 2018, respectively, within SG&A expenses for these Remaining Laminate Matters. As of December 31, 2019, the remaining accrual related to these matters is $0.1 million, which has been included in the Accrual for Legal Settlements on the Consolidated Balance Sheet. While the Company believes that a further loss associated with the Opt Outs and Related Laminate Matters is reasonably possible, the Company is unable to reasonably estimate the amount or range of possible loss beyond what has been provided. If the Company incurs losses with the respect to the Opt Outs or further losses with respect to Related Laminate Matters, the ultimate resolution of these actions could have a material adverse effect on the Company’s results of operations, financial condition, and liquidity.
Canadian Litigation
On or about April 1, 2015, Sarah Steele (“Steele”) filed a purported class action lawsuit in the Ontario, Canada Superior Court of Justice against the Company. In the complaint, Steele’s allegations include strict liability, breach of implied warranty of fitness for a particular purpose, breach of implied warranty of merchantability, fraud by concealment, civil negligence, negligent misrepresentation and breach of implied covenant of good faith and fair dealing relating to the Company’s Chinese-manufactured laminate flooring products. Steele did not quantify any alleged damages in her complaint, but seeks compensatory damages, punitive, exemplary and aggravated damages, statutory remedies, attorneys’ fees and costs. While the Company believes that a further loss associated with the Steele litigation is possible, the Company is unable to reasonably estimate the amount or range of possible loss.
Lacey Act Related Matters
On October 7, 2015, the Company reached a settlement with the Department of Justice (DOJ) with respect to its allegations of violations of the Lacey Act in its importation of certain wood flooring products and the court entered final judgment on February 3, 2016. In connection with this settlement the Company agreed to pay a total of $10 million in
70
fines, community service payments and forfeited proceeds and is subject to a five-year probation period and implemented the Lacey Compliance Plan. The Company has paid the settlement amount including the remaining $1.8 million in the first quarter of 2018. In addition, the Company reached a settlement with the DOJ and paid $3.2 million with respect to certain engineered hardwood flooring determined by the Company to have Lacey Act compliance concerns.
Employment Cases
Mason Lawsuit
In August 2017, Ashleigh Mason, Dan Morse, Ryan Carroll and Osagie Ehigie filed a purported class action lawsuit in the United States District Court for the Eastern District of New York on behalf of all current and former store managers, store managers in training, installation sales managers and similarly situated current and former employees (collectively, the “Mason Putative Class Employees”) alleging that the Company violated the Fair Labor Standards Act (“FLSA”) and New York Labor Law (“NYLL”) by classifying the Mason Putative Class Employees as exempt. The alleged violations include failure to pay for overtime work. The plaintiffs sought certification of the Mason Putative Class Employees for (i) a collective action covering the period beginning three years prior to the filing of the complaint (plus a tolling period) through the disposition of this action for the Mason Putative Class Employees nationwide in connection with FLSA and (ii) a class action covering the period beginning six years prior to the filing of the complaint (plus a tolling period) through the disposition of this action for members of the Mason Putative Class Employees who currently are or were employed in New York in connection with NYLL. The plaintiffs did not quantify any alleged damages but, in addition to attorneys’ fees and costs, the plaintiffs seek class certification, unspecified amounts for unpaid wages and overtime wages, liquidated and/or punitive damages, declaratory relief, restitution, statutory penalties, injunctive relief and other damages.
In November 2018, the plaintiffs filed a motion requesting conditional certification for all store managers and store managers in training who worked within the federal statute of limitations period. In May 2019, the magistrate judge granted the plaintiffs’ motion for conditional certification. The litigation is in the discovery stage, which currently closes in May 2020.
The Company disputes the Mason Putative Class Employees’ claims and intends to defend the matter vigorously. Given the uncertainty of litigation, the preliminary stage of the case and the legal standards that must be met for, among other things, class certification and success on the merits, the Company cannot estimate the reasonably possible loss or range of loss, if any, that may result from this action and therefore no accrual has been made related to this. Any such losses could, potentially, have a material adverse effect, individually or collectively, on the Company’s results of operations, financial condition and liquidity.
Kramer Lawsuit
In November 2017, Robert J. Kramer, on behalf of himself and all others similarly situated (collectively, the “Kramer Plaintiffs”) filed a purported class action lawsuit in the Superior Court of California, County of Sacramento on behalf of all current and former store managers, all others with similar job functions and/or titles and all current and former employees classified as non-exempt or incorrectly classified as exempt and who worked for the Company in the State of California (collectively, the “CSM Employees”) alleging violation of the California Labor Code including, among other items, failure to pay wages and overtime and engaging in unfair business practices (the “Kramer matter”). The Kramer Plaintiffs seek certification of the CSM Employees for a class action covering the prior four-year period prior to the filing of the complaint through the disposition of this action for the CSM Employees who currently are or were employed in California (the “California SM Class”). On or about February 19, 2019, the Kramer Plaintiffs filed a first amended complaint adding a claim for penalties under the California Private Attorney General Act for the same substantive alleged violations asserted in the complaint. The Kramer Plaintiffs did not quantify any alleged damages but, in addition to attorneys’ fees and costs, the Kramer Plaintiffs seek unspecified amounts for unpaid wages and overtime wages, liquidated and/or punitive damages, declaratory relief, restitution, statutory penalties, injunctive relief and other damages.
71
On September 9, 2019, the Company entered into an agreement to settle the Kramer matter, consistent with the terms of the Memorandum of Understanding previously disclosed by the Company. Under the terms of the settlement agreement, the Company will pay $4.75 million to settle the claims asserted in the Kramer matter (or which could have been asserted in the Kramer matter) on behalf of all current and/or former store managers and store managers in training employed by the Company at any time between November 17, 2013 and September 19, 2019. The settlement agreement was preliminarily approved by the court on September 19, 2019, and granted final approval on January 17, 2020. The Company recognized a net charge to earnings of approximately $4.75 million within SG&A expense in its second quarter 2019 financial statements. As of December 31, 2019, the remaining accrual related to this matter is $4.75 million, which is included on the balance sheet within the caption “Accrual for Legal Matters and Settlements- Current.”
Antidumping and Countervailing Duties Investigation
In October 2010, a conglomeration of domestic manufacturers of multilayered wood flooring (“Petitioners”) filed a petition seeking the imposition of antidumping (“AD”) and countervailing duties (“CVD”) with the United States Department of Commerce (“DOC”) and the United States International Trade Commission (“ITC”) against imports of multilayered wood flooring from China. This ruling applies to companies importing multilayered wood flooring from Chinese suppliers subject to the AD and CVD orders. The Company’s multilayered wood flooring imports from China accounted for approximately 6% and 7% of its flooring purchases in 2019 and 2018, respectively. The Company’s consistent view through the course of this matter has been, and remains, that its imports are neither dumped nor subsidized. As such, it has appealed the original imposition of AD and CVD fees.
As part of its processes in these proceedings, the DOC conducts annual reviews of the AD and CVD rates. In such cases, the DOC will issue preliminary rates that are not binding and are subject to comment by interested parties. After consideration of the comments received, the DOC will issue final rates for the applicable period, which may lag by a year or more. At the time of import, the Company makes deposits at the then prevailing rate, even while the annual review is in process. When rates are declared final by the DOC, the Company accrues a receivable or payable depending on where that final rate compares to the deposits it has made. The Company and/or the domestic manufacturers can appeal the final rate for any period and can place a hold on final settlement by U.S. Customs and Border Protection while the appeals are pending.
In addition to its overall appeal of the imposition of AD and CVD, which is still pending, the Company as well as other involved parties have appealed many of the final rate determinations. Those appeals are pending and, at times, have resulted in delays in settling the shortfalls and refunds shown in the table below. Because of the length of time for finalization of rates as well as appeals, any subsequent adjustment of AD and CVD rates typically flows through a period different from those in which the inventory was originally purchased and/or sold.
Results by period for the Company are shown below. The column labeled ‘December 31, 2019 Receivable/Liability Balance’ represents the amount the Company would receive or pay (net of any collections or payments) as the result of subsequent adjustment to rates whether due to finalization by the DOC or because of action of a court based on appeals by various parties. It does not include any initial amounts paid for AD or CVD in the current period at the in-effect rate at that time.
The Company recorded net interest expense related to antidumping of $0.6 million for the year ended December 31, 2019, with the amount included in other expense on the Statements of Operations. The estimated associated interest payable and receivable for each period is not included in the table below and is included in the same financial statement line item on the Company’s consolidated balance sheet as the associated liability and receivable balance for each period.
72
|
Review |
|
Rates at which |
|
December 31, 2019 |
|
Period |
Period Covered |
Company |
Final Rate |
Receivable/Liability |
|
|
|
Deposited |
|
Balance |
|
Antidumping |
||||
|
1 |
May 2011 through |
6.78% and 3.3% |
0.73%1 |
$1.3 million |
|
|
November 2012 |
|
|
receivable1 |
|
2 |
December 2012 through |
3.30% |
13.74% 2 |
$4.1 million |
|
|
November 2013 |
|
|
liability |
|
3 |
December 2013 through |
3.3% and 5.92% |
17.37% |
$4.7 million |
|
|
November 2014 |
|
|
liability |
|
4 |
December 2014 through |
5.92% and 13.74% |
0.00% |
Settled |
|
|
November 2015 |
|
|
|
|
5 |
December 2015 through |
5.92%. 13.74%. and 17.37% |
0.00% |
Settled |
|
|
November 2016 |
|
|
|
|
6 |
December 2016 through |
17.37% and 0.00% |
42.57% and 0.00%3 |
$0.5 million receivable |
|
|
November 2017 |
|
|
$1.5 million liability3 |
|
7 |
December 2017 through |
0.00% |
Pending4 |
NA |
|
|
November 2018 |
|
|
|
|
|
|
|
Included on the Consolidated Balance Sheet in Other Current Assets |
$0.5 million |
|
|
|
|
Included on the Consolidated Balance Sheet in Other Assets |
$1.3 million |
|
|
|
|
Included on the Consolidated Balance Sheet in Other Long-Term Liabilities |
$10.3 million |
|
Countervailing |
||||
|
1&2 |
April 2011 through |
1.50% |
0.83% / 0.99% |
$0.2 million |
|
|
December 2012 |
|
|
receivable |
|
3 |
January 2013 through |
1.50% |
1.38% |
$0.05 million |
|
4 |
January 2014 through |
1.50% and 0.83% |
1.06% |
$0.02 million |
|
5 |
January 2015 through |
0.83% and 0.99% |
Final at 0.11% and 0.85%5 |
$0.07 million |
|
6 |
January 2016 through |
0.99% and 1.38% |
Final at 3.10% and 2.96% |
$0.04 million |
|
7 |
January 2017 through |
1.38% and 1.06% |
Pending7 |
NA |
|
8 |
January 2018 through |
1.06% |
Pending |
NA |
|
|
|
|
Included on the Consolidated Balance Sheet in Other Current Assets |
$0.1 million |
|
|
|
|
Included on the Consolidated Balance Sheet in Other Assets |
$0.3 million |
|
|
|
|
Included on the Consolidated Balance Sheet in Other Current Liabilities |
$0.04 million |
|
1 |
In the second quarter of 2018, the Court of International Trade sustained the DOC’s recommendation to reduce the rate for the first annual review period to 0.73% (from 5.92%). As a result, the Company reversed its $0.8 million liability and recorded a $1.3 million receivable with a corresponding reduction of cost of sales during the year ended December 31, 2018. |
|
2 |
As a result of the remand from CIT, in June 2019 the DOC proposed to reduce the AD rate to 6.55% for the second annual review period. The CIT is expected to rule on the DOC’s remand during 2020. If the final ruling remains at 6.55% (from 13.74%), the Company’s liability of $4.1 million would decrease by $2.8 million to $1.3 million in the period in which the ruling is finalized. |
73
|
3 |
In the third quarter of 2019, the DOC issued the final rates for the sixth annual review period at 42.57% and 0% depending on the vendor. As a result, the Company recorded a liability of $0.8 million with a corresponding reduction of cost of sales during the year ended December 31, 2019. The Company received payments during 2019 for its vendor with a final rate of 0% and the remaining balance of $0.5 million as of December 31, 2019 was included in other current assets on the consolidated balance sheet. The vendors with a final rate of 42.57% are under appeal and the balance of $1.5 million as of December 31, 2019 was included in other long-term liabilities on the consolidated balance sheet. |
|
4 |
In January 2020, the DOC issued a preliminary rate of 0.0% for the seventh annual review period. |
|
5 |
In the second quarter of 2018, the DOC issued the final rates for the fifth annual review period at 0.11% and 0.85% depending on the vendor. As a result, in the second quarter of 2018, the Company recorded a receivable of $0.07 million for deposits made at previous preliminary rates, with a corresponding reduction of cost of sales. |
|
6 |
In the third quarter of 2019, the DOC issued the final rates for the sixth annual review period at 3.1% and 2.96% depending on the vendor. As a result, the Company recorded a liability of $0.4 million with a corresponding reduction of cost of sales during the year ended December 31, 2019. |
|
7 |
In January 2020, the DOC issued a preliminary rate of 24.61% for the seventh annual review period. If the preliminary rates remains at 24.61%, the Company will record a liability of $2 million in the period in which the ruling is finalized. |
Other Matters
The Company is also, from time to time, subject to claims and disputes arising in the normal course of business. In the opinion of management, while the outcome of any such claims and disputes cannot be predicted with certainty, its ultimate liability in connection with these matters is not expected to have a material adverse effect on the Company’s results of operations, financial position or liquidity.
Note 11. Selected Quarterly Financial Information (unaudited)
The following tables present the Company’s unaudited quarterly results for 2019 and 2018.
|
|
|
Quarter Ended |
|
||||||||||
|
|
|
March 31, |
|
June 30, |
|
September 30, |
|
December 31, |
|
||||
|
|
|
2019 |
|
2019 |
|
2019 |
|
2019 |
|
||||
|
Net Sales |
|
$ |
266,220 |
|
$ |
288,567 |
|
$ |
263,961 |
|
$ |
273,854 |
|
|
Gross Profit |
|
|
93,611 |
|
|
102,487 |
|
|
95,674 |
|
|
111,914 |
|
|
Selling, General and Administrative Expenses |
|
|
97,032 |
|
|
103,864 |
|
|
93,496 |
|
|
92,578 |
|
|
Operating (Loss) Income |
|
|
(3,421) |
|
|
(1,377) |
|
|
2,178 |
|
|
19,336 |
|
|
Net (Loss) Income |
|
$ |
(4,924) |
|
$ |
(2,856) |
|
$ |
1,045 |
|
$ |
16,398 |
|
|
Net (Loss) Income per Common Share - Basic |
|
$ |
(0.17) |
|
$ |
(0.10) |
|
$ |
0.04 |
|
$ |
0.57 |
|
|
Net (Loss) Income per Common Share - Diluted |
|
$ |
(0.17) |
|
$ |
(0.10) |
|
$ |
0.04 |
|
$ |
0.57 |
|
|
Number of Stores Opened in Quarter, net |
|
|
— |
|
|
2 |
|
|
4 |
|
|
— |
|
|
Comparable Store Net Sales (Decrease) Increase |
|
|
(0.8) |
% |
|
(0.1) |
% |
|
(3.6) |
% |
|
0.4 |
% |
|
|
|
Quarter Ended |
|
||||||||||
|
|
|
March 31, |
|
June 30, |
|
September 30, |
|
December 31, |
|
||||
|
|
|
2018 |
|
2018 |
|
2018 |
2018 |
|
|||||
|
Net Sales |
|
$ |
261,772 |
|
$ |
283,474 |
|
$ |
270,469 |
|
$ |
268,921 |
|
|
Gross Profit |
|
|
94,972 |
|
|
101,310 |
|
|
100,682 |
|
|
95,976 |
|
|
Selling, General and Administrative Expenses |
|
|
96,418 |
|
|
102,223 |
|
|
93,987 |
|
|
150,885 |
|
|
Operating (Loss) Income |
|
|
(1,446) |
|
|
(913) |
|
|
6,695 |
|
|
(54,909) |
|
|
Net (Loss) Income |
|
$ |
(1,972) |
|
$ |
(1,454) |
|
$ |
5,923 |
|
$ |
(56,876) |
|
|
Net (Loss) Income per Common Share - Basic |
|
$ |
(0.07) |
|
$ |
(0.05) |
|
$ |
0.21 |
|
$ |
(1.99) |
|
|
Net (Loss) Income per Common Share - Diluted |
|
$ |
(0.07) |
|
$ |
(0.05) |
|
$ |
0.21 |
|
$ |
(1.99) |
|
|
Number of Stores Opened in Quarter |
|
|
5 |
|
|
8 |
|
|
3 |
|
|
4 |
|
|
Comparable Store Net Sales Increase |
|
|
2.9 |
% |
|
4.7 |
% |
|
2.1 |
% |
|
0.4 |
% |
74
Item 9. Changes in and Disagreements with Accountants on Accounting and Financial Disclosure.
None.
Item 9A. Controls and Procedures.
Evaluation of Disclosure Controls and Procedures
We maintain disclosure controls and procedures (as defined in Rule 13a-15(e) under the Securities Exchange Act of 1934, as amended (the “Exchange Act”), that are designed to ensure that information that would be required to be disclosed in Exchange Act reports is recorded, processed, summarized and reported within the time periods specified in the SEC’s rules and forms, and that such information is accumulated and communicated to our management, including the Principal Executive Officer and Chief Financial Officer, as appropriate, to allow timely decisions regarding required disclosure.
We carried out an evaluation, under the supervision, and with the participation of our management, including our Principal Executive Officer and Chief Financial Officer, of the effectiveness of the design and operation of our disclosure controls and procedures as of December 31, 2019. Based on this evaluation, our Principal Executive Officer and Chief Financial Officer concluded that our disclosure controls and procedures were effective as of December 31, 2019, and designed to provide reasonable assurance that information required to be disclosed by us in reports that we file or submit under the Exchange Act, is recorded, processed, summarized and reported within the time periods specified in the rules and forms of the SEC and that such information is accumulated and communicated to our management, including our Principal Executive Officer and Chief Financial Officer, as appropriate to allow timely decisions regarding required disclosure.
Management’s Report on Internal Control over Financial Reporting
Management of the Company is responsible for establishing and maintaining adequate internal control over financial reporting. Internal control over financial reporting is defined in Rule 13a-15(f) promulgated under the Exchange Act as a process, designed by, or under the supervision of the Company’s principal executive and principal financial officer and effected by the Company’s board of directors, management and other personnel, to provide reasonable assurance regarding the reliability of financial reporting and the preparation of financial statements for external purposes in accordance with accounting principles generally accepted in the United States of America. Internal control over financial reporting includes maintaining records that in reasonable detail accurately and fairly reflect our transactions and disposition of assets; providing reasonable assurance that transactions are recorded as necessary for preparation of our financial statements in accordance with generally accepted accounting principles; providing reasonable assurance that receipts and expenditures are made only in accordance with management and Board authorizations; and providing reasonable assurance regarding prevention or timely detection of unauthorized acquisition, use or disposition of our assets that could have a material effect on our financial statements.
Because of its inherent limitations, internal control over financial reporting is not intended to provide absolute assurance that a misstatement of our financial statements would be prevented or detected. Also, projections of any evaluation of effectiveness to future periods are subject to the risk that controls may become inadequate because of changes in conditions or that the degree of compliance with policies or procedures may deteriorate.
Management under the supervision of, and with the participation of the Company’s principal executive and principal financial officer, conducted an evaluation of the effectiveness of our internal control over financial reporting as of December 31, 2019 based on the framework and criteria established in Internal Control — Integrated Framework (2013) issued by the Committee of Sponsoring Organizations of the Treadway Commission. This evaluation included review of the documentation of controls, evaluation of the design effectiveness of controls, testing of the operating effectiveness of controls and a conclusion on this evaluation. Based on the foregoing, management concluded that the Company’s internal control over financial reporting was effective as of December 31, 2019 based on the specified criteria.
75
Our internal control over financial reporting as of December 31, 2019 has been audited by Ernst & Young LLP, an independent registered public accounting firm, as stated in their report, as shown in Item 8. “Consolidated Financial Statements and Supplementary Data.”
Changes in Internal Control over Financial Reporting
During the fourth quarter of 2018, the Company reported a material weakness in that we did not maintain effective controls over the classification of imported products under the Harmonized Tariff Schedule of the United States. This classification is the basis on which tariff obligations on imported products are calculated. We believe that this weakness was the result of inconsistent documentation of product specifications, an overreliance upon the knowledge and expertise of certain individuals, and review controls that did not operate at a level of precision to detect and correct these errors.
Throughout fiscal year 2019, the Company developed and implemented controls that remediated the material weakness noted above. These controls included 1) documenting complete product specifications in a consistent manner, 2) reviewing classification codes for newly created products, and 3) reviewing previously assigned codes to ensure continued applicability. In addition, the Company hired employees with the requisite experience and expertise with customs and duties to execute these controls.
Except as noted in the preceding paragraphs, there has been no change in our internal control over financial reporting that occurred during the quarter ended December 31, 2019 that has materially affected, or is reasonably likely to materially affect, our internal control over financial reporting.
None.
Item 10. Directors, Executive Officers and Corporate Governance.
The information required by this Item is incorporated by reference from the definitive proxy statement for our 2020 annual meeting of shareholders, which will be filed no later than 120 days after December 31, 2019.
Code of Ethics
We have a Code of Business Conduct and Ethics, which applies to all employees, officers and directors of Lumber Liquidators Holdings, Inc. and its direct and indirect subsidiaries. Our Code of Business Conduct and Ethics meets the requirements of a “code of ethics” as defined by Item 406 of Regulation S-K, and applies to our Principal Executive Officer, Chief Financial Officer (who is our principal financial officer), as well as all other employees. Our Code of Business Conduct and Ethics also meets the requirements of a code of conduct under Rule 303A.10 of the NYSE Listed Company Manual. Our Code of Business Conduct and Ethics is posted on our website at www.lumberliquidators.com in the “Corporate Governance” section of our Investor Relations home page.
We intend to provide any required disclosure of an amendment to or waiver from our Code of Business Conduct and Ethics on our website at www.lumberliquidators.com in the “Corporate Governance” section of our Investor Relations home page promptly following the amendment or waiver. We may elect to disclose any such amendment or waiver in a report on Form 8‑K filed with the SEC either in addition to or in lieu of the website disclosure. The information contained on or connected to our website is not incorporated by reference in this report and should not be considered part of this or any other report that we file with or furnish to the SEC.
76
Item 11. Executive Compensation.
The information required by this Item is incorporated by reference from the definitive proxy statement for our 2020 annual meeting of shareholders, which will be filed no later than 120 days after December 31, 2019.
Item 12. Security Ownership of Certain Beneficial Owners and Management and Related Stockholder Matters.
The information required by this Item is incorporated by reference from the definitive proxy statement for our 2020 annual meeting of shareholders, which will be filed no later than 120 days after December 31, 2019.
Item 13. Certain Relationships and Related Transactions, and Director Independence.
The information required by this Item is incorporated by reference from the definitive proxy statement for our 2020 annual meeting of shareholders, which will be filed no later than 120 days after December 31, 2019.
Item 14. Principal Accountant Fees and Services.
The information required by this Item is incorporated by reference from the definitive proxy statement for our 2020 annual meeting of shareholders, which will be filed no later than 120 days after December 31, 2019.
Item 15. Exhibits, Financial Statement Schedules.
The following documents are filed as part of this annual report:
Consolidated Financial Statements
Refer to the financial statements filed as part of this annual report in Part II, Item 8.
Financial Statement Schedules.
The following financial statement schedule is filed as part of this annual report under Schedule II – Analysis of Valuation and Qualifying Accounts for the years ended December 31, 2019, 2018 and 2017. All other financial statement schedules have been omitted because the required information is either included in the financial statements or the notes thereto or is not applicable.
Exhibits
The exhibits listed on the accompanying Exhibit Index are filed or incorporated by reference as part of this report.
None.
77
Lumber Liquidators Holdings, Inc.
Schedule II – Analysis of Valuation and Qualifying Accounts
For the Years Ended December 31, 2019, 2018 and 2017
(in thousands)
|
|
|
|
|
Additions |
|
|
|
|
|
|
|||||
|
|
|
Balance |
|
Charged to |
|
|
|
|
|
|
|||||
|
|
|
Beginning |
|
Cost and |
|
|
|
|
|
Balance End |
|||||
|
|
|
of Year |
|
Expenses |
|
Deductions (1) |
|
Other |
|
of Year |
|||||
|
For the Year Ended December 31, 2017 |
|
|
|
|
|
|
|
|
|
|
|
|
|
|
|
|
Reserve deducted from assets to which it applies |
|
|
|
|
|
|
|
|
|
|
|
|
|
|
|
|
Inventory reserve for loss or obsolescence |
|
$ |
7,070 |
|
$ |
6,349 |
|
$ |
(7,788) |
|
$ |
— |
|
$ |
5,631 |
|
Income tax valuation allowance |
|
$ |
17,640 |
|
$ |
3,936 |
(2) |
$ |
— |
|
$ |
— |
|
$ |
21,576 |
|
|
|
|
|
|
|
|
|
|
|
|
|
|
|
|
|
|
For the Year Ended December 31, 2018 |
|
|
|
|
|
|
|
|
|
|
|
|
|
|
|
|
Reserve deducted from assets to which it applies |
|
|
|
|
|
|
|
|
|
|
|
|
|
|
|
|
Inventory reserve for loss or obsolescence |
|
$ |
5,631 |
|
$ |
3,108 |
|
$ |
(1,932) |
|
$ |
— |
|
$ |
6,807 |
|
Income tax valuation allowance |
|
$ |
21,576 |
|
$ |
4,742 |
|
$ |
— |
|
$ |
— |
|
$ |
26,318 |
|
|
|
|
|
|
|
|
|
|
|
|
|
|
|
|
|
|
For the Year Ended December 31, 2019 |
|
|
|
|
|
|
|
|
|
|
|
|
|
|
|
|
Reserve deducted from assets to which it applies |
|
|
|
|
|
|
|
|
|
|
|
|
|
|
|
|
Inventory reserve for loss or obsolescence |
|
$ |
6,807 |
|
$ |
1,888 |
|
$ |
(1,795) |
|
$ |
— |
|
$ |
6,900 |
|
Income tax valuation allowance |
|
$ |
26,318 |
|
$ |
668 |
|
$ |
— |
|
$ |
— |
|
$ |
26,986 |
|
1 |
Deductions are for the purposes for which the reserve was created. |
|
2 |
Includes the impact of the Tax Act, which was enacted on December 22, 2017. |
78
EXHIBIT INDEX
| 3.01 |
|
|
| 3.02 |
|
|
| 4.01 |
|
|
| 4.02 |
|
|
|
10.1* |
|
|
|
10.2* |
|
|
|
10.3* |
|
|
|
10.4* |
|
|
| 10.5 |
|
|
|
10.6* |
|
|
|
10.7* |
|
|
|
10.8* |
|
|
| 10.9 |
|
|
|
10.10* |
|
|
|
10.11* |
|
|
|
10.12* |
|
|
|
10.13* |
|
|
|
10.14* |
|
79
|
10.15* |
|
||
|
10.16* |
|
||
|
10.17* |
|
||
|
10.18* |
|
||
|
10.19* |
|
||
|
10.20* |
|
||
|
10.21* |
|
||
| 10.22 |
|
||
| 10.23 |
|
||
| 10.24 |
|
||
| 10.25 |
|
||
| 10.26 |
|
||
| 10.27 |
|
||
|
10.28 |
|
|
|
|
10.29* |
|
||
|
10.30* |
|
80
|
10.31* |
|
|
|
10.32* |
|
|
|
10.33* |
|
|
|
10.34* |
|
|
|
10.35* |
|
|
|
10.36* |
|
|
| 10.37 |
|
|
|
10.38* |
|
|
|
10.39* |
|
|
|
10.40* |
|
|
|
10.41* |
|
|
|
10.42* |
|
|
|
10.43* |
|
|
|
10.44* |
|
|
|
10.45* |
|
Offer Letter Agreement with Christopher Thomsen, dated August 8, 2016 |
|
10.46* |
|
Severance Agreement, effective as of July 26, 2018 between the Company and Christopher Thomsen |
|
10.47* |
|
|
|
10.48* |
|
|
|
10.49* |
|
|
|
21.1 |
|
81
|
23.1 |
|
Consent of Ernst & Young LLP, Independent Registered Public Accounting Firm |
|
31.1 |
|
|
|
31.2 |
|
|
|
32.1 |
|
|
| 101 |
|
The following financial statements from the Company’s Form 10-K for the year ended December 31, 2019, formatted in XBRL: (i) Consolidated Balance Sheets, (ii) Consolidated Statements of Operations, (iii) Consolidated Statements of Comprehensive Loss, (iv) Consolidated Statements of Stockholders’ Equity, (v) Consolidated Statements of Cash Flows, (vi) Notes to Consolidated Financial Statements |
|
|
|
|
|
* |
|
Indicates a management contract or compensation plan, contract or agreement. |
82
Pursuant to the requirements of Section 13 or 15(d) of the Securities Exchange Act of 1934, as amended, the registrant has duly caused this report to be signed on its behalf by the undersigned, thereunto duly authorized on February 24, 2020.
|
|
|
LUMBER LIQUIDATORS HOLDINGS, INC. |
|
|
|
(Registrant) |
|
|
|
|
|
|
By: |
/s/ Charles E. Tyson |
|
|
|
Charles E. Tyson |
|
|
Principal Executive Officer |
|
Pursuant to the requirements of the Securities and Exchange Act of 1934, this report has been signed below by the following persons on behalf of the registrant and in the capacities indicated on February 24, 2020.
|
Signature |
|
Title |
|
|
|
|
|
/s/ Charles E. Tyson |
|
Principal Executive Officer |
|
Charles E. Tyson |
|
(Principal Executive Officer) |
|
|
|
|
|
/s/ Nancy A. Walsh |
|
Chief Financial Officer |
|
Nancy A. Walsh |
|
(Principal Financial Officer) |
|
|
|
|
|
/s/ Timothy J. Mulvaney |
|
Chief Accounting Officer |
|
Timothy J. Mulvaney |
|
(Principal Accounting Officer) |
|
|
|
|
|
/s/ Nancy M. Taylor |
|
Chairperson of the Board |
|
Nancy M. Taylor |
|
|
|
/s/ Terri F. Graham |
|
Director |
|
Terri F. Graham |
|
|
|
|
|
|
|
/s/ David A. Levin |
|
Director |
|
David A. Levin |
|
|
|
|
|
|
|
/s/ Douglas T. Moore |
|
Director |
|
Douglas T. Moore |
|
|
|
|
|
|
|
/s/ Famous P. Rhodes |
|
Director |
|
Famous P. Rhodes |
|
|
|
|
|
|
|
/s/ Martin F. Roper |
|
Director |
|
Martin F. Roper |
|
|
|
|
|
|
|
/s/ Jimmie L. Wade |
|
Director |
|
Jimmie L. Wade |
|
|
83