Attached files
| file | filename |
|---|---|
| 8-K - 8-K - ASHFORD HOSPITALITY TRUST INC | ahtinvestorpresentation8-k.htm |

November 2018
Forward Looking St atements and Non-GAAP Measures In keeping with the SEC's "Safe Harbor" guidelines, certain statements made during this presentation could be considered forward-looking and subject to certain risks and uncertainties that could cause results to differ materially from those projected. When we use the words "will likely result," "may," "anticipate," "estimate," "should," "expect," "believe," "intend," or similar expressions, we intend to identify forward-looking statements. Such forward-looking statements include, but are not limited to, our business and investment strategy, our understanding of our competition, current market trends and opportunities, projected operating results, and projected capital expenditures. These forward-looking statements are subject to known and unknown risks and uncertainties, which could cause actual results to differ materially from those anticipated including, without limitation: general volatility of the capital markets and the market price of our common stock; changes in our business or investment strategy; availability, terms and deployment of capital; availability of qualified personnel; changes in our industry and the market in which we operate, interest rates or the general economy, and the degree and nature of our competition. These and other risk factors are more fully discussed in the company's filings with the Securities and Exchange Commission. EBITDA is defined as net income before interest, taxes, depreciation and amortization. EBITDA yield is defined as trailing twelve month EBITDA divided by the purchase price or debt amount. A capitalization rate is determined by dividing the property's net operating income by the purchase price. Net operating income is the property's funds from operations minus a capital expense reserve of either 4% or 5% of gross revenues. Hotel EBITDA flow-through is the change in Hotel EBITDA divided by the change in total revenues. EBITDA, FFO, AFFO, CAD and other terms are non-GAAP measures, reconciliations of which have been provided in prior earnings releases and filings with the SEC or in the appendix to this presentation. This overview is for informational purposes only and is not an offer to sell, or a solicitation of an offer to buy or sell, any securities of Ashford Hospitality Trust, Inc. or any of its respective affiliates, and may not be relied upon in connection with the purchase or sale of any such security. 2
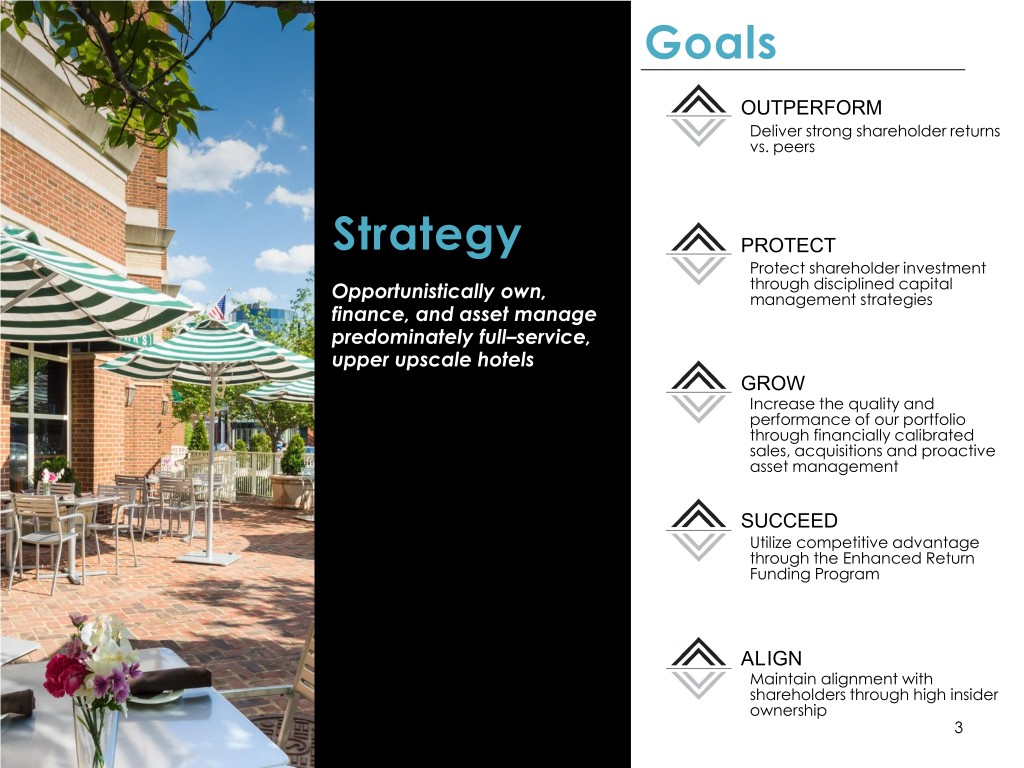
Goals OUTPERFORM Deliver strong shareholder returns vs. peers Strategy PROTECT Protect shareholder investment through disciplined capital Opportunistically own, management strategies finance, and asset manage predominately full–service, upper upscale hotels GROW Increase the quality and performance of our portfolio through financially calibrated sales, acquisitions and proactive asset management SUCCEED Utilize competitive advantage through the Enhanced Return Funding Program ALIGN Maintain alignment with shareholders through high insider ownership 3
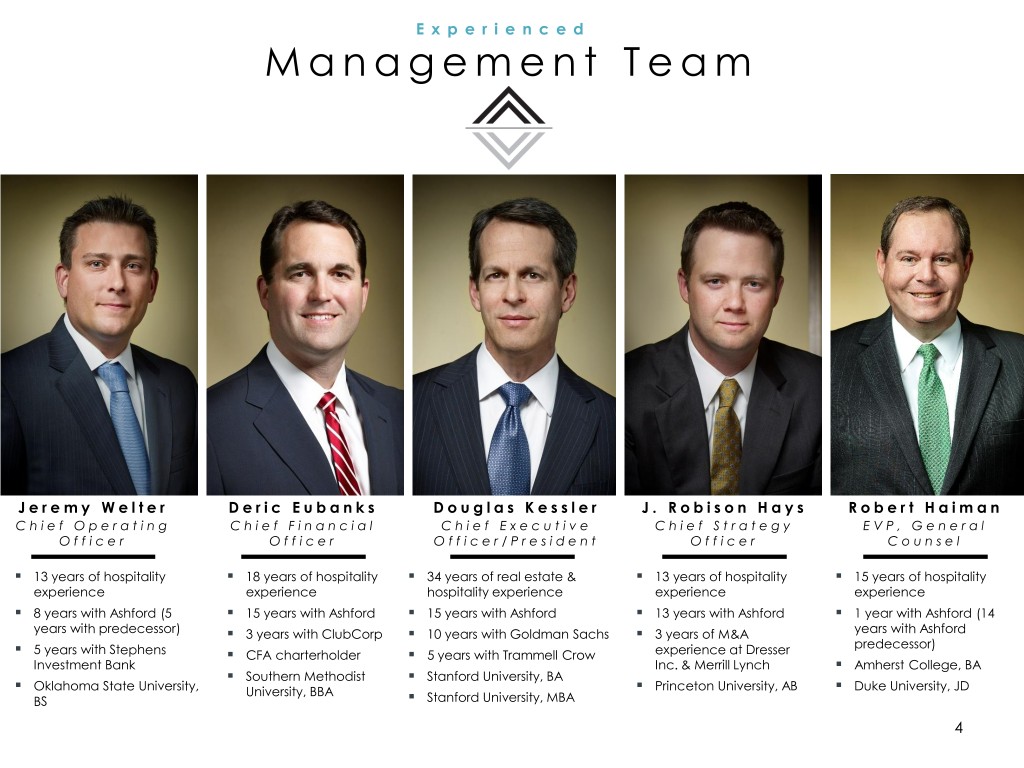
E x p e r i e n c e d M a n a g e m e n t T e a m J e r e m y W e l t e r D e r i c E u b a n k s D o u g l a s K e s s l e r J . R o b i s o n H a y s R o b e r t H a i m a n C h i e f O p e r a t i n g C h i e f F i n a n c i a l C h i e f E x e c u t i v e C h i e f S t r a t e g y E V P , G e n e r a l O f f i c e r O f f i c e r O f f i c e r / P r e s i d e n t O f f i c e r C o u n s e l . 13 years of hospitality . 18 years of hospitality . 34 years of real estate & . 13 years of hospitality . 15 years of hospitality experience experience hospitality experience experience experience . 8 years with Ashford (5 . 15 years with Ashford . 15 years with Ashford . 13 years with Ashford . 1 year with Ashford (14 years with predecessor) . 3 years with ClubCorp . 10 years with Goldman Sachs . 3 years of M&A years with Ashford . 5 years with Stephens . . experience at Dresser predecessor) CFA charterholder 5 years with Trammell Crow . Investment Bank . . Inc. & Merrill Lynch Amherst College, BA . Southern Methodist Stanford University, BA . . Oklahoma State University, University, BBA . Princeton University, AB Duke University, JD BS Stanford University, MBA 4
Reasons to Own Ashford Hospitality Trust STRATEGIC FOCUS PORTFOLIO QUALITY ERFP PROGRAM HIGH DIVIDEND YIELD Strategy maximizes investment High quality portfolio presents an Innovative program provides a One of the highest dividend yields in opportunity and value-added returns attractive investment opportunity competitive advantage relative to the industry peers ASSET MANAGEMENT TRACK RECORD AFFILIATE ADVANTAGES INSIDER OWNERSHIP Best-in-class asset management Disciplined capital management that Affiliate companies offer more value Highest insider ownership among peers generates value-add opportunities enhances shareholder value and control in other parts of the creates shareholder-management business alignment 5
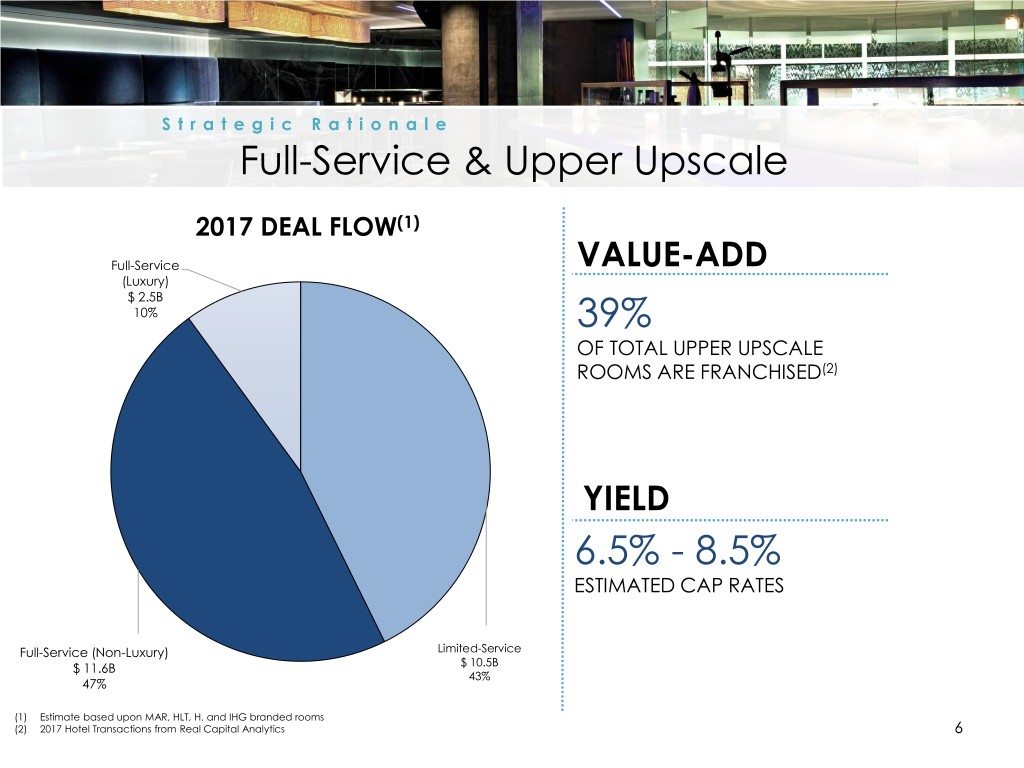
Strategic Rationale Full-Service & Upper Upscale 2017 DEAL FLOW(1) Full-Service VALUE-ADD (Luxury) $ 2.5B 10% 39% OF TOTAL UPPER UPSCALE ROOMS ARE FRANCHISED(2) YIELD 6.5% - 8.5% ESTIMATED CAP RATES Full-Service (Non-Luxury) Limited-Service $ 11.6B $ 10.5B 43% 47% (1) Estimate based upon MAR, HLT, H, and IHG branded rooms (2) 2017 Hotel Transactions from Real Capital Analytics 6
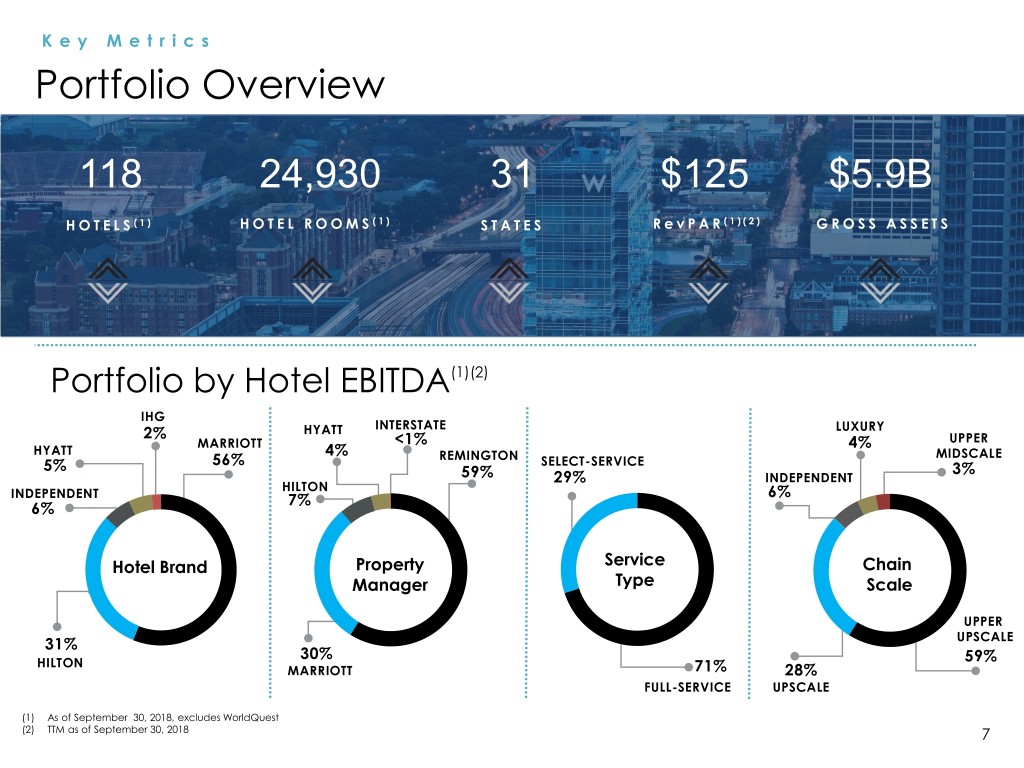
Key Metrics Portfolio Overview 118 24,930 31 $125 $5.9B H O T E L S (1) H O T E L R O O M S ( 1 ) S T A T E S R e v P A R ( 1 ) ( 2 ) G R O S S A S S E T S Portfolio by Hotel EBITDA(1)(2) IHG INTERSTATE 2% HYATT LUXURY MARRIOTT <1% 4% UPPER HYATT 4% 56% REMINGTON MIDSCALE 5% SELECT-SERVICE 3% 59% 29% INDEPENDENT HILTON 6% INDEPENDENT 7% 6% Hotel Brand Property Service Chain Manager Type Scale UPPER 31% UPSCALE 30% HILTON 59% MARRIOTT 71% 28% FULL-SERVICE UPSCALE (1) As of September 30, 2018, excludes WorldQuest (2) TTM as of September 30, 2018 7
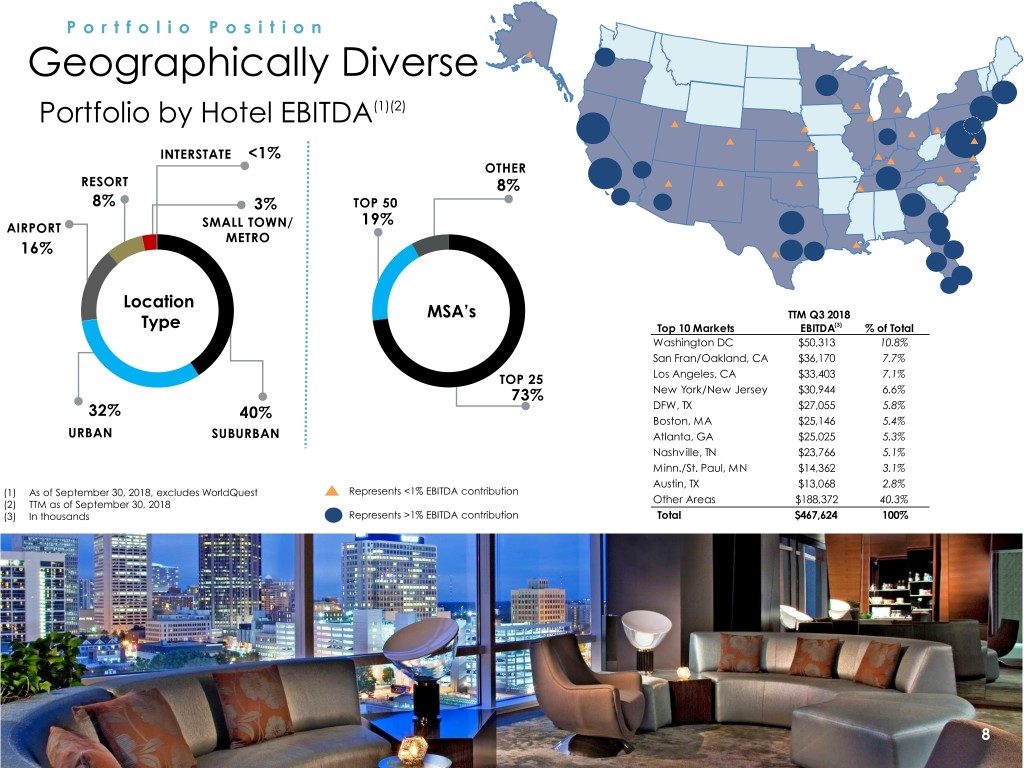
Portfolio Position Geographically Diverse Portfolio by Hotel EBITDA(1)(2) INTERSTATE <1% OTHER RESORT 8% 8% 3% TOP 50 19% AIRPORT SMALL TOWN/ METRO 16% Location MSA’s TTM Q3 2018 Type Top 10 Markets EBITDA(3) % of Total Washington DC $50,313 10.8% San Fran/Oakland, CA $36,170 7.7% TOP 25 Los Angeles, CA $33,403 7.1% 73% New York/New Jersey $30,944 6.6% 32% 40% DFW, TX $27,055 5.8% Boston, MA $25,146 5.4% URBAN SUBURBAN Atlanta, GA $25,025 5.3% Nashville, TN $23,766 5.1% Minn./St. Paul, MN $14,362 3.1% Austin, TX $13,068 2.8% (1) As of September 30, 2018, excludes WorldQuest Represents <1% EBITDA contribution (2) TTM as of September 30, 2018 Other Areas $188,372 40.3% (3) In thousands Represents >1% EBITDA contribution Total $467,624 100% 8
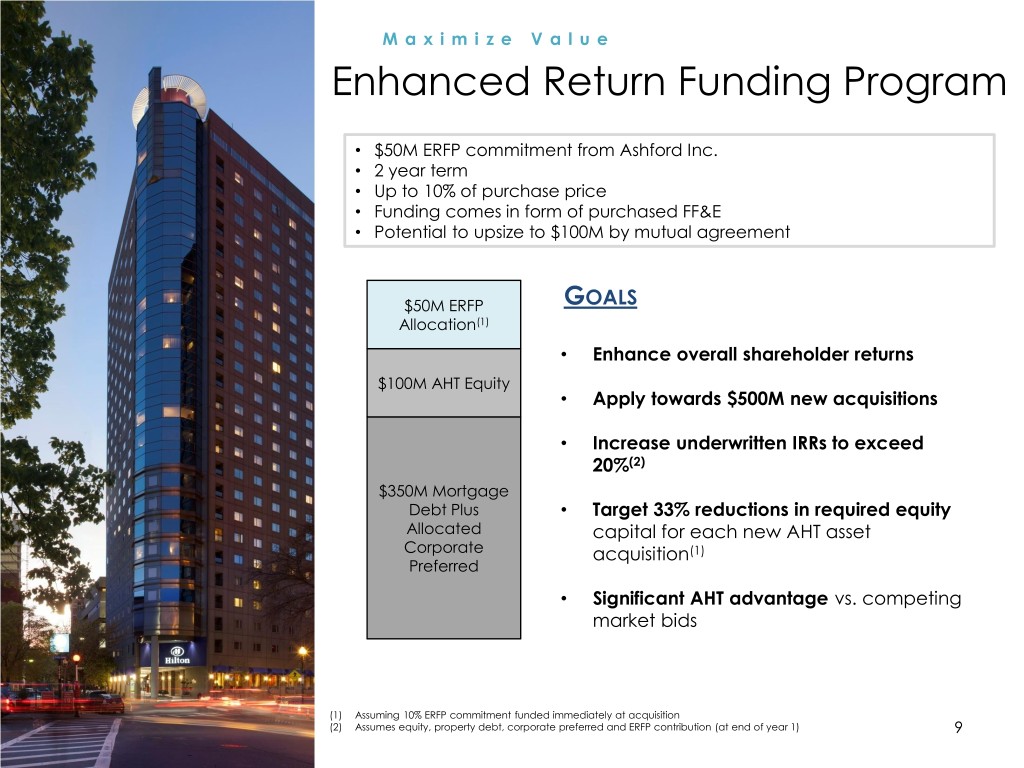
Maximize Value Enhanced Return Funding Program • $50M ERFP commitment from Ashford Inc. • 2 year term • Up to 10% of purchase price • Funding comes in form of purchased FF&E • Potential to upsize to $100M by mutual agreement $50M ERFP GOALS Allocation(1) • Enhance overall shareholder returns $100M AHT Equity • Apply towards $500M new acquisitions • Increase underwritten IRRs to exceed 20%(2) $350M Mortgage Debt Plus • Target 33% reductions in required equity Allocated capital for each new AHT asset Corporate acquisition(1) Preferred • Significant AHT advantage vs. competing market bids (1) Assuming 10% ERFP commitment funded immediately at acquisition (2) Assumes equity, property debt, corporate preferred and ERFP contribution (at end of year 1) 9
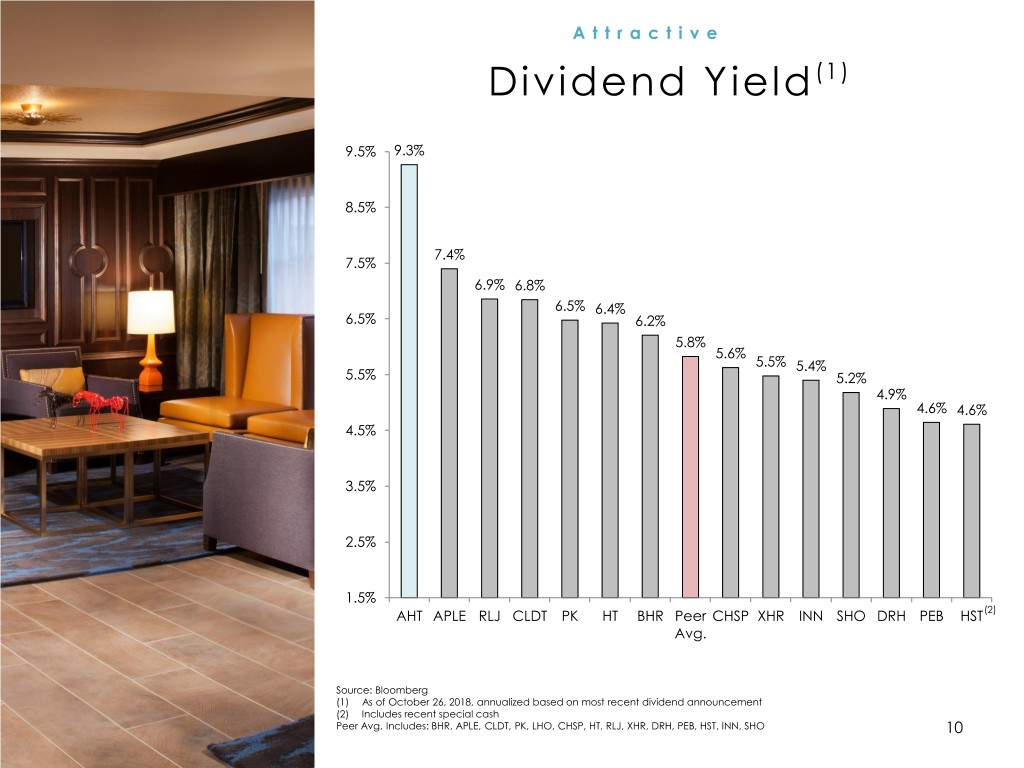
Attractive Dividend Yield (1) 9.5% 9.3% 8.5% 7.4% 7.5% 6.9% 6.8% 6.5% 6.4% 6.5% 6.2% 5.8% 5.6% 5.5% 5.4% 5.5% 5.2% 4.9% 4.6% 4.6% 4.5% 3.5% 2.5% 1.5% AHT APLE RLJ CLDT PK HT BHR Peer CHSP XHR INN SHO DRH PEB HST(2) Avg. Source: Bloomberg (1) As of October 26, 2018, annualized based on most recent dividend announcement (2) Includes recent special cash Peer Avg. Includes: BHR, APLE, CLDT, PK, LHO, CHSP, HT, RLJ, XHR, DRH, PEB, HST, INN, SHO 10
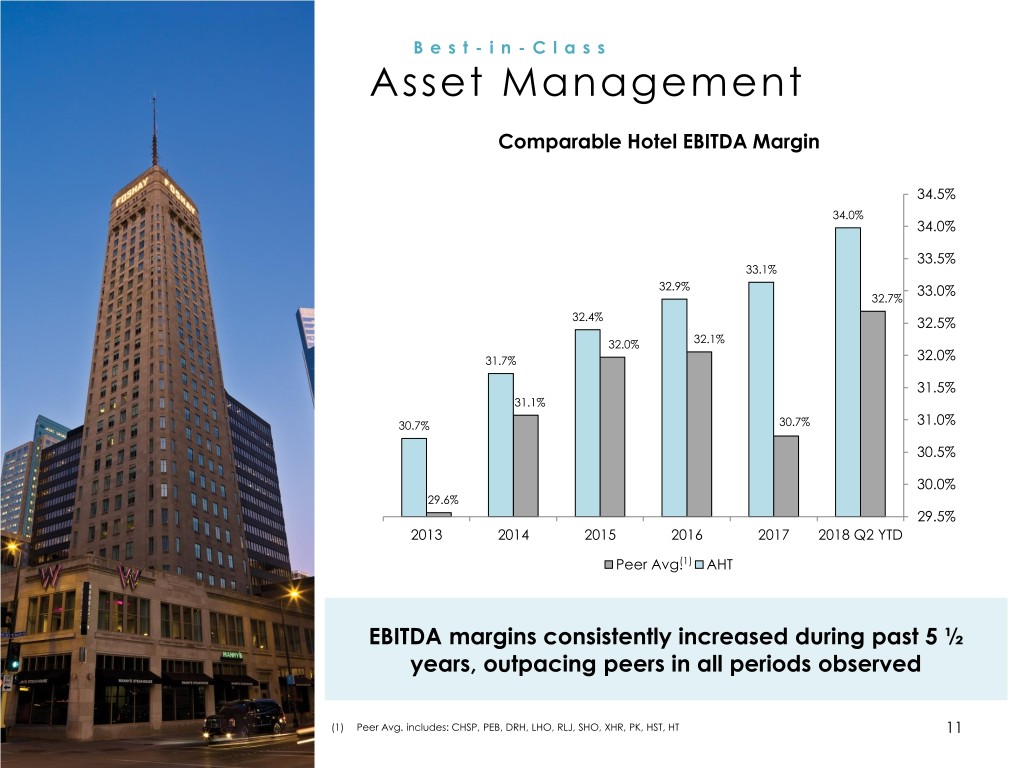
Best- in- C l a s s Asset Management Comparable Hotel EBITDA Margin 34.5% 34.0% 34.0% 33.5% 33.1% 32.9% 33.0% 32.7% 32.4% 32.5% 32.0% 32.1% 31.7% 32.0% 31.5% 31.1% 30.7% 30.7% 31.0% 30.5% 30.0% 29.6% 29.5% 2013 2014 2015 2016 2017 2018 Q2 YTD Peer Avg.(1) AHT EBITDA margins consistently increased during past 5 ½ years, outpacing peers in all periods observed (1) Peer Avg. includes: CHSP, PEB, DRH, LHO, RLJ, SHO, XHR, PK, HST, HT 11
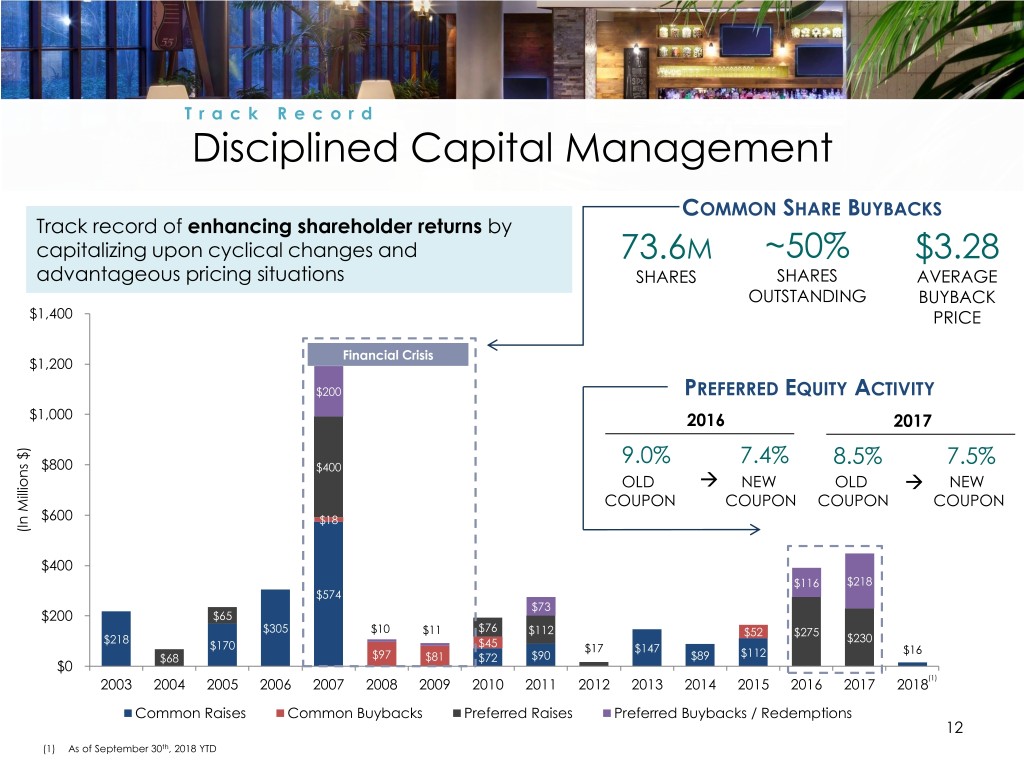
Track Record Disciplined Capital Management COMMON SHARE BUYBACKS Track record of enhancing shareholder returns by capitalizing upon cyclical changes and 73.6M ~50% $3.28 advantageous pricing situations SHARES SHARES AVERAGE OUTSTANDING BUYBACK $1,400 PRICE Financial Crisis $1,200 $200 PREFERRED EQUITY ACTIVITY $1,000 2016 2017 9.0% 7.4% 8.5% 7.5% $800 $400 OLD NEW OLD NEW COUPON COUPON COUPON COUPON $600 $18 (In Millions (In $) $400 $116 $218 $574 $73 $200 $65 $305 $10 $11 $76 $112 $52 $275 $218 $45 $230 $170 $17 $147 $16 $68 $97 $81 $72 $90 $89 $112 $0 (1) 2003 2004 2005 2006 2007 2008 2009 2010 2011 2012 2013 2014 2015 2016 2017 2018 Common Raises Common Buybacks Preferred Raises Preferred Buybacks / Redemptions 12 (1) As of September 30th, 2018 YTD
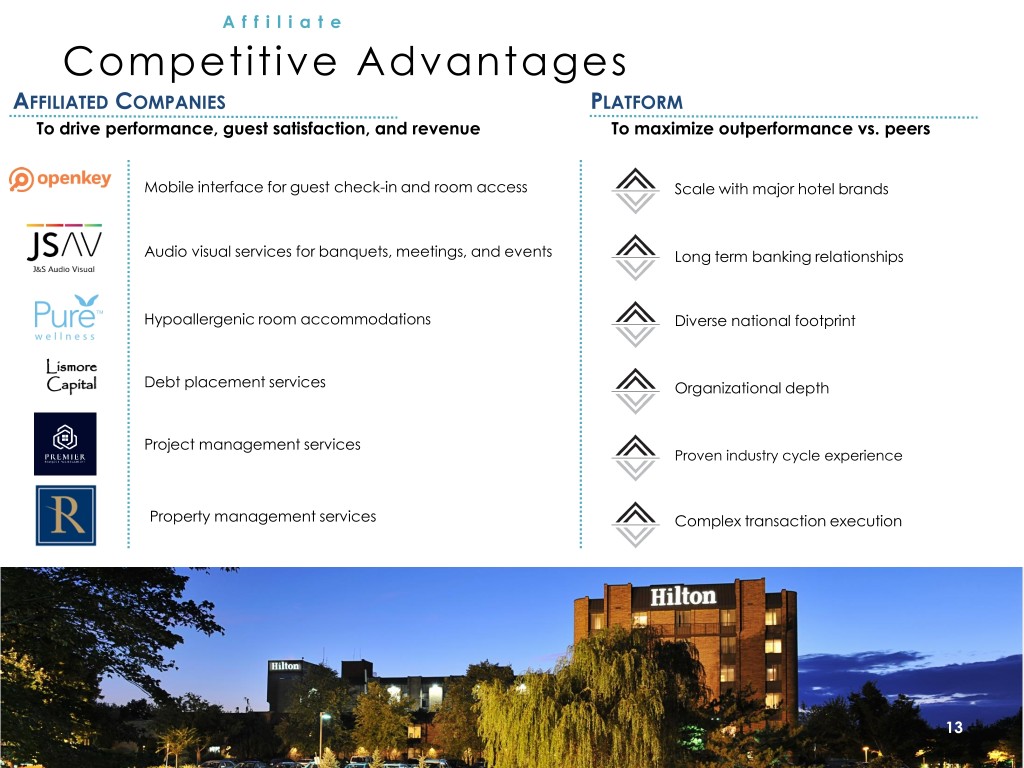
Affiliate Competitive Advantages AFFILIATED COMPANIES PLATFORM To drive performance, guest satisfaction, and revenue To maximize outperformance vs. peers Mobile interface for guest check-in and room access Scale with major hotel brands Audio visual services for banquets, meetings, and events Long term banking relationships Hypoallergenic room accommodations Diverse national footprint Debt placement services Organizational depth Project management services Proven industry cycle experience Property management services Complex transaction execution 13
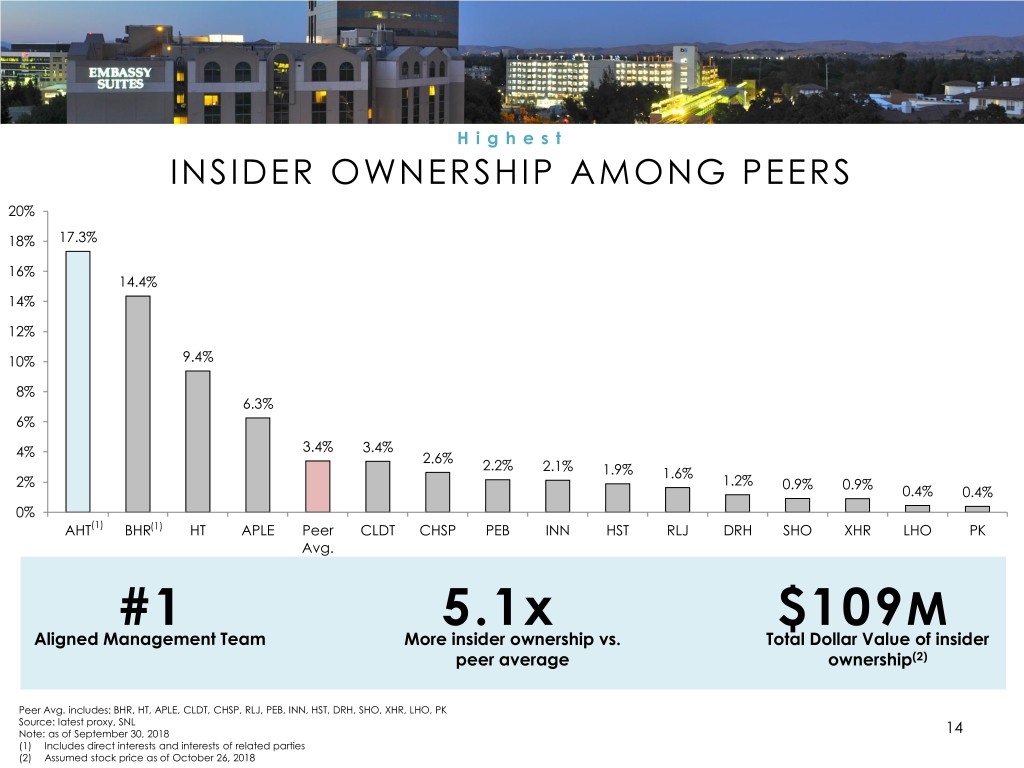
Highest INSIDER OWNERSHIP AMONG PEERS 20% 18% 17.3% 16% 14.4% 14% 12% 10% 9.4% 8% 6.3% 6% 3.4% 3.4% 4% 2.6% 2.2% 2.1% 1.9% 1.6% 2% 1.2% 0.9% 0.9% 0.4% 0.4% 0% AHT(1) BHR(1) HT APLE Peer CLDT CHSP PEB INN HST RLJ DRH SHO XHR LHO PK Avg. #1 5.1x $109M Aligned Management Team More insider ownership vs. Total Dollar Value of insider peer average ownership(2) Peer Avg. includes: BHR, HT, APLE, CLDT, CHSP, RLJ, PEB, INN, HST, DRH, SHO, XHR, LHO, PK Source: latest proxy, SNL Note: as of September 30, 2018 14 (1) Includes direct interests and interests of related parties (2) Assumed stock price as of October 26, 2018
Transactions
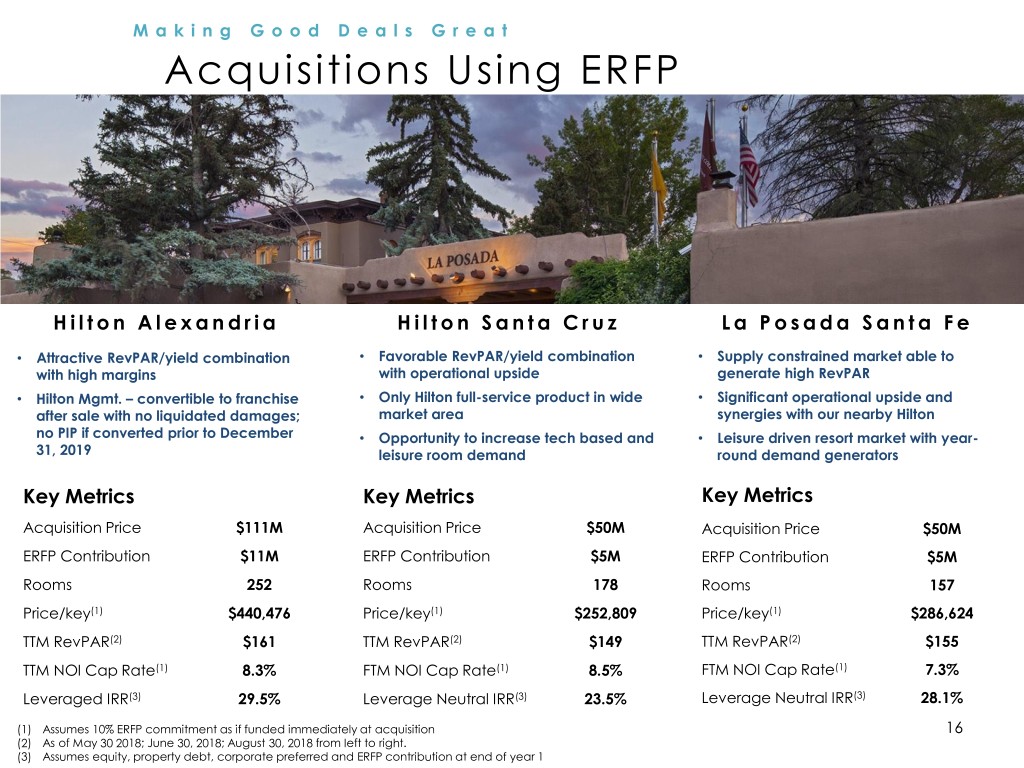
Making Good Deals Great Acquisitions Using ERFP H i l t o n A l e x a n d r i a H i l t o n S a n t a C r u z L a P o s a d a S a n t a F e • Attractive RevPAR/yield combination • Favorable RevPAR/yield combination • Supply constrained market able to with high margins with operational upside generate high RevPAR • Hilton Mgmt. – convertible to franchise • Only Hilton full-service product in wide • Significant operational upside and after sale with no liquidated damages; market area synergies with our nearby Hilton no PIP if converted prior to December • Opportunity to increase tech based and • Leisure driven resort market with year- 31, 2019 leisure room demand round demand generators Key Metrics Key Metrics Key Metrics Acquisition Price $111M Acquisition Price $50M Acquisition Price $50M ERFP Contribution $11M ERFP Contribution $5M ERFP Contribution $5M Rooms 252 Rooms 178 Rooms 157 Price/key(1) $440,476 Price/key(1) $252,809 Price/key(1) $286,624 TTM RevPAR(2) $161 TTM RevPAR(2) $149 TTM RevPAR(2) $155 TTM NOI Cap Rate(1) 8.3% FTM NOI Cap Rate(1) 8.5% FTM NOI Cap Rate(1) 7.3% Leveraged IRR(3) 29.5% Leverage Neutral IRR(3) 23.5% Leverage Neutral IRR(3) 28.1% (1) Assumes 10% ERFP commitment as if funded immediately at acquisition 16 (2) As of May 30 2018; June 30, 2018; August 30, 2018 from left to right. (3) Assumes equity, property debt, corporate preferred and ERFP contribution at end of year 1
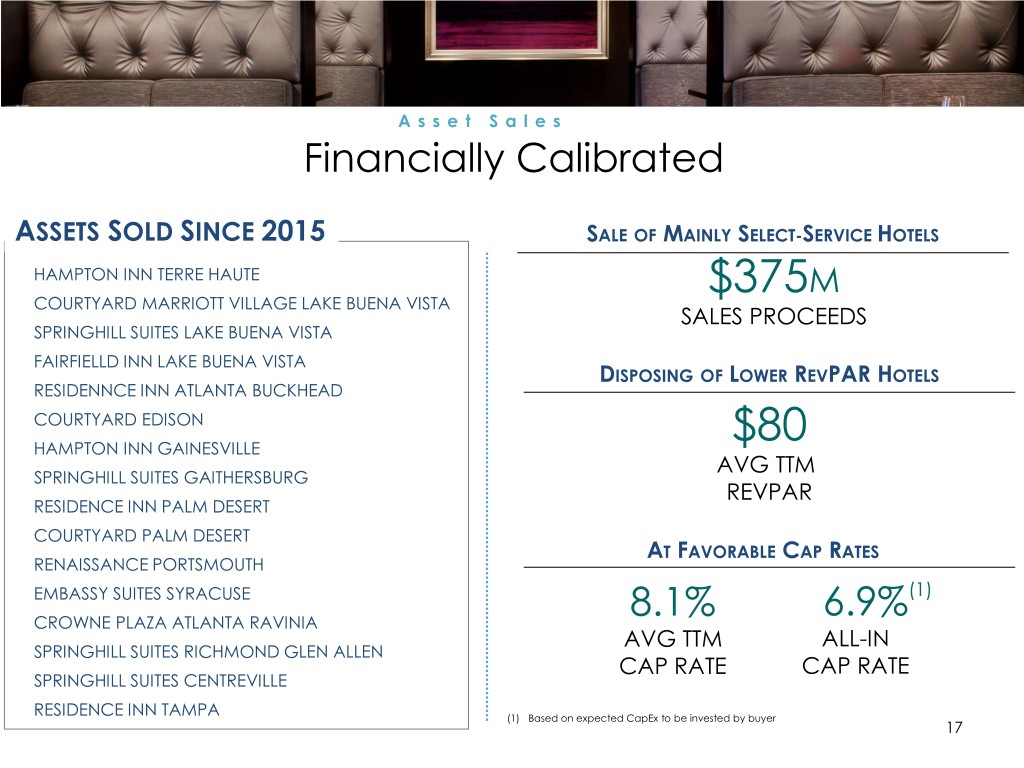
A s s e t S a l e s Financially Calibrated ASSETS SOLD SINCE 2015 SALE OF MAINLY SELECT-SERVICE HOTELS HAMPTON INN TERRE HAUTE $375M COURTYARD MARRIOTT VILLAGE LAKE BUENA VISTA SALES PROCEEDS SPRINGHILL SUITES LAKE BUENA VISTA FAIRFIELLD INN LAKE BUENA VISTA DISPOSING OF LOWER REVPAR HOTELS RESIDENNCE INN ATLANTA BUCKHEAD COURTYARD EDISON HAMPTON INN GAINESVILLE $80 AVG TTM SPRINGHILL SUITES GAITHERSBURG REVPAR RESIDENCE INN PALM DESERT COURTYARD PALM DESERT AT FAVORABLE CAP RATES RENAISSANCE PORTSMOUTH EMBASSY SUITES SYRACUSE 6.9%(1) CROWNE PLAZA ATLANTA RAVINIA 8.1% AVG TTM ALL-IN SPRINGHILL SUITES RICHMOND GLEN ALLEN CAP RATE CAP RATE SPRINGHILL SUITES CENTREVILLE RESIDENCE INN TAMPA (1) Based on expected CapEx to be invested by buyer 17
Balance Sheet
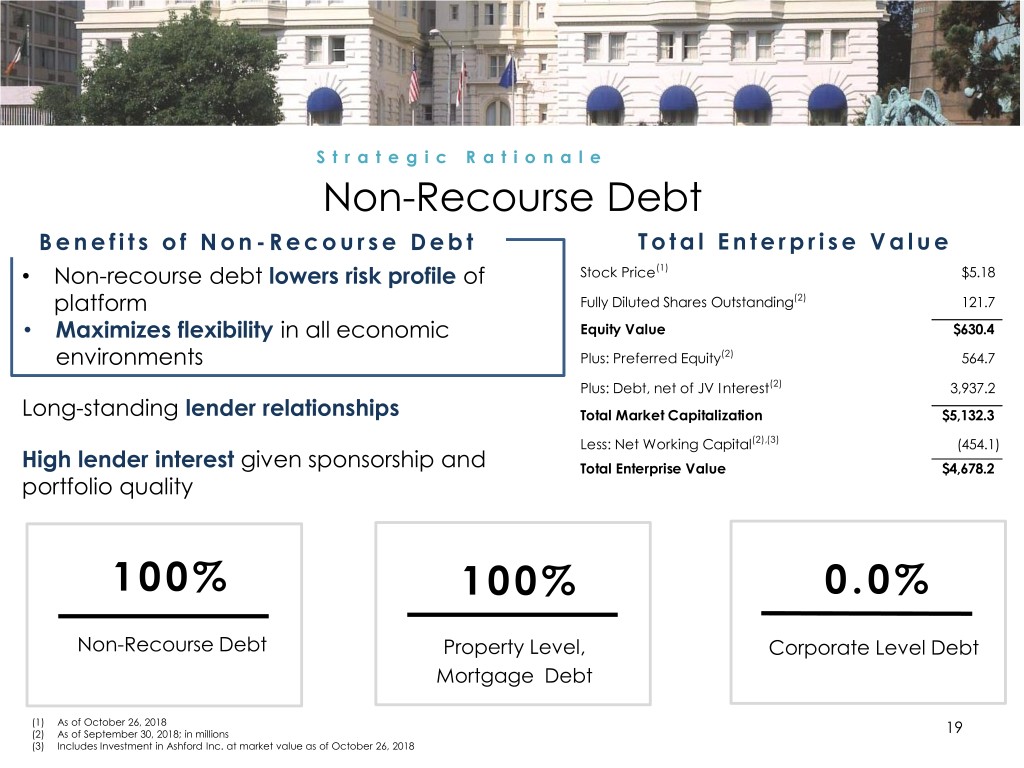
Strategic Rationale Non-Recourse Debt B e n e f i t s o f N o n - R e c o u r s e D e b t T o t a l E n t e r p r i s e V a l u e • Non-recourse debt lowers risk profile of Stock Price(1) $5.18 platform Fully Diluted Shares Outstanding(2) 121.7 • Maximizes flexibility in all economic Equity Value $630.4 environments Plus: Preferred Equity(2) 564.7 Plus: Debt, net of JV Interest(2) 3,937.2 Long-standing lender relationships Total Market Capitalization $5,132.3 Less: Net Working Capital(2),(3) (454.1) High lender interest given sponsorship and Total Enterprise Value $4,678.2 portfolio quality 100% 100% 0.0% Non-Recourse Debt Property Level, Corporate Level Debt Mortgage Debt (1) As of October 26, 2018 (2) As of September 30, 2018; in millions 19 (3) Includes Investment in Ashford Inc. at market value as of October 26, 2018
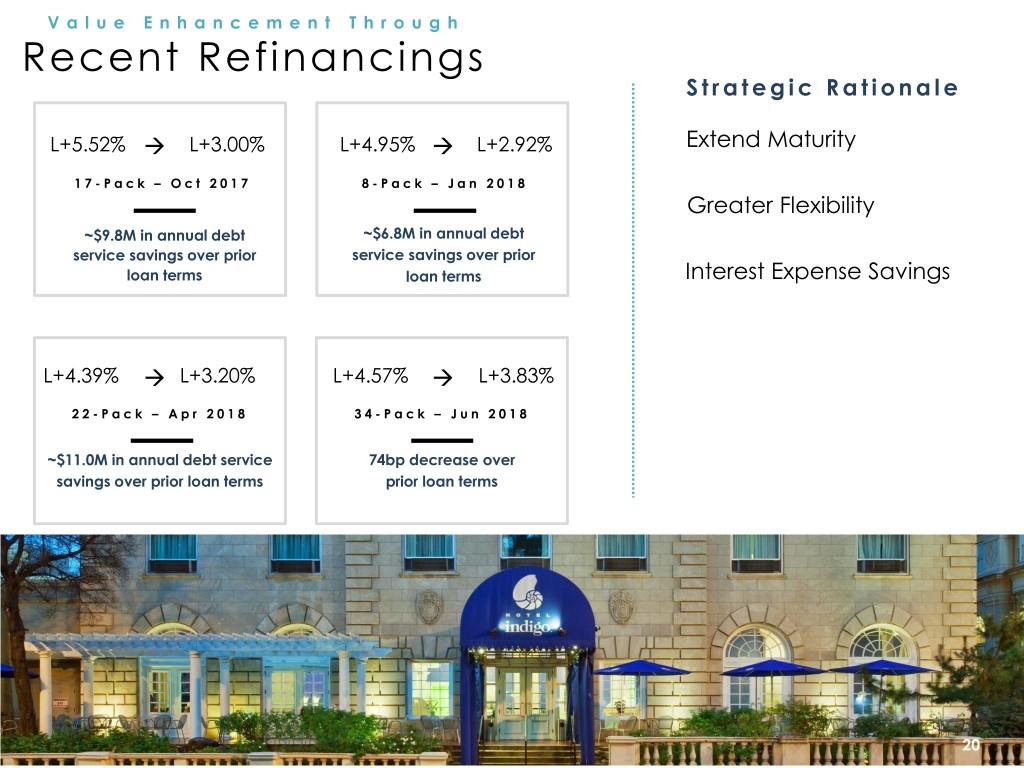
V a l u e E n h a n c e m e n t T h r o u g h Recent Refinancings S t r a t e g i c R a t i o n a l e L+5.52% L+3.00% L+4.95% L+2.92% Extend Maturity 17- P a c k – O c t 2 0 1 7 8 - P a c k – J a n 2 0 1 8 Greater Flexibility ~$9.8M in annual debt ~$6.8M in annual debt service savings over prior service savings over prior loan terms loan terms Interest Expense Savings L+4.39% L+3.20% L+4.57% L+3.83% 22- P a c k – A p r 2 0 1 8 34- P a c k – J u n 2 0 1 8 ~$11.0M in annual debt service 74bp decrease over savings over prior loan terms prior loan terms 20
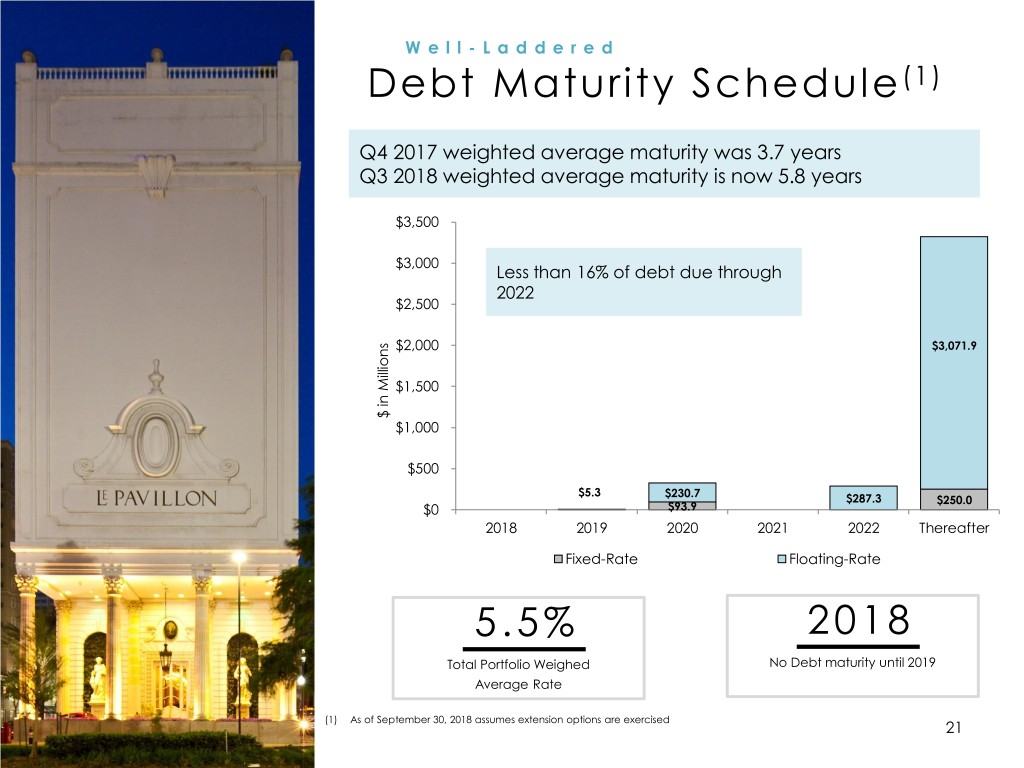
Well- Laddered Debt Maturity Schedule (1) Q4 2017 weighted average maturity was 3.7 years Q3 2018 weighted average maturity is now 5.8 years $3,500 $3,000 Less than 16% of debt due through 2022 $2,500 $2,000 $3,071.9 $1,500 $ in $ Millions $1,000 $500 $5.3 $230.7 $287.3 $250.0 $0 $93.9 2018 2019 2020 2021 2022 Thereafter Fixed-Rate Floating-Rate 5.5% 2018 Total Portfolio Weighed No Debt maturity until 2019 Average Rate (1) As of September 30, 2018 assumes extension options are exercised 21
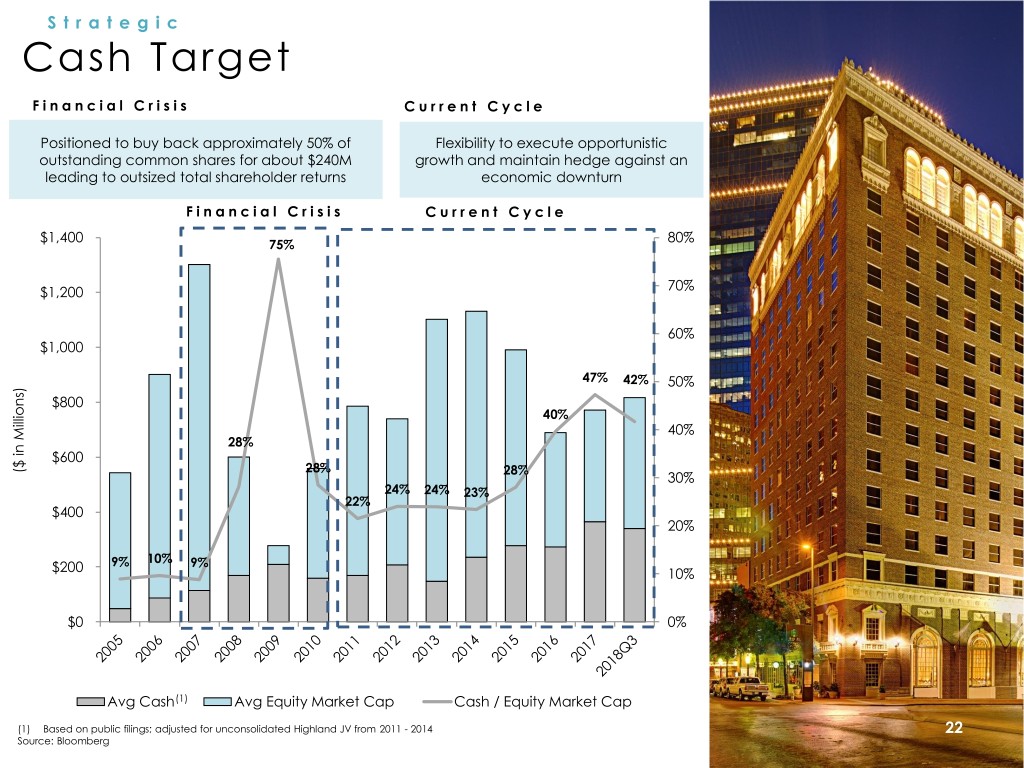
Strategic Cash Target F i n a n c i a l C r i s i s C u r r e n t C y c l e Positioned to buy back approximately 50% of Flexibility to execute opportunistic outstanding common shares for about $240M growth and maintain hedge against an leading to outsized total shareholder returns economic downturn F i n a n c i a l C r i s i s C u r r e n t C y c l e $1,400 80% 75% $1,200 70% 60% $1,000 47% 42% 50% $800 40% 40% 28% $600 ($ ($ inMillions) 28% 28% 30% 24% 24% 23% 22% $400 20% 9% 10% 9% $200 10% $0 0% Avg Cash(1) Avg Equity Market Cap Cash / Equity Market Cap (1) Based on public filings; adjusted for unconsolidated Highland JV from 2011 - 2014 22 Source: Bloomberg
Asset Management Initiatives
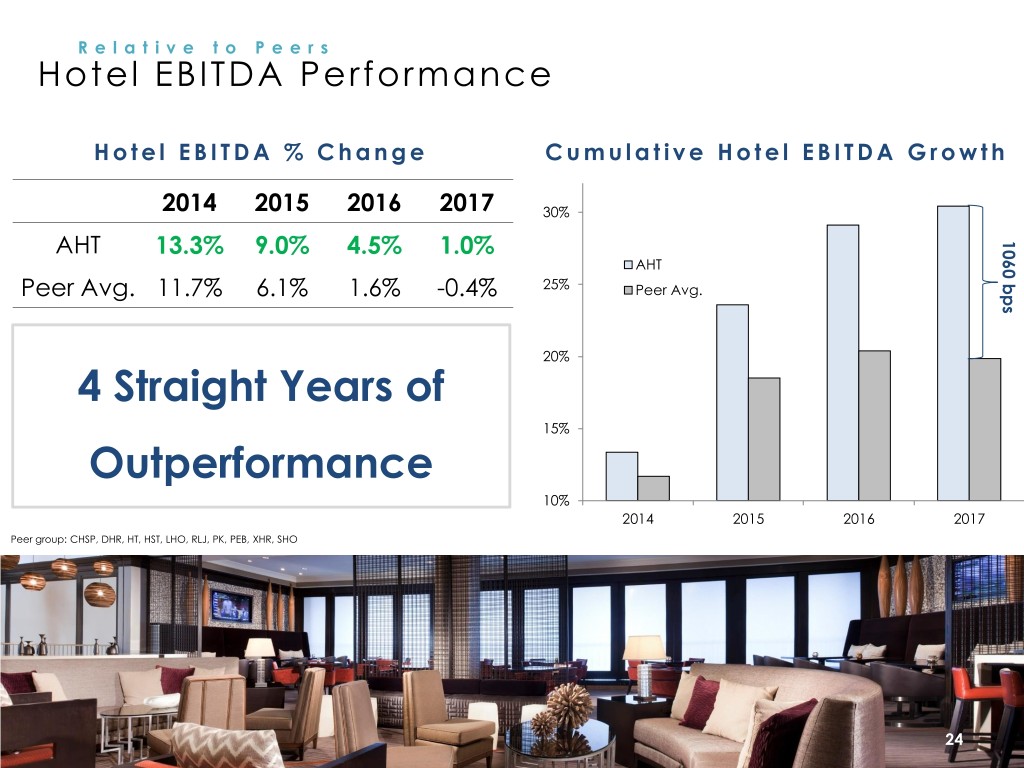
Relative to Peers Hotel EBITDA Performance H o t e l E B I T D A % C h a n g e C u m u l a t i v e H o t e l E B I T D A G r o w t h 2014 2015 2016 2017 30% AHT 13.3% 9.0% 4.5% 1.0% bps 1060 AHT Peer Avg. 11.7% 6.1% 1.6% -0.4% 25% Peer Avg. 20% 4 Straight Years of 15% Outperformance 10% 2014 2015 2016 2017 Peer group: CHSP, DHR, HT, HST, LHO, RLJ, PK, PEB, XHR, SHO 24
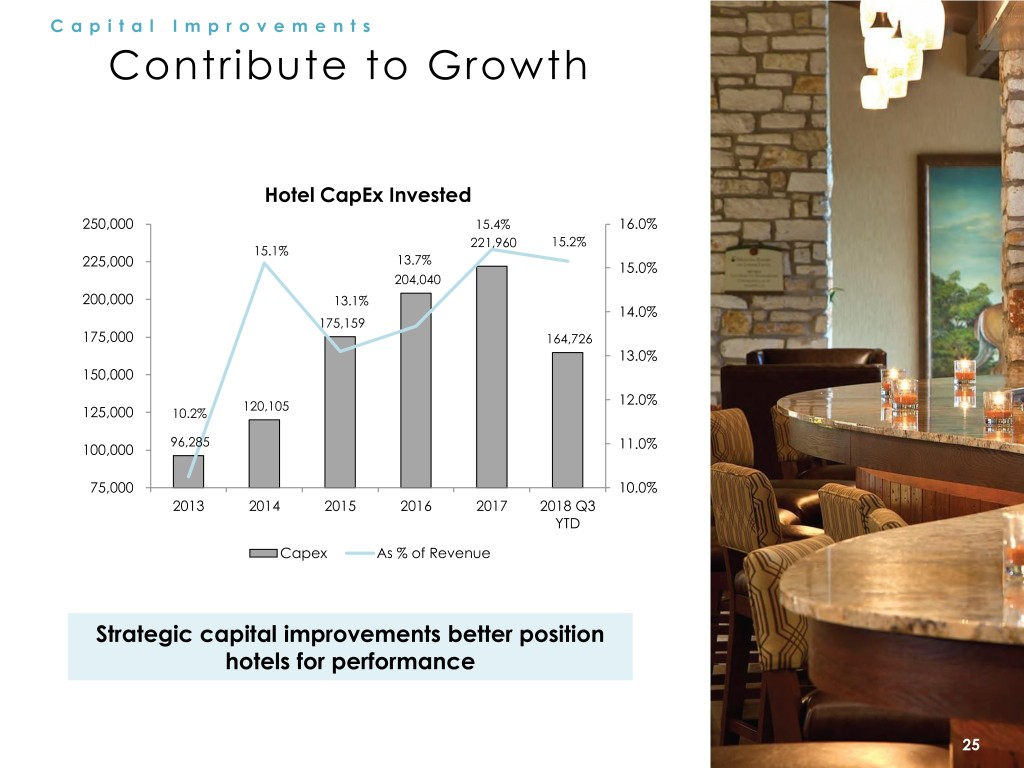
Capital Improvements Contribute to Growth Hotel CapEx Invested 250,000 15.4% 16.0% 221,960 15.2% 15.1% 13.7% 225,000 15.0% 204,040 200,000 13.1% 14.0% 175,159 175,000 164,726 13.0% 150,000 120,105 12.0% 125,000 10.2% 96,285 100,000 11.0% 75,000 10.0% 2013 2014 2015 2016 2017 2018 Q3 YTD Capex As % of Revenue Strategic capital improvements better position hotels for performance 25
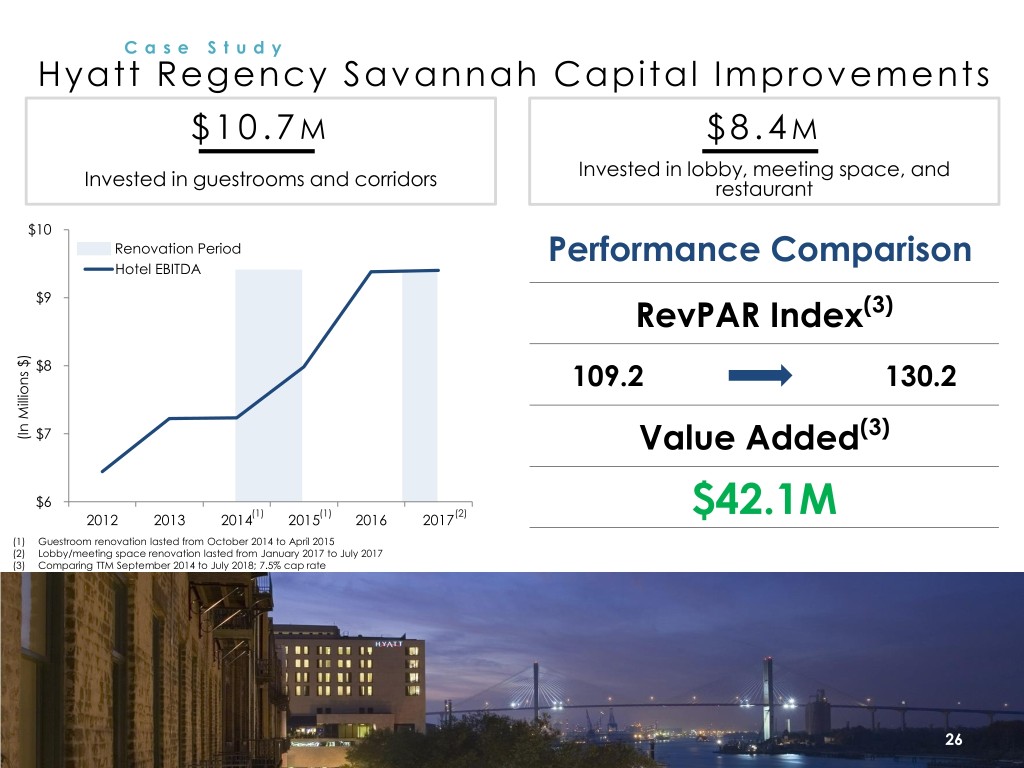
C a s e S t u d y Hyatt Regency Savannah Capital Improvements $ 1 0 . 7 M $ 8 . 4 M Invested in lobby, meeting space, and Invested in guestrooms and corridors restaurant $10 Renovation Period Performance Comparison Hotel EBITDA $9 RevPAR Index(3) $8 109.2 130.2 (3) (In Millions (In $) $7 Value Added $6 (1) (1) (2) 2012 2013 2014 2015 2016 2017 $42.1M (1) Guestroom renovation lasted from October 2014 to April 2015 (2) Lobby/meeting space renovation lasted from January 2017 to July 2017 (3) Comparing TTM September 2014 to July 2018; 7.5% cap rate 26
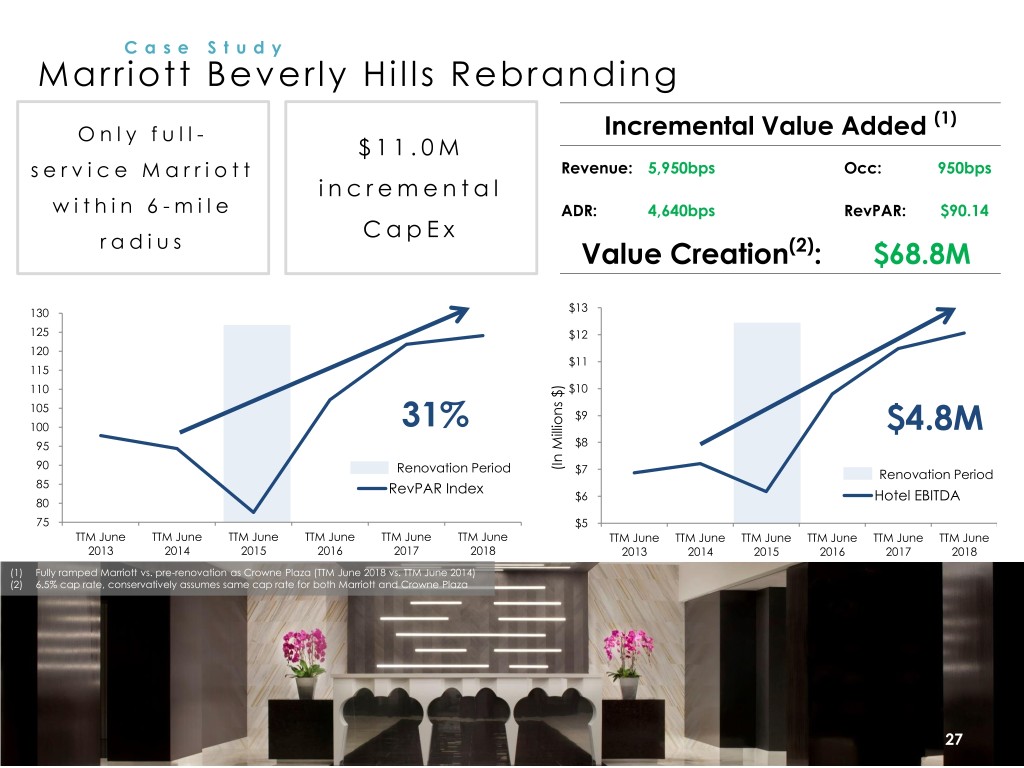
C a s e S t u d y Marriott Beverly Hills Rebranding (1) O n l y f u l l - Incremental Value Added $ 1 1 . 0 M s e r v i c e M a r r i o t t Revenue: 5,950bps Occ: 950bps i n c r e m e n t a l w i t h i n 6 - m i l e ADR: 4,640bps RevPAR: $90.14 C a p E x r a d i u s Value Creation(2): $68.8M 130 $13 125 $12 120 $11 115 110 $10 105 $9 100 31% $4.8M 95 $8 90 Renovation Period Millions (In $) $7 Renovation Period 85 RevPAR Index $6 Hotel EBITDA 80 75 $5 TTM June TTM June TTM June TTM June TTM June TTM June TTM June TTM June TTM June TTM June TTM June TTM June 2013 2014 2015 2016 2017 2018 2013 2014 2015 2016 2017 2018 (1) Fully ramped Marriott vs. pre-renovation as Crowne Plaza (TTM June 2018 vs. TTM June 2014) (2) 6.5% cap rate, conservatively assumes same cap rate for both Marriott and Crowne Plaza 27
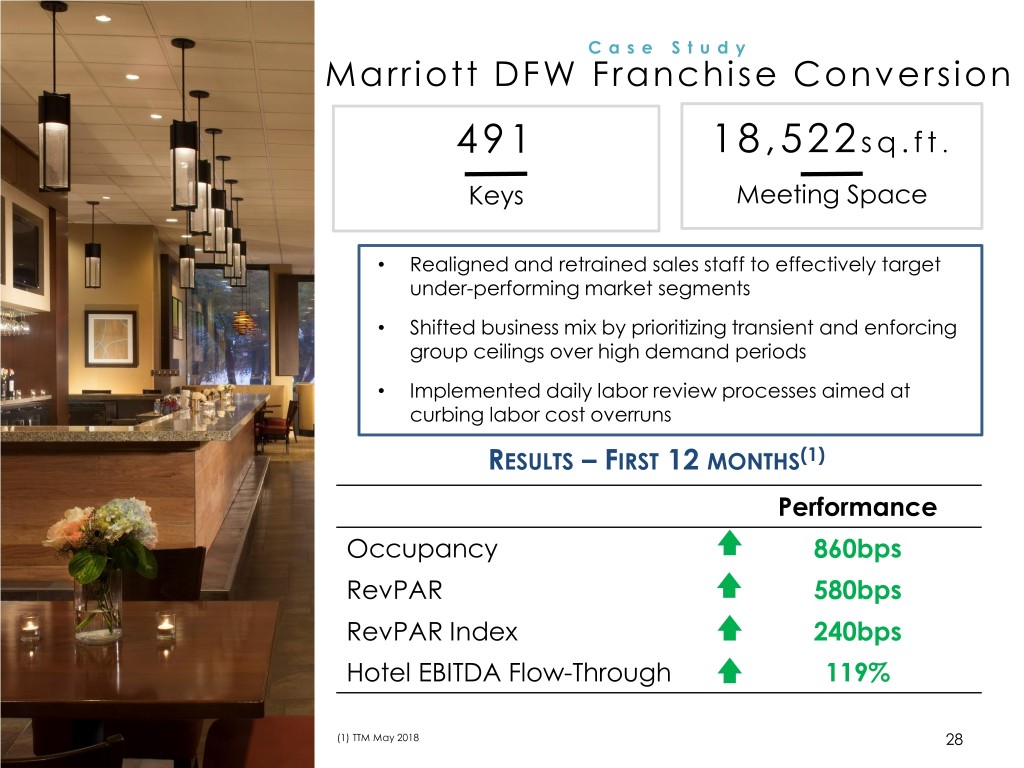
C a s e S t u d y Marriott DFW Franchise Conversion 491 18,522 s q . f t . Keys Meeting Space • Realigned and retrained sales staff to effectively target under-performing market segments • Shifted business mix by prioritizing transient and enforcing group ceilings over high demand periods • Implemented daily labor review processes aimed at curbing labor cost overruns RESULTS – FIRST 12 MONTHS(1) Performance Occupancy 860bps RevPAR 580bps RevPAR Index 240bps Hotel EBITDA Flow-Through 119% (1) TTM May 2018 28
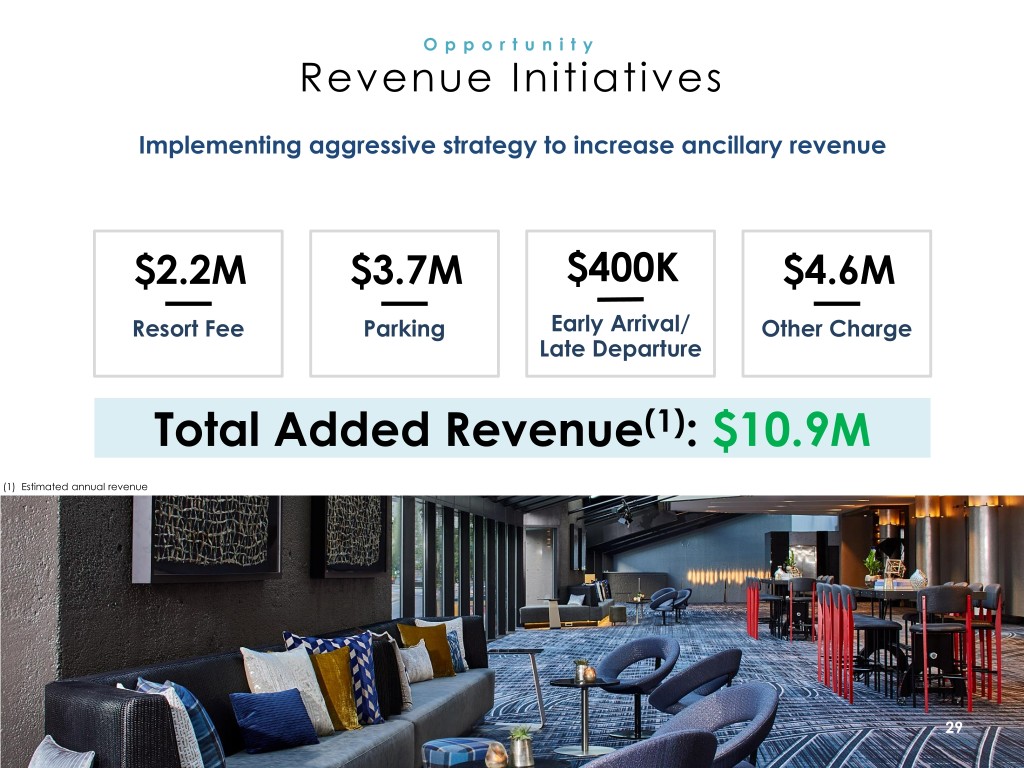
Opportunity Revenue Initiatives Implementing aggressive strategy to increase ancillary revenue $2.2M $3.7M $400K $4.6M Resort Fee Parking Early Arrival/ Other Charge Late Departure Total Added Revenue(1): $10.9M (1) Estimated annual revenue 29
Valuation
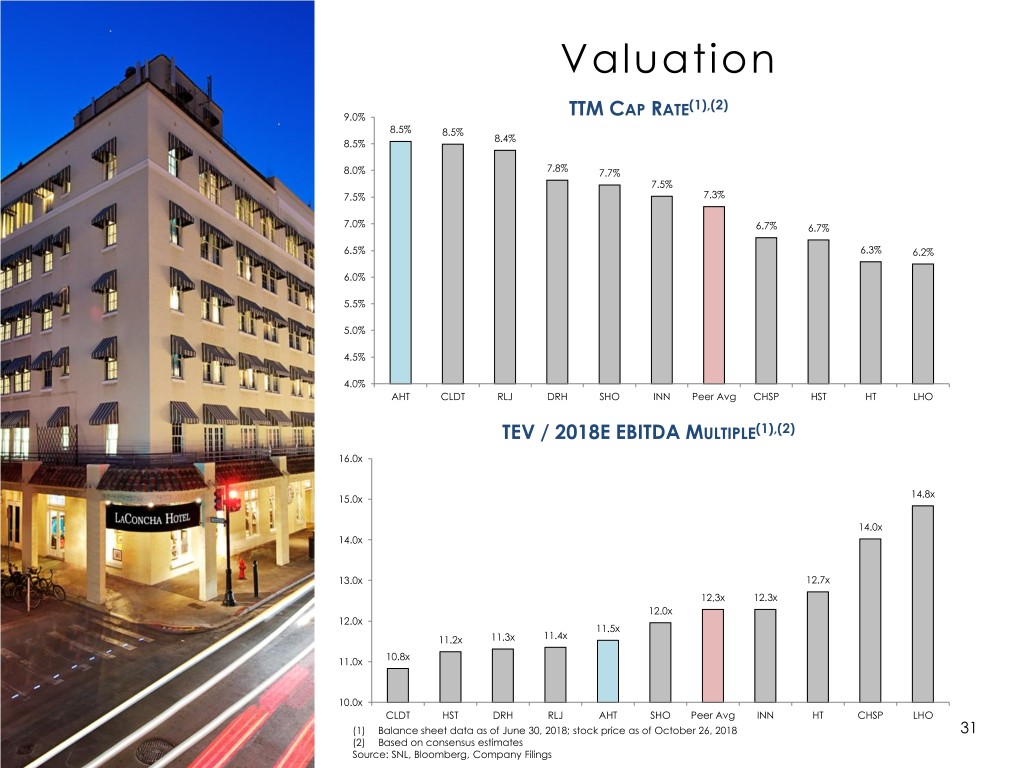
Valuation (1),(2) 9.0% TTM CAP RATE 8.5% 8.5% 8.4% 8.5% 8.0% 7.8% 7.7% 7.5% 7.5% 7.3% 7.0% 6.7% 6.7% 6.5% 6.3% 6.2% 6.0% 5.5% 5.0% 4.5% 4.0% AHT CLDT RLJ DRH SHO INN Peer Avg CHSP HST HT LHO TEV / 2018E EBITDA MULTIPLE(1),(2) 16.0x 14.8x 15.0x 14.0x 14.0x 13.0x 12.7x 12.3x 12.3x 12.0x 12.0x 11.5x 11.2x 11.3x 11.4x 10.8x 11.0x 10.0x CLDT HST DRH RLJ AHT SHO Peer Avg INN HT CHSP LHO (1) Balance sheet data as of June 30, 2018; stock price as of October 26, 2018 31 (2) Based on consensus estimates Source: SNL, Bloomberg, Company Filings
STRATEGIC FOCUS PORTFOLIO QUALITY ERFP PROGRAM DIVIDEND YIELD Reasons to Own Ashford Hospitality Trust ASSET MANAGEMENT TRACK RECORD AFFILIATE ADVANTAGES INSIDER OWNERSHIP

November 2018
