Attached files
| file | filename |
|---|---|
| 8-K - 8-K - MEDLEY MANAGEMENT INC. | a8k-retrospectiveadjustmen.htm |
Exhibit 99.1
The Company's 2017 Annual Report is being revised to reflect the implementation of certain reporting changes related to new accounting policies as described in Item 8.01 of the accompanying Current Report on Form 8-K. The 2017 Annual Report is revised as follows:
• | The information previously set forth under the heading “Item 6. Selected Financial Data” in the 2017 Annual Report is replaced in its entirety by the information set forth below in this Exhibit 99.1 under the heading “Item 6. Selected Financial Data.” |
• | The information previously set forth in each of the sections identified and described below under the heading “Item 7. Management’s Discussion and Analysis of Financial Condition and Results of Operations” in the 2017 Annual Report is replaced in its entirety by the information set forth below in this Exhibit 99.1 in the corresponding sections under the heading of “Item 7. Management’s Discussion and Analysis of Financial Condition and Results of Operations”: |
- Overview
- Results of Operations
- Liquidity and Capital Resources
• | The information previously set forth under the heading “Item 8. Financial Statements and Supplementary Data” in the 2017 Annual Report is replaced in its entirety by the information set forth below in this Exhibit 99.1 under the heading “Item 8. Financial Statements and Supplementary Data.” |
Other than as set forth herein, the 2017 Annual Report remains materially consistent with the Company's previously issued 2017 Annual Report. Those sections of the 2017 Annual Report which have not been revised as set forth herein are not materially impacted by the actions taken described in this Exhibit 99.1 and the accompanying Current Report on Form 8-K and/or have already been updated through the Quarterly Reports on Form 10-Q for the quarters ended March 31 and June 30, 2018 (the “Quarterly Reports on Form 10-Q”), including Risk Factors and the Note Regarding Forward Looking Statements contained in the Quarterly Reports on Form 10-Q, and are not included in this Exhibit 99.1. Accordingly, the revised information set forth in this Exhibit 99.1 should be read in conjunction with the 2017 Annual Report and the Quarterly Reports on Form 10-Q.
1
Item 6. Selected Financial Data
The following selected consolidated financial data presents selected data on the financial condition and results of operations of Medley Management Inc., and for periods prior to September 29, 2014, the financial condition and results of operations of Medley LLC, the predecessor of Medley Management Inc. Medley LLC is considered the predecessor of Medley Management Inc. for accounting purposes, and its consolidated financial statements are the historical financial statements of Medley Management Inc. During fiscal year 2015, we adopted new consolidation guidance which resulted in the deconsolidation of our Consolidated Funds, effective January 1, 2015. Prior to January 1, 2015, we consolidated certain funds in our consolidated financial statements which had a significant gross-up effect on our assets, liabilities and cash flows but no effect on the net income attributable to Medley Management Inc. and non-controlling interests in Medley LLC. This financial data should be read together with “Management's Discussion and Analysis of Financial Condition and Results of Operations” and the historical financial statements and related notes thereto included in this Form 10-K.
We derived the following selected consolidated financial data of Medley Management Inc. as of December 31, 2017 and 2016 and for the years ended December 31, 2017, 2016 and 2015 from the audited consolidated financial statements included in this Form 10-K. The following selected consolidated statement of operations data for the years ended December 31, 2014 and 2013 and the selected financial condition data as of December 31, 2015 were derived from our audited consolidated financial statements not included in this Form 10-K. The following selected financial condition data as of December 31, 2014 and 2013 were derived from our audited consolidated financial statements not included in this Form 10-K, which were adjusted for the adoption of ASU 2015-03, Simplifying the Presentation of Debt Issuance Costs. Effective January 1, 2016, we adopted this new guidance and retrospectively presented debt issuance costs related to our long-term debt as a deduction from the carrying amount of the associated debt on our consolidated balance sheets. As a result of this adoption, we reclassified $2.2 million and $0.3 million as of December 31, 2014 and 2013, respectively, of debt issuance costs from other assets to debt obligations. See Note 2, “Summary of Significant Accounting Policies” to our audited consolidated financial statements included in this Form 10-K for a description of the new guidance.
In connection with the adoption of the new revenue recognition guidance, ASC 606, Revenue from Contracts with Customers, on January 1, 2018, the Company reassessed its accounting policy for performance fees earned during the period which represent a capital allocation to the general partner or investment manager. As a result of this reassessment the Company has determined that it should account for such performance fees within the scope of ASC 323, Investments - Equity Method and Joint Ventures. Accordingly, these performance fees are now classified as carried interest within investment income on the Company's consolidated statements of operations and balances due for such fees are included as a part of equity method investments within Investments, at fair value on the Company's consolidated balance sheets.
For periods prior to the reorganization and IPO on September 29, 2014, all payments made to our senior professionals who are members of Medley LLC, including guaranteed payments, were reflected as distributions from members' capital. Subsequent to the reorganization and IPO, all guaranteed payments made to our senior professionals who are members of Medley LLC are recognized as compensation expense. Prior to our reorganization and IPO, our business was organized as a partnership for tax purposes and was not subject to U.S. federal, state and local corporate income taxes. A provision for income taxes was made for certain entities that were subject to New York City's unincorporated business tax related to taxable income allocated to New York city. As a result of the corporate reorganization and IPO, Medley Management Inc. is subject to U.S. federal, state and local corporate income taxes on its allocable portion of income from Medley LLC at prevailing corporate tax rates.
Our historical results are not necessarily indicative of the results expected for any future period.
For the Years Ended December 31, | |||||||||||||||||||
2017 | 2016 | 2015 | 2014 | 2013 | |||||||||||||||
(Amounts in thousands except share and per share amounts) | |||||||||||||||||||
Statement of Operations Data: | |||||||||||||||||||
Revenues | |||||||||||||||||||
Management fees | $ | 58,104 | $ | 65,496 | $ | 75,675 | $ | 61,252 | $ | 36,446 | |||||||||
Performance fees | (1,974 | ) | 2,443 | (3,055 | ) | 2,050 | 2,412 | ||||||||||||
Other revenues and fees | 9,201 | 8,111 | 7,436 | 8,871 | 5,011 | ||||||||||||||
Investment income (loss): | |||||||||||||||||||
2
Carried interest | 230 | (22 | ) | (12,630 | ) | — | — | ||||||||||||
Other investment loss | (528 | ) | (87 | ) | (833 | ) | (271 | ) | 244 | ||||||||||
Total revenues | 65,033 | 75,941 | 66,593 | 71,902 | 44,113 | ||||||||||||||
Expenses | |||||||||||||||||||
Compensation and benefits | 27,432 | 27,800 | 26,768 | 20,322 | 13,712 | ||||||||||||||
Performance fee compensation | (874 | ) | (319 | ) | (8,049 | ) | (1,543 | ) | 7,192 | ||||||||||
Consolidated Funds expenses | — | — | — | 1,670 | 1,225 | ||||||||||||||
General, administrative and other expenses | 13,045 | 28,540 | 16,836 | 16,312 | 12,655 | ||||||||||||||
Total expenses | 39,603 | 56,021 | 35,555 | 36,761 | 34,784 | ||||||||||||||
Other income (expense) | |||||||||||||||||||
Dividend income | 4,327 | 1,304 | 886 | 886 | 886 | ||||||||||||||
Interest expense | (11,855 | ) | (9,226 | ) | (8,469 | ) | (5,520 | ) | (1,479 | ) | |||||||||
Other income (expenses), net | 1,363 | (983 | ) | (808 | ) | (1,502 | ) | (727 | ) | ||||||||||
Interest and other income of Consolidated Funds | — | — | — | 71,468 | 52,550 | ||||||||||||||
Interest expense of Consolidated Funds | — | — | — | (9,951 | ) | (2,638 | ) | ||||||||||||
Net realized gain (loss) on investments of Consolidated Funds | — | — | — | 789 | (16,080 | ) | |||||||||||||
Net change in unrealized depreciation on investments of Consolidated Funds | — | — | — | (20,557 | ) | (3,361 | ) | ||||||||||||
Net change in unrealized depreciation (appreciation) on secured borrowings of Consolidated Funds | — | — | — | 1,174 | (306 | ) | |||||||||||||
Total other income (expense), net | (6,165 | ) | (8,905 | ) | (8,391 | ) | 36,787 | 28,845 | |||||||||||
Income before income taxes | 19,265 | 11,015 | 22,647 | 71,928 | 38,174 | ||||||||||||||
Provision for income taxes | 1,956 | 1,063 | 2,015 | 2,528 | 1,639 | ||||||||||||||
Net income | 17,309 | 9,952 | 20,632 | 69,400 | 36,535 | ||||||||||||||
Net income attributable to non-controlling interests in Consolidated Funds | — | — | — | 29,717 | 12,898 | ||||||||||||||
Net income (loss) attributable to redeemable non-controlling interests and non-controlling interests in consolidated subsidiaries | 6,718 | 2,549 | (885 | ) | 1,933 | — | |||||||||||||
Net income attributable to non-controlling interests in Medley LLC | 9,664 | 6,406 | 18,406 | 36,055 | $ | 23,637 | |||||||||||||
Net income attributable to Medley Management Inc. | $ | 927 | $ | 997 | $ | 3,111 | $ | 1,695 | |||||||||||
Per share data: | |||||||||||||||||||
Dividends declared per Class A common stock | $ | 0.80 | $ | 0.80 | $ | 0.60 | $ | 0.20 | |||||||||||
Net income per Class A common stock - Basic and Diluted | $ | 0.07 | $ | 0.02 | $ | 0.46 | $ | 0.24 | (1) | ||||||||||
Weighted average shares outstanding - Basic and Diluted | 5,553,026 | 5,804,042 | 6,002,422 | 6,000,000 | |||||||||||||||
(1) | Based on net income attributable to Medley Management Inc. for the period September 29, 2014 through December 31, 2014. |
3
As of December 31, | |||||||||||||||||||
2017 | 2016 | 2015 | 2014 | 2013 | |||||||||||||||
(Amounts in thousands) | |||||||||||||||||||
Balance Sheet Data: | |||||||||||||||||||
Assets | |||||||||||||||||||
Cash and cash equivalents | $ | 36,327 | $ | 49,666 | $ | 71,688 | $ | 87,206 | $ | 5,395 | |||||||||
Restricted cash equivalents | — | 4,897 | — | — | — | ||||||||||||||
Investments, at fair value | 56,632 | 31,904 | 16,360 | 9,901 | 10,173 | ||||||||||||||
Management fees receivable | 14,714 | 12,630 | 16,172 | 15,173 | 8,921 | ||||||||||||||
Performance fees receivable | 2,987 | 4,961 | 2,518 | 5,573 | 3,339 | ||||||||||||||
Other assets | 17,262 | 18,311 | 13,015 | 7,058 | 4,971 | ||||||||||||||
Assets of Consolidated Funds: | |||||||||||||||||||
Cash and cash equivalents | — | — | — | 38,111 | 60,355 | ||||||||||||||
Investments, at fair value | — | — | — | 734,870 | 453,396 | ||||||||||||||
Interest and dividends receivable | — | — | — | 6,654 | 2,969 | ||||||||||||||
Other assets | — | — | — | 3,681 | 436 | ||||||||||||||
Total assets | $ | 127,922 | $ | 122,369 | $ | 119,753 | $ | 908,227 | $ | 549,955 | |||||||||
Liabilities and Equity | |||||||||||||||||||
Loans payable | $ | 9,233 | $ | 52,178 | $ | 100,871 | $ | 100,885 | $ | 27,653 | |||||||||
Senior unsecured debt | 116,892 | 49,793 | — | — | — | ||||||||||||||
Accounts payable, accrued expenses and other liabilities | 25,130 | 37,255 | 36,569 | 39,390 | 33,838 | ||||||||||||||
Liabilities of Consolidated Funds: | |||||||||||||||||||
Accounts payable, accrued expenses and other liabilities | — | — | — | 5,767 | 1,325 | ||||||||||||||
Secured borrowings | — | — | — | 141,135 | 41,178 | ||||||||||||||
Total liabilities | 151,255 | 139,226 | 137,440 | 287,177 | 103,994 | ||||||||||||||
Redeemable Non-controlling Interests | 53,741 | 30,805 | — | — | — | ||||||||||||||
Equity | |||||||||||||||||||
Total stockholders' equity (deficit), Medley Management Inc. | (7,971 | ) | (1,853 | ) | (39 | ) | (2,052 | ) | — | ||||||||||
Non-controlling interests in Consolidated Funds | — | — | — | 625,548 | 464,475 | ||||||||||||||
Non-controlling interests in consolidated subsidiaries | (1,702 | ) | (1,717 | ) | (459 | ) | 1,526 | 40 | |||||||||||
Non-controlling interests in Medley LLC | (67,401 | ) | (44,092 | ) | (17,189 | ) | (3,972 | ) | — | ||||||||||
Medley LLC members' deficit prior to reorganization | — | — | — | — | (18,554 | ) | |||||||||||||
Total (deficit) equity | (77,074 | ) | (47,662 | ) | (17,687 | ) | 621,050 | 445,961 | |||||||||||
Total liabilities, redeemable non-controlling interests and equity | $ | 127,922 | $ | 122,369 | $ | 119,753 | $ | 908,227 | $ | 549,955 | |||||||||
Item 7. Management's Discussion and Analysis of Financial Condition and Results of Operations
The following discussion and analysis should be read in conjunction with our audited consolidated financial statements and related notes as of December 31, 2017 and 2016 and for the years ended December 31, 2017, 2016 and 2015 included in this Form 10-K.
4
Overview
We are an alternative asset management firm offering yield solutions to retail and institutional investors. We focus on credit-related investment strategies, primarily originating senior secured loans to private middle market companies in the U.S. that have revenues between $50 million and $1 billion. We generally hold these loans to maturity. Our national direct origination franchise provides capital to the middle market in the U.S. Over the past 16 years, we have provided capital to over 400 companies across 35 industries in North America.
We manage three permanent capital vehicles, two of which are BDCs and one interval fund, as well as long-dated private funds and SMAs, focusing on senior secured credit.
• | Permanent capital vehicles: MCC, SIC and STRF, have a total AUM of $2.3 billion as of December 31, 2017. |
• | Long-dated private funds and SMAs: MOF II, MOF III, MOF III Offshore, Tac Ops, MCOF, Aspect and SMAs, have a total AUM of $2.9 billion as of December 31, 2017. |
As of December 31, 2017, we had $5.2 billion of AUM, $2.3 billion in permanent capital vehicles and $2.9 billion in long-dated private funds and SMAs. Our year over year AUM decline as of December 31, 2017 was 3% and was driven in large part by income and return of capital distributions, offset in part by the growth of our long-dated private funds and SMAs. Our compounded annual AUM growth rate from December 31, 2010 through December 31, 2017 was 26% and our compounded annual Fee Earning AUM growth rate was 19%, both of which have been driven in large part by the growth in our permanent capital vehicles. As of December 31, 2017, we had $3.2 billion of Fee Earning AUM, $2.1 billion in permanent capital vehicles and $1.1 billion in long-dated private funds and SMAs. Typically the investment periods of our institutional commitments range from 18 to 24 months and we expect our Fee Earning AUM to increase as capital commitments included in AUM are invested.
In general, our institutional investors do not have the right to withdraw capital commitments and, to date, we have not experienced any withdrawals of capital commitments. For a description of the risk factor associated with capital commitments, see “Risk Factors – Third-party investors in our private funds may not satisfy their contractual obligation to fund capital calls when requested, which could adversely affect a fund’s operations and performance” included in this Annual Report on Form 10-K.
Direct origination, careful structuring and active monitoring of the loan portfolios we manage are important success factors in our business, which can be adversely affected by difficult market and political conditions, such as the turmoil in the global capital markets from 2007 to 2009. Since our inception in 2006, we have adhered to a disciplined investment process that employs these principles with the goal of delivering strong risk-adjusted investment returns while protecting investor capital. We believe that our ability to directly originate, structure and lead deals enables us to achieve these goals. In addition, the loans we manage generally have a contractual maturity of between three and seven years and are typically floating rate, which we believe positions our business well for rising interest rates.
The significant majority of our revenue is derived from management fees, which include base management fees earned on all of our investment products as well as Part I incentive fees earned from our permanent capital vehicles and certain of our long-dated private funds. Our base management fees are generally calculated based upon fee earning assets and paid quarterly in cash. Our Part I incentive fees are typically calculated based upon net investment income, subject to a hurdle rate, and are also paid quarterly in cash.
We also may earn performance fees from our long-dated private funds and SMAs. Typically, these performance fees are 15.0% to 20.0% of the total return above a hurdle rate. These performance fees are accrued quarterly and paid after the return of all invested capital and an amount sufficient to achieve the hurdle rate of return.
We also may receive incentive fees related to realized capital gains in our permanent capital vehicles and certain of our long-dated private funds that we refer to as Part II incentive fees. Part II incentive fees are payable annually and are calculated at the end of each applicable year by subtracting (i) the sum of cumulative realized capital losses and unrealized capital depreciation from (ii) cumulative aggregate realized capital gains. If the amount calculated is positive, then the Part II incentive fee for such year is equal to 20% of such amount, less the aggregate amount of Part II incentive fees paid in all prior years. If such amount is negative, then no Part II incentive fee will be payable for such year. As our investment strategy is focused on generating yield from senior secured credit, historically we have not generated Part II incentive fees.
For the years ended December 31, 2017, 2016 and 2015, 87%, 89% and 90%, respectively, of our revenues were generated from management fees and performance fees derived primarily from net interest income on senior secured loans.
Our primary expenses are compensation to our employees and general, administrative and other expenses. Compensation includes salaries, discretionary bonuses, stock-based compensation and benefits paid and payable to our employees. Performance fee compensation is related to performance fees, generally consisting of incentive allocations in our long-dated private funds that we grant to certain of our professionals. General and administrative expenses include costs primarily related to professional services, office rent and related expenses, depreciation and amortization, travel and related expenses, information technology, communication
5
and information services, placement fees and third-party marketing expenses, other general operating items, and, in 2016, expense support agreement expenses related to SIC.
Reorganization and Initial Public Offering
Medley Management Inc. was incorporated on June 13, 2014 and commenced operations on September 29, 2014 upon the completion of its IPO of its Class A common stock. We raised $100.4 million, net of underwriting discounts, through the issuance of 6,000,000 shares of Class A common stock at a public offering price of $18.00 per share. The offering proceeds were used to purchase 6,000,000 newly issued LLC Units from Medley LLC. Prior to the IPO, Medley Management Inc. had not engaged in any business or other activities except in connection with its formation and IPO.
In connection with the IPO, Medley Management Inc. issued 100 shares of Class B common stock to Medley Group LLC (“Medley Group”), an entity wholly owned by the pre-IPO members of Medley LLC. For so long as the pre-IPO members and then-current Medley personnel hold at least 10% of the aggregate number of shares of Class A common stock and LLC Units (excluding those LLC Units held by Medley Management Inc.) then outstanding, the Class B common stock entitles Medley Group to a number of votes that is equal to 10 times the aggregate number of LLC Units held by all non-managing members of Medley LLC that do not themselves hold shares of Class B common stock and entitle each other holder of Class B common stock, without regard to the number of shares of Class B common stock held by such other holder, to a number of votes that is equal to 10 times the number of membership units held by such holder.
In connection with the IPO, Medley LLC amended and restated its limited liability agreement to modify its capital structure by reclassifying the 23,333,333 interests held by the pre-IPO members into a single new class of units. The pre-IPO members also entered into an exchange agreement under which they (or certain permitted transferees thereof) have the right, subject to the terms of the exchange agreement, to exchange their LLC Units for shares of Medley Management Inc.’s Class A common stock on a one-for-one basis, subject to customary conversion rate adjustments for stock splits, stock dividends and reclassifications. In addition, pursuant to the amended and restated limited liability agreement, Medley Management Inc. became the sole managing member of Medley LLC.
Our Structure
Medley Management Inc. is a holding company and its sole material asset is a controlling equity interest in Medley LLC. Medley Management Inc. operates and controls all of the business and affairs and consolidates the financial results of Medley LLC and its subsidiaries. We and our pre-IPO owners have also entered into an exchange agreement under which they (or certain permitted transferees) have the right (subject to the terms of the exchange agreement), to exchange their LLC Units for shares of our Class A common stock on a one-for-one basis, subject to customary conversion rate adjustments for stock splits, stock dividends and reclassifications.
Medley Group LLC, an entity wholly-owned by our pre-IPO owners, holds all 100 issued and outstanding shares of our Class B common stock. For so long as our pre-IPO owners and then-current Medley personnel hold at least 10% of the aggregate number of shares of Class A common stock and LLC Units (excluding those LLC Units held by Medley Management Inc.), which we refer to as the “Substantial Ownership Requirement,” the Class B common stock entitles Medley Group LLC, without regard to the number of shares of Class B common stock held by it, to a number of votes that is equal to 10 times the aggregate number of LLC Units held by all non-managing members of Medley LLC that do not themselves hold shares of Class B common stock and entitle each other holder of Class B common stock, without regard to the number of shares of Class B common stock held by such other holder, to a number of votes that is equal to 10 times the number of LLC Units held by such holder. For purposes of calculating the Substantial Ownership Requirement, (1) shares of Class A common stock deliverable to our pre-IPO owners and then-current Medley personnel pursuant to outstanding equity awards will be deemed then outstanding and (2) shares of Class A common stock and LLC Units held by any estate, trust, partnership or limited liability company or other similar entity of which any pre-IPO owner or then-current Medley personnel, or any immediate family member thereof, is a trustee, partner, member or similar party will be considered held by such pre-IPO owner or other then-current Medley personnel. From and after the time that the Substantial Ownership Requirement is no longer satisfied, the Class B common stock will entitle Medley Group LLC, without regard to the number of shares of Class B common stock held by it, to a number of votes that is equal to the aggregate number of LLC Units held by all non-managing members of Medley LLC that do not themselves hold shares of Class B common stock and entitle each other holder of Class B common stock, without regard to the number of shares of Class B common stock held by such other holder, to a number of votes that is equal to the number of LLC Units held by such holder. At the completion of our IPO, our pre-IPO owners were comprised of all of the non-managing members of Medley LLC. However, Medley LLC may in the future admit additional non-managing members that would not constitute pre-IPO owners. If at any time the ratio at which LLC Units are exchangeable for shares of our Class A common stock changes from one-for-one as set forth in the Exchange Agreement, the number of votes to which Class B common stockholders are entitled will be adjusted accordingly. Holders of shares of our Class B common stock will vote together with holders of our Class A common stock as a single class on all matters on which stockholders are entitled to vote generally, except as otherwise required by law.
6
Other than Medley Management Inc., holders of LLC Units, including our pre-IPO owners, are, subject to limited exceptions, prohibited from transferring any LLC Units held by them upon consummation of our IPO, or any shares of Class A common stock received upon exchange of such LLC Units, until the third anniversary of our IPO without our consent. Thereafter and prior to the fourth and fifth anniversaries of our IPO, such holders may not transfer more than 33 1/3% and 66 2/3%, respectively, of the number of LLC Units held by them upon consummation of our IPO, together with the number of any shares of Class A common stock received by them upon exchange therefor, without our consent. While this agreement could be amended or waived by us, our pre-IPO owners have advised us that they do not intend to seek any waivers of these restrictions.
The diagram below depicts our organizational structure (excluding those operating subsidiaries with no material operations or assets) as of March 7, 2018:
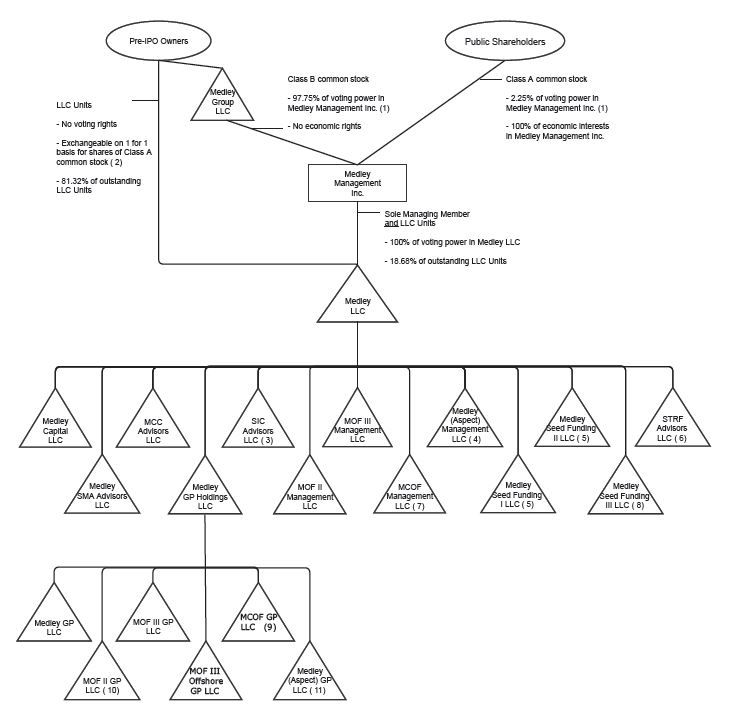
(1) | The Class B common stock provides Medley Group LLC with a number of votes that is equal to 10 times the aggregate number of LLC Units held by all non-managing members of Medley LLC. From and after the time that the Substantial Ownership Requirement is no longer satisfied, the Class B common stock will provide Medley Group LLC with a number of votes that is equal to the aggregate number of LLC Units held by all non-managing members of Medley LLC that do not themselves hold shares of Class B common stock. |
(2) | If our pre-IPO owners exchanged all of their vested LLC Units for shares of Class A common stock, they would hold 81.32% of the outstanding shares of Class A common stock, entitling them to an equivalent percentage of economic interests and voting power in Medley Management Inc., Medley Group LLC would hold no voting power or economic interests in Medley Management Inc. and Medley Management Inc. would hold 100% of outstanding LLC Units and 100% of the voting power in Medley LLC. |
7
(3) | Strategic Capital Advisory Services, LLC owns 20% of SIC Advisors LLC and is entitled to receive distributions of up to 20% of the gross cash proceeds received by SIC Advisors LLC from the management and incentive fees payable by Sierra Income Corporation to SIC Advisors LLC, net of certain expenses, as well as 20% of the returns of the investments held at SIC Advisors LLC. |
(4) | Medley LLC holds 96.5% of the Class B economic interests in Medley (Aspect) Management LLC. |
(5) | Medley LLC holds 100% of the outstanding Common Interest, and DB Med Investor I LLC holds 100% of the outstanding Preferred Interest in each of Medley Seed Funding I LLC and Medley Seed Funding II LLC. |
(6) | Medley Seed Funding III LLC holds 100% of the Senior Preferred Interest, Strategic Capital Advisory Services, LLC holds 100% of the Junior Preferred Interest and Medley LLC holds 100% of the Common Interest in STRF Advisors LLC. |
(7) | Medley LLC holds 95.5% of the Class B economic interests in MCOF Management LLC. |
(8) | Medley LLC holds 100% of the outstanding Common Interest, and DB MED Investor II LLC holds 100% of the outstanding Preferred Interest in Medley Seed Funding III LLC. |
(9) | Medley GP Holdings LLC holds 95.5% of the Class B economic interests in each of MCOF GP LLC. |
(10) | Certain employees, former employees and former members of Medley LLC hold approximately 40% of the limited liability company interests in MOF II GP LLC, the entity that serves as general partner of MOF II, entitling the holders to share the performance fees earned from MOF II. |
(11) | Medley LLC holds 96.5% of the Class B economic interests in Medley (Aspect) GP LLC. |
Trends Affecting Our Business
Our results of operations, including the fair value of our AUM, are affected by a variety of factors, including conditions in the global financial markets as well as economic and political environments, particularly in the U.S.
During 2017, the domestic economy exhibited continued growth, and key financial market indicators generated positive readings. Coincident with improving economic growth, LIBOR rates have increased, while credit spreads have tightened. Across the lending spectrum, year over year loan issuance has increased, driven by several factors, including robust merger and acquisition activity, as well as significant refinance activity. Our platform provides us the ability to lend across the capital structure and at varying interest rates providing our firm access to a larger borrower subset over time.
In addition to these macroeconomic trends and market factors, our future performance is dependent on our ability to attract new capital. We believe the following factors will influence our future performance:
• | The extent to which investors favor directly originated private credit investments. Our ability to attract additional capital is dependent on investors’ views of directly originated private credit investments relative to traditional assets. We believe fundraising efforts will continue to be impacted by certain fundamental asset management trends that include: (i) the increasing importance of directly originated private credit investment strategies for institutional investors; (ii) increasing demand for directly originated private credit investments from retail investors; (iii) recognition by the consultant channel, which serves endowment and pension fund investors, that directly originated private credit is an important component of asset allocation; (iv) increasing demand from insurance companies seeking alternatives to investing in the liquid credit markets; and (v) de-leveraging of the global banking system, bank consolidation and increased bank regulatory requirements. |
• | Our ability to generate strong, stable returns and retain investor capital throughout market cycles. The capital we are able to attract and retain drives the growth of our AUM, fee earning AUM and management fees. We believe we are well positioned to invest through market cycles given our AUM is in either permanent capital vehicles or long-dated private funds and SMAs. |
• | Our ability to source investments with attractive risk-adjusted returns. Our ability to grow our revenue is dependent on our continued ability to source attractive investments and deploy the capital that we have raised. We believe that the current economic environment provides attractive investment opportunities. Our ability to identify attractive investments and execute on those investments is dependent on a number of factors, including the general macroeconomic environment, valuation, size and the liquidity of these investment opportunities. A significant decrease in the quality or quantity of investment opportunities in the directly originated private credit market, a substantial increase in corporate default rates, an increase in competition from new entrants providing capital to the private debt market and a decrease in recovery rates of directly originated private credit could adversely affect our ability to source investments with attractive risk-adjusted returns. |
• | The attractiveness of our product offering to investors. We believe defined contribution plans, retail investors, public institutional investors, pension funds, endowments, sovereign wealth funds and insurance companies are increasing exposure to directly originated private credit investment products to seek differentiated returns and current yield. Our permanent capital vehicles and long-dated private funds and SMAs benefit from this demand by offering institutional and retail investors the ability to invest in our private credit investment strategy. We believe that the breadth, diversity and number of investment vehicles we offer allow us to maximize our reach with investors. |
• | The strength of our investment process, operating platform and client servicing capabilities. Following the most recent financial crisis, investors in alternative investments, including those managed by us, have heightened their focus on matters such as manager due diligence, reporting transparency and compliance infrastructure. Since inception, we have invested heavily in our investment monitoring systems, compliance and enterprise risk |
8
management systems to proactively address investor expectations and the evolving regulatory landscape. We believe these investments in operating infrastructure will continue to support our growth in AUM.
Components of Our Results of Operations
Management Fees. Management fees include both base management fees as well as Part I incentive fees.
• | Base Management Fees. Base management fees are generally based on a defined percentage of (i) average or total gross assets, including assets acquired with leverage, (ii) total commitments, (iii) net invested capital, (iv) NAV or (v) lower of cost or market value of a fund’s portfolio investments. These fees are calculated quarterly and are paid in cash in advance or in arrears. Base management fees are recognized as revenue in the period advisory services are rendered, subject to our assessment of collectability. |
In addition, we also receive non asset-based management fees that may include special fees such as origination fees, transaction fees and similar fees paid to us in connection with portfolio investments of our funds. These fees are specific to particular transactions and the contractual terms of the portfolio investments, and are recognized when earned.
• | Part I Incentive Fees. We also include Part I incentive fees that we receive from our permanent capital vehicles and certain of our long-dated private funds in management fees. Part I incentive fees are paid quarterly, in cash, and are driven primarily by net interest income on senior secured loans. As it relates to MCC, these fees are subject to netting against realized and unrealized losses. We are primarily an asset manager of yield-oriented products and our incentive fees are primarily derived from spread income rather than trading or capital gains. In addition, we also carefully manage interest rate risk. We are generally positioned to benefit from a raising rate environment, which should benefit fees paid to us from our vehicles and funds. |
Performance Fees. Performance fees are contractual fees which do not represent a capital allocation to the general partner or investment manager that are earned based on the performance of certain funds, typically our separately managed accounts. Performance fees are earned based on the fund performance during the period, subject to the achievement of minimum return levels in accordance with the respective terms set out in each fund’s investment management agreement.
Prior to the adoption of the new revenue recognition standard on January 1, 2018, we accounted for contractual based performance fees under Method 2 of ASC 605, Revenue Recognition, for revenue based on a formula. Under this method, performance fees for any period were based upon an assumed liquidation of the underlying fund's net assets on the reporting date and were subject to reversal to the extent that cumulative previously recognized performance fees exceeded the amount due to the general partner or investment manager based on a fund's cumulative investment returns. Effective January 1, 2018, we account for such performance fees in accordance with ASC 606, Revenue from Contracts with Customers, and will only recognize contractual based performance fees when it is probable that a significant reversal of such fees will not occur in the future.
The timing and amount of performance fees generated by our funds is uncertain. If we were to have a realization event in a particular quarter or year, it may have a significant impact on our results for that particular quarter or year that may not be replicated in subsequent periods. Refer to “Risk Factors — Risks Related to Our Business and Industry” included in this Annual Report on Form 10-K.
• | Part II Incentive Fees. For our permanent capital vehicles and certain of our long-dated private funds, Part II incentive fees generally represent 20.0% of each fund’s cumulative realized capital gains (net of realized capital losses and unrealized capital depreciation). We have not received these fees historically, and do not expect such fees to be material in the future given our focus on senior secured lending. |
Other Revenues and Fees. We provide administrative services to certain of our vehicles that are reported as other revenues and fees. Such fees are recognized as revenue in the period that administrative services are rendered. These fees are generally based on expense reimbursements for the portion of overhead and other expenses incurred by certain professionals directly attributable to each respective fund. These fees are reported within total revenues in our consolidated financial statements included in this Form 10-K.
Carried Interest. Carried interest are performance based fees that represent a capital allocation of income to the general partner or investment manager. Carried interest is allocated to us based on cumulative fund performance to date, subject to the achievement of minimum return levels in accordance with the respective terms set out in each fund’s governing documents.
Prior to January 1, 2018, we accounted for carried interest under Method 2 of ASC 605, as previously described above. Upon adoption of the new revenue recognition standard, we reassessed our accounting policy for carried interest, and determined that carried interest is within the scope of the accounting for equity method investments, and, as such, is not within the scope of the new revenue recognition guidance. Under the equity method of accounting, we will record carried interest in a consistent manner as we historically had which is based upon an assumed liquidation of that fund's net assets as of the reporting date, regardless of whether such amounts have been realized. For any given period, carried interest on our condensed consolidated statements of
9
operations may include reversals of previously recognized carried interest due to a decrease in the value of a particular fund that results in a decrease of cumulative carried interest earned to date. Since fund return hurdles are cumulative, previously recognized fees also may be reversed in a period of appreciation that is lower than the particular fund's hurdle rate.
Carried interest received in prior periods may be required to be returned by us in future periods if the funds’ investment performance declines below certain levels. Each fund is considered separately in this regard and, for a given fund, carried interest can never be negative over the life of a fund. If upon a hypothetical liquidation of a fund’s investments, at their then current fair values, previously recognized and distributed carried interest would be required to be returned, a liability is established for the potential clawback obligation. As of December 31, 2018, we have not received any carried interest distributions, except for tax distributions related to our allocation of net income, which included an allocation of carried interest. Pursuant to the organizational documents of each respective fund, a portion of these tax distributions may be subject to clawback. As of December 31, 2018, we have accrued $7.2 million for clawback obligations that would need to be paid if the funds were liquidated at fair value as of the end of the reporting period. Our actual obligation, however, would not become payable or realized until the end of a fund’s life.
Other Investment Income. Other investment income is comprised of unrealized appreciation (depreciation) resulting from changes in fair value of our equity method investments in addition to the income and expense allocations from such investments.
In certain cases, the entities that receive management and incentive fees from our funds are owned by Medley LLC together with other persons. See “Critical Accounting Policies” and Note 2, “Summary of Significant Accounting Policies,” to our consolidated financial statements included in this Form 10-K for additional information regarding the manner in which management fees, performance fees and other fees are generated.
Expenses
Compensation and Benefits. Compensation and benefits consists primarily of salaries, discretionary bonuses and benefits paid and payable to our employees. Compensation also includes stock-based compensation associated with the grants of equity-based awards to our employees. Compensation expense relating to equity based awards are measured at fair value as of the grant date, reduced for actual forfeitures when they occur, and expensed over the vesting period on a straight-line basis. Bonuses are accrued over the service period to which they relate.
Guaranteed payments made to our senior professionals who are members of Medley LLC are recognized as compensation expense. The guaranteed payments to our Co-Chief Executive Officers are performance based and periodically set subject to maximums based on our total assets under management. Such maximums aggregated to $2.5 million for each of the Co-Chief Executive Officers for the years ended December 31, 2017, 2016 and 2015. During the years ended December 31, 2017, 2016 and 2015, neither of our Co-Chief Executive Officers received any guaranteed payments.
Performance Fee Compensation. Performance fee compensation includes compensation related to performance fees, which generally consists of profit interests that we grant to our employees. Depending on the nature of each fund, the performance fee participation is generally structured as a fixed percentage or as an annual award. The liability is recorded subject to the vesting of the profit interests granted and is calculated based upon the net present value of the projected performance fees to be received. Payments to profit interest holders are payable when the performance fees are paid to Medley LLC by the respective fund. It is possible that we may record performance fee compensation during a period in which we do not record any performance fee revenue or we have a reversal of previously recognized performance fee revenue.
General, Administrative and Other Expenses. General and administrative expenses include costs primarily related to professional services, office rent, depreciation and amortization, general insurance, recruiting, travel and related expenses, information technology, communication and information services, other general operating items and, in 2016 and 2015, SIC expenses under an expense support and reimbursement agreement.
Other Income (Expense)
Dividend Income. Dividend income consists of dividends associated with our investments in SIC and MCC. Dividends are recognized on an accrual basis to the extent that such amounts are declared and expected to be collected.
Interest Expense. Interest expense consists primarily of interest expense relating to debt incurred by us.
Other Income (Expenses), Net. Other income (expenses), net consists primarily of expenses associated with our revenue share payable.
Provision for Income Taxes. Medley Management Inc. is subject to U.S. federal, state and local corporate income taxes on its allocable portion of taxable income from Medley LLC at prevailing corporate tax rates. Medley LLC and its subsidiaries are not subject to U.S. federal, state and local corporate income taxes since all of its income or losses are passed through to its members. However, Medley LLC and its subsidiaries are subject to New York City’s unincorporated business tax on its taxable income allocated to New York City. Our effective income tax rate is dependent on many factors, including the impact of nondeductible items and a rate benefit attributable to the fact that a portion of our earnings are not subject to corporate level taxes.
10
Deferred tax assets and liabilities are recognized for the future tax consequences attributable to differences between the financial statements carrying amounts of existing assets and liabilities and their respective tax basis. Deferred tax assets and liabilities are measured using enacted tax rates expected to apply to taxable income in the years in which those temporary differences are expected to be recovered or settled. To the extent it is more likely than not that the deferred tax assets will not be recognized, a valuation allowance is provided to offset their benefit.
We recognize the benefit of an income tax position only if it is more likely than not that the tax position will be sustained upon tax examination, based solely on the technical merits of the tax position. Otherwise, no benefit is recognized. The tax benefits recognized are measured based on the largest benefit that has a greater than 50% percent likelihood of being realized upon ultimate settlement. Interest expense and penalties related to income tax matters are recognized as a component of the provision for income taxes.
On December 22, 2017, the U.S. government enacted the Tax Cuts and Jobs Act (the “Tax Act”). The Tax Act includes significant changes to the U.S. corporate income tax system including: a federal corporate rate reduction from 34% to 21%; limitations on the deductibility of interest expense and executive compensation; and the transition of U.S. international taxation from a worldwide tax system to a modified territorial tax system. Changes under the Tax Act are effective for us as of January 1, 2018.
ASC 740, Income Taxes, requires us to remeasure our deferred tax assets and liabilities as of the date of enactment, with the resulting tax effects accounted for in the reporting period of enactment. Based on the reduction of the corporate income tax rate, we re-measured our deferred tax assets and liabilities based on the rates at which they are expected to to be utilized in the future. The impact of this change resulted in a $0.3 million decrease in our deferred tax asset balance and corresponding increase in the provision for income taxes for the year ended December 31, 2017.
Net Income Attributable to Redeemable Non-Controlling Interests and Non-Controlling Interests in Consolidated Subsidiaries. Net income attributable to redeemable non-controlling interests and non-controlling interests in consolidated subsidiaries represents the ownership interests that third parties hold in certain consolidated subsidiaries.
Net Income Attributable to Non-Controlling Interests in Medley LLC. Net income attributable to non-controlling interests in Medley LLC represents the ownership interests that non-managing members’ hold in Medley LLC.
Our private funds are closed-end funds, and accordingly do not permit investors to redeem their interests other than in limited circumstances that are beyond our control, such as instances in which retaining the limited partnership interest could cause the limited partner to violate a law, regulation or rule. In addition, SMAs for a single investor may allow such investor to terminate the investment management agreement at the discretion of the investor pursuant to the terms of the applicable documents. We manage assets for MCC and SIC, both of which are BDCs. The capital managed by MCC and SIC is permanently committed to these funds and cannot be redeemed by investors.
Managing Business Performance
Non-GAAP Financial Information
In addition to analyzing our results on a GAAP basis, management also makes operating decisions and assesses business performance based on the financial and operating metrics and data that are presented without the consolidation of any fund(s). Core Net Income, Core EBITDA, Core Net Income Per Share and Core Net Income Margin are non-GAAP financial measures that are used by management to assess the performance of our business. There are limitations associated with the use of non-GAAP financial measures as compared to the use of the most directly comparable U.S. GAAP financial measure and these measures supplement and should be considered in addition to and not in lieu of the results of operations discussed further under "Results of Operations,’’ which are prepared in accordance with U.S. GAAP. Furthermore, such measures may be inconsistent with measures presented by other companies. For a reconciliation of these measures to the most comparable measure in accordance with U.S. GAAP, see "Reconciliation of Certain Non-GAAP Performance Measures to Consolidated U.S. GAAP Financial Measures.’’
Core Net Income. Core Net Income is an income measure that is used by management to assess the performance of our business through the removal of non-core items, as well as non-recurring expenses associated with our IPO. It is calculated by adjusting net income attributable to Medley Management Inc. and net income attributable to non-controlling interests in Medley LLC to exclude reimbursable expenses associated with the launch of funds, amortization of stock-based compensation expense associated with grants of restricted stock units at the time of our IPO, other non-core items and the income tax impact of these adjustments.
Core Earnings Before Interest, Income Taxes, Depreciation and Amortization (Core EBITDA). Core EBITDA is an income measure also used by management to assess the performance of our business. Core EBITDA is calculated as Core Net Income before interest expense, income taxes, depreciation and amortization.
Pro-Forma Weighted Average Shares Outstanding. The calculation of Pro-Forma Weighted Average Shares Outstanding assumes the conversion by the pre-IPO holders of 23,333,333 Medley LLC units for 23,333,333 shares of Class A common stock
11
at the beginning of each period presented, as well as the vesting of the weighted average number of restricted stock units and, in 2017, the conversion of 320,000 restricted LLC units for an equal number of shares of Class A common stock.
Core Net Income Per Share. Core Net Income Per Share is Core Net Income adjusted for corporate income taxes assuming that all of our pre-tax earnings are subject to federal, state and local corporate income taxes, divided by Pro-Forma Weighted Average Shares Outstanding (as defined above). In determining corporate income taxes we used an annual effective corporate tax rate of 43.0%. Please refer to the calculation of Core Net Income Per Share in “ Reconciliation of Certain Non-GAAP Performance Measures to Consolidated U.S. GAAP Financial Measures.”
Core Net Income Margin. Core Net Income Margin equals Core Net Income Per Share divided by total revenue per share.
Key Performance Indicators
When we review our performance we focus on the indicators described below:
For the Years Ended December 31, | |||||||||||
2017 | 2016 | 2015 | |||||||||
(Amounts in thousands, except AUM, share and per share amounts) | |||||||||||
Consolidated Financial Data: | |||||||||||
Net income attributable to Medley Management Inc. and non-controlling interests in Medley LLC | $ | 10,591 | $ | 7,403 | $ | 21,517 | |||||
Net income per Class A common stock | $ | 0.07 | $ | 0.02 | $ | 0.46 | |||||
Net Income Margin (1) | 16.3 | % | 9.7 | % | 32.3 | % | |||||
Weighted average shares - Basic and Diluted | 5,553,026 | 5,804,042 | 6,002,422 | ||||||||
Non-GAAP Data: | |||||||||||
Core Net Income | $ | 15,090 | $ | 25,531 | $ | 29,747 | |||||
Core EBITDA | $ | 29,226 | $ | 38,481 | $ | 41,721 | |||||
Core Net Income Per Share | $ | 0.33 | $ | 0.54 | $ | 0.61 | |||||
Core Net Income Margin | 15.5 | % | 21.7 | % | 28.1 | % | |||||
Pro-Forma Weighted Average Shares Outstanding | 30,851,882 | 30,689,412 | 30,459,958 | ||||||||
Other Data (at period end, in millions): | |||||||||||
AUM | $ | 5,198 | $ | 5,335 | $ | 4,779 | |||||
Fee Earning AUM | $ | 3,158 | $ | 3,190 | $ | 3,302 | |||||
(1) | Net Income Margin equals Net income attributable to Medley Management Inc. and non-controlling interests in Medley LLC divided by total revenue. |
12
Results of Operations
The following table and discussion sets forth information regarding our consolidated results of operations for the years ended December 31, 2017, 2016 and 2015. The audited consolidated financial statements of Medley have been prepared on substantially the same basis for all historical periods presented.
For the Years Ended December 31, | |||||||||||
2017 | 2016 | 2015 | |||||||||
(Amounts in thousands, except AUM data) | |||||||||||
Revenues | |||||||||||
Management fees | $ | 58,104 | $ | 65,496 | $ | 75,675 | |||||
Performance fees | (1,974 | ) | 2,443 | (3,055 | ) | ||||||
Other revenues and fees | 9,201 | 8,111 | 7,436 | ||||||||
Investment income: | |||||||||||
Carried interest | 230 | (22 | ) | (12,630 | ) | ||||||
Other investment loss | (528 | ) | (87 | ) | (833 | ) | |||||
Total Revenues | 65,033 | 75,941 | 66,593 | ||||||||
Expenses | |||||||||||
Compensation and benefits | 27,432 | 27,800 | 26,768 | ||||||||
Performance fee compensation | (874 | ) | (319 | ) | (8,049 | ) | |||||
General, administrative and other expenses | 13,045 | 28,540 | 16,836 | ||||||||
Total Expenses | 39,603 | 56,021 | 35,555 | ||||||||
Other Income (Expense) | |||||||||||
Dividend income | 4,327 | 1,304 | 886 | ||||||||
Interest expense | (11,855 | ) | (9,226 | ) | (8,469 | ) | |||||
Other income (expense), net | 1,363 | (983 | ) | (808 | ) | ||||||
Total Other Expense, Net | (6,165 | ) | (8,905 | ) | (8,391 | ) | |||||
Income before income taxes | 19,265 | 11,015 | 22,647 | ||||||||
Provision for income taxes | 1,956 | 1,063 | 2,015 | ||||||||
Net Income | 17,309 | 9,952 | 20,632 | ||||||||
Net income attributable to redeemable non-controlling interests and non-controlling interests in consolidated subsidiaries | 6,718 | 2,549 | (885 | ) | |||||||
Net income attributable to non-controlling interests in Medley LLC | 9,664 | 6,406 | 18,406 | ||||||||
Net Income Attributable to Medley Management Inc. | $ | 927 | $ | 997 | $ | 3,111 | |||||
Other data (at period end, in millions): | |||||||||||
AUM | $ | 5,198 | $ | 5,335 | $ | 4,779 | |||||
Fee earning AUM | $ | 3,158 | $ | 3,190 | $ | 3,302 | |||||
13
Year Ended December 31, 2017 Compared to Year Ended December 31, 2016
Revenues
Management Fees. Total management fees decreased by $7.4 million, or 11%, to $58.1 million for the year ended December 31, 2017 compared to the year ended December 31, 2016.
• | Our management fees from permanent capital vehicles decreased by $9.4 million during the year ended December 31, 2017 compared to 2016. The decrease was due primarily to a decline in Part I incentive fees of $4.6 million from SIC and $4.9 million from MCC, offset in part, by an increase in base management fees from SIC. |
• | Our management fees from long-dated private funds and SMAs increased by $2.0 million for the year ended December 31, 2017, compared to 2016. The increase was due primarily to an increase in base management fees from our SMAs. |
Performance Fees. There was a reversal of performance fees of $2.0 million during the year ended December 31, 2017 compared to an accrual of performance fees revenue of $2.4 million in 2016. The variance was attributed primarily to reversals of previously recognized performance fees as a result of declines in the underlying fund values of our SMAs.
Other Revenues and Fees. Other revenues and fees increased by $1.1 million, or 13%, to $9.2 million for the year ended December 31, 2017 compared to 2016. The increase was due primarily to an increase in loan administrative and transaction fees as well as administrative fees from our permanent capital vehicles and other private funds.
Investment Income. Investment income decreased by approximately $0.2 million to a loss of $0.3 million for the year ended December 31, 2017 compared to the same period in 2016. The decrease was due primarily to losses from our equity method investments, partially offset with higher carried interest from our private long dated funds.
Expenses
Compensation and Benefits. Compensation and benefits decreased by $0.4 million, or 1% to $27.4 million for the year ended December 31, 2017 compared to 2016. The variance was due primarily to a decrease in stock compensation expense of $1.1 million as a result of forfeited RSUs as well as lower discretionary compensation accruals of $0.3 million, partly offset by an increase in severance charges of $1.0 million.
Performance Fee Compensation. There was a reversal in performance fee compensation of $0.9 million during the year ended December 31, 2017 as compared to a reversal of performance fee compensation of $0.3 million during 2016. The variance in performance fee compensation was due primarily to changes in projected future payments of $0.9 million.
General, Administrative and Other Expenses. General, administrative and other expenses decreased by $15.5 million to $13.0 million for the year ended December 31, 2017 compared to 2016. The decrease was due primarily to a $16.1 million decrease in expense support agreement expenses related to SIC and $0.5 million decrease in professional fees. The expense support agreement with SIC expired on December 31, 2016, as such, we are no longer responsible for expenses under the expense support agreement relating to SIC. The decreases in these expenses were offset, in part, by expenses related to our consolidated fund, STRF.
Other Income (Expense)
Dividend Income. Dividend income increased by $3.0 million to $4.3 million for the year ended December 31, 2017 compared to 2016. The increase was due primarily to dividend income from our investment in available for sale securities attributed to additional purchases made during 2017.
Interest Expense. Interest expense increased by $2.6 million, or 28%, to $11.9 million for the year ended December 31, 2017 compared to the same period in 2016. The increase was primarily due to an acceleration of amortization of debt issuance costs and discount relating to prepayments made on our Term Loan Facility as a result of the refinancing of our indebtedness from the issuance of senior unsecured debt. In addition, our average debt outstanding during the year ended December 31, 2017 and 2016 was $127.8 million and $106.0 million, respectively.
Other Income (Expenses), net. Other income (expenses), net increased by $2.3 million to $1.4 million for the year ended December 31, 2017 compared to 2016. The increase was due primarily to the impact of revaluation of our revenue share payable.
14
Provision for Income Taxes
Our effective income tax rate was 10.2% and 9.7% for the years ended December 31, 2017 and 2016, respectively. Our tax rate is affected by recurring items, such as permanent differences and income allocated to certain redeemable non-controlling interests which is not subject to U.S. federal, state and local corporate income taxes. The increase in the effective tax rate during the year ended December 31, 2017 as compared to 2016 was due primarily to the impact of discrete items associated with the vesting and forfeiture of RSUs as well as the re-measurement our deferred tax asset balance as a result the enactment of the Tax Act offset, in part, by an increase in taxable income allocable to certain redeemable non-controlling interests which is not subject to corporate level income taxes.
Redeemable Non-Controlling Interests and Non-Controlling Interests in Consolidated Subsidiaries
Net income attributable to redeemable non-controlling interests and non-controlling interests in consolidated subsidiaries increased by $4.2 million to $6.7 million for the year ended December 31, 2017 compared to 2016. The increase was due primarily to an increase in dividend income earned and allocated to DB MED Investor I LLC, a third party, based on its preferred ownership interests held in one of our consolidated subsidiaries as well as income allocated to SC Distributors LLC for its interests in SIC Advisors.
Year Ended December 31, 2016 Compared to Year Ended December 31, 2015
Revenues
Management Fees. Total management fees decreased by $10.2 million, or 13%, to $65.5 million for the year ended December 31, 2016 compared to the year ended December 31, 2015.
• | Our management fees from permanent capital vehicles decreased by $8.1 million for the year ended December 31, 2016 compared to 2015. Management fees from SIC increased by $7.6 million due to an increase in Part I incentive fees and an 16% increase in average fee earning AUM for the year ended December 31, 2016 compared to2015. Management fees from MCC decreased by $15.7 million due to a decrease in Part I incentive fees and a 14% decrease in average fee earning AUM for the year ended December 31, 2016 compared to 2015. |
• | Our management fees from long-dated private funds and SMAs decreased by $2.1 million for the year ended December 31, 2016, compared to 2015. The decrease was primarily due to a decrease in origination fees, partly offset by an increase in base management fees. |
Performance Fees. Performance fees increased to $2.4 million for the year ended December 31, 2016 compared to a reversal of performance fees of $3.1 million during 2015. The increase was due to an increase in SMA performance fees accrual for the year ended December 31, 2016 compared to a reversal of performance fees of MOF II and SMAs for the year ended December 31, 2015, which was the result of a decline in the underlying fund values.
Other Revenues and Fees. Other revenues and fees increased by $0.7 million, or 9%, to $8.1 million for the year ended December 31, 2016 compared to 2015. The increase was due primarily to an increase in administrative fees from our permanent capital vehicles.
Investment Income. Investment income increased by approximately $13.4 million to a loss of $0.1 million for the year ended December 31, 2016 compared to the same period in 2015. The increase was due to no carried interest from our long dated private funds in 2016 versus a reversal of $12.6 million in 2015.
Expenses
Compensation and Benefits. Compensation and benefits increased by $1.0 million, or 4% to $27.8 million for the year ended December 31, 2016 compared to 2015. The increase was due primarily to an increase in salaries, that resulted from an increase in headcount, and an increase in stock-based compensation expense, partly offset by a decrease in discretionary compensation during the year ended December 31, 2016
Performance Fee Compensation. There was a reversal in performance fee compensation of $0.3 million during the year ended December 31, 2016 as compared to a reversal of performance fee compensation of $8.0 million during 2015. The variance in performance fee compensation was due primarily to changes in projected future payments.
General, Administrative and Other Expenses. General, administrative and other expenses increased by $11.7 million to $28.5 million for the year ended December 31, 2016 compared to 2015. The increase was due primarily to an increase in expense support agreement expenses related to SIC. The expense support agreement with SIC expired on December 31, 2016, as such, we are no longer be responsible for expenses under the expense support agreement relating to SIC.
15
Other Income (Expense)
Dividend Income. Dividend income increased by $0.4 million to $1.3 million for the year ended December 31, 2016 compared to 2015. The increase was due to dividend income from our investment in available-for-sale securities which were acquired during the year ended December 31, 2016.
Interest Expense. Interest expense increased by $0.8 million, or 9%, to $9.2 million for the year ended December 31, 2016 compared to 2015. The increase was primarily due to an acceleration of amortization of debt issuance costs and discount relating to prepayments made on our Term Loan Facility as a result of the refinancing of our indebtedness from the issuance of senior unsecured debt. Average debt outstanding during the years ended December 31, 2016 and 2015 was $106.0 million and $105.9 million, respectively.
Other Income (Expenses), net. Other expenses, net increased by $0.2 million to $1.0 million for the year ended December 31, 2016 compared to 2015. The increase was due primarily to the impact of revaluation of our revenue share payable.
Provision for Income Taxes
Our effective income tax rate was 9.7% and 8.9% for the years ended December 31, 2016 and 2015, respectively. Our tax rate is affected by recurring items, such as permanent differences and income allocated to certain redeemable non-controlling interests which is not subject to U.S. federal, state and local corporate income taxes. It is also affected by discrete items that may occur in any given year, but are not consistent from year to year. The increase in the effective tax rate during the year ended December 31, 2016 as compared to 2015 was primarily attributed to the variance in the reversal of performance compensation which is not included in taxable income.
Redeemable Non-Controlling Interests and Non-Controlling Interests in Consolidated Subsidiaries
Net income attributable to redeemable non-controlling interests and non-controlling interests in consolidated subsidiaries increased by $3.4 million to $2.5 million for the year ended December 31, 2016 compared to 2015. The increase was due primarily to a reversal of MOF II performance fees for the year ended December 31, 2015, a portion of which was allocated to non-controlling interests in consolidated subsidiaries.
Liquidity and Capital Resources
Our primary cash flow activities involve: (i) generating cash flow from operations, which largely includes management fees; (ii) making distributions to our members and redeemable non-controlling interests; (iii) paying dividends and (iv) borrowings, interest payments and repayments under our debt facilities. As of December 31, 2017, we had $36.3 million in cash and cash equivalents.
Our material source of cash from our operations is management fees, which are collected quarterly. We primarily use cash flows from operations to pay compensation and benefits, general, administrative and other expenses, federal, state and local corporate income taxes, debt service costs and distributions to our owners. Our cash flows, together with the proceeds from equity and debt issuances, are also used to fund investments in limited partnerships, purchase available for sale securities, purchase fixed assets and other capital items. If cash flows from operations were insufficient to fund distributions, we expect that we would suspend paying such distributions.
Debt Instruments
Senior Unsecured Debt
On August 9, 2016, Medley LLC completed a registered public offering of $25.0 million of an aggregate principal amount of 6.875% senior notes due 2026 (the “2026 Notes”). On October 18, 2016, Medley LLC completed a registered public offering of an additional $28.6 million in aggregate principal amount of the 2026 Notes. The 2026 Notes mature on August 15, 2026.
On January 18, 2017, Medley LLC completed a registered public offering of $34.5 million in aggregate principal amount of 7.25% senior notes due 2024 (the “2024 Notes”). On February 22, 2017, Medley LLC completed a registered public offering of an additional $34.5 million in aggregate principal amount of 2024 Notes. The 2024 Notes mature on January 30, 2024.
As of December 31, 2017, the outstanding senior unsecured debt balance was $116.9 million, and is reflected net of unamortized discount, premium and debt issuance costs of $5.7 million.
16
See Note 7 "Senior Unsecured Debt" to our consolidated financial statements included in this Form 10-K for additional information on the 2026 Notes and the 2024 Notes.
Revolving Credit Facility
On August 19, 2014, we entered into a $15.0 million senior secured revolving credit facility with City National Bank (as amended, the “Revolving Credit Facility”), as administrative agent and collateral agent thereunder, and the lenders from time to time party thereto. On September 22, 2017 we amended the Revolving Credit Facility to, among other things, extend the maturity date until March 31, 2020 and provide for an incremental facility in an amount up to $10.0 million upon the satisfaction of certain customary conditions. We intend to use any proceeds of borrowings under the Revolving Credit Facility for general corporate purposes, including funding our working capital needs. We have not incurred any borrowings under the Revolving Credit Facility through December 31, 2017. As of December 31, 2017, we were in compliance with the financial covenants under our Revolving Credit Facility.
Interest Rate and Fees
Borrowings under the Revolving Credit Facility bear interest, at our option, either (i) at ABR, plus an applicable margin not to exceed 0.25 percentage points, or (ii) at an adjusted LIBOR plus an applicable margin not to exceed 2.50 percentage points. In addition to paying interest on any outstanding principal under the Revolving Credit Facility, we are required to pay an unused line fee on the first day of the second month following each fiscal quarter in an amount equal to (i) if the average daily balance for the applicable fiscal quarter was less than $9.0 million, 0.50% per annum, or (ii) if the average daily balance for the applicable fiscal quarter was equal to or greater than $9.0 million, 0.25% per annum.
Guarantees and Collateral
Any obligations under the Revolving Credit Facility are unconditionally and irrevocably guaranteed by certain of Medley LLC’s subsidiaries. In addition, any outstanding borrowings are collateralized by first priority or equivalent security interests in (i) all the capital stock of, or other equity interests in, the borrower and each of the borrower’s and credit agreement guarantors’ direct or indirect domestic subsidiaries and 65% of the capital stock of, or other equity interests in, each of the borrower’s or any subsidiary guarantors’ direct wholly owned first-tier restricted foreign subsidiaries, and (ii) certain tangible and intangible assets of the borrower and the credit agreement guarantors (subject to certain exceptions and qualifications).
None of our non-wholly owned domestic subsidiaries are obligated to guarantee the Revolving Credit Facility.
Certain Covenants and Events of Default
The Revolving Credit Facility contains a number of significant affirmative and negative covenants and customary events of default. Such covenants, among other things, will limit or restrict, subject to certain exceptions, the ability of the borrower and its restricted subsidiaries to:
• | incur additional indebtedness, make guarantees and enter into hedging arrangements; |
• | create liens on assets; |
• | enter into sale and leaseback transactions; |
• | engage in mergers or consolidations; |
• | make fundamental changes; |
• | pay dividends and distributions or repurchase our capital stock; |
• | make investments, loans and advances, including acquisitions; |
• | engage in certain transactions with affiliates; |
• | make changes in the nature of their business; and |
• | make prepayments of junior debt. |
In addition, the credit agreement governing our Revolving Credit Facility contains financial covenants that requires us to maintain a Maximum Net Leverage Ratio of not greater than 5.0 to 1.0, a Total Leverage Ratio of not greater than 7.0 to 1.0, and Core EBITDA of not less than $15.0 million. These ratios are calculated on a trailing twelve months basis and are calculated using our standalone financial results and include adjustments to calculate Core EBITDA.
Our Revolving Credit Facility contains certain customary representations and warranties, affirmative covenants and events of default. If an event of default occurs, the lender under the Revolving Credit Facility will be entitled to take various actions, including the acceleration of any amounts due under the Revolving Credit Facility and all actions permitted to be taken by a secured creditor.
17
Non-Recourse Promissory Notes
In April 2012, we borrowed $5.0 million under a non-recourse promissory note with a foundation, and $5.0 million under a non-recourse promissory note with a trust. These notes are scheduled to mature in March 2019.
See Note 6 "Loans Payable" to our consolidated financial statements included in this Form 10-K for additional information regarding the promissory notes.
Cash Flows
The significant captions and amounts from our consolidated statements of cash flows are summarized below. Negative amounts represent a net outflow, or use of cash.
For the Years Ended December 31, | |||||||||||
2017 | 2016 | 2015 | |||||||||
(Amounts in thousands) | |||||||||||
Statements of cash flows data | |||||||||||
Net cash provided by operating activities | $ | 12,563 | $ | 15,895 | $ | 24,063 | |||||
Net cash used in investing activities | (35,203 | ) | (18,826 | ) | (1,373 | ) | |||||
Net cash provided by (used in) financing activities | 4,404 | (14,194 | ) | (38,208 | ) | ||||||
Net decrease in cash and cash equivalents | $ | (18,236 | ) | $ | (17,125 | ) | $ | (15,518 | ) | ||
Operating Activities
Our net cash flow provided by operating activities was $12.6 million, $15.9 million and $24.1 million during the years ended December 31, 2017, 2016 and 2015, respectively. During the years ended December 31, 2017, 2016 and 2015, net cash flow provided by operating activities was attributed to net income of $17.3 million, $10.0 million and $20.6 million, respectively, non-cash adjustments of $7.6 million, $6.7 million and $17.4 million, respectively, and changes in operating assets and liabilities of $(12.5) million, $(0.7) million and $(14.0) million, respectively.
Investing Activities
Our investing activities generally reflect cash used for acquisitions of fixed assets, distributions received from our equity method investments and purchases of available for sale securities. Purchases of fixed assets were $0.1 million, $1.9 million and $0.8 million for the years ended December 31, 2017, 2016 and 2015, respectively. Capital contributions to equity method investments represented a use of cash from financing activities of $0.3 million for each of the years ended December 31, 2017 and 2016 and $1.1 million for the year ended December 31, 2015. Distributions received from equity method investments during each of the years ended December 31, 2017 and 2016 were $0.2 million and were $0.5 million for the year ended December 31, 2015. Excluding the investments held by our consolidated fund, purchases of available for sale securities were $35.0 million during the year ended December 31, 2017 and $16.8 million during the year ended December 31, 2016.
Financing Activities
Dividends paid were $5.8 million, $5.5 million and $4.1 million during the years ended December 31, 2017, 2016 and 2015, respectively. Distributions to members and non-controlling interests were $30.0 million, $23.7 million and $32.7 million for the years ended December 31, 2017, 2016 and 2015, respectively. Capital contributions from non-controlling interests and redeemable non-controlling interests resulted in an inflow of cash of $23.0 million for the year ended December 31, 2017 and $17.0 million during the year ended December 31, 2016. Repurchases of Class A common stock represented a use of cash from financing activities of $3.6 million, $1.2 million and $0.1 million for the years ended December 31, 2017, 2016 and 2015, respectively.
On August 9, 2016, Medley LLC completed its first registered public offering of senior unsecured debt and on October 18, 2016, January 18, 2017, and February 22, 2017 Medley LLC completed additional registered public offerings of senior unsecured debt. The proceeds from these offerings, net of offering expenses payable by us, amounted to $116.2 million. The net proceeds from the offerings were used to pay-down the outstanding indebtedness under the Term Loan Facility with the remaining amount to be used for working capital purposes. Repayments of loans payable resulted in an outflow of cash of $44.8 million and $50.5 million for the years ended December 31, 2017 and 2016, respectively. Proceeds from the issuance of debt obligations provided an inflow of cash of $69.1 million for the year ended December 31, 2017 and $52.6 million for the year ended December 31, 2016.
Sources and Uses of Liquidity
Our sources of liquidity are (i) cash on hand, (ii) net working capital, (iii) cash flows from operations, (iv) realizations on our investments, (v) net proceeds from borrowings under the Revolving Credit Facility and issuances of publicly-registered debt and (vi) other potential financings. We believe that these sources of liquidity will be sufficient to fund our working capital requirements and to meet our commitments in the foreseeable future. We expect that our primary liquidity needs will be comprised
18
of cash to (i) provide capital to facilitate the growth of our existing investment management business, (ii) fund our commitments to funds that we advise, (iii) provide capital to facilitate our expansion into business that are complementary to our existing investment management business, (iv) pay operating expenses, including cash compensation to our employees and payments under the TRA, (v) fund capital expenditures, (vi) pay income taxes, and (vii) make distributions to our shareholders in accordance with our dividend policy.
We intend to use a portion of our available liquidity to fund cash dividends to our common shareholders on a quarterly basis. Our ability to fund cash dividends to our common shareholders is dependent on a myriad of factors, including among others: general economic and business conditions; our strategic plans and prospects; our business and investment opportunities; timing of capital calls by our funds in support of our commitments; our financial condition and operating results; working capital requirements and other anticipated cash needs; contractual restrictions and obligations; legal, tax and regulatory restrictions; restrictions on the payment of distributions by our subsidiaries to us; and other relevant factors.
Critical Accounting Policies
We prepare our consolidated financial statements in accordance with U.S. GAAP. In applying many of these accounting principles, we need to make assumptions, estimates or judgments that affect the reported amounts of assets, liabilities, revenues and expenses in our consolidated financial statements. We base our estimates and judgments on historical experience and other assumptions that we believe are reasonable under the circumstances. These assumptions, estimates or judgments, however, are both subjective and subject to change, and actual results may differ from our assumptions and estimates. If actual amounts are ultimately different from our estimates, the revisions are included in our results of operations for the period in which the actual amounts become known. We believe the following critical accounting policies could potentially produce materially different results if we were to change underlying assumptions, estimates or judgments. See Note 2, “Summary of Significant Accounting Policies,” to our consolidated financial statements included in this Form 10-K for a summary of our significant accounting policies.
Principles of Consolidation
In accordance with ASC 810, Consolidation, we consolidate those entities where we have a direct and indirect controlling financial interest based on either a variable interest model or voting interest model. As such, we consolidate entities that we conclude are VIEs, for which we are deemed to be the primary beneficiary and entities in which we hold a majority voting interest or have majority ownership and control over the operational, financial and investing decisions of that entity.
For legal entities evaluated for consolidation, we must determine whether the interests that it holds and fees paid to it qualify as a variable interest in an entity. This includes an evaluation of the management fees and performance fees paid to us when acting as a decision maker or service provider to the entity being evaluated. Fees received by us that are customary and commensurate with the level of services provided, and we don’t hold other economic interests in the entity that would absorb more than an insignificant amount of the expected losses or returns of the entity, would not be considered a variable interest. We factor in all economic interests including proportionate interests through related parties, to determine if fees are considered a variable interest.
An entity in which we hold a variable interest is a VIE if any one of the following conditions exist: (a) the total equity investment at risk is not sufficient to permit the legal entity to finance its activities without additional subordinated financial support, (b) the holders of equity investment at risk have the right to direct the activities of the entity that most significantly impact the legal entity’s economic performance, (c) the voting rights of some investors are disproportionate to their obligation to absorb losses or rights to receive returns from a legal entity. For limited partnerships and other similar entities, non-controlling investors must have substantive rights to either dissolve the fund or remove the general partner (“kick-out rights”) in order to qualify as a VIE.
For those entities that qualify as a VIE, the primary beneficiary is generally defined as the party who has a controlling financial interest in the VIE. We are generally deemed to have a controlling financial interest if we have the power to direct the activities of a VIE that most significantly impact the VIE’s economic performance, and the obligation to absorb losses or receive benefits from the VIE that could potentially be significant to the VIE. We determine whether we are the primary beneficiary of a VIE at the time we become initially involved with the VIE and we reconsider that conclusion continuously. The primary beneficiary evaluation is generally performed qualitatively on the basis of all facts and circumstances. However, quantitative information may also be considered in the analysis, as appropriate. These assessments require judgments. Each entity is assessed for consolidation on a case-by-case basis.
For those entities evaluated under the voting interest model, we consolidate the entity if we have a controlling financial interest. We have a controlling financial interest in a voting interest entity (“VOE”) if we own a majority voting interest in the entity.
Performance Fees
Performance fees are based on certain specific hurdle rates as defined in the funds’ applicable investment management or partnership agreements. Performance fees are recorded on an accrual basis to the extent such amounts are contractually due.
19
We have elected to adopt Method 2 of ASC 605, Revenue Recognition, for revenue based on a formula. Under this method, we are entitled to performance-based fees that can amount to as much as 20.0% of a fund's profits, subject to certain hurdles. Performance-based fees are assessed as a percentage of the investment performance of the funds. The performance fee for any period is based upon an assumed liquidation of the fund's net assets on the reporting date, and distribution of the net proceeds in accordance with the fund's income allocation provisions. The performance fees may be subject to reversal to the extent that the performance fees recorded exceeds the amount due to the general partner or investment manager based on a fund's cumulative investment returns.
Performance fees receivable is presented separately in our audited consolidated balance sheets included in this Form 10-K and represents performance fees recognized but not yet collected. The timing of the payment of performance fees due to the general partner or investment manager varies depending on the terms of the applicable fund agreements.
If applicable, we record an accrual for the potential repayment of previously received performance fees which represents amounts that would need to be repaid to the underlying funds if these funds were to be liquidated based on the current fair value of the underlying funds’ investments as of the reporting date. Our actual obligation, however, would not become payable or realized until the end of a fund’s life.
Carried Interest
Carried interest are performance based fees that represent a capital allocation of income to the general partner or investment manager. Carried interest is allocated to us based on cumulative fund performance to date, subject to the achievement of minimum return levels in accordance with the respective terms set out in each fund’s governing documents.
Effective January 1, 2018, we account for carried interest under, ASC 323, Investments-Equity Method and Joint Ventures. Under this standard, we record carried interest in a consistent manner as we historically had which is based upon an assumed liquidation of that fund's net assets as of the reporting date, regardless of whether such amounts have been realized. For any given period, carried interest on our condensed consolidated statements of operations may include reversals of previously recognized carried interest due to a decrease in the value of a particular fund that results in a decrease of cumulative fees earned to date. Since fund return hurdles are cumulative, previously recognized carried interest also may be reversed in a period of appreciation that is lower than the particular fund's hurdle rate.
Carried interest received in prior periods may be required to be returned by us in future periods if the funds’ investment performance declines below certain levels. Each fund is considered separately in this regard and, for a given fund, carried interest can never be negative over the life of a fund. If upon a hypothetical liquidation of a fund’s investments, at their then current fair values, previously recognized and distributed carried interest would be required to be returned, a liability is established for the potential clawback obligation. Our actual obligation, however, would not become payable or realized until the end of a fund’s life.
Performance Fee Compensation Payable
We have an obligation to pay our professionals a portion of the performance fees earned from certain funds. These amounts are accounted for as compensation expense in conjunction with the recognition of the related performance fee revenue and, until paid, are recognized as performance fee compensation payable. Performance fee compensation is recognized in the same period that the related performance fees are recognized. Performance fee compensation can be reversed during periods when there is a decline in performance fees that were previously recognized.
Income Taxes
We account for income taxes using the asset and liability approach, which requires the recognition of tax benefits or expenses for temporary differences between the financial reporting and tax basis of assets and liabilities. A valuation allowance is established when necessary to reduce deferred tax assets to the amounts expected to be realized. We also recognize a tax benefit from uncertain tax positions only if it is “more likely than not” that the position is sustainable based on its technical merits. Our policy is to recognize interest and penalties on uncertain tax positions and other tax matters as a component of income tax expense. For interim periods, we account for income taxes based on its estimate of the effective tax rate for the year. Discrete items and changes in its estimate of the annual effective tax rate are recorded in the period they occur.
Medley Management Inc., is subject to U.S. federal, state and local corporate income taxes on its allocable portion of taxable income from Medley LLC at prevailing corporate tax rates, which are reflected in our consolidated financial statements included in this Form 10-K. Medley LLC and its subsidiaries are not subject to federal, state and local corporate income taxes since all income, gains and losses are passed through to its members. However, Medley LLC and its subsidiaries are subject to New York City’s unincorporated business tax, which is also included in our provision for income taxes.
We analyze our tax filing positions in all of the U.S. federal, state and local tax jurisdictions where we are required to file income tax returns, as well as for all open tax years in these jurisdictions. If, based on this analysis, we determine that uncertainties in tax positions exist, a liability is established.
20
Stock-based Compensation
We account for stock-based compensation in accordance with ASC 718, Compensation – Stock Compensation. Under the fair value recognition provision of this guidance, share-based compensation cost is measured at the grant date based on the fair value of the award and is recognized as expense over the requisite service period.
Prior to January 1, 2017, stock-based compensation expense was based on awards ultimately expected to vest and was reduced for estimated forfeitures. We estimated our forfeiture rate based on our historical experience and revised our estimate if actual forfeitures differed from our initial estimates. Effective January 1, 2017, we adopted a change in accounting policy as a result of the adoption of ASU 2016-09 to account for forfeitures in the period they occur.
Stock-based compensation expense relating to equity based awards are measured at fair value as of the grant date, reduced for actual forfeitures, and expensed over the vesting period on a straight-line basis as a component of compensation and benefits in our consolidated statements of operations.
Recent Accounting Pronouncements
Information regarding recent accounting pronouncements and their impact on us can be found in Note 2, “Summary of Significant Accounting Policies,” to our consolidated financial statements included in this Form 10-K.
Off-Balance Sheet Arrangements
In the normal course of business, we may engage in off-balance sheet arrangements, including transactions in guarantees, commitments, indemnifications and potential contingent repayment obligations.
See Note 9, “Commitments and Contingencies,” to our consolidated financial statements included in this Form 10-K for a discussion of our commitments and contingencies.
Contractual Obligations
The following table sets forth information relating to our contractual obligations as of December 31, 2017.
Less than 1 year | 1 - 3 years | 4 - 5 years | More than 5 years | Total | |||||||||||||||
(Amounts in thousands) | |||||||||||||||||||
Medley Obligations | |||||||||||||||||||
Operating lease obligations (1) | $ | 2,704 | $ | 5,543 | $ | 4,862 | $ | 1,823 | $ | 14,932 | |||||||||
Loans payable (2) | — | 10,000 | — | — | 10,000 | ||||||||||||||
Senior unsecured debt (3) | — | — | — | 122,595 | 122,595 | ||||||||||||||
Revenue share payable | 1,396 | 1,595 | 850 | — | 3,841 | ||||||||||||||
Capital commitments to funds (4) | 336 | — | — | — | 336 | ||||||||||||||
Total | $ | 4,436 | $ | 17,138 | $ | 5,712 | $ | 124,418 | $ | 151,704 | |||||||||
(1) | We lease office space in New York and San Francisco under non-cancelable lease agreements. The amounts in this table represent the minimum lease payments required over the term of the lease, and include operating leases for office equipment. |
(2) | We have included all loans described in Note 6, “Loans Payable,” to our consolidated financial statements included in this Form 10-K. |
(3) | We have included all our obligations described in Note 7, “Senior Unsecured Debt,” to our consolidated financial statements included in this Form 10-K. In addition to the principal amounts above, the Company is required to make quarterly interest payments of $1.2 million related to our 2024 Notes and $0.9 million related to our 2026 Notes. |
(4) | Represents equity commitments by us to certain long-dated private funds managed by us. These amounts are generally due on demand and are therefore presented in the less than one year category. |
Indemnifications
In the normal course of business, we enter into contracts that contain indemnities for our affiliates, persons acting on our behalf or such affiliates and third parties. The terms of the indemnities vary from contract to contract and the maximum exposure under these arrangements, if any, cannot be determined and has neither been recorded in our consolidated financial statements. As of December 31, 2017, we have not had prior claims or losses pursuant to these contracts and expect the risk of loss to be remote.
Contingent Obligations
The partnership documents governing our funds generally include a clawback provision that, if triggered, may give rise to a contingent obligation that may require the general partner to return amounts to the fund for distribution to investors. Therefore, performance fee revenue, generally, is subject to reversal in the event that the funds incur future losses. These losses are limited
21
to the extent of the cumulative performance fee revenue recognized in income to date, net of a portion of taxes paid. Due in part to our investment performance and the fact that our performance fee revenue is generally determined on a liquidation basis, as of December 31, 2017, we accrued $7.2 million for clawback obligations that would need to be paid had the funds been liquidated as of that date. There can be no assurance that we will not incur additional clawback obligations in the future. If all of the existing investments were valued at $0, the amount of cumulative performance fee revenue that have been recognized would be reversed. We believe that the possibility of all of the existing investments becoming worthless is remote. At December 31, 2017, had we assumed all existing investments were valued at $0, the net amount of performance fee revenue subject to additional reversal would have been approximately $3.2 million.
Performance fee revenue is also affected by changes in the fair values of the underlying investments in the funds that we advise. Valuations, on an unrealized basis, can be significantly affected by a variety of external factors including, but not limited to, bond yields and industry trading multiples. Under the governing agreements of certain of our funds, we may have to fund additional amounts on account of clawback obligations beyond what we received in performance fee compensation on account of distributions of performance fee payments made to current or former professionals from such funds if they do not fund their respective shares of such clawback obligations. We will generally retain the right to pursue any remedies that we have under such governing agreements against those carried interest recipients who fail to fund their obligations.
Additionally, at the end of the life of the funds, there could be a payment due to a fund by us if we have recognized more performance fee revenue than was ultimately earned. The general partner obligation amount, if any, will depend on final realized values of investments at the end of the life of the fund.
Item 8. Financial Statements and Supplementary Data
Page | ||
22
Report of Independent Registered Public Accounting Firm
To the Stockholders and the Board of Directors of Medley Management Inc.
Opinion on the Financial Statements
We have audited the accompanying consolidated balance sheets of Medley Management Inc. and its subsidiaries (the Company) as of December 31, 2017 and 2016, the related consolidated statements of income, comprehensive income, changes in equity and cash flows for each of the three years in the period ended December 31, 2017, and the related notes to the consolidated financial statements (collectively, the financial statements). In our opinion, the financial statements present fairly, in all material respects, the financial position of the Company as of December 31, 2017 and 2016, and the results of its operations and its cash flows for the years then ended, in conformity with accounting principles generally accepted in the United States of America.
Change in Accounting Principle
As discussed in Note 2 to the financial statements, effective January 1, 2018, the Company elected to change its method of accounting for performance fees earned which represent a capital allocation to the general partner or investment manager. This change has been retrospectively applied in all periods of the accompanying financial statements to reflect the accounting method change.
Basis for Opinion
These financial statements are the responsibility of the Company’s management. Our responsibility is to express an opinion on the Company’s financial statements based on our audits. We are a public accounting firm registered with the Public Company Accounting Oversight Board (United States) (PCAOB) and are required to be independent with respect to the Company in accordance with U.S. federal securities laws and the applicable rules and regulations of the Securities and Exchange Commission and the PCAOB.
We conducted our audits in accordance with the standards of the PCAOB. Those standards require that we plan and perform the audit to obtain reasonable assurance about whether the financial statements are free of material misstatement, whether due to error or fraud. The Company is not required to have, nor were we engaged to perform, an audit of its internal control over financial reporting. As part of our audits we are required to obtain an understanding of internal control over financial reporting but not for the purpose of expressing an opinion on the effectiveness of the Company's internal control over financial reporting. Accordingly, we express no such opinion.
Our audits included performing procedures to assess the risks of material misstatement of the financial statements, whether due to error or fraud, and performing procedures that respond to those risks. Such procedures included examining, on a test basis, evidence regarding the amounts and disclosures in the financial statements. Our audits also included evaluating the accounting principles used and significant estimates made by management, as well as evaluating the overall presentation of the financial statements. We believe that our audits provide a reasonable basis for our opinion.
/s/ RSM US LLP
We have served as the Company's auditor since 2014.
New York, New York
March 29, 2018, except for the last paragraph in the Investments section of Note 2, as to which the date is November 6, 2018
F- 1
Medley Management Inc.
Consolidated Balance Sheets
(Amounts in thousands, except share and per share amounts)
As of December 31, | |||||||
2017 | 2016 | ||||||
Assets | |||||||
Cash and cash equivalents | $ | 36,327 | $ | 49,666 | |||
Restricted cash equivalents | — | 4,897 | |||||
Investments, at fair value | 56,632 | 31,904 | |||||
Management fees receivable | 14,714 | 12,630 | |||||
Performance fees receivable | 2,987 | 4,961 | |||||
Other assets | 17,262 | 18,311 | |||||
Total Assets | $ | 127,922 | $ | 122,369 | |||
Liabilities, Redeemable Non-controlling Interests and Equity | |||||||
Liabilities | |||||||
Senior unsecured debt | $ | 116,892 | $ | 49,793 | |||
Loans payable | 9,233 | 52,178 | |||||
Accounts payable, accrued expenses and other liabilities | 25,130 | 37,255 | |||||
Total Liabilities | 151,255 | 139,226 | |||||
Commitments and Contingencies (Note 9) | |||||||
Redeemable Non-controlling Interests | 53,741 | 30,805 | |||||
Equity | |||||||
Class A common stock, $0.01 par value, 3,000,000,000 shares authorized; 6,235,332 and 6,042,050 issued as of December 31, 2017 and 2016, respectively; 5,481,068 and 5,809,130 outstanding as of December 31, 2017 and 2016, respectively | 55 | 58 | |||||
Class B common stock, $0.01 par value, 1,000,000 shares authorized; 100 shares issued and outstanding | — | — | |||||
Additional paid in capital | 2,820 | 3,310 | |||||
Accumulated other comprehensive (loss) income | (1,301 | ) | 33 | ||||
Accumulated deficit | (9,545 | ) | (5,254 | ) | |||
Total stockholders' deficit, Medley Management Inc. | (7,971 | ) | (1,853 | ) | |||
Non-controlling interests in consolidated subsidiaries | (1,702 | ) | (1,717 | ) | |||
Non-controlling interests in Medley LLC | (67,401 | ) | (44,092 | ) | |||
Total deficit | (77,074 | ) | (47,662 | ) | |||
Total Liabilities, Redeemable Non-controlling Interests and Equity | $ | 127,922 | $ | 122,369 | |||
See accompanying notes to consolidated financial statements
F- 2
Medley Management Inc.
Consolidated Statements of Operations
(Amounts in thousands, except share and per share amounts)
For the Years Ended December 31, | |||||||||||
2017 | 2016 | 2015 | |||||||||
Revenues | |||||||||||
Management fees (includes Part I incentive fees of $4,874, $14,209 and $21,487, respectively) | $ | 58,104 | $ | 65,496 | $ | 75,675 | |||||
Performance fees | (1,974 | ) | 2,443 | (3,055 | ) | ||||||
Other revenues and fees | 9,201 | 8,111 | 7,436 | ||||||||
Investment income (loss): | |||||||||||
Carried interest | 230 | (22 | ) | (12,630 | ) | ||||||
Other investment loss | (528 | ) | (87 | ) | (833 | ) | |||||
Total Revenues | 65,033 | 75,941 | 66,593 | ||||||||
Expenses | |||||||||||
Compensation and benefits | 27,432 | 27,800 | 26,768 | ||||||||
Performance fee compensation | (874 | ) | (319 | ) | (8,049 | ) | |||||
General, administrative and other expenses | 13,045 | 28,540 | 16,836 | ||||||||
Total Expenses | 39,603 | 56,021 | 35,555 | ||||||||
Other Income (Expense) | |||||||||||
Dividend income | 4,327 | 1,304 | 886 | ||||||||
Interest expense | (11,855 | ) | (9,226 | ) | (8,469 | ) | |||||
Other income (expense), net | 1,363 | (983 | ) | (808 | ) | ||||||
Total Other Expense, Net | (6,165 | ) | (8,905 | ) | (8,391 | ) | |||||
Income before income taxes | 19,265 | 11,015 | 22,647 | ||||||||
Provision for income taxes | 1,956 | 1,063 | 2,015 | ||||||||
Net Income | 17,309 | 9,952 | 20,632 | ||||||||
Net income (loss) attributable to redeemable non-controlling interests and non-controlling interests in consolidated subsidiaries | 6,718 | 2,549 | (885 | ) | |||||||
Net income attributable to non-controlling interests in Medley LLC | 9,664 | 6,406 | 18,406 | ||||||||
Net Income Attributable to Medley Management Inc. | $ | 927 | $ | 997 | $ | 3,111 | |||||
Dividends declared per share of Class A common stock | $ | 0.80 | $ | 0.80 | $ | 0.60 | |||||
Net Income Per Share of Class A Common Stock: | |||||||||||
Basic (Note 11) | $ | 0.07 | $ | 0.02 | $ | 0.46 | |||||
Diluted (Note 11) | $ | 0.07 | $ | 0.02 | $ | 0.46 | |||||
Weighted average shares outstanding - Basic and Diluted | 5,553,026 | 5,804,042 | 6,002,422 | ||||||||
See accompanying notes to consolidated financial statements
F- 3
Medley Management Inc.
Consolidated Statements of Comprehensive Income
(Amounts in thousands)
For the Year Ended December 31, | |||||||||||
2017 | 2016 | 2015 | |||||||||
Net Income | $ | 17,309 | $ | 9,952 | $ | 20,632 | |||||
Other Comprehensive Income: | |||||||||||
Change in fair value of available-for-sale securities (net of income tax benefit of $0.9 million for Medley Management Inc. and $0.3 million for non-controlling interests in Medley LLC for the year ended December 31, 2017, respectively) | (10,305 | ) | 194 | — | |||||||
Total Comprehensive Income | 7,004 | 10,146 | 20,632 | ||||||||
Comprehensive income (loss) attributable to redeemable non-controlling interests and non-controlling interests in consolidated subsidiaries | 6,690 | 2,577 | (885 | ) | |||||||
Comprehensive income attributable to non-controlling interests in Medley LLC | 721 | 6,539 | 18,406 | ||||||||
Comprehensive (Loss) Income Attributable to Medley Management Inc. | $ | (407 | ) | $ | 1,030 | $ | 3,111 | ||||
See accompanying notes to consolidated financial statements
F- 4
Medley Management Inc.
Consolidated Statement of Changes in Equity
(Amounts in thousands, except share and per share amounts)
Non-controlling Interests in Consolidated Funds | Class A Common Stock | Class B Common Stock | Additional Paid in Capital | Accumulated Other Comprehensive Income (Loss) | Accumulated Earnings (Deficit) | Non- controlling Interests in Consolidated Subsidiaries | Non- controlling Interests in Medley LLC | Total Equity (Deficit) | |||||||||||||||||||||||||||||||||
Shares | Dollars | Shares | Dollars | ||||||||||||||||||||||||||||||||||||||
Balance at December 31, 2014 | $ | 625,548 | 6,000,000 | $ | 60 | 100 | $ | — | $ | (2,384 | ) | $ | — | $ | 272 | $ | 1,526 | $ | (3,972 | ) | $ | 621,050 | |||||||||||||||||||
Deconsolidation of MOF I LP | (15,321 | ) | — | — | — | — | — | — | — | — | — | (15,321 | ) | ||||||||||||||||||||||||||||
Deconsolidation of MOF II LP | (610,227 | ) | — | — | — | — | — | — | — | — | — | (610,227 | ) | ||||||||||||||||||||||||||||
Net income | — | — | — | — | — | — | — | 3,111 | (885 | ) | 18,406 | 20,632 | |||||||||||||||||||||||||||||
Stock-based compensation | — | — | — | — | — | 3,052 | — | — | — | — | 3,052 | ||||||||||||||||||||||||||||||
Dividends on Class A common stock ($0.20 per share) | — | — | — | — | — | — | — | (4,113 | ) | — | — | (4,113 | ) | ||||||||||||||||||||||||||||
Excess tax benefit from dividends paid to RSU holders | — | — | — | — | — | 64 | — | — | — | 21 | 85 | ||||||||||||||||||||||||||||||
Issuance of Class A common stock related to vesting of restricted stock units, net of shares withheld for employee taxes | — | 10,646 | — | — | — | — | — | — | — | — | — | ||||||||||||||||||||||||||||||
Repurchases of Class A common stock | — | (16,705 | ) | — | — | — | (101 | ) | — | — | — | — | (101 | ) | |||||||||||||||||||||||||||
Contributions | — | — | — | — | — | — | — | — | — | — | — | ||||||||||||||||||||||||||||||
Distributions | — | — | — | — | — | — | — | — | (1,100 | ) | (31,644 | ) | (32,744 | ) | |||||||||||||||||||||||||||
Balance at December 31, 2015 | — | 5,993,941 | 60 | 100 | — | 631 | — | (730 | ) | (459 | ) | (17,189 | ) | (17,687 | ) | ||||||||||||||||||||||||||
Net income | — | — | — | — | — | — | — | 997 | (16 | ) | 6,406 | 7,387 | |||||||||||||||||||||||||||||
Change in fair value of available-for-sale securities, net of taxes | — | — | — | — | — | — | 33 | — | — | 133 | 166 | ||||||||||||||||||||||||||||||
Stock-based compensation | — | — | — | — | — | 3,811 | — | — | — | — | 3,811 | ||||||||||||||||||||||||||||||
Dividends on Class A common stock ($0.20 per share) | — | — | — | — | — | — | — | (5,521 | ) | — | — | (5,521 | ) | ||||||||||||||||||||||||||||
Excess tax benefit from dividends paid to RSU holders | — | — | — | — | — | 64 | — | — | — | 20 | 84 | ||||||||||||||||||||||||||||||
Issuance of Class A common stock related to vesting of restricted stock units, net of shares withheld for employee taxes | — | 31,404 | — | — | — | — | — | — | — | — | — | ||||||||||||||||||||||||||||||
Repurchases of Class A common stock | — | (216,215 | ) | (2 | ) | — | — | (1,196 | ) | — | — | — | — | (1,198 | ) | ||||||||||||||||||||||||||
Contributions | — | — | — | — | — | — | — | — | 12 | — | 12 | ||||||||||||||||||||||||||||||
Distributions | — | — | — | — | — | — | — | — | (1,547 | ) | (21,115 | ) | (22,662 | ) | |||||||||||||||||||||||||||
Reclassification of redeemable non-controlling interest | — | — | — | — | — | — | — | — | (41 | ) | (12,155 | ) | (12,196 | ) | |||||||||||||||||||||||||||
Issuance of non-controlling interests, at fair value | — | — | — | — | — | — | — | — | 334 | (192 | ) | 142 | |||||||||||||||||||||||||||||
Balance at December 31, 2016 | — | 5,809,130 | 58 | 100 | — | 3,310 | 33 | (5,254 | ) | (1,717 | ) | (44,092 | ) | (47,662 | ) | ||||||||||||||||||||||||||
Cumulative effect of accounting change due to the adoption of ASU 2016-09 | — | — | — | — | — | 1,039 | — | (120 | ) | — | (801 | ) | 118 | ||||||||||||||||||||||||||||
Net income | — | — | — | — | — | — | — | 927 | 16 | 9,664 | 10,607 | ||||||||||||||||||||||||||||||
Change in fair value of available-for-sale securities, net of income tax benefit | — | — | — | — | — | — | (1,334 | ) | — | — | (8,943 | ) | (10,277 | ) | |||||||||||||||||||||||||||
Stock-based compensation | — | — | — | — | — | 2,770 | — | — | — | — | 2,770 | ||||||||||||||||||||||||||||||
Dividends on Class A common stock ($0.20 per share) | — | — | — | — | — | — | — | (5,766 | ) | — | — | (5,766 | ) | ||||||||||||||||||||||||||||
Reclass of cumulative dividends on forfeited RSUs to compensation and benefits expense | — | — | — | — | — | — | — | 668 | — | — | 668 | ||||||||||||||||||||||||||||||
Issuance of Class A common stock related to vesting of restricted stock units, net of shares withheld for employee taxes | — | 193,282 | 2 | — | — | (715 | ) | — | — | — | — | (713 | ) | ||||||||||||||||||||||||||||
Repurchases of Class A common stock | — | (521,344 | ) | (5 | ) | — | — | (3,584 | ) | — | — | — | — | (3,589 | ) | ||||||||||||||||||||||||||
Distributions | — | — | — | — | — | — | — | — | (1 | ) | (23,229 | ) | (23,230 | ) | |||||||||||||||||||||||||||
Balance at December 31, 2017 | $ | — | 5,481,068 | $ | 55 | 100 | $ | — | $ | 2,820 | $ | (1,301 | ) | $ | (9,545 | ) | $ | (1,702 | ) | $ | (67,401 | ) | $ | (77,074 | ) | ||||||||||||||||
See accompanying notes to consolidated financial statements
F- 5
Medley Management Inc.
Consolidated Statements of Cash Flows
(Amounts in thousands)
For the Year Ended December 31, | |||||||||||
2017 | 2016 | 2015 | |||||||||
Cash flows from operating activities | |||||||||||
Net income | $ | 17,309 | $ | 9,952 | $ | 20,632 | |||||
Adjustments to reconcile net income to net cash provided by operating activities: | |||||||||||
Stock-based compensation | 2,770 | 3,811 | 3,052 | ||||||||
Amortization of debt issuance costs | 1,579 | 1,018 | 545 | ||||||||
Accretion of debt discount | 1,126 | 958 | 776 | ||||||||
Provision for (benefit from) deferred taxes | 424 | (267 | ) | (904 | ) | ||||||
Depreciation and amortization | 911 | 913 | 454 | ||||||||
Net change in unrealized depreciation (appreciation) on investments | 554 | (27 | ) | 885 | |||||||
(Income) loss from equity method investments | (274 | ) | 93 | 12,578 | |||||||
Reclassification of cumulative dividends paid on forfeited restricted stock units to compensation and benefits expense | 668 | — | — | ||||||||
Other non-cash amounts | (13 | ) | 169 | — | |||||||
Changes in operating assets and liabilities: | |||||||||||
Management fees receivable | (2,084 | ) | 3,542 | (999 | ) | ||||||
Performance fees receivable | 1,974 | (2,443 | ) | 3,055 | |||||||
Distributions of income received from equity method investments | 629 | 1,475 | — | ||||||||
Other assets | 1,674 | (1,617 | ) | (4,915 | ) | ||||||
Accounts payable, accrued expenses and other liabilities | (12,249 | ) | (1,682 | ) | (11,096 | ) | |||||
Investments of consolidated fund | (2,005 | ) | — | — | |||||||
Other assets of consolidated fund | (665 | ) | — | — | |||||||
Other liabilities of consolidated fund | 235 | — | — | ||||||||
Net cash provided by operating activities | 12,563 | 15,895 | 24,063 | ||||||||
Cash flows from investing activities | |||||||||||
Purchases of fixed assets | (73 | ) | (1,935 | ) | (795 | ) | |||||
Capital contributions to equity method investments | (322 | ) | (279 | ) | (1,074 | ) | |||||
Distributions received from equity method investment | 172 | 203 | 496 | ||||||||
Purchases of investments | (34,980 | ) | (16,815 | ) | — | ||||||
Net cash used in investing activities | (35,203 | ) | (18,826 | ) | (1,373 | ) | |||||
Cash flows from financing activities | |||||||||||
Repayments of loans payable | (44,800 | ) | (50,513 | ) | (1,250 | ) | |||||
Proceeds from issuance of senior unsecured debt | 69,108 | 52,588 | — | ||||||||
Capital contributions from redeemable non-controlling interests | 23,000 | 17,022 | — | ||||||||
Distributions to members and non-controlling interests | (29,968 | ) | (23,656 | ) | (32,744 | ) | |||||
Debt issuance costs | (2,868 | ) | (2,916 | ) | — | ||||||
Dividends paid | (5,766 | ) | (5,521 | ) | (4,113 | ) | |||||
Repurchases of Class A common stock | (3,589 | ) | (1,198 | ) | (101 | ) | |||||
Payments for taxes related to net share settlement of equity awards | (713 | ) | — | ||||||||
Net cash provided by (used in) financing activities | 4,404 | (14,194 | ) | (38,208 | ) | ||||||
Net decrease in cash, cash equivalents and restricted cash equivalents | (18,236 | ) | (17,125 | ) | (15,518 | ) | |||||
Cash, cash equivalents and restricted cash equivalents, beginning of year | 54,563 | 71,688 | 87,206 | ||||||||
Cash, cash equivalents and restricted cash equivalents, end of year | $ | 36,327 | $ | 54,563 | $ | 71,688 | |||||
See accompanying notes to consolidated financial statements
F- 6
Medley Management Inc.
Consolidated Statements of Cash Flows
(Amounts in thousands)
For the Year Ended December 31, | |||||||||||
2017 | 2016 | 2015 | |||||||||
Reconciliation of cash, cash equivalents, and restricted cash equivalents reported on the consolidated balance sheets to the total of such amounts reported on the consolidated statements of cash flows | |||||||||||
Cash and cash equivalents | $ | 36,327 | $ | 49,666 | $ | 71,688 | |||||
Restricted cash equivalents | — | 4,897 | — | ||||||||
Total cash, cash equivalents and restricted cash equivalents | $ | 36,327 | $ | 54,563 | $ | 71,688 | |||||
Supplemental cash flow information | |||||||||||
Interest paid | $ | 8,664 | $ | 7,992 | $ | 6,576 | |||||
Income taxes paid | 933 | 2,085 | 4,982 | ||||||||
Supplemental disclosure of non-cash investing and financing activities | |||||||||||
Investment in MOF I LP attributed to deconsolidation | $ | — | $ | — | $ | 1,768 | |||||
Investment in MOF II LP attributed to deconsolidation | — | — | 10,474 | ||||||||
Deferred tax asset impact on cumulative effect of accounting change due to the adoption of ASU 2016-09 (Note 2) | 118 | — | — | ||||||||
Reclassification of redeemable non-controlling interest (Note 14) | — | 12,155 | — | ||||||||
Fixed assets | — | 2,293 | — | ||||||||
Issuance of non-controlling interest, at fair value | — | 192 | — | ||||||||
Change in fair value of available-for-sale securities, net of income tax benefit | 10,306 | — | — | ||||||||
See accompanying notes to consolidated financial statements
F- 7
Medley Management Inc.
Notes to Consolidated Financial Statements
1. ORGANIZATION AND BASIS OF PRESENTATION
Medley Management Inc. is an alternative asset management firm offering yield solutions to retail and institutional investors. The Company's national direct origination franchise provides capital to the middle market in the United States of America. Medley Management Inc., through its consolidated subsidiary, Medley LLC, provides investment management services to permanent capital vehicles, long-dated private funds and separately managed accounts and serves as the general partner to the private funds, which are generally organized as pass-through entities. Medley LLC is headquartered in New York City.
The Company’s business is currently comprised of only one reportable segment, the investment management segment, and substantially all of the Company operations are conducted through this segment. The investment management segment provides investment management services to permanent capital vehicles, long-dated private funds and separately managed accounts. The Company conducts its investment management business in the U.S., where substantially all its revenues are generated.
Initial Public Offering of Medley Management Inc.
Medley Management Inc. was incorporated on June 13, 2014 and commenced operations on September 29, 2014 upon the completion of its initial public offering (“IPO”) of its Class A common stock. Medley Management Inc. raised $100.4 million, net of underwriting discount, through the issuance of 6,000,000 shares of Class A common stock at an offering price to the public of $18.00 per share. Medley Management Inc. used the offering proceeds to purchase 6,000,000 newly issued LLC Units (defined below) from Medley LLC. Prior to the IPO, Medley Management Inc. had not engaged in any business or other activities except in connection with its formation and IPO.
In connection with the IPO, Medley Management Inc. issued 100 shares of Class B common stock to Medley Group LLC (“Medley Group”), an entity wholly owned by the pre-IPO members of Medley LLC. For as long as the pre-IPO members and then-current Medley personnel hold at least 10% of the aggregate number of shares of Class A common stock and LLC Units (defined below) (excluding those LLC Units held by Medley Management Inc.) then outstanding, the Class B common stock entitles Medley Group to a number of votes that is equal to 10 times the aggregate number of LLC Units held by all non-managing members of Medley LLC that do not themselves hold shares of Class B common stock and entitle each other holder of Class B common stock, without regard to the number of shares of Class B common stock held by such other holder, to a number of votes that is equal to 10 times the number of membership units held by such holder. The Class B common stock does not participate in dividends and does not have any liquidation rights.
Medley LLC Reorganization
In connection with the IPO, Medley LLC amended and restated its limited liability agreement to modify its capital structure by reclassifying the 23,333,333 interests held by the pre-IPO members into a single new class of units (“LLC Units”). The pre-IPO members also entered into an exchange agreement under which they (or certain permitted transferees thereof) have the right, subject to the terms of an exchange agreement, to exchange their LLC Units for shares of Medley Management Inc.’s Class A common stock on a one-for-one basis, subject to customary conversion rate adjustments for stock splits, stock dividends and reclassifications. In addition, pursuant to the amended and restated limited liability agreement, Medley Management Inc. became the sole managing member of Medley LLC.
The pre-IPO owners were, subject to limited exceptions, prohibited from transferring any LLC Units held by them or any shares of Class A common stock received upon exchange of such LLC Units, until September 29, 2017, which was the third anniversary of the date of the closing of the IPO, without the Company’s consent. Thereafter and prior to the fourth and fifth anniversaries of the closing of the IPO, such holders may not transfer more than 33 1/3% and 66 2/3%, respectively, of the number of LLC Units held by them, together with the number of any shares of Class A common stock received by them upon exchange therefore, without the Company’s consent.
Basis of Presentation
The accompanying consolidated financial statements have been prepared on the accrual basis of accounting in conformity with U.S. generally accepted accounting principles (“GAAP”) and include the accounts of Medley Management Inc., Medley LLC and its consolidated subsidiaries (collectively, “Medley” or the “Company”).
F- 8
Medley Management Inc.
Notes to Consolidated Financial Statements
2. SUMMARY OF SIGNIFICANT ACCOUNTING POLICIES
Principles of Consolidation
In accordance with Accounting Standards Codification (“ASC”) 810, Consolidation, the Company consolidates those entities where it has a direct and indirect controlling financial interest based on either a variable interest model or voting interest model. As such, the Company consolidates entities that the Company concludes are variable interest entities (“VIEs”), for which the Company is deemed to be the primary beneficiary and entities in which it holds a majority voting interest or has majority ownership and control over the operational, financial and investing decisions of that entity.
In February 2015, the Financial Accounting Standards Board (“FASB”) issued ASU 2015-02, Consolidation (Topic 810) – Amendments to the Consolidation Analysis, which changes the consolidation analysis that a reporting entity must perform to determine whether it should consolidate certain types of legal entities. The Company elected to early adopt this new guidance using the modified retrospective method effective January 1, 2015. As a result of the adoption of ASU 2015-02, the Company determined that it is no longer the primary beneficiary of certain funds it manages. Therefore, the Company deconsolidated certain funds that had been consolidated under previous guidance effective January 1, 2015.
For legal entities evaluated for consolidation, the Company must determine whether the interests that it holds and fees paid to it qualify as a variable interest in an entity. This includes an evaluation of the management fees and performance fees paid to the Company when acting as a decision maker or service provider to the entity being evaluated. If fees received by the Company are customary and commensurate with the level of services provided, and the Company does not hold other economic interests in the entity that would absorb more than an insignificant amount of the expected losses or returns of the entity, the interest that the Company holds would not be considered a variable interest. The Company factors in all economic interests including proportionate interests through related parties, to determine if fees are considered a variable interest.
An entity in which the Company holds a variable interest is a VIE if any one of the following conditions exist: (a) the total equity investment at risk is not sufficient to permit the legal entity to finance its activities without additional subordinated financial support, (b) the holders of equity investment at risk have the right to direct the activities of the entity that most significantly impact the legal entity’s economic performance, (c) the voting rights of some investors are disproportionate to their obligation to absorb losses or rights to receive returns from a legal entity. For limited partnerships and other similar entities, non-controlling investors must have substantive rights to either dissolve the fund or remove the general partner (“kick-out rights”) in order to not qualify as a VIE.
For those entities that qualify as a VIE, the primary beneficiary is generally defined as the party who has a controlling financial interest in the VIE. The Company is generally deemed to have a controlling financial interest if it has the power to direct the activities of a VIE that most significantly impact the VIE’s economic performance, and the obligation to absorb losses or receive benefits from the VIE that could potentially be significant to the VIE. The Company determines whether it is the primary beneficiary of a VIE at the time it becomes initially involved with the VIE and reconsiders that conclusion continuously. The primary beneficiary evaluation is generally performed qualitatively on the basis of all facts and circumstances. However, quantitative information may also be considered in the analysis, as appropriate. These assessments require judgment. Each entity is assessed for consolidation on a case-by-case basis.
For those entities evaluated under the voting interest model, the Company consolidates the entity if it has a controlling financial interest. The Company has a controlling financial interest in a voting interest entity (“VOE”) if it owns a majority voting interest in the entity.
Consolidated Variable Interest Entities
Medley Management Inc. is the sole managing member of Medley LLC and, as such, it operates and controls all of the business and affairs of Medley LLC and, through Medley LLC, conducts its business. Under ASC 810, Medley LLC meets the definition of a VIE because the equity of Medley LLC is not sufficient to permit activities without additional subordinated financial support. Medley Management Inc. has the obligation to absorb expected losses that could be significant to Medley LLC and holds 100% of the voting power, therefore Medley Management Inc. is considered to be the primary beneficiary of Medley LLC.
As a result, Medley Management Inc. consolidates the financial results of Medley LLC and its subsidiaries and records a non-controlling interest for the economic interest in Medley LLC held by the non-managing members. Medley Management Inc.’s and the non-managing members’ economic interests in Medley LLC are 18.7% and 81.3%, respectively, as of December 31, 2017 and 19.9% and 80.1%, respectively, as of December 31, 2016. Net income attributable to the non-controlling interests in Medley LLC on the consolidated statements of operations represents the portion of earnings attributable to the economic interest in Medley LLC held by its non-managing members. Non-controlling interests in Medley LLC on the consolidated balance sheets represents the portion of net assets of Medley LLC attributable to the non-managing members based on total LLC Units of Medley LLC owned by such non-managing members.
F- 9
Medley Management Inc.
Notes to Consolidated Financial Statements
As of December 31, 2017 and 2016, Medley LLC had four majority owned subsidiaries, SIC Advisors LLC, Medley Seed Funding I LLC, Medley Seed Funding II LLC and STRF Advisors LLC, which are consolidated VIEs. Each of these entities were organized as a limited liability company and was legally formed to either manage a designated fund or to strategically invest capital as well as isolate business risk. As of December 31, 2017, total assets and total liabilities, after eliminating entries, of these VIEs reflected in the consolidated balance sheets were $63.3 million and $13.0 million, respectively. As of December 31, 2016, total assets and total liabilities, after eliminating entries, of these VIEs reflected in the consolidated balance sheets were $51.7 million and $22.8 million, respectively. Except to the extent of the assets of these VIEs that are consolidated, the holders of the consolidated VIEs’ liabilities generally do not have recourse to the Company.
Seed Investments
The Company accounts for seed investments through the application of the voting interest model under ASC 810-10-25-1 through 25-14 and consolidates a seed investment when the investment advisor holds a controlling interest, which is, in general, 50% or more of the equity in such investment. For seed investments in which the Company does not hold a controlling interest, the Company accounts for such seed investment under the equity method of accounting, at its ownership percentage of such seed investment’s net asset value.
The Company seed funded $2.1 million to Sierra Total Return Fund ("STRF"), which commenced investment operations in June 2017. As of December 31, 2017, the Company owned 100% of the equity of STRF and, as such, consolidated STRF in its consolidated financial statements.
The condensed balance sheet of STRF as of December 31, 2017 is presented in the table below (in thousands).
As of December 31, 2017 | |||
Assets | |||
Cash and cash equivalents | $ | 164 | |
Investments, at fair value | 2,005 | ||
Other assets | 1,698 | ||
Total assets | $ | 3,867 | |
Liabilities and Equity | |||
Accrued expenses and other liabilities | $ | 1,744 | |
Equity | 2,123 | ||
Total liabilities and equity | $ | 3,867 | |
The Company's consolidated balance sheet reflects the elimination of $1.0 million of other assets, $1.5 million of accrued expenses and other liabilities and $2.1 million of equity as a result of the consolidation of STRF. During the year ended December 31, 2017, the fund did not generate any significant income or losses from operations.
Non-Consolidated Variable Interest Entities
The Company holds interests in certain VIEs that are not consolidated because the Company is not deemed the primary beneficiary. The Company's interest in these entities is in the form of insignificant equity interests and fee arrangements. The maximum exposure to loss represents the potential loss of assets by the Company relating to these non-consolidated entities.
As of December 31, 2017, the Company recorded investments, at fair value, attributed to these non-consolidated VIEs of $4.8 million, receivables of $2.4 million included as a component of other assets and a clawback obligation of $7.2 million included as a component of accounts payable, accrued expenses and other liabilities on the Company’s consolidated balance sheets. The clawback obligation assumes a hypothetical liquidation of a fund’s investments, at their then current fair values and a portion of tax distributions relating to performance fees which would need to be returned. As of December 31, 2016, the Company recorded investments, at fair value, attributed to non-consolidated VIEs of $5.1 million, receivables of $1.9 million included as a component of other assets and a clawback obligation of $7.1 million included as a component of accounts payable, accrued expenses and other liabilities on the Company’s consolidated balance sheets. As of December 31, 2017, the Company’s maximum exposure to losses from these entities is $7.2 million.
Concentration of Credit and Market Risk
In the normal course of business, the Company's underlying funds encounter significant credit and market risk. Credit risk is the risk of default on investments in debt securities, loans and derivatives that result from a borrower's or derivative counterparty's inability or unwillingness to make required or expected payments. Credit risk is increased in situations where the Company's
F- 10
Medley Management Inc.
Notes to Consolidated Financial Statements
underlying funds are investing in distressed assets or unsecured or subordinate loans or in securities that are a material part of its respective business. Market risk reflects changes in the value of investments due to changes in interest rates, credit spreads or other market factors. The Company's underlying funds may make investments outside of the United States. These non-U.S. investments are subject to the same risks associated with U.S. investments, as well as additional risks, such as fluctuations in foreign currency exchange rates, unexpected changes in regulatory requirements, heightened risk of political and economic instability, difficulties in managing the investments, potentially adverse tax consequences, and the burden of complying with a wide variety of foreign laws.
Use of Estimates
The preparation of financial statements in conformity with U.S. GAAP requires management to make estimates and assumptions that affect the reported amounts of assets and liabilities and disclosures of contingent assets and liabilities at the date of the financial statements and the reported amounts of income and expenses during the reporting period. Management’s estimates are based on historical experience and other factors, including expectations of future events that management believes to be reasonable under the circumstances. These assumptions and estimates also require management to exercise judgment in the process of applying the Company’s accounting policies. Significant estimates and assumptions by management affect the carrying value of investments, performance compensation payable and certain accrued liabilities. Actual results could differ from these estimates, and such differences could be material.
Indemnification
In the normal course of business, the Company enters into contractual agreements that provide general indemnifications against losses, costs, claims and liabilities arising from the performance of individual obligations under such agreements. The Company has not experienced any prior claims or payments pursuant to such agreements. The Company’s individual maximum exposure under these arrangements is unknown, as this would involve future claims that may be made against the Company that have not yet occurred. However, based on management’s experience, the Company expects the risk of loss to be remote.
Non-Controlling Interests in Consolidated Subsidiaries
Non-controlling interests in consolidated subsidiaries represent the component of equity in such consolidated entities held by third-parties. These interests are adjusted for contributions to and distributions from Medley entities and are allocated income from Medley entities based on their ownership percentages.
Redeemable Non-Controlling Interests
Redeemable non-controlling interests represents interests of certain third parties that are not mandatorily redeemable but redeemable for cash or other assets at a fixed or determinable price or a fixed or determinable date, at the option of the holder or upon the occurrence of an event that is not solely within the control of the issuer. These interests are classified in the mezzanine section of the Company's consolidated balance sheets.
Cash and Cash Equivalents
Cash and cash equivalents include liquid investments in money market funds and demand deposits. The Company had cash balances with financial institutions in excess of Federal Deposit Insurance Corporation insured limits during the years ended December 31, 2017 and 2016. The Company monitors the credit standing of these financial institutions and has not experienced, and has no expectations of experiencing any losses with respect to such balances.
Restricted Cash Equivalents
Restricted cash equivalents consist of cash held at one of the Company's subsidiaries which was contributed by the Company and third-party investors, and could only be used to purchase investments in new and existing Medley managed funds.
Investments
Investments include equity method investments that are not consolidated but over which the Company exerts significant influence. The Company measures the carrying value of its public non-traded equity method investment at Net Asset Value ("NAV") per share. The Company measures the carrying value of its privately-held equity method investments by recording its share of the underlying income or loss of these entities.
Unrealized appreciation (depreciation) resulting from changes in fair value of the equity method investments is reflected as a component of other income (expense), net in the consolidated statements of operations. The Company evaluates its equity method investments for impairment whenever events or changes in circumstances indicate that the carrying amounts of such investments may not be recoverable.
F- 11
Medley Management Inc.
Notes to Consolidated Financial Statements
The carrying amounts of equity method investments are reflected in investments in the consolidated balance sheets. As the underlying entities that the Company manages and invests in are, for U.S. GAAP purposes, primarily investment companies which reflect their investments at estimated fair value, the carrying value of the Company’s equity method investments in such entities approximates fair value. The Company evaluates its equity-method investments for impairment whenever events or changes in circumstances indicate that the carrying amounts of such investments may not be recoverable.
For presentation in its consolidated statements of cash flows, the Company treats distributions received from certain equity method investments using the cumulative earnings approach. Under the cumulative earnings approach, an investor would compare the distributions received to its cumulative equity-method earnings since inception. Any distributions received up to the amount of cumulative equity earnings would be considered a return on investment and classified in operating activities. Any excess distributions would be considered a return of investment and classified in investing activities.
Investments also include available-for-sale securities which consist of an investment in publicly traded common stock. The Company measures the carrying value of its publicly traded investment in available-for-sale securities at the quoted market price on the primary market or exchange on which they trade. Unrealized appreciation (depreciation) resulting from changes in fair value of available-for-sale securities is recorded in accumulated other comprehensive income, redeemable non-controlling interests and non-controlling interests in Medley LLC. Realized gains (losses) and declines in value determined to be other than temporary, if any, are reported in other income (expenses), net. The Company evaluates its investment in available-for-sale securities for impairment whenever events or changes in circumstances indicate that the carrying amounts of such investment may not be recoverable.
In connection with the adoption of the new revenue recognition guidance, ASC 606, Revenue from Contracts with Customers, on January 1, 2018, the Company reassessed its accounting policy for performance fees earned during the period which represent a capital allocation to the general partner or investment manager. As a result of this reassessment the Company has determined that it should account for such performance fees within the scope of ASC 323, Investments - Equity Method and Joint Ventures. Accordingly, these performance fees are now classified as carried interest within investment income on the Company's consolidated statements of operations and balances due for such fees are included as a part of equity method investments within Investments, at fair value on the Company's consolidated balance sheets. The Company has applied this change in accounting principle on a full retrospective basis.
Fixed Assets
Fixed assets consist primarily of furniture, fixtures, computer equipment, and leasehold improvements and are recorded at cost, less accumulated depreciation and amortization.
The Company calculates depreciation expense for furniture, fixtures, and computer equipment using the straight-line method over the estimated useful life used for the respective assets, which generally ranges from three to seven years. Amortization of leasehold improvements is provided on a straightline basis over the shorter of the remaining term of the underlying lease or estimated useful life of the improvement. Useful lives of leasehold improvements range from three to eight years. Expenditures for major additions and improvements are capitalized, while minor replacements, maintenance and repairs are charged to expense as incurred. When property is retired or otherwise disposed of, the cost and accumulated depreciation are removed from accounts and any resulting gain or loss is reflected in Other income (expense), net in the consolidated statements of operations.
Debt Issuance Costs
Debt issuance costs represent direct costs incurred in obtaining financing and are amortized over the term of the underlying debt using the effective interest method. Debt issuance costs associated with the Company’s revolving credit facility are presented as a deferred charge and are included as a component of other assets on the Company's consolidated balance sheets. Debt issuance costs associated with the Company’s senior unsecured debt are presented as a direct reduction in the carrying value of such debt, consistent with the presentation of debt discount. Amortization of debt issuance costs is included as a component of interest expense in the Company's consolidated statement of operations.
Revenues
Management Fees
Medley provides investment management services to both public and private investment vehicles. Management fees include base management fees, other management fees, and Part I incentive fees, as described below.
Base management fees are calculated based on either (i) the average or ending gross assets balance for the relevant period, (ii) limited partners’ capital commitments to the funds, (iii) invested capital, (iv) NAV or (v) lower of cost or market value of a fund’s portfolio investments. Depending upon the contracted terms of the investment management agreement, management fees are paid either quarterly in advance or quarterly in arrears, and are recognized as earned over the period the services are provided.
F- 12
Medley Management Inc.
Notes to Consolidated Financial Statements
Certain management agreements provide for Medley to receive other management fee revenue derived from up front origination fees paid by the funds' and/or separately managed accounts' underlying portfolio companies. These fees are recognized when Medley becomes entitled to such fees.
Certain management agreements also provide for Medley to receive Part I incentive fee revenue derived from net investment income (excluding gains and losses) above a hurdle rate. As it relates to Medley Capital Corporation (“MCC”), these fees are subject to netting against realized and unrealized losses. Part I incentive fees are paid quarterly and are recognized as earned in the period the services are provided.
Performance Fees
Performance fees consist principally of the allocation of profits from certain funds and separately managed accounts, to which Medley provides management services. Medley is generally entitled to an allocation of income as a performance fee after returning the invested capital plus a specified preferred return as set forth in each respective agreement. Medley recognizes revenues attributable to performance fees based upon the amount that would be due pursuant to the respective agreement at each period end as if the funds were terminated as of that date (Method 2 of ASC 605, Revenue Recognition, revenue based on a formula). Accordingly, the amount recognized in the Company's consolidated financial statements reflects Medley’s share of the gains and losses of the associated funds’ underlying investments measured at their current fair values. Performance fee revenue may include reversals of previously recognized performance fees due to a decrease in the investment performance of a particular fund that results in a decrease of cumulative performance fees earned to date. Since fund return hurdles are cumulative, previously recognized performance fees also may be reversed in a period of appreciation that is lower than the particular fund’s hurdle rate. During the year ended December 31, 2017, the Company recorded reversals of $2.6 million of previously recognized performance fees. During the year ended December 31, 2016, the Company did not reverse previously recognized performance fees. During the year ended December 31, 2015, the Company reversed $24.0 million of previously recognized performance fees. As of December 31, 2017, the Company recognized cumulative performance fees of $5.3 million.
Performance fees received in prior periods may be required to be returned by Medley in future periods if the funds’ investment performance declines below certain levels. Each fund is considered separately in this regard and, for a given fund, performance fees can never be negative over the life of a fund. If upon a hypothetical liquidation of a fund’s investments, at their then current fair values, previously recognized and distributed performance fees would be required to be returned, a liability is established for the potential clawback obligation. As of December 31, 2017, the Company had not received any performance fee distributions, except for tax distributions related to the Company’s allocation of net income, which included an allocation of performance fees. Pursuant to the organizational documents of each respective fund, a portion of these tax distributions may be subject to clawback. As of December 31, 2017, the Company had accrued $7.2 million for clawback obligations that would need to be paid if the funds were liquidated at fair value as of the end of the reporting period. The Company’s actual obligation, however, would not become payable or realized until the end of a fund’s life.
Other Revenues and Fees
Medley provides administrative services to certain affiliated funds and is reimbursed for direct and allocated expenses incurred in providing such administrative services, as set forth in the respective underlying agreements. These fees are recognized as revenue in the period administrative services are rendered. Medley also acts as the administrative agent on certain deals for which Medley may earn loan administration fees and transaction fees. These fees are recognized as revenue over the period to which the fees directly relate.
Performance Fee Compensation
Medley has issued profit interests in certain subsidiaries to select employees. These profit-sharing arrangements are accounted for under ASC 710, Compensation — General, which requires compensation expense to be measured at fair value at the grant date and expensed over the vesting period, which is usually the period over which the service is provided. The fair value of the profit interests are re-measured at each balance sheet date and adjusted for changes in estimates of cash flows and vesting percentages. The impact of such changes is recorded in the consolidated statements of operations as an increase or decrease to performance fee compensation.
Stock-based Compensation
The Company accounts for stock-based compensation in accordance with ASC 718, Compensation – Stock Compensation. Stock-based compensation cost is measured as of the grant date based on the fair value of the award and is recognized as expense over the requisite service period.
Prior to January 1, 2017, the fair value of the awards were amortized on a straight line basis over the requisite service period as stock based compensation expense and was reduced for the impact of estimated forfeitures. The Company estimated forfeitures
F- 13
Medley Management Inc.
Notes to Consolidated Financial Statements
based on its historical experience and revised its estimate if actual forfeitures differed from its initial estimates. Effective January 1, 2017, the Company adopted a change in accounting policy as a result of the adoption of ASU 2016-09 to account for forfeitures as they occur. As such, stock based compensation expense relating to equity based awards are measured at fair value as of the grant date, reduced for actual forfeitures in the period they occur, and expensed over the requisite service period on a straight-line basis as a component of compensation and benefits on the Company's consolidated statements of operations.
Income Taxes
The Company accounts for income taxes using the asset and liability approach, which requires the recognition of tax benefits or expenses for temporary differences between the financial reporting and tax basis of assets and liabilities. A valuation allowance is established when necessary to reduce deferred tax assets to the amounts expected to be realized. The Company also recognizes a tax benefit from uncertain tax positions only if it is “more likely than not” that the position is sustainable based on its technical merits. The Company’s policy is to recognize interest and penalties on uncertain tax positions and other tax matters as a component of provision for income taxes. For interim periods, the Company accounts for income taxes based on its estimate of the effective tax rate for the year. Discrete items and changes in its estimate of the annual effective tax rate are recorded in the period they occur.
Medley Management Inc. is subject to U.S. federal, state and local corporate income taxes on its allocable portion of the income of Medley LLC at prevailing corporate tax rates. Medley LLC and its subsidiaries are not subject to federal, state and local corporate income taxes since all income, gains and losses are passed through to its members. However, a portion of taxable income from Medley LLC and its subsidiaries are subject to New York City’s unincorporated business tax, which is included in the Company’s provision for income taxes.
The Company analyzes its tax filing positions in all of the U.S. federal, state and local tax jurisdictions where it is required to file income tax returns, as well as for all open tax years in these jurisdictions. If, based on this analysis, the Company determines that uncertainties in tax positions exist, a liability is established.
Class A Earnings per Share
The Company computes and presents earnings per share using the two-class method. Under the two-class method, the Company allocates earnings between common stock and participating securities. The two-class method includes an earnings allocation formula that determines earnings per share for each class of common stock according to dividends declared and undistributed earnings for the period. For purposes of calculating earnings per share, the Company reduces its reported net earnings by the amount allocated to participating securities to arrive at the earnings allocated to Class A common stockholders. Earnings are then divided by the weighted average number of Class A common stock outstanding to arrive at basic earnings per share. Diluted earnings per share reflects the potential dilution beyond shares for basic earnings per share that could occur if securities or other contracts to issue common stock were exercised, converted into common stock, or resulted in the issuance of common stock that would have shared in our earnings. Participating securities consist of the Company's unvested restricted stock units that contain non-forfeitable rights to dividend equivalent payments, whether paid or unpaid, in the number of shares outstanding in its basic and diluted calculations.
Leases
Certain lease agreements contain escalating payments and rent holiday periods. The related rent expense is recorded on a straight-line basis over the length of the lease term. The difference between rent expense and rent paid is recorded as deferred rent. Leasehold improvements made by the lessee and funded by landlord allowances or other incentives are also recorded as deferred rent and are amortized as a reduction in rent expense over the term of the lease. Deferred rent is included as a component of accounts payable, accrued expenses and other liabilities on the consolidated balance sheets.
Recently Issued Accounting Pronouncements Adopted as of January 1, 2017
In March 2016, the FASB issued ASU 2016-09, Improvements to Employee Share-Based Payment Accounting, which simplifies and improves several aspects of the accounting for share-based payment transactions, including the income tax consequences, classification of awards as either equity or liabilities and classification on the statement of cash flows. The Company adopted ASU 2016-09 effective January 1, 2017.
Under the new guidance, all excess tax benefits and tax deficiencies related to employee stock compensation are recognized within provision for income taxes. Under prior guidance, excess tax benefits were recognized in additional paid-in capital and tax deficiencies were recognized in the provision for income taxes only to the extent they exceeded the pool of excess tax benefits. In addition, under the new guidance, excess tax benefits are classified as cash flows from operating activities, and cash withheld by the Company for employees' withholding taxes are classified as cash flows from financing activities on its consolidated statements of cash flows. In connection with the adoption of ASU 2016-09, the Company elected to account for forfeitures as they occur, instead of utilizing an estimated forfeiture rate assumption. The change in accounting for forfeitures was applied on a modified
F- 14
Medley Management Inc.
Notes to Consolidated Financial Statements
retrospective basis by means of a cumulative-effect adjustment to equity. As of January 1, 2017, retained earnings and non-controlling interests in Medley LLC decreased by $0.1 million and $0.8 million, respectively, additional paid in capital increased by $1.0 million and a deferred tax asset was recorded in the amount of $0.1 million to reflect the change in accounting principle.
Recently Issued Accounting Pronouncements Not Yet Adopted
In May 2014, the FASB issued ASU 2014-09, Revenue from Contracts with Customers (Topic 606), and since then, has issued several amendments intended to provide interpretive clarifications and to reduce the cost and complexity of applying the new revenue recognition standard, both at transition and on an ongoing basis. The core principle of this guidance is that an entity should recognize revenue to depict the transfer of promised goods or services to customers in an amount that reflects the consideration to which the entity expects to be entitled in exchange for such goods or services. To achieve this, entities will apply a five step approach: (1) identify the contract(s) with a customer, (2) identify the performance obligations within the contract, (3) determine the transaction price, (4) allocate the transaction price to the separate performance obligations and (5) recognize revenue when, or as, each performance obligation is satisfied. The guidance also requires advanced disclosures regarding the nature, amount, timing and uncertainty of revenue and cash flows arising from an entity’s contracts with customers.
This guidance became effective for the Company beginning on January 1, 2018 and entities had the option of adopting this guidance using either a full retrospective or a modified retrospective approach. The Company has adopted this guidance as of January 1, 2018 using the modified retrospective method. Under this method, the Company recognized the cumulative-effect of adoption of this guidance as an adjustment to equity as of January 1, 2018, as further described below, but did not restate prior periods presented in its consolidated financial statements.
Additionally, as of the date of adoption, the Company will no longer be deferring reimbursable organizational, offering and other pre-launch costs associated with a fund’s formation. Effective January 1, 2018, the Company will expense such costs as incurred until the respective fund commences operations and receives third party committed capital. Reimbursements for these costs will be recognized as a component of other revenues in the Company’s consolidated statements of operations when received.
As a result of the adoption of this new guidance, the Company recorded a cumulative effect decrease to equity of $3.7 million, pretax, as of January 1, 2018, which relates to (1) certain performance fee revenue that would not have met the “probable that significant reversal will not occur” criteria of $3.0 million and (2) the reversal of reimbursable fund formation costs which were deferred on the Company’s consolidated balance sheet of $0.7 million. Also, certain reimbursable costs incurred on behalf of the Company's funds that were previously presented net in the Company's consolidated statements of operations are now presented on a gross basis beginning January 1, 2018. There were no changes from the way the Company previously recognized management fees, administrative fees and loan administration fees as the result of its adoption of ASU 2014-09 or its change in accounting policy for performance fees earned which represent a capital allocation to the general partner or investment manager.
In January 2016, the FASB issued ASU 2016-01, Financial Instruments – Overall: Recognition and Measurement of Financial Assets and Financial Liabilities, which requires that all equity investments (except those accounted for under the equity method of accounting) be measured at fair value with changes in fair value recognized in net income. This guidance eliminates the available-for-sale classification for equity securities with readily determinable fair values. However, companies may elect to measure equity investments that do not have readily determinable fair values at cost minus impairment, if any, plus or minus changes resulting from observable price changes in orderly transactions for an identical or similar investment of the same issuer. This new guidance became effective for the Company on January 1, 2018. Under this new guidance, changes in the fair value of available-for-sale securities will no longer be classified in the Company's consolidated statements of comprehensive income but rather as a component of other income (expense), net in its consolidated statements of operations. As a result of the adoption of this ASU, on January 1, 2018, the Company reclassed $1.3 million of cumulative unrealized losses, net of income tax benefit, from accumulated other comprehensive (loss) income to accumulated deficit on the Company's consolidated balance sheet. The adoption of this ASU may have a significant impact to the consolidated statements of operations going forward as any changes to the fair value of our available-for-sale securities will now be reflected within other income in the Company's consolidated statements of operations.
In February 2016, the FASB issued ASU 2016-02, Leases (Topic 842). This guidance requires an entity to recognize assets and liabilities arising from a lease for both financing and operating leases, along with additional qualitative and quantitative disclosures. This new guidance will become effective for the Company on January 1, 2019, with early adoption permitted. The Company is currently evaluating the impact of adopting this standard on its consolidated financial statements. However, the adoption of this guidance is expected to result in a significant increase in total assets and total liabilities, but is not expected to have a significant impact on the consolidated statements of operations.
In May 2017, the FASB issued ASU 2017-09, Scope of Modification Accounting. This guidance clarifies when changes to share-based payment awards must be accounted for as modifications. The guidance requires an entity to apply modification accounting guidance if the value, vesting conditions or classification of the award changes but will provide relief to entities that make non-substantive changes to their share-based payment awards. This new guidance became effective for the Company on
F- 15
Medley Management Inc.
Notes to Consolidated Financial Statements
January 1, 2018. The Company has evaluated the impact of adopting this standard on its consolidated financial statements, and it did not have a significant impact on the Company's consolidated financial statements.
In February 2018, the FASB issued ASU 2018-02, Income Statement - Reporting Comprehensive Income (Topic 220): Reclassification of Certain Tax Effects from Accumulated Other Comprehensive Income. This guidance permits entities to reclassify tax effects stranded in accumulated other comprehensive income (OCI) as a result of tax reform to retained earnings. The final guidance gives entities the option to reclassify these amounts, but requires new disclosures, regardless of whether they elect to do so. An entity can apply this new guidance either (1) in the period of adoption or (2) retrospectively to each period in which the income tax effects of the Tax Cuts and Jobs Act related to items in accumulated OCI are recognized. The guidance is effective for fiscal years beginning after December 15, 2018, and interim periods within those fiscal years. Early adoption in any period is permitted. The adoption of this guidance is not expected to have a material impact on the Company's consolidated financial statements.
The Company does not believe any other recently issued, but not yet effective, revisions to authoritative guidance will have a material effect on its consolidated balance sheets, results of operations or cash flows.
3. INVESTMENTS
Investments consist of the following:
As of December 31, | |||||||
2017 | 2016 | ||||||
(Amounts in thousands) | |||||||
Equity method investments, at fair value | $ | 14,136 | $ | 14,895 | |||
Investment in available-for-sale securities | 40,491 | 17,009 | |||||
Investments of consolidated fund | 2,005 | — | |||||
Total investments, at fair value | $ | 56,632 | $ | 31,904 | |||
Equity Method Investments
Medley measures the carrying value of its public non-traded equity method investment at NAV per share. Unrealized appreciation (depreciation) resulting from changes in NAV per share is reflected as a component of other income (expense) in the consolidated statements of operations. The carrying value of the Company’s privately-held equity method investments is determined based on the amounts invested by the Company plus the equity in earnings or losses of the investee allocated based on the respective underlying agreements, less distributions received.
F- 16
Medley Management Inc.
Notes to Consolidated Financial Statements
The Company evaluates its equity method investments for impairment whenever events or changes in circumstances indicate that the carrying amounts of such investments may not be recoverable. There were no impairment losses recorded during the year ended December 31, 2017. During the year ended December 31, 2016, the Company recorded a $0.5 million loss on its investment in CK Pearl Fund which is included as a component of investment income (loss) on the consolidated statement of operations. There were no impairment losses recorded during the year ended December 31, 2015.
As of December 31, 2017 and 2016, the Company’s carrying value of its equity method investments was $14.1 million and $14.9 million, respectively. The Company's equity method investment in shares of Sierra Income Corporation (“SIC”), a related party, were $8.5 million and $9.0 million as of December 31, 2017 and 2016, respectively. The remaining balance as of December 31, 2017 and 2016 relates primarily to the Company’s investments in Medley Opportunity Fund II, LP ("MOF II"), Medley Opportunity Fund III LP (“MOF III”) and CK Pearl Fund, LP.
The entities in which the Company's investments are accounted for under the equity method, other than CK Pearl Fund, L.P., are considered to be related parties.
Investments in available-for-sale securities
The Company's investment in shares of Medley Capital Corporation ("MCC") is classified as available-for-sale securities. As of December 31, 2017 and 2016, the Company’s carrying value of its investment in shares of MCC, a related party, was $40.5 million and $17.0 million, respectively, and consisted of 7,756,938 and 2,264,892 shares, respectively. The Company measures the carrying value of its investment in MCC at fair value based on the quoted market price on the exchange on which its shares trade. As of December 31, 2017, cumulative unrealized losses in non-controlling interests in Medley LLC and accumulated other comprehensive income (loss), net of income tax benefit on the Company's consolidated balance sheets was $8.8 million, and $1.3 million respectively. As of December 31, 2017, there were no cumulative unrealized gains or losses included in the balance of redeemable non-controlling interests.
Investments of consolidated fund
Medley measures the carrying value of its investments held by its consolidated fund at fair value. As of December 31, 2017, investments of consolidated fund consisted of $0.4 million of equity investments and $1.6 million of investments in senior secured loans. The change in Investments of consolidated fund per the Company's consolidated statements of cash flows represents approximately $2.5 million in purchases offset by approximately $0.5 million of sales. See Note 4 "Fair Value Measurements" for more information.
4. FAIR VALUE MEASUREMENTS
The Company follows the guidance set forth in ASC 820 for measuring the fair value of investments in available-for-sale securities. Fair value is the price that would be received from the sale of an asset or paid to transfer a liability in an orderly transaction between market participants at the measurement date. Where available, fair value is based on observable market prices or parameters, or derived from such prices or parameters. Where observable prices or inputs are not available, valuation models are applied. These valuation models involve some level of management estimation and judgment, the degree of which is dependent on the price transparency for the instruments or market and the instruments’ complexity. The Company’s fair value analysis includes an analysis of the value of any unfunded loan commitments. Financial investments recorded at fair value in the consolidated financial statements are categorized for disclosure purposes based upon the level of judgment associated with the inputs to the valuation of the investment as of the measurement date. Investments which are valued using NAV as a practical expedient are excluded from this hierarchy:
• | Level I – Valuations based on quoted prices in active markets for identical assets or liabilities at the measurement date. |
• | Level II – Valuations based on inputs other than quoted prices in active markets included in Level I, which are either directly or indirectly observable at the measurement date. This category includes quoted prices for similar assets or liabilities in active markets, quoted prices for identical or similar assets or liabilities in non- active markets including actionable bids from third parties for privately held assets or liabilities, and observable inputs other than quoted prices such as yield curves and forward currency rates that are entered directly into valuation models to determine the value of derivatives or other assets or liabilities. |
• | Level III – Valuations based on inputs that are unobservable and where there is little, if any, market activity at the measurement date. The inputs for the determination of fair value may require significant management judgment or estimation and are based upon management’s assessment of the assumptions that market participants would use in pricing the assets and liabilities. These investments include debt and equity investments in private companies or assets valued using the Market or Income Approach and may involve pricing models whose inputs require significant judgment or estimation because of the absence of any meaningful current market data for identical or similar |
F- 17
Medley Management Inc.
Notes to Consolidated Financial Statements
investments. The inputs in these valuations may include, but are not limited to, capitalization and discount rates, beta and EBITDA multiples. The information may also include pricing information or broker quotes which include a disclaimer that the broker would not be held to such a price in an actual transaction. The non-binding nature of consensus pricing and/or quotes accompanied by disclaimer would result in classification as Level III information, assuming no additional corroborating evidence.
The following tables summarize the fair value hierarchy of the Company's financial assets measured at fair value (in thousands):
As of December 31, 2017 | |||||||||||||||
Level I | Level II | Level III | Total | ||||||||||||
Assets | |||||||||||||||
Investments of consolidated fund | $ | 435 | $ | — | $ | 1,570 | $ | 2,005 | |||||||
Investment in available-for-sale securities | 40,491 | — | — | 40,491 | |||||||||||
Total Assets | $ | 40,926 | $ | — | $ | 1,570 | $ | 42,496 | |||||||
As of December 31, 2016 | |||||||||||||||
Level I | Level II | Level III | Total | ||||||||||||
Assets | |||||||||||||||
Investment in available-for-sale securities | $ | 17,009 | $ | — | $ | — | $ | 17,009 | |||||||
Total Assets | $ | 17,009 | $ | — | $ | — | $ | 17,009 | |||||||
The Company’s investment in available-for-sale securities consist of shares of MCC. Included in investments of consolidated fund as of December 31, 2017 are Level I assets of $0.4 million in equity investments and Level III assets of $1.6 million, which consists of senior secured loans and preferred equity investments. The significant unobservable inputs used in the fair value measurement of Level III assets of the consolidated fund's investments in senior secured loans include market yields. Significant increases or decreases in market yields in isolation would result in a significantly higher or lower fair value measurement. There were no significant unrealized gains or losses related to the investments of consolidated fund for the year ended December 31, 2017.
The following is a summary of changes in fair value of the Company's financial assets that have been categorized within Level III of the fair value hierarchy at December 31, 2017 (in thousands):
Level III Financial Assets as of December 31, 2017 | |||||||||||||||||||
Balance at December 31, 2016 | Purchases | Transfers In or (Out) of Level III | Sale of Level III Assets | Balance at December 31, 2017 | |||||||||||||||
Investments of consolidated fund | $ | — | $ | 1,894 | $ | — | $ | (324 | ) | $ | 1,570 | ||||||||
A review of the fair value hierarchy classifications is conducted on a quarterly basis. Changes in the observability of valuation inputs may result in a reclassification for certain financial assets or liabilities. Reclassifications impacting all levels of the fair value hierarchy are reported as transfers in or out of Level I, II or III category as of the beginning of the quarter during which the reclassifications occur. There were no transfers between levels in the fair value hierarchy during the year ended December 31, 2017.
There were no financial instruments classified as Level II or Level III as of December 31, 2016 and there were no transfers between levels in the fair value hierarchy during the year ended December 31, 2016.
When determining the fair value of publicly traded equity securities, the Company uses the quoted closing market price as of the valuation date on the primary market or exchange on which they trade. Our equity method investments for which fair value is measured at NAV per share, or its equivalent, using the practical expedient, are not categorized in the fair value hierarchy.
The Company's Investments of consolidated fund are accounted for under a manner consistent with trading securities as STRF is considered an investment company under ASC 946 for standalone reporting purposes, and its investments are therefore also treated in a manner consistent with trading securities.
F- 18
Medley Management Inc.
Notes to Consolidated Financial Statements
5. OTHER ASSETS
Other assets consist of the following:
As of December 31, | |||||||
2017 | 2016 | ||||||
(Amounts in thousands) | |||||||
Fixed assets, net of accumulated depreciation and amortization of $2,370 and $1,816, respectively | $ | 4,160 | $ | 4,998 | |||
Security deposits | 1,975 | 1,975 | |||||
Administrative fees receivable (Note 10) | 1,903 | 2,068 | |||||
Deferred tax assets (Note 12) | 2,777 | 2,001 | |||||
Due from affiliates (Note 10) | 2,979 | 2,133 | |||||
Prepaid expenses and taxes | 1,353 | 3,078 | |||||
Other assets, excluding assets of consolidated fund | 1,450 | 2,058 | |||||
Other assets of consolidated fund | 665 | — | |||||
Total other assets | $ | 17,262 | $ | 18,311 | |||
6. LOANS PAYABLE
Loans payable consist of the following:
As of December 31, | |||||||
2017 | 2016 | ||||||
(Amounts in thousands) | |||||||
Term loans under the Credit Suisse Term Loan Facility, net of unamortized discount and debt issuance costs of $1,207 at December 31, 2016 | $ | — | $ | 43,593 | |||
Non-recourse promissory notes, net of unamortized discount of $767 and $1,415, respectively | 9,233 | 8,585 | |||||
Total loans payable | $ | 9,233 | $ | 52,178 | |||
CNB Credit Agreement
On August 19, 2014, the Company entered into a $15.0 million senior secured revolving credit facility with City National Bank, which was amended in August 2015, May 2016 and September 2017 (as amended, the “Revolving Credit Facility”). Pursuant to the terms of the amendment in September 2017 ("the Amendment"), the maturity date was extended to March 31, 2020. The Amendment also provides for an incremental facility in an amount up to $10.0 million upon the fulfillment of certain customary conditions, as well as other changes. The Company intends to use any proceeds from borrowings under the Revolving Credit Facility for general corporate purposes, including funding of its working capital needs. Borrowings under the Revolving Credit Facility bear interest, at the option of the Company, either (i) at an Alternate Base Rate, as defined, plus an applicable margin not to exceed 0.25% or (ii) at an Adjusted LIBOR plus an applicable margin not to exceed 2.5%. As of and during the year ended December 31, 2017, there were no amounts drawn under the Revolving Credit Facility. The capitalized terms below are defined in the Revolving Credit Facility, where applicable.
The Revolving Credit Facility also contains financial covenants that require the Company to maintain a Maximum Net Leverage Ratio, as defined, of not greater than 5.0 to 1.0, a Total Leverage Ratio, as defined, of not greater than 7.0 to 1.0 and Core EBITDA, as defined, of not less than $15.0 million. These ratios are calculated on a trailing twelve months basis and are calculated using the Company’s financial results and include adjustments made to calculate Core EBITDA. Non-compliance with any of the financial or non-financial covenants without cure or waiver would constitute an event of default. The Revolving Credit Facility also contains customary negative covenants and other customary events of default, including defaults based on events of bankruptcy and insolvency, dissolution, nonpayment of principal, interest or fees when due, breach of specified covenants, change in control and material inaccuracy of representations and warranties. There were no events of default under the Revolving Credit Facility as of December 31, 2017.
F- 19
Medley Management Inc.
Notes to Consolidated Financial Statements
Credit Suisse Term Loan Facility
On August 14, 2014, the Company entered into a $110.0 million senior secured term loan credit facility (as amended, “Term Loan Facility”) with Credit Suisse AG, Cayman Islands Branch, as administrative agent and collateral agent thereunder, Credit Suisse Securities (USA) LLC, as bookrunner and lead arranger, and the lenders from time-to-time party thereto, which had an original maturity date of June 15, 2019. In February 2017, borrowings under this facility were paid off using the proceeds from the issuance of senior unsecured debt and the Term Loan Facility was terminated.
Interest expense under the Term Loan Facility, including accretion of the note discount and amortization of debt issuance costs, as well as the deferred issuance costs associated with the Revolving Credit facility, for the year ending December 31, 2017, 2016 and 2015 was $1.6 million, $6.7 million, and $7.0 million, respectively.
Non-Recourse Promissory Notes
In April 2012, the Company borrowed $10.0 million under two non-recourse promissory notes. Proceeds from the borrowings were used to purchase 1,108,033 shares of common stock of SIC, which were pledged as collateral for the obligations. Interest on the notes is paid monthly and is equal to the dividends received by the Company related to the pledged shares. The Company may prepay the notes in whole or in part at any time without penalty and the lenders may call the notes if certain conditions are met. The notes are scheduled to mature in March 2019. The proceeds from the notes were recorded net of issuance costs of $3.8 million and are being accreted, using the effective interest method, over the term of the non-recourse promissory notes. Total interest expense under these notes, including accretion of the notes discount, was $1.4 million for each of the years ended December 31, 2017, 2016 and 2015. The fair value of the outstanding balance of the notes was $10.1 million and $10.2 million as of December 31, 2017 and 2016, respectively.
Contractual Maturities of Loans Payable
As of December 31, 2017, $10.0 million of future principal payments will be due, relating to loans payable, during the year ended December 31, 2019.
7. SENIOR UNSECURED DEBT
The carrying value of the Company’s senior unsecured debt consist of the following:
As of December 31, | |||||||
2017 | 2016 | ||||||
(Amounts in thousands) | |||||||
2026 Notes, net of unamortized discount and debt issuance costs of $3,266 and $3,802, respectively | $ | 50,329 | $ | 49,793 | |||
2024 Notes, net of unamortized premium and debt issuance costs of $2,437 at December 31, 2017 | 66,563 | — | |||||
Total senior unsecured debt | $ | 116,892 | $ | 49,793 | |||
2026 Notes
On August 9, 2016 and October 18, 2016, the Company issued debt consisting of $53.6 million in aggregate principal amount of senior unsecured notes due 2026 at a stated coupon rate of 6.875% (the "2026 Notes"). The net proceeds from these offerings were used to pay down a portion of the Company's outstanding indebtedness under its Term Loan Facility. Interest is payable quarterly and interest payments commenced on November 15, 2016. The 2026 Notes are subject to redemption in whole or in part at any time or from time to time, at the option of the Company, on or after August 15, 2019 at a redemption price per security equal to 100% of the outstanding principal amount thereof plus accrued and unpaid interest payments. The 2026 notes were recorded net of discount and direct issuance costs of $3.8 million which are being amortized over the term of the notes using the effective interest rate method. The 2026 Notes are listed on the New York Stock Exchange and trades thereon under the trading symbol “MDLX.” The fair value of the 2026 Notes based on their underlying quoted market price was $53.1 million as of December 31, 2017.
Interest expense on the 2026 Notes, including accretion of note discount and amortization of debt issuance costs, was $4.0 million and $1.2 million for the years ended December 31, 2017 and 2016, respectively.
2024 Notes
On January 18, 2017 and February 22, 2017, the Company issued $69.0 million in aggregate principal amount of senior unsecured notes due 2024 at a stated coupon rate of 7.25% (the "2024 Notes"). The net proceeds from these offerings were used
F- 20
Medley Management Inc.
Notes to Consolidated Financial Statements
to pay down the remaining portion of the Company's outstanding indebtedness under its Term Loan Facility with the remaining to be used for general corporate purposes. Interest is payable quarterly and interest payments commenced on April 30, 2017. The 2024 Notes are subject to redemption in whole or in part at any time or from time to time, at the option of the Company, on or after January 30, 2020 at a redemption price per security equal to 100% of the outstanding principal amount thereof plus accrued and unpaid interest payments. The 2024 notes were recorded net of premium and direct issuance costs of $2.8 million which are being amortized over the term of the notes using the effective interest rate method. The 2024 Notes are listed on the New York Stock Exchange and trades thereon under the trading symbol “MDLQ.” The fair value of the 2024 Notes based on their underlying quoted market price was $69.6 million as of December 31, 2017.
Interest expense on the 2024 Notes, including amortization of debt premium and debt issuance costs, was $4.9 million for the year ended December 31, 2017.
8. ACCOUNTS PAYABLE, ACCRUED EXPENSES AND OTHER LIABILITIES
Accounts payable, accrued expenses and other liabilities consist of the following:
As of December 31, | |||||||
2017 | 2016 | ||||||
(Amounts in thousands) | |||||||
Accrued compensation and benefits | $ | 6,835 | $ | 7,978 | |||
Due to affiliates (Note 10) | 7,315 | 15,043 | |||||
Revenue share payable (Note 9) | 3,841 | 6,472 | |||||
Accrued interest | 1,294 | 558 | |||||
Professional fees | 1,366 | 1,527 | |||||
Deferred rent | 2,506 | 2,833 | |||||
Deferred tax liabilities (Note 12) | 92 | 202 | |||||
Performance fee compensation | 111 | 985 | |||||
Accounts payable and other accrued expenses | 1,535 | 1,657 | |||||
Liabilities of consolidated fund | 235 | — | |||||
Total accounts payable, accrued expenses and other liabilities | $ | 25,130 | $ | 37,255 | |||
9. COMMITMENTS AND CONTINGENCIES
Operating Leases
Medley leases office space in New York City and San Francisco under non-cancelable lease agreements that expire at various times through September 2023. Rent expense was $2.4 million, $2.5 million and $2.6 million for the years ended December 31, 2017, 2016 and 2015, respectively.
As of December 31, 2017. future minimum rental payments under non-cancelable leases are as follows (in thousands):
2018 | $ | 2,704 | |
2019 | 2,710 | ||
2020 | 2,833 | ||
2021 | 2,431 | ||
2022 | 2,431 | ||
Thereafter | 1,823 | ||
Total future minimum lease payments | $ | 14,932 | |
During the first quarter of 2018, the Company initiated the consolidation of its business activities to its New York office. The Company believes this will enhance operations by consolidating origination, underwriting and asset management operations and personnel in a single location. The Company estimates the associated one-time costs to be approximately $2.6 million, primarily related to certain severance costs. The Company anticipates that most of these charges will be recognized during the first and second quarters of 2018. At this time, the Company does not anticipate a material change in overall headcount upon completion of the consolidation.
F- 21
Medley Management Inc.
Notes to Consolidated Financial Statements
Capital Commitments to Funds
As of December 31, 2017 and 2016, the Company had aggregate unfunded commitments of $0.3 million and $0.5 million, respectively, to certain long-dated private funds.
Other Commitments
In April 2012, the Company entered into an obligation to pay a fixed percentage of management and incentive fees received by the Company from SIC. The agreement was entered into contemporaneously with the $10.0 million non-recourse promissory notes that were issued to the same parties (Note 6). The two transactions were deemed to be related freestanding contracts and the $10.0 million of loan proceeds were allocated to the contracts using their relative fair values. At inception, the Company recognized an obligation of $4.4 million representing the present value of the future cash flows expected to be paid under this agreement. As of December 31, 2017 and 2016, this obligation amounted to $3.8 million and $6.5 million, respectively, and is recorded as revenue share payable, a component of accounts payable, accrued expenses and other liabilities on the consolidated balance sheets. The change in the estimated cash flows for this obligation is recorded in other income (expense), net on the consolidated statements of operations.
Legal Proceedings
From time to time, the Company is involved in various legal proceedings, lawsuits and claims incidental to the conduct of its business. Its business is also subject to extensive regulation, which may result in regulatory proceedings against it. Except as described below, the Company is not currently party to any material legal proceedings.
One of the Company's subsidiaries, MCC Advisors LLC, was named as a defendant in a lawsuit on May 29, 2015, by Moshe Barkat and Modern VideoFilm Holdings, LLC (“MVF Holdings”) against MCC, MOF II, MCC Advisors LLC, Deloitte Transactions and Business Analytics LLP A/K/A Deloitte ERG (“Deloitte”), Scott Avila (“Avila”), Charles Sweet, and Modern VideoFilm, Inc. (“MVF”). The lawsuit is pending in the California Superior Court, Los Angeles County, Central District, as Case No. BC 583437. The lawsuit was filed after MCC, as agent for the lender group, exercised remedies following a series of defaults by MVF and MVF Holdings on a secured loan with an outstanding balance at the time in excess of $65 million. The lawsuit sought damages in excess of $100 million. Deloitte and Avila have settled the claims against them in exchange for payment of $1.5 million. Following a separate lawsuit by Mr. Barkat against MVF’s D&O insurance carrier, the carrier, Charles Sweet and MVF have settled the claims against them. On June 6, 2016, the court granted the Medley defendants’ demurrers on several counts and dismissed Mr. Barkat’s claims with prejudice except with respect to his claim for intentional interference with contract. On March 18, 2018, the court granted the Medley defendants’ motion for summary adjudication with respect to Mr. Barkat’s sole remaining claim against the Medley Defendants for intentional interference. Now that the trial court has ruled in favor of the Medley defendants on all counts, the only remaining claims in the Barkat litigation are MCC and MOF II’s affirmative counterclaims against Mr. Barkat and MVF Holdings, which MCC and MOF II are diligently prosecuting.
On August 29, 2016, MVF Holdings filed another lawsuit in the California Superior Court, Los Angeles County, Central District, as Case No. BC 631888 (the “Derivative Action”), naming MCC Advisors LLC and certain of Medley’s employees as defendants, among others. The plaintiff in the Derivative Action, asserts claims against the defendants for breach of fiduciary duty, aiding and abetting breach of fiduciary duty, unfair competition, breach of the implied covenant of good faith and fair dealing, interference with prospective economic advantage, fraud, and declaratory relief. MCC Advisors LLC and the other defendants believe the causes of action asserted in the Derivative Action are without merit and all defendants intend to continue to assert a vigorous defense.
Medley LLC, MCC, and MOF II were named as defendants, along with other various parties, in a putative class action lawsuit captioned as Royce Solomon, Jodi Belleci, Michael Littlejohn, and Giulianna Lomaglio v. American Web Loan, Inc., AWL, Inc., Mark Curry, MacFarlane Group, Inc., The MacFarlane Group, LLC, Sol Partners, Medley Opportunity Fund, II, LP, Medley LLC, Medley Capital Corporation, Oakmont Funding, Inc., Dinero Investments, Inc., Chieftain Funding, Inc., Dant Holdings, Inc., DHI Computing Service, Inc., Smith Haynes & Watson, LLC, Middlemarch Partners, and John Does 1-100, filed on December 15, 2017, in the United States District Court for the Eastern District of Virginia, Newport News Division, as Case No. 4:17-cv-145 (hereinafter, “Class Action 1”). MOF II and MCC were also named as defendants, along with various other parties, in a putative class action lawsuit captioned George Hengle and Lula Williams v. Mark Curry, American Web Loan, Inc., AWL, Inc., Red Stone, Inc., Medley Opportunity Fund II LP, and Medley Capital Corporation, filed February 13, 2018, in the United States District Court, Eastern District of Virginia, Richmond Division, as Case No. 3:18-cv-100 (“Class Action 2”) (together with Class Action 1, the “Class Action Complaints”). The plaintiffs in the Class Action Complaints filed their putative class actions alleging claims under the Racketeer Influenced and Corrupt Organizations Act, and various other claims arising out of the alleged payday lending activities of American Web Loan. The claims against MOF II, Medley LLC, and MCC (in Class Action 1), and the claims against MOF II and MCC (in Class Action 2), allege that those defendants in each respective action exercised control over American Web Loan’s payday lending activities as a result of a loan to American Web Loan. The loan was made by MOF II in 2011. American Web Loan
F- 22
Medley Management Inc.
Notes to Consolidated Financial Statements
repaid the loan from MOF II in full in February of 2015, more than 1 year and 10 months prior to any of the loans allegedly made by American Web Loan to the alleged class plaintiff representatives in Class Action 1; in Class Action 2, the alleged class plaintiff representatives have not alleged when they received any loans from American Web Loan. Medley LLC and MCC never made any loans or provided financing to, or had any other relationship with, American Web Loan. MOF II, Medley LLC, and MCC are seeking indemnification from American Web Loan, various affiliates, and other parties with respect to the claims in the Class Action Complaints. MOF II, Medley LLC, and MCC believe the alleged claims in the Class Action Complaints are without merit and they intend to defend these lawsuits vigorously.
10. RELATED PARTY TRANSACTIONS
Substantially all of Medley’s revenue is earned through agreements with its non-consolidated funds for which it collects management and performance fees for providing investment and management services.
Expense Support and Reimbursement Agreement
From June 2012 through December 2016, Medley was party to an Expense Support and Reimbursement Agreement (“ESA”) with SIC. During the term of the ESA, which expired on December 31, 2016, Medley agreed to pay up to 100% of SIC's operating expenses in order for SIC to achieve a reasonable level of expenses relative to its investment income. Pursuant to the ESA, SIC had a conditional obligation to reimburse Medley for any amounts they funded under the ESA if, within three years of the date on which Medley funded such amounts, SIC met certain financial levels. ESA expenses are recorded within general, administrative, and other expense on the consolidated statements of operations. There was no outstanding balance due to SIC under the ESA agreement as of December 31, 2017. As of December 31, 2016 there was $7.9 million due to SIC under the ESA agreement. This amount was included in accounts payable, accrued expenses and other liabilities as due to affiliates on the consolidated balance sheets. During the years ended December 31, 2016 and 2015, Medley recorded $16.1 million and $6.4 million, respectively, of ESA expenses under this agreement.
Administration Agreement
In January 2011 and April 2012, Medley entered into administration agreements with MCC (the “MCC Admin Agreement”) and SIC (the “SIC Admin Agreement”), respectively, whereby Medley agreed to provide administrative services necessary for the operations of MCC and SIC. MCC and SIC agreed to pay Medley for the costs and expenses incurred in providing such administrative services, including an allocable portion of Medley’s overhead expenses and an allocable portion of the cost of MCC and SIC’s officers and their respective staffs.
Additionally, Medley has entered into administration agreements with other entities that it manages (the “Funds Admin Agreements”), whereby Medley agreed to provide administrative services necessary for the operations of these other vehicles. These other entities agreed to pay Medley for the costs and expenses incurred in providing such administrative services, including an allocable portion of Medley’s overhead expenses and an allocable portion of the cost of these other vehicles' officers and their respective staffs.
Medley records these administrative fees as revenue in the period when the services are provided and are included in other revenues and fees on the consolidated statements of operations. Amounts due from these agreements are included as a component of other assets on the Company's consolidated balance sheets.
Total revenues recorded under these agreements for the years ended December 31, 2017, 2016 and 2015 are reflected in the table below:
For the Years Ended December 31, | |||||||||||
2017 | 2016 | 2015 | |||||||||
(Amounts in thousands) | |||||||||||
MCC Admin Agreement | $ | 3,799 | $ | 3,935 | $ | 3,973 | |||||
SIC Admin Agreement | 3,031 | 2,848 | 2,142 | ||||||||
Funds Admin Agreements | 1,264 | 893 | 218 | ||||||||
Total administrative fees from related parties | $ | 8,094 | $ | 7,676 | $ | 6,333 | |||||
F- 23
Medley Management Inc.
Notes to Consolidated Financial Statements
Amounts due from related parties under these agreements are reflected in the table below:
As of December 31, | |||||||
2017 | 2016 | ||||||
(Amounts in thousands) | |||||||
Amounts due from MCC under the MCC Admin Agreement | $ | 867 | $ | 916 | |||
Amounts due from SIC under the SIC Admin Agreement | 696 | 851 | |||||
Amounts due from entities under the Funds Admin Agreements | 340 | 301 | |||||
Total administrative fees receivable | $ | 1,903 | $ | 2,068 | |||
Investments
Refer to Note 3 "Investments" for more information related to the Company's investments in related parties.
Exchange Agreement
Prior to the completion of the Company's IPO, Medley LLC's limited liability agreement was restated among other things, to modify its capital structure by reclassifying the interests held by its existing owners (i.e. the members of Medley prior to the IPO) into the LLC Units. Medley’s existing owners also entered into an exchange agreement under which they (or certain permitted transferees thereof) have the right (subject to the terms of the exchange agreement as described therein), to exchange their LLC Units for shares of Medley Management Inc.’s Class A common stock on a one-for-one basis at fair value, subject to customary conversion rate adjustments for stock splits, stock dividends and reclassifications.
Tax Receivable Agreement
Medley Management Inc. entered into a tax receivable agreement with the holders of LLC Units that provides for the payment by Medley Management Inc. to exchanging holders of LLC Units of 85% of the benefits, if any, that Medley Management Inc. is deemed to realize as a result of increases in tax basis of tangible and intangible assets of Medley LLC from the future exchange of LLC Units for shares of Class A common stock, as well as certain other tax benefits related to entering into the tax receivable agreement, including tax benefits attributable to payments under the tax receivable agreement.
The term of the tax receivable agreement will continue until all such tax benefits under the agreement have been utilized or have expired, unless Medley Management Inc. exercises its right to terminate the tax receivable agreement for an amount based on an agreed value of payments remaining to be made under the agreement. There have been no transactions under this agreement through December 31, 2017.
11. EARNINGS PER CLASS A SHARE
The table below presents basic and diluted net income per share of Class A common stock using the two-class method for the years ended December 31, 2017, 2016 and 2015, respectively:
For the Years Ended December 31, | |||||||||||
2017 | 2016 | 2015 | |||||||||
(Amounts in thousands, except share and per share amounts) | |||||||||||
Basic and diluted net income per share: | |||||||||||
Numerator | |||||||||||
Net income attributable to Medley Management Inc. | $ | 927 | $ | 997 | $ | 3,111 | |||||
Less: Allocation to participating securities | (551 | ) | (892 | ) | (353 | ) | |||||
Net income available to Class A common stockholders | $ | 376 | $ | 105 | $ | 2,758 | |||||
Denominator | |||||||||||
Weighted average shares of Class A common stock outstanding | 5,553,026 | 5,804,042 | 6,002,422 | ||||||||
Net income per Class A share | $ | 0.07 | $ | 0.02 | $ | 0.46 | |||||
The allocation to participating securities above generally represents dividends paid to holders of unvested restricted stock units which reduces net income available to common stockholders.
F- 24
Medley Management Inc.
Notes to Consolidated Financial Statements
The weighted average shares of Class A common stock is the same for both basic and diluted earnings per share as the diluted amount excludes the assumed conversion of 23,653,333 in 2017 and 23,333,333 LLC Units in 2016 and 2015, respectively, to shares of Class A common stock, the impact of which would be antidilutive.
The following table reflects the per share dividend amounts that we declared on our common stock since completion of our initial public offering.
Declaration Dates | Payment Dates | Per Share | ||||
Year ended December 31, 2015 | ||||||
March 29, 2015 | May 6, 2015 | $ | 0.20 | |||
August 10, 2015 | September 4, 2015 | 0.20 | ||||
November 12, 2015 | December 4, 2015 | 0.20 | ||||
February 6, 2016 | March 4, 2016 | 0.20 | ||||
Total | $ | 0.80 | ||||
Year ended December 31, 2016 | ||||||
May 10, 2016 | June 2, 2016 | $ | 0.20 | |||
August 9, 2016 | September 6, 2016 | 0.20 | ||||
November 10, 2016 | December 5, 2016 | 0.20 | ||||
February 9, 2017 | March 6, 2017 | 0.20 | ||||
Total | $ | 0.80 | ||||
Year ended December 31, 2017 | ||||||
May 10, 2017 | May 31, 2017 | $ | 0.20 | |||
August 8, 2017 | September 6, 2017 | 0.20 | ||||
November 8, 2017 | December 6, 2017 | 0.20 | ||||
Total | $ | 0.60 | ||||
12. INCOME TAXES
The provision for (benefit from) income taxes consist of the following:
For the Years Ended December 31, | |||||||||||
2017 | 2016 | 2015 | |||||||||
(Amounts in thousands) | |||||||||||
Current | |||||||||||
Federal | $ | 581 | $ | 272 | $ | 1,546 | |||||
State and local | 951 | 1,058 | 1,373 | ||||||||
Total current provision | 1,532 | 1,330 | 2,919 | ||||||||
Deferred | |||||||||||
Federal | 446 | 158 | (454 | ) | |||||||
State and local | (22 | ) | (425 | ) | (450 | ) | |||||
Total deferred provision | 424 | (267 | ) | (904 | ) | ||||||
Provision for Income Taxes | $ | 1,956 | $ | 1,063 | $ | 2,015 | |||||
Deferred income taxes reflect the net effect of temporary differences between the tax basis of an asset or liability and its reported amount on the Company’s consolidated balance sheets. These temporary differences result in taxable or deductible amounts in future years. The significant components of the Company's deferred tax assets and liabilities included on its consolidated balance sheet are as follows:
As of December 31, | |||||||
2017 | 2016 | ||||||
(Amounts in thousands) | |||||||
Deferred tax assets | |||||||
Tax goodwill | $ | 557 | $ | 605 | |||
Basis difference in partnership interest | 851 | 417 | |||||
Unrealized losses | 378 | 44 | |||||
Stock-based compensation | 173 | 216 | |||||
New York City unincorporated business tax credit carryforward | 700 | 512 | |||||
Other items | 118 | 207 | |||||
Total deferred tax assets | 2,777 | 2,001 | |||||
Deferred tax liabilities | |||||||
Accrued fee income | 89 | 147 | |||||
Other items | 3 | 55 | |||||
Total deferred tax liabilities | 92 | 202 | |||||
Net deferred tax assets | $ | 2,685 | $ | 1,799 | |||
The Company’s effective tax rate includes a rate benefit attributable to the fact that the Company’s subsidiaries operate as limited liability companies, which are not subject to federal or state income tax. Accordingly, a portion of the Company’s earnings attributable to non-controlling interests are not subject to corporate level taxes. However, a portion of the Company's subsidiaries' income is subject to New York City’s unincorporated business tax. For the years ended December 31, 2017, 2016 and 2015, the Company was only subject to federal, state and city corporate income taxes on its pre-tax income attributable to Medley Management Inc.
F- 25
Medley Management Inc.
Notes to Consolidated Financial Statements
A reconciliation of the federal statutory tax rate to the effective tax rates for the years ended December 31, 2017, 2016 and 2015 are as follow:
For the Years Ended December 31, | ||||||||
2017 | 2016 | 2015 | ||||||
Federal statutory rate | 34.0 | % | 34.0 | % | 34.0 | % | ||
Income allocated to non-controlling interests | (29.8 | )% | (28.9 | )% | (26.8 | )% | ||
State and local corporate income taxes | 0.8 | % | 1.2 | % | 1.0 | % | ||
Partnership unincorporated business tax | 2.5 | % | 4.2 | % | 1.7 | % | ||
Permanent differences | (0.6 | )% | — | % | (2.9 | )% | ||
Impact of U.S. tax reform (Tax Cuts and Jobs Act) | 1.4 | % | — | % | — | % | ||
Non-deductible stock-based compensation | 2.0 | % | — | % | — | % | ||
Other | (0.1 | )% | (0.8 | )% | 1.9 | % | ||
Effective tax rate | 10.2 | % | 9.7 | % | 8.9 | % | ||
On December 22, 2017, the U.S. government enacted the Tax Cuts and Jobs Act (the “Tax Act”). The Tax Act includes significant changes to the U.S. corporate income tax system including: a federal corporate rate reduction from 34% to 21%; limitations on the deductibility of interest expense and executive compensation; and the transition of U.S. international taxation from a worldwide tax system to a modified territorial tax system. Changes under the Tax Act are effective for the Company as of January 1, 2018.
ASC 740, Income Taxes, requires the Company to remeasure its deferred tax assets and liabilities as of the date of enactment, with the resulting tax impact accounted for in the reporting period of enactment. Based on the reduction of the corporate income tax rate, the Company re-measured its deferred tax assets and liabilities based on the rates at which they are expected to to be utilized in the future. The impact of this change resulted in a $0.3 million decrease in the Company's deferred tax asset balance and corresponding increase in the provision for income taxes for the year ended December 31, 2017.
Interest expense and penalties related to income tax matters are recognized as a component of the provision for income taxes and were not significant during the years ended December 31, 2017, 2016 and 2015. As of and during the years ended December 31, 2017, 2016 and 2015, there were no uncertain tax positions taken that were not more likely than not to be sustained. The primary jurisdictions in which the Company operates in are the United States, New York, New York City, and California. The Company is no longer subject to tax examinations by taxing authorities for tax years prior to 2014.
13. COMPENSATION EXPENSE
Compensation generally includes salaries, bonuses, equity and profit sharing awards. Bonuses, equity and profit sharing awards are accrued over the service period to which they relate. Guaranteed payments made to our senior professionals who are members of Medley LLC are recognized as compensation expense. The guaranteed payments to the Company’s Co-Chief Executive Officers are performance based and are periodically set subject to maximums based on the Company’s total assets under management. Such maximums aggregated to $5.0 million during each of the years ended December 31, 2017, 2016 and 2015. During the years ended December 31, 2017, 2016 and 2015, neither of the Company’s Co-Chief Executive Officers received any guaranteed payments.
Performance Fee Compensation
In October 2010 and January 2014, the Company granted shares of vested profit interests in certain subsidiaries to select employees. These awards are viewed as a profit-sharing arrangement and are accounted for under ASC 710, which requires compensation expense to be recognized over the vesting period, which is usually the period over which service is provided. The shares were vested at grant date, subject to a divestiture percentage based on percentage of service completed from the award grant date to the employee’s termination date. The Company adjusts the related liability quarterly based on changes in estimated cash flows for the profit interests.
In February 2015 and March 2016, the Company granted incentive cash bonus awards to select employees. These awards entitle employees to receive cash compensation based on distributed performance fees received by the Company from certain institutional funds. Eligibility to receive payments pursuant to these incentive awards is based on continued employment and ceases automatically upon termination of employment. Performance compensation expense is recorded based on the fair value of the incentive awards at the date of grant and is recognized on a straight-line basis over the expected requisite service period. The
performance compensation liability is subject to re-measurement at the end of each reporting period and any changes in the liability are recognized in such reporting period.
For the years ended December 31, 2017, 2016 and 2015, the Company recorded a reversal of performance fee compensation expense of $0.9 million, $0.3 million and $8.0 million, respectively. As of December 31, 2017 and 2016, total performance fee compensation payable for these awards was $0.1 million and $1.0 million, respectively, and is included as a component of accounts payable, accrued expenses and other liabilities on the Company's consolidated balance sheets.
Retirement Plan
The Company sponsors a defined-contribution 401(k) retirement plan that covers all employees. Employees are eligible to participate in the plan immediately, and participants are 100% vested from the date of eligibility. The Company makes contributions to the plan of 3% of an employee’s eligible wages, up to a maximum limit as determined by the Internal Revenue Service. The Company also pays all administrative fees related to the plan. The Company's accrued contributions to the plan were $0.5 million, $0.6 million and $0.4 million for the years ended December 31, 2017, 2016 and 2015, respectively. As of December 31, 2017 and 2016 the Company's outstanding liability to the plan was $0.5 million.
Stock-Based Compensation
In connection with the IPO, the Company adopted the Medley Management Inc. 2014 Omnibus Incentive Plan (the “Plan”). The purpose of the Plan is to provide a means through which the Company may attract and retain key personnel and to provide a means whereby directors, officers, employees, consultants and advisors (and prospective directors, officers, employees, consultants and advisors) of the Company can acquire and maintain an equity interest in the Company, or be paid incentive compensation, including incentive compensation measured by reference to the value of Medley Management Inc.’s Class A common stock or Medley LLC’s unit interests, thereby strengthening their commitment to the welfare of the Company and aligning their interests with those of the Company’s stockholders. The Plan provides for the issuance of incentive stock options, nonqualified stock options, stock appreciation rights, restricted stock, restricted stock units (“RSUs”), restricted LLC Units, stock bonuses, other stock-based awards and cash awards. The maximum aggregate number of awards available to be granted under the plan, as amended, is 4,500,000, of which all or any portion may be issued as shares of Medley Management Inc.’s Class A common stock or Medley LLC’s unit interests. Shares of Class A common stock issued by the Company in settlement of awards may be authorized and unissued shares, shares held in the treasury of the Company, shares purchased on the market or by private purchase or a combination of the foregoing. As of December 31, 2017, there were 2.5 million awards available to be granted under the Plan.
The fair value of RSUs granted under the Plan is determined to be the fair value of the underlying shares on the date of grant. The fair value of restricted LLC Units of Medley LLC is based on the public share price of MDLY at date of grant, adjusted for different distribution rights. The aggregate fair value of these awards is charged to compensation expense on a straight-line basis over the vesting period, which is generally up to five years.
Stock-based compensation was $2.8 million, $3.8 million and $3.1 million during the years ended December 31, 2017, 2016 and 2015, respectively.
F- 26
Medley Management Inc.
Notes to Consolidated Financial Statements
A summary of RSU and restricted LLC units activity for the years ended December 31, 2017, 2016 and 2015 is as follows:
Number of RSUs | Weighted Average Grant Date Fair Value | Number of Restricted LLC Units | Weighted Average Grant Date Fair Value | ||||||||||
Balance at December 31, 2014 | 1,197,915 | $ | 17.91 | — | $ | — | |||||||
Granted | 188,404 | 9.96 | — | — | |||||||||
Forfeited | (244,868 | ) | 17.99 | — | — | ||||||||
Vested | (10,647 | ) | 18.00 | — | — | ||||||||
Balance at December 31, 2015 | 1,130,804 | $ | 16.56 | — | $ | — | |||||||
Granted | 597,283 | 5.89 | — | — | |||||||||
Forfeited | (44,200 | ) | 17.24 | — | — | ||||||||
Vested | (31,404 | ) | 6.05 | — | — | ||||||||
Balance at December 31, 2016 | 1,652,483 | $ | 12.88 | — | $ | — | |||||||
Granted | 513,838 | 9.17 | 320,000 | 11.67 | |||||||||
Forfeited | (404,456 | ) | 13.51 | — | — | ||||||||
Vested | (310,472 | ) | 17.29 | — | — | ||||||||
Balance at December 31, 2017 | 1,451,393 | $ | 10.44 | 320,000 | $ | 11.67 | |||||||
The fair value of RSUs vested during the year ended December 31, 2017 was $1.9 million. The vesting of 310,472 restricted stock units resulted in the issuance of 193,282 Class A common shares, as the restricted stock units were net-share settled such that the Company withheld awards with the aggregate fair value equivalent to the employees' minimum statutory tax obligations in accordance with the terms of the Plan. Total tax obligations amounted to $0.7 million and payments to the appropriate taxing authorities are reflected as a financing activity on the Company's consolidated statements of cash flows.
During the year ended December 31, 2017, $2.7 million of previously recognized compensation was reversed relating to forfeited RSUs. In addition, during the year ended December 31, 2017, the Company reclassified cumulative dividends of $0.7 million from retained earnings to other compensation expense as a result of such forfeited RSUs. Unamortized compensation cost related to unvested RSUs and restricted LLC units as of December 31, 2017 was $12.5 million and is expected to be recognized over a weighted average period of 3.2 years.
F- 27
Medley Management Inc.
Notes to Consolidated Financial Statements
14. REDEEMABLE NON-CONTROLLING INTERESTS
Changes in redeemable non-controlling interests during the years ended December 31, 2017 and 2016 are reflected in the table below:
For the Years Ended December 31, | |||||||
2017 | 2016 | ||||||
(Amounts in thousands) | |||||||
Beginning balance | $ | 30,805 | $ | — | |||
Net income attributable to redeemable non-controlling interests in consolidated subsidiaries | 6,702 | 2,565 | |||||
Contributions | 23,000 | 17,010 | |||||
Distributions | (6,738 | ) | (994 | ) | |||
Change in fair value of available-for-sale securities | (28 | ) | 28 | ||||
Reclassification of redeemable non-controlling interest | — | 12,196 | |||||
Ending balance | $ | 53,741 | $ | 30,805 | |||
In January 2016, the Company executed an amendment to SIC Advisors' operating agreement which provided the Company with the right to redeem membership units owned by the minority interest holder. The Company’s redemption right is triggered by the termination of the dealer manager agreement between SIC and SC Distributors LLC, an affiliate of the minority interest holder. As a result of this redemption feature, the Company reclassified the non-controlling interest in SIC Advisors from the equity section to redeemable non-controlling interests in the mezzanine section of the consolidated balance sheet based on its fair value as of the amendment date. The fair value of the non-controlling interest was determined to be $12.2 million on the date of the amendment and was adjusted through a charge to non-controlling interests in Medley LLC. During the year ended December 31, 2017, net income allocated to this non-controlling interest was $4.4 million, and distributions paid were $4.3 million, respectively. As of December 31, 2017, the balance of the redeemable non-controlling interest in SIC Advisors LLC was $13.5 million.
On June 3, 2016, the Company entered into a Master Investment Agreement with DB MED Investor I LLC and DB MED Investor II LLC (the ‘‘Investors’’) to invest up to $50.0 million in new and existing Medley managed funds (the ‘‘Joint Venture’’). The Company agreed to contribute up to $10.0 million and an interest in STRF Advisors LLC, the investment advisor to Sierra Total Return Fund, in exchange for common equity interests in the Joint Venture. On June 6, 2017, the Company entered into an amendment to its Master Investment Agreement with the Investors, which provided for, among other things, an increase in the Company’s capital contribution to up to $13.8 million and extended the term of the Joint Venture from seven to ten years. The Investors agreed to invest up to $40.0 million in exchange for preferred equity interests in the Joint Venture. As of June 30, 2017, the Company and the Investors had fully satisfied their capital contributions. On account of the preferred equity interests, the Investors will receive an 8% preferred distribution, 15% of the Joint Venture’s profits, and all of the profits from the contributed interest in STRF Advisors LLC. Medley has the option, subject to certain conditions, to cause the Joint Venture to redeem the Investors’ interest in exchange for repayment of the outstanding investment amount at the time of redemption, plus certain other considerations. The Investors have the right, after ten years, to redeem their interests in the Joint Venture. As such, the Investors’ interest in the Joint Venture is included as a component of redeemable non-controlling interests on the Company’s consolidated balance sheets and amounted to $40.6 million and $17.5 million as of December 31, 2017 and 2016, respectively. Total contributions to the Joint Venture amounted to $53.8 million and $16.8 million through December 31, 2017 and 2016, respectively, and were used to purchase $51.8 million of MCC shares on the open market and seed fund $2.0 million to STRF. During the year ended December 31, 2017 and 2016, net income allocated to this non-controlling interest was $2.7 million and $0.4 million, respectively. For the year ended December 31, 2017, there was no other comprehensive income as a result of changes in the fair value of MCC shares allocated to this non-controlling interest. Distributions paid during the year ended December 31, 2017 were $2.4 million. There were no distributions paid during the year ended December 31, 2016.
In October 2016, the Company executed an operating agreement for STRF Advisors LLC which provided the Company with the right to redeem membership units owned by the minority interest holder. The Company’s redemption right is triggered by the termination of the dealer manager agreement between STRF and SC Distributors LLC, an affiliate of the minority interest holder. As a result of this redemption feature, the non-controlling interest in STRF Advisors LLC is classified as in redeemable non-controlling interests in the mezzanine section of the balance sheet. During the year ended December 31, 2017, net losses allocated to this redeemable non-controlling interest was $0.4 million. As of December 31, 2017, the balance of the redeemable non-controlling interest in STRF Advisors LLC was $(0.4) million.
15. MARKET AND OTHER RISK FACTORS
Due to the nature of the Medley funds’ investment strategy, their portfolio of investments has significant market and credit risk. As a result, the Company is subject to market and other risk factors, including, but not limited to the following:
F- 28
Medley Management Inc.
Notes to Consolidated Financial Statements
Market Risk
The market price of investments may significantly fluctuate during the period of investment. Investments may decline in value due to factors affecting securities markets generally or particular industries represented in the securities markets. The value of an investment may decline due to general market conditions that are not specifically related to such investment, such as real or perceived adverse economic conditions, changes in the general outlook for corporate earnings, changes in interest or currency rates or adverse investor sentiment generally. They may also decline due to factors that affect a particular industry or industries, such as labor shortages or increased production costs and competitive conditions within an industry.
Credit Risk
There are no restrictions on the credit quality of the investments the Company intends to make. Investments may be deemed by nationally recognized rating agencies to have substantial vulnerability to default in payment of interest and/or principal. Some investments may have low-quality ratings or be unrated. Lower rated and unrated investments have major risk exposure to adverse conditions and are considered to be predominantly speculative. Generally, such investments offer a higher return potential than higher rated investments, but involve greater volatility of price and greater risk of loss of income and principal.
In general, the ratings of nationally recognized rating organizations represent the opinions of agencies as to the quality of the securities they rate. Such ratings, however, are relative and subjective; they are not absolute standards of quality and do not evaluate the market value risk of the relevant securities. It is also possible that a rating agency might not change its rating of a particular issue on a timely basis to reflect subsequent events. The Company may use these ratings as initial criteria for the selection of portfolio assets for the Company but is not required to utilize them.
Limited Liquidity of Investments
The funds managed by the Company invest and intend to continue to invest in investments that may not be readily marketable. Illiquid investments may trade at a discount from comparable, more liquid investments and, at times there may be no market at all for such investments. Subordinate investments may be less marketable, or in some instances illiquid, because of the absence of registration under federal securities laws, contractual restrictions on transfer, the small size of the market or the small size of the issue (relative to issues of comparable interests). As a result, the funds managed by the Company may encounter difficulty in selling its investments or may, if required to liquidate investments to satisfy redemption requests of its investors or debt service obligations, be compelled to sell such investments at less than fair value.
Counterparty Risk
Some of the markets in which the Company, on behalf of its underlying funds, may affect its transactions are “over-the-counter” or “interdealer” markets. The participants in such markets are typically not subject to credit evaluation and regulatory oversight, unlike members of exchange-based markets. This exposes the Company to the risk that a counterparty will not settle a transaction in accordance with its terms and conditions because of a dispute over the terms of the applicable contract (whether or not such dispute is bona fide) or because of a credit or liquidity problem, causing the Company to suffer loss. Such “counterparty risk” is accentuated for contracts with longer maturities where events may intervene to prevent settlement, or where the Company has concentrated its transactions with a single or small group of counterparties.
F- 29
Medley Management Inc.
Notes to Consolidated Financial Statements
16. QUARTERLY FINANCIAL DATA (UNAUDITED)
The Company's condensed consolidated unaudited quarterly results of operations for 2017 and 2016 are as follows:
For the Three Months Ended | |||||||||||||||
December 31, 2017 | September 30, 2017 | June 30, 2017 | March 31, 2017 | ||||||||||||
(Amounts in thousands, except share and per share amounts) | |||||||||||||||
Revenues | $ | 18,042 | $ | 16,562 | $ | 16,434 | $ | 13,995 | |||||||
Expenses | 13,635 | 9,878 | 8,509 | 7,581 | |||||||||||
Other income (expense), net | (1,330 | ) | (1,482 | ) | (2,002 | ) | (1,351 | ) | |||||||
Income before income taxes | 3,077 | 5,202 | 5,923 | 5,063 | |||||||||||
Net income | 2,614 | 4,550 | 5,495 | 4,650 | |||||||||||
Net income attributable to redeemable non-controlling interests and non-controlling interests in consolidated subsidiaries | 2,009 | 1,917 | 1,304 | 1,488 | |||||||||||
Net income attributable to non-controlling interests in Medley LLC | 1,107 | 2,172 | 3,617 | 2,768 | |||||||||||
Net income attributable to Medley Management Inc. | $ | (502 | ) | $ | 461 | $ | 574 | $ | 394 | ||||||
Net income (loss) per Class A common stock: | |||||||||||||||
Basic | $ | (0.11 | ) | $ | 0.03 | $ | 0.06 | $ | 0.08 | ||||||
Diluted | $ | (0.11 | ) | $ | 0.03 | $ | 0.06 | $ | 0.08 | ||||||
Weighted average shares - Basic and Diluted | 5,478,910 | 5,342,939 | 5,588,978 | 5,808,626 | |||||||||||
For the Three Months Ended | |||||||||||||||
December 31, 2016 | September 30, 2016 | June 30, 2016 | March 31, 2016 | ||||||||||||
(Amounts in thousands, except share and per share amounts) | |||||||||||||||
Revenues | $ | 18,431 | $ | 19,052 | $ | 20,985 | $ | 17,473 | |||||||
Expenses | 9,184 | 15,553 | 17,508 | 13,776 | |||||||||||
Other income (expense), net | (1,775 | ) | (2,208 | ) | (2,373 | ) | (2,549 | ) | |||||||
Income before income taxes | 7,472 | 1,291 | 1,104 | 1,148 | |||||||||||
Net income | 6,700 | 1,214 | 1,002 | 1,036 | |||||||||||
Net income attributable to redeemable non-controlling interests and non-controlling interests in consolidated subsidiaries | 1,443 | 438 | 405 | 263 | |||||||||||
Net income attributable to non-controlling interests in Medley LLC | 4,632 | 556 | 539 | 679 | |||||||||||
Net income attributable to Medley Management Inc. | $ | 625 | $ | 220 | $ | 58 | $ | 94 | |||||||
Net income (loss) per Class A common stock: | |||||||||||||||
Basic | $ | 0.07 | $ | — | $ | (0.03 | ) | $ | (0.01 | ) | |||||
Diluted | $ | 0.07 | $ | — | $ | (0.03 | ) | $ | (0.01 | ) | |||||
Weighted average shares - Basic and Diluted | 5,809,130 | 5,778,409 | 5,777,726 | 5,851,129 | |||||||||||
17. SUBSEQUENT EVENTS
Management has evaluated subsequent events through the date of issuance of the consolidated financial statements included herein. There have been no subsequent events that occurred during such period that would require disclosure in this Form 10-K or would be required to be recognized in the consolidated financial statements as of and for the year ended December 31, 2017, except as disclosed below.
F- 30
Medley Management Inc.
Notes to Consolidated Financial Statements
On February 7, 2018, the Company’s Board of Directors declared a dividend of $0.20 per share of Class A common stock for the fourth quarter of 2017. The dividend will be paid on March 7, 2018 to stockholders of record as of February 22, 2018.
F- 31