Attached files
| file | filename |
|---|---|
| EX-32.1 - EXHIBIT 32.1 - MEDLEY MANAGEMENT INC. | mdly-12312017xex321.htm |
| EX-32.3 - EXHIBIT 32.3 - MEDLEY MANAGEMENT INC. | mdly-12312017xex323.htm |
| EX-32.2 - EXHIBIT 32.2 - MEDLEY MANAGEMENT INC. | mdly-12312017xex322.htm |
| EX-31.3 - EXHIBIT 31.3 - MEDLEY MANAGEMENT INC. | mdly-12312017xex313.htm |
| EX-31.2 - EXHIBIT 31.2 - MEDLEY MANAGEMENT INC. | mdly-12312017xex312.htm |
| EX-31.1 - EXHIBIT 31.1 - MEDLEY MANAGEMENT INC. | mdly-12312017xex311.htm |
| EX-23.1 - EXHIBIT 23.1 - MEDLEY MANAGEMENT INC. | mdly-12312017xex231.htm |
| EX-21.1 - EXHIBIT 21.1 - MEDLEY MANAGEMENT INC. | mdly-12312017xex211.htm |
UNITED STATES
SECURITIES AND EXCHANGE COMMISSION
Washington, D.C. 20549
FORM 10-K
☒ | ANNUAL REPORT PURSUANT TO SECTION 13 OR 15(d) OF THE SECURITIES EXCHANGE ACT OF 1934 |
For the fiscal year ended December 31, 2017
or
☐ | TRANSITION REPORT PURSUANT TO SECTION 13 OR 15(d) OF THE SECURITIES EXCHANGE ACT OF 1934 |
For the transition period from to
Commission File Number: 001-36638
(Exact name of registrant as specified in its charter)
Delaware | 47-1130638 |
(State or other jurisdiction of incorporation or organization) | (I.R.S. Employer Identification No.) |
280 Park Avenue, 6th Floor East
New York, New York 10017
(Address of principal executive offices)(Zip Code)
(212) 759-0777
(Registrant’s telephone number, including area code)
Securities registered pursuant to Section 12 (b) of the Act:
(Title of each class) | (Name of each exchange on which registered) |
Class A Common Stock, $0.01 par value per share | New York Stock Exchange |
Securities registered pursuant to Section 12(g) of the Act:
None
Indicate by check mark if the registrant is a well-known seasoned issuer as defined in Rule 405 of the Securities Act. Yes ☐ No ☒
Indicate by check mark if the registrant is not required to file reports pursuant to Section 13 or Section 15(d) of the Act. Yes ☐ No ☒
Indicate by check mark whether the registrant: (1) has filed all reports required to be filed by Section 13 or 15(d) of the Securities Exchange Act of 1934 during the preceding 12 months (or for such shorter period that the registrant was required to file such reports), and (2) has been subject to such filing requirements for the past 90 days. Yes ☒ No ☐
Indicate by check mark whether the registrant has submitted electronically and posted on its corporate Web site, if any, every Interactive Data File required to be submitted and posted pursuant to Rule 405 of Regulation S-T (§232.405 of this chapter) during the preceding 12 months (or for such shorter period that the registrant was required to submit and post such files). Yes ☒ No ☐
Indicate by check mark if disclosure of delinquent filers pursuant to Item 405 of Regulation S-K is not contained herein, and will not be contained, to the best of registrant's knowledge, in definitive proxy or information statements incorporated by reference in Part III of this Form 10-K or any amendment to this Form 10-K. ☐
Indicate by check mark whether the registrant is a large accelerated filer, an accelerated filer, a non-accelerated filer, a smaller reporting company or an emerging growth company. See the definitions of “large accelerated filer,” “accelerated filer”, “smaller reporting company” and "emerging growth company" in Rule 12b-2 of the Exchange Act.
Large accelerated filer | ☐ | Accelerated filer | ☐ |
Non-accelerated filer | ☐ (Do not check if a smaller reporting company) | Smaller reporting company | ☒ |
Emerging growth company | ☒ | ||
If an emerging growth company, indicate by check mark if the registrant has elected not to use the extended transition period for complying with any new or revised financial accounting standards provided pursuant to Section 7(a)(2)(B) of the Securities Act. ☒
Indicate by check mark whether the registrant is a shell company (as defined in Rule 12b-2 of the Exchange Act). Yes ☐ No ☒
As of June 30, 2017, the aggregate market value of registrant's voting and non-voting common equity held by non-affiliates was approximately $33,654,119. The number of shares of the registrant’s Class A common stock, par value $0.01 per share, outstanding as of March 27, 2018 was 5,495,343. The number of shares of the registrant’s Class B common stock, par value $0.01 per share, outstanding as of March 27, 2018 was 100.
TABLE OF CONTENTS
Page | ||
Part I. | ||
Item 1. | ||
Item 1A. | ||
Item 1B. | ||
Item 2. | ||
Item 3. | ||
Item 4. | ||
Part II. | ||
Item 5. | ||
Item 6. | ||
Item 7. | ||
Item 7A. | ||
Item 8. | ||
Item 9. | ||
Item 9A. | ||
Item 9B. | ||
Part III | ||
Item 10. | ||
Item 11. | ||
Item 12. | ||
Item 13. | ||
Item 14. | ||
Part IV. | ||
Item 15. | ||
Item 16 | ||
FORWARD-LOOKING STATEMENTS
This Annual Report on Form 10-K (“Form 10-K”) contains forward-looking statements within the meaning of Section 27A of the Securities Act of 1933, as amended (the "Securities Act"), and Section 21E of the Securities Exchange Act of 1934, as amended (the “Exchange Act”), that reflect our current views with respect to, among other things, our operations and financial performance. Forward-looking statements include all statements that are not historical facts. In some cases, you can identify these forward-looking statements by the use of words such as “outlook,” “believes,” “expects,” “potential,” “may,” “should,” “could,” “seeks,” “approximately,” “predicts,” “intends,” “plans,” “estimates,” “anticipates” or the negative version of these words or other comparable words. Such forward-looking statements are subject to various risks and uncertainties. Accordingly, there are or will be important factors that could cause actual outcomes or results to differ materially from those indicated in these statements. We believe these factors include, but are not limited to, those described under Part I, Item 1A. “Risk Factors,” which include, but are not limited to, the following:
• | difficult market and political conditions may adversely affect our business in many ways, including by reducing the value or hampering the performance of the investments made by our funds, each of which could materially and adversely affect our business, results of operations and financial condition; |
• | we derive a substantial portion of our revenues from funds managed pursuant to advisory agreements that may be terminated or fund partnership agreements that permit fund investors to remove us as the general partner; |
• | we may not be able to maintain our current fee structure as a result of industry pressure from fund investors to reduce fees, which could have an adverse effect on our profit margins and results of operations; |
• | a change of control of us could result in termination of our investment advisory agreements; |
• | the historical returns attributable to our funds should not be considered as indicative of the future results of our funds or of our future results or of any returns expected on an investment in Medley Management Inc.'s Class A common stock ("Class A common stock"); |
• | if we are unable to consummate or successfully integrate development opportunities, acquisitions or joint ventures, we may not be able to implement our growth strategy successfully; |
• | we depend on third-party distribution sources to market our investment strategies; |
• | an investment strategy focused primarily on privately held companies presents certain challenges, including the lack of available information about these companies; |
• | our funds’ investments in investee companies may be risky, and our funds could lose all or part of their investments; |
• | prepayments of debt investments by our investee companies could adversely impact our results of operations; |
• | our funds’ investee companies may incur debt that ranks equally with, or senior to, our funds’ investments in such companies; |
• | subordinated liens on collateral securing loans that our funds make to their investee companies may be subject to control by senior creditors with first priority liens and, if there is a default, the value of the collateral may not be sufficient to repay in full both the first priority creditors and our funds; |
• | there may be circumstances where our funds’ debt investments could be subordinated to claims of other creditors or our funds could be subject to lender liability claims; |
• | our funds may not have the resources or ability to make additional investments in our investee companies; |
• | economic recessions or downturns could impair our investee companies and harm our operating results; |
• | a covenant breach by our investee companies may harm our operating results; |
• | the investment management business is competitive; |
• | our funds operate in a competitive market for lending that has recently intensified, and competition may limit our funds’ ability to originate or acquire desirable loans and investments and could also affect the yields of these assets and have a material adverse effect on our business, results of operations and financial condition; |
• | dependence on leverage by certain of our funds and by our funds’ investee companies subjects us to volatility and contractions in the debt financing markets and could adversely affect our ability to achieve attractive rates of return on those investments; |
i
• | some of our funds may invest in companies that are highly leveraged, which may increase the risk of loss associated with those investments; |
• | we generally do not control the business operations of our investee companies and, due to the illiquid nature of our investments, may not be able to dispose of such investments; |
• | a substantial portion of our investments may be recorded at fair value as determined in good faith by or under the direction of our respective funds’ boards of directors or similar bodies and, as a result, there may be uncertainty regarding the value of our funds’ investments; |
• | we may need to pay “clawback” obligations if and when they are triggered under the governing agreements with respect to certain of our funds and SMAs; |
• | our funds may face risks relating to undiversified investments; |
• | third-party investors in our private funds may not satisfy their contractual obligation to fund capital calls when requested, which could adversely affect a fund’s operations and performance; |
• | our funds may be forced to dispose of investments at a disadvantageous time; |
• | hedging strategies may adversely affect the returns on our funds’ investments; |
• | our business depends in large part on our ability to raise capital from investors. If we were unable to raise such capital, we would be unable to collect management fees or deploy such capital into investments, which would materially and adversely affect our business, results of operations and financial condition; |
• | we depend on our senior management team, senior investment professionals and other key personnel, and our ability to retain them and attract additional qualified personnel is critical to our success and our growth prospects; |
• | our failure to appropriately address conflicts of interest could damage our reputation and adversely affect our business; |
• | potential conflicts of interest may arise between our Class A common stockholders and our fund investors; |
• | rapid growth of our business may be difficult to sustain and may place significant demands on our administrative, operational and financial resources; |
• | we may enter into new lines of business and expand into new investment strategies, geographic markets and business, each of which may result in additional risks and uncertainties in our business; |
• | extensive regulation affects our activities, increases the cost of doing business and creates the potential for significant liabilities and penalties that could adversely affect our business and results of operations; |
• | failure to comply with “pay to play” regulations implemented by the SEC and certain states, and changes to the “pay to play” regulatory regimes, could adversely affect our business; |
• | new or changed laws or regulations governing our funds’ operations and changes in the interpretation thereof could adversely affect our business; |
• | present and future business development companies for which we serve as investment adviser are subject to regulatory complexities that limit the way in which they do business and may subject them to a higher level of regulatory scrutiny; |
• | we are subject to risks in using custodians, counterparties, administrators and other agents; |
• | a portion of our revenue and cash flow is variable, which may impact our ability to achieve steady earnings growth on a quarterly basis and may cause the price of our Class A common stock to decline; |
• | we may be subject to litigation risks and may face liabilities and damage to our professional reputation as a result; |
• | employee misconduct could harm us by impairing our ability to attract and retain investors and subjecting us to significant legal liability, regulatory scrutiny and reputational harm, and fraud and other deceptive practices or other misconduct at our investee companies could similarly subject us to liability and reputational damage and also harm our business; |
• | our substantial indebtedness could adversely affect our financial condition, our ability to pay our debts or raise additional capital to fund our operations, our ability to operate our business and our ability to react to changes in the economy or our industry and could divert our cash flow from operations for debt payments; |
• | our Revolving Credit Facility imposes significant operating and financial restrictions on us and our subsidiaries, which may prevent us from capitalizing on business opportunities; |
ii
• | servicing our indebtedness will require a significant amount of cash. Our ability to generate sufficient cash depends on many factors, some of which are not within our control; |
• | despite our current level of indebtedness, we may be able to incur substantially more debt and enter into other transactions, which could further exacerbate the risks to our financial condition; |
• | operational risks may disrupt our business, result in losses or limit our growth; |
• | Medley Management Inc.’s only material asset is its interest in Medley LLC, and it is accordingly dependent upon distributions from Medley LLC to pay taxes, make payments under the tax receivable agreement or pay dividends; |
• | Medley Management Inc. is controlled by our pre-IPO owners, whose interests may differ from those of our public stockholders; |
• | Medley Management Inc. will be required to pay exchanging holders of LLC Units for most of the benefits relating to any additional tax depreciation or amortization deductions that we may claim as a result of the tax basis step-up we receive in connection with sales or exchanges of LLC Units and related transactions; |
• | in certain cases, payments under the tax receivable agreement may be accelerated and/or significantly exceed the actual benefits Medley Management Inc. realizes in respect of the tax attributes subject to the tax receivable agreement; |
• | anti-takeover provisions in our organizational documents and Delaware law might discourage or delay acquisition attempts for us that you might consider favorable; |
• | the actual costs related to consolidating our business activities to our New York office may be greater than we currently anticipate and we may incur additional costs that are not currently included in our estimate; and |
• | our ability to realize anticipated cost savings and efficiencies from consolidating our business activities to our New York office. |
These factors should not be construed as exhaustive and should be read in conjunction with the other cautionary statements that are included in this Form 10-K and other reports we file with the Securities and Exchange Commission. Forward-looking statements speak as of the date on which they are made, and we undertake no obligation to publicly update or review any forward-looking statement, whether as a result of new information, future developments or otherwise, except as required by law.
Medley Management Inc. was incorporated as a Delaware corporation on June 13, 2014, and its sole asset is a controlling equity interest in Medley LLC. Pursuant to a reorganization into a holding corporation structure (the “Reorganization”) consummated in connection with Medley Management Inc.’s initial public offering (“IPO”), Medley Management Inc. became a holding corporation and the sole managing member of Medley LLC, operating and controlling all of the business and affairs of Medley LLC and, through Medley LLC and its subsidiaries, conducts its business.
Unless the context suggests otherwise, references herein to the “Company,” “Medley,” “we,” “us” and “our” refer to Medley Management Inc., Medley LLC, and their consolidated subsidiaries.
The “pre-IPO owners” refers to the senior professionals who were the owners of Medley LLC immediately prior to the Offering Transactions. The “Offering Transactions” refer to Medley Management Inc.’s purchase upon the consummation of its IPO of 6,000,000 newly issued limited liability company units (the “LLC Units”) from Medley LLC, which correspondingly diluted the ownership interests of the pre-IPO owners in Medley LLC and resulted in Medley Management Inc.’s holding a number of LLC Units in Medley LLC equal to the number of shares of Class A common stock it issued in its IPO.
Unless the context suggests otherwise, references herein to:
• | “Aspect” refers to Aspect-Medley Investment Platform A LP; |
• | “AUM” refers to the assets of our funds, which represents the sum of the NAV of such funds, the drawn and undrawn debt (at the fund level, including amounts subject to restrictions) and uncalled committed capital (including commitments to funds that have yet to commence their investment periods); |
• | “base management fees” refers to fees we earn for advisory services provided to our funds, which are generally based on a defined percentage of fee earning AUM or, in certain cases, a percentage of originated assets in the case of certain of our SMAs; |
• | “BDC” refers to business development company; |
• | “Consolidated Funds” refers to, with respect to periods after December 31, 2013 and before January 1, 2015, MOF II and, with respect to periods prior to January 1, 2014, MOF I LP, MOF II and MOF III, subsequent to its formation; |
iii
• | “fee earning AUM” refers to the assets under management on which we directly earn base management fees; |
• | “hurdle rates” refers to the rates above which we earn performance fees, as defined in the long-dated private funds’ and SMAs’ applicable investment management or partnership agreements; |
• | “investee company” refers to a company to which one of our funds lends money or in which one of our funds otherwise makes an investment; |
• | “long-dated private funds” refers to MOF II, MOF III, MOF III Offshore, MCOF, Aspect and any other private funds we may manage in the future; |
• | “management fees” refers to base management fees and Part I incentive fees; |
• | “MCOF” refers to Medley Credit Opportunity Fund LP; |
• | “Medley LLC” refers to Medley LLC and its consolidated subsidiaries; |
• | “MOF II” refers to Medley Opportunity Fund II LP; |
• | “MOF III” refers to Medley Opportunity Fund III LP; |
• | "MOF III Offshore" refers to Medley Opportunity Fund Offshore III LP; |
• | “our funds” refers to the funds, alternative asset companies and other entities and accounts that are managed or co-managed by us and our affiliates; |
• | “our investors” refers to the investors in our permanent capital vehicles, our private funds and our SMAs; |
• | “Part I incentive fees” refers to fees that we receive from our permanent capital vehicles, and in 2017, MCOF, which are paid in cash quarterly and are driven primarily by net interest income on senior secured loans subject to hurdle rates. As it relates to Medley Capital Corporation (NYSE: MCC) (TASE:MCC) (“MCC”), these fees are subject to netting against realized and unrealized losses; |
• | “Part II incentive fees” refers to fees related to realized capital gains in our permanent capital vehicles; |
• | “performance fees” refers to incentive allocations in our long-dated private funds and incentive fees from our SMAs, which are typically 15% to 20% of the total return after a hurdle rate, accrued quarterly, but paid after the return of all invested capital and in an amount sufficient to achieve the hurdle rate; |
• | “permanent capital” refers to capital of funds that do not have redemption provisions or a requirement to return capital to investors upon exiting the investments made with such capital, except as required by applicable law, which funds currently consist of MCC, Sierra Total Return Fund ("STRF") and Sierra Income Corporation (“SIC”). Such funds may be required, or elect, to return all or a portion of capital gains and investment income. In certain circumstances, the investment adviser of such a fund may be removed; |
• | “SMA” refers to a separately managed account; |
• | "standalone" refers to our financial results without the consolidation of any fund(s); |
• | “STRF” refers to Sierra Total Return Fund; and |
• | "Tac Ops" refers to Medley Tactical Opportunities LLC |
iv
PART I.
Item 1. Business
Overview
We are an alternative asset management firm offering yield solutions to retail and institutional investors. We focus on credit-related investment strategies, primarily originating senior secured loans to private middle market companies in the United States that have revenues between $50 million and $1 billion. We generally hold these loans to maturity. Our national direct origination franchise provides capital to the middle market in the U.S. For over 15 years, we have provided capital to over 400 companies across 35 industries in North America.
We manage three permanent capital vehicles, two of which are BDCs, and a credit interval fund, as well as long-dated private funds and SMAs, with a primary focus on senior secured credit. As of December 31, 2017, we had over $5.0 billion of AUM in two business development companies, MCC and SIC, as well as private investment vehicles. Our compounded annual AUM growth rate from December 31, 2010 through December 31, 2017 was 26%, and our compounded annual Fee Earning AUM growth rate was 19%, which have both been driven in large part by the growth in our permanent capital vehicles. Since September 2015, we received over $1.5 billion of new institutional capital commitments, bringing AUM to over $5.0 billion. Typically the investment periods of our institutional commitments range from 18 to 24 months and we expect our Fee Earning AUM to increase as capital commitments included in AUM are invested.
In general, our institutional investors do not have the right to withdraw capital commitments and to date, we have not experienced any withdrawals of capital commitments. For a description of the risk factor associated with capital commitments, see “Risk Factors — Third-party investors in our private funds may not satisfy their contractual obligation to fund capital calls when requested, which could adversely affect a fund's operations and performance.”
The diagram below presents the historical correlation between growth in our AUM, fee earning AUM and management fees.
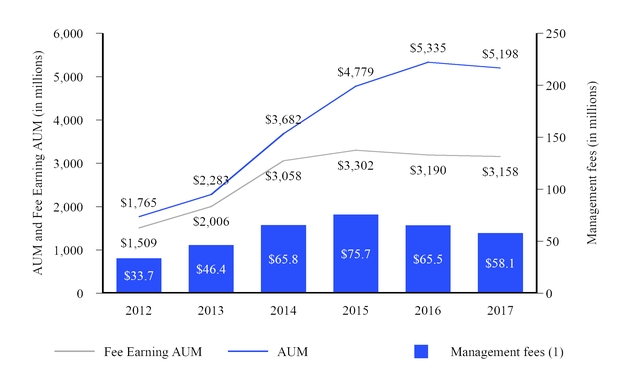 _________
(1) Presented on a standalone basis
Direct origination, credit structuring and active monitoring of the loan portfolios we manage are important success factors in our business, which can be adversely affected by difficult market and political conditions, such as the turmoil in the global capital markets from 2007 to 2009. Since our inception in 2006, we have adhered to a disciplined investment process that employs these principles with the goal of delivering strong risk-adjusted investment returns while protecting investor capital. Our focus on protecting investor capital is reflected in our investment strategy; at December 31, 2017, approximately 80% of the combined
1
portfolios investments were in first lien positions. We believe that our ability to directly originate, structure and lead deals enables us to consistently lend at higher yields with better terms. In addition, the loans we manage generally have a contractual maturity between three and seven years and are typically floating rate (at December 31, 2017, approximately 81% of the loans we manage, based on aggregate principal amount, bore interest at floating rates), which we believe positions our business well for rising interest rates.
Our senior management team has on average over 20 years of experience in credit, including originating, underwriting, principal investing and loan structuring. As of December 31, 2017, we had over 85 employees, including over 45 investment, origination and credit management professionals, and over 40 operations, accounting, legal, compliance and marketing professionals, each with extensive experience in their respective disciplines.
Our Funds
We provide our credit-focused investment strategies through various funds and products that meet the needs of a wide range of retail and institutional investors.
Our permanent capital vehicles, MCC and SIC, offer investors compelling risk-adjusted yield opportunities. Given their permanent capital nature and focus on senior credit, they provide a high degree of base management fee visibility. Additionally, we have a strong institutional investor base for our long-dated private funds and SMAs, which have been an important source of diversified capital for our business.
Except as otherwise described herein with respect to our BDCs, our investment funds themselves do not register as investment companies under the Investment Company Act of 1940, as amended (the “Investment Company Act”), in reliance on Section 3(c)(1), Section 3(c)(7) or Section 7(d) thereof. Section 3(c)(7) of the Investment Company Act exempts from the Investment Company Act’s registration requirements investment funds privately placed in the United States whose securities are owned exclusively by persons who, at the time of acquisition of such securities, are “qualified purchasers” as defined under the Investment Company Act. Section 3(c)(1) of the Investment Company Act exempts from the Investment Company Act’s registration requirements privately placed investment funds whose securities are beneficially owned by not more than 100 persons. In addition, under certain current interpretations of the SEC, Section 7(d) of the Investment Company Act exempts from registration any non-U.S. investment fund all of whose outstanding securities are beneficially owned either by non-U.S. residents or by U.S. residents that are qualified purchasers and purchase their interests in a private placement. Certain subsidiaries of Medley LLC typically serve as an investment adviser for our funds and are registered under the Advisors Act. Our funds’ investment advisers or one of their affiliates are entitled to management fees, performance fees and/or incentive fees from each investment fund to which they serve as investment advisers. For a discussion of the fees to which our funds’ investment advisers are entitled across our various types of funds, please see “Business — Fee Structure.”
Medley Capital Corporation
We launched MCC (NYSE: MCC) (TASE:MCC), our first permanent capital vehicle, in 2011 as a BDC. MCC has grown to become a BDC with approximately $1.1 billion in AUM as of December 31, 2017. MCC has demonstrated a 26% compounded annual growth rate of AUM from inception through December 31, 2017.
Sierra Income Corporation
We launched SIC, our first public non-traded permanent capital vehicle, in 2012 as a BDC. SIC is now offered on a continuous basis to investors through over 186 broker dealers representing over 17,600 registered investment advisers (“RIAs”) as of December 31, 2017. During the year ended December 31, 2017, SIC increased AUM to $1.3 billion, a 1.2% increase year over year.
Sierra Total Return Fund
We launched STRF (NASDAQ:SRNTX), our first interval fund, in January 2017. STRF is a continuously offered, non-diversified, closed-end investment management company that is operated as an interval fund. The fund commenced investment operations in June 2017.
Long-Dated Private Funds
We launched MOF I, our first long-dated private fund, in 2006, MOF II, our second long-dated private fund, in 2010, MOF III, our third long-dated private fund, in 2014, and, in 2016, MCOF and Aspect, our fourth and fifth long-dated private funds, respectively. In 2017, we launched MOF III Offshore. Our long-dated private funds are managed through partnership structures, in which limited partnerships organized by us accept commitments or funds for investment from institutional investors and high net worth individuals, and a general partner makes all policy and investment decisions, including selection of investment advisers. Affiliates of Medley LLC serve as the general partners and investment advisers to our long-dated private funds. The limited partners of our long-dated private funds take no part in the conduct or control of the business of such funds, have no right or authority to act for or bind such funds and have no influence on the voting or disposition of the securities or assets held by such funds, although
2
limited partners often have the right to remove the general partner or cause an early liquidation by super-majority vote. As our long-dated private funds are closed-ended, once an investor makes an investment, the investor is generally not able to withdraw or redeem its interest, except in very limited circumstances.
Separately Managed Accounts (SMAs)
We launched our first SMA in 2010 and currently manage ten SMAs. In the case of our SMAs, the investor, rather than us, dictates the risk tolerances and target returns of the account. We act as an investment adviser registered under the Advisers Act for these accounts. The accounts offer customized solutions for liability driven investors such as insurance companies and typically offer attractive returns on risk based capital.
Fee Structure
We earn management fees at an annual rate of 0.75% to 2.00% and may earn performance fees, which may be in the form of an incentive fee or carried interest, in the event that specified investment returns are achieved by the fund or SMA. Management fees are generally based on a defined percentage of (1) average or total gross assets, including assets acquired with leverage, (2) total commitments, (3) net invested capital (4) NAV, or (5) lower of cost or market value of a fund’s portfolio investments. Management fees are calculated quarterly and are paid in cash in advance or in arrears depending on each specific fund or SMA. We earn incentive fees on our permanent capital vehicles and earn incentive fees on certain of our long-dated private funds. In addition, we may earn additional carried interest performance fees on our long-dated private funds and SMAs that are typically 15% to 20% of the total return over a 6% to 8% annualized preferred return.
Medley Capital Corporation
Pursuant to the investment management agreement between MCC and our affiliate, MCC Advisors LLC, MCC Advisors LLC receives a base management fee and a two-part incentive fee. Effective January 1, 2016, pursuant to a fee waiver executed by MCC Advisors LLC on February 8, 2016, the base management fee is calculated at an annual rate of 1.75% of MCC’s gross assets up to $1.0 billion and 1.50% on MCC's gross assets over $1.0 billion, and is payable quarterly in arrears (the “Reduced Base Management Fee”). The Reduced Base Management Fee is calculated based on the average value of MCC’s gross assets at the end of the two most recently completed calendar quarters and will be appropriately pro-rated for any partial quarter. Prior to January 1, 2016, the MCC base management fee was calculated at an annual rate of 1.75% of MCC's gross assets. The base management fee was calculated based on the average value of MCC's gross assets at the end of the two most recently completed calendar quarters.
The two components of the MCC incentive fee are described below.
• | The first component of the MCC incentive fee is the Part I incentive fee. Effective January 1, 2016, the incentive fee based on net investment income is reduced from 20.0% on pre-incentive fee net investment income over a fixed hurdle rate of 2.0% per quarter, to 17.5% on pre-incentive fee net investment income over a fixed hurdle rate of 1.5% per quarter. Moreover, the incentive fee based on net investment income is determined and paid quarterly in arrears at the end of each calendar quarter by reference to our aggregate net investment income, as adjusted, as described below (the “Reduced Incentive Fee on Net Investment Income”), from the calendar quarter then ending and the eleven preceding calendar quarters (or if shorter, the number of quarters that have occurred since January 1, 2016). We refer to such period as the “Trailing Twelve Quarters.” The hurdle amount for the Reduced Incentive Fee on Net Investment Income is determined on a quarterly basis, and is equal to 1.5% multiplied by MCC’s net assets at the beginning of each applicable calendar quarter comprising the relevant Trailing Twelve Quarters. The hurdle amount is calculated after making appropriate adjustments to MCC’s net assets, as determined as of the beginning of each applicable calendar quarter, in order to account for any capital raising or other capital actions as a result of any issuances by MCC of its common stock (including issuances pursuant to MCC’s dividend reinvestment plan), any repurchase by MCC of its own common stock, and any dividends paid by MCC, each as may have occurred during the relevant quarter. Any Reduced Incentive Fee on Net Investment Income is paid to MCC Advisors LLC on a quarterly basis, and is based on the amount by which (A) aggregate net investment income (“Ordinary Income”) in respect of the relevant Trailing Twelve Quarters exceeds (B) the hurdle amount for such Trailing Twelve Quarters. The amount of the excess of (A) over (B) described in this paragraph for such Trailing Twelve Quarters is referred to as the “Excess Income Amount.” For the avoidance of doubt, Ordinary Income is net of all fees and expenses, including the Reduced Base Management Fee but excluding any incentive fee on pre-incentive fee net investment income or on MCC’s capital gains. |
The Reduced Incentive Fee on Net Investment Income for each quarter is determined as follows:
• | No incentive fee based on net investment income is payable to MCC Advisors LLC for any calendar quarter for which there is no Excess Income Amount; |
• | 100% of the Ordinary Income, if any, that exceeds the hurdle amount, but is less than or equal to an amount, which we refer to as the “Catch-up Amount,” determined as the sum of 1.8182% multiplied by MCC’s net assets at the beginning |
3
of each applicable calendar quarter, as adjusted as noted above, comprising the relevant Trailing Twelve Quarters is included in the calculation of the Reduced Incentive Fee on Net Investment Income; and
• | 17.5% of the Ordinary Income that exceeds the Catch-up Amount is included in the calculation of the Reduced Incentive Fee on Net Investment Income. |
The amount of the Reduced Incentive Fee on Net Investment Income that is paid to MCC Advisors LLC for a particular quarter equals the excess of the incentive fee so calculated minus the aggregate incentive fees based on income that were paid in respect of the first eleven calendar quarters (or the portion thereof) included in the relevant Trailing Twelve Quarters but not in excess of the Incentive Fee Cap (as described below).
The Reduced Incentive Fee on Net Investment Income that is paid to MCC Advisors LLC for a particular quarter is subject to a cap (the “Incentive Fee Cap”). The Incentive Fee Cap for any quarter is an amount equal to (a) 17.5% of the Cumulative Net Return (as defined below) during the relevant Trailing Twelve Quarters minus (b) the aggregate incentive fees based on net investment income that was paid in respect of the first eleven calendar quarters (or a portion thereof) included in the relevant Trailing Twelve Quarters.
“Cumulative Net Return” means (X) the Ordinary Income in respect of the relevant Trailing Twelve Quarters minus (Y) any Net Capital Loss (as defined below), if any, in respect of the relevant Trailing Twelve Quarters. If, in any quarter, the Incentive Fee Cap is zero or a negative value, MCC pays no incentive fee based on net investment income to MCC Advisors for such quarter. If, in any quarter, the Incentive Fee Cap for such quarter is a positive value but is less than the Reduced Incentive Fee based on Net Investment Income that is payable to MCC Advisors for such quarter (before giving effect to the Incentive Fee Cap) calculated as described above, MCC pays a Reduced Incentive Fee on Net Investment Income to MCC Advisors equal to the Incentive Fee Cap for such quarter. If, in any quarter, the Incentive Fee Cap for such quarter is equal to or greater than the Reduced Incentive Fee on Net Investment Income that is payable to MCC Advisors for such quarter (before giving effect to the Incentive Fee Cap) calculated as described above, MCC pays a Reduced Incentive Fee on Net Investment Income to MCC Advisors, calculated as described above, for such quarter without regard to the Incentive Fee Cap.
“Net Capital Loss” in respect of a particular period means the difference, if positive, between (i) aggregate capital losses, whether realized or unrealized, and dilution to MCC’s net assets due to capital raising or capital actions, in such period and (ii) aggregate capital gains, whether realized or unrealized and accretion to MCC’s net assets due to capital raising or capital action, in such period.
Dilution to MCC’s net assets due to capital raising is calculated, in the case of issuances of common stock, as the amount by which the net asset value per share was adjusted over the transaction price per share, multiplied by the number of shares issued. Accretion to MCC’s net assets due to capital raising is calculated, in the case of issuances of common stock (including issuances pursuant to our dividend reinvestment plan), as the excess of the transaction price per share over the amount by which the net asset value per share was adjusted, multiplied by the number of shares issued. Accretion to MCC's net assets due to other capital action is calculated, in the case of repurchases by MCC of its own common stock, as the excess of the amount by which the net asset value per share was adjusted over the transaction price per share multiplied by the number of shares repurchased by MCC.
For the avoidance of doubt, the purpose of changing our fee structure was to permanently reduce aggregate fees payable to MCC Advisors by MCC. Beginning January 1, 2016, in order to ensure that MCC pays MCC Advisors aggregate fees on a cumulative basis under the new fee structure that are less than the aggregate fees otherwise due under the management agreement, at the end of each quarter, MCC Advisors calculates aggregate base management fees and incentive fees on net investment income under both the new fee structure and the fee structure under the management agreement, and if, at any time after January 1, 2016, the aggregate fees on a cumulative basis under the new fee structure would be greater than the aggregate fees on a cumulative basis under the fee structure under the management agreement, MCC Advisors is only entitled to the lesser of those two amounts. Since the hurdle rate is fixed, if and as interest rates rise, it will be more likely that we will surpass the hurdle rate and receive an incentive fee based on net investment income.
Prior to January 1, 2016, the Part I incentive fee was payable quarterly in arrears and was 20.0% of MCC’s pre-incentive fee net investment income for the immediately preceding calendar quarter subject to a 2.0% (which was 8.0% annualized) hurdle rate and a “catch-up” provision measured as of the end of each calendar quarter. Under the hurdle rate and catch-up provisions, in any calendar quarter, we received no incentive fee until MCC’s net investment income equaled the hurdle rate of 2.0%, but then received, as a “catch-up”, 100% of MCC’s pre-incentive fee net investment income with respect to that portion of such pre-incentive fee net investment income, if any, that exceeded the hurdle rate but was less than 2.5%. The effect of this provision was that, if pre-incentive fee net investment income exceeded 2.5% in any calendar quarter, MCC Advisors LLC would receive 20.0% of MCC’s pre-incentive fee net investment income as if the hurdle rate did not apply. For this purpose, pre-incentive fee net investment income meant interest income, dividend income and any other income including any other fees (other than fees for providing managerial assistance), such as commitment, origination, structuring, due diligence and consulting fees or other fees that MCC received from portfolio companies accrued during the calendar quarter, minus MCC’s operating expenses for the quarter including the base management fee, expenses payable to MCC Advisors LLC, and any interest expense and any dividends paid on any issued
4
and outstanding preferred stock, but excluding the incentive fee. Pre-incentive fee net investment income included, in the case of investments with a deferred interest feature (such as original issue discount, debt instruments with payment-in-kind interest and zero coupon securities), accrued income that we had not yet received in cash.
• | The second component of the MCC incentive fee, the Part II incentive fee, is determined and payable in arrears as of the end of each calendar year (or upon termination of the investment management agreement as of the termination date), and equals 20.0% of MCC’s cumulative aggregate realized capital gains less cumulative realized capital losses, unrealized capital depreciation (unrealized depreciation on a gross investment-by-investment basis at the end of each calendar year) and all capital gains upon which prior performance-based capital gains incentive fee payments were previously made to MCC Advisors LLC. |
Entities controlled by former employees held limited liability company interests in MCC Advisors LLC that entitled them to approximately 4.86% of the net incentive fee income through October 29, 2015 and an additional 5.75% of the net incentive fee income through August 20, 2016 from MCC Advisors LLC. Since August 20, 2016 and going forward, we are entitled to all of the management fees paid to MCC Advisors LLC. We may have similar arrangements with respect to the ownership of the entities that advise our BDCs in the future.
Sierra Income Corporation
Pursuant to the investment management agreement between SIC and our affiliate, SIC Advisors LLC, SIC Advisors LLC receives a base management fee and a two-part incentive fee. The SIC base management fee is calculated at an annual rate of 1.75% of SIC’s gross assets at the end of each completed calendar quarter and is payable quarterly in arrears.
The two components of the SIC incentive fee are as follows.
• | The first, the Part I incentive fee (which is also referred to as a subordinated incentive fee), payable quarterly in arrears, is 20.0% of SIC’s pre-incentive fee net investment income for the immediately preceding calendar quarter subject to a 1.75% (which is 7.0% annualized) hurdle rate and a “catch-up” provision measured as of the end of each calendar quarter. Under the hurdle rate and catch-up provisions, in any calendar quarter, SIC Advisors LLC receives no incentive fee until SIC’s pre-incentive fee net investment income equals the hurdle rate of 1.75%, but then receives, as a “catch-up”, 100% of SIC’s pre-incentive fee net investment income with respect to that portion of such pre-incentive fee net investment income, if any, that exceeds the hurdle rate but is less than 2.1875%. The effect of this provision is that, if pre-incentive fee net investment income exceeds 2.1875% in any calendar quarter, SIC Advisors LLC will receive 20.0% of SIC’s pre-incentive fee net investment income as if the hurdle rate did not apply. For this purpose, pre-incentive fee net investment income means interest income, dividend income and any other income including any other fees (other than fees for providing managerial assistance), such as commitment, origination, structuring, due diligence and consulting fees or other fees that SIC receives from portfolio companies accrued during the calendar quarter, minus SIC’s operating expenses for the quarter including the base management fee, expenses payable to SIC Advisors LLC or to us, and any interest expense and any dividends paid on any issued and outstanding preferred stock, but excluding the incentive fee. Pre-incentive fee net investment income includes, in the case of investments with a deferred interest feature (such as original issue discount, debt instruments with payment-in-kind interest and zero coupon securities), accrued income that SIC has not yet received in cash. Since the hurdle rate is fixed, if interest rates rise, it will be easier for us to surpass the hurdle rate and receive an incentive fee based on pre-incentive fee net investment income. |
• | The second, the Part II incentive fee, is determined and payable in arrears as of the end of each calendar year (or upon termination of the investment management agreement as of the termination date), and equals 20.0% of SIC’s cumulative aggregate realized capital gains less cumulative realized capital losses, unrealized capital depreciation (unrealized depreciation on a gross investment-by-investment basis at the end of each calendar year) and all capital gains upon which prior performance-based capital gains incentive fee payments were previously made to SIC Advisors LLC. |
Strategic Capital Advisory Services, LLC owns 20% of SIC Advisors LLC and is entitled to receive distributions of up to 20% of the gross cash proceeds received by SIC Advisors LLC from the management and incentive fees payable by SIC to SIC Advisors LLC, net of certain expenses, as well as 20% of the returns of the investments held at SIC Advisors LLC. We may have similar arrangements with respect to the ownership of the entities that advise our BDCs in the future.
Sierra Total Return Fund
Pursuant to the investment management agreement between STRF and our affiliate, STRF Advisors LLC, STRF Advisors LLC will be entitled to a base management fee and an incentive fee. The STRF base management fee will be calculated and payable monthly in arrears at an annual rate of 1.50% of STRF's average daily total assets during such period.
The incentive fee will be calculated and payable quarterly in arrears in an amount equal to 15.0% of the Fund's pre-incentive fee net investment income for the immediately preceding quarter, and will be subject to a hurdle rate, expressed as a rate of return on the Fund's adjusted capital, equal to 1.50% per quarter, subject to a “catch-up” feature, which will allow STRF Advisors LLC
5
to recover foregone incentive fees that were previously limited by the hurdle rate. Under the hurdle rate and catch-up provisions, in any calendar quarter, STRF Advisors LLC will not receive any incentive fee until STRF's pre-incentive fee net investment income equals the hurdle rate of 1.50%, but then will receive, as a “catch-up,” 100% of STRF's pre-incentive fee net investment income with respect to that portion of such pre-incentive fee net investment income, if any, that exceeds the hurdle rate but is less than or equal to 1.76%. The effect of this provision is that, if pre-incentive fee net investment income exceeds 1.76% in any calendar quarter, STRF Advisors LLC will receive 15.0% of SIC's pre-incentive fee net investment income as if the hurdle rate did not apply. For this purpose, pre-incentive fee net investment income means interest income, dividend income and any other income accrued during the calendar quarter, minus STRF's operating expenses for the quarter (including the management fee, expenses reimbursed to STRF Advisors LLC and any interest expenses and distributions paid on any issued and outstanding preferred shares, but excluding the inventive fee). For this purpose, adjusted capital means the cumulative gross proceeds received by STRF from the sale of shares (including pursuant to STRF's distribution reinvestment plan), reduced by amounts paid in connection with purchases of shares pursuant to STRF's mandatory repurchases and discretionary repurchases. There is no accumulation of amounts on the hurdle rate from quarter to quarter, and accordingly there is no clawback of amounts previously paid to STRF Advisors LLC if subsequent quarters are below the quarterly hurdle rate, and there is no delay of payment to STRF Advisors LLC if prior quarters are below the quarterly hurdle rate.
Long-Dated Private Funds and SMAs
Pursuant to the respective underlying agreements of our long-dated private funds and SMAs, we receive an annual management fee and may earn incentive or performance fees. In general, management fees are calculated at an annual rate of 0.75% to 2.00% calculated on the value of the capital accounts or the value of the investments held by each limited partner, fund or account. We may also receive transaction and advisory fees from a funds' underlying portfolio investment. In certain circumstances, we are required to offset our management fees earned by 50% to 100% of transaction and advisory fees earned. In addition, we receive performance fees or carried interest in an amount equal to 15.0% to 20.0% of the realized cash derived from an investment, subject to a cumulative annualized preferred return to the investor of 6.0% to 8.0%, which is in turn subject to a 50% to 100% catch-up allocation to us.
For certain long-dated private funds, we may also earn a two-part incentive fee. The first, the Part I incentive fee, is calculated and payable quarterly in an amount equal to 15.0% to 20.0% of the net investment income, subject to a hurdle rate equal to 1.5% to 2.0% per quarter, which is in turn subject to a 50% to 100% catch-up provision measured as of the end of each calendar quarter. The second, the Part II incentive fee, is calculated and payable annually in an amount equal to 15.0% to 20.0% of cumulative realized capital gains.
In order to better align the interests of our senior professionals and the other individuals who manage our long-dated private funds with our own interests and with those of the investors in such funds, such individuals may be allocated directly a portion of the performance fees in such funds. These interests entitle the holders to share the performance fees earned from MOF II. We may make similar arrangements with respect to allocation of performance or incentive fees with respect to MOF III, MCOF, Aspect or other long-dated private funds that we may advise in the future.
As noted above, in connection with raising new funds or securing additional investments in existing funds, we negotiate terms for such funds and investments with existing and potential investors. The outcome of such negotiations could result in our agreement to terms that are materially less favorable to us than for prior funds we have advised or funds advised by our competitors. See “Risk Factors — Risks Related to Our Business and Industry — We may not be able to maintain our current fee structure as a result of industry pressure from fund investors to reduce fees, which could have an adverse effect on our profit margins and results of operations.”
Investor Relations
Our fundraising efforts historically have been spread across distribution channels and have not been dependent on the success of any single channel. We distribute our investment products through two primary channels: (1) permanent capital vehicles and (2) long-dated private funds and SMAs. We believe that each of these channels offers unique advantages to investors and allows us to continue to raise and deploy capital opportunistically in varying market environments.
Permanent Capital Vehicles
We distribute our permanent capital vehicles through three sub-channels:
• | MCC is our publicly traded vehicle. It offers retail and institutional investors liquid access to an otherwise illiquid asset class (middle market credit). In addition to equity capital, MCC also raises debt capital in the private and public markets which is an alternative source of capital in challenging operating environments. |
• | SIC is our non-traded public vehicle. It offers retail and institutional investors access to an otherwise illiquid asset class (middle market credit) without exposure to public market trading volatility. It allows us to continue to raise capital continually during more challenging operating environments when publicly listed vehicles may be trading below net |
6
asset value (“NAV”), which we believe is valuable during times of market volatility. We believe this is a competitive advantage allowing us to make opportunistic investments, while peers may be more limited during times of market volatility.
• | STRF is our non-traded interval vehicle. It offers retail and institutional investors investments in the debt and equity of fixed-income and fixed-income related securities. STRF is a continuously offered, non-diversified, closed-end investment management company that is operated as an interval fund. |
Long-Dated Private Funds and SMAs
We distribute our long-dated private funds and SMAs through two sub-channels:
• | Long-dated private funds: Our long-dated private funds offer institutional investors attractive risk-adjusted returns. We believe this channel is an important element of our capital raising efforts given institutional investors are more likely to remain engaged in higher yielding private credit assets during periods of market turbulence. |
• | Separately managed accounts: Our SMAs provide investors with customized investment solutions. This is particularly attractive for liability driven investors such as insurance companies that invest over long time horizons. |
We believe that our deep and long-standing investor relationships, founded on our strong performance, disciplined management of our investors’ capital and diverse product offering, have facilitated the growth of our existing business and will assist us with the development of additional strategies and products, thereby increasing our fee earning AUM in the future. We have dedicated in-house capital markets, investor relations and marketing specialists. We have frequent discussions with our investors and are committed to providing them with the highest quality service. We believe our service levels, as well as our emphasis on transparency, inspire loyalty and support our efforts to continue to attract investors across our investment platform.
Investment Process
Direct Origination. We focus on lending directly to companies that are underserved by the traditional banking system and generally seek to avoid broadly marketed investment opportunities. We source investment opportunities through a variety of channels including direct relationships with companies, financial intermediaries such as national, regional and local bankers, accountants, lawyers and consultants, as well as through financial sponsors. Historically, as much as half of our annual origination volume has been derived from either repeat or referred borrowers or repeat sponsors. The other half of our annual origination volume has been sourced through a variety of channels including direct relationships with companies, financial intermediaries such as national, regional and local bankers, accountants, lawyers and consultants, as well as through other financial sponsors. Medley investments are well diversified across 35 industries. As of December 31, 2017, our industry exposure in excess of 10% was 15.5% in business services, 11.4 % in healthcare and pharmaceuticals and 10.1% in construction and building. Medley has a highly selective, three step underwriting process that is governed by an investment committee. This comprehensive process narrows down the investment opportunities from generally over 1,000 a year to approximately 1% to 3% originated borrowers in a year. For the year ended December 31, 2017, we sourced 1,250 investment opportunities, which resulted in 123 investments across 34 borrowers and approximately $735.0 million of invested capital. As of December 31, 2017, our funds had 474 investments across 165 borrowers.
Disciplined Underwriting. We perform thorough due diligence and focus on several key criteria in our underwriting process, including strong underlying business fundamentals, a meaningful equity cushion, experienced management, conservative valuation and the ability to deleverage through cash flows. We are often the agent for the loans we originate and accordingly control the loan documentation and negotiation of covenants, which allows us to maintain consistent underwriting standards. We invest across a broad range of industries and our disciplined underwriting process also involves engagement of industry experts and third-party consultants. This disciplined underwriting process is essential as our funds have historically invested primarily in privately held companies, for which public financial information is generally unavailable. Since our inception, we have experienced annualized realized losses for 0.3% of that capital through December 31, 2017. We believe our disciplined underwriting culture is a key factor to our success and our ability to expand our product offerings.
Prior to making an investment, the investment team subjects each potential borrower to an extensive credit review process, which typically begins with an analysis of the market opportunity, business fundamentals, company operating metrics and historical and projected financial analysis. We also compare liquidity, operating margin trends, leverage, free cash flow and fixed charge coverage ratios for each potential investment to industry metrics. Areas of additional underwriting focus include management or sponsor (typically a private equity firm) experience, management compensation, competitive landscape, regulatory environment, pricing power, defensibility of market share and tangible asset values. Background checks are conducted and tax compliance information may also be requested on management teams and key employees. In addition, the investment team contacts customers, suppliers and competitors and performs on-site visits as part of a routine business due diligence process.
Our disciplined underwriting process also involves the engagement of industry experts and third-party consultants. The investment team routinely uses third-party consultants and market studies to corroborate valuation and industry specific due
7
diligence, as well as provide quality of earnings analysis. Experienced legal counsel is engaged to evaluate and mitigate regulatory, insurance, tax or other company-specific risks.
After the investment team completes its final due diligence, each proposed investment is presented to our investment committee and subjected to extensive discussion and follow-up analysis, if necessary. A formal memorandum for each investment opportunity typically includes the results of business due diligence, multi-scenario financial analysis, risk-management assessment, results of third-party consulting work, background checks (where applicable) and structuring proposals. Our investment committee requires a majority vote to approve any investment.
Active Credit Management. We employ active credit management. Our process includes frequent interaction with management, monthly or quarterly reviews of financial information and, typically, attendance at board of directors’ meetings as observers. Investment professionals with deep restructuring and workout experience support our credit management effort. The investment team also evaluates financial reporting packages provided by portfolio companies that detail operational and financial performance. Data is entered in Black Mountain, an investment management software program. Black Mountain creates a centralized, dynamic electronic repository for all of our portfolio company data and generates comprehensive, standardized reports and dashboards which aggregate operational updates, portfolio company financial performance, asset valuations, macro trends, management call notes and account history.
Investment Operations and Information Technology
In addition to our investment team, we have a finance, accounting and operations team that supports our public and private vehicles team by providing infrastructure and administrative support in the areas of accounting/finance, valuation, capital markets and treasury functions, operations/information technology, strategy and business development, legal/compliance and human resources.
Regulatory and Compliance Matters
Our business, as well as the financial services industry generally, is subject to extensive regulation in the United States and elsewhere. The SEC and other regulators around the world have in recent years significantly increased their regulatory activities with respect to alternative asset management firms. Our business is subject to compliance with laws and regulations of United States federal and state governments, their respective agencies and/or various self-regulatory organizations or exchanges, and any failure to comply with these regulations could expose us to liability and/or reputational damage. Our business has been operated for a number of years within a legal framework that requires our being able to monitor and comply with a broad range of legal and regulatory developments that affect our activities. However, additional legislation, changes in rules promulgated by regulators or changes in the interpretation or enforcement of existing laws and rules, either in the United States or elsewhere, may directly affect our mode of operation and profitability.
Certain of our subsidiaries are registered as investment advisers with the SEC. Registered investment advisers are subject to the requirements and regulations of the Investment Advisers Act of 1940, as amended (the “Investment Advisers Act”). Such requirements relate to, among other things, fiduciary duties to advisory clients, maintaining an effective compliance program, solicitation agreements, conflicts of interest, recordkeeping and reporting requirements, disclosure requirements, limitations on agency cross and principal transactions between an advisor and advisory clients and general anti-fraud prohibitions. The SEC requires investment advisers registered or required to register with the SEC under the Investment Advisers Act that advise one or more private funds and have at least $150.0 million in private fund assets under management to periodically file reports on Form PF. We have filed, and will continue to file, quarterly reports on Form PF, which has resulted in increased administrative costs and requires a significant amount of attention and time to be spent by our personnel. In addition, our investment advisers are subject to routine periodic examinations by the staff of the SEC. Our investment advisers also have not been subject to any regulatory or disciplinary actions by the SEC.
MCC and SIC are BDCs. A BDC is a special category of investment company under the Investment Company Act that was added by Congress to facilitate the flow of capital to private companies and small public companies based in the United States that do not have efficient or cost-effective access to public capital markets or other conventional forms of corporate financing. BDCs make investments in private or thinly traded public companies in the form of long-term debt and/or equity capital, with the goal of generating current income or capital growth.
BDCs are closed-end funds that elect to be regulated as BDCs under the Investment Company Act. As such, BDCs are subject to only certain provisions of the Investment Company Act, as well as the Securities Act and the Exchange Act. BDCs are provided greater flexibility under the Investment Company Act than are other investment companies that are registered under the Investment Company Act in dealing with their portfolio companies, issuing securities, and compensating their managers. BDCs can be internally or externally managed and may qualify to elect to be taxed as a regulated investment company (“RIC”) under Subchapter M of the Internal Revenue Code of 1986, as amended (the “Code”), and the regulations thereunder, for federal tax purposes. The Investment Company Act contains prohibitions and restrictions relating to transactions between BDCs and their affiliates, principal underwriters, and affiliates of those affiliates or underwriters. The Investment Company Act requires that a majority of a BDC’s
8
directors be persons other than “interested persons,” as that term is defined in the Investment Company Act. In addition, the Investment Company Act provides that a BDC may not change the nature of its business so as to cease to be, or withdraw its election to be regulated as a BDC unless approved by a majority of its outstanding voting securities. The Investment Company Act defines “a majority of the outstanding voting securities” as the lesser of: (1) 67% or more of the voting securities present at a meeting if the holders of more than 50% of its outstanding voting securities are present or represented by proxy or (2) more than 50% of its voting securities.
Generally, BDCs are prohibited under the Investment Company Act from knowingly participating in certain transactions with their affiliates without the prior approval of their board of directors who are not interested persons and, in some cases, prior approval by the SEC. The SEC has interpreted the prohibition on transactions with affiliates broadly to prohibit “joint transactions” among entities that share a common investment adviser.
On November 25, 2013, we received an amended order from the SEC that expanded our ability to negotiate the terms of co-investment transactions among our BDCs and other funds managed by us (the “Exemptive Order”), subject to the conditions included therein. In situations where co-investment with other funds managed by us is not permitted or appropriate, such as when there is an opportunity to invest in different securities of the same issuer or where the different investments could be expected to result in a conflict between our interests and those of our other clients, we will need to decide which client will proceed with the investment. We will make these determinations based on our policies and procedures, which generally require that such opportunities be offered to eligible accounts on an alternating basis that will be fair and equitable over time. Moreover, except in certain circumstances, our BDCs will be unable to invest in any issuer in which another of our funds holds an existing investment. Similar restrictions limit our BDCs’ ability to transact business with our officers or directors or their affiliates.
Under the terms of the Exemptive Order, a “required majority” (as defined in Section 57(o) of the Investment Company Act) of the independent directors of our BDCs must make certain conclusions in connection with a co-investment transaction, including that (1) the terms of the proposed transaction are reasonable and fair to the applicable BDC and such BDC’s stockholders and do not involve overreaching of such BDC or its stockholders on the part of any person concerned and (2) the transaction is consistent with the interests of the BDC’s stockholders and is consistent with its investment strategies and policies.
Our BDCs have elected to be treated as RICs under Subchapter M of the Code. As RICs, the BDCs generally do not have to pay corporate-level federal income taxes on any income that is distributed to its stockholders from its tax earnings and profits. To maintain qualification as a RIC, our BDCs must, among other things, meet certain source-of-income and asset diversification requirements (as described below). In addition, in order to obtain and maintain RIC tax treatment, the BDCs must distribute to their stockholders, for each taxable year, at least 90% of their “investment company taxable income,” which is generally its net ordinary income plus the excess, if any, of realized net short-term capital gains over realized net long-term capital losses.
In July 2010, President Obama signed into law the Dodd-Frank Act. The Dodd-Frank Act, among other things, imposes significant new regulations on nearly every aspect of the U.S. financial services industry, including oversight and regulation of systemic market risk (including the power to liquidate certain institutions); authorizing the Federal Reserve to regulate nonbank institutions that are deemed systemically important; generally prohibiting insured banks or thrifts, any bank holding company or savings and loan holding company, any non-U.S. bank with a U.S. branch, agency or commercial lending company and any subsidiaries and affiliates of any of these types of entities, regardless of geographic location, from conducting proprietary trading or investing in or sponsoring a “covered fund,” which includes private equity funds and hedge funds (i.e., the Volcker Rule); and imposing new registration, recordkeeping and reporting requirements on private fund investment advisers. Importantly, while several key aspects of the Dodd-Frank Act have been defined through final rules, many aspects will be implemented by various regulatory bodies over the next several years.
The Dodd-Frank Act requires the CFTC, the SEC and other regulatory authorities to promulgate certain rules relating to the regulation of the derivatives market. Such rules require or will require the registration of certain market participants, the clearing of certain derivatives contracts through central counterparties, the execution of certain derivatives contracts on electronic platforms, as well as reporting and recordkeeping of derivatives transactions. Certain of our funds may from time to time, directly or indirectly, invest in instruments that meet the definition of a “swap” under the Commodity Exchange Act and the CFTC’s rules promulgated thereunder. As a result, such funds may qualify as commodity pools, and the operators of such funds may need to register as commodity pool operators (“CPOs”) unless an exemption applies. Additionally, pursuant to a rule finalized by the CFTC in December 2012, certain classes of interest rate swaps and certain classes of index credit default swaps are now subject to mandatory clearing, unless an exemption applies. As of February 2014, many of these interest rate swaps and index credit default swaps are also now subject to mandatory trading on designated contract markets or swap execution facilities. The Dodd-Frank Act also provides expanded enforcement authority to the CFTC and SEC. While certain rules have been promulgated and are already in effect, the rulemaking and implementation process is still ongoing. In particular, the CFTC has finalized most of its rules under the Dodd-Frank Act, and the SEC has proposed several rules regarding security-based swaps but has only finalized a small number of these rules.
9
Competition
The investment management industry is intensely competitive, and we expect it to remain so. We face competition both in the pursuit of outside investors for our funds and in acquiring investments in attractive investee companies and making other investments. We compete for outside investors based on a variety of factors, including:
• | investment performance; |
• | investor perception of investment managers’ drive, focus and alignment of interest; |
• | quality of service provided to and duration of relationship with investors; |
• | business reputation; and |
• | the level of fees and expenses charged for services. |
We face competition in our lending and other investment activities primarily from other credit-focused funds, specialized funds, BDCs, real estate funds, hedge fund sponsors, other financial institutions and other parties. Many of these competitors in some of our business are substantially larger and have considerably greater financial, technical and marketing resources than are available to us. Many of these competitors have similar investment objectives to us, which may create additional competition for investment opportunities. Some of these competitors may also have a lower cost of capital and access to funding sources that are not available to us, which may create competitive disadvantages for us with respect to investment opportunities. In addition, some of these competitors may have higher risk tolerances, different risk assessments or lower return thresholds, which could allow them to consider a wider variety of investments and to bid more aggressively than us for investments that we want to make. Lastly, institutional and individual investors are allocating increasing amounts of capital to alternative investment strategies. Several large institutional investors have announced a desire to consolidate their investments in a more limited number of managers. We expect that this will cause competition in our industry to intensify and could lead to a reduction in the size and duration of pricing inefficiencies.
Competition is also intense for the attraction and retention of qualified employees. Our ability to continue to compete effectively in our business will depend upon our ability to attract new employees and retain and motivate our existing employees.
For additional information concerning the competitive risks that we face, see “Risk Factors — Risks Related to Our Business and Industry — The investment management business is competitive.”
Employees
As of December 31, 2017, we employed over 85 individuals, including over 45 investment, origination and credit management professionals, located in our New York and San Francisco offices. As discussed in Item 9B, below, during the first quarter of 2018, the Company initiated the consolidation of our operations in New York. At this time, the Company does not anticipate a material change in overall headcount upon completion of the consolidation.
Corporate Information
Medley Management Inc. was incorporated as a Delaware corporation on June 13, 2014, and its sole asset is a controlling equity interest in Medley LLC. Pursuant to the Reorganization consummated in connection with Medley Management Inc.’s IPO, Medley Management Inc. became a holding corporation and the sole managing member of Medley LLC, operating and controlling all of the business and affairs of Medley LLC and, through Medley LLC and its subsidiaries, conducts its business. Our principal executive office is located at 280 Park Avenue, 6th Floor East, New York, New York 10017. Our telephone number is (212) 759-0777.
Where You Can Find More Information
We file annual, quarterly and current reports, proxy statements and other information with the Securities and Exchange Commission (“SEC”). Our SEC filings are available to the public over the internet at the SEC’s website at http://www.sec.gov. Our SEC filings are also available on our website at http://www.mdly.com as soon as reasonably practicable after they are filed with or furnished to the SEC. You may also read and copy any filed document at the SEC’s public reference room in Washington, D.C. at 100 F Street, N.E., Washington, D.C. 20549. Please call the SEC at 1-800-SEC-0330 for further information about public reference rooms.
Item 1A. Risk Factors
You should carefully read the risks and uncertainties described below, together with the other information included in this Form 10-K. Any of the following risks could materially affect our business, financial condition or results of operations. The risks described below are not the only risks we face. Additional risks and uncertainties we are not presently aware of or that we currently believe are immaterial could also materially and adversely affect our business, financial condition or results of operations.
10
Risks Related to Our Business and Industry
Difficult market and political conditions may adversely affect our business in many ways, including by reducing the value or hampering the performance of the investments made by our funds, each of which could materially and adversely affect our business, results of operations and financial condition.
Our business is materially affected by conditions in the global financial markets and economic and political conditions throughout the world, such as interest rates, availability and cost of credit, inflation rates, economic uncertainty, changes in laws (including laws relating to our taxation, taxation of our investors, the possibility of changes to tax laws in either the United States or any non-U.S. jurisdiction and regulations on asset managers), trade barriers, commodity prices, currency exchange rates and controls and national and international political circumstances (including wars, terrorist acts and security operations). These factors are outside of our control and may affect the level and volatility of asset prices and the liquidity and value of investments, and we may not be able to or may choose not to manage our exposure to these conditions. Ongoing developments in the U.S. and global financial markets following the unprecedented turmoil in the global capital markets and the financial services industry in late 2008 and early 2009 continue to illustrate that the current environment is still one of uncertainty and instability for investment management business. Recently, global financial markets have experienced heightened volatility, including the June 2016 “Brexit” referendum in the United Kingdom in favor of exiting the EU and subsequent uncertainty regarding the timing and terms of the exit, the results of the 2016 U.S. presidential and congressional election and resulting uncertainty regarding actual and potential shifts in U.S. and foreign, trade, economic and other policies, and, more recently, concerns over increasing interest rates (particularly short-term rates), uncertainty regarding the short- and long-term effects of tax reform in the United States and uncertainty regarding trade policies and tariffs implemented by the Trump administration. For example, in February 2018, global equity markets experienced a widespread sell-off, and bonds have also declined in value. Any of the foregoing could have a significant impact on the markets in which we operate and a material adverse impact on our business prospects and financial condition.
A number of factors have had and may continue to have an adverse impact on credit markets in particular. In addition following a sustained period of historically low interest rate levels, in the United States, short-term interest rates have risen by 90 to 120 basis points since the U.S. presidential election in November 2016 with 10 to 20 bps of such amount attributable to increases seen between January 1, 2018 and February 8, 2018. Changes in and uncertainty surrounding interest rates may have a material effect on our business, particularly with respect to the cost and availability of financing for significant acquisition and disposition transactions. Furthermore, some of the provisions under the newly enacted tax law in the United States, Public Law No. 115-97 (the “Tax Cuts and Jobs Act”) could have a negative impact on the cost of financing and dampen the attractiveness of credit. There has been a corresponding meaningful increase in the uncertainty surrounding interest rates, foreign exchange rates, trade volume, and fiscal and economic policies, which has heightened volatility in the U.S. and global markets and could persist for an extended period.
These and other conditions in the global financial markets and the global economy may result in adverse consequences for our funds and their respective investee companies, which could restrict such funds’ investment activities and impede such funds’ ability to effectively achieve their investment objectives. In addition, because the fees we earn under our investment management agreements are based in part on the market value of our AUM and in part on investment performance, if any of these factors cause a decline in our AUM or result in non-performance of loans by investee companies, it would result in lower fees earned, which could in turn materially and adversely affect our business and results of operations.
Newly enacted laws, such as Tax Cuts and Jobs Act, or regulations and future changes in the U.S. taxation of businesses may impact our effective tax rate or may adversely affect our business, financial condition and operating results.
On December 22, 2017, the President signed into law the Tax Cuts and Jobs Act, which significantly changed the Code, including a reduction in the federal statutory corporate income tax rate to 21%, a new limitation on the deductibility of business interest expense, restrictions on the use of net operating loss carryforwards arising in taxable years beginning after December 31, 2017 and dramatic changes to the taxation of income earned from foreign sources and foreign subsidiaries. The Tax Cuts and Jobs Act also authorizes the Treasury Department to issue regulations with respect to the new provisions. We cannot predict how the changes in the Tax Cuts and Jobs Act, regulations, or other guidance issued under it or conforming or non-conforming state tax rules might affect us or our business. In addition, there can be no assurance that U.S. tax laws, including the corporate income tax rate, would not undergo significant changes in the near future.
We derive a substantial portion of our revenues from funds managed pursuant to advisory agreements that may be terminated or fund partnership agreements that permit fund investors to remove us as the general partner.
With respect to our permanent capital vehicles, each fund’s investment management agreement must be approved annually by such fund’s board of directors or by the vote of a majority of the stockholders and the majority of the independent members of such fund’s board of directors and, in certain cases, by its stockholders, as required by law. In addition, as required by the Investment Company Act, both MCC and SIC have the right to terminate their respective management agreements without penalty upon 60 days’ written notice to their respective advisers. Termination of these agreements would reduce the fees we earn from the relevant funds, which could have a material adverse effect on our results of operations. For the years ended December 31, 2017, 2016 and
11
2015, our investment advisory relationships with MCC and SIC represented approximately 74.4%, 80.3% and 80.2% , respectively, of our total management fees. These investment advisory relationships also represented, in the aggregate, 45% of our AUM at December 31, 2017. There can be no assurance that our investment management agreements with respect to MCC and SIC will remain in place.
With respect to our long-dated private funds, insofar as we control the general partner of such funds, the risk of termination of the investment management agreement for such funds is limited, subject to our fiduciary or contractual duties as general partner. However, the applicable fund partnership agreements may permit the limited partners of each respective fund to remove us as general partner by a majority or, in certain circumstances, a super majority vote. In addition, the partnership agreements provide for dissolution of the partnership upon certain changes of control.
Our SMAs are governed by investment management agreements that may be terminated by investors at any time for cause under the applicable agreement and “cause” may include the departure of specified members of our senior management team. Absent cause, the investment management agreements that govern our SMAs are generally not terminable during the specified investment period or following the specified investment period, prior to the scheduled maturities or disposition of the subject AUM.
Termination of these agreements would negatively affect the fees we earn from the relevant funds, which could have a material adverse effect on our results of operations.
We may not be able to maintain our current fee structure as a result of industry pressure from fund investors to reduce fees, which could have an adverse effect on our profit margins and results of operations.
We may not be able to maintain our current fee structure as a result of industry pressure from fund investors to reduce fees. Although our investment management fees vary among and within asset classes, historically we have competed primarily on the basis of our performance and not on the level of our investment management fees relative to those of our competitors. In recent years, however, there has been a general trend toward lower fees in the investment management industry. In September 2009, the Institutional Limited Partners Association published a set of Private Equity Principles (the “Principles”), which were revised in January 2011. The Principles were developed to encourage discussion between limited partners and general partners regarding private equity fund partnership terms. Certain of the Principles call for enhanced “alignment of interests” between general partners and limited partners through modifications of some of the terms of fund arrangements, including proposed guidelines for fees and performance income structures. Although we have no obligation to modify any of our fees with respect to our existing funds, we may experience pressure to do so in our funds. More recently institutional investors have been allocating increasing amounts of capital to alternative investment strategies as well as attempting to reduce management and investment fees to external managers, whether through direct reductions, deferrals or rebates. We cannot assure you that we will succeed in providing investment returns and service that will allow us to maintain our current fee structure. For example, on December 3, 2015, we agreed to reduce our fees from MCC and beginning January 1, 2016, the base management fee from MCC was reduced to 1.50% on gross assets above $1 billion. In addition, we reduced our incentive fee from MCC from 20% on pre-incentive fee net investment income over an 8% hurdle, to 17.5% on pre-incentive fee net investment income over a 6% hurdle and introduced a netting mechanism and incentive fee income will be subject to a rolling three-year look back. Under no circumstances will our recently implemented fee structure result in higher fees from MCC than fees under the current investment management agreement. Fee reductions on existing or future new business could have an adverse effect on our profit margins and results of operations. For more information about our fees, see “Business - Fee Structure."
A change of control of us could result in termination of our investment advisory agreements.
Pursuant to the Investment Company Act, each of the investment advisory agreements for the BDCs that we advise automatically terminates upon its deemed “assignment” and a BDC’s board and shareholders must approve a new agreement in order for us to continue to act as its investment adviser. In addition, pursuant to the Investment Advisers Act, each of our investment advisory agreements for the separate accounts we manage may not be “assigned” without the consent of the client. A sale of a controlling block of our voting securities and certain other transactions would be deemed an “assignment” pursuant to both the Investment Company Act and the Investment Advisers Act. Such an assignment may be deemed to occur in the event that our pre-IPO owners dispose of enough of their interests in us such that they no longer own a controlling interest in us. If such a deemed assignment occurs, there can be no assurance that we will be able to obtain the necessary consents from clients whose funds are managed pursuant to separate accounts or the necessary approvals from the boards and shareholders of the SEC-registered BDCs that we advise. An assignment, actual or constructive, would trigger these termination and consent provisions and, unless the necessary approvals and consents are obtained, could adversely affect our ability to continue managing client accounts, resulting in the loss of assets under management and a corresponding loss of revenue.
12
The historical returns attributable to our funds should not be considered as indicative of the future results of our funds or of our future results or of any returns expected on an investment in our Class A common stock.
The historical performance of our funds is relevant to us primarily insofar as it is indicative of fees we have earned in the past and may earn in the future and our reputation and ability to raise new funds. The historical and potential returns of the funds we advise are not, however, directly linked to returns on our Class A common stock. Therefore, you should not conclude that positive performance of the funds we advise will necessarily result in positive returns on an investment in Class A common stock. However, poor performance of the funds we advise could cause a decline in our revenues and could therefore have a negative effect on our operating results and returns on our Class A common stock. An investment in our Class A common stock is not an investment in any of our funds. Also, there is no assurance that projections in respect of our funds or unrealized valuations will be realized.
Moreover, the historical returns of our funds should not be considered indicative of the future returns of these funds or from any future funds we may raise, in part because:
• | market conditions during previous periods may have been significantly more favorable for generating positive performance than the market conditions we may experience in the future; |
• | our funds’ rates of returns, which are calculated on the basis of NAV of the funds’ investments, including unrealized gains, which may never be realized; |
• | our funds’ returns have previously benefited from investment opportunities and general market conditions that may not recur, and our funds may not be able to achieve the same returns or profitable investment opportunities or deploy capital as quickly; |
• | the historical returns that we present in this Form 10-K derive largely from the performance of our earlier funds, whereas future fund returns will depend increasingly on the performance of our newer funds or funds not yet formed, which may have little or no realized investment track record; |
• | you will not benefit from any value that was created in our funds prior to our becoming a public company if such value was previously realized; |
• | in recent years, there has been increased competition for investment opportunities resulting from the increased amount of capital invested in alternative funds and high liquidity in debt markets, and the increased competition for investments may reduce our returns in the future; and |
• | our newly established funds may generate lower returns during the period that they take to deploy their capital. |
The future internal rate of return for any current or future fund may vary considerably from the historical internal rate of return generated by any particular fund, or for our funds as a whole. Future returns will also be affected by the risks described in this Form 10-K, including risks of the industries and business in which a particular fund invests.
If we are unable to consummate or successfully integrate development opportunities, acquisitions or joint ventures, we may not be able to implement our growth strategy successfully.
Our growth strategy may include the selective development or acquisition of other asset management businesses, advisory businesses or other businesses or financial products complementary to our business where we think we can add substantial value or generate substantial returns. The success of this strategy will depend on, among other things: (a) the availability of suitable opportunities, (b) the level of competition from other companies that may have greater financial resources, (c) our ability to value potential development or acquisition opportunities accurately and negotiate acceptable terms for those opportunities, (d) our ability to obtain requisite approvals and licenses from the relevant governmental authorities and to comply with applicable laws and regulations without incurring undue costs and delays, (e) our ability to identify and enter into mutually beneficial relationships with venture partners and (f) our ability to properly manage conflicts of interest. Moreover, even if we are able to identify and successfully complete an acquisition, we may encounter unexpected difficulties or incur unexpected costs associated with integrating and overseeing the operations of the new business or activities. If we are not successful in implementing our growth strategy, our business, results of operations and the market price for our Class A common stock may be adversely affected.
We depend on third-party distribution sources to market our investment strategies.
Our ability to grow our AUM, particularly with respect to our BDCs, is dependent on access to third-party intermediaries, including investment banks, broker dealers and RIAs. We cannot assure you that these intermediaries will continue to be accessible to us on commercially reasonable terms, or at all. In addition, pension fund consultants may review and evaluate our institutional products and our firm from time to time. Poor reviews or evaluations of either a particular product, or of us, may result in institutional client withdrawals or may impair our ability to attract new assets through these consultants.
13
An investment strategy focused primarily on privately held companies presents certain challenges, including the lack of available information about these companies.
Our funds have historically invested primarily in privately held companies. Investments in private companies pose certain incremental risks as compared to investments in public companies including that private companies:
• | have reduced access to the capital markets, resulting in diminished capital resources and ability to withstand financial distress; |
• | may have limited financial resources and may be unable to meet their obligations under debt that we hold, which may be accompanied by a deterioration in the value of any collateral and a reduction in the likelihood of us realizing any guarantees we may have obtained in connection with our investment; |
• | may have shorter operating histories, narrower product lines and smaller market shares than larger business, which tend to render them more vulnerable to competitors’ actions and changing market conditions, as well as general economic downturns; |
• | are more likely to depend on the management talents and efforts of a small group of persons; therefore, the death, disability, resignation or termination of one or more of these persons could have a material adverse impact on our investee company and, in turn, on us; and |
• | generally have less predictable operating results, may from time to time be parties to litigation, may be engaged in rapidly changing business with products subject to a substantial risk of obsolescence, and may require substantial additional capital to support their operations, finance expansion or maintain their competitive position. In addition, our executive officers, directors or employees may, in the ordinary course of business, be named as defendants in litigation arising from our funds’ investments in investee companies. |
Finally, limited public information generally exists about private companies and these companies may not have third-party debt ratings or audited financial statements. We must therefore rely on the ability of our funds’ advisors to obtain adequate information through due diligence to evaluate the creditworthiness and potential returns from investing in these companies. Additionally, these companies and their financial information will not generally be subject to the Sarbanes-Oxley Act and other rules that govern public companies. If we are unable to uncover all material information about these companies, our funds may lose money on such investments.
Our funds’ investments in investee companies may be risky, and our funds could lose all or part of their investments.
Our funds pursue strategies focused on investing primarily in the debt of privately owned U.S. companies.
Senior Secured Debt and Second Lien Secured Debt. When our funds invest in senior secured term debt and second lien secured debt, our funds will generally take a security interest in the available assets of these investee companies, including the equity interests of their subsidiaries. There is a risk that the collateral securing such investments may decrease in value over time or lose its entire value, may be difficult to sell in a timely manner, may be difficult to appraise and may fluctuate in value based upon the success of the business and market conditions, including as a result of the inability of the investee company to raise additional capital. Also, in some circumstances, our security interest could be subordinated to claims of other creditors. In addition, deterioration in an investee company’s financial condition and prospects, including its inability to raise additional capital, may be accompanied by deterioration in the value of the collateral for the debt. Consequently, the fact that debt is secured does not guarantee that we will receive principal and interest payments according to the investment terms, or at all, or that we will be able to collect on the investment should we be forced to enforce our remedies.
Senior Unsecured Debt. Our funds may also make unsecured debt investments in investee companies, meaning that such investments will not benefit from any interest in collateral of such companies.
Subordinated Debt. Our subordinated debt investments will generally be subordinated to senior debt and will generally be unsecured. This may result in a heightened level of risk and volatility or a loss of principal, which could lead to the loss of the entire investment. These investments may involve additional risks that could adversely affect our investment returns. To the extent interest payments associated with such debt are deferred, such debt may be subject to greater fluctuations in valuations, and such debt could subject our funds to non-cash income. Since the applicable fund would not receive any principal repayments prior to the maturity of some of our subordinated debt investments, such investments will be of greater risk than amortizing loans.
Equity Investments. Certain of our funds make selected equity investments. In addition, when our funds invest in senior and subordinated debt, they may acquire warrants or options to purchase equity securities or benefit from other types of equity participation. Our goal is ultimately to dispose of these equity interests and realize gains upon our disposition of such interests. However, the equity interests our funds receive may not appreciate in value and, in fact, may decline in value. Accordingly, our funds may not be able to realize gains from such equity interests, and any gains that our funds do realize on the disposition of any equity interests may not be sufficient to offset any other losses our funds experience.
Most loans in which our funds invest will not be rated by any rating agency and, if they were rated, they would be rated as below investment grade quality. Loans rated below investment grade quality are generally regarded as having predominantly
14
speculative characteristics and may carry a greater risk with respect to a borrower’s capacity to pay interest and repay principal. From time to time, our funds, in the past, and may in the future, lose some or all of their investment in an investee company.
Prepayments of debt investments by our investee companies could adversely impact our results of operations.
We are subject to the risk that the investments our funds make in investee companies may be repaid prior to maturity. When this occurs, our BDCs will generally use such proceeds to reduce their existing borrowings and our private funds will generally return such capital to its investors, which capital may be recalled at a later date pursuant to such fund’s governing documents. With respect to our SMAs, if such event occurs after the investment period, such capital will be returned to investors. Any future investment in a new investee company may also be at lower yields than the debt that was repaid. As a result, the results of operations of the affected fund could be materially adversely affected if one or more investee companies elect to prepay amounts owed to such fund, which could in turn have a material adverse effect on our results of operations.
Our funds’ investee companies may incur debt that ranks equally with, or senior to, our funds’ investments in such companies.
Our funds pursue a strategy focused on investing primarily in the debt of privately owned U.S. companies. Our funds’ investee companies may have, or may be permitted to incur, other debt that ranks equally with, or senior to, the debt in which our funds invest. By their terms, such debt instruments may entitle the holders to receive payment of interest or principal on or before the dates on which we are entitled to receive payments with respect to the debt instruments in which our funds invest. Also, in the event of insolvency, liquidation, dissolution, reorganization or bankruptcy of an investee company, holders of debt instruments ranking senior to our funds’ investment in that investee company would typically be entitled to receive payment in full before we receive any distribution. After repaying such senior creditors, such investee company may not have any remaining assets to use for repaying its obligation to our funds. In the case of debt ranking equally with debt instruments in which our funds invest, our funds would have to share on an equal basis any distributions with other creditors holding such debt in the event of an insolvency, liquidation, dissolution, reorganization or bankruptcy of the relevant investee company.
Subordinated liens on collateral securing loans that our funds make to their investee companies may be subject to control by senior creditors with first priority liens. If there is a default, the value of the collateral may not be sufficient to repay in full both the first priority creditors and our funds.
Certain debt investments that our funds make in investee companies are secured on a second priority basis by the same collateral securing senior secured debt of such companies. The first priority liens on the collateral will secure the investee company’s obligations under any outstanding senior debt and may secure certain other future debt that may be permitted to be incurred by the company under the agreements governing the debt. The holders of obligations secured by the first priority liens on the collateral will generally control the liquidation of and be entitled to receive proceeds from any realization of the collateral to repay their obligations in full before our funds. In addition, the value of the collateral in the event of liquidation will depend on market and economic conditions, the availability of buyers and other factors. There can be no assurance that the proceeds, if any, from the sale or sales of all of the collateral would be sufficient to satisfy the debt obligations secured by the second priority liens after payment in full of all obligations secured by the first priority liens on the collateral. If such proceeds are not sufficient to repay amounts outstanding under the debt obligations secured by the second priority liens, then our funds, to the extent not repaid from the proceeds of the sale of the collateral, will only have an unsecured claim against the investee company’s remaining assets, if any.
Our funds may also make unsecured debt investments in investee companies, meaning that such investments will not benefit from any interest in collateral of such companies. Liens on such investee companies’ collateral, if any, will secure the investee company’s obligations under its outstanding secured debt and may secure certain future debt that is permitted to be incurred by the investee company under its secured debt agreements. The holders of obligations secured by such liens will generally control the liquidation of, and be entitled to receive proceeds from, any realization of such collateral to repay their obligations in full before us. In addition, the value of such collateral in the event of liquidation will depend on market and economic conditions, the availability of buyers and other factors. There can be no assurance that the proceeds, if any, from sales of such collateral would be sufficient to satisfy our unsecured debt obligations after payment in full of all secured debt obligations. If such proceeds were not sufficient to repay the outstanding secured debt obligations, then our unsecured claims would rank equally with the unpaid portion of such secured creditors’ claims against the investee company’s remaining assets, if any.
The rights our funds may have with respect to the collateral securing the debt investments our funds make in their investee companies with senior debt outstanding may also be limited pursuant to the terms of one or more intercreditor agreements that our funds enter into with the holders of senior secured debt. Under such an intercreditor agreement, at any time that obligations that have the benefit of the first priority liens are outstanding, any of the following actions that may be taken in respect of the collateral will be at the discretion of the holders of the obligations secured by the first priority liens: the ability to cause the commencement of enforcement proceedings against the collateral; the ability to control the conduct of such proceedings; the approval of amendments to collateral documents; releases of liens on the collateral; and waivers of past defaults under collateral documents. Our funds may not have the ability to control or direct such actions, even if their rights are adversely affected.
15
There may be circumstances where our funds’ debt investments could be subordinated to claims of other creditors or our funds could be subject to lender liability claims.
If one of our investee companies were to go bankrupt, depending on the facts and circumstances, including the extent to which our funds actually provided managerial assistance to that investee company or a representative of us sat on the board of directors of such investee company, a bankruptcy court might recharacterize our funds’ debt investment and subordinate all or a portion of our funds’ claim to that of other creditors. In situations where a bankruptcy carries a high degree of political significance, our funds’ legal rights may be subordinated to other creditors.
In addition, lenders in certain cases can be subject to lender liability claims for actions taken by them when they become too involved in the borrower’s business or exercise control over a borrower. It is possible that we or our funds could become subject to a lender’s liability claim, including as a result of actions taken if we or our funds render significant managerial assistance to, or exercise control or influence over the board of directors of, the borrower.
Our funds may not have the resources or ability to make additional investments in our investee companies.
After an initial investment in an investee company, our funds may be called upon from time to time to provide additional funds to such company or have the opportunity to increase their investment through the exercise of a warrant or other right to purchase common stock. There is no assurance that the applicable fund will make, or will have sufficient resources to make, follow-on investments. Even if such fund has sufficient capital to make a desired follow-on investment, we may elect not to make a follow-on investment because we may not want to increase our level of risk, we prefer other opportunities or we are limited in our ability to do so by compliance with BDC requirements or maintaining RIC status, if applicable. Any decisions not to make a follow-on investment or any inability on our part to make such an investment may have a negative impact on an investee company in need of such an investment, may result in a missed opportunity for us to increase our participation in a successful operation or may reduce the expected return on the investment.
Economic recessions or downturns could impair our investee companies and harm our operating results.
Many of our investee companies are susceptible to economic slowdowns or recessions and may be unable to repay our funds’ debt investments during these periods. Therefore, our funds’ non-performing assets are likely to increase, and the value of our funds’ portfolios are likely to decrease during these periods. Adverse economic conditions may also decrease the value of any collateral securing our senior secured or second lien secured debt. A severe recession may further decrease the value of such collateral and result in losses of value in such portfolios. Unfavorable economic conditions also could increase our funding costs, limit our access to the capital markets or result in a decision by lenders not to extend credit to us on terms we deem acceptable. Occurrence of any of these events could materially and adversely affect our business and results of operations.
A covenant breach by our investee companies may harm our operating results.
An investee company’s failure to satisfy financial or operating covenants imposed by us or other lenders could lead to defaults and, potentially, termination of its debt and foreclosure on its secured assets, which could trigger cross-defaults under other agreements and jeopardize an investee company’s ability to meet its obligations under the debt or equity instruments that our funds hold. Our funds may incur expenses to the extent necessary to seek recovery upon default or to negotiate new terms, which may include the waiver of certain financial covenants, with a defaulting investee company. To the extent our funds incur additional costs and/or do not recover their investments in investee companies, we may earn reduced management and incentive fees, which may adversely affect our results of operations.
The investment management business is competitive.
The investment management business is competitive, with competition based on a variety of factors, including investment performance, business relationships, quality of service provided to investors, investor liquidity and willingness to invest, fund terms (including fees), brand recognition and business reputation. We compete for investors with a number of other investment managers, public and private funds, BDCs, small business investment companies and others. Numerous factors increase our competitive risks, including:
• | a number of our competitors have greater financial, technical, marketing and other resources and more personnel than we do; |
• | some of our funds may not perform as well as competitors’ funds or other available investment products; |
• | several of our competitors have raised significant amounts of capital, and many of them have similar investment objectives to ours, which may create additional competition for investment opportunities and may reduce the size and duration of pricing inefficiencies that otherwise could be exploited; |
• | some of our competitors may have a lower cost of capital and access to funding sources that are not available to us, which may create competitive disadvantages for us with respect to our funds; |
16
• | some of our competitors may be subject to less regulation and, accordingly, may have more flexibility to undertake and execute certain business or investments than we do and/or bear less compliance expense than we do; |
• | some of our competitors may have more flexibility than we have in raising certain types of funds under the investment management contracts they have negotiated with their investors; |
• | some of our competitors may have better expertise or be regarded by investors as having better expertise in a specific asset class or geographic region than we do; and |
• | other industry participants may, from time to time, seek to recruit our investment professionals and other employees away from us. |
In addition, the attractiveness of our funds relative to investments in other investment products could decrease depending on economic conditions. This competitive pressure could adversely affect our ability to make successful investments and limit our ability to raise future funds, either of which would adversely impact our business, results of operations and financial condition.
Our funds operate in a competitive market for lending that has recently intensified, and competition may limit our funds’ ability to originate or acquire desirable loans and investments and could also affect the yields of these assets and have a material adverse effect on our business, results of operations and financial condition.
Our funds operate in a competitive market for lending that has recently intensified. Our profitability depends, in large part, on our funds’ ability to originate or acquire credit investments on attractive terms. In originating or acquiring our target credit investments, we compete with a variety of institutional lenders and investors, including specialty finance companies, public and private funds, commercial and investment banks, BDCs, small business investment companies, REITs, commercial finance and insurance companies and others. Some competitors may have a lower cost of funds and access to funding sources that are not available to us, such as the U.S. government. Many of our competitors or their funds are not subject to the operating constraints associated with qualifying as a RIC under subchapter M of the Code or compliance with the Investment Company Act. In addition, some of our competitors may have higher risk tolerances or different risk assessments, which could allow them to consider a wider variety of investments, offer more attractive pricing, transaction structures, covenants or other terms and establish more relationships than us. Furthermore, competition for originations of and investments in our target assets may lead to the yields of such assets decreasing, which may further limit our ability to generate satisfactory returns. Also, as a result of this competition, desirable loans and investments may be limited in the future and our funds may not be able to take advantage of attractive lending and investment opportunities from time to time, thereby limiting their ability to identify and originate loans or make investments that are consistent with their investment objectives. We cannot assure you that the competitive pressures our funds face will not have a material adverse effect on our business, results of operations and financial condition.
Dependence on leverage by certain of our funds and by our funds’ investee companies subjects us to volatility and contractions in the debt financing markets and could adversely affect our ability to achieve attractive rates of return on those investments.
MCC, SIC and our funds’ investee companies rely on the use of leverage, and our ability to achieve attractive rates of return on investments will depend on our ability to access sufficient sources of indebtedness at attractive rates. While our permanent capital vehicles, MCC and SIC, are our only funds that currently rely on the use of leverage, certain of our other funds may in the future rely on the use of leverage. If our funds or the companies in which our funds invest raise capital in the structured credit, leveraged loan and high yield bond markets, the results of their operations may suffer if such markets experience dislocations, contractions or volatility. Any such events could adversely impact the availability of credit to business generally and could lead to an overall weakening of the U.S. and global economies. Any economic downturn could adversely affect the financial resources of our funds and their investments (in particular those investments that depend on credit from third parties or that otherwise participate in the credit markets) and their ability to make principal and interest payments on, or refinance, outstanding debt when due. Moreover, these events could affect the terms of available debt financing with, for example, higher rates, higher equity requirements and/or more restrictive covenants.
The absence of available sources of sufficient debt financing for extended periods of time or an increase in either the general levels of interest rates or in the risk spread demanded by sources of indebtedness would make it more expensive to finance those investments. Certain investments may also be financed through borrowings on fund-level debt facilities, which may or may not be available for a refinancing at the end of their respective terms. Finally, the interest payments on the indebtedness used to finance our funds’ investments are generally deductible expenses for income tax purposes, subject to limitations under applicable tax law and policy. Any change in such tax law or policy to eliminate or substantially limit these income tax deductions, as has been discussed from time to time in various jurisdictions, would reduce the after-tax rates of return on the affected investments, which may have an adverse impact on our business and financial results.
Similarly, our funds’ investee companies regularly utilize the corporate debt markets to obtain additional financing for their operations. Our investee companies are typically highly leveraged. Those that have credit ratings are typically non-investment grade and those that do not have credit ratings would likely be non-investment grade if they were rated. If the credit markets render
17
such financing difficult to obtain or more expensive, this may negatively impact the operating performance of those investee companies and, therefore, the investment returns of our funds. In addition, if the markets make it difficult or impossible to refinance debt that is maturing in the near term, some of our investee companies may be unable to repay such debt at maturity and may be forced to sell assets, undergo a recapitalization or seek bankruptcy protection. Any of the foregoing circumstances could have a material adverse effect on our business, results of operations and financial condition.
Our funds may choose to use leverage as part of their respective investment programs. As of December 31, 2017, MCC and SIC were our only funds that relied on leverage. As of December 31, 2017, MCC had a NAV of $419.8 million, $1.1 billion of AUM and an asset coverage ratio of 229%. As of December 31, 2017, SIC had a NAV of $740.2 million, $1.3 billion of AUM and an asset coverage ratio of 233%. The use of leverage poses a significant degree of risk and enhances the possibility of a significant loss to investors. A fund may borrow money from time to time to make investments or may enter into derivative transactions with counterparties that have embedded leverage. The interest expense and other costs incurred in connection with such borrowing may not be recovered by returns on such investments and may be lost, and the timing and magnitude of such losses may be accelerated or exacerbated, in the event of a decline in the market value of such investments. Gains realized with borrowed funds may cause the fund’s NAV to increase at a faster rate than would be the case without borrowings. However, if investment results fail to cover the cost of borrowings, the fund’s NAV could also decrease faster than if there had been no borrowings. In addition, as BDCs registered under the Investment Company Act, MCC and SIC are each permitted to issue senior securities in amounts such that its asset coverage ratio equals at least 200% after each issuance of senior securities. Each of MCC’s and SIC’s ability to pay dividends will be restricted if its asset coverage ratio falls below at least 200% and any amounts that it uses to service its indebtedness are not available for dividends to its common stockholders. An increase in interest rates could also decrease the value of fixed-rate debt investments that our funds make. Any of the foregoing circumstances could have a material adverse effect on our business, results of operations and financial condition.
Some of our funds may invest in companies that are highly leveraged, which may increase the risk of loss associated with those investments.
Some of our funds may invest in companies whose capital structures involve significant leverage. For example, in many non-distressed private equity investments, indebtedness may be as much as 75% or more of an investee company’s total debt and equity capitalization, including debt that may be incurred in connection with the investment, whether incurred at or above the investment-level entity. In distressed situations, indebtedness may exceed 100% or more of an investee company’s capitalization. Additionally, the debt positions originated or acquired by our funds may be the most junior in what could be a complex capital structure, and thus subject us to the greatest risk of loss.
Investments in highly leveraged entities are also inherently more sensitive to declines in revenues, increases in expenses and interest rates and adverse economic, market and industry developments.
Furthermore, the incurrence of a significant amount of indebtedness by an entity could, among other things:
• | subject the entity to a number of restrictive covenants, terms and conditions, any violation of which could be viewed by creditors as an event of default and could materially impact our funds’ ability to realize value from the investment; |
• | allow even moderate reductions in operating cash flow to render the entity unable to service its indebtedness, leading to a bankruptcy or other reorganization of the entity and a loss of part or all of our funds’ equity investment in it; |
• | give rise to an obligation to make mandatory prepayments of debt using excess cash flow, which might limit the entity’s ability to respond to changing industry conditions if additional cash is needed for the response, to make unplanned but necessary capital expenditures or to take advantage of growth opportunities; |
• | limit the entity’s ability to adjust to changing market conditions, thereby placing it at a competitive disadvantage compared to its competitors that have relatively less debt; |
• | limit the entity’s ability to engage in strategic acquisitions that might be necessary to generate attractive returns or further growth; and |
• | limit the entity’s ability to obtain additional financing or increase the cost of obtaining such financing, including for capital expenditures, working capital or other general corporate purposes. |
As a result, the risk of loss associated with a leveraged entity is generally greater than for companies with comparatively less debt. For example, a number of investments consummated by private equity sponsors during 2005, 2006 and 2007 that utilized significant amounts of leverage subsequently experienced severe economic stress and, in certain cases, defaulted on their debt obligations due to a decrease in revenues and cash flows precipitated by the subsequent economic downturn during 2008 and 2009.
18
We generally do not control the business operations of our investee companies and, due to the illiquid nature of our investments, may not be able to dispose of such investments.
Investments by our funds generally consist of debt instruments and equity securities of companies that we do not control. We do not expect to control most of our investee companies, even though we may have board representation or board observation rights, and our debt agreements may impose certain restrictive covenants on our borrowers. As a result, we are subject to the risk that an investee company in which our funds invest may make business decisions with which we disagree and the management of such company, as representatives of the holders of their common equity, may take risks or otherwise act in ways that do not serve our interests as debt investors. Due to the lack of liquidity for our investments in private companies, we may not be able to dispose of our interests in our investee companies as readily as we would like or at an appropriate valuation. As a result, an investee company may make decisions that could decrease the value of our investment holdings.
A substantial portion of our investments may be recorded at fair value as determined in good faith by or under the direction of our respective funds’ boards of directors or similar bodies and, as a result, there may be uncertainty regarding the value of our funds’ investments.
The debt and equity instruments in which our funds invest for which market quotations are not readily available will be valued at fair value as determined in good faith by or under the direction of such fund’s board of directors or similar body. Most, if not all, of our funds' investments (other than cash and cash equivalents) are classified as Level III under Accounting Standards Codification (“ASC”) Topic 820 - Fair Value Measurements and Disclosures. This means that our funds’ portfolio valuations will be based on unobservable inputs and our funds’ assumptions about how market participants would price the asset or liability in question. We expect that inputs into the determination of fair value of our funds’ portfolio investments will require significant management judgment or estimation. Even if observable market data were available, such information may be the result of consensus pricing information or broker quotes, which include a disclaimer that the broker would not be held to such a price in an actual transaction. The non-binding nature of consensus pricing and/or quotes accompanied by disclaimers materially reduces the reliability of such information. Our funds retain the services of an independent service provider to review the valuation of these loans and securities.
The types of factors that the board of directors, general partner or similar body may take into account in determining the fair value of a fund’s investments generally include, as appropriate, comparison to publicly traded securities including such factors as yield, maturity and measures of credit quality, the enterprise value of an investee company, the nature and realizable value of any collateral, the investee company’s ability to make payments and its earnings and discounted cash flow, the markets in which the investee company does business and other relevant factors. Because such valuations, and particularly valuations of private securities and private companies, are inherently uncertain, may fluctuate over short periods of time and may be based on estimates, our determinations of fair value may differ materially from the values that would have been used if a ready market for these loans and securities existed. Our funds’ NAV could be adversely affected if determinations regarding the fair value of such funds’ investments were materially higher than the values that such funds’ ultimately realize upon the disposal of such loans and securities.
We may need to pay “clawback” obligations if and when they are triggered under the governing agreements with respect to certain of our funds and SMAs.
Generally, if at the termination of a fund (and sometimes at interim points in the life of a fund), the fund has not achieved investment returns that (in most cases) exceed the preferred return threshold or (in all cases) the general partner receives net profits over the life of the fund in excess of its allocable share under the applicable partnership agreement, we will be obligated to repay an amount equal to the extent to which carried interest that was previously distributed to us exceeds the amounts to which we are ultimately entitled. These repayment obligations may correspond to amounts previously distributed to our senior professionals prior to our IPO, with respect to which our Class A common stockholders did not receive any benefit. This obligation is known as a “clawback” obligation. Medley had not received any distributions of performance fees through December 31, 2017, other than tax distributions, a portion of which is subject to clawback. As of December 31, 2017, we recorded a $7.2 million clawback obligation that would need to be paid if the funds were liquidated at fair value as of the end of the reporting period. Had we assumed all existing investments were worthless as of December 31, 2017, there would be no additional amounts subject to clawback.
Although a clawback obligation is several to each person who received a distribution, and not a joint obligation, the governing agreements of our funds generally provide that, if a recipient does not fund his or her respective share, we may have to fund such additional amounts beyond the amount of carried interest we retained, although we generally will retain the right to pursue remedies against those carried interest recipients who fail to fund their obligations. We may need to use or reserve cash to repay such clawback obligations instead of using the cash for other purposes. See “Management’s Discussion and Analysis of Financial Condition and Results of Operations - Contingent Obligations.”
Our funds may face risks relating to undiversified investments.
While diversification is generally an objective of our funds, there can be no assurance as to the degree of diversification, if any, that will be achieved in any fund investments. Difficult market conditions or slowdowns affecting a particular asset class,
19
geographic region or other category of investment could have a significant adverse impact on a fund if its investments are concentrated in that area, which would result in lower investment returns. This lack of diversification may expose a fund to losses disproportionate to economic conditions or market declines in general if there are disproportionately greater adverse movements in the particular investments. If a fund holds investments concentrated in a particular issuer, security, asset class or geographic region, such fund may be more susceptible than a more widely diversified investment portfolio to the negative consequences of a single corporate, economic, political or regulatory event. Accordingly, a lack of diversification on the part of a fund could adversely affect a fund’s performance and, as a result, our results of operations and financial condition.
Third-party investors in our private funds may not satisfy their contractual obligation to fund capital calls when requested, which could adversely affect a fund’s operations and performance.
Investors in our private funds make capital commitments to those funds that we are entitled to call from those investors at any time during prescribed periods. We depend on investors fulfilling and honoring their commitments when we call capital from them for those funds to consummate investments and otherwise pay their obligations when due. Any investor that did not fund a capital call would be subject to several possible penalties, including having a meaningful amount of its existing investment forfeited in that fund. However, the impact of the penalty is directly correlated to the amount of capital previously invested by the investor in the fund and if an investor has invested little or no capital, for instance early in the life of the fund, then the forfeiture penalty may not be as meaningful. Investors may also negotiate for lesser or reduced penalties at the outset of the fund, thereby limiting our ability to enforce the funding of a capital call. Third-party investors in private funds often use distributions from prior investments to meet future capital calls. In cases where valuations of existing investments fall and the pace of distributions slows, investors may be unable to make new commitments to third-party managed investment funds such as those advised by us. A failure of investors to honor a significant amount of capital calls for any particular fund or funds could have a material adverse effect on the operation and performance of those funds.
Our funds may be forced to dispose of investments at a disadvantageous time.
Our funds may make investments that they do not advantageously dispose of prior to the date the applicable fund is dissolved, either by expiration of such fund’s term or otherwise. Although we generally expect that investments will be disposed of prior to dissolution or be suitable for in-kind distribution at dissolution, and the general partners of the funds have only a limited ability to extend the term of the fund with the consent of fund investors or the advisory board of the fund, as applicable, our funds may have to sell, distribute or otherwise dispose of investments at a disadvantageous time as a result of dissolution. This would result in a lower than expected return on the investments and, perhaps, on the fund itself.
Hedging strategies may adversely affect the returns on our funds’ investments.
When managing our exposure to market risks, we may (on our own behalf or on behalf of our funds) from time to time use forward contracts, options, swaps (including total return swaps), caps, collars, floors, foreign currency forward contracts, currency swap agreements, currency option contracts or other strategies. The success of any hedging or other derivative transactions generally will depend on our ability to correctly predict market or foreign exchange changes, the degree of correlation between price movements of a derivative instrument and the position being hedged, the creditworthiness of the counterparty and other factors. As a result, while we may enter into a transaction to reduce our or a fund’s exposure to market risks, the transaction may result in poorer overall investment performance than if it had not been executed. Such transactions may also limit the opportunity for gain if the value of a hedged position increases.
While such hedging arrangements may reduce certain risks, such arrangements themselves may entail certain other risks. These arrangements may require the posting of cash collateral at a time when we or a fund has insufficient cash or illiquid assets such that the posting of the cash is either impossible or requires the sale of assets at prices that do not reflect their underlying value. Moreover, these hedging arrangements may generate significant transaction costs, including potential tax costs, that may reduce the returns generated by a fund. Finally, the CFTC has made several public statements that it may soon issue a proposal for certain foreign exchange products to be subject to mandatory clearing, which could increase the cost of entering into currency hedges.
Our business depends in large part on our ability to raise capital from investors. If we were unable to raise such capital, we would be unable to collect management fees or deploy such capital into investments, which would materially and adversely affect our business, results of operations and financial condition.
Our ability to raise capital from investors depends on a number of factors, including many that are outside our control. Investors may downsize their investment allocations to credit focused private funds or BDCs or to rebalance a disproportionate weighting of their overall investment portfolio among asset classes. Poor performance of our funds could also make it more difficult for us to raise new capital. Our investors and potential investors continually assess our funds’ performance independently and relative to market benchmarks and our competitors, and our ability to raise capital for existing and future funds depends on our funds’ performance. If economic and market conditions deteriorate, we may be unable to raise sufficient amounts of capital to support the investment activities of future funds. If we were unable to successfully raise capital, our business, results of operations and financial condition would be adversely affected.
20
We depend on our senior management team, senior investment professionals and other key personnel, and our ability to retain them and attract additional qualified personnel is critical to our success and our growth prospects.
We depend on the diligence, skill, judgment, business contacts and personal reputations of our senior management team, including Brook Taube and Seth Taube, our co-Chief Executive Officers, senior investment professionals and other key personnel. Our future success will depend upon our ability to retain our senior professionals and other key personnel and our ability to recruit additional qualified personnel. These individuals possess substantial experience and expertise in investing, are responsible for locating and executing our funds’ investments, have significant relationships with the institutions that are the source of many of our funds’ investment opportunities and, in certain cases, have strong relationships with our investors. Therefore, if any of our senior professionals or other key personnel join competitors or form competing companies, it could result in the loss of significant investment opportunities and certain existing investors.
The departure for any reason of any of our senior professionals could have a material adverse effect on our ability to achieve our investment objectives, cause certain of our investors to withdraw capital they invest with us or elect not to commit additional capital to our funds or otherwise have a material adverse effect on our business and our prospects. The departure of some or all of those individuals could also trigger certain “key man” provisions in the documentation governing certain of our funds, which would permit the investors in those funds to suspend or terminate such funds’ investment periods or, in the case of certain funds, permit investors to withdraw their capital prior to expiration of the applicable lock-up date. We do not carry any “key man” insurance that would provide us with proceeds in the event of the death or disability of any of our senior professionals, and we do not have a policy that prohibits our senior professionals from traveling together.
We anticipate that it will be necessary for us to add investment professionals both to grow our business and to replace those who depart. However, the market for qualified investment professionals is extremely competitive and we may not succeed in recruiting additional personnel or we may fail to effectively replace current personnel who depart with qualified or effective successors. Our efforts to retain and attract investment professionals may also result in significant additional expenses, which could adversely affect our profitability or result in an increase in the portion of our performance fees that we grant to our investment professionals.
Our failure to appropriately address conflicts of interest could damage our reputation and adversely affect our business.
As we have expanded and as we continue to expand the number and scope of our business, we increasingly confront potential conflicts of interest relating to our funds’ investment activities. Certain of our funds may have overlapping investment objectives, including funds that have different fee structures, and potential conflicts may arise with respect to our decisions regarding how to allocate investment opportunities among those funds. For example, a decision to receive material non-public information about a company while pursuing an investment opportunity for a particular fund gives rise to a potential conflict of interest when it results in our having to restrict the ability of other funds to take any action.
In most cases, Medley is permitted to co-invest among our private funds, our SMAs, our public business development companies and other advisory clients pursuant to an exemptive order issued by the SEC. We have adopted an order aggregation and trade allocation policy designed to ensure that all of our clients are treated fairly and to prevent this form of conflict from influencing the allocation of investment opportunities among clients. Allocations will generally be made pro rata principally based on each fund or advisory client's capital available for investment. It is Medley's policy to base its determinations as to the amounts of capital available for investment on such factors as: the amount of cash on hand, existing capital commitments and reserves, if any, the targeted leverage level, the targeted asset mix and diversification requirements and other investment policies and restrictions or otherwise imposed by applicable laws, rules, regulations or interpretations.
We may also cause different funds to invest in a single investee company, for example, where the fund that made an initial investment no longer has capital available to invest. We may also cause different funds that we advise to purchase different classes of investments or securities in the same investee company. For example, certain of our funds hold minority equity interests, or have the right to acquire such equity interests, in some of our investee companies. As a result, we may face conflicts of interests in connection with making business decisions for these investee companies to the extent that such decisions affect the debt and equity holders in these investee companies differently. In addition, we may face conflicts of interests in connection with making investment or other decisions, including granting loan waivers or concessions with respect to these investee companies given that we also manage private funds that may hold equity interests in these investee companies. In addition, conflicts of interest may exist in the valuation of our investments and regarding decisions about the allocation of specific investment opportunities among us and our funds and the allocation of fees and costs among us and our funds. Though we believe we have developed appropriate policies and procedures to resolve these conflicts, our judgment on any particular allocation could be challenged. If we fail to appropriately address any such conflicts, it could negatively impact our reputation and ability to raise additional funds and the willingness of counterparties to do business with us or result in potential litigation against us.
21
Potential conflicts of interest may arise between our Class A common stockholders and our fund investors.
Our subsidiaries that serve as the investment advisors to, or the general partners of, our funds may have fiduciary duties and/or contractual obligations to those funds and their investors. As a result, we expect to regularly take actions with respect to the purchase or sale of investments in our funds, the structuring of investment transactions for the funds or otherwise in a manner consistent with such duties and obligations but that might at the same time adversely affect our near-term results of operations or cash flows. This may in turn have an adverse effect on the price of our Class A common stock and/or on the interests of our Class A common stockholders. Additionally, to the extent we fail to appropriately deal with any such conflicts of interest, it could negatively impact our reputation and ability to raise additional funds.
Rapid growth of our business may be difficult to sustain and may place significant demands on our administrative, operational and financial resources.
Our assets under management have grown significantly in the past and we are pursuing further growth. Our rapid growth has placed, and planned growth, if successful, will continue to place, significant demands on our legal, compliance, accounting and operational infrastructure, and has increased expenses associated with all of the foregoing. In addition, we are required to continuously develop our systems and infrastructure in response to the increasing sophistication of the investment management market and legal, accounting, regulatory and tax developments. Our future growth will depend in part on our ability to maintain an operating platform and management system sufficient to address our growth and will require us to incur significant additional expenses and to commit additional senior management and operational resources. As a result, we face significant challenges:
• | in maintaining adequate financial, regulatory (legal, tax and compliance) and business controls; |
• | in implementing new or updated information and financial systems and procedures; and |
• | in training, managing and appropriately sizing our work force and other components of our business on a timely and cost-effective basis. |
We may not be able to manage our expanding operations effectively or be able to continue to grow, and any failure to do so could adversely affect our ability to generate revenue and control our expenses.
We may enter into new lines of business and expand into new investment strategies, geographic markets and business, each of which may result in additional risks and uncertainties in our businesses.
We intend to grow our business by increasing assets under management in existing business and, if market conditions warrant, by expanding into complementary investment strategies, geographic markets and businesses. Accordingly, we may pursue growth through acquisitions of other investment management companies, acquisitions of critical business partners or other strategic initiatives, which may include entering into new lines of business. Attempts to expand our business involve a number of special risks, including some or all of the following:
• | the required investment of capital and other resources; |
• | the assumption of liabilities in any acquired business; |
• | the disruption of our ongoing business; |
• | entry into markets or lines of business in which we may have limited or no experience; |
• | increasing demands on our operational and management systems and controls; |
• | compliance with additional regulatory requirements; |
• | potential increase in investor concentration; and |
• | the broadening of our geographic footprint, increasing the risks associated with conducting operations in certain foreign jurisdictions where we currently have no presence. |
Entry into certain lines of business may subject us to new laws and regulations with which we are not familiar, or from which we are currently exempt, and may lead to increased litigation and regulatory risk. If a new business does not generate sufficient revenues or if we are unable to efficiently manage our expanded operations, our results of operations will be adversely affected. Our strategic initiatives may include joint ventures, in which case we will be subject to additional risks and uncertainties in that we may be dependent upon, and subject to liability, losses or reputational damage relating to systems, controls and personnel that are not under our control. Because we have not yet identified these potential new investment strategies, geographic markets or lines of business, we cannot identify for you all the risks we may face and the potential adverse consequences on us and your investment that may result from any attempted expansion.
22
Extensive regulation affects our activities, increases the cost of doing business and creates the potential for significant liabilities and penalties that could adversely affect our business and results of operations.
Our business is subject to extensive regulation, including periodic examinations, by governmental agencies and self-regulatory organizations in the jurisdictions in which we operate. The SEC oversees the activities of our subsidiaries that are registered investment advisers under the Investment Advisers Act. In addition, we regularly rely on exemptions from various requirements of the Securities Act, the Securities Exchange Act of 1934, as amended (the “Exchange Act”), the Investment Company Act, the Commodity Exchange Act and the U.S. Employee Retirement Income Security Act of 1974. These exemptions are sometimes highly complex and may in certain circumstances depend on compliance by third parties who we do not control. If for any reason these exemptions were to be revoked or challenged or otherwise become unavailable to us, we could be subject to regulatory action or third-party claims, which could have a material adverse effect on our business.
The SEC has indicated that investment advisers who receive transaction-based compensation for investment banking or acquisition activities relating to fund investee companies may be required to register as broker-dealers. Specifically, the SEC staff has noted that if a firm receives fees from a fund investee company in connection with the acquisition, disposition or recapitalization of such investee company, such activities could raise broker-dealer concerns under applicable regulations related to broker dealers. If we receive such transaction fees and the SEC takes the position that such activities render us a “broker” under the applicable rules and regulations of the Exchange Act, we could be subject to additional regulation. If receipt of transaction fees from an investee company is determined to require a broker-dealer license, receipt of such transaction fees in the past or in the future during any time when we did not or do not have a broker-dealer license could subject us to liability for fines, penalties, damages or other remedies.
Since 2010, certain states and other regulatory authorities have begun to require investment managers to register as lobbyists in connection with their solicitation of commitments from governmental entities, including state and municipal pension funds. We have registered as such in a number of jurisdictions, including California and New York. Other states or municipalities may consider similar legislation or adopt regulations or procedures with similar effect. These registration requirements impose significant compliance obligations and restrictions on registered lobbyists and their employers, which may include annual registration fees, periodic disclosure reports and internal recordkeeping, and may also prohibit the payment of contingent fees.
Each of the regulatory bodies with jurisdiction over us has regulatory powers dealing with many aspects of financial services, including the authority to grant, and in specific circumstances to cancel, permissions to carry on particular activities. A failure to comply with the obligations imposed by the Investment Advisers Act, including recordkeeping, advertising and operating requirements, disclosure obligations and prohibitions on fraudulent activities, could result in investigations, sanctions and reputational damage. We are involved regularly in trading activities that implicate a broad number of U.S. securities law regimes, including laws governing trading on inside information, market manipulation and a broad number of technical trading requirements that implicate fundamental market regulation policies. Violation of these laws could result in severe restrictions on our activities and damage to our reputation.
Our failure to comply with applicable laws or regulations could result in fines, censure, suspensions of personnel or other sanctions, including revocation of the registration of our relevant subsidiaries as investment advisers or registered broker-dealers. The regulations to which our business is subject are designed primarily to protect investors in our funds and to ensure the integrity of the financial markets. They are not designed to protect our stockholders. Even if a sanction imposed against us, one of our subsidiaries or our personnel by a regulator is for a small monetary amount, the adverse publicity related to the sanction could harm our reputation, which in turn could have a material adverse effect on our business in a number of ways, making it harder for us to raise new funds and discouraging others from doing business with us.
Failure to comply with “pay to play” regulations implemented by the SEC and certain states, and changes to the “pay to play” regulatory regimes, could adversely affect our business.
In recent years, the SEC and several states have initiated investigations alleging that certain private equity firms and hedge funds or agents acting on their behalf have paid money to current or former government officials or their associates in exchange for improperly soliciting contracts with state pension funds. In June 2010, the SEC approved Rule 206(4)-5 under the Investment Advisers Act regarding “pay to play” practices by investment advisers involving campaign contributions and other payments to government officials able to exert influence on potential government entity clients. Among other restrictions, the rule prohibits investment advisers from providing advisory services for compensation to a government entity for two years, subject to very limited exceptions, after the investment adviser, its senior executives or its personnel involved in soliciting investments from government entities make contributions to certain candidates and officials in a position to influence the hiring of an investment adviser by such government entity. Advisers are required to implement compliance policies designed, among other matters, to track contributions by certain of the adviser’s employees and engagements of third parties that solicit government entities and to keep certain records to enable the SEC to determine compliance with the rule. In addition, there have been similar rules on a state level regarding “pay to play” practices by investment advisers.
23
As a number of public pension plans are investors in our funds, these rules could impose significant economic sanctions on our business if we or one of the other persons covered by the rules make any such contribution or payment, whether or not material or with an intent to secure an investment from a public pension plan. In addition, such investigations may require the attention of senior management and may result in fines or forfeitures of fees paid and an obligation to provide services without payment of fees if any of our funds are deemed to have violated any regulations, thereby imposing additional expenses on us. Any failure on our part to comply with these rules could cause us to lose compensation for our advisory services or expose us to significant penalties and reputational damage.
New or changed laws or regulations governing our funds’ operations and changes in the interpretation thereof could adversely affect our business.
The laws and regulations governing the operations of our funds, as well as their interpretation, may change from time to time, and new laws and regulations may be enacted. Accordingly, any change in these laws or regulations, changes in their interpretation, or newly enacted laws or regulations and any failure by our funds to comply with these laws or regulations, could require changes to certain of our business practices, negatively impact our operations, assets under management or financial condition, impose additional costs on us or otherwise adversely affect our business. See “Business - Regulatory and Compliance Matters” for a discussion of our regulatory and compliance environment. The following includes the most significant regulatory risks facing our business:
• | Changes in capital requirements may increase the cost of our financing |
If regulatory capital requirements - whether under the Dodd-Frank Wall Street Reform and Consumer Protection Act of 2010 (the “Dodd-Frank Act”), Basel III, or other regulatory action - were to be imposed on our funds, they may be required to limit, or increase the cost of, financing they provide to others. Among other things, this could potentially require our funds to sell assets at an inopportune time or price, which could negatively impact our operations, assets under management or financial condition.
• | The imposition of additional legal or regulatory requirements could make compliance more difficult and expensive, affect the manner in which we conduct our business and adversely affect our profitability |
In July 2010, President Obama signed into law the Dodd-Frank Act. The Dodd-Frank Act, among other things, imposes significant new regulations on nearly every aspect of the U.S. financial services industry, including new registration, recordkeeping and reporting requirements on private fund investment advisers. Importantly, while several key aspects of the Dodd-Frank Act have been defined through final rules, many aspects will be implemented by various regulatory bodies over the next several years. While we already have several subsidiaries registered as investment advisers subject to SEC examinations, the imposition of any additional legal or regulatory requirements could make compliance more difficult and expensive, affect the manner in which we conduct our business and adversely affect our profitability.
• | The implementation of the Volcker Rule could have adverse implications on our ability to raise funds from certain entities |
In December 2013, the Federal Reserve and other federal regulatory agencies adopted a final rule implementing a section of the Dodd-Frank Act that has become known as the “Volcker Rule.” The Volcker Rule generally prohibits insured banks or thrifts, any bank holding company or savings and loan holding company, any non-U.S. bank with a U.S. branch, agency or commercial lending company and any subsidiaries and affiliates of such entities, regardless of geographic location, from investing in or sponsoring “covered funds,” which include private equity funds or hedge funds and certain other proprietary activities. The effects of the Volcker Rule are uncertain but it is in any event likely to curtail various banking activities that in turn could result in uncertainties in the financial markets as well as our business. Although we do not currently anticipate that the Volcker Rule will adversely affect our fundraising to any significant extent, there is uncertainty regarding the implementation of the Volcker Rule and its practical implications, and there could be adverse implications on our ability to raise funds from the types of entities mentioned above as a result of this prohibition.
• | Increased regulation on banks’ leveraged lending activities could negatively affect the terms and availability of credit to our funds and their investee companies |
In March 2013, the Office of the Comptroller of the Currency, the Department of the Treasury, the Board of Governors of the Federal Reserve System and the Federal Deposit Insurance Corporation published revised guidance regarding expectations for banks’ leveraged lending activities. This guidance, in addition to proposed Dodd-Frank risk retention rules circulated in August 2013, could further restrict credit availability, as well as potentially restrict certain of our investing activities that rely on banks’ lending activities. This could negatively affect the terms and availability of credit to our funds and their investee companies.
• | New restrictions on compensation could limit our ability to recruit and retain investment professionals |
The Dodd-Frank Act authorizes federal regulatory agencies to review and, in certain cases, prohibit compensation arrangements at financial institutions that give employees incentives to engage in conduct deemed to encourage inappropriate risk-
24
taking by covered financial institutions. Such restrictions could limit our ability to recruit and retain investment professionals and senior management executives.
• | Regulatory uncertainty could negatively impact our ability to efficiently project, plan and operate our business impacting profitability |
In early February 2017, the new Trump administration issued an executive order calling for a review of laws and regulations affecting the U.S. financial industry in order to determine their consistency with a set of core principles identified in the executive order. Several bills are pending in Congress that, if enacted, would amend the Dodd-Frank Act, including the Financial CHOICE Act (the “CHOICE Act”), which was approved by the House of Representatives and the Economic Growth, Regulatory Relief and Consumer Protection Act which is awaiting consideration in the Senate. The Administration has expressed support for these proposals and encouraged the House and Senate to work together to present legislation to the President as quickly as possible. The House and Senate legislation, while different, could change the process and criteria for designating systemically important financial institutions, modify the Volcker Rule and make reforms to the Consumer Financial Protection Bureau, among other amendments to the Dodd-Frank Act. The CHOICE Act would also significantly enhance the SEC’s enforcement capabilities and increase the maximum civil penalties and criminal sanctions under federal securities laws, including under the Investment Company Act and the Advisers Act. Both the House and Senate proposals are still subject to amendment and possible reconciliation into a single proposal, the scope of which is not possible to determine at this time nor is it possible to determine if and when such a proposal may be presented to the President for enactment.
It is difficult to determine the full extent of the impact on us of the Financial Choice Act, the Dodd-Frank Act or any other new laws, regulations or initiatives that may be proposed or whether any of the proposals will become law. In addition, as a result of proposed legislation, shifting areas of focus of regulatory enforcement bodies or otherwise, regulatory compliance practices may shift such that formerly accepted industry practices become disfavored or less common. Any changes or other developments in the regulatory framework applicable to our businesses, including the changes described above and changes to formerly accepted industry practices, may impose additional costs on us, require the attention of our senior management or result in limitations on the manner in which we conduct our businesses. Moreover, as calls for additional regulation have increased, there may be a related increase in regulatory investigations of the trading and other investment activities of alternative asset management funds, including our funds. In addition, we may be adversely affected by changes in the interpretation or enforcement of existing laws and rules by these governmental authorities and self-regulatory organizations. Compliance with any new laws or regulations could make compliance more difficult and expensive, affect the manner in which we conduct our businesses and adversely affect our profitability.
Present and future BDCs for which we serve as investment adviser are subject to regulatory complexities that limit the way in which they do business and may subject them to a higher level of regulatory scrutiny.
MCC and SIC, and other BDCs for which we may serve as investment adviser in the future, operate under a complex regulatory environment. Such BDCs require the application of complex tax and securities regulations and may entail a higher level of regulatory scrutiny. In addition, regulations affecting BDCs generally affect their ability to take certain actions. For example, each of MCC and SIC has elected to be treated as a RIC for United States federal income tax purposes. To maintain their status as a RIC, such vehicles must meet, among other things, certain source of income, asset diversification and annual distribution requirements. If any of our BDCs fails to qualify for RIC tax treatment for any reason and remains or becomes subject to corporate income tax, the resulting corporate taxes could, among other things, substantially reduce such BDC’s net assets.
In addition, MCC and SIC are subject to complex rules under the Investment Company Act, including rules that restrict certain of our funds from engaging in transactions with MCC and SIC. Under the regulatory and business environment in which they operate, MCC and SIC must periodically access the capital markets to raise cash to fund new investments in excess of their repayments to grow. This results from MCC and SIC each being required to generally distribute to their respective stockholders at least 90% of its investment company taxable income to maintain its RIC status, combined with regulations under the Investment Company Act that, subject to certain exceptions, generally prohibit MCC and SIC from issuing and selling their common stock at a price below NAV per share and from incurring indebtedness (including for this purpose, preferred stock), if their asset coverage, as calculated pursuant to the Investment Company Act, equals less than 200% after such incurrence. If our BDCs are found to be in violation of the Investment Company Act, they could lose their status as BDCs. If either of our BDCs fails to continuously qualify as a BDC, such BDC might be subject to regulation as a registered closed-end investment company under the 1940 Act, which would significantly decrease its operating flexibility. In addition, failure to comply with the requirements imposed on BDCs by the 1940 Act could cause the SEC to bring an enforcement action against such BDC, which could have a material adverse effect on us.
We are subject to risks in using custodians, counterparties, administrators and other agents.
Some of our funds depend on the services of custodians, counterparties, administrators, prime brokers and other agents to carry out certain financing, securities and derivatives transactions. The terms of these contracts are often customized and complex, and many of these arrangements occur in markets or relate to products that are not subject to regulatory oversight, although the Dodd-Frank Act provides for new regulation of the derivatives market. In particular, some of our funds utilize arrangements with
25
a relatively limited number of counterparties, which has the effect of concentrating the transaction volume (and related counterparty default risk) of such funds with these counterparties.
Our funds are subject to the risk that the counterparty to one or more of these contracts defaults, either voluntarily or involuntarily, on its performance under the contract. Any such default may occur suddenly and without notice to us. Moreover, if a counterparty defaults, we may be unable to take action to cover our exposure, either because we lack contractual recourse or because market conditions make it difficult to take effective action. This inability could occur in times of market stress, which is when defaults are most likely to occur.
In addition, our risk-management process may not accurately anticipate the impact of market stress or counterparty financial condition, and as a result, we may not have taken sufficient action to reduce our risks effectively. Default risk may arise from events or circumstances that are difficult to detect, foresee or evaluate. In addition, concerns about, or a default by, one large participant could lead to significant liquidity problems for other participants, which may in turn expose us to significant losses.
Although we have risk-management processes to ensure that we are not exposed to a single counterparty for significant periods of time, given the large number and size of our funds, we often have large positions with a single counterparty. For example, some of our funds have credit lines. If the lender under one or more of those credit lines were to become insolvent, we may have difficulty replacing the credit line and one or more of our funds may face liquidity problems.
In the event of a counterparty default, particularly a default by a major investment bank or a default by a counterparty to a significant number of our contracts, one or more of our funds may have outstanding trades that they cannot settle or are delayed in settling. As a result, these funds could incur material losses and the resulting market impact of a major counterparty default could harm our business, results of operation and financial condition.
In the event of the insolvency of a prime broker, custodian, counterparty or any other party that is holding assets of our funds as collateral, our funds might not be able to recover equivalent assets in full as they will rank among the prime broker’s, custodian’s or counterparty’s unsecured creditors in relation to the assets held as collateral. In addition, our funds’ cash held with a prime broker, custodian or counterparty generally will not be segregated from the prime broker’s, custodian’s or counterparty’s own cash, and our funds may therefore rank as unsecured creditors in relation thereto. If our derivatives transactions are cleared through a derivatives clearing organization, the CFTC has issued final rules regulating the segregation and protection of collateral posted by customers of cleared and uncleared swaps. The CFTC is also working to provide new guidance regarding prime broker arrangements and intermediation generally with regard to trading on swap execution facilities.
The counterparty risks that we face have increased in complexity and magnitude as a result of disruption in the financial markets in recent years. For example, the consolidation and elimination of counterparties has increased our concentration of counterparty risk and decreased the universe of potential counterparties. Our funds are generally not restricted from dealing with any particular counterparty or from concentrating any or all of their transactions with a single counterparty. In addition, counterparties have generally reacted to recent market volatility by tightening their underwriting standards and increasing their margin requirements for all categories of financing, which has the result of decreasing the overall amount of leverage available and increasing the costs of borrowing.
A portion of our revenue and cash flow is variable, which may impact our ability to achieve steady earnings growth on a quarterly basis and may cause the price of our Class A common stock to decline.
We believe that base management fees are consistent and predictable. For all periods presented, over 40% of total revenues was derived from base management fees. Due to our investment strategy and the nature of our fees, a portion of our revenue and cash flow is variable, due primarily to the fact that the performance fees from our long-dated private funds and SMAs can vary from quarter to quarter and year to year. For the years ended December 31, 2017 and 2015, total revenues of $65.6 million and $67.4 million, respectively, included a reversal of performance fees of $1.7 million and $15.7 million, respectively. For the year ended December 31, 2016, performance fees were 3% of our total revenues. Additionally, we may also experience fluctuations in our results from quarter to quarter and year to year due to a number of other factors, including changes in the values of our funds’ investments, changes in our operating expenses, the degree to which we encounter competition and general economic and market conditions. Such variability may lead to volatility in the trading price of our Class A common stock and cause our results for a particular period not to be indicative of our performance in a future period.
We may be subject to litigation risks and may face liabilities and damage to our professional reputation as a result.
In recent years, the volume of claims and amount of damages claimed in litigation and regulatory proceedings against investment managers have been increasing. We make investment decisions on behalf of investors in our funds that could result in substantial losses. This may subject us to the risk of legal liabilities or actions alleging negligent misconduct, breach of fiduciary duty or breach of contract. Further, we may be subject to third-party litigation arising from allegations that we improperly exercised control or influence over portfolio investments. In addition, we and our affiliates that are the investment managers and general partners of our funds, our funds themselves and those of our employees who are our, our subsidiaries’ or the funds’ officers and directors are each exposed to the risks of litigation specific to the funds’ investment activities and investee companies and, in the
26
case where our funds own controlling interests in public companies, to the risk of shareholder litigation by the public companies’ other shareholders. Moreover, we are exposed to risks of litigation or investigation by investors or regulators relating to our having engaged, or our funds having engaged, in transactions that presented conflicts of interest that were not properly addressed.
Legal liability could have a material adverse effect on our business, financial condition or results of operations or cause reputational harm to us, which could harm our business. We depend to a large extent on our business relationships and our reputation for integrity and high-caliber professional services to attract and retain investors and to pursue investment opportunities for our funds. As a result, allegations of improper conduct by private litigants or regulators, whether the ultimate outcome is favorable or unfavorable to us, as well as negative publicity and press speculation about us, our investment activities or the investment industry in general, whether or not valid, may harm our reputation, which may be damaging to our business.
Employee misconduct could harm us by impairing our ability to attract and retain investors and subjecting us to significant legal liability, regulatory scrutiny and reputational harm. Fraud and other deceptive practices or other misconduct at our investee companies could similarly subject us to liability and reputational damage and also harm our business.
Our ability to attract and retain investors and to pursue investment opportunities for our funds depends heavily upon the reputation of our professionals, especially our senior professionals. We are subject to a number of obligations and standards arising from our investment management business and our authority over the assets managed by our investment management business. The violation of these obligations and standards by any of our employees could adversely affect investors in our funds and us. Our business often requires that we deal with confidential matters of great significance to companies in which our funds may invest. If our employees were to use or disclose confidential information improperly, we could suffer serious harm to our reputation, financial position and current and future business relationships. It is not always possible to detect or deter employee misconduct, and the extensive precautions we take to detect and prevent this activity may not be effective in all cases. If one or more of our employees were to engage in misconduct or were to be accused of such misconduct, our business and our reputation could be adversely affected and a loss of investor confidence could result, which would adversely impact our ability to raise future funds.
In addition, we could be adversely affected as a result of actual or alleged misconduct by personnel of investee companies in which our funds invest. For example, failures by personnel at our investee companies to comply with anti-bribery, trade sanctions or other legal and regulatory requirements could expose us to litigation or regulatory action and otherwise adversely affect our business and reputation. Such misconduct could undermine our due diligence efforts with respect to such companies and could negatively affect the valuation of a fund’s investments.
Our substantial indebtedness could adversely affect our financial condition, our ability to pay our debts or raise additional capital to fund our operations, our ability to operate our business and our ability to react to changes in the economy or our industry and could divert our cash flow from operations for debt payments.
We have a significant amount of indebtedness. As of December 31, 2017, our total indebtedness, excluding unamortized discount, premium, and issuance costs, was approximately $132.6 million. Our substantial debt obligations could have important consequences, including:
• | requiring a substantial portion of cash flow from operations to be dedicated to the payment of principal and interest on our indebtedness, thereby reducing our ability to use our cash flow to fund our operations and pursue future business opportunities; |
• | exposing us to increased interest expense, as our degree of leverage may cause the interest rates of any future indebtedness (whether fixed or floating rate interest) to be higher than they would be otherwise; |
• | exposing us to the risk of increased interest rates because certain of our indebtedness is at variable rates of interest; |
• | making it more difficult for us to satisfy our obligations with respect to our indebtedness, and any failure to comply with the obligations of any of our debt instruments, including restrictive covenants, could result in an event of default that accelerates our obligation to repay indebtedness; |
• | increasing our vulnerability to adverse economic, industry or competitive developments; |
• | restricting us from making strategic acquisitions or causing us to make non-strategic divestitures; |
• | limiting our ability to obtain additional financing for working capital, product development, satisfaction of debt service requirements, acquisitions and general corporate or other purposes; and |
• | limiting our flexibility in planning for, or reacting to, changes in our business or market conditions and placing us at a competitive disadvantage compared to our competitors who may be better positioned to take advantage of opportunities that our leverage prevents us from exploiting. |
27
Our Revolving Credit Facility imposes significant operating and financial restrictions on us and our subsidiaries, which may prevent us from capitalizing on business opportunities.
The credit agreement that governs our Revolving Credit Facility imposes significant operating and financial restrictions on us. These restrictions will limit our ability and/or the ability of our subsidiaries to, among other things:
• | incur additional indebtedness, make guarantees and enter into hedging arrangements; |
• | create liens on assets; |
• | enter into sale and leaseback transactions; |
• | engage in mergers or consolidations; |
• | sell assets; |
• | make fundamental changes; |
• | pay dividends and distributions or repurchase our capital stock; |
• | make investments, loans and advances, including acquisitions; |
• | engage in certain transactions with affiliates; |
• | make changes in the nature of our business; and |
• | make prepayments of junior debt. |
In addition, the credit agreement governing our Revolving Credit Facility requires us to maintain, with respect to each four quarter period commencing with the four quarter period ending September 30, 2017, a ratio of net debt to Core EBITDA not greater than 5.0 to 1.0, a ratio of total debt to Core EBITDA not greater than 7.0 to 1.0 and a minimum Core EBITDA of not less than $15.0 million. The ratio of net debt to Core EBITDA, total debt to Core EBITDA and minimum Core EBITDA in respect of the Senior Secured Credit Facilities is calculated using our standalone financial results and includes the adjustments made to calculate Core EBITDA. See “Management’s Discussion and Analysis of Financial Condition and Results of Operations — Liquidity and Capital Resources — Debt Instruments.”
As a result of these restrictions, we will be limited as to how we conduct our business and we may be unable to raise additional debt or equity financing to compete effectively or to take advantage of new business opportunities. The terms of any future indebtedness we may incur could include more restrictive covenants. We cannot assure you that we will be able to maintain compliance with these covenants in the future and, if we fail to do so, that we will be able to obtain waivers from the lenders and/or amend the covenants.
Our failure to comply with the restrictive covenants described above as well as other terms of our other indebtedness and/or the terms of any future indebtedness from time to time could result in an event of default, which, if not cured or waived, could result in our being required to repay these borrowings before their due date. If we are forced to refinance these borrowings on less favorable terms or are unable to refinance these borrowings, our results of operations and financial condition could be adversely affected.
Servicing our indebtedness will require a significant amount of cash. Our ability to generate sufficient cash depends on many factors, some of which are not within our control.
Our ability to make payments on our indebtedness and to fund planned capital expenditures will depend on our ability to generate cash in the future. To a certain extent, this is subject to general economic, financial, competitive, legislative, regulatory and other factors that are beyond our control. If we are unable to generate sufficient cash flow to service our debt and meet our other commitments, we may need to restructure or refinance all or a portion of our debt, sell material assets or operations or raise additional debt or equity capital. We may not be able to effect any of these actions on a timely basis, on commercially reasonable terms or at all, and these actions may not be sufficient to meet our capital requirements. In addition, the terms of our existing or future debt arrangements may restrict us from effecting any of these alternatives.
Despite our current level of indebtedness, we may be able to incur substantially more debt and enter into other transactions, which could further exacerbate the risks to our financial condition described above.
We may be able to incur significant additional indebtedness in the future. Although the credit agreement that governs our Revolving Credit Facility contains restrictions on the incurrence of additional indebtedness and entering into certain types of other transactions, these restrictions are subject to a number of qualifications and exceptions. Additional indebtedness incurred in compliance with these restrictions could be substantial. These restrictions also do not prevent us from incurring obligations, such as trade payables, that do not constitute indebtedness as defined under our debt instruments. To the extent new debt is added to our current debt levels, the substantial leverage risks described in the preceding three risk factors would increase.
28
Operational risks may disrupt our business, result in losses or limit our growth.
Our business relies heavily on financial, accounting and other information systems and technology. We face various security threats, including cyber security attacks to our information technology infrastructure and attempts to gain access to our proprietary information, destroy data or disable, degrade or sabotage our systems. These security threats could originate from a wide variety of sources, including unknown third parties outside of Medley. Although we have not yet been subject to cyber-attacks or other cyber incidents and we utilize various procedures and controls to monitor and mitigate these threats, there can be no assurance that these procedures and controls will be sufficient to prevent disruptions to our systems. If any of these systems do not operate properly or are disabled for any reason or if there is any unauthorized disclosure of data, whether as a result of tampering, a breach of our network security systems, a cyber-incident or attack or otherwise, we could suffer financial loss, a disruption of our business, liability to our funds, regulatory intervention or reputational damage.
In addition, our information systems and technology may not continue to be able to accommodate our growth, and the cost of maintaining the systems may increase from its current level. Such a failure to accommodate growth, or an increase in costs related to the information systems, could have a material adverse effect on our business and results of operations.
Furthermore, we depend on our offices in New York and San Francisco, where a substantial portion of our personnel are located, for the continued operation of our business. An earthquake or other disaster or a disruption in the infrastructure that supports our business, including a disruption involving electronic communications or other services used by us or third parties with whom we conduct business, or directly affecting our headquarters, could have a material adverse effect on our ability to continue to operate our business without interruption. Although we have disaster recovery programs in place, these may not be sufficient to mitigate the harm that may result from such a disaster or disruption. In addition, insurance and other safeguards might only partially reimburse us for our losses, if at all.
Finally, we rely on third-party service providers for certain aspects of our business, including for certain information systems, technology and administration of our funds and compliance matters. Any interruption or deterioration in the performance of these third parties or failures of their information systems and technology could impair the quality of our funds’ operations and could impact our reputation, adversely affect our business and limit our ability to grow.
Risks Related to Our Organizational Structure
Medley Management Inc.’s only material asset is its interest in Medley LLC, and it is accordingly dependent upon distributions from Medley LLC to pay taxes, make payments under the tax receivable agreement or pay dividends.
Medley Management Inc. is a holding company and has no material assets other than its ownership of LLC Units. Medley Management Inc. has no independent means of generating revenue. Medley Management Inc. intends to cause Medley LLC to make distributions to its holders of LLC Units in an amount sufficient to cover all applicable taxes at assumed tax rates, payments under the tax receivable agreement and dividends, if any, declared by it. Deterioration in the financial condition, earnings or cash flow of Medley LLC and its subsidiaries for any reason could limit or impair their ability to pay such distributions. Additionally, to the extent that Medley Management Inc. needs funds, and Medley LLC is restricted from making such distributions under applicable law or regulation or under the terms of our financing arrangements, or is otherwise unable to provide such funds, it could materially adversely affect our liquidity and financial condition.
Payments of dividends, if any, is at the discretion of our board of directors after taking into account various factors, including our business, operating results and financial condition, current and anticipated cash needs, plans for expansion and any legal or contractual limitations on our ability to pay dividends. Any financing arrangement that we enter into in the future may include restrictive covenants that limit our ability to pay dividends. In addition, Medley LLC is generally prohibited under Delaware law from making a distribution to a member to the extent that, at the time of the distribution, after giving effect to the distribution, liabilities of Medley LLC (with certain exceptions) exceed the fair value of its assets. Subsidiaries of Medley LLC are generally subject to similar legal limitations on their ability to make distributions to Medley LLC.
Medley Management Inc. is controlled by our pre-IPO owners, whose interests may differ from those of our public stockholders.
Medley Group LLC, an entity controlled by our pre-IPO owners, holds approximately 97.6% of the combined voting power of our Class A and Class B common stock. Accordingly, our pre-IPO owners have the ability to elect all of the members of our board of directors, and thereby to control our management and affairs. In addition, they are able to determine the outcome of all matters requiring stockholder approval, including mergers and other material transactions, and are able to cause or prevent a change in the composition of our board of directors or a change in control of our company that could deprive our stockholders of an opportunity to receive a premium for their Class A common stock as part of a sale of our company and might ultimately affect the market price of our Class A common stock. Our pre-IPO owners comprise all of the non-managing members of Medley LLC. However, Medley LLC may in the future admit additional non-managing members that would not constitute pre-IPO owners. Because Medley Group LLC, as the holder of our Class B common stock, has a number of votes equal to 10 times the number of LLC Units held by all non-managing members of Medley LLC for so long as our pre-IPO owners and then-current Medley personnel
29
hold at least 10% of the aggregate number of shares of Class A common stock and LLC Units (excluding the LLC Units held by Medley Management Inc.), we anticipate that Medley Group LLC will continue to have a majority of the combined voting power of our Class A and Class B common stock even when our pre-IPO owners own less than a majority economic interest in our company.
In addition, our pre-IPO owners own 81.3% of the LLC Units. Because they hold their ownership interest in our business directly in Medley LLC, rather than through Medley Management Inc., these pre-IPO owners may have conflicting interests with holders of shares of our Class A common stock. For example, if Medley LLC makes distributions to Medley Management Inc., the non-managing members of Medley LLC will also be entitled to receive such distributions pro rata in accordance with the percentages of their respective limited liability company interests in Medley LLC and their preferences as to the timing and amount of any such distributions may differ from those of our public stockholders. Our pre-IPO owners may also have different tax positions from us which could influence their decisions regarding whether and when to dispose of assets, especially in light of the existence of the tax receivable agreement entered into in connection with our IPO, whether and when to incur new or refinance existing indebtedness, and whether and when Medley Management Inc. should terminate the tax receivable agreement and accelerate its obligations thereunder. In addition, the structuring of future transactions may take into consideration these pre-IPO owners’ tax or other considerations even where no similar benefit would accrue to us.
Medley Management Inc. will be required to pay exchanging holders of LLC Units for most of the benefits relating to any additional tax depreciation or amortization deductions that we may claim as a result of the tax basis step-up we receive in connection with sales or exchanges of LLC Units and related transactions.
Holders of LLC Units (other than Medley Management Inc.) may, subject to certain conditions and transfer restrictions applicable to such holders as set forth in the operating agreement of Medley LLC, exchange their LLC Units for Class A common stock on a one-for-one basis. The exchanges are expected to result in increases in the tax basis of the tangible and intangible assets of Medley LLC. These increases in tax basis may increase (for tax purposes) depreciation and amortization deductions and therefore reduce the amount of tax that Medley Management Inc. would otherwise be required to pay in the future, although the Internal Revenue Service (“IRS”) may challenge all or part of that tax basis increase, and a court could sustain such a challenge.
We have entered into a tax receivable agreement with the holders of LLC Units that provides for the payment by Medley Management Inc. to exchanging holders of LLC Units of 85% of the benefits, if any, that Medley Management Inc. is deemed to realize as a result of these increases in tax basis and of certain other tax benefits related to entering into the tax receivable agreement, including tax benefits attributable to payments under the tax receivable agreement. This payment obligation is an obligation of Medley Management Inc. and not of Medley LLC. While the actual increase in tax basis, as well as the amount and timing of any payments under the tax receivable agreement, will vary depending upon a number of factors, including the timing of exchanges, the price of shares of our Class A common stock at the time of the exchange, the extent to which such exchanges are taxable and the amount and timing of our income, we expect that as a result of the size of the transfers and increases in the tax basis of the tangible and intangible assets of Medley LLC, the payments that Medley Management Inc. may make under the tax receivable agreement will be substantial. The payments under the tax receivable agreement are not conditioned upon continued ownership of us by the holders of LLC Units.
In certain cases, payments under the tax receivable agreement may be accelerated and/or significantly exceed the actual benefits Medley Management Inc. realizes in respect of the tax attributes subject to the tax receivable agreement.
The tax receivable agreement provides that upon certain changes of control, or if, at any time, Medley Management Inc. elects an early termination of the tax receivable agreement, Medley Management Inc.’s obligations under the tax receivable agreement (with respect to all LLC Units whether or not previously exchanged) would be calculated by reference to the value of all future payments that holders of LLC Units would have been entitled to receive under the tax receivable agreement using certain valuation assumptions, including that Medley Management Inc. will have sufficient taxable income to fully utilize the deductions arising from the increased tax deductions and tax basis and other benefits related to entering into the tax receivable agreement and, in the case of an early termination election, that any LLC Units that have not been exchanged are deemed exchanged for the market value of the shares of Class A common stock at the time of termination. In addition, holders of LLC Units will not reimburse us for any payments previously made under the tax receivable agreement if such tax basis increase is successfully challenged by the IRS. Medley Management Inc.’s ability to achieve benefits from any tax basis increase, and the payments to be made under the tax receivable agreement, will depend upon a number of factors, including the timing and amount of our future income. As a result, even in the absence of a change of control or an election to terminate the tax receivable agreement, payments under the tax receivable agreement could be in excess of Medley Management Inc.’s actual cash tax savings.
Accordingly, it is possible that the actual cash tax savings realized by Medley Management Inc. may be significantly less than the corresponding tax receivable agreement payments. There may be a material negative effect on our liquidity if the payments under the tax receivable agreement exceed the actual cash tax savings that Medley Management Inc. realizes in respect of the tax attributes subject to the tax receivable agreement and/or distributions to Medley Management Inc. by Medley LLC are not sufficient to permit Medley Management Inc. to make payments under the tax receivable agreement after it has paid taxes and other expenses.
30
Based upon the $6.50 closing price of our Class A common stock on December 31, 2017 and interest rate of 3.1%, we estimate that, if Medley Management Inc. were to have exercised its termination right on December 31, 2017, the aggregate amount of these termination payments would have been approximately $127.8 million. The foregoing number is merely an estimate and the actual payments could differ materially. We may need to incur additional indebtedness to finance payments under the tax receivable agreement to the extent our cash resources are insufficient to meet our obligations under the tax receivable agreement as a result of timing discrepancies or otherwise.
Anti-takeover provisions in our organizational documents and Delaware law might discourage or delay acquisition attempts for us that you might consider favorable.
Our amended and restated certificate of incorporation and amended and restated bylaws contain provisions that may make the merger or acquisition of our company more difficult without the approval of our board of directors. Among other things, these provisions:
• | authorize the issuance of undesignated preferred stock, the terms of which may be established and the shares of which may be issued without stockholder approval, and which may include super voting, special approval, dividend, or other rights or preferences superior to the rights of the holders of Class A common stock; |
• | prohibit Class A common stockholders from acting by written consent unless such action is recommended by all directors then in office, but permit Class B common stockholders to act by written consent without requiring any such recommendation; |
• | provide that the board of directors is expressly authorized to make, alter, or repeal our bylaws and that our stockholders may only amend our bylaws with the approval of 80% or more of all of the outstanding shares of our capital stock entitled to vote; and |
• | establish advance notice requirements for nominations for elections to our board or for proposing matters that can be acted upon by stockholders at stockholder meetings. |
Further, as a Delaware corporation, we are also subject to provisions of Delaware law, which may impair a takeover attempt that our stockholders may find beneficial. These anti-takeover provisions and other provisions under Delaware law could discourage, delay or prevent a transaction involving a change in control of our company, including actions that our stockholders may deem advantageous, or negatively affect the trading price of our Class A common stock. These provisions could also discourage proxy contests and make it more difficult for you and other stockholders to elect directors of your choosing and to cause us to take other corporate actions you desire.
Risks Related to Our Class A Common Stock
The market price of our Class A common stock may decline due to the large number of shares of Class A common stock eligible for exchange and future sale.
The market price of shares of our Class A common stock could decline as a result of sales of a large number of shares of Class A common stock in the market or the perception that such sales could occur. These sales, or the possibility that these sales may occur, also might make it more difficult for us to sell shares of Class A common stock in the future at a time and at a price that we deem appropriate.
In addition, we and our pre-IPO owners have entered into an exchange agreement under which they (or certain permitted transferees thereof) have the right (subject to the terms of the exchange agreement), to exchange their LLC Units for shares of our Class A common stock on a one-for-one basis, subject to customary conversion rate adjustments. Subject to the terms of the exchange agreement, an aggregate of 23,653,333 LLC Units may be exchanged for shares of our Class A common stock and, subject to the transfer restrictions set forth in the Limited Liability Company Agreement of Medley LLC, sold. The market price of shares of our Class A common stock could decline as a result of the exchange or the perception that an exchange could occur. These exchanges, or the possibility that these exchanges may occur, also might make it more difficult for holders of our Class A common stock to sell such stock in the future at a time and at a price that they deem appropriate.
The disparity in the voting rights among the classes of our capital stock may have a potential adverse effect on the price of our Class A common stock.
Each share of our Class A common stock entitles its holder to one vote on all matters to be voted on by stockholders generally. Medley Group LLC, as the holder of our Class B common stock, has a number of votes equal to 10 times the number of LLC Units held by all non-managing members of Medley LLC for so long as our pre-IPO owners and then-current Medley personnel hold at least 10% of the aggregate number of shares of Class A common stock and LLC Units (excluding the LLC Units held by Medley Management Inc.). The difference in voting rights could adversely affect the value of our Class A common stock by, for example, delaying or deferring a change of control or if investors view, or any potential future purchaser of our company views, the superior voting rights of the Class B common stock to have value.
31
We are a “controlled company” within the meaning of the NYSE’s rules and, as a result, qualify for, and intend to rely on, exemptions from certain corporate governance requirements. You do not have the same protections afforded to stockholders of companies that are subject to such requirements.
Medley Group LLC, an entity owned by our pre-IPO owners holds a majority of the combined voting power of all classes of our stock entitled to vote generally in the election of directors. In addition, because Medley Group LLC, as the holder of our Class B common stock, has a number of votes equal to 10 times the number of LLC Units held by all non-managing members of Medley LLC for so long as our pre-IPO owners and then-current Medley personnel hold at least 10% of the aggregate number of shares of Class A common stock and LLC Units (excluding the LLC Units held by Medley Management Inc.), we anticipate that Medley Group LLC will continue to have at least a majority of the combined voting power of our Class A and Class B common stock even when our pre-IPO owners own less than a majority economic interest in our company. As a result, we are a “controlled company” within the meaning of the corporate governance standards of the New York Stock Exchange. Under these rules, a company of which more than 50% of the voting power in the election of directors is held by an individual, group or another company is a “controlled company” and may elect not to comply with certain corporate governance requirements. For example, controlled companies:
• | are not required to have a board that is composed of a majority of “independent directors,” as defined under the rules of such exchange; |
• | are not required to have a compensation committee that is composed entirely of independent directors; and |
• | are not required to have a nominating and corporate governance committee that is composed entirely of independent directors. |
We are utilizing these exemptions. As a result, a majority of the directors on our board are not independent. In addition, our compensation and nominating and corporate governance committees do not consist entirely of independent directors. Accordingly, you will not have the same protections afforded to stockholders of companies that are subject to all of the corporate governance requirements of the New York Stock Exchange.
We are an emerging growth company, and any decision on our part to comply with certain reduced reporting and disclosure requirements applicable to emerging growth companies could make our Class A common stock less attractive to investors.
We are an emerging growth company and, for as long as we continue to be an emerging growth company, we currently intend to take advantage of exemptions from various reporting requirements applicable to other public companies but not to emerging growth companies, including, but not limited to, not being required to have our independent registered public accounting firm audit our internal control over financial reporting under Section 404 of the Sarbanes-Oxley Act of 2002, or the Sarbanes-Oxley Act, reduced disclosure obligations regarding executive compensation in our registration statements, periodic reports and proxy statements, and exemptions from the requirements of holding a nonbinding advisory vote on executive compensation and stockholder approval of any golden parachute payments not previously approved. We could be an emerging growth company until December 31, 2019. We will cease to be an emerging growth company upon the earliest of: (i) December 31, 2019; (ii) the first fiscal year after our annual gross revenues are $1.0 billion or more; (iii) the date on which we have, during the previous three-year period, issued more than $1.0 billion in non-convertible debt securities; or (iv) the end of any fiscal year in which we become a “large accelerated filer,” which means that we have been public for at least 12 months, have filed at least one annual report and the market value of our Class A common stock held by non-affiliates exceeds $700 million as of the last day of our then most recently completed second fiscal quarter. We cannot predict if investors will find our Class A common stock less attractive if we choose to rely on these exemptions. If some investors find our Class A common stock less attractive as a result of any choices to reduce future disclosure, there may be a less active trading market for our Class A common stock and the price of our Class A common stock may be more volatile.
Under the JOBS Act, emerging growth companies can also delay adopting new or revised accounting standards until such time as those standards apply to private companies. We have irrevocably elected not to avail ourselves of this accommodation allowing for delayed adoption of new or revised accounting standards and, therefore, we will be subject to the same new or revised accounting standards as other public companies that are not emerging growth companies.
If we fail to maintain an effective system of internal control over financial reporting, we may not be able to accurately report our financial results or prevent fraud. As a result, stockholders could lose confidence in our financial and other public reporting, which would harm our business and the trading price of our common stock.
Effective internal controls over financial reporting are necessary for us to provide reliable financial reports and, together with adequate disclosure controls and procedures, are designed to prevent fraud. Any failure to implement required new or improved controls, or difficulties encountered in their implementation could cause us to fail to meet our reporting obligations. In addition, any testing by us conducted in connection with Section 404 of the Sarbanes-Oxley Act of 2002, or any subsequent testing by our independent registered public accounting firm, may reveal deficiencies in our internal controls over financial reporting that are deemed to be material weaknesses or that may require prospective or retroactive changes to our financial statements or identify
32
other areas for further attention or improvement. Inferior internal controls could also cause investors to lose confidence in our reported financial information, which could have a negative effect on the trading price of our common stock.
We are required to disclose changes made in our internal controls and procedures on a quarterly basis and our management is required to assess the effectiveness of these controls annually. However, our independent registered public accounting firm is not required to formally attest to the effectiveness of our internal control over financial reporting until the first annual report required to be filed with the SEC following the date we are no longer an “emerging growth company” as defined in the Jumpstart Our Business Startups Act of 2012, or the JOBS Act. We cannot assure you that there will not be material weaknesses or significant deficiencies in our internal controls in the future. If we are unable to assert that our internal control over financial reporting is effective, or if our independent registered public accounting firm is unable to express an opinion on the effectiveness of our internal control over financial reporting, we could lose investor confidence in the accuracy and completeness of our financial reports, which could have a material adverse effect on the price of our common stock.
Medley LLC’s tax treatment depends on its status as a partnership for United States federal and state income tax purposes. If the Internal Revenue Service (“IRS”) were to treat Medley LLC as a corporation for United States federal income tax purposes, which would subject it to entity-level taxation, or if Medley LLC were subjected to a material amount of additional entity-level taxation by individual states, then Medley LLC’s cash available for distributions to us could be substantially reduced.
It is possible, in certain circumstances, for Medley LLC to be taxed as a corporation for United States federal income tax purposes. Although we do not believe that Medley LLC is or will be (or should have been) so treated, if Medley LLC were treated as a “publicly traded partnership,” Medley LLC might be taxed as a corporation for United States federal income tax purposes. If Medley LLC were taxed as a corporation for United States federal income tax purposes, it would pay United States federal income tax on its taxable income at the corporate tax rate, which is currently a maximum of 35%, and would likely pay state and local income tax at varying rates. Therefore, Medley LLC’s treatment as a corporation would result in a material reduction in its anticipated cash flow and could materially adversely affect its ability to make cash distributions to us. In addition, changes in current state law may subject Medley LLC to additional entity-level taxation by individual states. Because of widespread state budget deficits and other reasons, several states are evaluating ways to subject partnerships to entity-level taxation through the imposition of state income, franchise and other forms of taxation. Imposition of any such taxes may substantially reduce Medley LLC’s cash available for distributions to us.
Recent legislation could subject Medley LLC to federal income tax liability, which may adversely affect its ability to make cash distributions to us.
Pursuant to the Bipartisan Budget Act of 2015, for tax years beginning after December 31, 2017, if the IRS makes audit adjustments to Medley LLC’s federal income tax returns, it may assess and collect any taxes (including any applicable penalties and interest) resulting from such audit adjustment directly from Medley LLC. If, as a result of any such audit adjustment, Medley LLC is required to make payments of taxes, penalties and interest, Medley LLC’s cash available for distributions to us may be substantially reduced. These rules are not applicable to Medley LLC for tax years beginning on or prior to December 31, 2017.
If securities or industry analysts do not publish research or reports about our business, or if they downgrade their recommendations regarding our Class A common stock, our stock price and trading volume could decline.
The trading market for our Class A common stock will be influenced by the research and reports that industry or securities analysts publish about us or our business. If any of the analysts who cover us downgrades our Class A common stock or publishes inaccurate or unfavorable research about our business, our Class A common stock price may decline. If analysts cease coverage of us or fail to regularly publish reports on us, we could lose visibility in the financial markets, which in turn could cause our Class A common stock price or trading volume to decline and our Class A common stock to be less liquid.
The market price of shares of our Class A common stock has been and may continue to be volatile, which could cause the value of your investment to decline.
The market price of our common stock has historically experienced and may continue to experience significant volatility. From January 2015 through December 2017, the market price of our common stock has fluctuated from a high of $15.14 per share in the first quarter of 2015 to a low of $3.43 per share in the first quarter of 2016. Securities markets worldwide experience significant price and volume fluctuations. This market volatility, as well as general economic, market or political conditions could reduce the market price of shares of our Class A common stock in spite of our operating performance. In addition, our operating results could be below the expectations of public market analysts and investors due to a number of potential factors, including variations in our quarterly operating results or dividends, if any, to stockholders, additions or departures of key management personnel, failure to meet analysts’ earnings estimates, publication of research reports about our industry, litigation and government investigations, changes or proposed changes in laws or regulations or differing interpretations or enforcement thereof affecting our business, adverse market reaction to any indebtedness we may incur or securities we may issue in the future, changes in market valuations of similar companies or speculation in the press or investment community, announcements by our competitors of significant contracts, acquisitions, dispositions, strategic partnerships, joint ventures or capital commitments, adverse publicity
33
about the industries we participate in or individual scandals, and in response the market price of shares of our Class A common stock could decrease significantly. You may be unable to resell your shares of Class A common stock at or above the initial public offering price.
In the past few years, stock markets have experienced extreme price and volume fluctuations. In the past, following periods of volatility in the overall market and the market price of a company’s securities, securities class action litigation has often been instituted against these companies. This litigation, if instituted against us, could result in substantial costs and a diversion of our management’s attention and resources.
You may be diluted by the future issuance of additional Class A common stock or LLC Units in connection with our incentive plans, acquisitions or otherwise.
As of December 31, 2017, we had 2,993,764,668 shares of Class A common stock authorized but unissued, including approximately 23,653,333 shares of Class A common stock issuable upon exchange of LLC Units that will be held by the non-managing members of Medley LLC. Our certificate of incorporation authorizes us to issue these shares of Class A common stock and options, rights, warrants and appreciation rights relating to Class A common stock for the consideration and on the terms and conditions established by our board of directors in its sole discretion, whether in connection with acquisitions or otherwise. Similarly, the limited liability company agreement of Medley LLC permits Medley LLC to issue an unlimited number of additional limited liability company interests of Medley LLC with designations, preferences, rights, powers and duties that are different from, and may be senior to, those applicable to the LLC Units, and which may be exchangeable for shares of our Class A common stock. Additionally, we have reserved an aggregate of 4,500,000 shares of Class A common stock and LLC Units for issuance under our 2014 Omnibus Incentive Plan, including 1,451,393 shares issuable upon the vesting of restricted stock units granted as of December 31, 2017. Any Class A common stock that we issue, including under our 2014 Omnibus Incentive Plan or other equity incentive plans that we may adopt in the future, would dilute the percentage ownership held by investors who purchase Class A common stock.
Item 1B. Unresolved Staff Comments
None.
Item 2. Properties
Our principal executive offices are located in leased office space at 280 Park Avenue, New York, New York, 10017. As discussed in Item 9B, below, during the first quarter of 2018, the Company initiated the consolidation of our operations in New York. We consider these facilities to be suitable and adequate for the management and operation of our business. We do not own any real property.
Item 3. Legal Proceedings
From time to time, we are involved in various legal proceedings, lawsuits and claims incidental to the conduct of our business. Our business is also subject to extensive regulation, which may result in regulatory proceedings against us. Except as described below, we are not currently party to any material legal proceedings.
One of the Company's subsidiaries, MCC Advisors LLC, was named as a defendant in a lawsuit on May 29, 2015, by Moshe Barkat and Modern VideoFilm Holdings, LLC (“MVF Holdings”) against MCC, MOF II, MCC Advisors LLC, Deloitte Transactions and Business Analytics LLP A/K/A Deloitte ERG (“Deloitte”), Scott Avila (“Avila”), Charles Sweet, and Modern VideoFilm, Inc. (“MVF”). The lawsuit is pending in the California Superior Court, Los Angeles County, Central District, as Case No. BC 583437. The lawsuit was filed after MCC, as agent for the lender group, exercised remedies following a series of defaults by MVF and MVF Holdings on a secured loan with an outstanding balance at the time in excess of $65 million. The lawsuit sought damages in excess of $100 million. Deloitte and Avila have settled the claims against them in exchange for payment of $1.5 million. Following a separate lawsuit by Mr. Barkat against MVF’s D&O insurance carrier, the carrier, Charles Sweet and MVF have settled the claims against them. On June 6, 2016, the court granted the Medley defendants’ demurrers on several counts and dismissed Mr. Barkat’s claims with prejudice except with respect to his claim for intentional interference with contract. On March 18, 2018, the court granted the Medley defendants’ motion for summary adjudication with respect to Mr. Barkat’s sole remaining claim against the Medley Defendants for intentional interference. Now that the trial court has ruled in favor of the Medley defendants on all counts, the only remaining claims in the Barkat litigation are MCC and MOF II’s affirmative counterclaims against Mr. Barkat and MVF Holdings, which MCC and MOF II are diligently prosecuting.
On August 29, 2016, MVF Holdings filed another lawsuit in the California Superior Court, Los Angeles County, Central District, as Case No. BC 631888 (the “Derivative Action”), naming MCC Advisors LLC and certain of Medley’s employees as defendants, among others. The plaintiff in the Derivative Action, asserts claims against the defendants for breach of fiduciary duty, aiding and abetting breach of fiduciary duty, unfair competition, breach of the implied covenant of good faith and fair dealing, interference with prospective economic advantage, fraud, and declaratory relief. MCC Advisors LLC and the other defendants
34
believe the causes of action asserted in the Derivative Action are without merit and all defendants intend to continue to assert a vigorous defense.
Medley LLC, MCC, and MOF II were named as defendants, along with other various parties, in a putative class action lawsuit captioned as Royce Solomon, Jodi Belleci, Michael Littlejohn, and Giulianna Lomaglio v. American Web Loan, Inc., AWL, Inc., Mark Curry, MacFarlane Group, Inc., The MacFarlane Group, LLC, Sol Partners, Medley Opportunity Fund, II, LP, Medley LLC, Medley Capital Corporation, Oakmont Funding, Inc., Dinero Investments, Inc., Chieftain Funding, Inc., Dant Holdings, Inc., DHI Computing Service, Inc., Smith Haynes & Watson, LLC, Middlemarch Partners, and John Does 1-100, filed on December 15, 2017, in the United States District Court for the Eastern District of Virginia, Newport News Division, as Case No. 4:17-cv-145 (hereinafter, “Class Action 1”). MOF II and MCC were also named as defendants, along with various other parties, in a putative class action lawsuit captioned George Hengle and Lula Williams v. Mark Curry, American Web Loan, Inc., AWL, Inc., Red Stone, Inc., Medley Opportunity Fund II LP, and Medley Capital Corporation, filed February 13, 2018, in the United States District Court, Eastern District of Virginia, Richmond Division, as Case No. 3:18-cv-100 (“Class Action 2”) (together with Class Action 1, the “Class Action Complaints”). The plaintiffs in the Class Action Complaints filed their putative class actions alleging claims under the Racketeer Influenced and Corrupt Organizations Act, and various other claims arising out of the alleged payday lending activities of American Web Loan. The claims against MOF II, Medley LLC, and MCC (in Class Action 1), and the claims against MOF II and MCC (in Class Action 2), allege that those defendants in each respective action exercised control over American Web Loan’s payday lending activities as a result of a loan to American Web Loan. The loan was made by MOF II in 2011. American Web Loan repaid the loan from MOF II in full in February of 2015, more than 1 year and 10 months prior to any of the loans allegedly made by American Web Loan to the alleged class plaintiff representatives in Class Action 1; in Class Action 2, the alleged class plaintiff representatives have not alleged when they received any loans from American Web Loan. Medley LLC and MCC never made any loans or provided financing to, or had any other relationship with, American Web Loan. MOF II, Medley LLC, and MCC are seeking indemnification from American Web Loan, various affiliates, and other parties with respect to the claims in the Class Action Complaints. MOF II, Medley LLC, and MCC believe the alleged claims in the Class Action Complaints are without merit and they intend to defend these lawsuits vigorously.
Item 4. Mine Safety Disclosures
Not Applicable.
35
PART II.
Item 5. Market For Registrant's Common Equity, Related Stockholder Matters and Issuer Purchases of Equity Securities
Market Information
Our Class A common stock is traded on the NYSE under the symbol “MDLY.” Our Class A common stock began trading on the NYSE on September 24, 2014.
The number of holders of record of our Class A stock as of March 15, 2018 was 5. This does not include the number of shareholders that hold shares in “street name” through banks, brokers and other financial institutions. There is no publicly traded market for our Class B common stock, which is held by Medley Group, LLC.
The following table sets forth the high and low intra-day sales prices per share of our Class A common stock, for the periods indicated, as reported by the NYSE:
Sales Price | ||||||||
2017 | High | Low | ||||||
First Quarter | $ | 10.35 | $ | 7.85 | ||||
Second Quarter | $ | 8.40 | $ | 5.60 | ||||
Third Quarter | $ | 6.80 | $ | 5.80 | ||||
Fourth Quarter | $ | 7.15 | $ | 5.50 | ||||
Sales Price | ||||||||
2016 | High | Low | ||||||
First Quarter | $ | 6.55 | $ | 3.43 | ||||
Second Quarter | $ | 6.87 | $ | 5.12 | ||||
Third Quarter | $ | 8.72 | $ | 5.55 | ||||
Fourth Quarter | $ | 10.65 | $ | 8.16 | ||||
Dividend Policy
During 2017 we paid quarterly dividends of $0.20 per share to holders of our Class A common stock on March 6, 2017, May 31, 2017, September 6, 2017 and December 6, 2017. On February 27, 2018, the Board of Directors declared a $0.20 per share dividend to holders of our Class A common stock in respect of the fourth quarter of 2017, which was paid on March 7, 2018. During fiscal year 2016 we paid quarterly dividends of $0.20 per share to holders of our Class A common stock on March 4 2016, June 2, 2016, September 6, 2016 and December 5, 2016.
The declaration, amount and payment of any future dividends on shares of our Class A common stock will be at the sole discretion of our board of directors and we may reduce or discontinue entirely the payment of such dividends at any time. Our board of directors may take into account general and economic conditions, our financial condition and operating results, our available cash and current and anticipated cash needs, capital requirements, contractual, legal, tax and regulatory restrictions and implications on the payment of dividends by us to our stockholders or by our subsidiaries to us, and such other factors as our board of directors may deem relevant.
Medley Management Inc. is a holding company and has no material assets other than its ownership of LLC Units in Medley LLC. We intend to cause Medley LLC to make distributions to us in an amount sufficient to cover cash dividends, if any, declared by us. If Medley LLC makes such distributions to Medley Management Inc., the holders of LLC Units will also be entitled to receive distributions pro rata in accordance with the percentages of their respective limited liability company interests.
Any financing arrangements that we enter into in the future may include restrictive covenants that limit our ability to pay dividends. In addition, Medley LLC is generally prohibited under Delaware law from making a distribution to a member to the extent that, at the time of the distribution, after giving effect to the distribution, liabilities of Medley LLC (with certain exceptions) exceed the fair value of its assets. Subsidiaries of Medley LLC are generally subject to similar legal limitations on their ability to make distributions to Medley LLC. In addition, the Revolving Credit Facility limits the ability of Medley LLC to pay distributions to us. See “Management's Discussion and Analysis of Financial Condition and Results of Operations — Liquidity and Capital Resources — Debt Instruments — Revolving Credit Facility.”
36
Because Medley Management Inc. must pay taxes and make payments under the tax receivable agreement, amounts ultimately distributed to holders of our Class A common stock are expected to be less than the amounts distributed by Medley LLC to its members on a per LLC Unit basis.
Medley LLC's historical distributions include compensatory payments and other benefits paid to our senior professionals who are members of Medley LLC, which have historically been accounted for as distributions on the equity held by such senior professionals rather than as employee compensation. Following our IPO, guaranteed payments and other benefits paid to our senior professionals who are members of Medley LLC are accounted for as employee compensation.
For the years ended December 31, 2017, 2016 and 2015, Medley LLC made distributions to our pre-IPO owners in the amount of $23.2 million, $22.7 million and $32.7 million, respectively.
Stock Performance Graph
The following graph compares the cumulative stockholder return from September 24, 2014, the date our Class A common stock began trading on the NYSE, through December 31, 2017, with that of the Standard & Poor's 500 Stock Index and the Russell 2000 Financial Services Index. The graph assumes that the value of the investment in our Class A common stock and each index was $100 on September 24, 2014 and that all dividends and other distributions were reinvested.
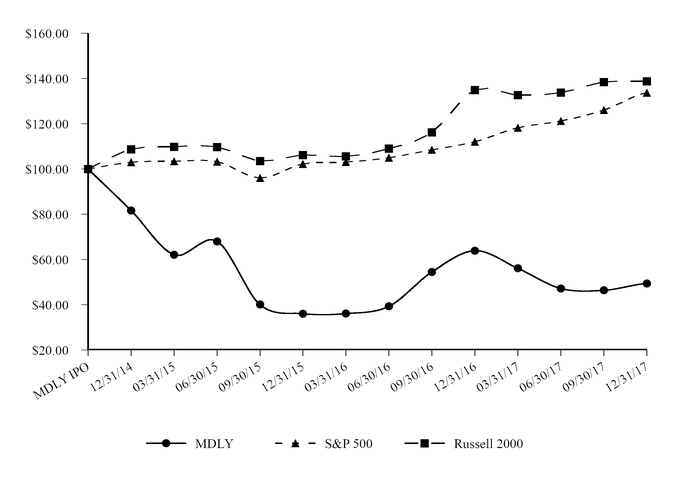
Recent Sales of Unregistered Securities
None.
Issuer Purchases of Equity Securities
None.
37
Item 6. Selected Financial Data
The following selected consolidated financial data presents selected data on the financial condition and results of operations of Medley Management Inc., and for periods prior to September 29, 2014, the financial condition and results of operations of Medley LLC, the predecessor of Medley Management Inc. Medley LLC is considered the predecessor of Medley Management Inc. for accounting purposes, and its consolidated financial statements are the historical financial statements of Medley Management Inc. During fiscal year 2015, we adopted new consolidation guidance which resulted in the deconsolidation of our Consolidated Funds, effective January 1, 2015. Prior to January 1, 2015, we consolidated certain funds in our consolidated financial statements which had a significant gross-up effect on our assets, liabilities and cash flows but no effect on the net income attributable to Medley Management Inc. and non-controlling interests in Medley LLC. This financial data should be read together with “Management's Discussion and Analysis of Financial Condition and Results of Operations” and the historical financial statements and related notes thereto included in this Form 10-K.
We derived the following selected consolidated financial data of Medley Management Inc. as of December 31, 2017 and 2016 and for the years ended December 31, 2017, 2016 and 2015 from the audited consolidated financial statements included in this Form 10-K. The following selected consolidated statement of operations data for the years ended December 31, 2014 and 2013 and the selected financial condition data as of December 31, 2015 were derived from our audited consolidated financial statements not included in this Form 10-K. The following selected financial condition data as of December 31, 2014 and 2013 were derived from our audited consolidated financial statements not included in this Form 10-K, which were adjusted for the adoption of ASU 2015-03, Simplifying the Presentation of Debt Issuance Costs. Effective January 1, 2016, we adopted this new guidance and retrospectively presented debt issuance costs related to our long-term debt as a deduction from the carrying amount of the associated debt on our consolidated balance sheets. As a result of this adoption, we reclassified $2.2 million and $0.3 million as of December 31, 2014 and 2013, respectively, of debt issuance costs from other assets to debt obligations. See Note 2, “Summary of Significant Accounting Policies” to our audited consolidated financial statements included in this Form 10-K for a description of the new guidance.
For periods prior to the reorganization and IPO on September 29, 2014, all payments made to our senior professionals who are members of Medley LLC, including guaranteed payments, were reflected as distributions from members' capital. Subsequent to the reorganization and IPO, all guaranteed payments made to our senior professionals who are members of Medley LLC are recognized as compensation expense. Prior to our reorganization and IPO, our business was organized as a partnership for tax purposes and was not subject to U.S. federal, state and local corporate income taxes. A provision for income taxes was made for certain entities that were subject to New York City's unincorporated business tax related to taxable income allocated to New York city. As a result of the corporate reorganization and IPO, Medley Management Inc. is subject to U.S. federal, state and local corporate income taxes on its allocable portion of income from Medley LLC at prevailing corporate tax rates.
Our historical results are not necessarily indicative of the results expected for any future period.
For the Years Ended December 31, | |||||||||||||||||||
2017 | 2016 | 2015 | 2014 | 2013 | |||||||||||||||
(Amounts in thousands except share and per share amounts) | |||||||||||||||||||
Statement of Operations Data: | |||||||||||||||||||
Revenues | |||||||||||||||||||
Management fees | $ | 58,104 | $ | 65,496 | $ | 75,675 | $ | 61,252 | $ | 36,446 | |||||||||
Performance fees | (1,744 | ) | 2,421 | (15,685 | ) | 2,050 | 2,412 | ||||||||||||
Other revenues and fees | 9,201 | 8,111 | 7,436 | 8,871 | 5,011 | ||||||||||||||
Total revenues | 65,561 | 76,028 | 67,426 | 72,173 | 43,869 | ||||||||||||||
Expenses | |||||||||||||||||||
Compensation and benefits | 27,432 | 27,800 | 26,768 | 20,322 | 13,712 | ||||||||||||||
Performance fee compensation | (874 | ) | (319 | ) | (8,049 | ) | (1,543 | ) | 7,192 | ||||||||||
Consolidated Funds expenses | — | — | — | 1,670 | 1,225 | ||||||||||||||
General, administrative and other expenses | 13,045 | 28,540 | 16,836 | 16,312 | 12,655 | ||||||||||||||
Total expenses | 39,603 | 56,021 | 35,555 | 36,761 | 34,784 | ||||||||||||||
38
Other income (expense) | |||||||||||||||||||
Dividend income | 4,327 | 1,304 | 886 | 886 | 886 | ||||||||||||||
Interest expense | (11,855 | ) | (9,226 | ) | (8,469 | ) | (5,520 | ) | (1,479 | ) | |||||||||
Other income (expenses), net | 835 | (1,070 | ) | (1,641 | ) | (1,773 | ) | (483 | ) | ||||||||||
Interest and other income of Consolidated Funds | — | — | — | 71,468 | 52,550 | ||||||||||||||
Interest expense of Consolidated Funds | — | — | — | (9,951 | ) | (2,638 | ) | ||||||||||||
Net realized gain (loss) on investments of Consolidated Funds | — | — | — | 789 | (16,080 | ) | |||||||||||||
Net change in unrealized depreciation on investments of Consolidated Funds | — | — | — | (20,557 | ) | (3,361 | ) | ||||||||||||
Net change in unrealized depreciation (appreciation) on secured borrowings of Consolidated Funds | — | — | — | 1,174 | (306 | ) | |||||||||||||
Total other income (expense), net | (6,693 | ) | (8,992 | ) | (9,224 | ) | 36,516 | 29,089 | |||||||||||
Income before income taxes | 19,265 | 11,015 | 22,647 | 71,928 | 38,174 | ||||||||||||||
Provision for income taxes | 1,956 | 1,063 | 2,015 | 2,528 | 1,639 | ||||||||||||||
Net income | 17,309 | 9,952 | 20,632 | 69,400 | 36,535 | ||||||||||||||
Net income attributable to non-controlling interests in Consolidated Funds | — | — | — | 29,717 | 12,898 | ||||||||||||||
Net income (loss) attributable to redeemable non-controlling interests and non-controlling interests in consolidated subsidiaries | 6,718 | 2,549 | (885 | ) | 1,933 | — | |||||||||||||
Net income attributable to non-controlling interests in Medley LLC | 9,664 | 6,406 | 18,406 | 36,055 | $ | 23,637 | |||||||||||||
Net income attributable to Medley Management Inc. | $ | 927 | $ | 997 | $ | 3,111 | $ | 1,695 | |||||||||||
Per share data: | |||||||||||||||||||
Dividends declared per Class A common stock | $ | 0.80 | $ | 0.80 | $ | 0.60 | $ | 0.20 | |||||||||||
Net income per Class A common stock - Basic and Diluted | $ | 0.07 | $ | 0.02 | $ | 0.46 | $ | 0.24 | (1) | ||||||||||
Weighted average shares outstanding - Basic and Diluted | 5,553,026 | 5,804,042 | 6,002,422 | 6,000,000 | |||||||||||||||
(1) | Based on net income attributable to Medley Management Inc. for the period September 29, 2014 through December 31, 2014. |
39
As of December 31, | |||||||||||||||||||
2017 | 2016 | 2015 | 2014 | 2013 | |||||||||||||||
(Amounts in thousands) | |||||||||||||||||||
Balance Sheet Data: | |||||||||||||||||||
Assets | |||||||||||||||||||
Cash and cash equivalents | $ | 36,327 | $ | 49,666 | $ | 71,688 | $ | 87,206 | $ | 5,395 | |||||||||
Restricted cash equivalents | — | 4,897 | — | — | — | ||||||||||||||
Investments, at fair value | 56,399 | 31,904 | 16,360 | 9,901 | 10,173 | ||||||||||||||
Management fees receivable | 14,714 | 12,630 | 16,172 | 15,173 | 8,921 | ||||||||||||||
Performance fees receivable | 3,220 | 4,961 | 2,518 | 5,573 | 3,339 | ||||||||||||||
Other assets | 17,262 | 18,311 | 13,015 | 7,058 | 5,021 | ||||||||||||||
Assets of Consolidated Funds: | |||||||||||||||||||
Cash and cash equivalents | — | — | — | 38,111 | 60,355 | ||||||||||||||
Investments, at fair value | — | — | — | 734,870 | 453,396 | ||||||||||||||
Interest and dividends receivable | — | — | — | 6,654 | 2,969 | ||||||||||||||
Other assets | — | — | — | 3,681 | 436 | ||||||||||||||
Total assets | $ | 127,922 | $ | 122,369 | $ | 119,753 | $ | 908,227 | $ | 550,005 | |||||||||
Liabilities and Equity | |||||||||||||||||||
Loans payable | $ | 116,892 | $ | 52,178 | $ | 100,871 | $ | 100,885 | $ | 27,703 | |||||||||
Senior unsecured debt | 9,233 | 49,793 | — | — | — | ||||||||||||||
Accounts payable, accrued expenses and other liabilities | 25,019 | 36,270 | 34,746 | 27,583 | 17,613 | ||||||||||||||
Performance fee compensation payable | 111 | 985 | 1,823 | 11,807 | 16,225 | ||||||||||||||
Liabilities of Consolidated Funds: | |||||||||||||||||||
Accounts payable, accrued expenses and other liabilities | — | — | — | 5,767 | 1,325 | ||||||||||||||
Secured borrowings | — | — | — | 141,135 | 41,178 | ||||||||||||||
Total liabilities | 151,255 | 139,226 | 137,440 | 287,177 | 104,044 | ||||||||||||||
Redeemable Non-controlling Interests | 53,741 | 30,805 | — | — | — | ||||||||||||||
Equity | |||||||||||||||||||
Total stockholders' equity (deficit), Medley Management Inc. | (7,971 | ) | (1,853 | ) | (39 | ) | (2,052 | ) | — | ||||||||||
Non-controlling interests in Consolidated Funds | — | — | — | 625,548 | 464,475 | ||||||||||||||
Non-controlling interests in consolidated subsidiaries | (1,702 | ) | (1,717 | ) | (459 | ) | 1,526 | 40 | |||||||||||
Non-controlling interests in Medley LLC | (67,401 | ) | (44,092 | ) | (17,189 | ) | (3,972 | ) | — | ||||||||||
Medley LLC members' deficit prior to reorganization | — | — | — | — | (18,554 | ) | |||||||||||||
Total (deficit) equity | (77,074 | ) | (47,662 | ) | (17,687 | ) | 621,050 | 445,961 | |||||||||||
Total liabilities, redeemable non-controlling interests and equity | $ | 127,922 | $ | 122,369 | $ | 119,753 | $ | 908,227 | $ | 550,005 | |||||||||
40
Item 7. Management's Discussion and Analysis of Financial Condition and Results of Operations
The following discussion and analysis should be read in conjunction with our audited consolidated financial statements and related notes as of December 31, 2017 and 2016 and for the years ended December 31, 2017, 2016 and 2015 included in this Form 10-K.
Overview
We are an alternative asset management firm offering yield solutions to retail and institutional investors. We focus on credit-related investment strategies, primarily originating senior secured loans to private middle market companies in the U.S. that have revenues between $50 million and $1 billion. We generally hold these loans to maturity. Our national direct origination franchise provides capital to the middle market in the U.S. Over the past 16 years, we have provided capital to over 400 companies across 35 industries in North America.
We manage three permanent capital vehicles, two of which are BDCs and one interval fund, as well as long-dated private funds and SMAs, focusing on senior secured credit.
• | Permanent capital vehicles: MCC, SIC and STRF, have a total AUM of $2.3 billion as of December 31, 2017. |
• | Long-dated private funds and SMAs: MOF II, MOF III, MOF III Offshore, Tac Ops, MCOF, Aspect and SMAs, have a total AUM of $2.9 billion as of December 31, 2017. |
As of December 31, 2017, we had $5.2 billion of AUM, $2.3 billion in permanent capital vehicles and $2.9 billion in long-dated private funds and SMAs. Our year over year AUM decline as of December 31, 2017 was 3% and was driven in large part by income and return of capital distributions, offset in part by the growth of our long-dated private funds and SMAs. Our compounded annual AUM growth rate from December 31, 2010 through December 31, 2017 was 26% and our compounded annual Fee Earning AUM growth rate was 19%, both of which have been driven in large part by the growth in our permanent capital vehicles. As of December 31, 2017, we had $3.2 billion of Fee Earning AUM, $2.1 billion in permanent capital vehicles and $1.1 billion in long-dated private funds and SMAs. Typically the investment periods of our institutional commitments range from 18 to 24 months and we expect our Fee Earning AUM to increase as capital commitments included in AUM are invested.
In general, our institutional investors do not have the right to withdraw capital commitments and, to date, we have not experienced any withdrawals of capital commitments. For a description of the risk factor associated with capital commitments, see “Risk Factors – Third-party investors in our private funds may not satisfy their contractual obligation to fund capital calls when requested, which could adversely affect a fund’s operations and performance” included in this Annual Report on Form 10-K.
Direct origination, careful structuring and active monitoring of the loan portfolios we manage are important success factors in our business, which can be adversely affected by difficult market and political conditions, such as the turmoil in the global capital markets from 2007 to 2009. Since our inception in 2006, we have adhered to a disciplined investment process that employs these principles with the goal of delivering strong risk-adjusted investment returns while protecting investor capital. We believe that our ability to directly originate, structure and lead deals enables us to achieve these goals. In addition, the loans we manage generally have a contractual maturity of between three and seven years and are typically floating rate, which we believe positions our business well for rising interest rates.
The significant majority of our revenue is derived from management fees, which include base management fees earned on all of our investment products as well as Part I incentive fees earned from our permanent capital vehicles and certain of our long-dated private funds. Our base management fees are generally calculated based upon fee earning assets and paid quarterly in cash. Our Part I incentive fees are typically calculated based upon net investment income, subject to a hurdle rate, and are also paid quarterly in cash.
We also may earn performance fees from our long-dated private funds and SMAs. Typically, these performance fees are 15.0% to 20.0% of the total return above a hurdle rate. These performance fees are accrued quarterly and paid after the return of all invested capital and an amount sufficient to achieve the hurdle rate of return.
We also may receive incentive fees related to realized capital gains in our permanent capital vehicles and certain of our long-dated private funds that we refer to as Part II incentive fees. Part II incentive fees are payable annually and are calculated at the end of each applicable year by subtracting (i) the sum of cumulative realized capital losses and unrealized capital depreciation from (ii) cumulative aggregate realized capital gains. If the amount calculated is positive, then the Part II incentive fee for such year is equal to 20% of such amount, less the aggregate amount of Part II incentive fees paid in all prior years. If such amount is negative, then no Part II incentive fee will be payable for such year. As our investment strategy is focused on generating yield from senior secured credit, historically we have not generated Part II incentive fees.
41
For the years ended December 31, 2017, 86%, and 89% for the years ended December 31, 2016 and 2015 of our revenues were generated from management fees and performance fees derived primarily from net interest income on senior secured loans.
Our primary expenses are compensation to our employees and general, administrative and other expenses. Compensation includes salaries, discretionary bonuses, stock-based compensation and benefits paid and payable to our employees. Performance fee compensation is related to performance fees, generally consisting of incentive allocations in our long-dated private funds that we grant to certain of our professionals. General and administrative expenses include costs primarily related to professional services, office rent and related expenses, depreciation and amortization, travel and related expenses, information technology, communication and information services, placement fees and third-party marketing expenses, other general operating items, and, in 2016, expense support agreement expenses related to SIC.
Reorganization and Initial Public Offering
Medley Management Inc. was incorporated on June 13, 2014 and commenced operations on September 29, 2014 upon the completion of its IPO of its Class A common stock. We raised $100.4 million, net of underwriting discounts, through the issuance of 6,000,000 shares of Class A common stock at a public offering price of $18.00 per share. The offering proceeds were used to purchase 6,000,000 newly issued LLC Units from Medley LLC. Prior to the IPO, Medley Management Inc. had not engaged in any business or other activities except in connection with its formation and IPO.
In connection with the IPO, Medley Management Inc. issued 100 shares of Class B common stock to Medley Group LLC (“Medley Group”), an entity wholly owned by the pre-IPO members of Medley LLC. For so long as the pre-IPO members and then-current Medley personnel hold at least 10% of the aggregate number of shares of Class A common stock and LLC Units (excluding those LLC Units held by Medley Management Inc.) then outstanding, the Class B common stock entitles Medley Group to a number of votes that is equal to 10 times the aggregate number of LLC Units held by all non-managing members of Medley LLC that do not themselves hold shares of Class B common stock and entitle each other holder of Class B common stock, without regard to the number of shares of Class B common stock held by such other holder, to a number of votes that is equal to 10 times the number of membership units held by such holder.
In connection with the IPO, Medley LLC amended and restated its limited liability agreement to modify its capital structure by reclassifying the 23,333,333 interests held by the pre-IPO members into a single new class of units. The pre-IPO members also entered into an exchange agreement under which they (or certain permitted transferees thereof) have the right, subject to the terms of the exchange agreement, to exchange their LLC Units for shares of Medley Management Inc.’s Class A common stock on a one-for-one basis, subject to customary conversion rate adjustments for stock splits, stock dividends and reclassifications. In addition, pursuant to the amended and restated limited liability agreement, Medley Management Inc. became the sole managing member of Medley LLC.
Our Structure
Medley Management Inc. is a holding company and its sole material asset is a controlling equity interest in Medley LLC. Medley Management Inc. operates and controls all of the business and affairs and consolidates the financial results of Medley LLC and its subsidiaries. We and our pre-IPO owners have also entered into an exchange agreement under which they (or certain permitted transferees) have the right (subject to the terms of the exchange agreement), to exchange their LLC Units for shares of our Class A common stock on a one-for-one basis, subject to customary conversion rate adjustments for stock splits, stock dividends and reclassifications.
Medley Group LLC, an entity wholly-owned by our pre-IPO owners, holds all 100 issued and outstanding shares of our Class B common stock. For so long as our pre-IPO owners and then-current Medley personnel hold at least 10% of the aggregate number of shares of Class A common stock and LLC Units (excluding those LLC Units held by Medley Management Inc.), which we refer to as the “Substantial Ownership Requirement,” the Class B common stock entitles Medley Group LLC, without regard to the number of shares of Class B common stock held by it, to a number of votes that is equal to 10 times the aggregate number of LLC Units held by all non-managing members of Medley LLC that do not themselves hold shares of Class B common stock and entitle each other holder of Class B common stock, without regard to the number of shares of Class B common stock held by such other holder, to a number of votes that is equal to 10 times the number of LLC Units held by such holder. For purposes of calculating the Substantial Ownership Requirement, (1) shares of Class A common stock deliverable to our pre-IPO owners and then-current Medley personnel pursuant to outstanding equity awards will be deemed then outstanding and (2) shares of Class A common stock and LLC Units held by any estate, trust, partnership or limited liability company or other similar entity of which any pre-IPO owner or then-current Medley personnel, or any immediate family member thereof, is a trustee, partner, member or similar party will be considered held by such pre-IPO owner or other then-current Medley personnel. From and after the time that the Substantial Ownership Requirement is no longer satisfied, the Class B common stock will entitle Medley Group LLC, without regard to the number of shares of Class B common stock held by it, to a number of votes that is equal to the aggregate number of LLC Units held by all non-managing members of Medley LLC that do not themselves hold shares of Class B common stock and
42
entitle each other holder of Class B common stock, without regard to the number of shares of Class B common stock held by such other holder, to a number of votes that is equal to the number of LLC Units held by such holder. At the completion of our IPO, our pre-IPO owners were comprised of all of the non-managing members of Medley LLC. However, Medley LLC may in the future admit additional non-managing members that would not constitute pre-IPO owners. If at any time the ratio at which LLC Units are exchangeable for shares of our Class A common stock changes from one-for-one as set forth in the Exchange Agreement, the number of votes to which Class B common stockholders are entitled will be adjusted accordingly. Holders of shares of our Class B common stock will vote together with holders of our Class A common stock as a single class on all matters on which stockholders are entitled to vote generally, except as otherwise required by law.
Other than Medley Management Inc., holders of LLC Units, including our pre-IPO owners, are, subject to limited exceptions, prohibited from transferring any LLC Units held by them upon consummation of our IPO, or any shares of Class A common stock received upon exchange of such LLC Units, until the third anniversary of our IPO without our consent. Thereafter and prior to the fourth and fifth anniversaries of our IPO, such holders may not transfer more than 33 1/3% and 66 2/3%, respectively, of the number of LLC Units held by them upon consummation of our IPO, together with the number of any shares of Class A common stock received by them upon exchange therefor, without our consent. While this agreement could be amended or waived by us, our pre-IPO owners have advised us that they do not intend to seek any waivers of these restrictions.
43
The diagram below depicts our organizational structure (excluding those operating subsidiaries with no material operations or assets) as of March 7, 2018:
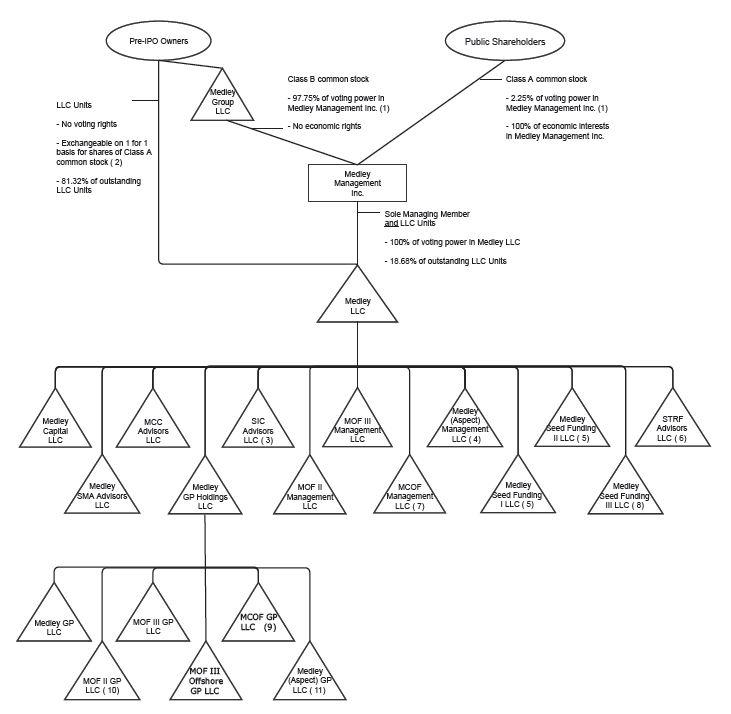
(1) | The Class B common stock provides Medley Group LLC with a number of votes that is equal to 10 times the aggregate number of LLC Units held by all non-managing members of Medley LLC. From and after the time that the Substantial Ownership Requirement is no longer satisfied, the Class B common stock will provide Medley Group LLC with a number of votes that is equal to the aggregate number of LLC Units held by all non-managing members of Medley LLC that do not themselves hold shares of Class B common stock. |
(2) | If our pre-IPO owners exchanged all of their vested LLC Units for shares of Class A common stock, they would hold 81.32% of the outstanding shares of Class A common stock, entitling them to an equivalent percentage of economic interests and voting power in Medley Management Inc., Medley Group LLC would hold no voting power or economic interests in Medley Management Inc. and Medley Management Inc. would hold 100% of outstanding LLC Units and 100% of the voting power in Medley LLC. |
(3) | Strategic Capital Advisory Services, LLC owns 20% of SIC Advisors LLC and is entitled to receive distributions of up to 20% of the gross cash proceeds received by SIC Advisors LLC from the management and incentive fees payable by Sierra Income Corporation to SIC Advisors LLC, net of certain expenses, as well as 20% of the returns of the investments held at SIC Advisors LLC. |
(4) | Medley LLC holds 96.5% of the Class B economic interests in Medley (Aspect) Management LLC. |
(5) | Medley LLC holds 100% of the outstanding Common Interest, and DB Med Investor I LLC holds 100% of the outstanding Preferred Interest in each of Medley Seed Funding I LLC and Medley Seed Funding II LLC. |
44
(6) | Medley Seed Funding III LLC holds 100% of the Senior Preferred Interest, Strategic Capital Advisory Services, LLC holds 100% of the Junior Preferred Interest and Medley LLC holds 100% of the Common Interest in STRF Advisors LLC. |
(7) | Medley LLC holds 95.5% of the Class B economic interests in MCOF Management LLC. |
(8) | Medley LLC holds 100% of the outstanding Common Interest, and DB MED Investor II LLC holds 100% of the outstanding Preferred Interest in Medley Seed Funding III LLC. |
(9) | Medley GP Holdings LLC holds 95.5% of the Class B economic interests in each of MCOF GP LLC. |
(10) | Certain employees, former employees and former members of Medley LLC hold approximately 40% of the limited liability company interests in MOF II GP LLC, the entity that serves as general partner of MOF II, entitling the holders to share the performance fees earned from MOF II. |
(11) | Medley LLC holds 96.5% of the Class B economic interests in Medley (Aspect) GP LLC. |
Trends Affecting Our Business
Our results of operations, including the fair value of our AUM, are affected by a variety of factors, including conditions in the global financial markets as well as economic and political environments, particularly in the U.S.
During 2017, the domestic economy exhibited continued growth, and key financial market indicators generated positive readings. Coincident with improving economic growth, LIBOR rates have increased, while credit spreads have tightened. Across the lending spectrum, year over year loan issuance has increased, driven by several factors, including robust merger and acquisition activity, as well as significant refinance activity. Our platform provides us the ability to lend across the capital structure and at varying interest rates providing our firm access to a larger borrower subset over time.
In addition to these macroeconomic trends and market factors, our future performance is dependent on our ability to attract new capital. We believe the following factors will influence our future performance:
• | The extent to which investors favor directly originated private credit investments. Our ability to attract additional capital is dependent on investors’ views of directly originated private credit investments relative to traditional assets. We believe fundraising efforts will continue to be impacted by certain fundamental asset management trends that include: (i) the increasing importance of directly originated private credit investment strategies for institutional investors; (ii) increasing demand for directly originated private credit investments from retail investors; (iii) recognition by the consultant channel, which serves endowment and pension fund investors, that directly originated private credit is an important component of asset allocation; (iv) increasing demand from insurance companies seeking alternatives to investing in the liquid credit markets; and (v) de-leveraging of the global banking system, bank consolidation and increased bank regulatory requirements. |
• | Our ability to generate strong, stable returns and retain investor capital throughout market cycles. The capital we are able to attract and retain drives the growth of our AUM, fee earning AUM and management fees. We believe we are well positioned to invest through market cycles given our AUM is in either permanent capital vehicles or long-dated private funds and SMAs. |
• | Our ability to source investments with attractive risk-adjusted returns. Our ability to grow our revenue is dependent on our continued ability to source attractive investments and deploy the capital that we have raised. We believe that the current economic environment provides attractive investment opportunities. Our ability to identify attractive investments and execute on those investments is dependent on a number of factors, including the general macroeconomic environment, valuation, size and the liquidity of these investment opportunities. A significant decrease in the quality or quantity of investment opportunities in the directly originated private credit market, a substantial increase in corporate default rates, an increase in competition from new entrants providing capital to the private debt market and a decrease in recovery rates of directly originated private credit could adversely affect our ability to source investments with attractive risk-adjusted returns. |
• | The attractiveness of our product offering to investors. We believe defined contribution plans, retail investors, public institutional investors, pension funds, endowments, sovereign wealth funds and insurance companies are increasing exposure to directly originated private credit investment products to seek differentiated returns and current yield. Our permanent capital vehicles and long-dated private funds and SMAs benefit from this demand by offering institutional and retail investors the ability to invest in our private credit investment strategy. We believe that the breadth, diversity and number of investment vehicles we offer allow us to maximize our reach with investors. |
• | The strength of our investment process, operating platform and client servicing capabilities. Following the most recent financial crisis, investors in alternative investments, including those managed by us, have heightened their focus on matters such as manager due diligence, reporting transparency and compliance infrastructure. Since inception, we have invested heavily in our investment monitoring systems, compliance and enterprise risk management systems to proactively address investor expectations and the evolving regulatory landscape. We believe these investments in operating infrastructure will continue to support our growth in AUM. |
45
Components of Our Results of Operations
Management Fees. Management fees include both base management fees as well as Part I incentive fees.
• | Base Management Fees. Base management fees are generally based on a defined percentage of (i) average or total gross assets, including assets acquired with leverage, (ii) total commitments, (iii) net invested capital, (iv) NAV or (v) lower of cost or market value of a fund’s portfolio investments. These fees are calculated quarterly and are paid in cash in advance or in arrears. Base management fees are recognized as revenue in the period advisory services are rendered, subject to our assessment of collectability. |
In addition, we also receive non asset-based management fees that may include special fees such as origination fees, transaction fees and similar fees paid to us in connection with portfolio investments of our funds. These fees are specific to particular transactions and the contractual terms of the portfolio investments, and are recognized when earned.
• | Part I Incentive Fees. We also include Part I incentive fees that we receive from our permanent capital vehicles and certain of our long-dated private funds in management fees. Part I incentive fees are paid quarterly, in cash, and are driven primarily by net interest income on senior secured loans. As it relates to MCC, these fees are subject to netting against realized and unrealized losses. We are primarily an asset manager of yield-oriented products and our incentive fees are primarily derived from spread income rather than trading or capital gains. In addition, we also carefully manage interest rate risk. We are generally positioned to benefit from a raising rate environment, which should benefit fees paid to us from our vehicles and funds. |
Performance Fees. Our long-dated private funds and SMAs may have industry standard carried interest performance fee structures and are typically 15% to 20% of the total return over a 6.0% to 8.0% annualized preferred return. We record these fees on an accrual basis, to the extent such amounts are contractually due but not paid, and we present this revenue as a separate line item on our consolidated statements of operations. These fees are subject to repayment (clawback).
The timing and amount of performance fees generated by our funds is uncertain. If we were to have a realization event in a particular quarter or year, it may have a significant impact on our results for that particular quarter or year that may not be replicated in subsequent periods. Refer to “Risk Factors — Risks Related to Our Business and Industry” included in this Annual Report on Form 10-K.
Generally, if at the termination of a fund (and sometimes at interim points in the life of a fund), the fund has not achieved investment returns that (in most cases) exceed the preferred return threshold or (in all cases) the general partner receives net profits over the life of the fund in excess of its allocable share under the applicable partnership agreement, we will be obligated to repay an amount equal to the extent to which carried interest that was previously distributed to us exceeds the amounts to which we are ultimately entitled. Medley has not received any distributions of performance fees through December 31, 2017, other than tax distributions, a portion of which are subject to clawback. As of December 31, 2017, we accrued $7.2 million for clawback obligations that would need to be paid if the funds were liquidated at fair value at the end of the reporting period. Our actual obligation, however, would not become payable or realized until the end of a fund’s life.
For any given period, performance fee revenue on our consolidated statements of operations may include reversals of previously recognized performance fees due to a decrease in the value of a particular fund that results in a decrease of cumulative performance fees earned to date. Since fund return hurdles are cumulative, previously recognized fees also may be reversed in a period of appreciation that is lower than the particular fund's hurdle rate. During the year ended December 31, 2017, we reversed $2.6 million of previously recognized performance fees. During the year ended December 31, 2016, the Company did not reverse previously recognized performance fees. During the year ended December 31, 2015, the Company reversed $24.0 million of previously recognized performance fees. Cumulative performance fee revenue recognized as of December 31, 2017, was $5.3 million.
• | Part II Incentive Fees. For our permanent capital vehicles and certain of our long-dated private funds, Part II incentive fees generally represent 20.0% of each fund’s cumulative realized capital gains (net of realized capital losses and unrealized capital depreciation). We have not received these fees historically, and do not expect such fees to be material in the future given our focus on senior secured lending. |
Other Revenues and Fees. We provide administrative services to certain of our vehicles that are reported as other revenues and fees. Such fees are recognized as revenue in the period that administrative services are rendered. These fees are generally based on expense reimbursements for the portion of overhead and other expenses incurred by certain professionals directly attributable to each respective fund. These fees are reported within total revenues in our consolidated financial statements included in this Form 10-K.
46
In certain cases, the entities that receive management and incentive fees from our funds are owned by Medley LLC together with other persons. See “Critical Accounting Policies” and Note 2, “Summary of Significant Accounting Policies,” to our consolidated financial statements included in this Form 10-K for additional information regarding the manner in which management fees, performance fees and other fees are generated.
Expenses
Compensation and Benefits. Compensation and benefits consists primarily of salaries, discretionary bonuses and benefits paid and payable to our employees. Compensation also includes stock-based compensation associated with the grants of equity-based awards to our employees. Compensation expense relating to equity based awards are measured at fair value as of the grant date, reduced for actual forfeitures when they occur, and expensed over the vesting period on a straight-line basis. Bonuses are accrued over the service period to which they relate.
Guaranteed payments made to our senior professionals who are members of Medley LLC are recognized as compensation expense. The guaranteed payments to our Co-Chief Executive Officers are performance based and periodically set subject to maximums based on our total assets under management. Such maximums aggregated to $2.5 million for each of the Co-Chief Executive Officers for the years ended December 31, 2017, 2016 and 2015. During the years ended December 31, 2017, 2016 and 2015, neither of our Co-Chief Executive Officers received any guaranteed payments.
Performance Fee Compensation. Performance fee compensation includes compensation related to performance fees, which generally consists of profit interests that we grant to our employees. Depending on the nature of each fund, the performance fee participation is generally structured as a fixed percentage or as an annual award. The liability is recorded subject to the vesting of the profit interests granted and is calculated based upon the net present value of the projected performance fees to be received. Payments to profit interest holders are payable when the performance fees are paid to Medley LLC by the respective fund. It is possible that we may record performance fee compensation during a period in which we do not record any performance fee revenue or we have a reversal of previously recognized performance fee revenue.
General, Administrative and Other Expenses. General and administrative expenses include costs primarily related to professional services, office rent, depreciation and amortization, general insurance, recruiting, travel and related expenses, information technology, communication and information services, other general operating items and, in 2016 and 2015, SIC expenses under an expense support and reimbursement agreement.
Other Income (Expense)
Dividend Income. Dividend income consists of dividends associated with our investments in SIC and MCC. Dividends are recognized on an accrual basis to the extent that such amounts are declared and expected to be collected.
Interest Expense. Interest expense consists primarily of interest expense relating to debt incurred by us.
Other Income (Expenses), Net. Other income (expenses), net consists primarily of expenses associated with our revenue share payable, equity income (loss) and unrealized gains (losses) associated with our equity method investments.
Provision for Income Taxes. Medley Management Inc. is subject to U.S. federal, state and local corporate income taxes on its allocable portion of taxable income from Medley LLC at prevailing corporate tax rates. Medley LLC and its subsidiaries are not subject to U.S. federal, state and local corporate income taxes since all of its income or losses are passed through to its members. However, Medley LLC and its subsidiaries are subject to New York City’s unincorporated business tax on its taxable income allocated to New York City. Our effective income tax rate is dependent on many factors, including the impact of nondeductible items and a rate benefit attributable to the fact that a portion of our earnings are not subject to corporate level taxes.
Deferred tax assets and liabilities are recognized for the future tax consequences attributable to differences between the financial statements carrying amounts of existing assets and liabilities and their respective tax basis. Deferred tax assets and liabilities are measured using enacted tax rates expected to apply to taxable income in the years in which those temporary differences are expected to be recovered or settled. To the extent it is more likely than not that the deferred tax assets will not be recognized, a valuation allowance is provided to offset their benefit.
We recognize the benefit of an income tax position only if it is more likely than not that the tax position will be sustained upon tax examination, based solely on the technical merits of the tax position. Otherwise, no benefit is recognized. The tax benefits recognized are measured based on the largest benefit that has a greater than 50% percent likelihood of being realized upon ultimate settlement. Interest expense and penalties related to income tax matters are recognized as a component of the provision for income taxes.
On December 22, 2017, the U.S. government enacted the Tax Cuts and Jobs Act (the “Tax Act”). The Tax Act includes significant changes to the U.S. corporate income tax system including: a federal corporate rate reduction from 34% to 21%;
47
limitations on the deductibility of interest expense and executive compensation; and the transition of U.S. international taxation from a worldwide tax system to a modified territorial tax system. Changes under the Tax Act are effective for us as of January 1, 2018.
ASC 740, Income Taxes, requires us to remeasure our deferred tax assets and liabilities as of the date of enactment, with the resulting tax effects accounted for in the reporting period of enactment. Based on the reduction of the corporate income tax rate, we re-measured our deferred tax assets and liabilities based on the rates at which they are expected to to be utilized in the future. The impact of this change resulted in a $0.3 million decrease in our deferred tax asset balance and corresponding increase in the provision for income taxes for the year ended December 31, 2017.
Net Income Attributable to Redeemable Non-Controlling Interests and Non-Controlling Interests in Consolidated Subsidiaries. Net income attributable to redeemable non-controlling interests and non-controlling interests in consolidated subsidiaries represents the ownership interests that third parties hold in certain consolidated subsidiaries.
Net Income Attributable to Non-Controlling Interests in Medley LLC. Net income attributable to non-controlling interests in Medley LLC represents the ownership interests that non-managing members’ hold in Medley LLC.
Our private funds are closed-end funds, and accordingly do not permit investors to redeem their interests other than in limited circumstances that are beyond our control, such as instances in which retaining the limited partnership interest could cause the limited partner to violate a law, regulation or rule. In addition, SMAs for a single investor may allow such investor to terminate the investment management agreement at the discretion of the investor pursuant to the terms of the applicable documents. We manage assets for MCC and SIC, both of which are BDCs. The capital managed by MCC and SIC is permanently committed to these funds and cannot be redeemed by investors.
Managing Business Performance
Non-GAAP Financial Information
In addition to analyzing our results on a GAAP basis, management also makes operating decisions and assesses business performance based on the financial and operating metrics and data that are presented without the consolidation of any fund(s). Core Net Income, Core EBITDA, Core Net Income Per Share and Core Net Income Margin are non-GAAP financial measures that are used by management to assess the performance of our business. There are limitations associated with the use of non-GAAP financial measures as compared to the use of the most directly comparable U.S. GAAP financial measure and these measures supplement and should be considered in addition to and not in lieu of the results of operations discussed further under "Results of Operations,’’ which are prepared in accordance with U.S. GAAP. Furthermore, such measures may be inconsistent with measures presented by other companies. For a reconciliation of these measures to the most comparable measure in accordance with U.S. GAAP, see "Reconciliation of Certain Non-GAAP Performance Measures to Consolidated U.S. GAAP Financial Measures.’’
Core Net Income. Core Net Income is an income measure that is used by management to assess the performance of our business through the removal of non-core items, as well as non-recurring expenses associated with our IPO. It is calculated by adjusting net income attributable to Medley Management Inc. and net income attributable to non-controlling interests in Medley LLC to exclude reimbursable expenses associated with the launch of funds, amortization of stock-based compensation expense associated with grants of restricted stock units at the time of our IPO, other non-core items and the income tax impact of these adjustments.
Core Earnings Before Interest, Income Taxes, Depreciation and Amortization (Core EBITDA). Core EBITDA is an income measure also used by management to assess the performance of our business. Core EBITDA is calculated as Core Net Income before interest expense, income taxes, depreciation and amortization.
Pro-Forma Weighted Average Shares Outstanding. The calculation of Pro-Forma Weighted Average Shares Outstanding assumes the conversion by the pre-IPO holders of 23,333,333 Medley LLC units for 23,333,333 shares of Class A common stock at the beginning of each period presented, as well as the vesting of the weighted average number of restricted stock units and, in 2017, the conversion of 320,000 restricted LLC units for an equal number of shares of Class A common stock.
Core Net Income Per Share. Core Net Income Per Share is Core Net Income adjusted for corporate income taxes assuming that all of our pre-tax earnings are subject to federal, state and local corporate income taxes, divided by Pro-Forma Weighted Average Shares Outstanding (as defined above). In determining corporate income taxes we used an annual effective corporate tax rate of 43.0%. Please refer to the calculation of Core Net Income Per Share in “ Reconciliation of Certain Non-GAAP Performance Measures to Consolidated U.S. GAAP Financial Measures.”
Core Net Income Margin. Core Net Income Margin equals Core Net Income Per Share divided by total revenue per share.
48
Key Performance Indicators
When we review our performance we focus on the indicators described below:
For the Years Ended December 31, | |||||||||||
2017 | 2016 | 2015 | |||||||||
(Amounts in thousands, except AUM, share and per share amounts) | |||||||||||
Consolidated Financial Data: | |||||||||||
Net income attributable to Medley Management Inc. and non-controlling interests in Medley LLC | $ | 10,591 | $ | 7,403 | $ | 21,517 | |||||
Net income per Class A common stock | $ | 0.07 | $ | 0.02 | $ | 0.46 | |||||
Net Income Margin (1) | 16.2 | % | 9.7 | % | 31.9 | % | |||||
Weighted average shares - Basic and Diluted | 5,553,026 | 5,804,042 | 6,002,422 | ||||||||
Non-GAAP Data: | |||||||||||
Core Net Income | $ | 15,090 | $ | 25,531 | $ | 29,747 | |||||
Core EBITDA | $ | 29,226 | $ | 38,481 | 41,721 | ||||||
Core Net Income Per Share | $ | 0.33 | $ | 0.54 | $ | 0.61 | |||||
Core Net Income Margin | 15.5 | % | 21.7 | % | 27.7 | % | |||||
Pro-Forma Weighted Average Shares Outstanding | 30,851,882 | 30,689,412 | 30,459,958 | ||||||||
Other Data (at period end, in millions): | |||||||||||
AUM | $ | 5,198 | $ | 5,335 | $ | 4,779 | |||||
Fee Earning AUM | $ | 3,158 | $ | 3,190 | 3,302 | ||||||
(1) | Net Income Margin equals Net income attributable to Medley Management Inc. and non-controlling interests in Medley LLC divided by total revenue. |
49
AUM
AUM refers to the assets of our funds. We view AUM as a metric to measure our investment and fundraising performance as it reflects assets generally at fair value plus available uncalled capital. For our funds, our AUM equals the sum of the following:
• | Gross asset values or NAV of such funds; |
• | the drawn and undrawn debt (at the fund-level, including amounts subject to restrictions); and |
• | uncalled committed capital (including commitments to funds that have yet to commence their investment periods). |
The table below provides the roll forward of AUM.
% of AUM | |||||||||||||||||
Permanent Capital Vehicles | Long-dated Private Funds and SMAs | Total | Permanent Capital Vehicles | Long-dated Private Funds and SMAs | |||||||||||||
(Dollars in millions) | |||||||||||||||||
Beginning balance, December 31, 2014 | $ | 2,253 | $ | 1,429 | $ | 3,682 | 61 | % | 39 | % | |||||||
Commitments (1) | 485 | 874 | 1,359 | ||||||||||||||
Capital reduction (2) | (23 | ) | (17 | ) | (40 | ) | |||||||||||
Distributions (3) | (137 | ) | (75 | ) | (212 | ) | |||||||||||
Change in fund value (4) | (32 | ) | 22 | (10 | ) | ||||||||||||
Ending balance, December 31, 2015 | $ | 2,546 | $ | 2,233 | $ | 4,779 | 53 | % | 47 | % | |||||||
Commitments (1) | 33 | 858 | 891 | ||||||||||||||
Capital reduction (2) | (12 | ) | — | (12 | ) | ||||||||||||
Distributions (3) | (125 | ) | (315 | ) | (440 | ) | |||||||||||
Change in fund value (4) | 85 | 32 | 117 | ||||||||||||||
Ending balance, December 31, 2016 | $ | 2,527 | $ | 2,808 | $ | 5,335 | 47 | % | 53 | % | |||||||
Commitments (1) | (7 | ) | 254 | 247 | |||||||||||||
Capital reduction (2) | (44 | ) | — | (44 | ) | ||||||||||||
Distributions (3) | (100 | ) | (175 | ) | (275 | ) | |||||||||||
Change in fund value (4) | (39 | ) | (26 | ) | (65 | ) | |||||||||||
Ending balance, December 31, 2017 | $ | 2,337 | $ | 2,861 | $ | 5,198 | 45 | % | 55 | % | |||||||
(1) | With respect to permanent capital vehicles, represents increases during the period through equity and debt offerings, subject to restrictions, as well as any increases in available undrawn borrowings or capital commitments. With respect to long-dated private funds and SMAs, represents new commitments or gross inflows, respectively, as well as any increases in available undrawn borrowings. |
(2) | Represents the permanent reduction in equity or leverage during the period. |
(3) | With respect to permanent capital vehicles, represents distributions of income. With respect to long-dated private funds and SMAs, represents return of capital, given our funds’ stage in their respective life cycle and the prioritization of capital distributions. |
(4) | Includes interest income, realized and unrealized gains (losses), fees and/or expenses. |
AUM was $5.2 billion as of December 31, 2017 compared to $5.3 billion of AUM as of December 31, 2016. Our permanent capital vehicles decreased by $190.0 million as of December 31, 2017, primarily due to distributions and realized and unrealized losses. Our long-dated private funds and SMAs increased AUM by $53.0 million, or 2%, primarily associated with new debt commitments, partly offset by distributions as some of our vehicles are no longer in the investment period.
AUM increased by $556.0 million, or 12%, to $5.3 billion as of December 31, 2016 compared to AUM of $4.8 billion as of December 31, 2015. Our permanent capital vehicles remained consistent at $2.5 billion as of December 31, 2016. Our long-dated private funds and SMAs increased AUM by $575.0 million, or 26%, primarily associated with new capital commitments from our long-dated private funds and SMAs, partly offset by distributions by our long-dated private funds and SMAs as some of our vehicles are no longer in the investment period.
AUM increased by $1.1 billion, or 30%, to $4.8 billion as of December 31, 2015 compared to AUM as of December 31,
50
2014. Our permanent capital vehicles increased AUM by $293.0 million, or 13%, primarily associated with new equity issuances at SIC and increased leverage capacity at both MCC and SIC during the period. Our long-dated private funds and SMAs increased AUM by $804.0 million, or 56%, primarily associated with new capital commitments from our SMAs.
Fee Earning AUM
Fee earning AUM refers to assets under management on which we directly earn base management fees. We view fee earning AUM as a metric to measure changes in the assets from which we earn management fees. Our fee earning AUM is the sum of all the individual fee earning assets of our funds that contribute directly to our management fees and generally equals the sum of:
• | for our permanent capital vehicles, the average or total gross asset value, including assets acquired with the proceeds of leverage (see “Fee earning AUM based on gross asset value” in the “Components of Fee Earning AUM” table below for the amount of this component of fee earning AUM as of each period); |
• | for certain funds within the investment period in the long-dated private funds, the amount of limited partner capital commitments (see “Fee earning AUM based on capital commitments” in the “Components of Fee Earning AUM” table below for the amount of this component of fee earning AUM as of each period); and |
• | for the aforementioned funds beyond the investment period and certain managed accounts within their investment period, the amount of limited partner invested capital or the NAV of the fund (see “Fee earning AUM based on invested capital or NAV” in the “Components of Fee Earning AUM” table below for the amount of this component of fee earning AUM as of each period). |
Our calculations of fee earning AUM and AUM may differ from the calculations of other asset managers and, as a result, this measure may not be comparable to similar measures presented by others. In addition, our calculations of fee earning AUM and AUM may not be based on any definition of fee earning AUM or AUM that is set forth in the agreements governing the investment funds that we advise.
Components of Fee Earning AUM
As of December 31, | |||||||
2017 | 2016 | ||||||
(Amounts in millions) | |||||||
Fee earning AUM based on gross asset value | $ | 2,090 | $ | 2,207 | |||
Fee earning AUM based on capital commitments | 126 | 113 | |||||
Fee earning AUM based on invested capital or NAV | 942 | 870 | |||||
Total fee earning AUM | $ | 3,158 | $ | 3,190 | |||
As of December 31, 2017, fee earning AUM based on gross asset value decreased by $117.0 million, compared to December 31, 2016. The decrease in fee earning AUM based on gross asset value was due primarily to distributions.
As of December 31, 2017, fee earning AUM based on capital commitments increased $13.0 million compared to December 31, 2016. The increase in fee earning AUM based on capital commitments was due to the launch of a new fund in 2017.
As of December 31, 2017, fee earning AUM based on invested capital or NAV increased by $72.0 million, or 8%, compared to December 31, 2016. The increase in fee earning AUM based on invested capital or NAV was due primarily to capital deployment from our long-dated private funds and SMAs, partially offset by distributions of income and return of capital by our long-dated private funds and SMAs as some of our vehicles are no longer in the investment period.
51
The table below presents the roll forward of fee earning AUM.
% of Fee Earning AUM | |||||||||||||||||
Permanent Capital Vehicles | Long-dated Private Funds and SMAs | Total | Permanent Capital Vehicles | Long-dated Private Funds and SMAs | |||||||||||||
(Dollars in millions) | |||||||||||||||||
Beginning balance, December 31, 2014 | $ | 2,047 | $ | 1,011 | $ | 3,058 | 67 | % | 33 | % | |||||||
Commitments (1) | 383 | 221 | 604 | ||||||||||||||
Capital reduction (2) | (23 | ) | (17 | ) | (40 | ) | |||||||||||
Distributions (3) | (137 | ) | (95 | ) | (232 | ) | |||||||||||
Change in fund value (4) | (32 | ) | (56 | ) | (88 | ) | |||||||||||
Ending balance, December 31, 2015 | $ | 2,238 | $ | 1,064 | $ | 3,302 | 68 | % | 32 | % | |||||||
Commitments (1) | 22 | 194 | 216 | ||||||||||||||
Capital reduction (2) | (12 | ) | — | (12 | ) | ||||||||||||
Distributions (3) | (126 | ) | (285 | ) | (411 | ) | |||||||||||
Change in fund value (4) | 85 | 10 | 95 | ||||||||||||||
Ending balance, December 31, 2016 | $ | 2,207 | $ | 983 | $ | 3,190 | 69 | % | 31 | % | |||||||
Commitments (1) | 22 | 308 | 330 | ||||||||||||||
Capital reduction (2) | — | — | — | ||||||||||||||
Distributions (3) | (100 | ) | (178 | ) | (278 | ) | |||||||||||
Change in fund value (4) | (39 | ) | (45 | ) | (84 | ) | |||||||||||
Ending balance, December 31, 2017 | $ | 2,090 | $ | 1,068 | $ | 3,158 | 66 | % | 34 | % | |||||||
(1) | With respect to permanent capital vehicles, represents increases or temporary reductions during the period through equity and debt offerings, as well as any increases in capital commitments. With respect to long-dated private funds and SMAs, represents new commitments or gross inflows, respectively. |
(2) | Represents the permanent reduction in equity or leverage during the period. |
(3) | Represents distributions of income, return of capital and return of portfolio investment capital to the fund. |
(4) | Includes interest income, realized and unrealized gains (losses), fees and/or expenses. |
Total fee earning AUM decreased by $32.0 million, or 1%, to $3.2 billion as of December 31, 2017 compared to December 31, 2016, due primarily to distributions from all permanent capital vehicles and private funds and SMAs and realized and unrealized losses within our fund portfolios, partly offset by capital deployment by our private funds and SMAs.
Total fee earning AUM decreased by $112.0 million, or 3%, to $3.0 billion as of December 31, 2016 compared to total fee earning AUM as of December 31, 2015, due primarily to distributions of income and return of capital by our long-dated private funds and SMAs as some of our vehicles are no longer in the investment period.
Total fee earning AUM increased by $243.0 million, or 8%, to $3.3 billion as of December 31, 2015 compared to total fee earning AUM as of December 31, 2014 and was due primarily to increased commitments from SIC and SMAs.
Returns
The following section sets forth historical performance for our active funds.
Sierra Income Corporation (SIC)
We launched SIC, our first public non-traded permanent capital vehicle, in April 2012. SIC primarily focuses on direct lending to middle market borrowers in the U.S. Since inception, we have provided capital for a total of 353 investments and have invested a total of $2.1 billion. As of December 31, 2017, fee earning AUM was $1.2 billion. The performance for SIC as of December 31, 2017 is summarized below:
Annualized Net Total Return(1): | 5.7 | % |
Annualized Realized Losses on Invested Capital: | 0.8 | % |
Average Recovery(3): | 72.6 | % |
52
Medley Capital Corporation (MCC)
We launched MCC, our first permanent capital vehicle in January 2011. MCC primarily focuses on direct lending to private middle market borrowers in the U.S. Since inception, we have provided capital for a total of 208 investments and have invested a total of $2.1 billion. As of December 31, 2017, excluding Medley SBIC LP, fee earning AUM was $672 million. The performance for MCC as of December 31, 2017 is summarized below:
Annualized Net Total Return(2): | 5.9 | % |
Annualized Realized Losses on Invested Capital: | 2.0 | % |
Average Recovery(3): | 45.0 | % |
Medley SBIC LP (Medley SBIC)
We launched Medley SBIC in March 2013 as a wholly owned subsidiary of MCC. Medley SBIC lends to smaller middle market private borrowers that we otherwise would not target in our other funds, due primarily to size. Since inception, we have provided capital for a total of 45 investments and have invested a total of $442 million. As of December 31, 2017, fee earning AUM was $228 million. The performance for Medley SBIC fund as of December 31, 2017 is summarized below:
Gross Portfolio Internal Rate of Return(4): | 10.8 | % |
Net Investor Internal Rate of Return(5): | 15.4 | % |
Annualized Realized Losses on Invested Capital: | — | % |
Average Recovery: | N/A | |
Medley Opportunity Fund II LP (MOF II)
MOF II is a long-dated private investment fund that we launched in December 2010. MOF II lends to middle market private borrowers, with a focus on providing senior secured loans. Since inception, we have provided capital for a total of 75 investments and have invested a total of $926 million. As of December 31, 2017, fee earning AUM was $324 million. MOF II is currently fully invested and actively managing its assets. The performance for MOF II as of December 31, 2017, is summarized below:
Gross Portfolio Internal Rate of Return(4): | 10.7 | % |
Net Investor Internal Rate of Return(6): | 5.5 | % |
Annualized Realized Losses on Invested Capital: | 1.7 | % |
Average Recovery(3): | NM | |
Medley Opportunity Fund III LP (MOF III)
MOF III is a long-dated private investment fund that we launched in December 2014. MOF III lends to middle market private borrowers in the U.S., with a focus on providing senior secured loans. Since inception, we have provided capital for a total of 43 investments and have invested a total of $186 million. As of December 31, 2017, fee earning AUM was $113 million. The performance for MOF III as of December 31, 2017 is summarized below:
Gross Portfolio Internal Rate of Return(4): | 11.7 | % |
Net Investor Internal Rate of Return(6): | 6.0 | % |
Annualized Realized Losses on Invested Capital: | — | % |
Average Recovery: | N/A | |
Other Long-Dated Private Funds and Permanent Capital Vehicles
We launched STRF, a public non-traded permanent capital vehicle, in June 2017. The Fund seeks to provide a total return through a combination of current income and long-term capital appreciation by investing in a portfolio of debt securities and fixed-income related equity securities.
We launched MOF III Offshore in May 2017. MOF III Offshore invests in senior secured loans made to middle market private borrowers in the US.
We launched Aspect in November 2016 to meet the current demand for equity capital solutions in the traditional corporate debt-backed collateralized loan obligation (“CLO”) market. Its investment objective is to generate current income, and also to generate capital appreciation through investing in CLO equity, as well as, equity and junior debt tranches trading in the secondary market.
53
We launched MCOF in July 2016 to meet the current demand for equity capital solutions in the traditional corporate debt-backed collateralized loan obligation (“CLO”) market. Its investment objective is to generate current income, and also to generate capital appreciation through investing in CLO equity, as well as, equity and junior debt tranches trading in the secondary market.
The performance of STRF, MOF III Offshore, Aspect, and MCOF as of December 31, 2017 is not meaningful given the funds' limited operations and capital invested to date.
Separately Managed Accounts (SMAs)
In the case of our SMAs, the investor, rather than us, may control the assets or investment vehicle that holds or has custody of the related investments. Certain subsidiaries of Medley LLC serve as the investment adviser for our SMAs. Since inception, we have provided capital for a total of 171 investments and have invested a total of $962 million. As of December 31, 2017, fee earning AUM in our SMAs was $543 million. The aggregate performance of our SMAs as of December 31, 2017, is summarized below:
Gross Portfolio Internal Rate of Return(4): | 9.3 | % |
Net Investor Internal Rate of Return(7): | 7.4 | % |
Annualized Realized Losses on Invested Capital: | 0.7 | % |
Average Recovery(3): | 49.5 | % |
(1) | Annualized Net Total Return for SIC represents the annualized return assuming an investment at the initial public offering price, reinvestments of all dividends and distributions at prices obtained under SIC’s dividend reinvestment plan and selling at the NAV as of the measurement date. |
(2) | Annualized Net Total Return for MCC, including Medley SBIC, represents the annualized return assuming an investment at the initial public offering price, reinvestments of all dividends and distributions at prices obtained under MCC's dividend reinvestment plan and selling at NAV as of the measurement date. |
(3) | Average Recovery includes only those realized investments in which we experience a loss of principal on a cumulative cash flow basis and is calculated by dividing the total actual cash inflows for each respective investment, including all interest, principal and fee note repayments, dividends and transactions fees, if applicable, by the total actual cash outflows for each respective investment. For MOF II, we have presented the Average Recovery as “NM” or “Not Meaningful” because we believe the number of realized losses for each respective vehicle is not sufficient to provide an accurate representation of the expected Average Recovery for each vehicle. |
(4) | For Medley SBIC, MOF II, MOF III, and SMAs, the Gross Portfolio Internal Rate of Return represents the cumulative investment performance from inception of each respective fund through December 31, 2017. The Gross Portfolio Internal Rate of Return includes both realized and unrealized investments and excludes the impact of base management fees, incentive fees and other fund related expenses. For realized investments, the investment returns were calculated based on the actual cash outflows and inflows for each respective investment and include all interest, principal and fee note repayments, dividends and transactions fees, if applicable. For unrealized investments, the investment returns were calculated based on the actual cash outflows and inflows for each respective investment and include all interest, principal and fee note repayments, dividends and transactions fees, if applicable. The investment return assumes that the remaining unrealized portion of the investment is realized at the investment’s most recent fair value, as calculated in accordance with U.S. GAAP. There can be no assurance that the investments will be realized at these fair values and actual results may differ significantly. |
(5) | Earnings from Medley SBIC are paid to MCC. The Net Internal Rate of Return for Medley SBIC was calculated based upon i) the actual cash contribution and distributions to/from MCC and Medley SBIC ii) an allocable portion of MCC’s management and incentive fees and general fund related expenses and iii) assumes the NAV as of the measurement date is distributed to MCC. As of December 31, 2017, Medley SBIC Net Internal Rate of Return as described above assuming only the inclusion of management fees was 15.7%. |
(6) | Net Investor Internal Rate of Return for MOF II and MOF III was calculated net of all management fees and carried interest allocation since inception and was computed based on the actual dates of capital contributions and the ending aggregate partners’ capital at the end of the period. |
(7) | Net Investor Internal Rate of Return for our SMAs was calculated using the Gross Portfolio Internal Rate of Return, as described in note 4, and includes the actual management fees, incentive fees and general fund related expenses. |
54
Results of Operations
The following table and discussion sets forth information regarding our consolidated results of operations for the years ended December 31, 2017, 2016 and 2015. The audited consolidated financial statements of Medley have been prepared on substantially the same basis for all historical periods presented.
For the Years Ended December 31, | |||||||||||
2017 | 2016 | 2015 | |||||||||
(Amounts in thousands, except AUM data) | |||||||||||
Revenues | |||||||||||
Management fees | $ | 58,104 | $ | 65,496 | $ | 75,675 | |||||
Performance fees | (1,744 | ) | 2,421 | (15,685 | ) | ||||||
Other revenues and fees | 9,201 | 8,111 | 7,436 | ||||||||
Total Revenues | 65,561 | 76,028 | 67,426 | ||||||||
Expenses | |||||||||||
Compensation and benefits | 27,432 | 27,800 | 26,768 | ||||||||
Performance fee compensation | (874 | ) | (319 | ) | (8,049 | ) | |||||
General, administrative and other expenses | 13,045 | 28,540 | 16,836 | ||||||||
Total Expenses | 39,603 | 56,021 | 35,555 | ||||||||
Other Income (Expense) | |||||||||||
Dividend income | 4,327 | 1,304 | 886 | ||||||||
Interest expense | (11,855 | ) | (9,226 | ) | (8,469 | ) | |||||
Other income (expense), net | 835 | (1,070 | ) | (1,641 | ) | ||||||
Total Other Expense, Net | (6,693 | ) | (8,992 | ) | (9,224 | ) | |||||
Income before income taxes | 19,265 | 11,015 | 22,647 | ||||||||
Provision for income taxes | 1,956 | 1,063 | 2,015 | ||||||||
Net Income | 17,309 | 9,952 | 20,632 | ||||||||
Net income attributable to redeemable non-controlling interests and non-controlling interests in consolidated subsidiaries | 6,718 | 2,549 | (885 | ) | |||||||
Net income attributable to non-controlling interests in Medley LLC | 9,664 | 6,406 | 18,406 | ||||||||
Net Income Attributable to Medley Management Inc. | $ | 927 | $ | 997 | $ | 3,111 | |||||
Other data (at period end, in millions): | |||||||||||
AUM | $ | 5,198 | $ | 5,335 | $ | 4,779 | |||||
Fee earning AUM | $ | 3,158 | $ | 3,190 | $ | 3,302 | |||||
Year Ended December 31, 2017 Compared to Year Ended December 31, 2016
Revenues
Management Fees. Total management fees decreased by $7.4 million, or 11%, to $58.1 million for the year ended December 31, 2017 compared to the year ended December 31, 2016.
• | Our management fees from permanent capital vehicles decreased by $9.4 million during the year ended December 31, 2017 compared to 2016. The decrease was due primarily to a decline in Part I incentive fees of $4.6 million from SIC and $4.9 million from MCC, offset in part, by an increase in base management fees from SIC. |
• | Our management fees from long-dated private funds and SMAs increased by $2.0 million for the year ended December 31, 2017, compared to 2016. The increase was due primarily to an increase in base management fees from our SMAs. |
55
Performance Fees. There was a reversal of performance fees of $1.7 million during the year ended December 31, 2017 compared to an accrual of performance fees revenue of $2.4 million in 2016. The variance was attributed primarily to reversals of previously recognized performance fees as a result of declines in the underlying fund values of our SMAs.
Other Revenues and Fees. Other revenues and fees increased by $1.1 million, or 13%, to $9.2 million for the year ended December 31, 2017 compared to 2016. The increase was due primarily to an increase in loan administrative and transaction fees as well as administrative fees from our permanent capital vehicles and other private funds.
Expenses
Compensation and Benefits. Compensation and benefits decreased by $0.4 million, or 1% to $27.4 million for the year ended December 31, 2017 compared to 2016. The variance was due primarily to a decrease in stock compensation expense of $1.1 million as a result of forfeited RSUs as well as lower discretionary compensation accruals of $0.3 million, partly offset by an increase in severance charges of $1.0 million.
Performance Fee Compensation. There was a reversal in performance fee compensation of $0.9 million during the year ended December 31, 2017 as compared to a reversal of performance fee compensation of $0.3 million during 2016. The variance in performance fee compensation was due primarily to changes in projected future payments of $0.9 million.
General, Administrative and Other Expenses. General, administrative and other expenses decreased by $15.5 million to $13.0 million for the year ended December 31, 2017 compared to 2016. The decrease was due primarily to a $16.1 million decrease in expense support agreement expenses related to SIC and $0.5 million decrease in professional fees. The expense support agreement with SIC expired on December 31, 2016, as such, we are no longer responsible for expenses under the expense support agreement relating to SIC. The decreases in these expenses were offset, in part, by expenses related to our consolidated fund, STRF.
Other Income (Expense)
Dividend Income. Dividend income increased by $3.0 million to $4.3 million for the year ended December 31, 2017 compared to 2016. The increase was due primarily to dividend income from our investment in available for sale securities attributed to additional purchases made during 2017.
Interest Expense. Interest expense increased by $2.6 million, or 28%, to $11.9 million for the year ended December 31, 2017 compared to the same period in 2016. The increase was primarily due to an acceleration of amortization of debt issuance costs and discount relating to prepayments made on our Term Loan Facility as a result of the refinancing of our indebtedness from the issuance of senior unsecured debt. In addition, our average debt outstanding during the year ended December 31, 2017 and 2016 was $127.8 million and $106.0 million, respectively.
Other Income (Expenses), net. Other income (expenses), net increased by $1.9 million to $0.8 million for the year ended December 31, 2017 compared to 2016. The increase was due primarily to the impact of revaluation of our revenue share payable and a nonrecurring impairment charge taken during the year ended December 31, 2016 on our investment in CK Pearl Fund LLC.
Provision for Income Taxes
Our effective income tax rate was 10.2% and 9.7% for the years ended December 31, 2017 and 2016, respectively. Our tax rate is affected by recurring items, such as permanent differences and income allocated to certain redeemable non-controlling interests which is not subject to U.S. federal, state and local corporate income taxes. The increase in the effective tax rate during the year ended December 31, 2017 as compared to 2016 was due primarily to the impact of discrete items associated with the vesting and forfeiture of RSUs as well as the re-measurement our deferred tax asset balance as a result the enactment of the Tax Act offset, in part, by an increase in taxable income allocable to certain redeemable non-controlling interests which is not subject to corporate level income taxes.
Redeemable Non-Controlling Interests and Non-Controlling Interests in Consolidated Subsidiaries
Net income attributable to redeemable non-controlling interests and non-controlling interests in consolidated subsidiaries increased by $4.2 million to $6.7 million for the year ended December 31, 2017 compared to 2016. The increase was due primarily to an increase in dividend income earned and allocated to DB MED Investor I LLC, a third party, based on its preferred ownership interests held in one of our consolidated subsidiaries as well as income allocated to SC Distributors LLC for its interests in SIC Advisors.
Year Ended December 31, 2016 Compared to Year Ended December 31, 2015
Revenues
Management Fees. Total management fees decreased by $10.2 million, or 13%, to $65.5 million for the year ended December 31, 2016 compared to the year ended December 31, 2015.
56
• | Our management fees from permanent capital vehicles decreased by $8.1 million for the year ended December 31, 2016 compared to 2015. Management fees from SIC increased by $7.6 million due to an increase in Part I incentive fees and an 16% increase in average fee earning AUM for the year ended December 31, 2016 compared to2015. Management fees from MCC decreased by $15.7 million due to a decrease in Part I incentive fees and a 14% decrease in average fee earning AUM for the year ended December 31, 2016 compared to 2015. |
• | Our management fees from long-dated private funds and SMAs decreased by $2.1 million for the year ended December 31, 2016, compared to 2015. The decrease was primarily due to a decrease in origination fees, partly offset by an increase in base management fees. |
Performance Fees. Performance fees increased to $2.4 million for the year ended December 31, 2016 compared to a reversal of performance fees of $15.7 million during 2015. The increase was due to an increase in SMA performance fees accrual for the year ended December 31, 2016 compared to a reversal of performance fees of MOF II and SMAs for the year ended December 31, 2015, which was the result of a decline in the underlying fund values.
Other Revenues and Fees. Other revenues and fees increased by $0.7 million, or 9%, to $8.1 million for the year ended December 31, 2016 compared to 2015. The increase was due primarily to an increase in administrative fees from our permanent capital vehicles.
Expenses
Compensation and Benefits. Compensation and benefits increased by $1.0 million, or 4% to $27.8 million for the year ended December 31, 2016 compared to 2015. The increase was due primarily to an increase in salaries, that resulted from an increase in headcount, and an increase in stock-based compensation expense, partly offset by a decrease in discretionary compensation during the year ended December 31, 2016
Performance Fee Compensation. There was a reversal in performance fee compensation of $0.3 million during the year ended December 31, 2016 as compared to a reversal of performance fee compensation of $8.0 million during 2015. The variance in performance fee compensation was due primarily to changes in projected future payments.
General, Administrative and Other Expenses. General, administrative and other expenses increased by $11.7 million to $28.5 million for the year ended December 31, 2016 compared to 2015. The increase was due primarily to an increase in expense support agreement expenses related to SIC. The expense support agreement with SIC expired on December 31, 2016, as such, we are no longer be responsible for expenses under the expense support agreement relating to SIC.
Other Income (Expense)
Dividend Income. Dividend income increased by $0.4 million to $1.3 million for the year ended December 31, 2016 compared to 2015. The increase was due to dividend income from our investment in available-for-sale securities which were acquired during the year ended December 31, 2016.
Interest Expense. Interest expense increased by $0.8 million, or 9%, to $9.2 million for the year ended December 31, 2016 compared to 2015. The increase was primarily due to an acceleration of amortization of debt issuance costs and discount relating to prepayments made on our Term Loan Facility as a result of the refinancing of our indebtedness from the issuance of senior unsecured debt. Average debt outstanding during the years ended December 31, 2016 and 2015 was $106.0 million and $105.9 million, respectively.
Other Income (Expenses), net. Other expenses, net decreased by $0.6 million to $1.1 million for the year ended December 31, 2016 compared to 2015. This decrease was due primarily to changes in fair value of our investment in SIC.
Provision for Income Taxes
Our effective income tax rate was 9.7% and 8.9% for the years ended December 31, 2016 and 2015, respectively. Our tax rate is affected by recurring items, such as permanent differences and income allocated to certain redeemable non-controlling interests which is not subject to U.S. federal, state and local corporate income taxes. It is also affected by discrete items that may occur in any given year, but are not consistent from year to year. The increase in the effective tax rate during the year ended December 31, 2016 as compared to 2015 was primarily attributed to the variance in the reversal of performance compensation which is not included in taxable income.
Redeemable Non-Controlling Interests and Non-Controlling Interests in Consolidated Subsidiaries
Net income attributable to redeemable non-controlling interests and non-controlling interests in consolidated subsidiaries increased by $3.4 million to $2.5 million for the year ended December 31, 2016 compared to 2015. The increase was due primarily
57
to a reversal of MOF II performance fees for the year ended December 31, 2015, a portion of which was allocated to non-controlling interests in consolidated subsidiaries.
Reconciliation of Certain Non-GAAP Performance Measures to Consolidated U.S. GAAP Financial Measures
In addition to analyzing our results on a GAAP basis, management also makes operating decisions and assesses business performance based on the financial and operating metrics and data that are presented in the table below. Management believes that these measures provide analysts, investors and management with helpful information regarding our underlying operating performance and our business, as they remove the impact of items management believes are not reflective of underlying operating performance. These non-GAAP measures are also used by management for planning purposes, including the preparation of internal budgets; and for evaluating the effectiveness of operational strategies. Additionally, we believe these non-GAAP measures provide another tool for investors to use in comparing our results with other companies in our industry, many of whom use similar non-GAAP measures. There are limitations associated with the use of non-GAAP financial measures as compared to the use of the most directly comparable U.S. GAAP financial measure and these measures supplement and should be considered in addition to and not in lieu of the results of operations discussed below. Furthermore, such measures may be inconsistent with measures presented by other companies.
Net income attributable to Medley Management Inc. and non-controlling interests in Medley LLC is the U.S. GAAP financial measure most comparable to Core Net Income and Core EBITDA.
The following table is a reconciliation of net income attributable to Medley Management Inc. and non-controlling interests in Medley LLC on a consolidated basis to Core Net Income and Core EBITDA.
For the Year Ended December 31, | |||||||||||
2017 | 2016 | 2015 | |||||||||
(Amounts in thousands, except share and per share amounts) | |||||||||||
Net income attributable to Medley Management Inc. | $ | 927 | $ | 997 | $ | 3,111 | |||||
Net income attributable to non-controlling interests in Medley LLC | 9,664 | 6,406 | 18,406 | ||||||||
Net income attributable to Medley Management Inc. and non-controlling interests in Medley LLC | $ | 10,591 | $ | 7,403 | $ | 21,517 | |||||
Reimbursable fund startup expenses | 1,510 | 16,329 | 6,378 | ||||||||
IPO date award stock-based compensation | 461 | 2,811 | 2,585 | ||||||||
Other non-core items: | |||||||||||
Severance expense | 1,184 | 218 | 303 | ||||||||
Acceleration of debt issuance costs (1) | 1,150 | 612 | — | ||||||||
Other (2) | 757 | 518 | — | ||||||||
Income tax expense on adjustments | (563 | ) | (2,360 | ) | (1,036 | ) | |||||
Core Net Income | $ | 15,090 | $ | 25,531 | $ | 29,747 | |||||
Interest expense | 10,705 | 8,614 | 8,469 | ||||||||
Income taxes | 2,519 | 3,423 | 3,051 | ||||||||
Depreciation and amortization | 912 | 913 | 454 | ||||||||
Core EBITDA | $ | 29,226 | $ | 38,481 | $ | 41,721 | |||||
Core Net Income Per Share | $ | 0.33 | $ | 0.54 | $ | 0.61 | |||||
Pro-Forma Weighted Average Shares Outstanding (3) | 30,851,882 | 30,689,412 | 30,459,958 | ||||||||
(1) | For the years ended December 31, 2017 and 2016, these amounts relate to additional interest expense associated with the acceleration of amortization of debt issuance costs and discount relating to prepayments made on our Term Loan Facility as a result of the refinancing of our indebtedness from the issuance of Senior Unsecured Debt. |
(2) | For the year ended December 31, 2017, other items consist of $0.7 million of expenses related to non-core business development activities and other expenses. For the year ended December 31, 2016, other non-core items consists of a $0.5 million impairment loss on our investment in CK Pearl Fund. |
58
(3) | Assumes the conversion by the pre-IPO holders of 23,333,333 Medley LLC units for 23,333,333 shares of Class A common stock at the beginning of each period presented, as well as the vesting of the weighted average number of restricted stock units and, in 2017, the conversion of 320,000 restricted LLC units for an equal number of shares of Class A common stock. |
The calculation of Core Net Income Per Share is presented in the table below:
For the Year Ended December 31, | |||||||||||
2017 | 2016 | 2015 | |||||||||
(Amounts in thousands, except share and per share amounts) | |||||||||||
Numerator | |||||||||||
Core Net Income | $ | 15,090 | $ | 25,531 | $ | 29,747 | |||||
Add: Income taxes | 2,519 | 3,423 | 3,051 | ||||||||
Pre-Tax Core Net Income | $ | 17,609 | $ | 28,954 | $ | 32,798 | |||||
Denominator | |||||||||||
Class A common stock | 5,553,026 | 5,804,042 | 6,002,422 | ||||||||
Conversion of LLC Units and restricted LLC Units to Class A common stock | 23,607,744 | 23,333,333 | 23,333,333 | ||||||||
Restricted stock units | 1,691,112 | 1,552,037 | 1,124,203 | ||||||||
Pro-Forma Weighted Average Shares Outstanding | 30,851,882 | 30,689,412 | 30,459,958 | ||||||||
Pre-Tax Core Net Income Per Share | $ | 0.57 | $ | 0.94 | $ | 1.08 | |||||
Less: corporate income taxes per share (1) | (0.25 | ) | (0.40 | ) | (0.47 | ) | |||||
Core Net Income Per Share | $ | 0.33 | $ | 0.54 | $ | 0.61 | |||||
(1) | Assumes that all of our pre-tax earnings are subject to federal, state and local corporate income taxes. In determining corporate income taxes, we used a combined effective corporate tax rate of 43.0%. |
Net Income Margin is the U.S. GAAP financial measure most comparable to Core Net Income Margin. Net Income margin is equal to Net income attributable to Medley Management Inc. and non-controlling interests in Medley LLC divided by total revenue. The following table is a reconciliation of Net Income Margin to Core Net Income Margin.
For the Year Ended December 31, | ||||||||
2017 | 2016 | 2015 | ||||||
Net Income Margin | 16.2 | % | 9.7 | % | 31.9 | % | ||
Reimbursable fund startup expenses (1) | 2.3 | % | 21.5 | % | 9.5 | % | ||
IPO date award stock-based compensation (1) | 0.7 | % | 3.7 | % | 3.8 | % | ||
Other non-core items: (1) | ||||||||
Severance expense | 1.8 | % | 0.3 | % | 0.4 | % | ||
Acceleration of debt issuance costs | 1.8 | % | 0.8 | % | — | % | ||
Other | 1.2 | % | 0.7 | % | — | % | ||
Provision for income taxes (1) | 3.0 | % | 1.4 | % | 3.0 | % | ||
Corporate income taxes (2) | (11.5 | )% | (16.4 | )% | (20.9 | )% | ||
Core Net Income Margin | 15.5 | % | 21.7 | % | 27.7 | % | ||
(1) | Adjustments to Net income attributable to Medley Management Inc. and non-controlling interests in Medley LLC to calculate Core Net Income are presented as a percentage of total revenue. |
(2) | Assumes that all our pre-tax earnings, including adjustments above, are subject to federal, state and local corporate income taxes. In determining corporate income taxes, we used a combined effective corporate tax rate of 43.0% and presented the calculation as a percentage of total revenue. |
59
Liquidity and Capital Resources
Our primary cash flow activities involve: (i) generating cash flow from operations, which largely includes management fees; (ii) making distributions to our members and redeemable non-controlling interests; (iii) paying dividends and (iv) borrowings, interest payments and repayments under our debt facilities. As of December 31, 2017, we had $36.2 million in cash and cash equivalents.
Our material source of cash from our operations is management fees, which are collected quarterly. We primarily use cash flows from operations to pay compensation and benefits, general, administrative and other expenses, federal, state and local corporate income taxes, debt service costs and distributions to our owners. Our cash flows, together with the proceeds from equity and debt issuances, are also used to fund investments in limited partnerships, purchase available for sale securities, purchase fixed assets and other capital items. If cash flows from operations were insufficient to fund distributions, we expect that we would suspend paying such distributions.
Debt Instruments
Senior Unsecured Debt
On August 9, 2016, Medley LLC completed a registered public offering of $25.0 million of an aggregate principal amount of 6.875% senior notes due 2026 (the “2026 Notes”). On October 18, 2016, Medley LLC completed a registered public offering of an additional $28.6 million in aggregate principal amount of the 2026 Notes. The 2026 Notes mature on August 15, 2026.
On January 18, 2017, Medley LLC completed a registered public offering of $34.5 million in aggregate principal amount of 7.25% senior notes due 2024 (the “2024 Notes”). On February 22, 2017, Medley LLC completed a registered public offering of an additional $34.5 million in aggregate principal amount of 2024 Notes. The 2024 Notes mature on January 30, 2024.
As of December 31, 2017, the outstanding senior unsecured debt balance was $116.9 million, and is reflected net of unamortized discount, premium and debt issuance costs of $5.7 million.
See Note 7 "Senior Unsecured Debt" to our consolidated financial statements included in this Form 10-K for additional information on the 2026 Notes and the 2024 Notes.
Revolving Credit Facility
On August 19, 2014, we entered into a $15.0 million senior secured revolving credit facility with City National Bank (as amended, the “Revolving Credit Facility”), as administrative agent and collateral agent thereunder, and the lenders from time to time party thereto. On September 22, 2017 we amended the Revolving Credit Facility to, among other things, extend the maturity date until March 31, 2020 and provide for an incremental facility in an amount up to $10.0 million upon the satisfaction of certain customary conditions. We intend to use any proceeds of borrowings under the Revolving Credit Facility for general corporate purposes, including funding our working capital needs. We have not incurred any borrowings under the Revolving Credit Facility through December 31, 2017. As of December 31, 2017, we were in compliance with the financial covenants under our Revolving Credit Facility.
Interest Rate and Fees
Borrowings under the Revolving Credit Facility bear interest, at our option, either (i) at ABR, plus an applicable margin not to exceed 0.25 percentage points, or (ii) at an adjusted LIBOR plus an applicable margin not to exceed 2.50 percentage points. In addition to paying interest on any outstanding principal under the Revolving Credit Facility, we are required to pay an unused line fee on the first day of the second month following each fiscal quarter in an amount equal to (i) if the average daily balance for the applicable fiscal quarter was less than $9.0 million, 0.50% per annum, or (ii) if the average daily balance for the applicable fiscal quarter was equal to or greater than $9.0 million, 0.25% per annum.
Guarantees and Collateral
Any obligations under the Revolving Credit Facility are unconditionally and irrevocably guaranteed by certain of Medley LLC’s subsidiaries. In addition, any outstanding borrowings are collateralized by first priority or equivalent security interests in (i) all the capital stock of, or other equity interests in, the borrower and each of the borrower’s and credit agreement guarantors’ direct or indirect domestic subsidiaries and 65% of the capital stock of, or other equity interests in, each of the borrower’s or any subsidiary guarantors’ direct wholly owned first-tier restricted foreign subsidiaries, and (ii) certain tangible and intangible assets of the borrower and the credit agreement guarantors (subject to certain exceptions and qualifications).
None of our non-wholly owned domestic subsidiaries are obligated to guarantee the Revolving Credit Facility.
60
Certain Covenants and Events of Default
The Revolving Credit Facility contains a number of significant affirmative and negative covenants and customary events of default. Such covenants, among other things, will limit or restrict, subject to certain exceptions, the ability of the borrower and its restricted subsidiaries to:
• | incur additional indebtedness, make guarantees and enter into hedging arrangements; |
• | create liens on assets; |
• | enter into sale and leaseback transactions; |
• | engage in mergers or consolidations; |
• | make fundamental changes; |
• | pay dividends and distributions or repurchase our capital stock; |
• | make investments, loans and advances, including acquisitions; |
• | engage in certain transactions with affiliates; |
• | make changes in the nature of their business; and |
• | make prepayments of junior debt. |
In addition, the credit agreement governing our Revolving Credit Facility contains financial covenants that requires us to maintain a Maximum Net Leverage Ratio of not greater than 5.0 to 1.0, a Total Leverage Ratio of not greater than 7.0 to 1.0, and Core EBITDA of not less than $15.0 million. These ratios are calculated on a trailing twelve months basis and are calculated using our standalone financial results and include adjustments to calculate Core EBITDA.
Our Revolving Credit Facility contains certain customary representations and warranties, affirmative covenants and events of default. If an event of default occurs, the lender under the Revolving Credit Facility will be entitled to take various actions, including the acceleration of any amounts due under the Revolving Credit Facility and all actions permitted to be taken by a secured creditor.
Non-Recourse Promissory Notes
In April 2012, we borrowed $5.0 million under a non-recourse promissory note with a foundation, and $5.0 million under a non-recourse promissory note with a trust. These notes are scheduled to mature in March 2019.
See Note 6 "Loans Payable" to our consolidated financial statements included in this Form 10-K for additional information regarding the promissory notes.
Cash Flows
The significant captions and amounts from our consolidated statements of cash flows are summarized below. Negative amounts represent a net outflow, or use of cash.
For the Years Ended December 31, | |||||||||||
2017 | 2016 | 2015 | |||||||||
(Amounts in thousands) | |||||||||||
Statements of cash flows data | |||||||||||
Net cash provided by operating activities | $ | 12,399 | $ | 15,895 | $ | 24,063 | |||||
Net cash used in investing activities | (35,203 | ) | (18,826 | ) | (1,373 | ) | |||||
Net cash provided by (used in) financing activities | 4,404 | (14,194 | ) | (38,208 | ) | ||||||
Net decrease in cash and cash equivalents | $ | (18,400 | ) | $ | (17,125 | ) | $ | (15,518 | ) | ||
Operating Activities
Our net cash flow provided by operating activities was $12.4 million, $15.9 million and $24.1 million during the years ended December 31, 2017, 2016 and 2015, respectively. During the years ended December 31, 2017, 2016 and 2015, net cash flow provided by operating activities was attributed to net income of $17.3 million, $10.0 million and $20.6 million, respectively, non-cash adjustments of $8.0 million, $6.7 million and $17.4 million, respectively, and changes in operating assets and liabilities of $(12.9) million, $(0.7) million and $(14.0) million, respectively.
61
Investing Activities
Our investing activities generally reflect cash used for acquisitions of fixed assets, distributions received from our equity method investments and purchases of available for sale securities. Purchases of fixed assets were $0.1 million, $1.9 million and $0.8 million for the years ended December 31, 2017, 2016 and 2015, respectively. Capital contributions to equity method investments represented a use of cash from financing activities of $0.3 million for each of the years ended December 31, 2017 and 2016 and $1.1 million for the year ended December 31, 2015. Distributions received from equity method investments during each of the years ended December 31, 2017 and 2016 were $0.2 million and were $0.5 million for the year ended December 31, 2015. Excluding the investments held by our consolidated fund, purchases of available for sale securities were $35.0 million during the year ended December 31, 2017 and $16.8 million during the year ended December 31, 2016.
Financing Activities
Dividends paid were $5.8 million, $5.5 million and $4.1 million during the years ended December 31, 2017, 2016 and 2015, respectively. Distributions to members and non-controlling interests were $30.0 million, $23.7 million and $32.7 million for the years ended December 31, 2017, 2016 and 2015, respectively. Capital contributions from non-controlling interests and redeemable non-controlling interests resulted in an inflow of cash of $23.0 million for the year ended December 31, 2017 and $17.0 million during the year ended December 31, 2016. Repurchases of Class A common stock represented a use of cash from financing activities of $3.6 million, $1.2 million and $0.1 million for the years ended December 31, 2017, 2016 and 2015, respectively.
On August 9, 2016, Medley LLC completed its first registered public offering of senior unsecured debt and on October 18, 2016, January 18, 2017, and February 22, 2017 Medley LLC completed additional registered public offerings of senior unsecured debt. The proceeds from these offerings, net of offering expenses payable by us, amounted to $116.2 million. The net proceeds from the offerings were used to pay-down the outstanding indebtedness under the Term Loan Facility with the remaining amount to be used for working capital purposes. Repayments of loans payable resulted in an outflow of cash of $44.8 million and $50.5 million for the years ended December 31, 2017 and 2016, respectively. Proceeds from the issuance of debt obligations provided an inflow of cash of $69.1 million for the year ended December 31, 2017 and $52.6 million for the year ended December 31, 2016.
Sources and Uses of Liquidity
Our sources of liquidity are (i) cash on hand, (ii) net working capital, (iii) cash flows from operations, (iv) realizations on our investments, (v) net proceeds from borrowings under the Revolving Credit Facility and issuances of publicly-registered debt and (vi) other potential financings. We believe that these sources of liquidity will be sufficient to fund our working capital requirements and to meet our commitments in the foreseeable future. We expect that our primary liquidity needs will be comprised of cash to (i) provide capital to facilitate the growth of our existing investment management business, (ii) fund our commitments to funds that we advise, (iii) provide capital to facilitate our expansion into business that are complementary to our existing investment management business, (iv) pay operating expenses, including cash compensation to our employees and payments under the TRA, (v) fund capital expenditures, (vi) pay income taxes, and (vii) make distributions to our shareholders in accordance with our dividend policy.
We intend to use a portion of our available liquidity to fund cash dividends to our common shareholders on a quarterly basis. Our ability to fund cash dividends to our common shareholders is dependent on a myriad of factors, including among others: general economic and business conditions; our strategic plans and prospects; our business and investment opportunities; timing of capital calls by our funds in support of our commitments; our financial condition and operating results; working capital requirements and other anticipated cash needs; contractual restrictions and obligations; legal, tax and regulatory restrictions; restrictions on the payment of distributions by our subsidiaries to us; and other relevant factors.
Critical Accounting Policies
We prepare our consolidated financial statements in accordance with U.S. GAAP. In applying many of these accounting principles, we need to make assumptions, estimates or judgments that affect the reported amounts of assets, liabilities, revenues and expenses in our consolidated financial statements. We base our estimates and judgments on historical experience and other assumptions that we believe are reasonable under the circumstances. These assumptions, estimates or judgments, however, are both subjective and subject to change, and actual results may differ from our assumptions and estimates. If actual amounts are ultimately different from our estimates, the revisions are included in our results of operations for the period in which the actual amounts become known. We believe the following critical accounting policies could potentially produce materially different results if we were to change underlying assumptions, estimates or judgments. See Note 2, “Summary of Significant Accounting Policies,” to our consolidated financial statements included in this Form 10-K for a summary of our significant accounting policies.
62
Principles of Consolidation
In accordance with ASC 810, Consolidation, we consolidate those entities where we have a direct and indirect controlling financial interest based on either a variable interest model or voting interest model. As such, we consolidate entities that we conclude are VIEs, for which we are deemed to be the primary beneficiary and entities in which we hold a majority voting interest or have majority ownership and control over the operational, financial and investing decisions of that entity.
For legal entities evaluated for consolidation, we must determine whether the interests that it holds and fees paid to it qualify as a variable interest in an entity. This includes an evaluation of the management fees and performance fees paid to us when acting as a decision maker or service provider to the entity being evaluated. Fees received by us that are customary and commensurate with the level of services provided, and we don’t hold other economic interests in the entity that would absorb more than an insignificant amount of the expected losses or returns of the entity, would not be considered a variable interest. We factor in all economic interests including proportionate interests through related parties, to determine if fees are considered a variable interest.
An entity in which we hold a variable interest is a VIE if any one of the following conditions exist: (a) the total equity investment at risk is not sufficient to permit the legal entity to finance its activities without additional subordinated financial support, (b) the holders of equity investment at risk have the right to direct the activities of the entity that most significantly impact the legal entity’s economic performance, (c) the voting rights of some investors are disproportionate to their obligation to absorb losses or rights to receive returns from a legal entity. For limited partnerships and other similar entities, non-controlling investors must have substantive rights to either dissolve the fund or remove the general partner (“kick-out rights”) in order to qualify as a VIE.
For those entities that qualify as a VIE, the primary beneficiary is generally defined as the party who has a controlling financial interest in the VIE. We are generally deemed to have a controlling financial interest if we have the power to direct the activities of a VIE that most significantly impact the VIE’s economic performance, and the obligation to absorb losses or receive benefits from the VIE that could potentially be significant to the VIE. We determine whether we are the primary beneficiary of a VIE at the time we become initially involved with the VIE and we reconsider that conclusion continuously. The primary beneficiary evaluation is generally performed qualitatively on the basis of all facts and circumstances. However, quantitative information may also be considered in the analysis, as appropriate. These assessments require judgments. Each entity is assessed for consolidation on a case-by-case basis.
For those entities evaluated under the voting interest model, we consolidate the entity if we have a controlling financial interest. We have a controlling financial interest in a voting interest entity (“VOE”) if we own a majority voting interest in the entity.
Performance Fees
Performance fees are based on certain specific hurdle rates as defined in the funds’ applicable investment management or partnership agreements. Performance fees are recorded on an accrual basis to the extent such amounts are contractually due.
We have elected to adopt Method 2 of ASC 605, Revenue Recognition, for revenue based on a formula. Under this method, we are entitled to performance-based fees that can amount to as much as 20.0% of a fund's profits, subject to certain hurdles. Performance-based fees are assessed as a percentage of the investment performance of the funds. The performance fee for any period is based upon an assumed liquidation of the fund's net assets on the reporting date, and distribution of the net proceeds in accordance with the fund's income allocation provisions. The performance fees may be subject to reversal to the extent that the performance fees recorded exceeds the amount due to the general partner or investment manager based on a fund's cumulative investment returns.
Performance fees receivable is presented separately in our audited consolidated balance sheets included in this Form 10-K and represents performance fees recognized but not yet collected. The timing of the payment of performance fees due to the general partner or investment manager varies depending on the terms of the applicable fund agreements.
If applicable, we record an accrual for the potential repayment of previously received performance fees which represents amounts that would need to be repaid to the underlying funds if these funds were to be liquidated based on the current fair value of the underlying funds’ investments as of the reporting date. Our actual obligation, however, would not become payable or realized until the end of a fund’s life.
Performance Fee Compensation Payable
We have an obligation to pay our professionals a portion of the performance fees earned from certain funds. These amounts are accounted for as compensation expense in conjunction with the recognition of the related performance fee revenue and, until paid, are recognized as performance fee compensation payable. Performance fee compensation is recognized in the same period
63
that the related performance fees are recognized. Performance fee compensation can be reversed during periods when there is a decline in performance fees that were previously recognized.
Income Taxes
We account for income taxes using the asset and liability approach, which requires the recognition of tax benefits or expenses for temporary differences between the financial reporting and tax basis of assets and liabilities. A valuation allowance is established when necessary to reduce deferred tax assets to the amounts expected to be realized. We also recognize a tax benefit from uncertain tax positions only if it is “more likely than not” that the position is sustainable based on its technical merits. Our policy is to recognize interest and penalties on uncertain tax positions and other tax matters as a component of income tax expense. For interim periods, we account for income taxes based on its estimate of the effective tax rate for the year. Discrete items and changes in its estimate of the annual effective tax rate are recorded in the period they occur.
Medley Management Inc., is subject to U.S. federal, state and local corporate income taxes on its allocable portion of taxable income from Medley LLC at prevailing corporate tax rates, which are reflected in our consolidated financial statements included in this Form 10-K. Medley LLC and its subsidiaries are not subject to federal, state and local corporate income taxes since all income, gains and losses are passed through to its members. However, Medley LLC and its subsidiaries are subject to New York City’s unincorporated business tax, which is also included in our provision for income taxes.
We analyze our tax filing positions in all of the U.S. federal, state and local tax jurisdictions where we are required to file income tax returns, as well as for all open tax years in these jurisdictions. If, based on this analysis, we determine that uncertainties in tax positions exist, a liability is established.
Stock-based Compensation
We account for stock-based compensation in accordance with ASC 718, Compensation – Stock Compensation. Under the fair value recognition provision of this guidance, share-based compensation cost is measured at the grant date based on the fair value of the award and is recognized as expense over the requisite service period.
Prior to January 1, 2017, stock-based compensation expense was based on awards ultimately expected to vest and was reduced for estimated forfeitures. We estimated our forfeiture rate based on our historical experience and revised our estimate if actual forfeitures differed from our initial estimates. Effective January 1, 2017, we adopted a change in accounting policy as a result of the adoption of ASU 2016-09 to account for forfeitures in the period they occur.
Stock-based compensation expense relating to equity based awards are measured at fair value as of the grant date, reduced for actual forfeitures, and expensed over the vesting period on a straight-line basis as a component of compensation and benefits in our consolidated statements of operations.
Recent Accounting Pronouncements
Information regarding recent accounting pronouncements and their impact on us can be found in Note 2, “Summary of Significant Accounting Policies,” to our consolidated financial statements included in this Form 10-K.
Off-Balance Sheet Arrangements
In the normal course of business, we may engage in off-balance sheet arrangements, including transactions in guarantees, commitments, indemnifications and potential contingent repayment obligations.
See Note 9, “Commitments and Contingencies,” to our consolidated financial statements included in this Form 10-K for a discussion of our commitments and contingencies.
64
Contractual Obligations
The following table sets forth information relating to our contractual obligations as of December 31, 2017.
Less than 1 year | 1 - 3 years | 4 - 5 years | More than 5 years | Total | |||||||||||||||
(Amounts in thousands) | |||||||||||||||||||
Medley Obligations | |||||||||||||||||||
Operating lease obligations (1) | $ | 2,704 | $ | 5,543 | $ | 4,862 | $ | 1,823 | $ | 14,932 | |||||||||
Loans payable (2) | — | 10,000 | — | — | 10,000 | ||||||||||||||
Senior unsecured debt (3) | — | — | — | 122,595 | 122,595 | ||||||||||||||
Revenue share payable | 1,396 | 1,595 | 850 | — | 3,841 | ||||||||||||||
Capital commitments to funds (4) | 336 | — | — | — | 336 | ||||||||||||||
Total | $ | 4,436 | $ | 17,138 | $ | 5,712 | $ | 124,418 | $ | 151,704 | |||||||||
(1) | We lease office space in New York and San Francisco under non-cancelable lease agreements. The amounts in this table represent the minimum lease payments required over the term of the lease, and include operating leases for office equipment. |
(2) | We have included all loans described in Note 6, “Loans Payable,” to our consolidated financial statements included in this Form 10-K. |
(3) | We have included all our obligations described in Note 7, “Senior Unsecured Debt,” to our consolidated financial statements included in this Form 10-K. In addition to the principal amounts above, the Company is required to make quarterly interest payments of $1.2 million related to our 2024 Notes and $0.9 million related to our 2026 Notes. |
(4) | Represents equity commitments by us to certain long-dated private funds managed by us. These amounts are generally due on demand and are therefore presented in the less than one year category. |
Indemnifications
In the normal course of business, we enter into contracts that contain indemnities for our affiliates, persons acting on our behalf or such affiliates and third parties. The terms of the indemnities vary from contract to contract and the maximum exposure under these arrangements, if any, cannot be determined and has neither been recorded in our consolidated financial statements. As of December 31, 2017, we have not had prior claims or losses pursuant to these contracts and expect the risk of loss to be remote.
Contingent Obligations
The partnership documents governing our funds generally include a clawback provision that, if triggered, may give rise to a contingent obligation that may require the general partner to return amounts to the fund for distribution to investors. Therefore, performance fee revenue, generally, is subject to reversal in the event that the funds incur future losses. These losses are limited to the extent of the cumulative performance fee revenue recognized in income to date, net of a portion of taxes paid. Due in part to our investment performance and the fact that our performance fee revenue is generally determined on a liquidation basis, as of December 31, 2017, we accrued $7.2 million for clawback obligations that would need to be paid had the funds been liquidated as of that date. There can be no assurance that we will not incur additional clawback obligations in the future. If all of the existing investments were valued at $0, the amount of cumulative performance fee revenue that have been recognized would be reversed. We believe that the possibility of all of the existing investments becoming worthless is remote. At December 31, 2017, had we assumed all existing investments were valued at $0, the net amount of performance fee revenue subject to additional reversal would have been approximately $3.2 million.
Performance fee revenue is also affected by changes in the fair values of the underlying investments in the funds that we advise. Valuations, on an unrealized basis, can be significantly affected by a variety of external factors including, but not limited to, bond yields and industry trading multiples. Under the governing agreements of certain of our funds, we may have to fund additional amounts on account of clawback obligations beyond what we received in performance fee compensation on account of distributions of performance fee payments made to current or former professionals from such funds if they do not fund their respective shares of such clawback obligations. We will generally retain the right to pursue any remedies that we have under such governing agreements against those carried interest recipients who fail to fund their obligations.
Additionally, at the end of the life of the funds, there could be a payment due to a fund by us if we have recognized more performance fee revenue than was ultimately earned. The general partner obligation amount, if any, will depend on final realized values of investments at the end of the life of the fund.
65
Item 7A. Quantitative and Qualitative Disclosures About Market Risk
Our primary exposure to market risk is related to our role as general partner or investment advisor to our investment funds and the sensitivity to movements in the fair value of their investments, including the effect on management fees, performance fees and investment income.
The market price of investments may significantly fluctuate during the period of investment. Investments may decline in value due to factors affecting securities markets generally or particular industries represented in the securities markets. The value of an investment may decline due to general market conditions which are not specifically related to such investment, such as real or perceived adverse economic conditions, changes in the general outlook for corporate earnings, changes in interest or currency rates or adverse investor sentiment generally. They may also decline due to factors that affect a particular industry or industries, such as labor shortages or increased production costs and competitive conditions within an industry.
Effect on Management Fees
Management fees are generally based on a defined percentage of gross asset values, total committed capital, net invested capital and NAV of the investment funds managed by us as well as a percentage of net interest income over a performance hurdle. Management fees calculated based on fair value of assets or net investment income are affected by short-term changes in market values.
The overall impact of a short-term change in market value may be mitigated by fee definitions that are not based on market value including invested capital and committed capital, market value definitions that exclude the impact of realized and/or unrealized gains and losses, market value definitions based on beginning of the period values or a form of average market value including daily, monthly or quarterly averages, as well as monthly or quarterly payment terms.
As such, based on an incremental 10% short-term increase in fair value of the investments in our permanent capital vehicles, long-dated private funds and SMAs’ as of December 31, 2017, we calculated a $3.1 million increase in management fees for the year ended December 31, 2017. In the case of a 10% short-term decline in fair value of the investments in our permanent capital, long-dated funds and SMAs’ as of December 31, 2017, we calculated a $4.0 million decrease in management fees for the year ended December 31, 2017.
Effect on Performance Fees
Performance fees are based on certain specific hurdle rates as defined in the funds' applicable investment management or partnership agreements. The performance fees for any period are based upon an assumed liquidation of the fund's net assets on the reporting date, and distribution of the net proceeds in accordance with the fund's income allocation provisions, which can result in a performance-based fee to us, subject to certain hurdles and benchmarks. The performance fees may be subject to reversal to the extent that the performance fees recorded exceed the amount due to the general partner or investment manager based on a fund's cumulative investment returns.
Short-term changes in the fair values of funds' investments may materially impact accrued performance fees depending on the respective funds' performance relative to applicable hurdles. The overall impact of a short-term change in market value may be mitigated by a number of factors including, but not limited to, the way in which carried interest performance fees are calculated, which is not ultimately dependent on short-term moves in fair market value, but rather realize cumulative performance of the investments through the end of the long-dated private funds and SMAs’ lives. However, short-term moves can meaningfully impact our ability to accrue performance fees and receive cash payments in any given period.
As such, based on an incremental 10% short-term increase in fair value of the investments in our long-dated private funds and SMAs’ as of December 31, 2017, we calculated a $12.5 million increase in performance fees for the year ended December 31, 2017. In the case of a 10% short-term decline in fair value of investments in our long-dated private funds and SMAs’ as of December 31, 2017, we calculated a $1.8 million decrease in performance fees for the year ended December 31, 2017.
Effect on Part I and Part II Incentive Fees
Incentive fees are based on certain specific hurdle rates as defined in our permanent capital vehicles' applicable investment management agreements. The Part II incentive fees are based upon realized gains netted against cumulative realized and unrealized losses. The Part I incentive fees are not subject to clawbacks as our carried interest performance fees are.
Short-term changes in the fair values of the investments of our permanent capital vehicles may materially impact Part II incentive fees depending on the respective vehicle's performance relative to applicable hurdles to the extent there were realized gains that we would otherwise earn Part II incentive fees on.
As such, based on an incremental 10% short-term increase in fair value of the investments in our permanent capital vehicles as of December 31, 2017, we calculated a $1.4 million increase in Part I and II incentive fees for the year ended December 31,
66
2017. In the case of a 10% short-term decline in fair value of the investments in our permanent capital vehicles as of December 31, 2017, we calculated a $0.4 million increase in Part I incentive fees for the year ended December 31, 2017.
Interest Rate Risk
As of December 31, 2017, we had $126.1 million of debt outstanding, net of unamortized discount, premium, and issuance costs, presented as loans payable and senior unsecured debt in our audited financial statements included elsewhere in this Form 10-K. Our debt bears interest at fixed rates, and therefore is not subject to interest rate fluctuation risk.
As credit-oriented investors, we are also subject to interest rate risk through the securities we hold in our funds. A 100 basis point increase in interest rates would be expected to negatively affect prices of securities that accrue interest income at fixed rates and therefore negatively impact net change in unrealized appreciation on the funds' investments. The actual impact is dependent on the average duration of such holdings. Conversely, securities that accrue interest at variable rates would be expected to benefit from a 100 basis points increase in interest rates because these securities would generate higher levels of current income and therefore positively impact interest and dividend income, subject to LIBOR. In the cases where our funds pay management fees based on NAV, we would expect management fees to experience a change in direction and magnitude corresponding to that experienced by the underlying portfolios.
Credit Risk
We are party to agreements providing for various financial services and transactions that contain an element of risk in the event that the counterparties are unable to meet the terms of such agreements. In such agreements, we depend on the respective counterparty to make payment or otherwise perform. We generally endeavor to minimize our risk of exposure by limiting to reputable financial institutions the counterparties with which we enter into financial transactions. In other circumstances, availability of financing from financial institutions may be uncertain due to market events, and we may not be able to access these financing markets.
67
Item 8. Financial Statements and Supplementary Data
Page | ||
68
Report of Independent Registered Public Accounting Firm
To the Stockholders and the Board of Directors of Medley Management Inc.
Opinion on the Financial Statements
We have audited the accompanying consolidated balance sheets of Medley Management Inc. and its subsidiaries (the Company) as of December 31, 2017 and 2016, the related consolidated statements of income, comprehensive income, changes in equity and cash flows for each of the three years in the period ended December 31, 2017, and the related notes to the consolidated financial statements (collectively, the financial statements). In our opinion, the financial statements present fairly, in all material respects, the financial position of the Company as of December 31, 2017 and 2016, and the results of its operations and its cash flows for the years then ended, in conformity with accounting principles generally accepted in the United States of America.
Basis for Opinion
These financial statements are the responsibility of the Company’s management. Our responsibility is to express an opinion on the Company’s financial statements based on our audits. We are a public accounting firm registered with the Public Company Accounting Oversight Board (United States) (PCAOB) and are required to be independent with respect to the Company in accordance with U.S. federal securities laws and the applicable rules and regulations of the Securities and Exchange Commission and the PCAOB.
We conducted our audits in accordance with the standards of the PCAOB. Those standards require that we plan and perform the audit to obtain reasonable assurance about whether the financial statements are free of material misstatement, whether due to error or fraud. The Company is not required to have, nor were we engaged to perform, an audit of its internal control over financial reporting. As part of our audits we are required to obtain an understanding of internal control over financial reporting but not for the purpose of expressing an opinion on the effectiveness of the Company's internal control over financial reporting. Accordingly, we express no such opinion.
Our audits included performing procedures to assess the risks of material misstatement of the financial statements, whether due to error or fraud, and performing procedures that respond to those risks. Such procedures included examining, on a test basis, evidence regarding the amounts and disclosures in the financial statements. Our audits also included evaluating the accounting principles used and significant estimates made by management, as well as evaluating the overall presentation of the financial statements. We believe that our audits provide a reasonable basis for our opinion.
/s/ RSM US LLP
We have served as the Company's auditor since 2014.
New York, New York
March 29, 2018
F- 1
Medley Management Inc.
Consolidated Balance Sheets
(Amounts in thousands, except share and per share amounts)
As of December 31, | |||||||
2017 | 2016 | ||||||
Assets | |||||||
Cash and cash equivalents | $ | 36,163 | $ | 49,666 | |||
Cash and cash equivalents of consolidated fund | 164 | — | |||||
Restricted cash equivalents | — | 4,897 | |||||
Investments, at fair value | 56,399 | 31,904 | |||||
Management fees receivable | 14,714 | 12,630 | |||||
Performance fees receivable | 3,220 | 4,961 | |||||
Other assets | 17,262 | 18,311 | |||||
Total Assets | $ | 127,922 | $ | 122,369 | |||
Liabilities, Redeemable Non-controlling Interests and Equity | |||||||
Liabilities | |||||||
Senior unsecured debt | $ | 116,892 | $ | 49,793 | |||
Loans payable | 9,233 | 52,178 | |||||
Accounts payable, accrued expenses and other liabilities | 25,130 | 37,255 | |||||
Total Liabilities | 151,255 | 139,226 | |||||
Commitments and Contingencies (Note 9) | |||||||
Redeemable Non-controlling Interests | 53,741 | 30,805 | |||||
Equity | |||||||
Class A common stock, $0.01 par value, 3,000,000,000 shares authorized; 6,235,332 and 6,042,050 issued as of December 31, 2017 and 2016, respectively; 5,481,068 and 5,809,130 outstanding as of December 31, 2017 and 2016, respectively | 55 | 58 | |||||
Class B common stock, $0.01 par value, 1,000,000 shares authorized; 100 shares issued and outstanding | — | — | |||||
Additional paid in capital | 2,820 | 3,310 | |||||
Accumulated other comprehensive (loss) income | (1,301 | ) | 33 | ||||
Accumulated deficit | (9,545 | ) | (5,254 | ) | |||
Total stockholders' deficit, Medley Management Inc. | (7,971 | ) | (1,853 | ) | |||
Non-controlling interests in consolidated subsidiaries | (1,702 | ) | (1,717 | ) | |||
Non-controlling interests in Medley LLC | (67,401 | ) | (44,092 | ) | |||
Total deficit | (77,074 | ) | (47,662 | ) | |||
Total Liabilities, Redeemable Non-controlling Interests and Equity | $ | 127,922 | $ | 122,369 | |||
See accompanying notes to consolidated financial statements
F- 2
Medley Management Inc.
Consolidated Statements of Operations
(Amounts in thousands, except share and per share amounts)
For the Years Ended December 31, | |||||||||||
2017 | 2016 | 2015 | |||||||||
Revenues | |||||||||||
Management fees (includes Part I incentive fees of $4,874, $14,209 and $21,487, respectively) | $ | 58,104 | $ | 65,496 | $ | 75,675 | |||||
Performance fees | (1,744 | ) | 2,421 | (15,685 | ) | ||||||
Other revenues and fees | 9,201 | 8,111 | 7,436 | ||||||||
Total Revenues | 65,561 | 76,028 | 67,426 | ||||||||
Expenses | |||||||||||
Compensation and benefits | 27,432 | 27,800 | 26,768 | ||||||||
Performance fee compensation | (874 | ) | (319 | ) | (8,049 | ) | |||||
General, administrative and other expenses | 13,045 | 28,540 | 16,836 | ||||||||
Total Expenses | 39,603 | 56,021 | 35,555 | ||||||||
Other Income (Expense) | |||||||||||
Dividend income | 4,327 | 1,304 | 886 | ||||||||
Interest expense | (11,855 | ) | (9,226 | ) | (8,469 | ) | |||||
Other income (expense), net | 835 | (1,070 | ) | (1,641 | ) | ||||||
Total Other Expense, Net | (6,693 | ) | (8,992 | ) | (9,224 | ) | |||||
Income before income taxes | 19,265 | 11,015 | 22,647 | ||||||||
Provision for income taxes | 1,956 | 1,063 | 2,015 | ||||||||
Net Income | 17,309 | 9,952 | 20,632 | ||||||||
Net income (loss) attributable to redeemable non-controlling interests and non-controlling interests in consolidated subsidiaries | 6,718 | 2,549 | (885 | ) | |||||||
Net income attributable to non-controlling interests in Medley LLC | 9,664 | 6,406 | 18,406 | ||||||||
Net Income Attributable to Medley Management Inc. | $ | 927 | $ | 997 | $ | 3,111 | |||||
Dividends declared per share of Class A common stock | $ | 0.80 | $ | 0.80 | $ | 0.60 | |||||
Net Income Per Share of Class A Common Stock: | |||||||||||
Basic (Note 11) | $ | 0.07 | $ | 0.02 | $ | 0.46 | |||||
Diluted (Note 11) | $ | 0.07 | $ | 0.02 | $ | 0.46 | |||||
Weighted average shares outstanding - Basic and Diluted | 5,553,026 | 5,804,042 | 6,002,422 | ||||||||
See accompanying notes to consolidated financial statements
F- 3
Medley Management Inc.
Consolidated Statements of Comprehensive Income
(Amounts in thousands)
For the Year Ended December 31, | |||||||||||
2017 | 2016 | 2015 | |||||||||
Net Income | $ | 17,309 | $ | 9,952 | $ | 20,632 | |||||
Other Comprehensive Income: | |||||||||||
Change in fair value of available-for-sale securities (net of income tax benefit of $0.9 million for Medley Management Inc. and $0.3 million for non-controlling interests in Medley LLC for the year ended December 31, 2017, respectively) | (10,305 | ) | 194 | — | |||||||
Total Comprehensive Income | 7,004 | 10,146 | 20,632 | ||||||||
Comprehensive income (loss) attributable to redeemable non-controlling interests and non-controlling interests in consolidated subsidiaries | 6,690 | 2,577 | (885 | ) | |||||||
Comprehensive income attributable to non-controlling interests in Medley LLC | 721 | 6,539 | 18,406 | ||||||||
Comprehensive (Loss) Income Attributable to Medley Management Inc. | $ | (407 | ) | $ | 1,030 | $ | 3,111 | ||||
See accompanying notes to consolidated financial statements
F- 4
Medley Management Inc.
Consolidated Statement of Changes in Equity
(Amounts in thousands, except share and per share amounts)
Non-controlling Interests in Consolidated Funds | Class A Common Stock | Class B Common Stock | Additional Paid in Capital | Accumulated Other Comprehensive Income (Loss) | Accumulated Earnings (Deficit) | Non- controlling Interests in Consolidated Subsidiaries | Non- controlling Interests in Medley LLC | Total Equity (Deficit) | |||||||||||||||||||||||||||||||||
Shares | Dollars | Shares | Dollars | ||||||||||||||||||||||||||||||||||||||
Balance at December 31, 2014 | $ | 625,548 | 6,000,000 | $ | 60 | 100 | $ | — | $ | (2,384 | ) | $ | — | $ | 272 | $ | 1,526 | $ | (3,972 | ) | $ | 621,050 | |||||||||||||||||||
Deconsolidation of MOF I LP | (15,321 | ) | — | — | — | — | — | — | — | — | — | (15,321 | ) | ||||||||||||||||||||||||||||
Deconsolidation of MOF II LP | (610,227 | ) | — | — | — | — | — | — | — | — | — | (610,227 | ) | ||||||||||||||||||||||||||||
Net income | — | — | — | — | — | — | — | 3,111 | (885 | ) | 18,406 | 20,632 | |||||||||||||||||||||||||||||
Stock-based compensation | — | — | — | — | — | 3,052 | — | — | — | — | 3,052 | ||||||||||||||||||||||||||||||
Dividends on Class A common stock ($0.20 per share) | — | — | — | — | — | — | — | (4,113 | ) | — | — | (4,113 | ) | ||||||||||||||||||||||||||||
Excess tax benefit from dividends paid to RSU holders | — | — | — | — | — | 64 | — | — | — | 21 | 85 | ||||||||||||||||||||||||||||||
Issuance of Class A common stock related to vesting of restricted stock units, net of shares withheld for employee taxes | — | 10,646 | — | — | — | — | — | — | — | — | — | ||||||||||||||||||||||||||||||
Repurchases of Class A common stock | — | (16,705 | ) | — | — | — | (101 | ) | — | — | — | — | (101 | ) | |||||||||||||||||||||||||||
Contributions | — | — | — | — | — | — | — | — | — | — | — | ||||||||||||||||||||||||||||||
Distributions | — | — | — | — | — | — | — | — | (1,100 | ) | (31,644 | ) | (32,744 | ) | |||||||||||||||||||||||||||
Balance at December 31, 2015 | — | 5,993,941 | 60 | 100 | — | 631 | — | (730 | ) | (459 | ) | (17,189 | ) | (17,687 | ) | ||||||||||||||||||||||||||
Net income | — | — | — | — | — | — | — | 997 | (16 | ) | 6,406 | 7,387 | |||||||||||||||||||||||||||||
Change in fair value of available-for-sale securities, net of taxes | — | — | — | — | — | — | 33 | — | — | 133 | 166 | ||||||||||||||||||||||||||||||
Stock-based compensation | — | — | — | — | — | 3,811 | — | — | — | — | 3,811 | ||||||||||||||||||||||||||||||
Dividends on Class A common stock ($0.20 per share) | — | — | — | — | — | — | — | (5,521 | ) | — | — | (5,521 | ) | ||||||||||||||||||||||||||||
Excess tax benefit from dividends paid to RSU holders | — | — | — | — | — | 64 | — | — | — | 20 | 84 | ||||||||||||||||||||||||||||||
Issuance of Class A common stock related to vesting of restricted stock units, net of shares withheld for employee taxes | — | 31,404 | — | — | — | — | — | — | — | — | — | ||||||||||||||||||||||||||||||
Repurchases of Class A common stock | — | (216,215 | ) | (2 | ) | — | — | (1,196 | ) | — | — | — | — | (1,198 | ) | ||||||||||||||||||||||||||
Contributions | — | — | — | — | — | — | — | — | 12 | — | 12 | ||||||||||||||||||||||||||||||
Distributions | — | — | — | — | — | — | — | — | (1,547 | ) | (21,115 | ) | (22,662 | ) | |||||||||||||||||||||||||||
Reclassification of redeemable non-controlling interest | — | — | — | — | — | — | — | — | (41 | ) | (12,155 | ) | (12,196 | ) | |||||||||||||||||||||||||||
Issuance of non-controlling interests, at fair value | — | — | — | — | — | — | — | — | 334 | (192 | ) | 142 | |||||||||||||||||||||||||||||
Balance at December 31, 2016 | — | 5,809,130 | 58 | 100 | — | 3,310 | 33 | (5,254 | ) | (1,717 | ) | (44,092 | ) | (47,662 | ) | ||||||||||||||||||||||||||
Cumulative effect of accounting change due to the adoption of ASU 2016-09 | — | — | — | — | — | 1,039 | — | (120 | ) | — | (801 | ) | 118 | ||||||||||||||||||||||||||||
Net income | — | — | — | — | — | — | — | 927 | 16 | 9,664 | 10,607 | ||||||||||||||||||||||||||||||
Change in fair value of available-for-sale securities, net of income tax benefit | — | — | — | — | — | — | (1,334 | ) | — | — | (8,943 | ) | (10,277 | ) | |||||||||||||||||||||||||||
Stock-based compensation | — | — | — | — | — | 2,770 | — | — | — | — | 2,770 | ||||||||||||||||||||||||||||||
Dividends on Class A common stock ($0.20 per share) | — | — | — | — | — | — | — | (5,766 | ) | — | — | (5,766 | ) | ||||||||||||||||||||||||||||
Reclass of cumulative dividends on forfeited RSUs to compensation and benefits expense | — | — | — | — | — | — | — | 668 | — | — | 668 | ||||||||||||||||||||||||||||||
Issuance of Class A common stock related to vesting of restricted stock units, net of shares withheld for employee taxes | — | 193,282 | 2 | — | — | (715 | ) | — | — | — | — | (713 | ) | ||||||||||||||||||||||||||||
Repurchases of Class A common stock | — | (521,344 | ) | (5 | ) | — | — | (3,584 | ) | — | — | — | — | (3,589 | ) | ||||||||||||||||||||||||||
Distributions | — | — | — | — | — | — | — | — | (1 | ) | (23,229 | ) | (23,230 | ) | |||||||||||||||||||||||||||
Balance at December 31, 2017 | $ | — | 5,481,068 | $ | 55 | 100 | $ | — | $ | 2,820 | $ | (1,301 | ) | $ | (9,545 | ) | $ | (1,702 | ) | $ | (67,401 | ) | $ | (77,074 | ) | ||||||||||||||||
See accompanying notes to consolidated financial statements
F- 5
Medley Management Inc.
Consolidated Statements of Cash Flows
(Amounts in thousands)
For the Year Ended December 31, | |||||||||||
2017 | 2016 | 2015 | |||||||||
Cash flows from operating activities | |||||||||||
Net income | $ | 17,309 | $ | 9,952 | $ | 20,632 | |||||
Adjustments to reconcile net income to net cash provided by operating activities: | |||||||||||
Stock-based compensation | 2,770 | 3,811 | 3,052 | ||||||||
Amortization of debt issuance costs | 1,579 | 1,018 | 545 | ||||||||
Accretion of debt discount | 1,126 | 958 | 776 | ||||||||
Provision for (benefit from) deferred taxes | 424 | (267 | ) | (904 | ) | ||||||
Depreciation and amortization | 911 | 913 | 454 | ||||||||
Net change in unrealized depreciation (appreciation) on investments | 554 | (27 | ) | 885 | |||||||
(Income) loss from equity method investments | (41 | ) | 93 | 12,578 | |||||||
Reclassification of cumulative dividends paid on forfeited restricted stock units to compensation and benefits expense | 668 | — | — | ||||||||
Other non-cash amounts | (13 | ) | 169 | — | |||||||
Changes in operating assets and liabilities: | |||||||||||
Management fees receivable | (2,084 | ) | 3,542 | (999 | ) | ||||||
Performance fees receivable | 1,741 | (2,443 | ) | 3,055 | |||||||
Distributions of income received from equity method investments | 629 | 1,475 | — | ||||||||
Other assets | 1,674 | (1,617 | ) | (4,915 | ) | ||||||
Accounts payable, accrued expenses and other liabilities | (12,249 | ) | (1,682 | ) | (11,096 | ) | |||||
Cash and cash equivalents of consolidated fund | (164 | ) | — | — | |||||||
Investments of consolidated fund | (2,005 | ) | — | — | |||||||
Other assets of consolidated fund | (665 | ) | — | — | |||||||
Other liabilities of consolidated fund | 235 | — | — | ||||||||
Net cash provided by operating activities | 12,399 | 15,895 | 24,063 | ||||||||
Cash flows from investing activities | |||||||||||
Purchases of fixed assets | (73 | ) | (1,935 | ) | (795 | ) | |||||
Capital contributions to equity method investments | (322 | ) | (279 | ) | (1,074 | ) | |||||
Distributions received from equity method investment | 172 | 203 | 496 | ||||||||
Purchases of investments | (34,980 | ) | (16,815 | ) | — | ||||||
Net cash used in investing activities | (35,203 | ) | (18,826 | ) | (1,373 | ) | |||||
Cash flows from financing activities | |||||||||||
Repayments of loans payable | (44,800 | ) | (50,513 | ) | (1,250 | ) | |||||
Proceeds from issuance of senior unsecured debt | 69,108 | 52,588 | — | ||||||||
Capital contributions from redeemable non-controlling interests | 23,000 | 17,022 | — | ||||||||
Distributions to members and non-controlling interests | (29,968 | ) | (23,656 | ) | (32,744 | ) | |||||
Debt issuance costs | (2,868 | ) | (2,916 | ) | — | ||||||
Dividends paid | (5,766 | ) | (5,521 | ) | (4,113 | ) | |||||
Repurchases of Class A common stock | (3,589 | ) | (1,198 | ) | (101 | ) | |||||
Payments for taxes related to net share settlement of equity awards | (713 | ) | — | ||||||||
Net cash provided by (used in) financing activities | 4,404 | (14,194 | ) | (38,208 | ) | ||||||
Net decrease in cash, cash equivalents and restricted cash equivalents | (18,400 | ) | (17,125 | ) | (15,518 | ) | |||||
Cash, cash equivalents and restricted cash equivalents, beginning of year | 54,563 | 71,688 | 87,206 | ||||||||
Cash, cash equivalents and restricted cash equivalents, end of year | $ | 36,163 | $ | 54,563 | $ | 71,688 | |||||
See accompanying notes to consolidated financial statements
F- 6
Medley Management Inc.
Consolidated Statements of Cash Flows
(Amounts in thousands)
For the Year Ended December 31, | |||||||||||
2017 | 2016 | 2015 | |||||||||
Reconciliation of cash, cash equivalents, and restricted cash equivalents reported on the consolidated balance sheets to the total of such amounts reported on the consolidated statements of cash flows | |||||||||||
Cash and cash equivalents | $ | 36,163 | $ | 49,666 | $ | 71,688 | |||||
Restricted cash equivalents | — | 4,897 | — | ||||||||
Total cash, cash equivalents and restricted cash equivalents | $ | 36,163 | $ | 54,563 | $ | 71,688 | |||||
Supplemental cash flow information | |||||||||||
Interest paid | $ | 8,664 | $ | 7,992 | $ | 6,576 | |||||
Income taxes paid | 933 | 2,085 | 4,982 | ||||||||
Supplemental disclosure of non-cash investing and financing activities | |||||||||||
Investment in MOF I LP attributed to deconsolidation | $ | — | $ | — | $ | 1,768 | |||||
Investment in MOF II LP attributed to deconsolidation | — | — | 10,474 | ||||||||
Deferred tax asset impact on cumulative effect of accounting change due to the adoption of ASU 2016-09 (Note 2) | 118 | — | — | ||||||||
Reclassification of redeemable non-controlling interest (Note 14) | — | 12,155 | — | ||||||||
Fixed assets | — | 2,293 | — | ||||||||
Issuance of non-controlling interest, at fair value | — | 192 | — | ||||||||
Change in fair value of available-for-sale securities, net of income tax benefit | 10,306 | — | — | ||||||||
See accompanying notes to consolidated financial statements
F- 7
Medley Management Inc.
Notes to Consolidated Financial Statements
1. ORGANIZATION AND BASIS OF PRESENTATION
Medley Management Inc. is an alternative asset management firm offering yield solutions to retail and institutional investors. The Company's national direct origination franchise provides capital to the middle market in the United States of America. Medley Management Inc., through its consolidated subsidiary, Medley LLC, provides investment management services to permanent capital vehicles, long-dated private funds and separately managed accounts and serves as the general partner to the private funds, which are generally organized as pass-through entities. Medley LLC is headquartered in New York City.
The Company’s business is currently comprised of only one reportable segment, the investment management segment, and substantially all of the Company operations are conducted through this segment. The investment management segment provides investment management services to permanent capital vehicles, long-dated private funds and separately managed accounts. The Company conducts its investment management business in the U.S., where substantially all its revenues are generated.
Initial Public Offering of Medley Management Inc.
Medley Management Inc. was incorporated on June 13, 2014 and commenced operations on September 29, 2014 upon the completion of its initial public offering (“IPO”) of its Class A common stock. Medley Management Inc. raised $100.4 million, net of underwriting discount, through the issuance of 6,000,000 shares of Class A common stock at an offering price to the public of $18.00 per share. Medley Management Inc. used the offering proceeds to purchase 6,000,000 newly issued LLC Units (defined below) from Medley LLC. Prior to the IPO, Medley Management Inc. had not engaged in any business or other activities except in connection with its formation and IPO.
In connection with the IPO, Medley Management Inc. issued 100 shares of Class B common stock to Medley Group LLC (“Medley Group”), an entity wholly owned by the pre-IPO members of Medley LLC. For as long as the pre-IPO members and then-current Medley personnel hold at least 10% of the aggregate number of shares of Class A common stock and LLC Units (defined below) (excluding those LLC Units held by Medley Management Inc.) then outstanding, the Class B common stock entitles Medley Group to a number of votes that is equal to 10 times the aggregate number of LLC Units held by all non-managing members of Medley LLC that do not themselves hold shares of Class B common stock and entitle each other holder of Class B common stock, without regard to the number of shares of Class B common stock held by such other holder, to a number of votes that is equal to 10 times the number of membership units held by such holder. The Class B common stock does not participate in dividends and does not have any liquidation rights.
Medley LLC Reorganization
In connection with the IPO, Medley LLC amended and restated its limited liability agreement to modify its capital structure by reclassifying the 23,333,333 interests held by the pre-IPO members into a single new class of units (“LLC Units”). The pre-IPO members also entered into an exchange agreement under which they (or certain permitted transferees thereof) have the right, subject to the terms of an exchange agreement, to exchange their LLC Units for shares of Medley Management Inc.’s Class A common stock on a one-for-one basis, subject to customary conversion rate adjustments for stock splits, stock dividends and reclassifications. In addition, pursuant to the amended and restated limited liability agreement, Medley Management Inc. became the sole managing member of Medley LLC.
The pre-IPO owners were, subject to limited exceptions, prohibited from transferring any LLC Units held by them or any shares of Class A common stock received upon exchange of such LLC Units, until September 29, 2017, which was the third anniversary of the date of the closing of the IPO, without the Company’s consent. Thereafter and prior to the fourth and fifth anniversaries of the closing of the IPO, such holders may not transfer more than 33 1/3% and 66 2/3%, respectively, of the number of LLC Units held by them, together with the number of any shares of Class A common stock received by them upon exchange therefore, without the Company’s consent.
Basis of Presentation
The accompanying consolidated financial statements have been prepared on the accrual basis of accounting in conformity with U.S. generally accepted accounting principles (“GAAP”) and include the accounts of Medley Management Inc., Medley LLC and its consolidated subsidiaries (collectively, “Medley” or the “Company”).
F- 8
Medley Management Inc.
Notes to Consolidated Financial Statements
2. SUMMARY OF SIGNIFICANT ACCOUNTING POLICIES
Principles of Consolidation
In accordance with Accounting Standards Codification (“ASC”) 810, Consolidation, the Company consolidates those entities where it has a direct and indirect controlling financial interest based on either a variable interest model or voting interest model. As such, the Company consolidates entities that the Company concludes are variable interest entities (“VIEs”), for which the Company is deemed to be the primary beneficiary and entities in which it holds a majority voting interest or has majority ownership and control over the operational, financial and investing decisions of that entity.
In February 2015, the Financial Accounting Standards Board (“FASB”) issued ASU 2015-02, Consolidation (Topic 810) – Amendments to the Consolidation Analysis, which changes the consolidation analysis that a reporting entity must perform to determine whether it should consolidate certain types of legal entities. The Company elected to early adopt this new guidance using the modified retrospective method effective January 1, 2015. As a result of the adoption of ASU 2015-02, the Company determined that it is no longer the primary beneficiary of certain funds it manages. Therefore, the Company deconsolidated certain funds that had been consolidated under previous guidance effective January 1, 2015.
For legal entities evaluated for consolidation, the Company must determine whether the interests that it holds and fees paid to it qualify as a variable interest in an entity. This includes an evaluation of the management fees and performance fees paid to the Company when acting as a decision maker or service provider to the entity being evaluated. If fees received by the Company are customary and commensurate with the level of services provided, and the Company does not hold other economic interests in the entity that would absorb more than an insignificant amount of the expected losses or returns of the entity, the interest that the Company holds would not be considered a variable interest. The Company factors in all economic interests including proportionate interests through related parties, to determine if fees are considered a variable interest.
An entity in which the Company holds a variable interest is a VIE if any one of the following conditions exist: (a) the total equity investment at risk is not sufficient to permit the legal entity to finance its activities without additional subordinated financial support, (b) the holders of equity investment at risk have the right to direct the activities of the entity that most significantly impact the legal entity’s economic performance, (c) the voting rights of some investors are disproportionate to their obligation to absorb losses or rights to receive returns from a legal entity. For limited partnerships and other similar entities, non-controlling investors must have substantive rights to either dissolve the fund or remove the general partner (“kick-out rights”) in order to not qualify as a VIE.
For those entities that qualify as a VIE, the primary beneficiary is generally defined as the party who has a controlling financial interest in the VIE. The Company is generally deemed to have a controlling financial interest if it has the power to direct the activities of a VIE that most significantly impact the VIE’s economic performance, and the obligation to absorb losses or receive benefits from the VIE that could potentially be significant to the VIE. The Company determines whether it is the primary beneficiary of a VIE at the time it becomes initially involved with the VIE and reconsiders that conclusion continuously. The primary beneficiary evaluation is generally performed qualitatively on the basis of all facts and circumstances. However, quantitative information may also be considered in the analysis, as appropriate. These assessments require judgment. Each entity is assessed for consolidation on a case-by-case basis.
For those entities evaluated under the voting interest model, the Company consolidates the entity if it has a controlling financial interest. The Company has a controlling financial interest in a voting interest entity (“VOE”) if it owns a majority voting interest in the entity.
Consolidated Variable Interest Entities
Medley Management Inc. is the sole managing member of Medley LLC and, as such, it operates and controls all of the business and affairs of Medley LLC and, through Medley LLC, conducts its business. Under ASC 810, Medley LLC meets the definition of a VIE because the equity of Medley LLC is not sufficient to permit activities without additional subordinated financial support. Medley Management Inc. has the obligation to absorb expected losses that could be significant to Medley LLC and holds 100% of the voting power, therefore Medley Management Inc. is considered to be the primary beneficiary of Medley LLC.
As a result, Medley Management Inc. consolidates the financial results of Medley LLC and its subsidiaries and records a non-controlling interest for the economic interest in Medley LLC held by the non-managing members. Medley Management Inc.’s and the non-managing members’ economic interests in Medley LLC are 18.7% and 81.3%, respectively, as of December 31, 2017 and 19.9% and 80.1%, respectively, as of December 31, 2016. Net income attributable to the non-controlling interests in Medley LLC on the consolidated statements of operations represents the portion of earnings attributable to the economic interest in Medley LLC held by its non-managing members. Non-controlling interests in Medley LLC on the consolidated balance sheets represents the portion of net assets of Medley LLC attributable to the non-managing members based on total LLC Units of Medley LLC owned by such non-managing members.
F- 9
Medley Management Inc.
Notes to Consolidated Financial Statements
As of December 31, 2017 and 2016, Medley LLC had four majority owned subsidiaries, SIC Advisors LLC, Medley Seed Funding I LLC, Medley Seed Funding II LLC and STRF Advisors LLC, which are consolidated VIEs. Each of these entities were organized as a limited liability company and was legally formed to either manage a designated fund or to strategically invest capital as well as isolate business risk. As of December 31, 2017, total assets and total liabilities, after eliminating entries, of these VIEs reflected in the consolidated balance sheets were $63.3 million and $13.0 million, respectively. As of December 31, 2016, total assets and total liabilities, after eliminating entries, of these VIEs reflected in the consolidated balance sheets were $51.7 million and $22.8 million, respectively. Except to the extent of the assets of these VIEs that are consolidated, the holders of the consolidated VIEs’ liabilities generally do not have recourse to the Company.
Seed Investments
The Company accounts for seed investments through the application of the voting interest model under ASC 810-10-25-1 through 25-14 and consolidates a seed investment when the investment advisor holds a controlling interest, which is, in general, 50% or more of the equity in such investment. For seed investments in which the Company does not hold a controlling interest, the Company accounts for such seed investment under the equity method of accounting, at its ownership percentage of such seed investment’s net asset value.
The Company seed funded $2.1 million to Sierra Total Return Fund ("STRF"), which commenced investment operations in June 2017. As of December 31, 2017, the Company owned 100% of the equity of STRF and, as such, consolidated STRF in its consolidated financial statements.
The condensed balance sheet of STRF as of December 31, 2017 is presented in the table below (in thousands).
As of December 31, 2017 | |||
Assets | |||
Cash and cash equivalents | $ | 164 | |
Investments, at fair value | 2,005 | ||
Other assets | 1,698 | ||
Total assets | $ | 3,867 | |
Liabilities and Equity | |||
Accrued expenses and other liabilities | $ | 1,744 | |
Equity | 2,123 | ||
Total liabilities and equity | $ | 3,867 | |
The Company's consolidated balance sheet reflects the elimination of $1.0 million of other assets, $1.5 million of accrued expenses and other liabilities and $2.1 million of equity as a result of the consolidation of STRF. During the year ended December 31, 2017, the fund did not generate any significant income or losses from operations.
Non-Consolidated Variable Interest Entities
The Company holds interests in certain VIEs that are not consolidated because the Company is not deemed the primary beneficiary. The Company's interest in these entities is in the form of insignificant equity interests and fee arrangements. The maximum exposure to loss represents the potential loss of assets by the Company relating to these non-consolidated entities.
As of December 31, 2017, the Company recorded investments, at fair value, attributed to these non-consolidated VIEs of $4.8 million, receivables of $2.4 million included as a component of other assets and a clawback obligation of $7.2 million included as a component of accounts payable, accrued expenses and other liabilities on the Company’s consolidated balance sheets. The clawback obligation assumes a hypothetical liquidation of a fund’s investments, at their then current fair values and a portion of tax distributions relating to performance fees which would need to be returned. As of December 31, 2016, the Company recorded investments, at fair value, attributed to non-consolidated VIEs of $5.1 million, receivables of $1.9 million included as a component of other assets and a clawback obligation of $7.1 million included as a component of accounts payable, accrued expenses and other liabilities on the Company’s consolidated balance sheets. As of December 31, 2017, the Company’s maximum exposure to losses from these entities is $7.2 million.
Concentration of Credit and Market Risk
In the normal course of business, the Company's underlying funds encounter significant credit and market risk. Credit risk is the risk of default on investments in debt securities, loans and derivatives that result from a borrower's or derivative counterparty's inability or unwillingness to make required or expected payments. Credit risk is increased in situations where the Company's
F- 10
Medley Management Inc.
Notes to Consolidated Financial Statements
underlying funds are investing in distressed assets or unsecured or subordinate loans or in securities that are a material part of its respective business. Market risk reflects changes in the value of investments due to changes in interest rates, credit spreads or other market factors. The Company's underlying funds may make investments outside of the United States. These non-U.S. investments are subject to the same risks associated with U.S. investments, as well as additional risks, such as fluctuations in foreign currency exchange rates, unexpected changes in regulatory requirements, heightened risk of political and economic instability, difficulties in managing the investments, potentially adverse tax consequences, and the burden of complying with a wide variety of foreign laws.
Use of Estimates
The preparation of financial statements in conformity with U.S. GAAP requires management to make estimates and assumptions that affect the reported amounts of assets and liabilities and disclosures of contingent assets and liabilities at the date of the financial statements and the reported amounts of income and expenses during the reporting period. Management’s estimates are based on historical experience and other factors, including expectations of future events that management believes to be reasonable under the circumstances. These assumptions and estimates also require management to exercise judgment in the process of applying the Company’s accounting policies. Significant estimates and assumptions by management affect the carrying value of investments, performance compensation payable and certain accrued liabilities. Actual results could differ from these estimates, and such differences could be material.
Indemnification
In the normal course of business, the Company enters into contractual agreements that provide general indemnifications against losses, costs, claims and liabilities arising from the performance of individual obligations under such agreements. The Company has not experienced any prior claims or payments pursuant to such agreements. The Company’s individual maximum exposure under these arrangements is unknown, as this would involve future claims that may be made against the Company that have not yet occurred. However, based on management’s experience, the Company expects the risk of loss to be remote.
Non-Controlling Interests in Consolidated Subsidiaries
Non-controlling interests in consolidated subsidiaries represent the component of equity in such consolidated entities held by third-parties. These interests are adjusted for contributions to and distributions from Medley entities and are allocated income from Medley entities based on their ownership percentages.
Redeemable Non-Controlling Interests
Redeemable non-controlling interests represents interests of certain third parties that are not mandatorily redeemable but redeemable for cash or other assets at a fixed or determinable price or a fixed or determinable date, at the option of the holder or upon the occurrence of an event that is not solely within the control of the issuer. These interests are classified in the mezzanine section of the Company's consolidated balance sheets.
Cash and Cash Equivalents
Cash and cash equivalents include liquid investments in money market funds and demand deposits. The Company had cash balances with financial institutions in excess of Federal Deposit Insurance Corporation insured limits during the years ended December 31, 2017 and 2016. The Company monitors the credit standing of these financial institutions and has not experienced, and has no expectations of experiencing any losses with respect to such balances.
Restricted Cash Equivalents
Restricted cash equivalents consist of cash held at one of the Company's subsidiaries which was contributed by the Company and third-party investors, and could only be used to purchase investments in new and existing Medley managed funds.
Investments
Investments include equity method investments that are not consolidated but over which the Company exerts significant influence. The Company measures the carrying value of its public non-traded equity method investment at Net Asset Value ("NAV") per share. The Company measures the carrying value of its privately-held equity method investments by recording its share of the underlying income or loss of these entities.
Unrealized appreciation (depreciation) resulting from changes in fair value of the equity method investments is reflected as a component of other income (expense), net in the consolidated statements of operations. The Company evaluates its equity method investments for impairment whenever events or changes in circumstances indicate that the carrying amounts of such investments may not be recoverable.
F- 11
Medley Management Inc.
Notes to Consolidated Financial Statements
The carrying amounts of equity method investments are reflected in investments in the consolidated balance sheets. As the underlying entities that the Company manages and invests in are, for U.S. GAAP purposes, primarily investment companies which reflect their investments at estimated fair value, the carrying value of the Company’s equity method investments in such entities approximates fair value. The Company evaluates its equity-method investments for impairment whenever events or changes in circumstances indicate that the carrying amounts of such investments may not be recoverable.
For presentation in its consolidated statements of cash flows, the Company treats distributions received from certain equity method investments using the cumulative earnings approach. Under the cumulative earnings approach, an investor would compare the distributions received to its cumulative equity-method earnings since inception. Any distributions received up to the amount of cumulative equity earnings would be considered a return on investment and classified in operating activities. Any excess distributions would be considered a return of investment and classified in investing activities.
Investments also include available-for-sale securities which consist of an investment in publicly traded common stock. The Company measures the carrying value of its publicly traded investment in available-for-sale securities at the quoted market price on the primary market or exchange on which they trade. Unrealized appreciation (depreciation) resulting from changes in fair value of available-for-sale securities is recorded in accumulated other comprehensive income, redeemable non-controlling interests and non-controlling interests in Medley LLC. Realized gains (losses) and declines in value determined to be other than temporary, if any, are reported in other income (expenses), net. The Company evaluates its investment in available-for-sale securities for impairment whenever events or changes in circumstances indicate that the carrying amounts of such investment may not be recoverable.
Fixed Assets
Fixed assets consist primarily of furniture, fixtures, computer equipment, and leasehold improvements and are recorded at cost, less accumulated depreciation and amortization.
The Company calculates depreciation expense for furniture, fixtures, and computer equipment using the straight-line method over the estimated useful life used for the respective assets, which generally ranges from three to seven years. Amortization of leasehold improvements is provided on a straightline basis over the shorter of the remaining term of the underlying lease or estimated useful life of the improvement. Useful lives of leasehold improvements range from three to eight years. Expenditures for major additions and improvements are capitalized, while minor replacements, maintenance and repairs are charged to expense as incurred. When property is retired or otherwise disposed of, the cost and accumulated depreciation are removed from accounts and any resulting gain or loss is reflected in Other income (expense), net in the consolidated statements of operations.
Debt Issuance Costs
Debt issuance costs represent direct costs incurred in obtaining financing and are amortized over the term of the underlying debt using the effective interest method. Debt issuance costs associated with the Company’s revolving credit facility are presented as a deferred charge and are included as a component of other assets on the Company's consolidated balance sheets. Debt issuance costs associated with the Company’s senior unsecured debt are presented as a direct reduction in the carrying value of such debt, consistent with the presentation of debt discount. Amortization of debt issuance costs is included as a component of interest expense in the Company's consolidated statement of operations.
Revenues
Management Fees
Medley provides investment management services to both public and private investment vehicles. Management fees include base management fees, other management fees, and Part I incentive fees, as described below.
Base management fees are calculated based on either (i) the average or ending gross assets balance for the relevant period, (ii) limited partners’ capital commitments to the funds, (iii) invested capital, (iv) NAV or (v) lower of cost or market value of a fund’s portfolio investments. Depending upon the contracted terms of the investment management agreement, management fees are paid either quarterly in advance or quarterly in arrears, and are recognized as earned over the period the services are provided.
Certain management agreements provide for Medley to receive other management fee revenue derived from up front origination fees paid by the funds' and/or separately managed accounts' underlying portfolio companies. These fees are recognized when Medley becomes entitled to such fees.
Certain management agreements also provide for Medley to receive Part I incentive fee revenue derived from net investment income (excluding gains and losses) above a hurdle rate. As it relates to Medley Capital Corporation (“MCC”), these fees are subject to netting against realized and unrealized losses. Part I incentive fees are paid quarterly and are recognized as earned in the period the services are provided.
F- 12
Medley Management Inc.
Notes to Consolidated Financial Statements
Performance Fees
Performance fees consist principally of the allocation of profits from certain funds and separately managed accounts, to which Medley provides management services. Medley is generally entitled to an allocation of income as a performance fee after returning the invested capital plus a specified preferred return as set forth in each respective agreement. Medley recognizes revenues attributable to performance fees based upon the amount that would be due pursuant to the respective agreement at each period end as if the funds were terminated as of that date (Method 2 of ASC 605, Revenue Recognition, revenue based on a formula). Accordingly, the amount recognized in the Company's consolidated financial statements reflects Medley’s share of the gains and losses of the associated funds’ underlying investments measured at their current fair values. Performance fee revenue may include reversals of previously recognized performance fees due to a decrease in the investment performance of a particular fund that results in a decrease of cumulative performance fees earned to date. Since fund return hurdles are cumulative, previously recognized performance fees also may be reversed in a period of appreciation that is lower than the particular fund’s hurdle rate. During the year ended December 31, 2017, the Company recorded reversals of $2.6 million of previously recognized performance fees. During the year ended December 31, 2016, the Company did not reverse previously recognized performance fees. During the year ended December 31, 2015, the Company reversed $24.0 million of previously recognized performance fees. As of December 31, 2017, the Company recognized cumulative performance fees of $5.3 million.
Performance fees received in prior periods may be required to be returned by Medley in future periods if the funds’ investment performance declines below certain levels. Each fund is considered separately in this regard and, for a given fund, performance fees can never be negative over the life of a fund. If upon a hypothetical liquidation of a fund’s investments, at their then current fair values, previously recognized and distributed performance fees would be required to be returned, a liability is established for the potential clawback obligation. As of December 31, 2017, the Company had not received any performance fee distributions, except for tax distributions related to the Company’s allocation of net income, which included an allocation of performance fees. Pursuant to the organizational documents of each respective fund, a portion of these tax distributions may be subject to clawback. As of December 31, 2017, the Company had accrued $7.2 million for clawback obligations that would need to be paid if the funds were liquidated at fair value as of the end of the reporting period. The Company’s actual obligation, however, would not become payable or realized until the end of a fund’s life.
Other Revenues and Fees
Medley provides administrative services to certain affiliated funds and is reimbursed for direct and allocated expenses incurred in providing such administrative services, as set forth in the respective underlying agreements. These fees are recognized as revenue in the period administrative services are rendered. Medley also acts as the administrative agent on certain deals for which Medley may earn loan administration fees and transaction fees. These fees are recognized as revenue over the period to which the fees directly relate.
Performance Fee Compensation
Medley has issued profit interests in certain subsidiaries to select employees. These profit-sharing arrangements are accounted for under ASC 710, Compensation — General, which requires compensation expense to be measured at fair value at the grant date and expensed over the vesting period, which is usually the period over which the service is provided. The fair value of the profit interests are re-measured at each balance sheet date and adjusted for changes in estimates of cash flows and vesting percentages. The impact of such changes is recorded in the consolidated statements of operations as an increase or decrease to performance fee compensation.
Stock-based Compensation
The Company accounts for stock-based compensation in accordance with ASC 718, Compensation – Stock Compensation. Stock-based compensation cost is measured as of the grant date based on the fair value of the award and is recognized as expense over the requisite service period.
Prior to January 1, 2017, the fair value of the awards were amortized on a straight line basis over the requisite service period as stock based compensation expense and was reduced for the impact of estimated forfeitures. The Company estimated forfeitures based on its historical experience and revised its estimate if actual forfeitures differed from its initial estimates. Effective January 1, 2017, the Company adopted a change in accounting policy as a result of the adoption of ASU 2016-09 to account for forfeitures as they occur. As such, stock based compensation expense relating to equity based awards are measured at fair value as of the grant date, reduced for actual forfeitures in the period they occur, and expensed over the requisite service period on a straight-line basis as a component of compensation and benefits on the Company's consolidated statements of operations.
F- 13
Medley Management Inc.
Notes to Consolidated Financial Statements
Income Taxes
The Company accounts for income taxes using the asset and liability approach, which requires the recognition of tax benefits or expenses for temporary differences between the financial reporting and tax basis of assets and liabilities. A valuation allowance is established when necessary to reduce deferred tax assets to the amounts expected to be realized. The Company also recognizes a tax benefit from uncertain tax positions only if it is “more likely than not” that the position is sustainable based on its technical merits. The Company’s policy is to recognize interest and penalties on uncertain tax positions and other tax matters as a component of provision for income taxes. For interim periods, the Company accounts for income taxes based on its estimate of the effective tax rate for the year. Discrete items and changes in its estimate of the annual effective tax rate are recorded in the period they occur.
Medley Management Inc. is subject to U.S. federal, state and local corporate income taxes on its allocable portion of the income of Medley LLC at prevailing corporate tax rates. Medley LLC and its subsidiaries are not subject to federal, state and local corporate income taxes since all income, gains and losses are passed through to its members. However, a portion of taxable income from Medley LLC and its subsidiaries are subject to New York City’s unincorporated business tax, which is included in the Company’s provision for income taxes.
The Company analyzes its tax filing positions in all of the U.S. federal, state and local tax jurisdictions where it is required to file income tax returns, as well as for all open tax years in these jurisdictions. If, based on this analysis, the Company determines that uncertainties in tax positions exist, a liability is established.
Class A Earnings per Share
The Company computes and presents earnings per share using the two-class method. Under the two-class method, the Company allocates earnings between common stock and participating securities. The two-class method includes an earnings allocation formula that determines earnings per share for each class of common stock according to dividends declared and undistributed earnings for the period. For purposes of calculating earnings per share, the Company reduces its reported net earnings by the amount allocated to participating securities to arrive at the earnings allocated to Class A common stockholders. Earnings are then divided by the weighted average number of Class A common stock outstanding to arrive at basic earnings per share. Diluted earnings per share reflects the potential dilution beyond shares for basic earnings per share that could occur if securities or other contracts to issue common stock were exercised, converted into common stock, or resulted in the issuance of common stock that would have shared in our earnings. Participating securities consist of the Company's unvested restricted stock units that contain non-forfeitable rights to dividend equivalent payments, whether paid or unpaid, in the number of shares outstanding in its basic and diluted calculations.
Leases
Certain lease agreements contain escalating payments and rent holiday periods. The related rent expense is recorded on a straight-line basis over the length of the lease term. The difference between rent expense and rent paid is recorded as deferred rent. Leasehold improvements made by the lessee and funded by landlord allowances or other incentives are also recorded as deferred rent and are amortized as a reduction in rent expense over the term of the lease. Deferred rent is included as a component of accounts payable, accrued expenses and other liabilities on the consolidated balance sheets.
Recently Issued Accounting Pronouncements Adopted as of January 1, 2017
In March 2016, the FASB issued ASU 2016-09, Improvements to Employee Share-Based Payment Accounting, which simplifies and improves several aspects of the accounting for share-based payment transactions, including the income tax consequences, classification of awards as either equity or liabilities and classification on the statement of cash flows. The Company adopted ASU 2016-09 effective January 1, 2017.
Under the new guidance, all excess tax benefits and tax deficiencies related to employee stock compensation are recognized within provision for income taxes. Under prior guidance, excess tax benefits were recognized in additional paid-in capital and tax deficiencies were recognized in the provision for income taxes only to the extent they exceeded the pool of excess tax benefits. In addition, under the new guidance, excess tax benefits are classified as cash flows from operating activities, and cash withheld by the Company for employees' withholding taxes are classified as cash flows from financing activities on its consolidated statements of cash flows. In connection with the adoption of ASU 2016-09, the Company elected to account for forfeitures as they occur, instead of utilizing an estimated forfeiture rate assumption. The change in accounting for forfeitures was applied on a modified retrospective basis by means of a cumulative-effect adjustment to equity. As of January 1, 2017, retained earnings and non-controlling interests in Medley LLC decreased by $0.1 million and $0.8 million, respectively, additional paid in capital increased by $1.0 million and a deferred tax asset was recorded in the amount of $0.1 million to reflect the change in accounting principle.
F- 14
Medley Management Inc.
Notes to Consolidated Financial Statements
Recently Issued Accounting Pronouncements Not Yet Adopted
In May 2014, the FASB issued ASU 2014-09, Revenue from Contracts with Customers (Topic 606), and since then, has issued several amendments intended to provide interpretive clarifications and to reduce the cost and complexity of applying the new revenue recognition standard, both at transition and on an ongoing basis. The core principle of this guidance is that an entity should recognize revenue to depict the transfer of promised goods or services to customers in an amount that reflects the consideration to which the entity expects to be entitled in exchange for such goods or services. To achieve this, entities will apply a five step approach: (1) identify the contract(s) with a customer, (2) identify the performance obligations within the contract, (3) determine the transaction price, (4) allocate the transaction price to the separate performance obligations and (5) recognize revenue when, or as, each performance obligation is satisfied. The guidance also requires advanced disclosures regarding the nature, amount, timing and uncertainty of revenue and cash flows arising from an entity’s contracts with customers.
This guidance is effective for the Company beginning on January 1, 2018 and entities have the option of adopting this guidance using either a full retrospective or a modified retrospective approach. The Company has adopted this guidance as of January 1, 2018 using the modified retrospective method. Under this method, the Company will recognize the cumulative-effect of adoption of this guidance as an adjustment to retained earnings as of January 1, 2018, as further described below, but will not restate prior periods presented in its consolidated financial statements.
Effective January 1, 2018, the Company’s current policy of recognizing performance fees earned from certain funds and separately managed accounts, which do not represent a capital allocation to the general partner or investment manager will change. Currently such fees are being recognized on a hypothetical liquidation basis as of each reporting date (Method 2 of ASC 605, Revenue Recognition, for revenue based on a formula). Effective January 1, 2018, the Company will not be able to recognize such fees until such time that it is probable that a significant reversal in cumulative performance fees will not occur in the future. For performance fees earned which represent a capital allocation to the general partner or investment manager, the Company will effect a change in accounting policy and account for them under ASC 323, Investments - Equity Method and Joint Ventures. As such, these types of performance fees will not be in the scope of ASU 2014-09 and its related amendments. The Company expects that the pattern and amount of recognition under this new policy will not differ materially from the Company’s historical recognition of such fees, however the presentation and disclosure of such fees and the income from capital allocations related to these fees will be altered. The change in accounting policy for performance fees earned which represent a capital allocation to the general partner or investment manager will be retrospectively applied.
Additionally, as of the date of adoption, the Company will no longer be deferring reimbursable organizational, offering and other pre-launch costs associated with a fund’s formation. Effective January 1, 2018, the Company will be expense such costs as incurred until the respective fund commences operations and receives third party committed capital. Reimbursements for these costs will be recognized as a component of other revenues in the Company’s consolidated statements of operations when received.
As a result of the adoption of this new guidance, the Company expects to record a cumulative effect decrease to equity by approximately $3.7 million, pre-tax, as of January 1, 2018, which relates to certain performance fee revenue that would not have met the “probable that significant reversal will not occur” criteria of $3.0 million and the reversal of reimbursable fund formation costs which were deferred on the Company’s consolidated balance sheet of $0.7 million. Also, certain reimbursable costs incurred on behalf of the Company's funds that were previously presented net in the Company's consolidated statements of operations will be presented on a gross basis beginning January 1, 2018. The Company is currently in the final stages of implementing this new guidance which includes finalization of its documentation over the adoption of this new guidance. The Company does not expect any significant changes from the way it previously recognized management and incentive fees as the result of its adoption of ASU 2014-09 or its change in accounting policy for performance fees earned which represent a capital allocation to the general partner or investment manager.
In January 2016, the FASB issued ASU 2016-01, Financial Instruments – Overall: Recognition and Measurement of Financial Assets and Financial Liabilities, which requires that all equity investments (except those accounted for under the equity method of accounting) be measured at fair value with changes in fair value recognized in net income. This guidance eliminates the available-for-sale classification for equity securities with readily determinable fair values. However, companies may elect to measure equity investments that do not have readily determinable fair values at cost minus impairment, if any, plus or minus changes resulting from observable price changes in orderly transactions for an identical or similar investment of the same issuer. This new guidance became effective for the Company on January 1, 2018. Under this new guidance, changes in the fair value of available-for-sale securities will no longer be classified in the Company's consolidated statements of comprehensive income but rather as a component of other income (expense), net in its consolidated statements of operations. As a result of the adoption of this ASU, on January 1, 2018, the Company reclassed $1.3 million of cumulative unrealized losses, net of income tax benefit, from accumulated other comprehensive (loss) income to accumulated deficit on the Company's consolidated balance sheet. The adoption of this ASU may have a significant impact to the consolidated statements of operations going forward as any changes to the fair value of our available-for-sale securities will now be reflected within other income in the Company's consolidated statements of operations.
F- 15
Medley Management Inc.
Notes to Consolidated Financial Statements
In February 2016, the FASB issued ASU 2016-02, Leases (Topic 842). This guidance requires an entity to recognize assets and liabilities arising from a lease for both financing and operating leases, along with additional qualitative and quantitative disclosures. This new guidance will become effective for the Company on January 1, 2019, with early adoption permitted. The Company is currently evaluating the impact of adopting this standard on its consolidated financial statements. However, the adoption of this guidance is expected to result in a significant increase in total assets and total liabilities, but is not expected to have a significant impact on the consolidated statements of operations.
In May 2017, the FASB issued ASU 2017-09, Scope of Modification Accounting. This guidance clarifies when changes to share-based payment awards must be accounted for as modifications. The guidance requires an entity to apply modification accounting guidance if the value, vesting conditions or classification of the award changes but will provide relief to entities that make non-substantive changes to their share-based payment awards. This new guidance became effective for the Company on January 1, 2018. The Company has evaluated the impact of adopting this standard on its consolidated financial statements, and it did not have a significant impact on the Company's consolidated financial statements.
In February 2018, the FASB issued ASU 2018-02, Income Statement - Reporting Comprehensive Income (Topic 220): Reclassification of Certain Tax Effects from Accumulated Other Comprehensive Income. This guidance permits entities to reclassify tax effects stranded in accumulated other comprehensive income (OCI) as a result of tax reform to retained earnings. The final guidance gives entities the option to reclassify these amounts, but requires new disclosures, regardless of whether they elect to do so. An entity can apply this new guidance either (1) in the period of adoption or (2) retrospectively to each period in which the income tax effects of the Tax Cuts and Jobs Act related to items in accumulated OCI are recognized. The guidance is effective for fiscal years beginning after December 15, 2018, and interim periods within those fiscal years. Early adoption in any period is permitted. The adoption of this guidance is not expected to have a material impact on the Company's consolidated financial statements.
The Company does not believe any other recently issued, but not yet effective, revisions to authoritative guidance will have a material effect on its consolidated balance sheets, results of operations or cash flows.
3. INVESTMENTS
Investments consist of the following:
As of December 31, | |||||||
2017 | 2016 | ||||||
(Amounts in thousands) | |||||||
Equity method investments, at fair value | $ | 13,903 | $ | 14,895 | |||
Investment in available-for-sale securities | 40,491 | 17,009 | |||||
Investments of consolidated fund | 2,005 | — | |||||
Total investments, at fair value | $ | 56,399 | $ | 31,904 | |||
Equity Method Investments
Medley measures the carrying value of its public non-traded equity method investment at NAV per share. Unrealized appreciation (depreciation) resulting from changes in NAV per share is reflected as a component of other income (expense) in the consolidated statements of operations. The carrying value of the Company’s privately-held equity method investments is determined based on the amounts invested by the Company plus the equity in earnings or losses of the investee allocated based on the respective underlying agreements, less distributions received.
The Company evaluates its equity method investments for impairment whenever events or changes in circumstances indicate that the carrying amounts of such investments may not be recoverable. There were no impairment losses recorded during the year ended December 31, 2017. During the year ended December 31, 2016, the Company recorded a $0.5 million loss on its investment in CK Pearl Fund which is included as a component of other income (expense), net on the consolidated statement of operations. There were no impairment losses recorded during the year ended December 31, 2015.
As of December 31, 2017 and 2016, the Company’s carrying value of its equity method investments was $13.9 million and $14.9 million, respectively. The Company's equity method investment in shares of Sierra Income Corporation (“SIC”), a related party, were $8.5 million and $9.0 million as of December 31, 2017 and 2016, respectively. The remaining balance as of December 31, 2017 and 2016 relates primarily to the Company’s investments in Medley Opportunity Fund II, LP ("MOF II"), Medley Opportunity Fund III LP (“MOF III”) and CK Pearl Fund, LP.
F- 16
Medley Management Inc.
Notes to Consolidated Financial Statements
The entities in which the Company's investments are accounted for under the equity method, other than CK Pearl Fund, L.P., are considered to be related parties.
Investment in available-for-sale securities
The Company's investment in shares of Medley Capital Corporation ("MCC") is classified as available-for-sale securities. As of December 31, 2017 and 2016, the Company’s carrying value of its investment in shares of MCC, a related party, was $40.5 million and $17.0 million, respectively, and consisted of 7,756,938 and 2,264,892 shares, respectively. The Company measures the carrying value of its investment in MCC at fair value based on the quoted market price on the exchange on which its shares trade. As of December 31, 2017, cumulative unrealized losses in non-controlling interests in Medley LLC and accumulated other comprehensive income (loss), net of income tax benefit on the Company's consolidated balance sheets was $8.8 million, and $1.3 million respectively. As of December 31, 2017, there were no cumulative unrealized gains or losses included in the balance of redeemable non-controlling interests.
Investments of consolidated fund
Medley measures the carrying value of its investments held by its consolidated fund at fair value. As of December 31, 2017, investments of consolidated fund consisted of $0.4 million of equity investments and $1.6 million of investments in senior secured loans. The change in Investments of consolidated fund per the Company's consolidated statements of cash flows represents approximately $2.5 million in purchases offset by approximately $0.5 million of sales. See Note 4 "Fair Value Measurements" for more information.
4. FAIR VALUE MEASUREMENTS
The Company follows the guidance set forth in ASC 820 for measuring the fair value of investments in available-for-sale securities. Fair value is the price that would be received from the sale of an asset or paid to transfer a liability in an orderly transaction between market participants at the measurement date. Where available, fair value is based on observable market prices or parameters, or derived from such prices or parameters. Where observable prices or inputs are not available, valuation models are applied. These valuation models involve some level of management estimation and judgment, the degree of which is dependent on the price transparency for the instruments or market and the instruments’ complexity. The Company’s fair value analysis includes an analysis of the value of any unfunded loan commitments. Financial investments recorded at fair value in the consolidated financial statements are categorized for disclosure purposes based upon the level of judgment associated with the inputs to the valuation of the investment as of the measurement date. Investments which are valued using NAV as a practical expedient are excluded from this hierarchy:
• | Level I – Valuations based on quoted prices in active markets for identical assets or liabilities at the measurement date. |
• | Level II – Valuations based on inputs other than quoted prices in active markets included in Level I, which are either directly or indirectly observable at the measurement date. This category includes quoted prices for similar assets or liabilities in active markets, quoted prices for identical or similar assets or liabilities in non- active markets including actionable bids from third parties for privately held assets or liabilities, and observable inputs other than quoted prices such as yield curves and forward currency rates that are entered directly into valuation models to determine the value of derivatives or other assets or liabilities. |
• | Level III – Valuations based on inputs that are unobservable and where there is little, if any, market activity at the measurement date. The inputs for the determination of fair value may require significant management judgment or estimation and are based upon management’s assessment of the assumptions that market participants would use in pricing the assets and liabilities. These investments include debt and equity investments in private companies or assets valued using the Market or Income Approach and may involve pricing models whose inputs require significant judgment or estimation because of the absence of any meaningful current market data for identical or similar investments. The inputs in these valuations may include, but are not limited to, capitalization and discount rates, beta and EBITDA multiples. The information may also include pricing information or broker quotes which include a disclaimer that the broker would not be held to such a price in an actual transaction. The non-binding nature of consensus pricing and/or quotes accompanied by disclaimer would result in classification as Level III information, assuming no additional corroborating evidence. |
F- 17
Medley Management Inc.
Notes to Consolidated Financial Statements
The following tables summarize the fair value hierarchy of the Company's financial assets measured at fair value (in thousands):
As of December 31, 2017 | |||||||||||||||
Level I | Level II | Level III | Total | ||||||||||||
Assets | |||||||||||||||
Investments of consolidated fund | $ | 435 | $ | — | $ | 1,570 | $ | 2,005 | |||||||
Investment in available-for-sale securities | 40,491 | — | — | 40,491 | |||||||||||
Total Assets | $ | 40,926 | $ | — | $ | 1,570 | $ | 42,496 | |||||||
As of December 31, 2016 | |||||||||||||||
Level I | Level II | Level III | Total | ||||||||||||
Assets | |||||||||||||||
Investment in available-for-sale securities | $ | 17,009 | $ | — | $ | — | $ | 17,009 | |||||||
Total Assets | $ | 17,009 | $ | — | $ | — | $ | 17,009 | |||||||
The Company’s investment in available-for-sale securities consist of shares of MCC. Included in investments of consolidated fund as of December 31, 2017 are Level I assets of $0.4 million in equity investments and Level III assets of $1.6 million, which consists of senior secured loans and preferred equity investments. The significant unobservable inputs used in the fair value measurement of Level III assets of the consolidated fund's investments in senior secured loans include market yields. Significant increases or decreases in market yields in isolation would result in a significantly higher or lower fair value measurement. There were no significant unrealized gains or losses related to the investments of consolidated fund for the year ended December 31, 2017.
The following is a summary of changes in fair value of the Company's financial assets that have been categorized within Level III of the fair value hierarchy at December 31, 2017 (in thousands):
Level III Financial Assets as of December 31, 2017 | |||||||||||||||||||
Balance at December 31, 2016 | Purchases | Transfers In or (Out) of Level III | Sale of Level III Assets | Balance at December 31, 2017 | |||||||||||||||
Investments of consolidated fund | $ | — | $ | 1,894 | $ | — | $ | (324 | ) | $ | 1,570 | ||||||||
A review of the fair value hierarchy classifications is conducted on a quarterly basis. Changes in the observability of valuation inputs may result in a reclassification for certain financial assets or liabilities. Reclassifications impacting all levels of the fair value hierarchy are reported as transfers in or out of Level I, II or III category as of the beginning of the quarter during which the reclassifications occur. There were no transfers between levels in the fair value hierarchy during the year ended December 31, 2017.
There were no financial instruments classified as Level II or Level III as of December 31, 2016 and there were no transfers between levels in the fair value hierarchy during the year ended December 31, 2016.
When determining the fair value of publicly traded equity securities, the Company uses the quoted closing market price as of the valuation date on the primary market or exchange on which they trade. Our equity method investments for which fair value is measured at NAV per share, or its equivalent, using the practical expedient, are not categorized in the fair value hierarchy.
The Company's Investments of consolidated fund are accounted for under a manner consistent with trading securities as STRF is considered an investment company under ASC 946 for standalone reporting purposes, and its investments are therefore also treated in a manner consistent with trading securities.
F- 18
Medley Management Inc.
Notes to Consolidated Financial Statements
5. OTHER ASSETS
Other assets consist of the following:
As of December 31, | |||||||
2017 | 2016 | ||||||
(Amounts in thousands) | |||||||
Fixed assets, net of accumulated depreciation and amortization of $2,370 and $1,816, respectively | $ | 4,160 | $ | 4,998 | |||
Security deposits | 1,975 | 1,975 | |||||
Administrative fees receivable (Note 10) | 1,903 | 2,068 | |||||
Deferred tax assets (Note 12) | 2,777 | 2,001 | |||||
Due from affiliates (Note 10) | 2,979 | 2,133 | |||||
Prepaid expenses and taxes | 1,353 | 3,078 | |||||
Other assets, excluding assets of consolidated fund | 1,450 | 2,058 | |||||
Other assets of consolidated fund | 665 | — | |||||
Total other assets | $ | 17,262 | $ | 18,311 | |||
6. LOANS PAYABLE
Loans payable consist of the following:
As of December 31, | |||||||
2017 | 2016 | ||||||
(Amounts in thousands) | |||||||
Term loans under the Credit Suisse Term Loan Facility, net of unamortized discount and debt issuance costs of $1,207 at December 31, 2016 | $ | — | $ | 43,593 | |||
Non-recourse promissory notes, net of unamortized discount of $767 and $1,415, respectively | 9,233 | 8,585 | |||||
Total loans payable | $ | 9,233 | $ | 52,178 | |||
CNB Credit Agreement
On August 19, 2014, the Company entered into a $15.0 million senior secured revolving credit facility with City National Bank, which was amended in August 2015, May 2016 and September 2017 (as amended, the “Revolving Credit Facility”). Pursuant to the terms of the amendment in September 2017 ("the Amendment"), the maturity date was extended to March 31, 2020. The Amendment also provides for an incremental facility in an amount up to $10.0 million upon the fulfillment of certain customary conditions, as well as other changes. The Company intends to use any proceeds from borrowings under the Revolving Credit Facility for general corporate purposes, including funding of its working capital needs. Borrowings under the Revolving Credit Facility bear interest, at the option of the Company, either (i) at an Alternate Base Rate, as defined, plus an applicable margin not to exceed 0.25% or (ii) at an Adjusted LIBOR plus an applicable margin not to exceed 2.5%. As of and during the year ended December 31, 2017, there were no amounts drawn under the Revolving Credit Facility. The capitalized terms below are defined in the Revolving Credit Facility, where applicable.
The Revolving Credit Facility also contains financial covenants that require the Company to maintain a Maximum Net Leverage Ratio, as defined, of not greater than 5.0 to 1.0, a Total Leverage Ratio, as defined, of not greater than 7.0 to 1.0 and Core EBITDA, as defined, of not less than $15.0 million. These ratios are calculated on a trailing twelve months basis and are calculated using the Company’s financial results and include adjustments made to calculate Core EBITDA. Non-compliance with any of the financial or non-financial covenants without cure or waiver would constitute an event of default. The Revolving Credit Facility also contains customary negative covenants and other customary events of default, including defaults based on events of bankruptcy and insolvency, dissolution, nonpayment of principal, interest or fees when due, breach of specified covenants, change in control and material inaccuracy of representations and warranties. There were no events of default under the Revolving Credit Facility as of December 31, 2017.
F- 19
Medley Management Inc.
Notes to Consolidated Financial Statements
Credit Suisse Term Loan Facility
On August 14, 2014, the Company entered into a $110.0 million senior secured term loan credit facility (as amended, “Term Loan Facility”) with Credit Suisse AG, Cayman Islands Branch, as administrative agent and collateral agent thereunder, Credit Suisse Securities (USA) LLC, as bookrunner and lead arranger, and the lenders from time-to-time party thereto, which had an original maturity date of June 15, 2019. In February 2017, borrowings under this facility were paid off using the proceeds from the issuance of senior unsecured debt and the Term Loan Facility was terminated.
Interest expense under the Term Loan Facility, including accretion of the note discount and amortization of debt issuance costs, as well as the deferred issuance costs associated with the Revolving Credit facility, for the year ending December 31, 2017, 2016 and 2015 was $1.6 million, $6.7 million, and $7.0 million, respectively.
Non-Recourse Promissory Notes
In April 2012, the Company borrowed $10.0 million under two non-recourse promissory notes. Proceeds from the borrowings were used to purchase 1,108,033 shares of common stock of SIC, which were pledged as collateral for the obligations. Interest on the notes is paid monthly and is equal to the dividends received by the Company related to the pledged shares. The Company may prepay the notes in whole or in part at any time without penalty and the lenders may call the notes if certain conditions are met. The notes are scheduled to mature in March 2019. The proceeds from the notes were recorded net of issuance costs of $3.8 million and are being accreted, using the effective interest method, over the term of the non-recourse promissory notes. Total interest expense under these notes, including accretion of the notes discount, was $1.4 million for each of the years ended December 31, 2017, 2016 and 2015. The fair value of the outstanding balance of the notes was $10.1 million and $10.2 million as of December 31, 2017 and 2016, respectively.
Contractual Maturities of Loans Payable
As of December 31, 2017, $10.0 million of future principal payments will be due, relating to loans payable, during the year ended December 31, 2019.
7. SENIOR UNSECURED DEBT
The carrying value of the Company’s senior unsecured debt consist of the following:
As of December 31, | |||||||
2017 | 2016 | ||||||
(Amounts in thousands) | |||||||
2026 Notes, net of unamortized discount and debt issuance costs of $3,266 and $3,802, respectively | $ | 50,329 | $ | 49,793 | |||
2024 Notes, net of unamortized premium and debt issuance costs of $2,437 at December 31, 2017 | 66,563 | — | |||||
Total senior unsecured debt | $ | 116,892 | $ | 49,793 | |||
2026 Notes
On August 9, 2016 and October 18, 2016, the Company issued debt consisting of $53.6 million in aggregate principal amount of senior unsecured notes due 2026 at a stated coupon rate of 6.875% (the "2026 Notes"). The net proceeds from these offerings were used to pay down a portion of the Company's outstanding indebtedness under its Term Loan Facility. Interest is payable quarterly and interest payments commenced on November 15, 2016. The 2026 Notes are subject to redemption in whole or in part at any time or from time to time, at the option of the Company, on or after August 15, 2019 at a redemption price per security equal to 100% of the outstanding principal amount thereof plus accrued and unpaid interest payments. The 2026 notes were recorded net of discount and direct issuance costs of $3.8 million which are being amortized over the term of the notes using the effective interest rate method. The 2026 Notes are listed on the New York Stock Exchange and trades thereon under the trading symbol “MDLX.” The fair value of the 2026 Notes based on their underlying quoted market price was $53.1 million as of December 31, 2017.
Interest expense on the 2026 Notes, including accretion of note discount and amortization of debt issuance costs, was $4.0 million and $1.2 million for the years ended December 31, 2017 and 2016, respectively.
2024 Notes
On January 18, 2017 and February 22, 2017, the Company issued $69.0 million in aggregate principal amount of senior unsecured notes due 2024 at a stated coupon rate of 7.25% (the "2024 Notes"). The net proceeds from these offerings were used
F- 20
Medley Management Inc.
Notes to Consolidated Financial Statements
to pay down the remaining portion of the Company's outstanding indebtedness under its Term Loan Facility with the remaining to be used for general corporate purposes. Interest is payable quarterly and interest payments commenced on April 30, 2017. The 2024 Notes are subject to redemption in whole or in part at any time or from time to time, at the option of the Company, on or after January 30, 2020 at a redemption price per security equal to 100% of the outstanding principal amount thereof plus accrued and unpaid interest payments. The 2024 notes were recorded net of premium and direct issuance costs of $2.8 million which are being amortized over the term of the notes using the effective interest rate method. The 2024 Notes are listed on the New York Stock Exchange and trades thereon under the trading symbol “MDLQ.” The fair value of the 2024 Notes based on their underlying quoted market price was $69.6 million as of December 31, 2017.
Interest expense on the 2024 Notes, including amortization of debt premium and debt issuance costs, was $4.9 million for the year ended December 31, 2017.
8. ACCOUNTS PAYABLE, ACCRUED EXPENSES AND OTHER LIABILITIES
Accounts payable, accrued expenses and other liabilities consist of the following:
As of December 31, | |||||||
2017 | 2016 | ||||||
(Amounts in thousands) | |||||||
Accrued compensation and benefits | $ | 6,835 | $ | 7,978 | |||
Due to affiliates (Note 10) | 7,315 | 15,043 | |||||
Revenue share payable (Note 9) | 3,841 | 6,472 | |||||
Accrued interest | 1,294 | 558 | |||||
Professional fees | 1,366 | 1,527 | |||||
Deferred rent | 2,506 | 2,833 | |||||
Deferred tax liabilities (Note 12) | 92 | 202 | |||||
Performance fee compensation | 111 | 985 | |||||
Accounts payable and other accrued expenses | 1,535 | 1,657 | |||||
Liabilities of consolidated fund | 235 | — | |||||
Total accounts payable, accrued expenses and other liabilities | $ | 25,130 | $ | 37,255 | |||
9. COMMITMENTS AND CONTINGENCIES
Operating Leases
Medley leases office space in New York City and San Francisco under non-cancelable lease agreements that expire at various times through September 2023. Rent expense was $2.4 million, $2.5 million and $2.6 million for the years ended December 31, 2017, 2016 and 2015, respectively.
As of December 31, 2017. future minimum rental payments under non-cancelable leases are as follows (in thousands):
2018 | $ | 2,704 | |
2019 | 2,710 | ||
2020 | 2,833 | ||
2021 | 2,431 | ||
2022 | 2,431 | ||
Thereafter | 1,823 | ||
Total future minimum lease payments | $ | 14,932 | |
During the first quarter of 2018, the Company initiated the consolidation of its business activities to its New York office. The Company believes this will enhance operations by consolidating origination, underwriting and asset management operations and personnel in a single location. The Company estimates the associated one-time costs to be approximately $2.6 million, primarily related to certain severance costs. The Company anticipates that most of these charges will be recognized during the first and second quarters of 2018. At this time, the Company does not anticipate a material change in overall headcount upon completion of the consolidation.
F- 21
Medley Management Inc.
Notes to Consolidated Financial Statements
Capital Commitments to Funds
As of December 31, 2017 and 2016, the Company had aggregate unfunded commitments of $0.3 million and $0.5 million, respectively, to certain long-dated private funds.
Other Commitments
In April 2012, the Company entered into an obligation to pay a fixed percentage of management and incentive fees received by the Company from SIC. The agreement was entered into contemporaneously with the $10.0 million non-recourse promissory notes that were issued to the same parties (Note 6). The two transactions were deemed to be related freestanding contracts and the $10.0 million of loan proceeds were allocated to the contracts using their relative fair values. At inception, the Company recognized an obligation of $4.4 million representing the present value of the future cash flows expected to be paid under this agreement. As of December 31, 2017 and 2016, this obligation amounted to $3.8 million and $6.5 million, respectively, and is recorded as revenue share payable, a component of accounts payable, accrued expenses and other liabilities on the consolidated balance sheets. The change in the estimated cash flows for this obligation is recorded in other income (expense), net on the consolidated statements of operations.
Legal Proceedings
From time to time, the Company is involved in various legal proceedings, lawsuits and claims incidental to the conduct of its business. Its business is also subject to extensive regulation, which may result in regulatory proceedings against it. Except as described below, the Company is not currently party to any material legal proceedings.
One of the Company's subsidiaries, MCC Advisors LLC, was named as a defendant in a lawsuit on May 29, 2015, by Moshe Barkat and Modern VideoFilm Holdings, LLC (“MVF Holdings”) against MCC, MOF II, MCC Advisors LLC, Deloitte Transactions and Business Analytics LLP A/K/A Deloitte ERG (“Deloitte”), Scott Avila (“Avila”), Charles Sweet, and Modern VideoFilm, Inc. (“MVF”). The lawsuit is pending in the California Superior Court, Los Angeles County, Central District, as Case No. BC 583437. The lawsuit was filed after MCC, as agent for the lender group, exercised remedies following a series of defaults by MVF and MVF Holdings on a secured loan with an outstanding balance at the time in excess of $65 million. The lawsuit sought damages in excess of $100 million. Deloitte and Avila have settled the claims against them in exchange for payment of $1.5 million. Following a separate lawsuit by Mr. Barkat against MVF’s D&O insurance carrier, the carrier, Charles Sweet and MVF have settled the claims against them. On June 6, 2016, the court granted the Medley defendants’ demurrers on several counts and dismissed Mr. Barkat’s claims with prejudice except with respect to his claim for intentional interference with contract. On March 18, 2018, the court granted the Medley defendants’ motion for summary adjudication with respect to Mr. Barkat’s sole remaining claim against the Medley Defendants for intentional interference. Now that the trial court has ruled in favor of the Medley defendants on all counts, the only remaining claims in the Barkat litigation are MCC and MOF II’s affirmative counterclaims against Mr. Barkat and MVF Holdings, which MCC and MOF II are diligently prosecuting.
On August 29, 2016, MVF Holdings filed another lawsuit in the California Superior Court, Los Angeles County, Central District, as Case No. BC 631888 (the “Derivative Action”), naming MCC Advisors LLC and certain of Medley’s employees as defendants, among others. The plaintiff in the Derivative Action, asserts claims against the defendants for breach of fiduciary duty, aiding and abetting breach of fiduciary duty, unfair competition, breach of the implied covenant of good faith and fair dealing, interference with prospective economic advantage, fraud, and declaratory relief. MCC Advisors LLC and the other defendants believe the causes of action asserted in the Derivative Action are without merit and all defendants intend to continue to assert a vigorous defense.
Medley LLC, MCC, and MOF II were named as defendants, along with other various parties, in a putative class action lawsuit captioned as Royce Solomon, Jodi Belleci, Michael Littlejohn, and Giulianna Lomaglio v. American Web Loan, Inc., AWL, Inc., Mark Curry, MacFarlane Group, Inc., The MacFarlane Group, LLC, Sol Partners, Medley Opportunity Fund, II, LP, Medley LLC, Medley Capital Corporation, Oakmont Funding, Inc., Dinero Investments, Inc., Chieftain Funding, Inc., Dant Holdings, Inc., DHI Computing Service, Inc., Smith Haynes & Watson, LLC, Middlemarch Partners, and John Does 1-100, filed on December 15, 2017, in the United States District Court for the Eastern District of Virginia, Newport News Division, as Case No. 4:17-cv-145 (hereinafter, “Class Action 1”). MOF II and MCC were also named as defendants, along with various other parties, in a putative class action lawsuit captioned George Hengle and Lula Williams v. Mark Curry, American Web Loan, Inc., AWL, Inc., Red Stone, Inc., Medley Opportunity Fund II LP, and Medley Capital Corporation, filed February 13, 2018, in the United States District Court, Eastern District of Virginia, Richmond Division, as Case No. 3:18-cv-100 (“Class Action 2”) (together with Class Action 1, the “Class Action Complaints”). The plaintiffs in the Class Action Complaints filed their putative class actions alleging claims under the Racketeer Influenced and Corrupt Organizations Act, and various other claims arising out of the alleged payday lending activities of American Web Loan. The claims against MOF II, Medley LLC, and MCC (in Class Action 1), and the claims against MOF II and MCC (in Class Action 2), allege that those defendants in each respective action exercised control over American Web Loan’s payday lending activities as a result of a loan to American Web Loan. The loan was made by MOF II in 2011. American Web Loan
F- 22
Medley Management Inc.
Notes to Consolidated Financial Statements
repaid the loan from MOF II in full in February of 2015, more than 1 year and 10 months prior to any of the loans allegedly made by American Web Loan to the alleged class plaintiff representatives in Class Action 1; in Class Action 2, the alleged class plaintiff representatives have not alleged when they received any loans from American Web Loan. Medley LLC and MCC never made any loans or provided financing to, or had any other relationship with, American Web Loan. MOF II, Medley LLC, and MCC are seeking indemnification from American Web Loan, various affiliates, and other parties with respect to the claims in the Class Action Complaints. MOF II, Medley LLC, and MCC believe the alleged claims in the Class Action Complaints are without merit and they intend to defend these lawsuits vigorously.
10. RELATED PARTY TRANSACTIONS
Substantially all of Medley’s revenue is earned through agreements with its non-consolidated funds for which it collects management and performance fees for providing investment and management services.
Expense Support and Reimbursement Agreement
From June 2012 through December 2016, Medley was party to an Expense Support and Reimbursement Agreement (“ESA”) with SIC. During the term of the ESA, which expired on December 31, 2016, Medley agreed to pay up to 100% of SIC's operating expenses in order for SIC to achieve a reasonable level of expenses relative to its investment income. Pursuant to the ESA, SIC had a conditional obligation to reimburse Medley for any amounts they funded under the ESA if, within three years of the date on which Medley funded such amounts, SIC met certain financial levels. ESA expenses are recorded within general, administrative, and other expense on the consolidated statements of operations. There was no outstanding balance due to SIC under the ESA agreement as of December 31, 2017. As of December 31, 2016 there was $7.9 million due to SIC under the ESA agreement. This amount was included in accounts payable, accrued expenses and other liabilities as due to affiliates on the consolidated balance sheets. During the years ended December 31, 2016 and 2015, Medley recorded $16.1 million and $6.4 million, respectively, of ESA expenses under this agreement.
Administration Agreement
In January 2011 and April 2012, Medley entered into administration agreements with MCC (the “MCC Admin Agreement”) and SIC (the “SIC Admin Agreement”), respectively, whereby Medley agreed to provide administrative services necessary for the operations of MCC and SIC. MCC and SIC agreed to pay Medley for the costs and expenses incurred in providing such administrative services, including an allocable portion of Medley’s overhead expenses and an allocable portion of the cost of MCC and SIC’s officers and their respective staffs.
Additionally, Medley has entered into administration agreements with other entities that it manages (the “Funds Admin Agreements”), whereby Medley agreed to provide administrative services necessary for the operations of these other vehicles. These other entities agreed to pay Medley for the costs and expenses incurred in providing such administrative services, including an allocable portion of Medley’s overhead expenses and an allocable portion of the cost of these other vehicles' officers and their respective staffs.
Medley records these administrative fees as revenue in the period when the services are provided and are included in other revenues and fees on the consolidated statements of operations. Amounts due from these agreements are included as a component of other assets on the Company's consolidated balance sheets.
Total revenues recorded under these agreements for the years ended December 31, 2017, 2016 and 2015 are reflected in the table below:
For the Years Ended December 31, | |||||||||||
2017 | 2016 | 2015 | |||||||||
(Amounts in thousands) | |||||||||||
MCC Admin Agreement | $ | 3,799 | $ | 3,935 | $ | 3,973 | |||||
SIC Admin Agreement | 3,031 | 2,848 | 2,142 | ||||||||
Funds Admin Agreements | 1,264 | 893 | 218 | ||||||||
Total administrative fees from related parties | $ | 8,094 | $ | 7,676 | $ | 6,333 | |||||
F- 23
Medley Management Inc.
Notes to Consolidated Financial Statements
Amounts due from related parties under these agreements are reflected in the table below:
As of December 31, | |||||||
2017 | 2016 | ||||||
(Amounts in thousands) | |||||||
Amounts due from MCC under the MCC Admin Agreement | $ | 867 | $ | 916 | |||
Amounts due from SIC under the SIC Admin Agreement | 696 | 851 | |||||
Amounts due from entities under the Funds Admin Agreements | 340 | 301 | |||||
Total administrative fees receivable | $ | 1,903 | $ | 2,068 | |||
Investments
Refer to Note 3 "Investments" for more information related to the Company's investments in related parties.
Exchange Agreement
Prior to the completion of the Company's IPO, Medley LLC's limited liability agreement was restated among other things, to modify its capital structure by reclassifying the interests held by its existing owners (i.e. the members of Medley prior to the IPO) into the LLC Units. Medley’s existing owners also entered into an exchange agreement under which they (or certain permitted transferees thereof) have the right (subject to the terms of the exchange agreement as described therein), to exchange their LLC Units for shares of Medley Management Inc.’s Class A common stock on a one-for-one basis at fair value, subject to customary conversion rate adjustments for stock splits, stock dividends and reclassifications.
Tax Receivable Agreement
Medley Management Inc. entered into a tax receivable agreement with the holders of LLC Units that provides for the payment by Medley Management Inc. to exchanging holders of LLC Units of 85% of the benefits, if any, that Medley Management Inc. is deemed to realize as a result of increases in tax basis of tangible and intangible assets of Medley LLC from the future exchange of LLC Units for shares of Class A common stock, as well as certain other tax benefits related to entering into the tax receivable agreement, including tax benefits attributable to payments under the tax receivable agreement.
The term of the tax receivable agreement will continue until all such tax benefits under the agreement have been utilized or have expired, unless Medley Management Inc. exercises its right to terminate the tax receivable agreement for an amount based on an agreed value of payments remaining to be made under the agreement. There have been no transactions under this agreement through December 31, 2017.
11. EARNINGS PER CLASS A SHARE
The table below presents basic and diluted net income per share of Class A common stock using the two-class method for the years ended December 31, 2017, 2016 and 2015, respectively:
For the Years Ended December 31, | |||||||||||
2017 | 2016 | 2015 | |||||||||
(Amounts in thousands, except share and per share amounts) | |||||||||||
Basic and diluted net income per share: | |||||||||||
Numerator | |||||||||||
Net income attributable to Medley Management Inc. | $ | 927 | $ | 997 | $ | 3,111 | |||||
Less: Allocation to participating securities | (551 | ) | (892 | ) | (353 | ) | |||||
Net income available to Class A common stockholders | $ | 376 | $ | 105 | $ | 2,758 | |||||
Denominator | |||||||||||
Weighted average shares of Class A common stock outstanding | 5,553,026 | 5,804,042 | 6,002,422 | ||||||||
Net income per Class A share | $ | 0.07 | $ | 0.02 | $ | 0.46 | |||||
The allocation to participating securities above generally represents dividends paid to holders of unvested restricted stock units which reduces net income available to common stockholders.
F- 24
Medley Management Inc.
Notes to Consolidated Financial Statements
The weighted average shares of Class A common stock is the same for both basic and diluted earnings per share as the diluted amount excludes the assumed conversion of 23,653,333 in 2017 and 23,333,333 LLC Units in 2016 and 2015, respectively, to shares of Class A common stock, the impact of which would be antidilutive.
The following table reflects the per share dividend amounts that we declared on our common stock since completion of our initial public offering.
Declaration Dates | Payment Dates | Per Share | ||||
Year ended December 31, 2015 | ||||||
March 29, 2015 | May 6, 2015 | $ | 0.20 | |||
August 10, 2015 | September 4, 2015 | 0.20 | ||||
November 12, 2015 | December 4, 2015 | 0.20 | ||||
February 6, 2016 | March 4, 2016 | 0.20 | ||||
Total | $ | 0.80 | ||||
Year ended December 31, 2016 | ||||||
May 10, 2016 | June 2, 2016 | $ | 0.20 | |||
August 9, 2016 | September 6, 2016 | 0.20 | ||||
November 10, 2016 | December 5, 2016 | 0.20 | ||||
February 9, 2017 | March 6, 2017 | 0.20 | ||||
Total | $ | 0.80 | ||||
Year ended December 31, 2017 | ||||||
May 10, 2017 | May 31, 2017 | $ | 0.20 | |||
August 8, 2017 | September 6, 2017 | 0.20 | ||||
November 8, 2017 | December 6, 2017 | 0.20 | ||||
Total | $ | 0.60 | ||||
12. INCOME TAXES
The provision for (benefit from) income taxes consist of the following:
For the Years Ended December 31, | |||||||||||
2017 | 2016 | 2015 | |||||||||
(Amounts in thousands) | |||||||||||
Current | |||||||||||
Federal | $ | 581 | $ | 272 | $ | 1,546 | |||||
State and local | 951 | 1,058 | 1,373 | ||||||||
Total current provision | 1,532 | 1,330 | 2,919 | ||||||||
Deferred | |||||||||||
Federal | 446 | 158 | (454 | ) | |||||||
State and local | (22 | ) | (425 | ) | (450 | ) | |||||
Total deferred provision | 424 | (267 | ) | (904 | ) | ||||||
Provision for Income Taxes | $ | 1,956 | $ | 1,063 | $ | 2,015 | |||||
Deferred income taxes reflect the net effect of temporary differences between the tax basis of an asset or liability and its reported amount on the Company’s consolidated balance sheets. These temporary differences result in taxable or deductible amounts in future years. The significant components of the Company's deferred tax assets and liabilities included on its consolidated balance sheet are as follows:
F- 25
Medley Management Inc.
Notes to Consolidated Financial Statements
As of December 31, | |||||||
2017 | 2016 | ||||||
(Amounts in thousands) | |||||||
Deferred tax assets | |||||||
Tax goodwill | $ | 557 | $ | 605 | |||
Basis difference in partnership interest | 851 | 417 | |||||
Unrealized losses | 378 | 44 | |||||
Stock-based compensation | 173 | 216 | |||||
New York City unincorporated business tax credit carryforward | 700 | 512 | |||||
Other items | 118 | 207 | |||||
Total deferred tax assets | 2,777 | 2,001 | |||||
Deferred tax liabilities | |||||||
Accrued fee income | 89 | 147 | |||||
Other items | 3 | 55 | |||||
Total deferred tax liabilities | 92 | 202 | |||||
Net deferred tax assets | $ | 2,685 | $ | 1,799 | |||
The Company’s effective tax rate includes a rate benefit attributable to the fact that the Company’s subsidiaries operate as limited liability companies, which are not subject to federal or state income tax. Accordingly, a portion of the Company’s earnings attributable to non-controlling interests are not subject to corporate level taxes. However, a portion of the Company's subsidiaries' income is subject to New York City’s unincorporated business tax. For the years ended December 31, 2017, 2016 and 2015, the Company was only subject to federal, state and city corporate income taxes on its pre-tax income attributable to Medley Management Inc.
A reconciliation of the federal statutory tax rate to the effective tax rates for the years ended December 31, 2017, 2016 and 2015 are as follow:
For the Years Ended December 31, | ||||||||
2017 | 2016 | 2015 | ||||||
Federal statutory rate | 34.0 | % | 34.0 | % | 34.0 | % | ||
Income allocated to non-controlling interests | (29.8 | )% | (28.9 | )% | (26.8 | )% | ||
State and local corporate income taxes | 0.8 | % | 1.2 | % | 1.0 | % | ||
Partnership unincorporated business tax | 2.5 | % | 4.2 | % | 1.7 | % | ||
Permanent differences | (0.6 | )% | — | % | (2.9 | )% | ||
Impact of U.S. tax reform (Tax Cuts and Jobs Act) | 1.4 | % | — | % | — | % | ||
Non-deductible stock-based compensation | 2.0 | % | — | % | — | % | ||
Other | (0.1 | )% | (0.8 | )% | 1.9 | % | ||
Effective tax rate | 10.2 | % | 9.7 | % | 8.9 | % | ||
On December 22, 2017, the U.S. government enacted the Tax Cuts and Jobs Act (the “Tax Act”). The Tax Act includes significant changes to the U.S. corporate income tax system including: a federal corporate rate reduction from 34% to 21%; limitations on the deductibility of interest expense and executive compensation; and the transition of U.S. international taxation from a worldwide tax system to a modified territorial tax system. Changes under the Tax Act are effective for the Company as of January 1, 2018.
ASC 740, Income Taxes, requires the Company to remeasure its deferred tax assets and liabilities as of the date of enactment, with the resulting tax impact accounted for in the reporting period of enactment. Based on the reduction of the corporate income tax rate, the Company re-measured its deferred tax assets and liabilities based on the rates at which they are expected to to be utilized in the future. The impact of this change resulted in a $0.3 million decrease in the Company's deferred tax asset balance and corresponding increase in the provision for income taxes for the year ended December 31, 2017.
Interest expense and penalties related to income tax matters are recognized as a component of the provision for income taxes and were not significant during the years ended December 31, 2017, 2016 and 2015. As of and during the years ended December 31, 2017, 2016 and 2015, there were no uncertain tax positions taken that were not more likely than not to be sustained. The primary
F- 26
Medley Management Inc.
Notes to Consolidated Financial Statements
jurisdictions in which the Company operates in are the United States, New York, New York City, and California. The Company is no longer subject to tax examinations by taxing authorities for tax years prior to 2014.
13. COMPENSATION EXPENSE
Compensation generally includes salaries, bonuses, equity and profit sharing awards. Bonuses, equity and profit sharing awards are accrued over the service period to which they relate. Guaranteed payments made to our senior professionals who are members of Medley LLC are recognized as compensation expense. The guaranteed payments to the Company’s Co-Chief Executive Officers are performance based and are periodically set subject to maximums based on the Company’s total assets under management. Such maximums aggregated to $5.0 million during each of the years ended December 31, 2017, 2016 and 2015. During the years ended December 31, 2017, 2016 and 2015, neither of the Company’s Co-Chief Executive Officers received any guaranteed payments.
Performance Fee Compensation
In October 2010 and January 2014, the Company granted shares of vested profit interests in certain subsidiaries to select employees. These awards are viewed as a profit-sharing arrangement and are accounted for under ASC 710, which requires compensation expense to be recognized over the vesting period, which is usually the period over which service is provided. The shares were vested at grant date, subject to a divestiture percentage based on percentage of service completed from the award grant date to the employee’s termination date. The Company adjusts the related liability quarterly based on changes in estimated cash flows for the profit interests.
In February 2015 and March 2016, the Company granted incentive cash bonus awards to select employees. These awards entitle employees to receive cash compensation based on distributed performance fees received by the Company from certain institutional funds. Eligibility to receive payments pursuant to these incentive awards is based on continued employment and ceases automatically upon termination of employment. Performance compensation expense is recorded based on the fair value of the incentive awards at the date of grant and is recognized on a straight-line basis over the expected requisite service period. The performance compensation liability is subject to re-measurement at the end of each reporting period and any changes in the liability are recognized in such reporting period.
For the years ended December 31, 2017, 2016 and 2015, the Company recorded a reversal of performance fee compensation expense of $0.9 million, $0.3 million and $8.0 million, respectively. As of December 31, 2017 and 2016, total performance fee compensation payable for these awards was $0.1 million and $1.0 million, respectively, and is included as a component of accounts payable, accrued expenses and other liabilities on the Company's consolidated balance sheets.
Retirement Plan
The Company sponsors a defined-contribution 401(k) retirement plan that covers all employees. Employees are eligible to participate in the plan immediately, and participants are 100% vested from the date of eligibility. The Company makes contributions to the plan of 3% of an employee’s eligible wages, up to a maximum limit as determined by the Internal Revenue Service. The Company also pays all administrative fees related to the plan. The Company's accrued contributions to the plan were $0.5 million, $0.6 million and $0.4 million for the years ended December 31, 2017, 2016 and 2015, respectively. As of December 31, 2017 and 2016 the Company's outstanding liability to the plan was $0.5 million.
Stock-Based Compensation
In connection with the IPO, the Company adopted the Medley Management Inc. 2014 Omnibus Incentive Plan (the “Plan”). The purpose of the Plan is to provide a means through which the Company may attract and retain key personnel and to provide a means whereby directors, officers, employees, consultants and advisors (and prospective directors, officers, employees, consultants and advisors) of the Company can acquire and maintain an equity interest in the Company, or be paid incentive compensation, including incentive compensation measured by reference to the value of Medley Management Inc.’s Class A common stock or Medley LLC’s unit interests, thereby strengthening their commitment to the welfare of the Company and aligning their interests with those of the Company’s stockholders. The Plan provides for the issuance of incentive stock options, nonqualified stock options, stock appreciation rights, restricted stock, restricted stock units (“RSUs”), restricted LLC Units, stock bonuses, other stock-based awards and cash awards. The maximum aggregate number of awards available to be granted under the plan, as amended, is 4,500,000, of which all or any portion may be issued as shares of Medley Management Inc.’s Class A common stock or Medley LLC’s unit interests. Shares of Class A common stock issued by the Company in settlement of awards may be authorized and unissued shares, shares held in the treasury of the Company, shares purchased on the market or by private purchase or a combination of the foregoing. As of December 31, 2017, there were 2.5 million awards available to be granted under the Plan.
The fair value of RSUs granted under the Plan is determined to be the fair value of the underlying shares on the date of grant. The fair value of restricted LLC Units of Medley LLC is based on the public share price of MDLY at date of grant, adjusted for
F- 27
Medley Management Inc.
Notes to Consolidated Financial Statements
different distribution rights. The aggregate fair value of these awards is charged to compensation expense on a straight-line basis over the vesting period, which is generally up to five years.
Stock-based compensation was $2.8 million, $3.8 million and $3.1 million during the years ended December 31, 2017, 2016 and 2015, respectively.
A summary of RSU and restricted LLC units activity for the years ended December 31, 2017, 2016 and 2015 is as follows:
Number of RSUs | Weighted Average Grant Date Fair Value | Number of Restricted LLC Units | Weighted Average Grant Date Fair Value | ||||||||||
Balance at December 31, 2014 | 1,197,915 | $ | 17.91 | — | $ | — | |||||||
Granted | 188,404 | 9.96 | — | — | |||||||||
Forfeited | (244,868 | ) | 17.99 | — | — | ||||||||
Vested | (10,647 | ) | 18.00 | — | — | ||||||||
Balance at December 31, 2015 | 1,130,804 | $ | 16.56 | — | $ | — | |||||||
Granted | 597,283 | 5.89 | — | — | |||||||||
Forfeited | (44,200 | ) | 17.24 | — | — | ||||||||
Vested | (31,404 | ) | 6.05 | — | — | ||||||||
Balance at December 31, 2016 | 1,652,483 | $ | 12.88 | — | $ | — | |||||||
Granted | 513,838 | 9.17 | 320,000 | 11.67 | |||||||||
Forfeited | (404,456 | ) | 13.51 | — | — | ||||||||
Vested | (310,472 | ) | 17.29 | — | — | ||||||||
Balance at December 31, 2017 | 1,451,393 | $ | 10.44 | 320,000 | $ | 11.67 | |||||||
The fair value of RSUs vested during the year ended December 31, 2017 was $1.9 million. The vesting of 310,472 restricted stock units resulted in the issuance of 193,282 Class A common shares, as the restricted stock units were net-share settled such that the Company withheld awards with the aggregate fair value equivalent to the employees' minimum statutory tax obligations in accordance with the terms of the Plan. Total tax obligations amounted to $0.7 million and payments to the appropriate taxing authorities are reflected as a financing activity on the Company's consolidated statements of cash flows.
During the year ended December 31, 2017, $2.7 million of previously recognized compensation was reversed relating to forfeited RSUs. In addition, during the year ended December 31, 2017, the Company reclassified cumulative dividends of $0.7 million from retained earnings to other compensation expense as a result of such forfeited RSUs. Unamortized compensation cost related to unvested RSUs and restricted LLC units as of December 31, 2017 was $12.5 million and is expected to be recognized over a weighted average period of 3.2 years.
14. REDEEMABLE NON-CONTROLLING INTERESTS
Changes in redeemable non-controlling interests during the years ended December 31, 2017 and 2016 are reflected in the table below:
For the Years Ended December 31, | |||||||
2017 | 2016 | ||||||
(Amounts in thousands) | |||||||
Beginning balance | $ | 30,805 | $ | — | |||
Net income attributable to redeemable non-controlling interests in consolidated subsidiaries | 6,702 | 2,565 | |||||
Contributions | 23,000 | 17,010 | |||||
Distributions | (6,738 | ) | (994 | ) | |||
Change in fair value of available-for-sale securities | (28 | ) | 28 | ||||
Reclassification of redeemable non-controlling interest | — | 12,196 | |||||
Ending balance | $ | 53,741 | $ | 30,805 | |||
F- 28
Medley Management Inc.
Notes to Consolidated Financial Statements
In January 2016, the Company executed an amendment to SIC Advisors' operating agreement which provided the Company with the right to redeem membership units owned by the minority interest holder. The Company’s redemption right is triggered by the termination of the dealer manager agreement between SIC and SC Distributors LLC, an affiliate of the minority interest holder. As a result of this redemption feature, the Company reclassified the non-controlling interest in SIC Advisors from the equity section to redeemable non-controlling interests in the mezzanine section of the consolidated balance sheet based on its fair value as of the amendment date. The fair value of the non-controlling interest was determined to be $12.2 million on the date of the amendment and was adjusted through a charge to non-controlling interests in Medley LLC. During the year ended December 31, 2017, net income allocated to this non-controlling interest was $4.4 million, and distributions paid were $4.3 million, respectively. As of December 31, 2017, the balance of the redeemable non-controlling interest in SIC Advisors LLC was $13.5 million.
On June 3, 2016, the Company entered into a Master Investment Agreement with DB MED Investor I LLC and DB MED Investor II LLC (the ‘‘Investors’’) to invest up to $50.0 million in new and existing Medley managed funds (the ‘‘Joint Venture’’). The Company agreed to contribute up to $10.0 million and an interest in STRF Advisors LLC, the investment advisor to Sierra Total Return Fund, in exchange for common equity interests in the Joint Venture. On June 6, 2017, the Company entered into an amendment to its Master Investment Agreement with the Investors, which provided for, among other things, an increase in the Company’s capital contribution to up to $13.8 million and extended the term of the Joint Venture from seven to ten years. The Investors agreed to invest up to $40.0 million in exchange for preferred equity interests in the Joint Venture. As of June 30, 2017, the Company and the Investors had fully satisfied their capital contributions. On account of the preferred equity interests, the Investors will receive an 8% preferred distribution, 15% of the Joint Venture’s profits, and all of the profits from the contributed interest in STRF Advisors LLC. Medley has the option, subject to certain conditions, to cause the Joint Venture to redeem the Investors’ interest in exchange for repayment of the outstanding investment amount at the time of redemption, plus certain other considerations. The Investors have the right, after ten years, to redeem their interests in the Joint Venture. As such, the Investors’ interest in the Joint Venture is included as a component of redeemable non-controlling interests on the Company’s consolidated balance sheets and amounted to $40.6 million and $17.5 million as of December 31, 2017 and 2016, respectively. Total contributions to the Joint Venture amounted to $53.8 million and $16.8 million through December 31, 2017 and 2016, respectively, and were used to purchase $51.8 million of MCC shares on the open market and seed fund $2.0 million to STRF. During the year ended December 31, 2017 and 2016, net income allocated to this non-controlling interest was $2.7 million and $0.4 million, respectively. For the year ended December 31, 2017, there was no other comprehensive income as a result of changes in the fair value of MCC shares allocated to this non-controlling interest. Distributions paid during the year ended December 31, 2017 were $2.4 million. There were no distributions paid during the year ended December 31, 2016.
In October 2016, the Company executed an operating agreement for STRF Advisors LLC which provided the Company with the right to redeem membership units owned by the minority interest holder. The Company’s redemption right is triggered by the termination of the dealer manager agreement between STRF and SC Distributors LLC, an affiliate of the minority interest holder. As a result of this redemption feature, the non-controlling interest in STRF Advisors LLC is classified as in redeemable non-controlling interests in the mezzanine section of the balance sheet. During the year ended December 31, 2017, net losses allocated to this redeemable non-controlling interest was $0.4 million. As of December 31, 2017, the balance of the redeemable non-controlling interest in STRF Advisors LLC was $(0.4) million.
15. MARKET AND OTHER RISK FACTORS
Due to the nature of the Medley funds’ investment strategy, their portfolio of investments has significant market and credit risk. As a result, the Company is subject to market and other risk factors, including, but not limited to the following:
Market Risk
The market price of investments may significantly fluctuate during the period of investment. Investments may decline in value due to factors affecting securities markets generally or particular industries represented in the securities markets. The value of an investment may decline due to general market conditions that are not specifically related to such investment, such as real or perceived adverse economic conditions, changes in the general outlook for corporate earnings, changes in interest or currency rates or adverse investor sentiment generally. They may also decline due to factors that affect a particular industry or industries, such as labor shortages or increased production costs and competitive conditions within an industry.
Credit Risk
There are no restrictions on the credit quality of the investments the Company intends to make. Investments may be deemed by nationally recognized rating agencies to have substantial vulnerability to default in payment of interest and/or principal. Some investments may have low-quality ratings or be unrated. Lower rated and unrated investments have major risk exposure to adverse conditions and are considered to be predominantly speculative. Generally, such investments offer a higher return potential than higher rated investments, but involve greater volatility of price and greater risk of loss of income and principal.
F- 29
Medley Management Inc.
Notes to Consolidated Financial Statements
In general, the ratings of nationally recognized rating organizations represent the opinions of agencies as to the quality of the securities they rate. Such ratings, however, are relative and subjective; they are not absolute standards of quality and do not evaluate the market value risk of the relevant securities. It is also possible that a rating agency might not change its rating of a particular issue on a timely basis to reflect subsequent events. The Company may use these ratings as initial criteria for the selection of portfolio assets for the Company but is not required to utilize them.
Limited Liquidity of Investments
The funds managed by the Company invest and intend to continue to invest in investments that may not be readily marketable. Illiquid investments may trade at a discount from comparable, more liquid investments and, at times there may be no market at all for such investments. Subordinate investments may be less marketable, or in some instances illiquid, because of the absence of registration under federal securities laws, contractual restrictions on transfer, the small size of the market or the small size of the issue (relative to issues of comparable interests). As a result, the funds managed by the Company may encounter difficulty in selling its investments or may, if required to liquidate investments to satisfy redemption requests of its investors or debt service obligations, be compelled to sell such investments at less than fair value.
Counterparty Risk
Some of the markets in which the Company, on behalf of its underlying funds, may affect its transactions are “over-the-counter” or “interdealer” markets. The participants in such markets are typically not subject to credit evaluation and regulatory oversight, unlike members of exchange-based markets. This exposes the Company to the risk that a counterparty will not settle a transaction in accordance with its terms and conditions because of a dispute over the terms of the applicable contract (whether or not such dispute is bona fide) or because of a credit or liquidity problem, causing the Company to suffer loss. Such “counterparty risk” is accentuated for contracts with longer maturities where events may intervene to prevent settlement, or where the Company has concentrated its transactions with a single or small group of counterparties.
16. QUARTERLY FINANCIAL DATA (UNAUDITED)
The Company's condensed consolidated unaudited quarterly results of operations for 2017 and 2016 are as follows:
For the Three Months Ended | |||||||||||||||
December 31, 2017 | September 30, 2017 | June 30, 2017 | March 31, 2017 | ||||||||||||
(Amounts in thousands, except share and per share amounts) | |||||||||||||||
Revenues | $ | 18,469 | $ | 16,652 | $ | 16,444 | $ | 13,996 | |||||||
Expenses | 13,635 | 9,878 | 8,509 | 7,581 | |||||||||||
Other income (expense), net | (1,757 | ) | (1,572 | ) | (2,012 | ) | (1,352 | ) | |||||||
Income before income taxes | 3,077 | 5,202 | 5,923 | 5,063 | |||||||||||
Net income | 2,614 | 4,550 | 5,495 | 4,650 | |||||||||||
Net income attributable to redeemable non-controlling interests and non-controlling interests in consolidated subsidiaries | 2,009 | 1,917 | 1,304 | 1,488 | |||||||||||
Net income attributable to non-controlling interests in Medley LLC | 1,107 | 2,172 | 3,617 | 2,768 | |||||||||||
Net income attributable to Medley Management Inc. | $ | (502 | ) | $ | 461 | $ | 574 | $ | 394 | ||||||
Net income (loss) per Class A common stock: | |||||||||||||||
Basic | $ | (0.11 | ) | $ | 0.03 | $ | 0.06 | $ | 0.08 | ||||||
Diluted | $ | (0.11 | ) | $ | 0.03 | $ | 0.06 | $ | 0.08 | ||||||
Weighted average shares - Basic and Diluted | 5,478,910 | 5,342,939 | 5,588,978 | 5,808,626 | |||||||||||
F- 30
Medley Management Inc.
Notes to Consolidated Financial Statements
For the Three Months Ended | |||||||||||||||
December 31, 2016 | September 30, 2016 | June 30, 2016 | March 31, 2016 | ||||||||||||
(Amounts in thousands, except share and per share amounts) | |||||||||||||||
Revenues | $ | 18,251 | $ | 18,880 | $ | 21,326 | $ | 17,571 | |||||||
Expenses | 9,184 | 15,553 | 17,508 | 13,776 | |||||||||||
Other income (expense), net | (1,595 | ) | (2,036 | ) | (2,714 | ) | (2,647 | ) | |||||||
Income before income taxes | 7,472 | 1,291 | 1,104 | 1,148 | |||||||||||
Net income | 6,700 | 1,214 | 1,002 | 1,036 | |||||||||||
Net income attributable to redeemable non-controlling interests and non-controlling interests in consolidated subsidiaries | 1,443 | 438 | 405 | 263 | |||||||||||
Net income attributable to non-controlling interests in Medley LLC | 4,632 | 556 | 539 | 679 | |||||||||||
Net income attributable to Medley Management Inc. | $ | 625 | $ | 220 | $ | 58 | $ | 94 | |||||||
Net income (loss) per Class A common stock: | |||||||||||||||
Basic | $ | 0.07 | $ | — | $ | (0.03 | ) | $ | (0.01 | ) | |||||
Diluted | $ | 0.07 | $ | — | $ | (0.03 | ) | $ | (0.01 | ) | |||||
Weighted average shares - Basic and Diluted | 5,809,130 | 5,778,409 | 5,777,726 | 5,851,129 | |||||||||||
17. SUBSEQUENT EVENTS
Management has evaluated subsequent events through the date of issuance of the consolidated financial statements included herein. There have been no subsequent events that occurred during such period that would require disclosure in this Form 10-K or would be required to be recognized in the consolidated financial statements as of and for the year ended December 31, 2017, except as disclosed below.
On February 7, 2018, the Company’s Board of Directors declared a dividend of $0.20 per share of Class A common stock for the fourth quarter of 2017. The dividend will be paid on March 7, 2018 to stockholders of record as of February 22, 2018.
F- 31
Medley Management Inc.
Notes to Consolidated Financial Statements
Item 9. Changes and Disagreements with Accountants on Accounting and Financial Disclosure
None.
Item 9A. Controls and Procedures
Evaluation of Disclosure Controls and Procedures
We maintain disclosure controls and procedures (as that term is defined in Rules 13a-15(e) and 15d-15(e) under the Exchange Act) that are designed to ensure that information required to be disclosed in our reports under the Exchange Act is recorded, processed, summarized and reported within the time periods specified in the SEC’s rules and forms, and that such information is accumulated and communicated to our management, including our co-principal executive officers and principal financial officer, as appropriate, to allow timely decisions regarding required disclosures. The design of any disclosure controls and procedures is based in part upon certain assumptions about the likelihood of future events, and there can be no assurance that any design will succeed in achieving its stated goals under all potential future conditions. Any controls and procedures, no matter how well designed and operated, can provide only reasonable, not absolute, assurance of achieving the desired control objectives. Our management, with the participation of our Co-Chief Executive Officers and our Chief Financial Officer, has evaluated the effectiveness of the design and operation of our disclosure controls and procedures as of the end of the period covered by this report. Based upon that evaluation, and subject to the foregoing, our Co-Chief Executive Officers and our Chief Financial Officer have concluded that, as of the end of the period covered by this report, the design and operation of our disclosure controls and procedures were effective to accomplish their objectives at the reasonable assurance level.
Changes in Internal Control over Financial Reporting
There have been no changes in our internal control over financial reporting (as that term is defined in Rules 13a-15(f) and 15d-15(f) under the Exchange Act) during the quarter ended December 31, 2017, that have materially affected, or are reasonably likely to materially affect, our internal control over financial reporting.
Management’s Report on Internal Control over Financial Reporting
Our management is responsible for establishing and maintaining adequate internal control over our financial reporting. Our internal control over financial reporting is designed to provide reasonable assurances regarding the reliability of financial reporting and the preparation of our consolidated financial statements in accordance with U.S. generally accepted accounting principles.
Our internal control over financial reporting includes those policies and procedures that (i) pertain to the maintenance of records that, in reasonable detail, accurately and fairly reflect the transactions and dispositions of our assets; (ii) provide reasonable assurance that transactions are recorded as necessary to permit preparation of financial statements in accordance with U.S. generally accepted accounting principles, and that receipts and expenditures are being made only in accordance with authorizations of our management and directors; and (iii) provide reasonable assurance regarding prevention or timely detection of unauthorized acquisition, use or disposition of our assets that could have a material effect on the financial statements.
Because of its inherent limitations, internal control over financial reporting may not prevent or detect misstatements. Also, projections of any evaluation of effectiveness to future periods are subject to the risk that controls may become inadequate because either conditions change or the degree of compliance with our policies and procedures may deteriorate.
Our management has assessed the effectiveness of our internal control over financial reporting as of December 31, 2017. In making this assessment, management used the framework set forth by the Committee of Sponsoring Organizations of the Treadway Commission (COSO) in Internal Control-Integrated Framework (2013). Based on this assessment, our management concluded that our internal control over financial reporting was effective as of December 31, 2017.
Item 9B. Other Information
During the first quarter of 2018, the Company initiated the consolidation of its business activities to its New York office. The Company believes this will enhance operations by consolidating origination, underwriting and asset management operations and personnel in a single location. The Company estimates the associated one-time costs to be approximately $2.3 million, primarily related to certain severance costs. The Company anticipates that most of these charges will be recognized during the first and second quarters of 2018. This is expected to reduce expenses by approximately $1.0 million annually, primarily related to a reduction in real estate and operational expenses. At this time, the Company does not anticipate a material change in overall headcount upon completion of the consolidation.
69
PART III .
Item 10. Directors, Executive Officers and Corporate Governance
Directors and Executive Officers
The following table sets forth certain information about our directors and executive officers as of March 29, 2018.
Name | Age | Position | ||
Brook Taube | 48 | Co-Chief Executive Officer and Co-Chairman of the Board of Directors | ||
Seth Taube | 48 | Co-Chief Executive Officer and Co-Chairman of the Board of Directors | ||
Jeffrey Tonkel | 47 | President and Director | ||
James G. Eaton | 41 | Director | ||
Jeffrey T. Leeds | 62 | Director | ||
Guy Rounsaville, Jr. | 74 | Director | ||
Richard T. Allorto, Jr. | 46 | Chief Financial Officer | ||
John D. Fredericks | 54 | General Counsel and Secretary | ||
Directors
Brook Taube, 48, co-founded Medley in 2006 and has served as our Co-Chief Executive Officer since then and as Co-Chairman of the Board of Directors of Medley Management Inc. since its formation. He has also served as Chief Executive Officer and Chairman of the Board of Directors of Medley Capital Corporation since 2011, has served on the Board of Directors of Sierra Income Corporation since its inception in 2012 and the Board of Trustees of Sierra Total Return Fund since its inception in 2016. Prior to forming Medley, Mr. Taube was a Partner with CN Opportunity Fund, T3 Group, a principal and advisory firm focused on distressed asset and credit investments, and Griphon Capital Management. Mr. Taube began his career at Bankers Trust in leveraged finance in 1992. Mr. Taube received a B.A. from Harvard University.
Seth Taube, 48, co-founded Medley in 2006 and has served as our Co-Chief Executive Officer since then and as Co-Chairman of the Board of Directors of Medley Management Inc. since its formation. He has also served as Chief Executive Officer and Chairman of the Board of Directors of Sierra Income Corporation since its inception in 2012, Chief Executive Officer and Chairman of the Board of Trustees of Sierra Total Return Fund since its inception in 2016 and on the Board of Directors of Medley Capital Corporation since its inception in 2011. Prior to forming Medley, Mr. Taube was a Partner with CN Opportunity Fund, T3 Group, a principal and advisory firm focused on distressed asset and credit investments, and Griphon Capital Management. Mr. Taube previously worked with Tiger Management and held positions with Morgan Stanley & Co. in the Investment Banking and Institutional Equity Divisions. Mr. Taube received a B.A. from Harvard University, an M. Litt. in Economics from St. Andrew’s University in Great Britain, where he was a Rotary Foundation Fellow, and an M.B.A. from the Wharton School at the University of Pennsylvania.
Jeffrey Tonkel, 47, joined Medley in 2011 and has served as President and as a member of the Board of Directors of Medley Management Inc. since its formation. He has also served as President of Sierra Income Corporation since July 2013, President of Sierra Total Return fund since 2016 and as a member of the Board of Directors of Medley Capital Corporation since February 2014. Prior to joining Medley, Mr. Tonkel was a Managing Director with JPMorgan from January 2010 to November 2011, where he was Chief Financial Officer of a global financing and markets business. Prior to JPMorgan, Mr. Tonkel was a Managing Director, Principal Investments, with Friedman Billings Ramsey, where he focused on merchant banking and corporate development investments in diversified industrials, energy, real estate and specialty finance. Mr. Tonkel began his investment career with Summit Partners. Mr. Tonkel received a B.A. from Harvard University and an M.B.A. from Harvard Business School.
James G. Eaton, 41, is the President of Weatons Holdings, a Canadian private holding company. Mr. Eaton has been active in the founding, growth and divestiture stages of the Weatons portfolio companies across a wide variety of industries. His responsibilities at Weatons include overseeing numerous private investments and a portfolio of listed securities. Mr. Eaton is currently a partner of JJR Capital, a private merchant bank, and serves as a director on the board of JC Clark Ltd., a Toronto-based independent investment firm and Defyrus Inc., a private life sciences biodefence company, as well as audit committee chair of Dream Alternatives Trust, a publicly-traded mutual fund trust. Mr. Eaton is a founding director of the True Patriot Love Foundation, he chairs the Invictus Games Toronto 2017, and is a trustee of the John David and Signy Eaton Foundation. Mr. Eaton holds a B.A. from the University of Colorado at Boulder.
Jeffrey T. Leeds, 62, has been a member of the Board of Directors since September 2014. Mr. Leeds is President and Co-Founder of Leeds Equity Partners, LLC, a private equity investment firm focused on the knowledge sector. Mr. Leeds also serves
70
as a director of BARBRI, FineEd Holdings LLC, Fusion Education Group, Knowledge Factor, INTO University Partnerships, Simplify Compliance Holdings, LLC and RealPage, Inc., where he chairs the Nominating and Governance Committee. Prior to co-founding Leeds Equity in 1993, Mr. Leeds worked at Lazard Frères & Co., specializing in mergers and acquisitions and corporate finance from 1986 to 1992. Prior to joining Lazard, Mr. Leeds served as a law clerk to the Hon. William Brennan, Jr. of the Supreme Court of the United States. From 1983 to 1985 Mr. Leeds worked in the corporate department of the law firm of Cravath, Swaine & Moore in New York. Mr. Leeds also serves as a member of the Board of Directors of CECU (Career Education Colleges and Universities). He has previously served as a director of Argosy University, Datamark, Evanta, Miller Heiman and Ross University, among others. He was the founding chairman of the Green Dot New York Charter School and currently serves as a trustee on the board of the Colin L. Powell School for Civic and Global Leadership at the City College of New York. Mr. Leeds received a B.A. from Yale University, attended Oxford University as a Marshall Scholar and received a J.D. from Harvard Law School.
Guy Rounsaville, Jr., 74, has been a member of the Board of Directors since September 2014. Mr. Rounsaville has served on the board of directors of Tri-Valley Bank and First Banks, Inc. since 2011, and of United American Bank since 2012. Mr. Rounsaville served as Director of Diversity of the law firm Allen Matkins Leck Gamble Mallory & Natsis LLP from 2009 until May 2012 and as co-managing partner of their San Francisco office from 1999 to 2001. Mr. Rounsaville served as General Counsel and Corporate Secretary of LaSalle Bank from 2006 until it was acquired by Bank of America in October 2007, after which he served, for transition purposes, as Bank of America's Senior Vice President and Assistant General Counsel until May 2008. From 2001 to 2006, Mr. Rounsaville served as General Counsel and Corporate Secretary of Visa International. Prior to that, Mr. Rounsaville served in several roles at Wells Fargo from 1969 through 1998, including General Counsel and Corporate Secretary. Mr. Rounsaville serves on numerous civic and professional committees and boards. He received a B.A. from Stanford University and a J.D. from Hastings College of Law.
Executive Officers
Richard T. Allorto, Jr., 46, has served as our Chief Financial Officer since July 2010. Mr. Allorto has also served as the Chief Financial Officer and Secretary of Medley Capital Corporation since January 2011. Mr. Allorto also served as Chief Financial Officer and Secretary of Sierra Income Corporation from April 2012 until November 2016. Prior to joining Medley, Mr. Allorto held various positions at GSC Group, Inc., a registered investment adviser, including, Chief Financial Officer of GSC Investment Corp, a business development company that was externally managed by GSC Group. Mr. Allorto began his career at Arthur Andersen in public accounting in 1994. Mr. Allorto is a licensed CPA and received a B.S. in Accounting from Seton Hall University.
John D. Fredericks, 54, has served as our General Counsel since June 2013. Mr. Fredericks has also served as the Chief Compliance Officer of Medley Capital Corporation and Sierra Income Corporation since February 2014 and as the Chief Compliance Officer of Sierra Total Return Fund since 2016. Prior to joining Medley, Mr. Fredericks was a partner with Winston & Strawn, LLP from February 2003 to May 2013, where he was a member of the firm’s restructuring and insolvency and corporate lending groups. Before joining Winston & Strawn, LLP, from 2000 to 2003, Mr. Fredericks was a partner with Murphy Sheneman Julian & Rogers and, from 1993 to 2000, an associate at Murphy, Weir & Butler. Mr. Fredericks was admitted to the California State Bar in 1993. Mr. Fredericks received a B.A. from the University of California Santa Cruz and a J.D. from University of San Francisco.
Board Structure
The Board does not have a policy on whether or not the roles of the Chief Executive Officer and Chairman should be separate. The Board evaluates relevant factors and determines the best leadership structure for the Company’s operating and governance environment at the time. The Board believes that having combined Co-Chairmen and Co-Chief Executive Officers is the appropriate leadership structure for the Company at this time. As the Co-Chairmen and Co-Chief Executive Officers, Messrs. Brook and Seth Taube are able to draw on their knowledge and expertise related to the Company’s daily operations, industry and competitive developments to set the agenda for the Board and ensure the appropriate focus on issues of concern to the Company. Furthermore, the Board believes that combining these roles enables decisive leadership, ensures clear accountability and facilitates information flow between management and the Board, all of which are essential to effective governance. The Board has not formally designated a lead independent director.
Controlled Company Status
Medley Group LLC, an entity owned by our pre-IPO owners, holds more than a majority of the voting power of our common stock eligible to vote in the election of our directors. As a result, we are a “controlled company” within the meaning of the NYSE’s corporate governance standards. Under these corporate governance standards, a company of which more than 50% of the voting power is held by an individual, group or another company entitled to vote for the election of directors is a “controlled company” and may elect not to comply with certain corporate governance standards, including the requirements (1) that a majority of the board of directors consist of independent directors, (2) that the board of directors have a compensation committee that is comprised entirely of independent directors with a written charter addressing the committee’s purpose and responsibilities and (3) that the board of directors have a nominating and corporate governance committee that is comprised entirely of independent directors with a written charter addressing the committee’s purpose and responsibilities. We are utilizing these exemptions. As a result, the
71
majority of our directors on our Board are not independent and our Compensation Committee and our Corporate Governance and Nominating Committee are not comprised entirely of independent directors. Accordingly, you do not have the same protections afforded to stockholders of companies that are subject to all of these corporate governance requirements. In the event that we cease to be a “controlled company” and our shares continue to be listed on the NYSE, we will be required to comply with these provisions within the applicable transition periods.
Family Relationships of Directors and Executive Officers
Messrs. Brook and Seth Taube, each a Co-Chief Executive Officer and Co-Chairman of the Board of Directors, are brothers. There are no other family relationships among any of our directors or executive officers.
Board of Directors' Role in Risk Oversight
The Board of Directors has overall responsibility for risk oversight, including, as part of regular Board and committee meetings, general oversight of executives’ management of risks relevant to the Company. A fundamental part of risk oversight is not only understanding the material risks a company faces and the steps management is taking to manage those risks, but also understanding what level of risk is appropriate for the Company. Each quarter, the Board of Directors receives presentations from senior management on matters involving the Company’s operations and considers the risks related to strategies and business plans.
In addition, our Board committees consider the risks within their respective areas of responsibility. The Audit Committee assists the Board in fulfilling its oversight responsibilities with respect to risk management in the areas of financial reporting, internal controls and compliance with legal and regulatory requirements, and, in accordance with NYSE requirements, discusses with management policies with respect to risk assessment and risk management. The Compensation Committee assists the Board in fulfilling its oversight responsibilities with respect to the management of risks arising from the Company's compensation policies and programs and reviews and discusses with management the Company's compensation policies and practices and management's assessment of whether any risks arising from such policies and practices are reasonably likely to have a material adverse effect on the Company. The Corporate Governance and Nominating Committee assists the Board in fulfilling its oversight responsibilities with respect to the management of risks associated with Board and Board committee organization, membership and structure, succession planning and corporate governance matters.
Our Board of Directors believes that this role in risk oversight is appropriate. We believe that we have robust internal processes in place and a strong internal control environment to identify and manage risks. However, not all risks that may affect us can be identified or eliminated and some risks are beyond the control of us and our service providers.
We recognize that different board roles in risk oversight are appropriate for companies in different situations. We re-examine the manners in which the Board of Directors administers its oversight function on an ongoing basis to ensure that it continues to meet the Company’s needs.
Board Committees and Meetings
The following table summarizes the current membership of each of the Board’s committees.
Audit Committee | Compensation Committee | Corporate Governance and Nominating Committee | ||||
Brook Taube | X | X | ||||
Seth Taube | X | X | ||||
Jeffrey T. Leeds | Chair | Chair | ||||
Guy Rounsaville, Jr. | X | Chair | ||||
James G. Eaton | X | X | ||||
Jeffrey Tonkel | ||||||
All directors are expected to make every effort to attend all meetings of the Board, meetings of the committees of which they are members. During the year ended December 31, 2017, the Board held six meetings, the Audit Committee held four meetings , the Compensation Committee held two meetings and the Corporate Governance and Nominating Committee held one meeting. In 2017, save for Mr. James G. Eaton, each of our directors attended at least 75% of the meetings of the Board and committees that occurred during the time in which he served as a member of the Board or such committee. Mr. Eaton attended five out of the seven board and committee meetings in which he served as a member of the Board or such committee. Each of our directors is strongly encouraged, but is not required, to attend our annual meeting of stockholders. All of our directors attended our 2017 annual meeting of stockholders.
72
Committee Charters and Corporate Governance Guidelines
Our commitment to good corporate governance is reflected in our Corporate Governance Guidelines, which describe the Board’s views on a wide range of governance topics. These Corporate Governance Guidelines are reviewed from time to time by the Board and, to the extent deemed appropriate in light of emerging practices, revised accordingly, upon recommendation to and approval by the Board.
Our Corporate Governance Guidelines, our Audit, Compensation and Corporate Governance and Nominating Committee charters and other corporate governance information are available on the Corporate Governance page of the Investor Relations section on our website at www.mdly.com. Any stockholder also may request them in print, without charge, by contacting the General Counsel and Secretary, Medley Management Inc., 280 Park Avenue, 6th Floor East, New York, New York 10017.
Committee Membership
Audit Committee - All members of the Audit Committee have been determined to be “independent,” consistent with our Audit Committee Charter, Corporate Governance Guidelines and the NYSE listing standards applicable to boards of directors in general and audit committees in particular. Our Board also has determined that each of the members of the Audit Committee is “financially literate” within the meaning of the listing standards of the NYSE. In addition, our Board has determined that Jeffrey T. Leeds qualifies as an “audit committee financial expert” as defined by applicable SEC regulations.
The duties and responsibilities of the Audit Committee are set forth in its charter, which may be found at www.mdly.com under Investor Relations: Corporate Governance: Committee Charters: Audit, and include among duties and responsibilities:
• | selecting and hiring our independent auditors, and approving the audit and non-audit services to be performed by our independent auditors; |
• | assisting the Board of Directors in evaluating the qualifications, performance and independence of our independent auditors; |
• | assisting the Board of Directors in monitoring the quality and integrity of our financial statements and our accounting and financial reporting; |
• | assisting the Board of Directors in monitoring our compliance with legal and regulatory requirements; |
• | reviewing the adequacy and effectiveness of our internal control over financial reporting processes; |
• | assisting the Board of Directors in monitoring the performance of our internal audit function; |
• | monitoring the performance of our internal audit function; |
• | reviewing with management and our independent auditors our annual and quarterly financial statements; and |
• | reviewing and evaluating complaints received by us regarding accounting, internal accounting controls or auditing matters and the confidential, anonymous submission by our employees of concerns regarding questionable accounting or auditing matters. |
With respect to our reporting and disclosure matters, the responsibilities and duties of the Audit Committee include reviewing and discussing with management and the independent registered public accounting firm our annual audited financial statements prior to inclusion in our Annual Report on Form 10-K, our quarterly financial statements and other public filings in accordance with applicable rules and regulations of the SEC and the Audit Committee Charter.
On behalf of the Board, the Audit Committee plays a key role in the oversight of our risk management policies and procedures. See “Board of Directors' Role in Risk Oversight” above.
Compensation Committee - Mr. Jeffrey T. Leeds has been determined to be “independent” as defined by our Corporate Governance Guidelines and the NYSE listing standards applicable to boards of directors generally and compensation committees specifically. The other members of the Compensation Committee, Messrs. Brook and Seth Taube have not been determined by our Board of Directors to be independent.
The duties and responsibilities of the Compensation Committee are set forth in its charter, which may be found at www.mdly.com under Investor Relations: Corporate Governance: Committee Charters: Compensation, and include, among other duties and responsibilities:
• | reviewing and approving corporate goals and objectives relevant to the compensation of our Co-Chief Executive Officers, evaluating our Co-Chief Executive Officers’ performance in light of those goals and objectives, and, either as a committee or together with the other independent directors (as directed by the board of directors), determining and approving our Co-Chief Executive Officers’ compensation level based on such evaluation; |
73
• | reviewing and approving, or making recommendations to the board of directors with respect to, the compensation of our other executive officers, including annual base salary, bonus and equity-based incentives and other benefits; |
• | reviewing and recommending the compensation of our directors; and |
• | reviewing and making recommendations with respect to our equity compensation plans. |
With respect to our reporting and disclosure matters, the responsibilities and duties of the Compensation Committee include overseeing the preparation of the Compensation Discussion and Analysis, to the extent applicable, for inclusion in our Annual Proxy Statement and Annual Report on Form 10-K in accordance with applicable rules and regulations of the SEC. The charter of the Compensation Committee permits the committee to delegate any or all of its authority to one or more subcommittees and to delegate to one or more of our officers the authority to make awards to employees other than any Section 16 officer under our incentive compensation or other equity-based plan, subject to compliance with the plan and the laws of our state of jurisdiction.
The Compensation Committee has the authority under its charter to retain outside consultants or advisors, as it deems necessary or advisable.
Corporate Governance and Nominating Committee - Mr. Rounsaville is a member of the Corporate Governance and Nominating Committee who has been determined to be “independent” as defined by our Corporate Governance Guidelines and the NYSE listing standards. The other members of the Corporate Governance and Nominating Committee, Messrs. Brook and Seth Taube, have not been determined by our Board of Directors to be independent.
The duties and responsibilities of the Corporate Governance and Nominating Committee are set forth in its charter, which may be found at www.mdly.com under Investor Relations: Corporate Governance: Committee Charters: Corporate Governance and Nominating, and include, among other duties and responsibilities:
• | assisting our Board of Directors in identifying prospective director nominees and recommending nominees to the Board of Directors; |
• | overseeing the evaluation of the Board of Directors and management; |
• | reviewing developments in corporate governance practices and developing and making recommendations to the Board with respect to the Company’s corporate governance guidelines; and |
• | recommending members for each committee of our Board of Directors. |
Director Nomination Process
The Corporate Governance and Nominating Committee weighs the characteristics, experience, independence and skills of potential candidates for election to the Board and recommends nominees for director to the Board for election. In considering candidates for the Board, the Corporate Governance and Nominating Committee also assesses the size, composition and combined expertise of the Board. As the application of these factors involves the exercise of judgment, the Corporate Governance and Nominating Committee does not have a standard set of fixed qualifications that is applicable to all director candidates, although the Corporate Governance and Nominating Committee does at a minimum assess each candidate’s strength of character, judgment, industry knowledge or experience, his or her ability to work collegially with the other members of the Board and his or her ability to satisfy any applicable legal requirements or listing standards. In addition, although the Board considers diversity of viewpoints, background and experiences, the Board does not have a formal diversity policy. In identifying prospective director candidates, the Corporate Governance and Nominating Committee may seek referrals from other members of the Board, management, stockholders and other sources, including third party recommendations. The Corporate Governance and Nominating Committee also may, but need not, retain a search firm in order to assist it in identifying candidates to serve as directors of the Company. The Corporate Governance and Nominating Committee utilizes the same criteria for evaluating candidates regardless of the source of the referral. When considering director candidates, the Corporate Governance and Nominating Committee seeks individuals with backgrounds and qualities that, when combined with those of our incumbent directors, provide a blend of skills and experience to further enhance the Board’s effectiveness.
In connection with its annual recommendation of a slate of nominees, the Corporate Governance and Nominating Committee also may assess the contributions of those directors recommended for re-election in the context of the Board evaluation process and other perceived needs of the Board.
When considering whether the directors and nominees have the experience, qualifications, attributes and skills, taken as a whole, to enable the Board to satisfy its oversight responsibilities effectively in light of our business and structure, the Board focused primarily on the information discussed in each of the Board member’s biographical information set forth above. We believe that our directors provide an appropriate mix of experience and skills relevant to the size and nature of our business. In particular, the members of our Board of Directors considered the following important characteristics:
74
• | Messrs. Brook Taube and Seth Taube — we considered that these two individuals have played an integral role in our firm’s successful growth, and that each has developed a unique and in-depth understanding of our business. We also noted that these two individuals are our largest equity owners and, as a consequence of such alignment of interest with our other equity owners, each has additional motivation to diligently fulfill his oversight responsibilities as a member of our Board of Directors. |
• | Mr. Tonkel — we considered his extensive experience in various senior leadership roles in the financial services industry, including his role as a Managing Director with JPMorgan where he was the Chief Financial Officer of a global financing and markets business, as well as his familiarity with our business and operations as President of Medley and Sierra Income Corporation and a member of the Board of Directors of Medley Capital Corporation. |
• | Mr. Jeffrey T. Leeds — we considered his extensive experience in private equity investing, investment banking and law, along with his prior experience as a board member of various institutions. |
• | Mr. Guy Rounsaville, Jr. — we considered his background in law, banking and lending, including his extensive experience serving in general counsel, corporate secretary and board member roles at several financial institutions. |
• | Mr. James G. Eaton — we considered his background in finance and financial services, owing to his extensive experience as president of a private holding company and investment advisor and board member roles. |
The Corporate Governance and Nominating Committee will consider director candidates recommended by stockholders. Any recommendation submitted to the Secretary of the Company should be in writing and should include any supporting material the stockholder considers appropriate in support of that recommendation, but must include information that would be required under the rules of the SEC to be included in a proxy statement soliciting proxies for the election of such candidate and a written consent of the candidate to serve as one of our directors if elected. Stockholders wishing to propose a candidate for consideration may do so by submitting the above information to the attention of the General Counsel and Secretary, Medley Management Inc., 280 Park Avenue, 6th Floor East, New York, New York 10017. All recommendations for nomination received by the General Counsel and Secretary that satisfy our by-law requirements relating to such director nominations will be presented to the Corporate Governance and Nominating Committee for its consideration. Stockholders also must satisfy the notification, timeliness, consent and information requirements set forth in our by-laws.
Communications with the Board
As described in the Corporate Governance Guidelines, stockholders and other interested parties who wish to communicate with a member or members of the Board, including the chairperson of the Audit, Compensation, or Corporate Governance and Nominating Committees or to the non-management or independent directors as a group, may do so by addressing such communications or concerns to the General Counsel of the Company, at Medley Management Inc., 280 Park Avenue, 6th Floor East, New York, New York 10017, who will forward such communication to the appropriate party.
Compensation Committee Interlocks and Insider Participation
During the 2017 fiscal year, the members of our Compensation Committee were Mr. Leeds, Mr. Brook Taube (our Co-Chief Executive Officer) and Mr. Seth Taube (our Co-Chief Executive Officer). None of our executive officers serves as a member of the Board of Directors or Compensation Committee (or other committee performing equivalent functions) of any entity that has one or more executive officers serving on our Board of Directors or Compensation Committee.
Section 16 Beneficial Ownership Reporting Compliance
Section 16(a) of the Exchange Act requires executive officers and directors, a company’s chief accounting officer and persons who beneficially own more than 10% of a company’s common stock, to file initial reports of ownership and reports of changes in ownership with the SEC and the NYSE. Executive officers, directors, the chief accounting officer and beneficial owners with more than 10% of our common stock are required by SEC regulations to furnish us with copies of all Section 16(a) forms they file.
Based solely on our review of copies of such reports and written representations from our executive officers and directors, except as set forth below, we believe that our executive officers and directors complied with all other Section 16(a) filing requirements during 2017.
Each of Mr. Leeds and Mr. Rounsaville had restricted stock units vest on September 29, 2017, which triggered a Form 4 filing. Such Form 4 filings were due on October 3, 2017 and were filed with the SEC on October 12, 2017.
Code of Conduct and Ethics
We maintain a Code of Business Conduct and Ethics that is applicable to all of our directors, officers and employees, including our Co-Chairmen and Co-Chief Executive Officers, Chief Financial Officer and other senior financial officers. The Code of Business Conduct and Ethics sets forth our policies and expectations on a number of topics, including conflicts of interest, compliance with laws, use of our assets and business conduct and fair dealing. This Code of Business Conduct and Ethics also
75
satisfies the requirements for a code of ethics, as defined by Item 406 of Regulation S-K promulgated by the SEC. We will disclose within four business days any substantive changes in or waivers of the Code of Business Conduct and Ethics granted to our principal executive officer, principal financial officer, principal accounting officer or controller, or persons performing similar functions, by posting such information on our website as set forth above rather than by filing a Form 8-K. In the case of a waiver for an executive officer or a director, the required disclosure also will be made available on our website within four business days of the date of such waiver.
The Code of Business Conduct and Ethics may be found on our website at www.mdly.com under Investor Relations: Corporate Governance: Governance Documents: Code of Business Conduct and Ethics.
Item 11. Executive Compensation
Emerging Growth Company Status
We qualify as an “emerging growth company” under the Jumpstart Our Business Startups Act of 2012, also known as the JOBS Act. As a result, we are permitted to, and rely on exemptions from certain disclosure requirements that are applicable to other companies that are not emerging growth companies. Accordingly, we have not included a compensation discussion and analysis of our executive compensation programs and have excluded tabular compensation information. However, in the interest of providing more fulsome disclosure, we have included compensation information for our Co-Chief Executive Officers, our Chief Financial Officer and our two next most highly compensated executive officers serving at the end of the fiscal year (collectively referred to herein as our “named executive officers”).
In addition to the foregoing described reduced compensation disclosure, for so long as we are an emerging growth company, we will not be required to submit certain executive compensation matters to stockholder advisory votes, such as “say-on-pay,” “say-on-frequency” and “say-on-golden parachute” compensation. We will remain an emerging growth company until the earliest to occur of: (i) December 31, 2019; (ii) the first fiscal year after our annual gross revenues are $1.0 billion or more; (iii) the date on which we have, during the previous three-year period, issued more than $1.0 billion in non-convertible debt securities; or (iv) the end of any fiscal year in which we become a “large accelerated filer,” which means that we have been public for at least 12 months, have filed at least one annual report and the market value of our voting and non-voting common equity held by non-affiliates exceeds $700 million as of the last day of our then most recently completed second fiscal quarter.
Summary Compensation Table
Our named executive officers for 2017 are:
• | Brook Taube, Co-Chief Executive Officer; |
• | Seth Taube, Co-Chief Executive Officer; |
• | Jeffrey Tonkel, President; |
• | Richard T. Allorto, Jr., Chief Financial Officer; and |
• | John D. Fredericks, General Counsel and Secretary. |
The following table presents summary information regarding the total compensation awarded to, earned by, or paid to each of our named executive officers for the fiscal years indicated.
Name | Year | Salary ($)(1) | Bonus ($) | Stock Awards ($)(2) | Option Awards ($) | Non-Equity Incentive Plan Compensation ($) | Change in Pension Value and Nonqualified Deferred Compensation Earnings ($) | All Other Compensation ($)(3) | Total ($) | |||||||||||||||||||||
Brook Taube | 2017 | — | — | — | — | — | — | $ | 38,686 | $ | 38,686 | |||||||||||||||||||
Co-Chief Executive Officer | 2016 | — | — | — | — | — | — | $ | 43,136 | $ | 43,136 | |||||||||||||||||||
Seth Taube | 2017 | — | — | — | — | — | — | $ | 39,195 | $ | 39,195 | |||||||||||||||||||
Co-Chief Executive Officer | 2016 | — | — | — | — | — | — | $ | 48,625 | $ | 48,625 | |||||||||||||||||||
Jeffrey Tonkel | 2017 | $ | 225,000 | — | — | — | — | — | $ | 36,671 | $ | 261,671 | ||||||||||||||||||
President | 2016 | $ | 300,000 | — | — | — | — | — | $ | 41,120 | $ | 341,120 | ||||||||||||||||||
Richard T. Allorto, Jr. | 2017 | $ | 300,000 | — | $ | 583,500 | — | — | — | $ | 38,605 | $ | 922,105 | |||||||||||||||||
Chief Financial Officer | 2016 | $ | 300,000 | — | $ | 293,000 | — | — | — | $ | 43,824 | $ | 636,824 | |||||||||||||||||
John D. Fredericks | 2017 | $ | 300,000 | — | $ | 583,500 | — | — | — | $ | 39,832 | $ | 923,332 | |||||||||||||||||
General Counsel and Secretary | 2016 | $ | 300,000 | — | $ | 293,000 | — | — | — | $ | 44,842 | $ | 637,842 | |||||||||||||||||
76
(1) | Amounts reported under Salary include guaranteed cash distributions made on membership interests in Medley LLC owned directly or indirectly by our named executive officers. During the years ended December 31, 2017 and 2016, neither of Messrs. Brook and Seth Taube received any guaranteed payments. During the three months ended December 31, 2017, Mr. Tonkel did not receive any guaranteed payments. |
(2) | Amounts reported under Stock Awards for the year 2017 consist of Restricted LLC Units granted in February 2017 for services rendered in 2016. Amounts reported for the year 2016 consist of RSUs granted in March 2016 for services rendered in 2015. The Restricted LLC Units and RSUs are included at their grant date fair market value which was computed in accordance with FASB ASC Topic 718. Subsequently, in February 2017, the 2016 RSU grants were canceled and in return the holders thereof were granted 50,000 Restricted LLC Units under the Incentive Plan, which had the equivalent grant date fair market value. |
(3) | Amounts reported under All Other Compensation include Company-paid executive health insurance, Company matching 401(k) contributions, Company-paid life insurance premiums, Company-reimbursed commuting expenses and Company-paid professional dues. |
Outstanding Equity Awards at 2017 Fiscal Year End
The following table includes information concerning stock awards that have not vested for each of our named executive officer as of December 31, 2017.
Option awards | Stock awards (1) | ||||||||||||||||||||||||||
Name | Number of securities underlying unexercised options (#) exercisable | Number of securities underlying unexercised options (#) unexercisable | Equity incentive plan awards: number of securities underlying unexercised unearned options (#) | Option exercise price ($) | Option exercise date | Number of shares or units of stock that have not vested (#) | Market value of shares or units of stock that have not vested ($) | Equity incentive plan awards: number of unearned shares, units or other rights that have not vested (#) | Equity incentive plan awards: market payout value of unearned shares, units or other rights that have not vested ($) | ||||||||||||||||||
Brook Taube | — | — | — | — | — | — | — | — | — | ||||||||||||||||||
Seth Taube | — | — | — | — | — | — | — | — | — | ||||||||||||||||||
Jeffrey Tonkel | — | — | — | — | — | — | — | — | — | ||||||||||||||||||
Richard T. Allorto, Jr. | — | — | — | — | — | 100,000 | $ | 650,000 | — | — | |||||||||||||||||
John D. Fredericks | — | — | — | — | — | 100,000 | $ | 650,000 | — | — | |||||||||||||||||
(1) | Stock awards consist of Restricted LLC Units granted on February 22, 2017 and March 17, 2016. The Restricted LLC Units vest in three equal annual installments on each of the third, fourth and fifth anniversaries of the grant date, subject to the executive's continued employment on the applicable vesting date. The market value of the RSUs was computed using Medley Management Inc.'s closing price of $6.50 per share as of December 29, 2017. |
Narrative Disclosure to Summary Compensation Table
Our named executive officers are generally compensated through a combination of annual guaranteed distributions on membership interests and annual discretionary bonuses in the form of cash, equity-based awards and/or profit interests in our advisor entities.
Guaranteed Distributions on Membership Interests
Each of our named executive officers owns, directly or indirectly, membership interests in Medley LLC. The payments to our Co-Chief Executive Officers, Brook and Seth Taube, are performance based periodically set subject to maximums based on our total assets under management. During the years ended December 31, 2017 and 2016, neither of our Co-Chief Executive Officers received any guaranteed payments. This is expected to continue through December 31, 2018. In addition, we pay to each of Messrs. Tonkel, Allorto and Fredericks a $25,000 monthly cash payment, included under Salary in the Summary Compensation Table. During the three months ended December 31, 2017, Mr. Tonkel elected not receive any guaranteed payments.
As a condition to receiving membership interests in Medley LLC, each executive was required to become party to the limited liability company agreement of Medley LLC. The limited liability company agreement of Medley LLC, the unit award agreements evidencing such membership interests and the agreement described above relating to guaranteed payments, generally govern the rights and obligations of the executives.
77
Annual Discretionary Bonus
In March 2018, each of Messrs. Allorto and Fredericks was awarded an annual discretionary bonus for services rendered in 2017, which consisted of 70,000 Restricted LLC Units granted under the Incentive Plan. The Restricted LLC Units vest in three equal annual installments commencing on January 1, 2021, subject to the executive’s continued employment on the applicable vesting date. Each vested Restricted LLC Unit may be exchanged for one share of our common stock. The grant date fair market value of the LLC Units will be included in the Summary Compensation Table in our proxy statement for the 2019 annual meeting of stockholders.
In February 2017, each of Messrs. Allorto and Fredericks was awarded an annual discretionary bonus for services rendered in 2016, which consisted of 50,000 Restricted LLC Units granted under the Incentive Plan. The Restricted LLC Units vest in three equal annual installments on each of the third, fourth and fifth anniversaries of the grant date, subject to the executive’s continued employment on the applicable vesting date. Each vested Restricted LLC Unit may be exchanged for one share of our common stock. The grant date fair market value of the LLC Units will be included in the Summary Compensation Table above.
In March 2016, each of Messrs. Allorto and Fredericks was awarded an annual discretionary bonus for services rendered in 2015, which consisted of (1) 50,000 RSUs granted under the Incentive Plan and (2) the right to receive cash-settled carried interest payments in an amount tied to the performance of one of our funds. The RSUs vest in three equal annual installments on each of the third, fourth and fifth anniversaries of the grant date, subject to the executive’s continued employment on the applicable vesting date. The carry interest awards entitle each of Messrs. Allorto and Fredericks to receive a cash distribution equal to 0.258% of the carried interest received by MOF II GP LLC from Medley Opportunity Fund II LP. Eligibility to receive a carry interest payment is based on the executive’s continued employment and ceases automatically upon termination of employment. The grant date fair market value of the RSUs is included in the Summary Compensation Table above. Subsequently, in February 2017, these RSU grants were canceled and in return the holders thereof were granted 50,000 Restricted LLC Units under the Incentive Plan, which had the equivalent grant date fair market value. These Restricted LLC Units vest annually in three equal installments commencing March 16, 2019, subject to the executive's continued employment on the applicable vesting date. Each vested Restricted LLC Unit may be exchanged for one share of our common stock. In accordance with SEC rules, the carry interest awards have not been included in the Summary Compensation Table above since the performance criteria has not been met.
Restrictive Covenants
Under the terms of their respective confidentiality, non-interference and invention assignment agreements, each of the named executive officers is subject to covenants restricting his (i) use and disclosure of confidential information while employed and at all times thereafter, (ii) ability to engage in any business activities that directly or indirectly competes with us while employed and for six months thereafter and (iii) solicitation of our employees and consultants while employed and for twelve months thereafter and solicitation of our customers and clients while employed and for six months thereafter.
Retirement Plan
We maintain a qualified contributory retirement plan that is intended to qualify as a deferred salary arrangement under Section 401(k) of the Internal Revenue Code (the “Code”). The plan covers all employees, including our named executive officers, who may contribute up to 96% of their eligible compensation, subject to statutory limits imposed by the Code. We are also permitted to provide for, but we currently do not provide any, matching contributions. In addition, the Company makes nonelective contributions under the 401(k) plan equal to 3% of each employee’s eligible earnings, subject to statutory limits imposed by the Code.
Compensation of Directors
Our employees who serve as directors receive no separate compensation for their service on the Board or on committees thereof.
For 2017, each of our non-employee directors was entitled to receive annual compensation consisting of:
• | An annual cash retainer in the amount of $35,000, payable in quarterly installments; |
• | restricted stock units (“RSUs”) having a fair market value on the date of grant of $35,000; provided, however, that each non-employee director has the option to elect to receive 100% of his annual compensation in RSUs, having a fair market value on the date of grant of $70,000 and subject to vesting terms as set forth in the applicable award agreement; and |
• | as to the chairperson of the Audit Committee, an additional annual RSU award having a fair market value on the date of grant of $15,000. |
78
Each of our directors is entitled to be reimbursed for reasonable travel and related expenses associated with attendance at Board or committee meetings, although they will not be paid additional fees for attending meetings or for serving on Board committees.
In September 2016, we granted each of our non-employee directors RSUs in an amount representing the director’s annual equity award, or total compensation if the director elected to receive the entire compensation in the form of RSUs, for the annual period from September 2016 to September 2017. In March 2017, we revised our non-employee director compensation program such that going forward, RSUs would be granted on the date of the annual meeting each year which aligns the grant with annual term. In March 2017, the Board approved an amendment to the RSUs granted in September 2016 to each of Mr. Leeds and Rounsaville, Jr., such that two-thirds of such RSUs vest on May 10, 2017, the date of the 2017 Annual Meeting, and the reminder vest on September 29, 2017. The board also approved an amendment to the RSUs granted in September 2016 to Mr. Ryan such that a pro-rated portion of such RSUs will vest on March 17, 2017. At the same meeting, the Board approved pro-rated annual awards for the continuing non-employee directors for the period from September 30, 2017 until the next annual meeting and a full annual award for the new non-employee director.
Director Compensation in 2017
The table below sets forth information regarding non-employee director compensation for the fiscal year ended December 31, 2017.
Name | Fees Earned or Paid in Cash ($)(1) | Stock Awards ($)(2) | All Other Compensation ($) | Total ($) | Total Number of Outstanding Unvested Equity Awards (#)(3) | ||||||||||||||
Jeffrey T. Leeds | $ | — | $ | 82,000 | $ | — | $ | 82,000 | 9,788 | ||||||||||
Guy Rounsaville, Jr. | $ | 35,000 | $ | 35,000 | $ | — | $ | 70,000 | 3,703 | ||||||||||
James G. Eaton | $ | — | $ | 56,700 | $ | — | $ | 56,700 | 11,111 | ||||||||||
(1) | Represents the annual cash retainer earned for services rendered in 2017. |
(2) | Represents the aggregate grant date fair value of the RSU awards computed in accordance with the Financial Accounting Standards Board (“FASB”) Accounting Standards Codification (“ASC”) Topic 718. |
(3) | Represents the aggregate number of unvested RSUs held by each non-employee director as of the fiscal year end. |
Narrative to Director Compensation Table
Eligible non-employee directors are awarded equity under the Company’s 2014 Omnibus Incentive Plan (the “Incentive Plan”). The directors’ RSUs granted in 2017 vest in full one year from the date of grant, subject to the director’s continued service on the Board on the applicable vesting date. If the director ceases to be a member of the Board for any reason, all of his then unvested RSUs will be forfeited, and upon a change in control (as defined in the Incentive Plan), all of the director’s unvested RSUs will fully vest.
Compensation Committee Interlocks and Insider Participation
During the 2017 fiscal year, the members of our Compensation Committee were Mr. Leeds, Mr. Brook Taube (our Co-Chief Executive Officer) and Mr. Seth Taube (our Co-Chief Executive Officer). None of our executive officers serves as a member of the Board of Directors or Compensation Committee (or other committee performing equivalent functions) of any entity that has one or more executive officers serving on our Board of Directors or Compensation Committee.
Item 12. Security Ownership of Certain Beneficial Owners and Management and Related Stockholder Matters
Ownership of Securities
The following table sets forth information regarding the beneficial ownership of shares of our common stock and of LLC Units as of December 31, 2017 by (1) each person known to us to beneficially own more than 5% of the outstanding voting securities of Medley Management Inc., (2) each of our directors and named executive officers and (3) all of our directors and executive officers as a group. Beneficial ownership is determined in accordance with the rules of the SEC.
79
Class A Common Stock Beneficially Owned(1) | LLC Units Beneficially Owned(1)(2) | Class B Common Stock Beneficially Owned(2) | Combined Voting Power(2)(3) | |||||||||||||||
Name of Beneficial Owner | Number | % | Number | % | Number | % | ||||||||||||
Medley Group LLC(2) 280 Park Avenue 6 Floor East New York, NY 10152 | — | — | — | — | 100 | 97.7 | % | |||||||||||
American Financial Group Inc.(4) Great American Insurance Tower 301 East Fourth Street Cincinnati, OH 45202 | 579,100 | 10.6 | % | — | — | — | * | |||||||||||
Brown Advisory Incorporated(5) 901 South Bond Street Suite 400 Baltimore, MD 21231 | 545,884 | 10.0 | % | — | — | — | * | |||||||||||
Wells Fargo & Company(6) 420 Montgomery Street San Francisco, CA 94104 | 316,277 | 5.8 | % | — | — | — | * | |||||||||||
BlackRock, Inc.(7) 55 East 52nd Street New York, NY 10022 | 294,877 | 5.4 | % | — | — | — | * | |||||||||||
Named Executive Officers and Directors | ||||||||||||||||||
Brook Taube(2)(8) | — | — | 10,000,000 | 34.1 | % | 100 | 97.7 | % | ||||||||||
Seth Taube(2)(9) | 264,681 | 4.8 | % | 10,000,000 | 34.1 | % | 100 | 97.7 | % | |||||||||
Jeffrey Tonkel | — | — | 1,818,182 | 6.2 | % | — | — | |||||||||||
Richard T. Allorto, Jr. | — | — | 706,061 | 2.4 | % | — | — | |||||||||||
John D. Fredericks | — | — | 403,030 | 1.4 | % | — | — | |||||||||||
James G. Eaton(10) | 1,437 | * | — | — | — | — | ||||||||||||
Jeffrey T. Leeds(11) | 24,335 | * | — | — | — | — | ||||||||||||
Guy Rounsaville, Jr.(12) | 12,018 | * | — | — | — | — | ||||||||||||
Directors and executive officers as a group (8 persons)(2) | 302,471 | 5.5 | % | 22,927,273 | 78.2 | % | 100 | 97.7 | % | |||||||||
* Represents less than 1%.
(1) | Subject to the terms of the exchange agreement, the LLC Units are exchangeable for shares of our Class A common stock on a one-for-one basis. See “Certain Relationships and Related Person Transactions — Exchange Agreement.” Beneficial ownership of LLC Units reflected in this table does not include beneficial ownership of shares of our Class A common stock for which such LLC Units may be exchanged. Percentage of Class A common stock beneficially owned as reflected in this table is based on 5,481,068 shares of Class A common stock outstanding as of December 31, 2017. Percentage of LLC Units beneficially owned as reflected in this table treats LLC Units held by the Company as outstanding. |
(2) | Holders of Class B common stock are entitled to a number of votes that is equal to 10 times the number of LLC Units held by such holder, regardless of the number of shares of Class B common stock held by such holder. Medley Group LLC, an entity wholly-owned by our pre-IPO owners, holds all 100 issued and outstanding shares of our Class B common stock, and the Class B common stock provides Medley Group LLC with a number of votes that is equal to 10 times the aggregate number of LLC Units held by all non-managing members of Medley LLC. As of December 31, 2017, the non-managing members of Medley LLC held 23,653,333 LLC Units entitling Medley Group LLC to 236,533,330 votes. |
Messrs. Brook and Seth Taube may be deemed to have beneficial ownership of the shares of Class B common stock held by Medley Group LLC.
(3) | Represents percentage of voting power of the Class A common stock and Class B common stock voting together as a single class, based upon an aggregate of 5,481,068 shares of Class A common stock outstanding as of December 31, 2017, which carry a total of 5,481,068 votes, and 100 shares of Class B common stock outstanding as of December 31, 2017, which carry a total of 236,533,330 votes. |
80
(4) | According to the Schedule 13G filed on January 26, 2018 by American Financial Group, Inc. (“American Financial”), American Financial has sole voting and sole dispositive power over 579,100 shares of our Class A common stock. |
(5) | According to the Schedule 13G filed on February 9, 2018 by Brown Advisory Incorporated and certain of its affiliates (collectively, “Brown Advisory”), Brown Advisory has sole voting power over 542,950 shares of our Class A common stock and shared dispositive power over 545,884 shares of our Class A common stock. |
(6) | According to the Schedule 13G filed on January 29, 2018 by Wells Fargo & Company and certain of its affiliates (collectively “Wells Fargo”), Wells Fargo has shared voting and shared dispositive voting power over 316,277 shares of our Class A common stock. |
(7) | According to the Schedule 13G filed on January 23, 2018 by BlackRock, Inc. (“BlackRock”), BlackRock has sole voting power over 317,605 shares of our class A common stock and sole dispositive power over 294,877 shares of our Class A common stock. |
(8) | Includes 1,818,182 LLC Units owned by B. Taube 2014 Associates, LLC and 8,181,818 LLC Units owned by the Brook Taube Trust. |
(9) | Includes 264,681 shares of Class A common stock held by The Seth and Angie Foundation, 909,091 LLC Units owned by A. Taube 2014 Associates, LLC, 909,091 LLC Units owned by S. Taube 2014 Associates and 8,181,818 LLC Units owned by The Seth and Angie Taube Trust. |
(10) | Excludes 11,111 shares of Class A common stock underlying restricted stock units that did not vest within sixty days of December 31, 2017. |
(11) | Excludes 9,788 shares of Class A common stock underlying restricted stock units that did not vest within sixty days of December 31, 2017. |
(12) | Excludes 3,703 shares of Class A common stock underlying restricted stock units that did not vest within sixty days of December 31, 2017. |
Securities Authorized for Issuance under Equity Compensation Plans
The following table sets forth, as of December 31, 2017, certain information related to Medley Management Inc.'s compensation plans under which our Class A common stock may be issued.
Number of securities to be issued upon exercise of outstanding | Weighted-average exercise price of outstanding options, warrants and rights(2) | Number of securities remaining available for future issuance | ||||||||
Equity compensation plans approved by stockholders(1) | 1,451,393 | $ | — | 2,493,275 | ||||||
Equity compensation plans not approved by stockholders | — | — | — | |||||||
(1) | Relates to Medley Management Inc. 2014 Omnibus Incentive Plan. |
(2) | The weighted average exercise price does not include outstanding equity awards that are received or exercised for no consideration. |
Item 13. Certain Relationships and Related Transactions, and Director Independence
Transactions with Related Persons
Exchange Agreement
In September 2014, we entered into an exchange agreement with the holders of LLC Units pursuant to which each holder of LLC Units (and certain permitted transferees thereof) may, from and after the first anniversary of the date of the IPO (subject to the terms of the exchange agreement) exchange their LLC Units for shares of Class A common stock of Medley Management Inc. on a one-for-one basis, subject to customary conversion rate adjustments for stock splits, stock dividends and reclassifications. The exchange agreement also provides that a holder of LLC Units will not have the right to exchange LLC Units if Medley Management Inc. determines that such exchange would be prohibited by law or regulation or would violate other agreements with Medley Management Inc. or its subsidiaries to which such holder may be subject. Medley Management Inc. may impose additional restrictions on exchange that it determines to be necessary or advisable so that Medley LLC is not treated as a “publicly traded partnership” for United States federal income tax purposes. As a holder exchanges LLC Units for shares of Class A common stock, the number of LLC Units held by Medley Management Inc. is correspondingly increased as it acquires the exchanged LLC Units.
81
Registration Rights Agreement
In September 2014, we entered into a registration rights agreement with our pre-IPO owners pursuant to which we will grant them, their affiliates and certain of their transferees the right, under certain circumstances and subject to certain restrictions, to require us to register under the Securities Act shares of Class A common stock delivered in exchange for LLC Units. Under the registration rights agreement, we have agreed to register the exchange of LLC Units for shares of Class A common stock by our pre-IPO owners. In addition, Medley Group LLC, an entity wholly-owned by our pre-IPO owners, will have the right to request that we register the sale of shares of Class A common stock held by our pre-IPO owners an unlimited number of times and may require us to make available shelf registration statements permitting sales of shares of Class A common stock into the market from time to time over an extended period. Medley Group LLC will also have the ability to exercise certain piggyback registration rights in respect of shares of Class A common stock held by our pre-IPO owners in connection with registered offerings requested by other registration rights holders or initiated by us. Under the registration rights agreement, Medley Management Inc. will be liable for and pay all registration expenses in connection with each of the foregoing registrations.
Tax Receivable Agreement
Holders of LLC Units (other than Medley Management Inc.) may, subject to certain conditions, from and after the first anniversary of the date of the completion of the IPO (subject to the terms of the exchange agreement), exchange their LLC Units for shares of Class A common stock of Medley Management Inc. on a one-for-one basis. Medley LLC intends to make an election under Section 754 of the Code effective for each taxable year in which an exchange of LLC Units for shares of Class A common stock occurs, which is expected to result in increases to the tax basis of the assets of Medley LLC at the time of an exchange of LLC Units. The exchanges are expected to result in increases in the tax basis of the tangible and intangible assets of Medley LLC. These increases in tax basis may reduce the amount of tax that Medley Management Inc. would otherwise be required to pay in the future. These increases in tax basis may also decrease gains (or increase losses) on future dispositions of certain capital assets to the extent tax basis is allocated to those capital assets. The IRS may challenge all or part of the tax basis increase and increased deductions, and a court could sustain such a challenge.
In September 2014, we entered into a tax receivable agreement with the holders of LLC Units that provides for the payment by Medley Management Inc. to exchanging holders of LLC Units of 85% of the benefits, if any, that Medley Management Inc. is deemed to realize as a result of these increases in tax basis and of certain other tax benefits related to entering into the tax receivable agreement, including tax benefits attributable to payments under the tax receivable agreement. This payment obligation is an obligation of Medley Management Inc. and not of Medley LLC. Medley Management Inc. expects to benefit from the remaining 15% of cash tax savings, if any, in income tax it realizes. For purposes of the tax receivable agreement, the cash tax savings in income tax will be computed by comparing the actual income tax liability of Medley Management Inc. (calculated with certain assumptions) to the amount of such taxes that Medley Management Inc. would have been required to pay had there been no increase to the tax basis of the assets of Medley LLC as a result of the exchanges and had Medley Management Inc. not entered into the tax receivable agreement. The term of the tax receivable agreement will continue until all such tax benefits have been utilized or expired, unless Medley Management Inc. exercises its right to terminate the tax receivable agreement for an amount based on the agreed payments remaining to be made under the agreement (as described in more detail below) or Medley Management Inc. breaches any of its material obligations under the tax receivable agreement in which case all obligations generally will be accelerated and due as if Medley Management Inc. had exercised its right to terminate the tax receivable agreement. Estimating the amount of payments that may be made under the tax receivable agreement is by its nature imprecise, insofar as the calculation of amounts payable depends on a variety of factors. The actual increase in tax basis, as well as the amount and timing of any payments under the tax receivable agreement, will vary depending upon a number of factors, including:
• | the timing of exchanges — for instance, the increase in any tax deductions will vary depending on the fair market value, which may fluctuate over time, of the depreciable or amortizable assets of Medley LLC at the time of each exchange; |
• | the price of shares of our Class A common stock at the time of the exchange — the increase in any tax deductions, as well as the tax basis increase in other assets, of Medley LLC, is directly proportional to the price of shares of our Class A common stock at the time of the exchange; |
• | the extent to which such exchanges are taxable — if an exchange is not taxable for any reason, increased deductions will not be available; and |
• | the amount and timing of our income — Medley Management Inc. will be required to pay 85% of the cash tax savings as and when realized, if any. If Medley Management Inc. does not have taxable income, Medley Management Inc. is not required (absent circumstances requiring an early termination payment) to make payments under the tax receivable agreement for that taxable year because no cash tax savings will have been realized. However, any cash tax savings that do not result in realized benefits in a given tax year will likely generate tax attributes that may be utilized to generate benefits in previous or future tax years. The utilization of such tax attributes will result in payments under the tax receivables agreement. |
82
We anticipate that we will account for the effects of these increases in tax basis and associated payments under the tax receivable agreement arising from future exchanges as follows:
• | we will record an increase in deferred tax assets for the estimated income tax effects of the increases in tax basis based on enacted federal and state tax rates at the date of the exchange; |
• | to the extent we estimate that we will not realize the full benefit represented by the deferred tax asset, based on an analysis that will consider, among other things, our expectation of future earnings, we will reduce the deferred tax asset with a valuation allowance; and |
• | we will record 85% of the estimated realizable tax benefit (which is the recorded deferred tax asset less any recorded valuation allowance) as an increase to the liability due under the tax receivable agreement and the remaining 15% of the estimated realizable tax benefit as an increase to additional paid-in capital. |
All of the effects of changes in any of our estimates after the date of the exchange will be included in net income. Similarly, the effect of subsequent changes in the enacted tax rates will be included in net income.
We expect that as a result of the size of the increases in the tax basis of the tangible and intangible assets of Medley LLC, the payments that we may make under the tax receivable agreement will be substantial. There may be a material negative effect on our liquidity if, as a result of timing discrepancies or otherwise, the payments under the tax receivable agreement exceed the actual cash tax savings that Medley Management Inc. realizes in respect of the tax attributes subject to the tax receivable agreement and/or distributions to Medley Management Inc. by Medley LLC are not sufficient to permit Medley Management Inc. to make payments under the tax receivable agreement after it has paid taxes. Late payments under the tax receivable agreement generally will accrue interest at an uncapped rate equal to LIBOR plus 500 basis points. The payments under the tax receivable agreement are not conditioned upon continued ownership of us by holders of LLC Units.
In addition, the tax receivable agreement provides that upon certain changes of control, Medley Management Inc.’s (or its successor’s) obligations with respect to exchanged or acquired LLC Units (whether exchanged or acquired before or after such transaction) would be based on certain assumptions, including Medley Management Inc. would have sufficient taxable income to fully utilize the deductions arising from the increased tax deductions and tax basis and other benefits related to entering into the tax receivable agreement.
Furthermore, Medley Management Inc. may elect to terminate the tax receivable agreement early by making an immediate payment equal to the present value of the anticipated future cash tax savings. In determining such anticipated future cash tax savings, the tax receivable agreement includes several assumptions, including (i) that any LLC Units that have not been exchanged are deemed exchanged for the market value of the shares of Class A common stock at the time of termination, (ii) Medley Management Inc. will have sufficient taxable income in each future taxable year to fully realize all potential tax savings, (iii) the tax rates for future years will be those specified in the law as in effect at the time of termination and (iv) certain non-amortizable assets are deemed disposed of within specified time periods. In addition, the present value of such anticipated future cash tax savings are discounted at a rate equal to LIBOR plus 100 basis points.
As a result of the change in control provisions and the early termination right, Medley Management Inc. could be required to make payments under the tax receivable agreement that are greater than or less than the specified percentage of the actual cash tax savings that Medley Management Inc. realizes in respect of the tax attributes subject to the tax receivable agreement. In these situations, our obligations under the tax receivable agreement could have a substantial negative impact on our liquidity.
Decisions made by our pre-IPO owners in the course of running our business may influence the timing and amount of payments that are received by an exchanging or selling existing owner under the tax receivable agreement. For example, the earlier disposition of assets following an exchange or acquisition transaction generally will accelerate payments under the tax receivable agreement and increase the present value of such payments, and the disposition of assets before an exchange or acquisition transaction will increase an existing owner’s tax liability without giving rise to any rights of an existing owner to receive payments under the tax receivable agreement. Payments under the tax receivable agreement are based on the tax reporting positions that we will determine. Medley Management Inc. will not be reimbursed for any payments previously made under the tax receivable agreement if a tax basis increase is successfully challenged by the IRS. As a result, in certain circumstances, payments could be made under the tax receivable agreement in excess of the Medley Management Inc.’s cash tax savings.
Medley LLC Limited Liability Company Agreement
Medley Management Inc. holds LLC Units in Medley LLC and is the sole managing member of Medley LLC. Accordingly, Medley Management Inc. will operate and control all of the business and affairs of Medley LLC and, through Medley LLC and its operating entity subsidiaries, conduct our business.
Pursuant to the limited liability company agreement of Medley LLC, Medley Management Inc. has the right to determine when distributions will be made to holders of LLC Units and the amount of any such distributions. If a distribution is authorized,
83
such distribution will be made to the holders of LLC Units pro rata in accordance with the percentages of their respective limited liability company interests.
The holders of LLC Units, including Medley Management Inc., will incur United States federal, state and local income taxes on their proportionate share of any taxable income of Medley LLC. Net profits and net losses of Medley LLC will generally be allocated to its holders (including Medley Management Inc.) pro rata in accordance with the percentages of their respective limited liability company interests, except as otherwise required by law. The limited liability company agreement of Medley LLC will provide for cash distributions, which we refer to as “tax distributions”, to the holders of the LLC Units if Medley Management Inc., as the sole managing member of Medley LLC, determines that the taxable income of Medley LLC will give rise to taxable income for the holders of LLC Units to the extent that other distributions made by Medley LLC for such year were otherwise insufficient to cover such tax liabilities. Generally, these tax distributions will be computed based on our estimate of the net taxable income of Medley LLC multiplied by an assumed tax rate equal to the highest effective marginal combined United States federal, state and local income tax rate (including the “Medicare” tax imposed under Internal Revenue Code) prescribed for an individual or corporate resident in New York, New York or California (taking into account the non-deductibility of certain expenses and the character of our income) and the character of the applicable income, but not taking into account the deductibility of state and local income taxes for U.S. federal income tax purposes and without regard to certain basis adjustments that may have the effect of reducing a particular holders net taxable income.
The limited liability company agreement of Medley LLC also provides that substantially all expenses incurred by or attributable to Medley Management Inc. in connection with operating the Company's business, but not including obligations incurred under the tax receivable agreement by Medley Management Inc., income tax expenses of Medley Management Inc. and payments on indebtedness incurred by Medley Management Inc., will be borne by Medley LLC.
Other than Medley Management Inc., holders of LLC Units, including our pre-IPO owners, will, subject to limited exceptions, be prohibited from transferring any LLC Units held by them upon consummation of the IPO, or any shares of Class A common stock received upon exchange of such LLC Units, until the third anniversary of the IPO without our consent. Thereafter and prior to the fourth and fifth anniversaries of the IPO, such holders may not transfer more than 33 1/3% and 66 2/3%, respectively, of the number of LLC Units held by them upon consummation of the IPO, together with the number of any shares of Class A common stock received by them upon exchange therefor, without our consent. While this agreement could be amended or waived by us, our pre-IPO owners have advised us that they do not intend to seek any waivers of these restrictions.
Other Transactions
Christopher Taube, our Senior Managing Director, Head of Institutional Fund Raising, is the brother of Messrs. Brook and Seth Taube, our Co-Chief Executive Officers and Co-Chairmen of the Board. In connection with his employment, Mr. Chris Taube is entitled to a guaranteed annual payment related to his ownership interest in Medley LLC, as well as an annual discretionary bonus which may be in the form of cash, equity based awards and/or profits interests in our advisor entities. Mr. Chris Taube received total compensation valued at $1.2 million, in respect of his 2017 services, which included the guaranteed annual payments. His compensation is commensurate with that of a similarly situated employee in his position.
Statement of Policy Regarding Transactions with Related Persons
Our Board of Directors recognizes the fact that transactions with related persons present a heightened risk of conflicts of interests and/or improper valuation (or the perception thereof). Our Board of Directors has adopted a written policy on transactions with related persons that is in conformity with the requirements for issuers having publicly-held common stock that is listed on the NYSE.
This related person policy requires that a “related person” (as defined as in Item 404(a) of Regulation S-K) must promptly disclose to our General Counsel any “related person transaction” (defined as any transaction that is anticipated would be reportable by us under Item 404(a) of Regulation S-K in which we were or are to be a participant and the amount involved exceeds $120,000 and in which any related person had or will have a direct or indirect material interest) and all material facts with respect thereto. The General Counsel will then promptly communicate that information to our Board. No related person transaction will be executed without the approval or ratification of our Board or a duly authorized committee of the Board. It is our policy that directors interested in a related person transaction will recuse themselves from any vote on a related person transaction in which they have an interest.
Family Relationships of Directors and Executive Officers
Messrs. Brook and Seth Taube, each a Co-Chief Executive Officer and Co-Chairman of the Board of Directors of the Manager, are brothers. There are no other family relationships among any of the other directors or executive officers.
Director Independence and independence Determinations
Under our Corporate Governance Guidelines and NYSE rules, a director is not independent unless the Board affirmatively determines that he or she does not have a direct or indirect material relationship with us or any of our subsidiaries. In addition, the director must meet the bright-line test for independence set forth by the NYSE rules.
84
Our Corporate Governance Guidelines define independence in accordance with the independence definition in the current NYSE corporate governance rules for listed companies. Our Corporate Governance Guidelines require the Board to review the independence of all directors at least annually.
In the event a director has a relationship with the Company that is relevant to his or her independence and is not addressed by the objective tests set forth in the NYSE independence definition, the Board will determine, considering all relevant facts and circumstances, whether such relationship is material.
Our Board has affirmatively determined that each of Messrs. Eaton, Leeds and Rounsaville, Jr. is independent under the guidelines for director independence set forth in the Corporate Governance Guidelines and under all applicable NYSE guidelines, including with respect to committee membership. Our Board also has determined that each of Messrs. Eaton, Leeds and Rounsaville is “independent” for purposes of Section 10A(m)(3) of the Securities Exchange Act of 1934, as amended (the “Exchange Act”).
Item 14. Principal Accounting Fees and Services
Audit Committee Pre-approval Policies and Procedures
Consistent with SEC policies regarding auditor independence and the Audit Committee’s charter, the Audit Committee is directly responsible for the appointment, compensation, retention, oversight and termination of the independent registered public accounting firm engaged (including the resolution of disagreements between management and such firm regarding financial reporting) for the purpose of preparing or issuing an audit report or performing other audit, review or attest services for the Company. In exercising this responsibility, the Audit Committee pre-approves all audit and permitted non-audit services provided by the independent registered public accounting firm prior to each engagement going forward. These services may include audit services, audit-related services, tax services and other services. In addition, the Audit Committee may also pre-approve particular services on a case-by-case basis. The Audit Committee may form and delegate authority to subcommittees consisting of one or more members who are independent directors, when appropriate, including the authority to grant pre-approvals of audit and permitted non-audit services, provided that decisions of such subcommittee to grant pre-approvals shall be presented to the full Audit Committee at its next scheduled meeting.
RSM US LLP Fees
In connection with the audit of the Company’s annual financial statements for the fiscal year ended December 31, 2017, we entered into an agreement with RSM US LLP which sets forth the terms by which RSM US LLP performed audit services for the Company.
The following table presents fees for professional services rendered by RSM US LLP for the audit of our financial statements for 2017 and 2016 and fees billed for other services rendered by RSM US LLP for those periods:
2017 | 2016 | |||||||
Audit fees(1) | $ | 683,714 | $ | 668,141 | ||||
Audit-related fees(2) | 42,532 | 177,230 | ||||||
Tax fees(3) | — | — | ||||||
All other fees(4) | — | — | ||||||
Total | $ | 726,246 | $ | 845,371 | ||||
(1) | Amounts reported under Audit fees include professional services rendered for the audits of our annual financial statements and reviews of our quarterly financial statements. |
(2) | Amounts reported under Audit-related fees include reviews of registration statements filed with the SEC for Medley LLC. |
(3) | Amounts reported under Tax fees include professional services rendered for tax return compliance, including review of partner capital accounts, and consultations related to technical interpretations, applicable laws and regulations and tax accounting. There were no such fees in 2017 and 2016. |
(4) | All other fees encompasses any services provided by the independent registered public accounting firm other than services reported in the other above categories. There were no such fees in 2017 and 2016. |
85
PART IV.
Item 15. Exhibits
Exhibit No. | Exhibit Description | |
3.1 | ||
3.2 | ||
4.1 | ||
4.2 | ||
4.3 | ||
4.4 | ||
4.5 | ||
10.1 | ||
10.2 | ||
10.3 | ||
10.4 | ||
10.5 | ||
10.6 | ||
10.7 | ||
10.8† | ||
10.9† | ||
10.10† | ||
10.11† | ||
10.12† | ||
10.13† | ||
10.14† | ||
10.15† | ||
10.16† | ||
10.17† | ||
10.18† | ||
10.19† | ||
10.20† | ||
10.21† | ||
10.22† | ||
10.23 | ||
10.24 | ||
10.25 | ||
10.26 | ||
10.27† | ||
10.28 | ||
87
10.29 | ||
21.1* | ||
23.1* | ||
31.1* | ||
31.2* | ||
31.3* | ||
32.1** | ||
32.2** | ||
32.3** | ||
101.INS* | XBRL Instance Document | |
101.SCH* | XBRL Taxonomy Extension Schema Document | |
101.CAL* | XBRL Taxonomy Extension Calculation Linkbase Document | |
101.DEF* | XBRL Taxonomy Extension Definition Linkbase Document | |
101.LAB* | XBRL Taxonomy Extension Label Linkbase Document | |
101.PRE* | XBRL Taxonomy Extension Presentation Linkbase Document | |
* Filed herewith
** Furnished herewith
† Management contract or compensatory plan in which directors and/or executive officers are eligible to participate
The agreements and other documents filed as exhibits to this report are not intended to provide factual information or other disclosure other than with respect to the terms of the agreements or other documents themselves, and you should not rely on them for that purpose. In particular, any representations and warranties made by us in these agreements or other documents were made solely within the specific context of the relevant agreement or document and may not describe the actual state of affairs as of the date they were made or at any other time.
Item 16. Form 10-K Summary
None.
88
SIGNATURES
Pursuant to the requirements of the Securities Exchange Act of 1934, the Registrant has duly caused this report to be signed on its behalf by the undersigned thereunto duly authorized.
MEDLEY MANAGEMENT INC. | ||
(Registrant) | ||
Date: March 29, 2018 | By: | /s/ Richard T. Allorto, Jr. |
Richard T. Allorto Jr. | ||
Chief Financial Officer | ||
(Principal Financial Officer and Authorized Signatory) | ||
Pursuant to the requirements of the Securities Exchange Act of 1934, this report has been signed by the following persons on behalf of the registrant and in the capabilities indicated on the 29th day of March, 2018.
Signature | Title | |
/s/ Brook Taube | Co-Chief Executive Officer, Chief Investment Officer and Co-Chairman | |
Brook Taube | (Co-Principal Executive Officer) | |
/s/ Seth Taube | Co-Chief Executive Officer and Co-Chairman | |
Seth Taube | (Co-Principal Executive Officer) | |
/s/ Richard T. Allorto, Jr. | Chief Financial Officer | |
Richard T. Allorto, Jr. | (Principal Financial Officer and Principal Accounting Officer) | |
/s/ Jeffrey Tonkel | President and Director | |
Jeffrey Tonkel | ||
/s/ James G. Eaton | Director | |
James G. Eaton | ||
/s/ Jeffrey T. Leeds | Director | |
Jeffrey T. Leeds | ||
/s/ Guy Rounsaville, Jr. | Director | |
Guy Rounsaville, Jr. | ||
89