Attached files
| file | filename |
|---|---|
| 8-K - Good Times Restaurants Inc. | r1121808k.htm |
Exhibit 99.1

Nasdaq Capital Market: GTIM Investor Presentation November 2018

Forward - Looking Statements and Non - GAAP Financial Information 2 Forward - Looking Statements This presentation contains forward - looking statements . All statements other than statements of historical facts contained in this presentation may be forward - looking statements . The words “may,” “will,” “should,” “expects,” “plans,” “anticipates,” “could,” “intend,” “targets,” “projects,” “contemplates,” “believes,” “estimates”, “predicts,” “potential” or “continue” and other expressions that are predictions of or indicate future events and trends and that do not relate to historical matters identify forward - looking statements . Forward - looking statements involve known and unknown risks, uncertainties and other important factors that may cause our actual results, performance or achievements to be materially different from any future results, performance or achievements expressed or implied by the forward - looking statements . Important factors that could cause actual results to differ materially from expectation are disclosed under the section “Risk Factors” in the Company’s Annual Report on Form 10 - K filed with the Securities and Exchange Commission (“SEC”) . All written and oral forward - looking statements attributable to us, or persons acting on our behalf, are expressly qualified in their entirety by the cautionary statements . You should evaluate all forward - looking statements made in this presentation in the context of these risks and uncertainties . Because forward - looking statements are inherently subject to risks and uncertainties, some of which cannot be predicted or qualified, you should not rely on these forward - looking statements as predictions of future events . The events and circumstances reflected in our forward - looking statements may not be achieved or occur and actual results could differ materially from those projected in the forward - looking statements . Any forward - looking statements made in this presentation is current only as of the date on which it is made . The Company does not undertake any obligation to publicly update any previously - made forward - looking statement, irrespective of any new information, changes in facts, circumstances, or developments, or otherwise, except as required by law . Non - GAAP Financial Information The non - GAAP financial measures contained in this presentation (including, without limitation, EBITDA, Adjusted EBITDA, Restaurant Operating Profit and Cash on Cash Return on Investment) are not GAAP measures of financial performance or liquidity and should not be considered as alternatives to net income (loss) as a measure of financial performance or cash flows from operations as measures of liquidity, or any other performance measure derived in accordance with GAAP . Adjusted EBITDA should not be construed as an inference that our future results will be unaffected by unusual or non - recurring items . Additionally, EBITDA and Adjusted EBITDA are not intended to be measures of free cash flow for management’s discretionary use, as they do not reflect tax payments, debt service requirements, capital expenditures, new restaurant openings and certain other cash costs that may recur in the future, including among other things, cash requirements for working capital needs and cash costs to replace assets being depreciated and amortized . Management compensates for these limitations by relying on our GAAP results in addition to using EBITDA and Adjusted EBITDA in a supplemental manner . EBITDA, Adjusted EBITDA, Restaurant Operating Profit and Cash on Cash Return on Investment are included in this presentation because they are key metrics used by management and our board of directors to assess our financial performance . EBITDA and Adjusted EBITDA are frequently used by analysts, investors and other interested parties to evaluate companies in our industry . Our measures of EBITDA, Adjusted EBITDA, Restaurant Operating Profit and Cash on Cash Return on Investment are not necessarily comparable to similarly titled captions of other companies due to different methods of calculation .

3 Company and Concept Overview • Two Differentiated and Complementary Concepts • Excellent Cash - on - Cash Return Model for Bad Daddy’s Expansion • Momentum Driven by Successful Execution Across Multiple Geographies • Stable Cash Flow from Good Times That Can Be Reinvested in Bad Daddy’s Growth • Experienced Leadership Team • Sophisticated Systems and Proven Operations Support Accelerated Growth 1 2 3 4 5 6 • Founded in 2008 • Acquired by Good Times in 2015 as growth platform • Full - service, upscale, chef - inspired restaurant concept • Founded by an award - winning entrepreneur founder of numerous successful concepts • Operate, license and franchise 33 restaurants in Colorado (12),North Carolina (14), Georgia (3), Oklahoma (1), South Carolina (2), and Tennessee (1) as of November 1, 2018 • Founded in 1987 • Only QSR with steroid - free, hormone - free, vegetarian - fed, humanely - raised beef and chicken • “Fresh, Handcrafted, All - Natural” position • Operates and franchises 36 restaurants located primarily in the front - range communities of Colorado • Strong history of same store sales growth

How We Win 4 Business Differentiated Service • “Radical Hospitality” • A commitment to high - touch service • Efficient but personalized • “Cooked to Order at the Speed of QSR” • Dedicated to offering incredible food and unparalleled service in QSR environment High - quality, Segment - Leading Food Quality • “Artfully Created Food” • Chef - driven recipes, yet fast prep speeds • High quality, fresh ingredients • Regional / seasonal ingredients and menu offerings • “All Natural Beef & Chicken, Fresh Frozen Custard” • The QSR industry’s only all - natural, handcrafted brand positioning • Antibiotic - and hormone - free protein platform • Where possible uses regional / seasonal ingredients Brands with Personality and Attitude • A “Bad Ass Bar” • Local craft beers in bar menu at every location • Edgy, retro attitude in a suburb - friendly space • Personality permeates brand – in the décor, menu names, service style • “Because That’s the Kind of Company We Are” • Quirky irreverent advertising • Emphasizes the quality and natural brand positioning Financial Great Momentum • Multi - geography concept successful in diverse regions • High customer receptivity, six restaurants opened in FY2017, nine restaurants projected FY2018, and seven to nine projected for FY2019 • History of continued SSS growth • Driving sales without reliance on discounting • Brand well positioned for franchising and opportunistic expansion Industry Leading Unit Economics • Combination of higher average check, smaller box, and low cost to build leads to strong unit economics • Industry leading cash - on - cash returns • Flexible real estate model that can work in a variety of sites • High cash - on - cash returns

Superior Positioning and Quality 5 “Bringing cool to the suburbs” “Fast casual quality, QSR speed of service” QSR Fast Casual Casual Dining Polished Casual High Average Check Low Average Check


Bad Daddy’s Burger Bar – Future Growth Platform 7 • Bad Daddy’s Burger Bar (“BDBB”) is a 33 - unit full service concept with a high - energy, chef - driven, burger - and bar - focused positioning founded in Charlotte, NC in 2008 • Fully - committed to full service model; strong volume in a comparatively small box enables us to generate high energy, high sales per square foot, and spend a little more on elevated service • 31 Company - owned stores, 1 franchise store, 1 licensed store as of November 1, 2018 • ~$17 per person average check (including alcohol) • 59% Dinner / 41% Lunch, 84% Food / 16% Alcohol • Implied guidance of ~10MM restaurant - level cash flow represents an ~60% CAGR between 2015 and 2018, and expect continued growth rate at ~30% - 40% for each of the following two years. Company - owned Restaurant Sales and Store Level EBITDA (1) ($ in Millions) (1) For reconciliation of Store Level EBITDA to comparable GAAP measure, see slide 23. *FY2018P and FY2019P represents the midpoint of the Company’s guidance, per the most recent earnings release filed August 9, 201 8. $1.8 $15.0 $34.9 $47.7 $67.0 $ 90.9 $2.4 $5.6 $7.1 $10.5 $14.3 FY14A FY15A FY16A FY17A FY18P FY19P Restaurant Sales Store Level EBITDA 2 10 16 22 31 39 3 3 2 2 2 FY14A FY15A FY16A FY17A FY18A FY19P Company Franchised / Licensed System - wide Units

Chef - driven menu with big portions and in - your - face flavors 8 • Simple, high - quality ingredients executed at a high level − House - made sauces and dressings − “Create Your Own” burgers and salads − Monthly chef specials − Featured proteins include beef, chicken, turkey, buffalo and tuna • Bar sales averaging ~16.2% of mix for LTM (ranged from 11 – 25%) − 17 – 20 local micro - brews on tap − Fresh - squeezed cocktails, “Bad Ass Margarita” Burgers Starters / Sides Non - Burgers / Salads Drinks / Desserts

Marketing Approach and Strategy 9 • Brand Voice & Personality: − “We brought cool to the suburbs” − Irreverent but not offensive, non - chain, Classic Rock − Bad Ass, fun, informal, high - energy − Culture of “yes” − It’s all about the food: culinary - driven concept • Key Messages: − Scratch - made, artisan ingredients, unique flavor profiles and near limitless customization drive a “Create Your Own” attitude − Bad Ass Margaritas (#Limit2), award winning local craft beers − Best - in - town, local, each store with unique identity • Core Target: − Affectionately the “upscale redneck” & the “naughty white collar” − Household income of $60k – $75k − White & grey collar − Families with 5 – 18 year old kids

• Bad Daddy’s Burger Bar “brings cool to the suburbs” • High - traffic suburban areas with lunch and dinner traffic • Metropolitan areas of Tier II cities • Take an ever - larger share of wallet through displacement of competing concepts • Take share from full service concepts • High ROI, small box model • 3800 sf endcap with patio • 32 tables, 14 seat bar • Over $700 per sf in sales • Generate a fan following through social media engagement • Local and specific events drive more customer engagement • Create an emotional attachment to the brand Focus On Inner - And Outer - ring Suburbs Upscale demo, high daytime employment, retail & traffic generators Take Share Through Superior Quality and Service Drive Traffic Through Social Media and Local Engagement Core Growth Philosophy 10 1 2 3 Drive Successful Growth with Strongly Aligned Tactics And Strategy 4
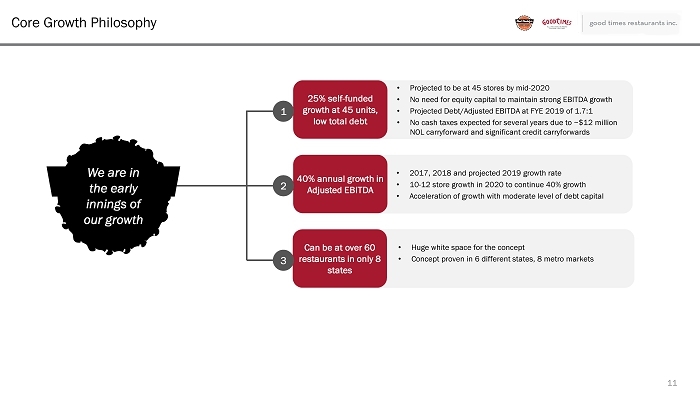
• Projected to be at 45 stores by mid - 2020 • No need for equity capital to maintain strong EBITDA growth • Projected Debt/Adjusted EBITDA at FYE 2019 of 1.7:1 • No cash taxes expected for several years due to ~$12 million NOL carryforward and significant credit carryforwards • Huge white space for the concept • Concept proven in 6 different states, 8 metro markets • 2017, 2018 and projected 2019 growth rate • 10 - 12 store growth in 2020 to continue 40% growth • Acceleration of growth with moderate level of debt capital 25% self - funded growth at 45 units, low total debt 40% annual growth in Adjusted EBITDA Can be at over 60 restaurants in only 8 states Core Growth Philosophy 11 1 2 3 We are in the early innings of our growth

Economics Proven in 6 States with Runway for Future Growth 12 Existing Markets Future likely markets Markets under consideration 9 (3 joint - venture) FY2018 New Units Source: U.S. Department of the Census FY2017 New Units 6 (2 joint - venture) Target Unit Economics • Targeted cash - on - cash return of ~40%+ • $2.6MM targeted AUV with $1.0mm build cost net of landlord contribution • Last ten units generating AUV in excess of $2.7MM • Bad Daddy’s Burger Bar seeks in - line and end - cap locations ranging from 3,500 – 4,000 sf. with 140 seats plus patio • 4 stores with rooftop bars and patios • Typically open from 11AM – 10PM (slightly later on weekends) (1) Store Level EBITDA is defined as restaurant level cash flow less advertising plus non - cash rent and D&A. (2) Store Level EBITDA Margin for units in Federal tip minimum wage states. (3) Investment Cost is net of landlord provided tenant improvement allowance. Cash - on - Cash Return Year 1 Estimate Sales 2,600,000 $ Store Level EBITDA (1)(2) (a) 420,000 $ Store Level EBITDA Margin 16.2% Investment Cost (3) (b) 1,000,000 $ Store Level Cash on Cash ROI (a) / (b) 42.0% Existing and Near-Term Target DMAs Metropolitan Area State 2016 Population (est millions) Pop Growth 2010 - 2016 Committed Units* Potential Total Units Front Range Colorado Colorado 5.0 12.2% 12 13 Charlotte/Raleigh/NC North Carolina 5.0 10.8% 15 18 Atlanta/Augusta/Macon Georgia 8.0 9.2% 4 12 South Carolina South Carolina 2.0 5.9% 4 7 Nashville/Chattanooga Tennessee 2.3 3.3% 3 5 Birmingham/Hunstville Alabama 1.4 2.0% 2 5 Houston, San Antonio Texas 5.0 4.0% 0 10 Oklahoma City/Tulsa Oklahoma 1.4 9.3% 1 4 Total Restaurants 41 74 *Charlotte DMA includes licenced location at CLT airport; Data through June 4, 2018 *South Carolina includes franchised location in Greenville, SC 7 - 9 (all company - owned) FY2019* New Units *FY18P and FY19P based upon Company’s guidance, per the most recent earnings release filed August 9, 2018.


Good Times Burgers and Frozen Custard 14 • Good Times Burgers and Frozen Custard (“GTBFC”) is the only QSR concept with steroid - free, hormone - free, vegetarian - fed, humanely - raised chicken and beef • “Fresh, Handcrafted, All - Natural” position • 26 Company - owned stores, 10 franchise stores • $1.2MM average annual unit volume • Consistently generates $3MM+ of restaurant - level cash flow that we can redeploy into new Bad Daddy’s development Company - owned Restaurant Sales and Store Level EBITDA (1) ($ in Millions) (1) For reconciliation of Store Level EBITDA to comparable GAAP measure, see slide 23. * FY18P, FY19P Sales and EBITDA, represent the midpoint of the Company’s guidance, per the most recent earnings release filed Au gust 9, 2018. $25.6 $28.5 $28.9 $30.7 $31.7 $ 30.6 $3.6 $3.9 $3.8 $3.6 $3.4 $ 3.3 FY14A FY15A FY16A FY17A FY18P FY19P Restaurant Sales Store Level EBITDA 6.1% 0.7% 3.4% 7.3% 3.4% 1.3% 5.1% 7.0% 15.2% 18.2% 17.4% 17.8% 12.5% 11.9% 8.0% 8.2% 4.8% 6.8% 4.8% 0.5% (2.0%) (1.2%) (0.5%) 0.1% 3.7% 3.9% 5.9% 7.1% 3.7% 0.5% 3Q11 4Q11 1Q12 2Q12 3Q12 4Q12 1Q13 2Q13 3Q13 4Q13 1Q14 2Q14 3Q14 4Q14 1Q15 2Q15 3Q15 4Q15 1Q16 2Q16 3Q16 4Q16 1Q17 2Q17 3Q17 4Q17 1Q18 2Q18 3Q18 4Q18 CONSISTENT, STRONG SAME - STORE SALES GENERATION

Marketing Approach and Strategy 15 • Brand Voice & Personality: − The Jester: never look or feel like the big guys − A principled brand: we do the right thing because “that’s the kind of company we are” − Go to lengths the other guys don’t & won’t • Key Messages: − 100% all - natural beef & chicken: no hormones, no steroids, no antibiotics, vegetarian - fed, humanely - raised − Fresh, handcrafted and regional ingredients − Quick, but not the fastest – made to order and cooked to order − Cravability vs. simply new − Where food comes from matters • Core Target: − 18 – 49 years old with an emphasis on 25 – 49 range − Customers skew more female than traditional QSR − Index most closely with Chick - fil - A customer − Middle to upper income

Financial Review

Full - Year Guidance Summary – FY18 and FY19 FY 2018 Guidance as of August 9, 2018 □ Revenues: $99 to $100 million □ Q4 Comparable sales: +0.0% to +1.0% □ FY 2018 New Units: 9 restaurants □ Adjusted EBITDA: $5.3 - $5.6 million □ Year - end long - term debt: $9.0 - $9.5 million FY 2019 Guidance as of August 9, 2018 □ Revenues: $120 to $123 million □ Q4 Comparable sales: – Bad Daddy’s Segment approx. +1% – Good Times Segment approx. +2% (0% in Q2) □ FY 2019 New Units: 7 - 9 restaurants □ Adjusted EBITDA: $7.6 - $8.1 million □ Year - end long - term debt: $13.0 - $13.5 million 17 At the end of Q3 2018 we had nearly $7 million available on our credit facility. Additionally, on October 31, 2018, we amended our agreement with Cadence Bank to expand the facility by an additional $5 million and extend the facility’s expiration date until December 31, 2021. Given the strong performance of both concepts, including significant contribution by new Bad Daddy’s restaurants, we expect to be able to continue our FY2018 unit growth through FY2020 without raising equity, which we expect to translate to an Adjusted EBITDA CAGR of ~40%.

Comparable Growth Company Valuations 18 GTIM trades a significant discount to it’s peers on an EV/Revenue and EV/EBITDA basis given its growth *Price and Market Cap effective as of market close October 26, 2018 FY2018P and FY2019P for GTIM represents the midpoint of the Company’s guidance, per the most recent earnings release filed A ugu st 9, 2018 and for other companies based upon analysis of public information available as of October 31, 2018. Market Enterprise Price Cap Value 2017A 2018E 2019E 2018E 2019E GTIM Good Times Restaurants 4.64 58.9 61.0 78.4 100.0 121.0 0.6 0.5 27.6% 21.0% HABT Habit Restaurants 13.93 362.2 355.5 332 395 442 0.9 0.8 19.1% 12.0% CHUY Chuy's 24.20 411.4 401.4 370 405 448 1.0 0.9 9.6% 10.6% NDLS Noodles & Co. 9.70 398.7 461.7 451 457 461 1.0 1.0 1.3% 0.9% TACO Del Taco 10.77 415.7 585.7 471 510 539 1.1 1.1 8.3% 5.7% FRGI Fiesta Restaurant Group 26.52 724.0 794.0 669 686 719 1.2 1.1 2.5% 4.8% LOCO El Pollo Loco 12.69 494.9 567.9 402 430 444 1.3 1.3 7.0% 3.3% SHAK Shake Shack 52.25 1,504.8 1,584.7 359 450 568 3.5 2.8 25.4% 26.2% WING Wingstop 67.19 1,982.1 2,202.0 106 151 167 14.6 13.2 42.5% 10.6% Revenue EV/Revenue

Appendix
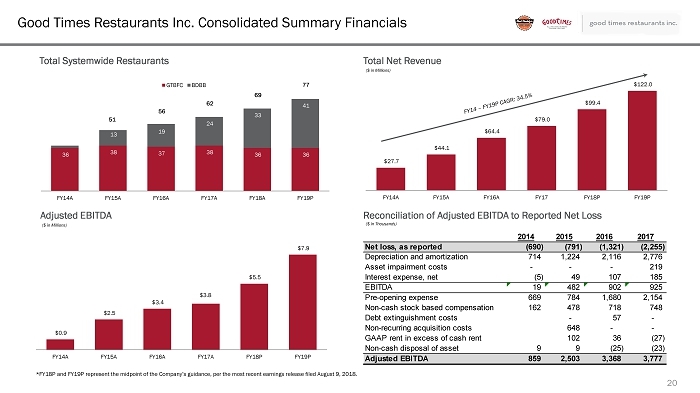
Good Times Restaurants Inc. Consolidated Summary Financials 20 Total Systemwide Restaurants Total Net Revenue Adjusted EBITDA Reconciliation of Adjusted EBITDA to Reported Net Loss ($ in Millions) ($ in Millions) 36 38 37 38 36 36 13 19 24 33 41 51 56 62 69 77 FY14A FY15A FY16A FY17A FY18A FY19P GTBFC BDBB $27.7 $44.1 $64.4 $79.0 $99.4 $122.0 FY14A FY15A FY16A FY17 FY18P FY19P $0.9 $2.5 $3.4 $3.8 $5.5 $7.9 FY14A FY15A FY16A FY17A FY18P FY19P *FY18P and FY19P represent the midpoint of the Company’s guidance, per the most recent earnings release filed August 9, 2018. ($ in Thousands) 2014 2015 2016 2017 Net loss, as reported (690) (791) (1,321) (2,255) Depreciation and amortization 714 1,224 2,116 2,776 Asset impairment costs - - - 219 Interest expense, net (5) 49 107 185 EBITDA 19 482 902 925 Pre-opening expense 669 784 1,680 2,154 Non-cash stock based compensation 162 478 718 748 Debt extinguishment costs - 57 - Non-recurring acquisition costs 648 - - GAAP rent in excess of cash rent 102 36 (27) Non-cash disposal of asset 9 9 (25) (23) Adjusted EBITDA 859 2,503 3,368 3,777

Tax Position 21 We have accumulated significant tax assets, although due to accumulated historical losses, combined with the expectation of future losses for the next few fiscal years, we have fully reserved against these tax assets. □ Future losses are primarily driven by the immediate expensing of pre - opening costs for new Bad Daddy’s. While we expect to continue our expansion, we expect our book losses to narrow, and in the more distant future we should generate positive net income. □ These tax assets, primarily an NOL carry - forward of approximately $12 million and tax credits exceeding $1 million (with additional NOL and credits expected to be generated in FY 2018), could offset significant future federal taxable income. Deferred Tax Assets as of FYE 2017 Current Long - Term Tax effect of NOL carry - forward $0. $4,084. General business credits 0. 1,378. Partnership/JV differences 0. - 126. Deferred revenue 0. 75. PP&E Basis Differences 0. - 859. Intangibles Basis Difference 0. - 705. Other liability/asset difference $117. 1,454. Subtotal 117. 5,301. Less: Valuation Allowance - 117. - 5,301. Net Deferred Tax Assets $0. $0. Source: Good Times Restaurants Inc. 10 - K filed on December 22, 2017

Reconciliation of Store - Level EBITDA to Segment Income from Operations 22 Adjusted EBITDA Margin ($ in Thousands) Bad Daddy’s Operating Segment 2015 2016 2017 Income from Operations (759) (520) (1,104) Net franchise/license income (18) (367) (361) Depreciation and Amortization 568 1,475 2,059 Pre-opening expense 612 1,691 2,438 Regional, G&A, and training expenses 1,328 3,296 4,082 GAAP rent in excess of cash rent 59 (6) (23) Non-cash disposal of asset - - 2 Acquisition costs 649 - - Store Level EBITDA 2,437 5,569 7,093 ($ in Thousands) Good Times Operating Segment 2015 2016 2017 Income from Operations 520 804 322 Net franchise/license income (288) (249) (216) Depreciation and Amortization 657 731 819 Pre-opening expense 172 4 151 Regional, G&A, and training expenses 2,774 2,462 2,356 GAAP rent in excess of cash rent 49 42 22 Non-cash disposal of asset 9 (25) (26) Asset impairment charges - - 219 Store Level EBITDA 3,892 3,769 3,648