Attached files
| file | filename |
|---|---|
| EX-32.2 - EX-32.2 - Daseke, Inc. | dske-20180930ex322a22d10.htm |
| EX-32.1 - EX-32.1 - Daseke, Inc. | dske-20180930ex321b7c088.htm |
| EX-31.2 - EX-31.2 - Daseke, Inc. | dske-20180930ex3123afc95.htm |
| EX-31.1 - EX-31.1 - Daseke, Inc. | dske-20180930ex31135075a.htm |
UNITED STATES
SECURITIES AND EXCHANGE COMMISSION
Washington, D.C. 20549
FORM 10-Q
(Mark One)
|
☒ |
QUARTERLY REPORT PURSUANT TO SECTION 13 OR 15(d) OF THE SECURITIES EXCHANGE ACT OF 1934 |
For the quarterly period ended September 30, 2018
OR
|
☐ |
TRANSITION REPORT PURSUANT TO SECTION 13 OR 15(d) OF THE SECURITIES EXCHANGE ACT OF 1934 |
For the transition period from ________ to _________
DASEKE, INC.
(Exact name of registrant as specified in its charter)
|
Delaware |
|
001-37509 |
|
47-3913221 |
|
|
|
|
|
|
|
15455 Dallas Parkway, Suite 550 |
|
75001 |
||
|
(Address of Principal Executive Offices) |
|
(Zip Code) |
||
|
|
|
|
|
|
|
Registrant’s Telephone Number, Including Area Code: (972) 248-0412
Not applicable (Former name, former address and former fiscal year, if changed since last report) |
||||
|
|
||||
Indicate by check mark whether the registrant (1) has filed all reports required to be filed by Section 13 or 15(d) of the Securities Exchange Act of 1934 during the preceding 12 months (or for such shorter period that the registrant was required to file such reports), and (2) has been subject to such filing requirements for the past 90 days. Yes ☒ No ☐
Indicate by check mark whether the registrant has submitted electronically every Interactive Data File required to be submitted pursuant to Rule 405 of Regulation S-T (§ 232.405 of this chapter) during the preceding 12 months (or for such shorter period that the registrant was required to submit such files).Yes ☒ No ☐
Indicate by check mark whether the registrant is a large accelerated filer, an accelerated filer, a non-accelerated filer, smaller reporting company, or an emerging growth company. See the definitions of “large accelerated filer,” “accelerated filer,” “smaller reporting company” and “emerging growth company” in Rule 12b-2 of the Exchange Act.
|
☐ Large accelerated filer |
|
|
|
☒ Accelerated filer |
|
☐ Non-accelerated filer |
|
|
|
|
|
☐ Smaller reporting company |
|
|
|
☒ Emerging growth company |
If an emerging growth company, indicate by check mark if the registrant has elected not to use the extended transition period for complying with any new or revised financial accounting standards provided pursuant to Section 13(a) of the Exchange Act. ☐
Indicate by check mark whether the registrant is a shell company (as defined in Rule 12b-2 of the Exchange Act). Yes ☐ No ☒
Common shares of the registrant outstanding at November 5, 2018 were 64,454,182.
DASEKE, INC.
FORM 10-Q
For the Quarterly Period Ended September 30, 2018
Cautionary Note Regarding Forward-Looking Statements
This Quarterly Report on Form 10-Q (this Report) of Daseke, Inc. (Daseke or the Company) contains forward-looking statements within the meaning of the Private Securities Litigation Reform Act of 1995. Except as otherwise indicated by the context, references in this Report to “we,” “us” and “our” are to the consolidated business of the Company. All statements in this Report, including those made by the management of the Company, other than statements of historical fact, are forward-looking statements. These forward-looking statements are based on management’s estimates, projections and assumptions as of the date hereof. Forward-looking statements may contain words such as “may,” “will,” “expect,” “anticipate,” “continue,” “estimate,” “project,” “believe,” “plan,” “should,” “could,” “would,” “forecast,” “seek,” “target,” “predict,” and “potential,” the negative of these terms, or other comparable terminology. Forward-looking statements may include statements about the Company’s goals; the Company’s financial strategy, liquidity and capital required for its business strategy and plans; the Company’s competition and government regulations; general economic conditions; and the Company’s future operating results.
These forward-looking statements are based on information available as of the date of this Report (or, in the case of forward-looking statements incorporated herein by reference, as of the date of the applicable filed document), and current expectations, forecasts and assumptions. While management believes that these forward-looking statements are reasonable as and when made, there can be no assurance that future developments affecting us will be those that the Company anticipates. Accordingly, forward-looking statements should not be relied upon as representing the Company’s views as of any subsequent date, and the Company does not undertake any obligation to update forward-looking statements to reflect events or circumstances after the date they were made, whether as a result of new information, future events or otherwise, except as may be required under applicable securities laws. Accordingly, readers are cautioned not to place undue reliance on the forward-looking statements.
Forward-looking statements are subject to risks and uncertainties (many of which are beyond the Company’s control) that could cause actual results to differ materially from the Company’s historical experience and our present expectations or projections. Important factors that could cause actual results to differ materially from those in the forward-looking statements include, but are not limited to, general economic and business risks, driver shortages and increases in driver compensation or owner-operator contracted rates, loss of senior management or key operating personnel, our ability to identify and execute future acquisitions successfully, seasonality and the impact of weather and other catastrophic events, fluctuations in the price or availability of diesel fuel, increased prices for, or decreases in the availability of, new revenue equipment and decreases in the value of used revenue equipment, the Company’s ability to generate sufficient cash to service all of the Company’s indebtedness, restrictions in its existing and future debt agreements, increases in interest rates, changes in existing laws or regulations, including environmental and worker health safety laws and regulations and those relating to tax rates or taxes in general, the impact of governmental regulations and other governmental actions related to the Company and its operations, litigation and governmental proceedings, and insurance and claims expenses. For additional information regarding known material factors that could cause the Company’s actual results to differ from its projected results, please see the Company’s filings with the Securities and Exchange Commission (the SEC), particularly the section titled “Item 1A. Risk Factors” in the Company’s Annual Report on Form 10-K, filed with the SEC on March 16, 2018.
All forward-looking statements, expressed or implied, attributed to the Company or persons acting on its behalf are expressly qualified in their entirety by this cautionary statement. This cautionary statement should also be considered in connection with any subsequent written or oral forward-looking statements that the Company or persons acting on its behalf may issue.
Part I – FINANCIAL INFORMATION
Item 1. Financial Statements (Unaudited)
DASEKE, INC. AND SUBSIDIARIES
(Unaudited)
(In thousands, except share and per share data)
|
|
|
September 30, |
|
December 31, |
||
|
|
|
2018 |
|
2017 |
||
|
ASSETS |
|
|
|
|
|
|
|
Current assets: |
|
|
|
|
|
|
|
Cash and cash equivalents |
|
$ |
18,077 |
|
$ |
90,679 |
|
Accounts receivable, net of allowance of $788 and $212 at September 30, 2018 and December 31, 2017, respectively |
|
|
233,983 |
|
|
127,368 |
|
Drivers’ advances and other receivables |
|
|
6,045 |
|
|
4,792 |
|
Current portion of net investment in sales-type leases |
|
|
15,744 |
|
|
10,979 |
|
Parts supplies |
|
|
5,366 |
|
|
4,653 |
|
Prepaid and other current assets |
|
|
33,458 |
|
|
28,240 |
|
Total current assets |
|
|
312,673 |
|
|
266,711 |
|
|
|
|
|
|
|
|
|
Property and equipment, net |
|
|
562,659 |
|
|
429,639 |
|
Intangible assets, net |
|
|
212,009 |
|
|
93,120 |
|
Goodwill |
|
|
274,291 |
|
|
302,702 |
|
Other long-term assets |
|
|
44,902 |
|
|
33,496 |
|
Total assets |
|
|
1,406,534 |
|
|
1,125,668 |
|
|
|
|
|
|
|
|
|
LIABILITIES AND STOCKHOLDERS’ EQUITY |
|
|
|
|
|
|
|
Current liabilities: |
|
|
|
|
|
|
|
Accounts payable |
|
|
25,534 |
|
|
12,488 |
|
Accrued expenses and other liabilities |
|
|
54,370 |
|
|
25,876 |
|
Accrued payroll, benefits and related taxes |
|
|
20,315 |
|
|
14,004 |
|
Accrued insurance and claims |
|
|
14,351 |
|
|
12,644 |
|
Current portion of long-term debt |
|
|
58,407 |
|
|
43,056 |
|
Total current liabilities |
|
|
172,977 |
|
|
108,068 |
|
|
|
|
|
|
|
|
|
Line of credit |
|
|
15,664 |
|
|
4,561 |
|
Long-term debt, net of current portion |
|
|
594,360 |
|
|
569,740 |
|
Deferred tax liabilities |
|
|
134,057 |
|
|
90,434 |
|
Other long-term liabilities |
|
|
20,960 |
|
|
1,632 |
|
Total liabilities |
|
|
938,018 |
|
|
774,435 |
|
|
|
|
|
|
|
|
|
Commitments and contingencies (Note 15) |
|
|
|
|
|
|
|
|
|
|
|
|
|
|
|
Stockholders’ equity: |
|
|
|
|
|
|
|
Series A convertible preferred stock, $0.0001 par value; 10,000,000 shares authorized; 650,000 shares issued with liquidation preference of $65,000 at September 30, 2018 and December 31, 2017 |
|
|
65,000 |
|
|
65,000 |
|
Common stock, par value $0.0001 per share; 250,000,000 shares authorized, 64,445,371 and 48,712,288 shares issued and outstanding at September 30, 2018 and December 31, 2017, respectively |
|
|
6 |
|
|
5 |
|
Additional paid-in-capital |
|
|
432,795 |
|
|
277,931 |
|
Retained earnings (accumulated deficit) |
|
|
(29,710) |
|
|
7,338 |
|
Accumulated other comprehensive income |
|
|
425 |
|
|
959 |
|
Total stockholders’ equity |
|
|
468,516 |
|
|
351,233 |
|
Total liabilities and stockholders’ equity |
|
$ |
1,406,534 |
|
$ |
1,125,668 |
The accompanying notes are an integral part of the consolidated financial statements.
1
DASEKE, INC. AND SUBSIDIARIES
CONSOLIDATED STATEMENTS OF OPERATIONS AND COMPREHENSIVE INCOME (LOSS)
(Unaudited)
(In thousands, except share and per share data)
|
|
|
Three Months Ended |
|
Nine Months Ended |
||||||||
|
|
|
September 30, |
|
September 30, |
||||||||
|
|
|
2018 |
|
2017 |
|
2018 |
|
2017 |
||||
|
Revenues: |
|
|
|
|
|
|
|
|
|
|
|
|
|
Freight |
|
$ |
329,474 |
|
$ |
171,245 |
|
$ |
842,128 |
|
$ |
446,454 |
|
Brokerage |
|
|
82,203 |
|
|
34,198 |
|
|
188,432 |
|
|
83,723 |
|
Logistics |
|
|
11,656 |
|
|
7,871 |
|
|
31,265 |
|
|
10,571 |
|
Fuel surcharge |
|
|
38,256 |
|
|
18,008 |
|
|
104,244 |
|
|
48,331 |
|
Total revenue |
|
|
461,589 |
|
|
231,322 |
|
|
1,166,069 |
|
|
589,079 |
|
|
|
|
|
|
|
|
|
|
|
|
|
|
|
Operating expenses: |
|
|
|
|
|
|
|
|
|
|
|
|
|
Salaries, wages and employee benefits |
|
|
114,776 |
|
|
64,955 |
|
|
287,735 |
|
|
174,253 |
|
Fuel |
|
|
38,931 |
|
|
24,734 |
|
|
103,666 |
|
|
64,423 |
|
Operations and maintenance |
|
|
51,494 |
|
|
35,132 |
|
|
126,427 |
|
|
86,332 |
|
Communications |
|
|
920 |
|
|
539 |
|
|
2,426 |
|
|
1,491 |
|
Purchased freight |
|
|
170,548 |
|
|
61,598 |
|
|
429,948 |
|
|
148,945 |
|
Administrative expenses |
|
|
16,075 |
|
|
8,619 |
|
|
41,290 |
|
|
24,019 |
|
Sales and marketing |
|
|
1,007 |
|
|
488 |
|
|
2,295 |
|
|
1,425 |
|
Taxes and licenses |
|
|
4,681 |
|
|
2,963 |
|
|
12,265 |
|
|
7,855 |
|
Insurance and claims |
|
|
12,738 |
|
|
6,351 |
|
|
32,350 |
|
|
15,516 |
|
Acquisition-related transaction expenses |
|
|
601 |
|
|
773 |
|
|
2,442 |
|
|
2,255 |
|
Depreciation and amortization |
|
|
36,800 |
|
|
19,805 |
|
|
93,748 |
|
|
53,758 |
|
Gain on disposition of revenue property and equipment |
|
|
(899) |
|
|
(339) |
|
|
(1,545) |
|
|
(513) |
|
Impairment |
|
|
— |
|
|
— |
|
|
2,840 |
|
|
— |
|
Total operating expenses |
|
|
447,672 |
|
|
225,618 |
|
|
1,135,887 |
|
|
579,759 |
|
Income from operations |
|
|
13,917 |
|
|
5,704 |
|
|
30,182 |
|
|
9,320 |
|
|
|
|
|
|
|
|
|
|
|
|
|
|
|
Other expense (income): |
|
|
|
|
|
|
|
|
|
|
|
|
|
Interest income |
|
|
(170) |
|
|
(76) |
|
|
(1,213) |
|
|
(130) |
|
Interest expense |
|
|
11,839 |
|
|
8,624 |
|
|
33,246 |
|
|
21,064 |
|
Write-off of unamortized deferred financing fees |
|
|
— |
|
|
— |
|
|
— |
|
|
3,883 |
|
Other |
|
|
(603) |
|
|
(32) |
|
|
(2,462) |
|
|
(247) |
|
Total other expense |
|
|
11,066 |
|
|
8,516 |
|
|
29,571 |
|
|
24,570 |
|
|
|
|
|
|
|
|
|
|
|
|
|
|
|
Income (loss) before provision (benefit) for income taxes |
|
|
2,851 |
|
|
(2,812) |
|
|
611 |
|
|
(15,250) |
|
Provision (benefit) for income taxes |
|
|
670 |
|
|
(2,862) |
|
|
(14,258) |
|
|
(3,448) |
|
Net income (loss) |
|
|
2,181 |
|
|
50 |
|
|
14,869 |
|
|
(11,802) |
|
|
|
|
|
|
|
|
|
|
|
|
|
|
|
Other comprehensive income (loss): |
|
|
|
|
|
|
|
|
|
|
|
|
|
Unrealized income on interest rate swaps |
|
|
— |
|
|
— |
|
|
— |
|
|
52 |
|
Foreign currency translation adjustments, net of tax expense (benefit) of $105, $283, $(146) and $556, respectively |
|
|
409 |
|
|
526 |
|
|
(534) |
|
|
1,032 |
|
Comprehensive income (loss) |
|
|
2,590 |
|
|
576 |
|
|
14,335 |
|
|
(10,718) |
|
|
|
|
|
|
|
|
|
|
|
|
|
|
|
Net income (loss) |
|
|
2,181 |
|
|
50 |
|
|
14,869 |
|
|
(11,802) |
|
Less dividends to Series A convertible preferred stockholders |
|
|
(1,239) |
|
|
(1,225) |
|
|
(3,717) |
|
|
(2,919) |
|
Less dividends to Series B convertible preferred stockholders |
|
|
— |
|
|
— |
|
|
— |
|
|
(806) |
|
Net income (loss) attributable to common stockholders |
|
$ |
942 |
|
$ |
(1,175) |
|
$ |
11,152 |
|
$ |
(15,527) |
|
|
|
|
|
|
|
|
|
|
|
|
|
|
|
Net income (loss) per common share: |
|
|
|
|
|
|
|
|
|
|
|
|
|
Basic and Diluted |
|
$ |
0.01 |
|
$ |
(0.03) |
|
$ |
0.18 |
|
$ |
(0.45) |
|
Weighted-average common shares outstanding: |
|
|
|
|
|
|
|
|
|
|
|
|
|
Basic and Diluted |
|
|
65,289,320 |
|
|
39,359,523 |
|
|
60,413,694 |
|
|
34,790,861 |
|
|
|
|
|
|
|
|
|
|
|
|
|
|
|
Dividends declared per Series A convertible preferred share |
|
$ |
1.91 |
|
$ |
1.91 |
|
$ |
5.72 |
|
$ |
2.59 |
|
Dividends declared per Series B convertible preferred share |
|
$ |
— |
|
$ |
— |
|
$ |
— |
|
$ |
12.50 |
The accompanying notes are an integral part of the consolidated financial statements.
2
DASEKE, INC. AND SUBSIDIARIES
CONSOLIDATED STATEMENT OF CHANGES IN STOCKHOLDERS’ EQUITY
Nine Months Ended September 30, 2018
(Unaudited)
(In thousands, except share data)
|
|
|
Series A Convertible |
|
|
|
|
|
|
|
|
|
Retained |
|
Accumulated |
|
|
|
|||||
|
|
|
Preferred Stock |
|
Common Stock |
|
|
|
|
Earnings |
|
Other |
|
|
|
||||||||
|
|
|
|
|
|
|
|
|
Par |
|
Additional |
|
(Accumulated |
|
Comprehensive |
|
|
|
|||||
|
|
|
Shares |
|
Amount |
|
Shares |
|
Value |
|
Paid- In Capital |
|
Deficit) |
|
Income (Loss) |
|
Total |
||||||
|
Balance at January 1, 2018 |
|
650,000 |
|
$ |
65,000 |
|
48,712,288 |
|
$ |
5 |
|
$ |
277,931 |
|
$ |
7,338 |
|
$ |
959 |
|
$ |
351,233 |
|
Exercise of stock options |
|
— |
|
|
— |
|
5,000 |
|
|
— |
|
|
50 |
|
|
— |
|
|
— |
|
|
50 |
|
Series A convertible preferred stock dividend |
|
— |
|
|
— |
|
— |
|
|
— |
|
|
— |
|
|
(1,239) |
|
|
— |
|
|
(1,239) |
|
Stock-based compensation expense |
|
— |
|
|
— |
|
— |
|
|
— |
|
|
886 |
|
|
— |
|
|
— |
|
|
886 |
|
Issuance of common stock |
|
— |
|
|
— |
|
8,545,000 |
|
|
1 |
|
|
84,568 |
|
|
— |
|
|
— |
|
|
84,569 |
|
Foreign currency translation adjustments |
|
— |
|
|
— |
|
— |
|
|
— |
|
|
— |
|
|
— |
|
|
(320) |
|
|
(320) |
|
Net loss |
|
— |
|
|
— |
|
— |
|
|
— |
|
|
— |
|
|
(797) |
|
|
— |
|
|
(797) |
|
Balance at March 31, 2018 |
|
650,000 |
|
$ |
65,000 |
|
57,262,288 |
|
$ |
6 |
|
$ |
363,435 |
|
$ |
5,302 |
|
$ |
639 |
|
$ |
434,382 |
|
Series A convertible preferred stock dividend |
|
— |
|
|
— |
|
— |
|
|
— |
|
|
— |
|
|
(1,239) |
|
|
— |
|
|
(1,239) |
|
Stock-based compensation expense |
|
— |
|
|
— |
|
— |
|
|
— |
|
|
902 |
|
|
— |
|
|
— |
|
|
902 |
|
Issuance of common stock |
|
— |
|
|
— |
|
1,612,979 |
|
|
— |
|
|
15,355 |
|
|
— |
|
|
— |
|
|
15,355 |
|
Issuance of earnout shares |
|
— |
|
|
— |
|
5,000,000 |
|
|
— |
|
|
48,200 |
|
|
(48,200) |
|
|
— |
|
|
— |
|
Foreign currency translation adjustments |
|
— |
|
|
— |
|
— |
|
|
— |
|
|
— |
|
|
— |
|
|
(623) |
|
|
(623) |
|
Net income |
|
— |
|
|
— |
|
— |
|
|
— |
|
|
— |
|
|
13,485 |
|
|
— |
|
|
13,485 |
|
Balance at June 30, 2018 |
|
650,000 |
|
$ |
65,000 |
|
63,875,267 |
|
$ |
6 |
|
$ |
427,892 |
|
$ |
(30,652) |
|
$ |
16 |
|
$ |
462,262 |
|
Exercise of warrants |
|
— |
|
|
— |
|
2 |
|
|
— |
|
|
— |
|
|
— |
|
|
— |
|
|
— |
|
Vesting of restricted stock units |
|
— |
|
|
— |
|
74,713 |
|
|
— |
|
|
(376) |
|
|
— |
|
|
— |
|
|
(376) |
|
Series A convertible preferred stock dividend |
|
— |
|
|
— |
|
— |
|
|
— |
|
|
— |
|
|
(1,239) |
|
|
— |
|
|
(1,239) |
|
Stock-based compensation expense |
|
— |
|
|
— |
|
— |
|
|
— |
|
|
928 |
|
|
— |
|
|
— |
|
|
928 |
|
Issuance of common stock |
|
— |
|
|
— |
|
495,389 |
|
|
— |
|
|
4,351 |
|
|
— |
|
|
— |
|
|
4,351 |
|
Foreign currency translation adjustments |
|
— |
|
|
— |
|
— |
|
|
— |
|
|
— |
|
|
— |
|
|
409 |
|
|
409 |
|
Net income |
|
— |
|
|
— |
|
— |
|
|
— |
|
|
— |
|
|
2,181 |
|
|
— |
|
|
2,181 |
|
Balance at September 30, 2018 |
|
650,000 |
|
$ |
65,000 |
|
64,445,371 |
|
$ |
6 |
|
$ |
432,795 |
|
$ |
(29,710) |
|
$ |
425 |
|
$ |
468,516 |
The accompanying notes are an integral part of the consolidated financial statements.
3
DASEKE, INC. AND SUBSIDIARIES
CONSOLIDATED STATEMENT OF CHANGES IN STOCKHOLDERS’ EQUITY
Nine Months Ended September 30, 2017
(Unaudited)
(In thousands, except share data)
|
|
|
Series A Convertible |
|
Series B Convertible |
|
|
|
|
|
|
|
|
|
Retained |
|
Accumulated |
|
|
|
||||||||
|
|
|
Preferred Stock |
|
Preferred Stock |
|
Common Stock |
|
|
|
|
Earnings |
|
Other |
|
|
|
|||||||||||
|
|
|
|
|
|
|
|
|
|
|
|
|
Par |
|
Additional |
|
(Accumulated |
|
Comprehensive |
|
|
|
||||||
|
|
|
Shares |
|
Amount |
|
Shares |
|
Amount |
|
Shares |
|
Value |
|
Paid- In Capital |
|
Deficit) |
|
Income (Loss) |
|
Total |
|||||||
|
Balance at January 1, 2017 |
|
— |
|
$ |
— |
|
64,500 |
|
$ |
1 |
|
20,980,961 |
|
$ |
2 |
|
$ |
117,807 |
|
$ |
(14,694) |
|
$ |
(52) |
|
$ |
103,064 |
|
Income on interest rate swaps |
|
— |
|
|
— |
|
— |
|
|
— |
|
— |
|
|
— |
|
|
— |
|
|
— |
|
|
52 |
|
|
52 |
|
Series B convertible preferred stock dividend |
|
— |
|
|
— |
|
— |
|
|
— |
|
— |
|
|
— |
|
|
— |
|
|
(806) |
|
|
— |
|
|
(806) |
|
Repurchase of common stock |
|
— |
|
|
— |
|
— |
|
|
— |
|
(3,616,781) |
|
|
(1) |
|
|
(36,167) |
|
|
— |
|
|
— |
|
|
(36,168) |
|
Conversion of Series B convertible preferred stock to common stock |
|
— |
|
|
— |
|
(64,500) |
|
|
(1) |
|
9,301,150 |
|
|
1 |
|
|
— |
|
|
— |
|
|
— |
|
|
— |
|
Issuance of Series A convertible preferred stock |
|
650,000 |
|
|
65,000 |
|
— |
|
|
— |
|
— |
|
|
— |
|
|
— |
|
|
— |
|
|
— |
|
|
65,000 |
|
Shares assumed by legal acquirer |
|
— |
|
|
— |
|
— |
|
|
— |
|
11,050,630 |
|
|
1 |
|
|
83,639 |
|
|
— |
|
|
— |
|
|
83,640 |
|
Settlement of legal acquirer transaction costs |
|
— |
|
|
— |
|
— |
|
|
— |
|
— |
|
|
— |
|
|
(19,063) |
|
|
— |
|
|
— |
|
|
(19,063) |
|
Net loss |
|
— |
|
|
— |
|
— |
|
|
— |
|
— |
|
|
— |
|
|
— |
|
|
(7,746) |
|
|
— |
|
|
(7,746) |
|
Balance at March 31, 2017 |
|
650,000 |
|
$ |
65,000 |
|
— |
|
$ |
— |
|
37,715,960 |
|
$ |
3 |
|
$ |
146,216 |
|
$ |
(23,246) |
|
$ |
— |
|
$ |
187,973 |
|
Issuance of common stock |
|
— |
|
|
— |
|
— |
|
|
— |
|
342,133 |
|
|
— |
|
|
3,437 |
|
|
— |
|
|
— |
|
|
3,437 |
|
Series A convertible preferred stock dividend |
|
— |
|
|
— |
|
— |
|
|
— |
|
— |
|
|
— |
|
|
— |
|
|
(1,694) |
|
|
— |
|
|
(1,694) |
|
Stock-based compensation expense |
|
— |
|
|
— |
|
— |
|
|
— |
|
— |
|
|
— |
|
|
538 |
|
|
— |
|
|
— |
|
|
538 |
|
Foreign currency translation adjustments |
|
— |
|
|
— |
|
— |
|
|
— |
|
— |
|
|
— |
|
|
— |
|
|
— |
|
|
506 |
|
|
506 |
|
Net loss |
|
— |
|
|
— |
|
— |
|
|
— |
|
— |
|
|
— |
|
|
— |
|
|
(4,106) |
|
|
— |
|
|
(4,106) |
|
Balance at June 30, 2017 |
|
650,000 |
|
$ |
65,000 |
|
— |
|
$ |
— |
|
38,058,093 |
|
$ |
3 |
|
$ |
150,191 |
|
$ |
(29,046) |
|
$ |
506 |
|
$ |
186,654 |
|
Issuance of common stock |
|
— |
|
|
— |
|
— |
|
|
— |
|
6,422,139 |
|
|
1 |
|
|
71,248 |
|
|
— |
|
|
— |
|
|
71,249 |
|
Series A convertible preferred stock dividend |
|
— |
|
|
— |
|
— |
|
|
— |
|
— |
|
|
— |
|
|
— |
|
|
(1,225) |
|
|
— |
|
|
(1,225) |
|
Stock-based compensation expense |
|
— |
|
|
— |
|
— |
|
|
— |
|
— |
|
|
— |
|
|
663 |
|
|
— |
|
|
— |
|
|
663 |
|
Foreign currency translation adjustments |
|
— |
|
|
— |
|
— |
|
|
— |
|
— |
|
|
— |
|
|
— |
|
|
— |
|
|
526 |
|
|
526 |
|
Net loss |
|
— |
|
|
— |
|
— |
|
|
— |
|
— |
|
|
— |
|
|
— |
|
|
50 |
|
|
— |
|
|
50 |
|
Balance at September 30, 2017 |
|
650,000 |
|
$ |
65,000 |
|
— |
|
$ |
— |
|
44,480,232 |
|
$ |
4 |
|
$ |
222,102 |
|
$ |
(30,221) |
|
$ |
1,032 |
|
$ |
257,917 |
The accompanying notes are an integral part of the consolidated financial statements.
4
DASEKE, INC. AND SUBSIDIARIES
CONSOLIDATED STATEMENTS OF CASH FLOWS
(Unaudited)
(in thousands)
|
|
|
Nine months ended |
||||
|
|
|
September 30, |
||||
|
|
|
2018 |
|
2017 |
||
|
Cash flows from operating activities |
|
|
|
|
|
|
|
Net income (loss) |
|
$ |
14,869 |
|
$ |
(11,802) |
|
Adjustments to reconcile net income (loss) to net cash provided by operating activities |
|
|
|
|
|
|
|
Depreciation |
|
|
81,572 |
|
|
49,109 |
|
Amortization of intangible assets |
|
|
12,176 |
|
|
4,649 |
|
Amortization of deferred financing fees |
|
|
2,222 |
|
|
1,330 |
|
Write-off of deferred financing fees |
|
|
— |
|
|
3,883 |
|
Stock-based compensation expense |
|
|
2,716 |
|
|
1,201 |
|
Deferred taxes |
|
|
(16,103) |
|
|
(4,849) |
|
Bad debt expense |
|
|
633 |
|
|
347 |
|
Non-cash interest expense |
|
|
— |
|
|
92 |
|
Gain on disposition of revenue property and equipment |
|
|
(1,545) |
|
|
(513) |
|
Gain on disposition of building |
|
|
(817) |
|
|
— |
|
Deferred gain recognized on sales-type leases |
|
|
(1,974) |
|
|
(793) |
|
Impairment |
|
|
2,840 |
|
|
— |
|
Changes in operating assets and liabilities |
|
|
|
|
|
|
|
Accounts receivable |
|
|
(57,526) |
|
|
(28,567) |
|
Drivers’ advances and other receivables |
|
|
(609) |
|
|
547 |
|
Payments received on sales-type leases |
|
|
10,522 |
|
|
3,774 |
|
Prepaid and other current assets |
|
|
(9,549) |
|
|
(339) |
|
Accounts payable |
|
|
(5,646) |
|
|
3,224 |
|
Accrued expenses and other liabilities |
|
|
12,979 |
|
|
5,478 |
|
Net cash provided by operating activities |
|
|
46,760 |
|
|
26,771 |
|
|
|
|
|
|
|
|
|
Cash flows from investing activities |
|
|
|
|
|
|
|
Purchase of property and equipment |
|
|
(58,844) |
|
|
(15,565) |
|
Proceeds from sale of property and equipment |
|
|
15,569 |
|
|
5,252 |
|
Cash paid in acquisitions, net of cash acquired |
|
|
(131,809) |
|
|
(91,133) |
|
Net cash used in investing activities |
|
|
(175,084) |
|
|
(101,446) |
|
|
|
|
|
|
|
|
|
Cash flows from financing activities: |
|
|
|
|
|
|
|
Advances on line of credit |
|
|
774,976 |
|
|
543,404 |
|
Repayments on line of credit |
|
|
(763,873) |
|
|
(550,261) |
|
Advances on long-term debt |
|
|
6,104 |
|
|
— |
|
Principal payments on and payoff of long-term debt |
|
|
(40,985) |
|
|
(231,817) |
|
Proceeds from Term Loan Facility |
|
|
— |
|
|
350,000 |
|
Deferred financing fees |
|
|
(998) |
|
|
(14,411) |
|
Pay off of subordinated debt |
|
|
— |
|
|
(66,715) |
|
Proceeds from issuance of common stock |
|
|
84,193 |
|
|
128,184 |
|
Repurchase of common stock |
|
|
— |
|
|
(36,168) |
|
Issuance of Series A convertible preferred stock |
|
|
— |
|
|
65,000 |
|
Exercise of options |
|
|
50 |
|
|
— |
|
Series A convertible preferred stock dividends |
|
|
(3,717) |
|
|
(1,680) |
|
Series B convertible preferred stock dividends |
|
|
— |
|
|
(2,016) |
|
Net cash provided by financing activities |
|
|
55,750 |
|
|
183,520 |
|
|
|
|
|
|
|
|
|
Effect of exchange rates on cash and cash equivalents |
|
|
(28) |
|
|
(30) |
|
|
|
|
|
|
|
|
|
Net (decrease) increase in cash and cash equivalents |
|
|
(72,602) |
|
|
108,815 |
|
Cash and cash equivalents – beginning of period |
|
|
90,679 |
|
|
3,695 |
|
Cash and cash equivalents – end of period |
|
$ |
18,077 |
|
$ |
112,510 |
The accompanying notes are an integral part of the consolidated financial statements.
5
DASEKE, INC. AND SUBSIDIARIES
CONSOLIDATED STATEMENTS OF CASH FLOWS – (Continued)
(Unaudited)
(in thousands)
|
|
|
Nine months ended |
||||
|
|
|
September 30, |
||||
|
|
|
2018 |
|
2017 |
||
|
Supplemental disclosure of cash flow information |
|
|
|
|
|
|
|
Cash paid for interest |
|
$ |
30,963 |
|
$ |
20,916 |
|
Cash paid for income taxes |
|
$ |
1,805 |
|
$ |
629 |
|
|
|
|
|
|
|
|
|
Noncash investing and financing activities |
|
|
|
|
|
|
|
Property and equipment acquired with debt or capital lease obligations |
|
$ |
36,100 |
|
$ |
13,609 |
|
Accrued capital expenditures |
|
$ |
5,921 |
|
$ |
— |
|
Property and equipment sold for notes receivable |
|
$ |
431 |
|
$ |
412 |
|
Property and equipment transferred to sales-type lease |
|
$ |
8,377 |
|
$ |
7,042 |
|
Sales-type lease returns to property and equipment |
|
$ |
465 |
|
$ |
724 |
|
Sales-type lease assets acquired with debt or capital lease obligations |
|
$ |
9,873 |
|
$ |
— |
|
Sales-type lease assets sold for notes receivable |
|
$ |
46,228 |
|
$ |
21,488 |
|
Sales-type lease returns to sales-type lease assets |
|
$ |
24,044 |
|
$ |
13,795 |
|
Common stock issued in acquisitions |
|
$ |
19,706 |
|
$ |
11,079 |
|
Issuance of earnout shares |
|
$ |
48,200 |
|
$ |
— |
|
Accrued Series A convertible preferred dividends |
|
$ |
— |
|
$ |
1,239 |
The accompanying notes are an integral part of the consolidated financial statements.
6
DASEKE, INC. AND SUBSIDIARIES
NOTES TO CONSOLIDATED FINANCIAL STATEMENTS
(Unaudited)
NOTE 1 – NATURE OF OPERATIONS AND SUMMARY OF SIGNIFICANT ACCOUNTING POLICIES
Nature of Operations
The registrant was originally formed in April 2015 as a special purpose acquisition company (SPAC) under the name Hennessy Capital Acquisition Corp. II (Hennessy). As a SPAC, Hennessy had no operations and its purpose was to go public with the intention of merging with or acquiring an operating company with the proceeds of the SPAC’s initial public offering (the IPO).
On February 27, 2017, Hennessy consummated the Business Combination (as defined and described in Note 3) with Daseke, Inc. Upon consummation of the Business Combination, Daseke, Inc. changed its name to Daseke Companies, Inc. and Hennessy changed its name to Daseke, Inc.
Daseke, Inc. was formed in December 2008 and began operations on January 1, 2009. Daseke is engaged in full service open-deck trucking that specializes primarily in flatbed truckload and heavy haul transportation of specialized items throughout the United States, Canada and Mexico. The Company also provides logistical planning and warehousing services to customers. The Company is subject to regulation by the Department of Transportation, the Department of Defense, the Department of Energy and various state regulatory authorities.
Unless expressly stated otherwise, references to the Company or Daseke refers to Daseke, Inc. and its wholly owned subsidiaries, Hennessy refers to the registrant prior to the closing of the Business Combination, and Private Daseke refers to Daseke, Inc. and its subsidiaries prior to the closing of the Business Combination.
Basis of Presentation
These interim consolidated financial statements have been prepared in accordance with accounting principles generally accepted in the United States (GAAP) for interim financial information and with the instructions for Form 10-Q and Article 10 of Regulation S-X. Accordingly, they do not include all of the information and footnotes required by GAAP for complete financial statements. In the opinion of management, all adjustments (consisting of normal recurring accruals) considered necessary for a fair presentation have been included. Operating results for the three and nine months ended September 30, 2018 are not necessarily indicative of the results that may be expected for the year ended December 31, 2018.
The consolidated balance sheet as of December 31, 2017 has been derived from the audited consolidated financial statements at that date. For additional information, including the Company’s significant accounting policies, refer to the consolidated financial statements and related footnotes for the year ended December 31, 2017 as set forth in the Company’s Current Report on Form 10-K, filed with the SEC on March 16, 2018.
Principles of Consolidation
The consolidated financial statements include the accounts of Daseke, Inc. and its wholly-owned subsidiaries. All significant intercompany balances and transactions have been eliminated in consolidation.
Use of Estimates
The preparation of the consolidated financial statements in accordance with GAAP requires management to make estimates and assumptions that affect the reported amounts of assets and liabilities and disclosure of contingent assets and liabilities at the date of the consolidated financial statements and the reported amounts of revenues and expenses during the reporting period. Actual results could differ from those estimates.
7
DASEKE, INC. AND SUBSIDIARIES
NOTES TO CONSOLIDATED FINANCIAL STATEMENTS
(Unaudited)
Deferred Financing Fees
In conjunction with obtaining long-term debt, the Company incurred financing costs which are being amortized using the straight-line method, which approximates the effective interest rate method, over the terms of the obligations. As of September 30, 2018 and December 31, 2017, the balance of deferred finance charges was $16.4 million and $17.7 million, respectively, which is included as a reduction of long-term debt, net of current portion in the consolidated balance sheets. Amortization expense was $0.7 million and $0.5 million for the three months ended September 30, 2018 and 2017, respectively, and $2.2 million and $1.3 million for the nine months ended September 30, 2018 and 2017, respectively, which is included in interest expense. In February 2017, in conjunction with new term loan financing, as amended, discussed in Note 10, the Company incurred deferred financing costs of $14.2 million and an additional $4.8 million in November 2017 related to the tack-on loan. Unamortized deferred financing fees totaling $3.9 million were expensed as a result of the new term loan financing.
Fair Value Measurements
The Company follows the accounting guidance for fair value measurements of financial assets and financial liabilities and for fair value measurements of nonfinancial items that are recognized or disclosed at fair value in the financial statements on a recurring basis. Fair value guidance defines fair value as the price that would be received to sell an asset or paid to transfer a liability in an orderly transaction between market participants at the measurement date. It also establishes a framework for measuring fair value and expands disclosures about fair value measurements. The three levels of the fair value framework are as follows:
Level 1 - Quoted market prices in active markets for identical assets or liabilities.
Level 2 - Observable market-based inputs or unobservable inputs that are corroborated by market data.
Level 3 - Unobservable inputs reflecting the reporting entity’s own assumptions or external inputs from inactive markets.
A financial asset or liability’s classification within the framework is determined based on the lowest level of input that is significant to the fair value measurement.
Interest Rate Swaps
The fair value of the Company’s interest rate swaps is determined using cash flow computer models with unobservable inputs, therefore the liability for interest rate swaps is classified within Level 3 of the fair value framework. In conjunction with the Business Combination discussed in Note 3, the Company’s lone interest rate swap was terminated. The table below is a summary of the changes in the fair value of this liability for the three and nine months ended September 30, 2017 (in thousands):
|
|
|
2017 |
|
|
Balance at January 1, 2017 |
|
$ |
(52) |
|
Change in fair value |
|
|
52 |
|
|
|
|
|
|
Balance at June 30, 2017 |
|
|
— |
|
Change in fair value |
|
|
— |
|
Balance at September 30, 2017 |
|
$ |
— |
8
DASEKE, INC. AND SUBSIDIARIES
NOTES TO CONSOLIDATED FINANCIAL STATEMENTS
(Unaudited)
Contingent Consideration
The contingent consideration liabilities represent future payment obligations that relate to certain EBITDA thresholds related to the Company’s acquisitions over a defined period of time. See Note 4 for additional details on the future payment obligations connected to the Company’s acquisitions. The fair value of the Company’s contingent consideration liabilities are determined using estimates based on discount rates that reflect the risk involved and the projected EBITDA of the acquired businesses, therefore the liabilities are classified within Level 3 of the fair value framework. The table below is a summary of the changes in the fair value of this liability for the three and nine months ended September 30, 2018 and 2017 (in thousands):
|
|
|
2017 |
|
|
Balance at January 1, 2017 |
|
$ |
— |
|
Change in fair value |
|
|
— |
|
Balance at June 30, 2017 |
|
$ |
— |
|
2017 Acquisitions |
|
|
1,140 |
|
Balance at September 30, 2017 |
|
$ |
1,140 |
|
|
|
|
|
|
|
|
2018 |
|
|
Balance at January 1, 2018 |
|
$ |
800 |
|
2018 Acquisitions |
|
|
20,300 |
|
Change in fair value |
|
|
(700) |
|
Balance at June 30, 2018 |
|
$ |
20,400 |
|
Change in fair value |
|
|
— |
|
Balance at September 30, 2018 |
|
$ |
20,400 |
Stock-Based Compensation
Awards of equity instruments issued to employees and directors are accounted for under the fair value method of accounting and recognized in the consolidated statements of operations and comprehensive loss. Compensation cost is measured for all stock-based awards at fair value on the date of grant and recognized using the straight-line method over the service period over which the awards are expected to vest.
Fair value of all time-vested options as of the date of grant is estimated using the Black-Scholes option valuation model, which was developed for use in estimating the fair value of traded options that have no vesting restrictions and are fully transferable. Option valuation models require the input of highly subjective assumptions, including the expected stock price volatility. Since the Company does not have a sufficient history of exercise behavior, expected term is calculated using the assumption that the options will be exercised ratably from the date of vesting to the end of the contractual term for each vesting tranche of awards. The risk-free interest rate is based on the U.S. Treasury yield curve for the period of the expected term of the stock option. Expected volatility is calculated using an index of publicly traded peer companies.
Fair values of non-vested stock awards (restricted stock units) are equal to the market value of the common stock on the date of the award with compensation costs amortized over the vesting period of the award.
Segment Reporting
The Company determines its operating segments based on the information utilized by the chief operating decision maker to allocate resources and assess performance. Based on this information, the Company has determined it had 16 operating segments as of September 30, 2018 and 12 operating segments as of September 30, 2017 that are aggregated into two reportable segments: Flatbed Solutions, which delivers its services using primarily flatbed transportation equipment to meet the needs of high-volume, time-sensitive shippers, and Specialized Solutions, which delivers transportation and logistics solutions for super heavy haul, high-value customized and over-dimensional loads, many of which require engineering and customized equipment.
9
DASEKE, INC. AND SUBSIDIARIES
NOTES TO CONSOLIDATED FINANCIAL STATEMENTS
(Unaudited)
Earnings (Loss) Per Share
Basic earnings (loss) per common share is calculated by dividing net income (loss) attributable to common stockholders by the weighted average number of shares of common stock outstanding during the period. Diluted earnings (loss) per share reflect the potential dilution of earnings per share that could occur if securities or other contracts to issue common stock were exercised or converted into common stock or resulted in the issuance of common stock that then shared in the Company’s earnings (loss).
For the three and nine months ended September 30, 2018 and 2017, shares of the Company’s 7.625% Series A Convertible Cumulative Preferred Stock (Series A Preferred Stock) and outstanding stock options were not included in the computation of diluted earnings (loss) per share as their effects were anti-dilutive. Additionally, for the three and nine months ended September 30, 2018 and 2017, there was no dilutive effect from the Merger Agreement earn-out provision (see Note 3) or the outstanding warrants to purchase shares of the Company’s common stock (the common stock purchase warrants). For the three and nine months ended September 30, 2017, shares of Private Daseke’s Series B Convertible Preferred Stock (Series B Preferred Stock) were not included in the computation of diluted loss per share as their effects were anti-dilutive. See Note 17 for the effects of non-vested restricted stock units on basic and diluted earnings per share under the two-class method.
Common Stock Purchase Warrants
The Company accounts for the issuance of common stock purchase warrants in connection with equity offerings in accordance with the provisions of the Accounting Standards Codification (ASC) 815, Derivatives and Hedging (Topic 815). The Company classifies as equity any contract that (i) requires physical settlement or net-share settlement or (ii) gives the Company a choice of net-cash settlement or settlement in its own shares (physical settlement or net-share settlement). The Company classifies as assets or liabilities any contract that (i) requires net-cash settlement (including a requirement to net-cash settle the contract if an event occurs and if that event is outside the control of the Company) or (ii) gives the counterparty a choice of net-cash settlement or settlement in shares (physical settlement or net-share settlement). See Note 12 for additional details on the common stock purchase warrants.
The Company assessed the classification of its common stock purchase warrants and determined that such instruments meet the criteria for equity classification at the time of issuance.
Foreign Currency Gains and Losses
The functional currency for all operations except Canada is the United States dollar. The local currency is the functional currency for the Company’s operations in Canada. For these operations, assets and liabilities are translated at the rates of exchange on the consolidated balance sheet date, while income and expense items are translated at average rates of exchange during the period. The resulting gains or losses arising from the translation of accounts from the functional currency into U.S. dollars are included as a separate component of stockholders’ equity in accumulated other comprehensive income until a partial or complete liquidation of the Company’s net investment in the foreign operation.
From time to time, the Company’s foreign operations may enter into transactions that are denominated in a currency other than their functional currency. These transactions are initially recorded in the functional currency of the operating company based on the applicable exchange rate in effect on the date of the transaction. Monthly, these transactions are remeasured to an equivalent amount of the functional currency based on the applicable exchange rate in effect on the remeasurement date. Any adjustment required to remeasure a transaction to the equivalent amount of functional currency is recorded in the consolidated statements of operations of the foreign operating company as a component of foreign exchange gain or loss.
Assets Held for Sale
Assets held for sale is comprised of revenue equipment in the Company’s lease purchase program and is recorded as a component of prepaid and other current assets on the consolidated balance sheets. Assets held for sale at September 30, 2018 and December 31, 2017, totaled $10.4 million and $9.9 million, respectively. Assets held for sale totaled $7.2 million and $7.0 million for the Flatbed Solutions segment as of September 30, 2018 and December 31, 2017, respectively. Assets held for sale totaled $3.2 million and $2.9 million for the Specialized Solutions segment as of September 30, 2018 and December 31, 2017, respectively.
10
DASEKE, INC. AND SUBSIDIARIES
NOTES TO CONSOLIDATED FINANCIAL STATEMENTS
(Unaudited)
Assets held for sale are not subject to depreciation, and are recorded at the lower of depreciated carrying value or fair market value less selling costs. The Company expects to sell these assets in its lease purchase program within twelve months of being classified as assets held for sale. Any gains from the sale of these assets are recognized as a deferred gain in the consolidated balance sheets in current portion of net investment in sales-type leases and other long-term assets.
New Accounting Pronouncements
In August 2018, the Financial Accounting Standards Board (FASB) issued Accounting Standards Updated (ASU) 2018-15, Intangibles – Goodwill and Other – Internal-Use Software (Subtopic 350-40). ASU 2018-15 aligns the requirements for capitalizing implementation costs incurred in a hosting arrangement (Cloud-based) that is a service contract with the requirements for capitalizing implementation costs incurred to develop or obtain internal-use software. ASU 2018-15 will become effective for annual periods beginning after December 15, 2019 and interim periods within those periods, with early adoption permitted. ASU 2018-15 can be applied either retrospectively or prospectively to all implementation costs incurred after the date of adoption. The Company has elected to early adopt ASU 2018-15 on a prospective basis and has capitalized relevant software implementation costs in the three months ended September 30, 2018.
In March 2018, the FASB issued ASU 2018-05, Income Taxes (Topic 740). ASU 2018-05 provides amendments to SEC paragraphs pursuant to SEC Staff Accounting Bulletin (SAB) No. 118 related to the Tax Cuts and Jobs Act (TCJA) that became effective January 2018. The Company adopted the disclosure requirements of SAB 118 as of December 31, 2017, which were included in the Company’s Annual Report on Form 10-K filed March 16, 2018 and as described in SAB 118 carried forward through September 30, 2018.
In July 2017, the FASB issued ASU 2017-11, Earnings per Share (Topic 260), Distinguishing Liabilities from Equity (Topic 480) and Topic 815. ASU 2017-11 provides guidance on accounting for financial instruments with down round features and clarifies the deferral of certain provisions in Topic 480. ASU 2017-11 will become effective for annual periods beginning after December 15, 2018 and interim periods within those periods. The Company is currently evaluating the impact of adopting this guidance.
In May 2017, the FASB issued ASU 2017-09, Compensation – Stock Compensation (Topic 718). ASU 2017-09 provides guidance about which changes to the terms or conditions of a share-based payment award requires the application of modification accounting. Modification accounting will apply unless the fair value of the modified award is the same as the original award, the vesting conditions of the modified award are the same as the original award and the classification of the modified award as an equity instrument or liability instrument is the same as the original award. ASU 2017-09 became effective for annual periods beginning after December 15, 2017 and interim periods within those periods. The Company adopted this pronouncement on January 1, 2018 which did not have a material impact on its consolidated results of operations, financial condition, cash flows, or financial statement disclosures as there were no changes to the terms or conditions of the Company’s share-based payment awards during the nine months ended September 30, 2018.
In August 2016, the FASB issued ASU 2016-15, Statement of Cash Flows (Topic 230). ASU 2016-15 provides new guidance intended to reduce diversity in practice in how certain cash receipts and payments are classified in the statement of cash flows, including debt prepayment or extinguishment costs, the settlement of contingent liabilities arising from a business combination, proceeds from insurance settlements, and distributions from certain equity method investees. ASU 2016-15 became effective for fiscal years beginning after December 15, 2017 and interim periods within fiscal years. The Company adopted this pronouncement on January 1, 2018 which did not impact its consolidated statement of cash flows.
In June 2016, the FASB issued ASU No. 2016-13, Accounting for Credit Losses (Topic 326). ASU 2016-13 requires the use of an “expected loss” model on certain types of financial instruments. ASU 2016-13 is effective for fiscal years, and interim periods within those years, beginning after December 15, 2019, with early adoption permitted. The Company is currently evaluating the impact of adopting this guidance.
In February 2016, the FASB issued ASU 2016-02, Leases (Topic 842). ASU 2016-02 amends various aspects of existing guidance for leases. ASU 2016-02 requires an entity to recognize assets and liabilities arising from a lease for both financing and operating leases, along with additional qualitative and quantitative disclosures. The main difference between previous GAAP and the amended standard is the recognition of lease assets and lease liabilities of lessees on the balance sheet for those leases classified as operating leases under previous GAAP. ASU 2016-02 is effective for fiscal years beginning after December 15, 2018, with early adoption permitted. Entities are required to adopt the ASU using a modified retrospective approach, subject to certain optional practical expedients, and apply the provisions of ASU 2016-02 to leasing arrangements existing at or entered into after the earliest comparative period presented in the financial statements. In July 2018, the FASB issued an ASU 2018-10 and ASU 2018-11 to further clarify narrow aspects of the guidance issued in ASU 2016-02 specifically
11
DASEKE, INC. AND SUBSIDIARIES
NOTES TO CONSOLIDATED FINANCIAL STATEMENTS
(Unaudited)
regarding transition adoption and separating components of a contract. The Company is currently evaluating the provisions of ASU 2016-02 and assessing its impact on the Company’s financial statements. As part of the Company’s assessment to-date, the Company has formed an implementation team, selected lease accounting specific software, identified the Company’s population of operating leases to extract relevant lease terms, elected guidance practical expedients and drafted preliminary policy documents. The Company expects the adoption of ASU 2016-02 will materially gross up its consolidated balance sheet with the recognition of right-of-use assets and operating lease liabilities. The impact to the Company’s consolidated statements of operations and cash flows are not expected to be material. The new standard will also require additional disclosures for financing and operating leases.
NOTE 2 – REVENUE RECOGNITION
Adoption of New Accounting Standard
The Company has evaluated its current accounting practices to the requirements of ASU No. 2014-09, Revenue from Contracts with Customers (Topic 606) and related amendments. This evaluation included an assessment of representative contracts from each of the Company’s revenue streams. The Company was recognizing revenue upon completion of transportation or other services. By nature, the Company’s services are short in duration, typically representing less than one week to completion, therefore the Company has determined that the difference between recognizing revenue upon completion and over time is minimal to its business.
In addition to freight revenue, the Company also recognizes logistics revenue as a separate revenue stream. Logistics revenue is generated from a range of services, including value-added warehousing, loading and unloading, vehicle maintenance and repair, preparation and packaging, fuel management, and other fleet management solutions. The Company recognizes logistics revenue over time as services are completed.
The adoption of this standard did not have a material impact on the Company’s financial position, results of operations or cash flows; however, there have been additions and modifications to its existing financial disclosures. While the overall revenue, systems and controls were minimally impacted by the new standard, the underlying recognition methodology has changed. Under the new standard, the Company now recognizes revenue over time as its customers are simultaneously receiving and consuming the benefits of its services, primarily based upon the output method of miles driven. The primary difference for the Company’s business, although currently immaterial, is the recognition of revenue for in-transit services at the end of each reporting period.
The Company adopted this guidance as of January 1, 2018, utilizing the modified retrospective method and the practical expedient that applies to all contracts that were not completed at the date of adoption. The Company determined the differences between recognition methods was minimal; thus no opening adjustment was deemed necessary to retained earnings. The comparative information was not restated and continues to be presented under the accounting standards in effect for those periods. The Company does not anticipate any material changes to the costs of obtaining or fulfilling a contract, or corporate taxes.
Accounting Policies
The vast majority of the Company’s revenue is recognized over time as its customers simultaneously receive and consume the benefits. While there may be master service agreements with Company customers, a contract is not established until the customer specifically requests the Company’s services and the Company accepts.
The Company evaluates each contract for distinct performance obligations. In the Company’s business, a typical performance obligation is the transportation of a load including any highly interrelated ancillary services.
The Company predominantly estimates the standalone selling price of its services based upon observable evidence, market conditions and other relevant inputs. The Company allocates the total transaction price to each distinct performance obligation based upon the relative standalone selling prices.
12
DASEKE, INC. AND SUBSIDIARIES
NOTES TO CONSOLIDATED FINANCIAL STATEMENTS
(Unaudited)
The Company’s customers simultaneously receive and consume the benefits of the Company’s contracts; therefore revenue is recognized over time. This is a faithful depiction of the satisfaction of the performance obligation, as the customer does not need to re-perform the transportation services the Company has provided to date.
Brokerage Revenue
The Company regularly engages third-party capacity providers to haul loads brokered to them when it needs additional capacity. The Company is primarily responsible for fulfilling the promise to provide load transportation services, and has discretion in setting prices, along with the risk to fulfill the contract to the customer. Based upon this evaluation, the Company has determined that it is the principal and therefore, records gross revenues for brokerage services.
Disclosure Designations
The Company has designated the following preference and practical expedients:
|
· |
Not disclose remaining performance obligations when the expected performance obligation duration is one year or less. The vast majority of the Company’s services transfer control within a month of the inception of the contract with select specialized loads taking several months to allow for increased planning and permitting. |
|
· |
Recognize the incremental costs of obtaining or fulfilling a contract as an expense when incurred, as the amortization period of a potential asset would be recognized in one year or less. |
|
· |
Exclude taxes collected on behalf of government authorities from the Company’s measurement of transaction prices. Tax amounts are not included within net income or cost of sales. |
13
DASEKE, INC. AND SUBSIDIARIES
NOTES TO CONSOLIDATED FINANCIAL STATEMENTS
(Unaudited)
Disaggregation of Revenue
The Company’s income and segment disclosures have been reviewed to ensure revenues are properly disaggregated in accordance with the new guidance as displayed in the table below:
|
|
|
Flatbed |
|
Specialized |
|
|
|
|
|
|
||
|
|
|
Solutions |
|
Solutions |
|
Corporate/ |
|
Consolidated |
||||
|
|
|
Segment |
|
Segment |
|
Eliminations |
|
Total |
||||
|
Three Months Ended September 30, 2018 |
|
|
|
|
|
|
|
|
|
|
|
|
|
Freight |
|
$ |
130,678 |
|
$ |
202,085 |
|
$ |
(3,289) |
|
$ |
329,474 |
|
Brokerage |
|
|
29,134 |
|
|
53,233 |
|
|
(164) |
|
|
82,203 |
|
Logistics |
|
|
824 |
|
|
10,855 |
|
|
(23) |
|
|
11,656 |
|
Fuel surcharge |
|
|
20,858 |
|
|
17,718 |
|
|
(320) |
|
|
38,256 |
|
Total revenue |
|
$ |
181,494 |
|
$ |
283,891 |
|
$ |
(3,796) |
|
$ |
461,589 |
|
|
|
|
|
|
|
|
|
|
|
|
|
|
|
Three Months Ended September 30, 2017 |
|
|
|
|
|
|
|
|
|
|
|
|
|
Freight |
|
$ |
67,807 |
|
$ |
105,137 |
|
$ |
(1,699) |
|
$ |
171,245 |
|
Brokerage |
|
|
9,385 |
|
|
24,852 |
|
|
(39) |
|
|
34,198 |
|
Logistics |
|
|
— |
|
|
7,886 |
|
|
(15) |
|
|
7,871 |
|
Fuel surcharge |
|
|
8,400 |
|
|
9,756 |
|
|
(148) |
|
|
18,008 |
|
Total revenue |
|
$ |
85,592 |
|
$ |
147,631 |
|
$ |
(1,901) |
|
$ |
231,322 |
|
|
|
|
|
|
|
|
|
|
|
|
|
|
|
Nine Months Ended September 30, 2018 |
|
|
|
|
|
|
|
|
|
|
|
|
|
Freight |
|
$ |
353,676 |
|
$ |
496,712 |
|
$ |
(8,260) |
|
$ |
842,128 |
|
Brokerage |
|
|
76,006 |
|
|
112,823 |
|
|
(397) |
|
|
188,432 |
|
Logistics |
|
|
2,231 |
|
|
29,128 |
|
|
(94) |
|
|
31,265 |
|
Fuel surcharge |
|
|
56,768 |
|
|
48,474 |
|
|
(998) |
|
|
104,244 |
|
Total revenue |
|
$ |
488,681 |
|
$ |
687,137 |
|
$ |
(9,749) |
|
$ |
1,166,069 |
|
|
|
|
|
|
|
|
|
|
|
|
|
|
|
Nine Months Ended September 30, 2017 |
|
|
|
|
|
|
|
|
|
|
|
|
|
Freight |
|
$ |
200,670 |
|
$ |
250,255 |
|
$ |
(4,471) |
|
$ |
446,454 |
|
Brokerage |
|
|
27,979 |
|
|
55,820 |
|
|
(76) |
|
|
83,723 |
|
Logistics |
|
|
— |
|
|
10,594 |
|
|
(23) |
|
|
10,571 |
|
Fuel surcharge |
|
|
25,145 |
|
|
23,620 |
|
|
(434) |
|
|
48,331 |
|
Total revenue |
|
$ |
253,794 |
|
$ |
340,289 |
|
$ |
(5,004) |
|
$ |
589,079 |
Significant Judgments
Under the new revenue standard, significant judgments are required in order to identify contracts with customers and estimate transaction prices. Additional judgments are required for the identification of distinct performance obligations, the estimation of standalone selling prices and the allocation of the transaction price by relative standalone selling prices. Assumptions regarding the timing of when control transfers to the customer requires significant judgment in order to recognize revenue.
NOTE 3 – BUSINESS COMBINATION
On February 27, 2017, Hennessy consummated the merger of Hennessy’s wholly-owned subsidiary with and into Daseke, Inc., with Daseke, Inc. surviving as a direct wholly-owned subsidiary of Hennessy (the Business Combination) pursuant to the Agreement and Plan of Merger, dated December 22, 2016 (the Merger Agreement). The aggregate consideration received by Private Daseke stockholders upon closing was $266.7 million, consisting of newly issued shares of common stock at a value of $10.00 per share. The Merger Agreement contains an earn-out provision through which Private Daseke stockholders could receive up to 15 million additional shares of common stock (with up to 5 million shares payable annually with respect to 2017, 2018 and 2019 performance). The full 15 million shares are only payable if (i) the annualized Adjusted EBITDA (giving effect to acquisitions and as defined in the Merger Agreement) for 2017, 2018 and 2019 is at least $140.0 million, $170.0 million and $200.0 million, respectively, and (ii) the closing share price of the Company’s common stock is at least $12.00, $14.00 and $16.00 for any 20-trading days in a consecutive 30-trading day period in 2017, 2018 and 2019, respectively. For each year, the 5 million earn-out shares will be prorated to the extent the annualized Adjusted EBITDA (giving effect to acquisitions and as defined in the Merger Agreement) exceeds 90% but represents less than 100%, of the applicable earn-out target. The Company met the earn-out provisions for the year ended December 31, 2017 and 5 million shares were issued to the Private Daseke stockholders in the second quarter of 2018.
14
DASEKE, INC. AND SUBSIDIARIES
NOTES TO CONSOLIDATED FINANCIAL STATEMENTS
(Unaudited)
Following the consummation of the Business Combination on February 27, 2017 (the Closing), there were 37,715,960 shares of common stock issued and outstanding, consisting of (i) 26,665,330 shares issued to Private Daseke stockholders pursuant to the Merger Agreement, (ii) 419,669 shares issued in a private placement that closed in conjunction with the Business Combination, (iii) 2,288,043 shares originally issued to Hennessy Capital Partners II LLC (the Sponsor) in a private placement that closed simultaneously with the consummation of the IPO, and (iv) 8,342,918 shares, following redemptions, which shares were originally issued in the IPO. In connection with the Business Combination, $65.0 million of Series A Preferred Stock (650,000 shares) were issued in a private placement.
In conjunction with the Closing, the Company entered into (i) a $350.0 million term loan credit facility (the Term Loan Facility), which consists of a $250.0 million term loan funded on the closing date of the Term Loan Facility and up to $100.0 million of term loans to be funded from time to time under a delayed draw term loan facility, and (ii) an asset-based revolving credit facility (the ABL Facility), in an aggregate maximum credit amount equal to $70.0 million (subject to availability under a borrowing base). See Note 10 for more information regarding the Term Loan Facility and the ABL Facility. Prior to the Closing, the Company had a credit facility consisting of a term loan (Senior Term Loan) and a revolving line of credit (Line of Credit).
The following table is a summary of cash proceeds and utilization of proceeds in the Business Combination (in thousands):
|
Proceeds |
|
|
|
|
|
|
|
|
|
Public share proceeds(1) |
|
$ |
83,429 |
|
Issuance of Series A Preferred Stock |
|
|
65,000 |
|
Term Loan Facility |
|
|
250,000 |
|
Cash(2) |
|
|
3,209 |
|
Total proceeds |
|
|
401,638 |
|
|
|
|
|
|
Use of Proceeds |
|
|
|
|
|
|
|
|
|
Repayment of Line of Credit(3) |
|
|
16,717 |
|
Repayment of Senior Term Loan(4) |
|
|
122,724 |
|
Repayment of equipment loans(5) |
|
|
89,488 |
|
Repayment of subordinated debt(6) |
|
|
67,460 |
|
Payment of deferred financing fees(7) |
|
|
14,148 |
|
Repurchase Main Street and Prudential shares(8) |
|
|
36,168 |
|
Hennessy transaction costs |
|
|
19,063 |
|
Daseke transaction costs(9) |
|
|
1,204 |
|
Total use of proceeds |
|
|
366,972 |
|
|
|
|
|
|
Net cash received |
|
$ |
34,666 |
|
(1) - 8,342,918 public shares outstanding valued at $10.00 per share |
|
(2) - Daseke cash utilized for payment of deferred financing fees and transaction costs |
|
(3) - Includes payment of $59 accrued interest recognized in interest expense |
|
(4) - Includes payment of $422 accrued interest recognized in interest expense |
|
(5) - Includes payment of $731 accrued interest recognized in interest expense |
|
(6) - Includes payment of $745 accrued interest recognized in interest expense |
|
(7) - Excludes $81 paid subsequent to the Closing |
|
(8) - Hennessy repurchased Private Daseke shares held by Main Street Capital II, LP, Main Street Mezzanine Fund, LP, Main Street Capital Corporation, Prudential Capital Partners IV, L.P., Prudential Capital Partners (Parallel Fund) IV, L.P. and Prudential Capital Partners Management Fund IV, L.P. |
|
(9) - $0.8 million and $0.4 million expensed in fourth quarter 2016 and first quarter 2017, respectively |
The Business Combination was accounted for as a reverse merger in accordance with GAAP. Under this method of accounting, Hennessy is treated as the “acquired” company. This determination was primarily based on Private Daseke comprising the ongoing operations of the combined company, Private Daseke’s senior management comprising the senior management of the combined company, and Private Daseke stockholders having a majority of the voting power of the combined company. For accounting purposes, Private Daseke is deemed to be the accounting acquirer in the transaction and, consequently, the transaction is treated as a recapitalization of Private Daseke (i.e., a capital
15
DASEKE, INC. AND SUBSIDIARIES
NOTES TO CONSOLIDATED FINANCIAL STATEMENTS
(Unaudited)
transaction involving the issuance of stock by Hennessy for the stock of Private Daseke). Accordingly, the consolidated assets, liabilities and results of operations of Private Daseke are the historical financial statements of the combined company, and Hennessy’s assets, liabilities and results of operations are consolidated with Private Daseke beginning on the acquisition date.
In connection with the Closing, Daseke, Inc. changed its name to Daseke Companies, Inc. and Hennessy Capital Acquisition Corp. II changed its name to Daseke, Inc. Daseke, Inc.’s common stock and warrants began trading under the ticker symbols DSKE and DSKEW, respectively, on February 28, 2017.
NOTE 4 – ACQUISITIONS
The Company is a leading consolidator of the open-deck freight market in North America. From its inception in late 2008, the Company has successfully acquired more than 18 open-deck trucking companies. Negotiations and discussions with potential targets are an integral part of the Company’s operations, and the Company may be in varying stages of the acquisition process, from infancy to very mature, at any point in time. To date, the primary reason for each acquisition was to add resources and services in geographic areas, customers and markets that the Company wants to serve, resulting in recognized goodwill.
For each acquisition, the aggregate purchase price was allocated to the major categories of assets acquired and liabilities assumed at estimated fair values as of the acquisition date, which were based, in part, upon outside preliminary appraisals for certain assets and subject to change when additional information concerning final asset and liability values is obtained. The final purchase price allocations may result in adjustments to certain assets and liabilities, including the residual amount allocated to goodwill.
2018 Acquisitions
The following is a summary of the preliminary allocation of the purchase price paid to the fair values of the net assets, net of cash acquired, of the 2018 acquisitions, as defined below (in thousands):
|
(all amounts in U.S. dollars) |
|
|
|
|
|
|
|
|
|
|
|
|
|
|
|
Leavitt's |
|
Builders |
|
Kelsey Trail |
|
Aveda |
||||
|
Accounts receivable |
|
$ |
1,968 |
|
$ |
8,347 |
|
$ |
2,320 |
|
$ |
37,255 |
|
Parts supplies |
|
|
53 |
|
|
261 |
|
|
33 |
|
|
— |
|
Prepaid and other current assets |
|
|
384 |
|
|
1,509 |
|
|
382 |
|
|
1,785 |
|
Property and equipment |
|
|
8,551 |
|
|
29,437 |
|
|
9,164 |
|
|
89,752 |
|
Goodwill |
|
|
3,492 |
|
|
11,863 |
|
|
1,441 |
|
|
8,227 |
|
Intangible assets |
|
|
5,237 |
|
|
13,077 |
|
|
1,878 |
|
|
8,951 |
|
Other long-term assets |
|
|
— |
|
|
536 |
|
|
— |
|
|
— |
|
Deferred tax liability |
|
|
(21) |
|
|
(8,835) |
|
|
(1,109) |
|
|
(1,224) |
|
Accounts payable and other liabilities |
|
|
(4,935) |
|
|
(19,931) |
|
|
(8,026) |
|
|
(30,007) |
|
Total |
|
$ |
14,729 |
|
$ |
36,264 |
|
$ |
6,083 |
|
$ |
114,739 |
Leavitt’s Freight Service
On August 1, 2018, the Company acquired 100% of the outstanding equity interests of Leavitt’s Freight Service, Inc. (Leavitt’s), based in Springfield, Oregon. Total consideration paid was $14.9 million of cash, which was funded with cash on hand. The acquisition was treated as an asset purchase because Leavitt’s was a qualified subchapter S-subsidiary acquired directly from an S-corporation; therefore, the values assigned to the intangible assets and goodwill are deductible for tax purposes. Approximately $0.3 million of transaction expenses were incurred in the acquisition, which will be deductible for tax purposes because the transaction qualified as an asset purchase.
16
DASEKE, INC. AND SUBSIDIARIES
NOTES TO CONSOLIDATED FINANCIAL STATEMENTS
(Unaudited)
Builders Transportation
On August 1, 2018, the Company acquired 100% of the outstanding equity interests of Builders Transportation Co., LLC (Builders), based in Memphis, Tennessee. Total consideration paid was $36.3 million, consisting of $30.0 million in cash, 399,530 shares of Daseke common stock valued at $3.4 million and the payoff of $2.9 million of outstanding debt. The cash consideration was funded with cash on hand. The acquisition was a stock purchase; therefore, the values assigned to the intangible assets and goodwill are not deductible for tax purposes. Approximately $0.2 million of transaction expenses were incurred in the acquisition, which are not deductible for tax purposes.
Kelsey Trail Trucking
On July 1, 2018, the Company acquired 100% of the outstanding equity interests of Kelsey Trail Trucking Ltd. (Kelsey Trail), based in Saskatoon, Saskatchewan province, Canada. Total consideration paid was $6.2 million, consisting of $5.3 million in cash and 95,859 shares of Daseke common stock valued at $0.9 million. The cash consideration was funded with cash on hand. The acquisition was a stock purchase; therefore, the values assigned to the intangible assets and goodwill are not deductible for tax purposes. Approximately $0.1 million of transaction expenses were incurred in the acquisition, which are not deductible for tax purposes.
Aveda Transportation and Energy Services
On June 6, 2018, the Company acquired all of the outstanding common shares of Aveda Transportation and Energy Services Inc., a corporation existing under the laws of the Province of Alberta, Canada (Aveda), pursuant to the Agreement and the Plan of Arrangement (the Agreement). Total consideration paid was $117.8 million, consisting of $27.3 million in cash, 1,612,979 shares of Daseke common stock valued at $15.4 million, and the payoff of $54.8 million of outstanding debt. The Company will also pay to the holders of Aveda common shares up to C$0.45 in cash per Aveda common share, contingent on and based on Aveda’s Company EBITDA (as defined in the Agreement) meeting certain thresholds set forth in the Agreement for the period beginning June 1, 2018 and ending on May 1, 2019 or with agreement of the parties, July 1, 2018 to June 30, 2019. The contingent consideration for this earn-out has been initially valued at an estimated $20.3 million. The Aveda acquisition was a stock purchase; therefore, the value assigned to the intangible assets and goodwill are not deductible for tax purposes. Approximately $1.1 million of transaction expenses were incurred in the acquisition, which are not deductible for tax purposes.
The Company has not completed its assessment of the fair value of purchased intangible assets or contingent consideration for the 2018 acquisitions; therefore, the purchase price allocations for the above acquisitions are not considered final as of September 30, 2018.
2017 Acquisitions
The following is a summary of the preliminary allocation of the purchase price paid to the fair values of the net assets, net of cash acquired, of the Company’s 2017 acquisitions (in thousands):
|
(all amounts in U.S. dollars) |
|
|
|
|
|
|
|
Tennessee |
|
|
|
|
|
|
|
|
||||||||
|
|
|
|
|
Moore |
|
Roadmaster |
|
Steel |
|
|
|
|
|
|
|
|
||||||||
|
|
|
Belmont |
|
Freight |
|
Group |
|
Haulers |
|
R&R* |
|
Steelman* |
|
Schilli* |
|
Big Freight* |
||||||||
|
Accounts receivable |
|
$ |
240 |
|
$ |
4,456 |
|
$ |
9,806 |
|
$ |
20,207 |
|
$ |
5,129 |
|
$ |
4,383 |
|
$ |
8,616 |
|
$ |
4,914 |
|
Parts supplies |
|
|
— |
|
|
312 |
|
|
231 |
|
|
— |
|
|
149 |
|
|
90 |
|
|
1,681 |
|
|
212 |
|
Prepaid and other current assets |
|
|
107 |
|
|
301 |
|
|
1,097 |
|
|
5,870 |
|
|
1,515 |
|
|
2,295 |
|
|
2,548 |
|
|
287 |
|
Property and equipment |
|
|
1,548 |
|
|
22,052 |
|
|
36,854 |
|
|
8,705 |
|
|
16,887 |
|
|
11,100 |
|
|
39,870 |
|
|
11,493 |
|
Goodwill |
|
|
2,427 |
|
|
17,800 |
|
|
61,047 |
|
|
35,252 |
|
|
15,676 |
|
|
9,747 |
|
|
11,050 |
|
|
7,638 |
|
Intangible assets |
|
|
1,760 |
|
|
30,400 |
|
|
22,900 |
|
|
49,850 |
|
|
11,010 |
|
|
6,620 |
|
|
6,000 |
|
|
4,210 |
|
Other long-term assets |
|
|
— |
|
|
114 |
|
|
670 |
|
|
19,049 |
|
|
156 |
|
|
5,013 |
|
|
915 |
|
|
121 |
|
Deferred tax liability |
|
|
(1,300) |
|
|
(14,376) |
|
|
(19,410) |
|
|
(33,284) |
|
|
(8,922) |
|
|
(4,811) |
|
|
(15,424) |
|
|
(4,792) |
|
Accounts payable and other liabilities |
|
|
(248) |
|
|
(1,889) |
|
|
(26,764) |
|
|
(14,002) |
|
|
(3,362) |
|
|
(15,612) |
|
|
(27,896) |
|
|
(6,294) |
|
Total |
|
$ |
4,534 |
|
$ |
59,170 |
|
$ |
86,431 |
|
$ |
91,647 |
|
$ |
38,238 |
|
$ |
18,825 |
|
$ |
27,360 |
|
$ |
17,789 |
*The purchase price allocations for R&R, Steelman, Schilli and Big Freight are considered final as of September 30, 2018.
Belmont
On December 29, 2017, the Company acquired 100% of the outstanding equity interests of Belmont Enterprises, Inc. (Belmont) based in Olympia, Washington. Total consideration paid was $4.6 million in cash funded through the Company’s line of credit under the ABL Facility.
17
DASEKE, INC. AND SUBSIDIARIES
NOTES TO CONSOLIDATED FINANCIAL STATEMENTS
(Unaudited)
The acquisition was a stock purchase; therefore, the values assigned to the intangible assets and goodwill are not deductible for tax purposes. Transaction expenses incurred in the acquisition, which are not deductible for tax purposes, were immaterial. As of June 30, 2018, the valuation of identifiable intangible assets was completed resulting in assets totaling $1.7 million, consisting of trade name valued at $0.3 million, non-compete agreements valued at $0.2 million and customer relationships intangible of $1.2 million, with a corresponding decrease to goodwill. For the three months ended June 30, 2018, the change resulted in an increase in amortization expense and accumulated amortization of $0.1 million, of which $62,566 is related to the previous quarter. Additionally, goodwill and a corresponding deferred tax liability of $0.6 million was recognized based on the rates in effect on the acquisition date. The deferred tax liability was re-measured using the TCJA rates, which resulted in the recognition of a $0.4 million deferred tax benefit.
Moore Freight Services
On December 1, 2017, the Company acquired 100% of the outstanding equity interests of: (1) Moore Freight Service, Inc., (2) RT & L, LLC, (3) JD and Partners, LLC, (4) TM Transport and Leasing, LLC, and (5) Rand, LLC (collectively Moore Freight Services) based in Knoxville, Tennessee. Total consideration paid was $59.1 million, consisting of $35.1 million in cash and 145,129 shares of Daseke common stock valued at $1.8 million and the repayment of $22.2 million of long-term debt by the Company. The cash consideration was funded with cash on hand and the Term Loan Facility. The acquisition was a stock purchase; therefore, the values assigned to the intangible assets and goodwill are not deductible for tax purposes. Approximately $0.6 million of transaction expenses were incurred in the acquisition, which are not deductible for tax purposes. As of June 30, 2018, the valuation of identifiable intangible assets was completed resulting in assets totaling $30.4 million, consisting of trade name valued at $3.2 million, non-compete agreements valued at $3.5 million and customer relationships intangible of $23.7 million, with a corresponding decrease to goodwill. For the three months ended June 30, 2018, the change resulted in an increase in amortization expense and accumulated amortization of $1.5 million, of which $0.9 million related to the previous quarter. Additionally, goodwill and a corresponding deferred tax liability of $11.7 million was recognized based on the rates in effect on the acquisition date. The deferred tax liability was re-measured using the TCJA rates, which resulted in the recognition of a $4.0 million deferred tax benefit.
Roadmaster Group
On December 1, 2017, the Company acquired 100% of the outstanding equity interests of Roadmaster Group, Inc. and subsidiaries, and Roadmaster Equipment Leasing, Inc. and all subsidiaries (collectively the Roadmaster Group) based in Phoenix, Arizona. Total consideration paid was $86.9 million, consisting of $37.5 million in cash, 3,114,247 shares of Daseke common stock valued at $39.1 million and the repayment of $10.3 million of long-term debt by the Company. The cash consideration was funded with cash on hand and the Term Loan Facility. The acquisition was a stock purchase; therefore, the values assigned to the intangible assets and goodwill are not deductible for tax purposes. Approximately $0.6 million of transaction expenses were incurred in the acquisition, which are not deductible for tax purposes. As of June 30, 2018, the valuation of identifiable intangible assets was completed resulting in assets totaling $22.9 million, consisting of trade name valued at $12.7 million, non-compete agreements valued at $2.9 million and customer relationships intangible of $7.3 million, with a corresponding decrease to goodwill. For the three months ended June 30, 2018, the change resulted in an increase in amortization expense and accumulated amortization of $0.6 million, of which $0.3 million related to the previous quarter. Additionally, goodwill and a corresponding deferred tax liability of $8.7 million was recognized based on the rates in effect on the acquisition date. The deferred tax liability was re-measured using the TCJA rates, which resulted in the recognition of a $3.0 million deferred tax benefit.
18
DASEKE, INC. AND SUBSIDIARIES
NOTES TO CONSOLIDATED FINANCIAL STATEMENTS
(Unaudited)
Tennessee Steel Haulers & Co.
On December 1, 2017, the Company acquired 100% of the outstanding equity interests of: (1) Tennessee Steel Haulers, Inc., (2) Alabama Carriers, Inc., and (3) Fleet Movers Inc. (collectively TSH & Co.) based in Nashville, Tennessee. Total consideration paid was $91.9 million, consisting of $74.9 million in cash and 972,680 shares of Daseke common stock valued at $12.0 million and the repayment of $5.0 million of long-term debt by the Company. The cash consideration was funded with cash on hand and the Term Loan Facility. The acquisition was a stock purchase; therefore, the values assigned to the intangible assets and goodwill are not deductible for tax purposes. Approximately $0.5 million of transaction expenses were incurred in the acquisition, which are not deductible for tax purposes. As of June 30, 2018, the valuation of identifiable intangible assets was completed resulting in assets totaling $49.8 million, consisting of trade name valued at $21.5 million, non-compete agreements valued at $12.4 million and customer relationships intangible of $15.9 million, with a corresponding decrease to goodwill. For the three months ended June 30, 2018, the change resulted in an increase in amortization expense and accumulated amortization of $2.1 million, of which $1.2 million related to the previous quarter. Additionally, goodwill and a deferred tax liability of $19.2 million was recognized based on the rates in effect on the acquisition date. The deferred tax liability was re-measured using the TCJA rates, which resulted in the recognition of a $6.6 million deferred tax benefit.
R&R Trucking Holdings
On September 1, 2017, the Company acquired 100% of the outstanding stock of R&R Trucking Holdings, LLC (R&R), based in Duenweg, Missouri. Total consideration paid was $38.4 million, consisting of $24.6 million in cash and the assumption and repayment of $13.8 million of long-term debt by the Company. The cash consideration was funded through a delayed draw on September 1, 2017 under the Term Loan Facility. The acquisition was a stock purchase; therefore, the values assigned to the intangible assets and goodwill are not deductible for tax purposes. Approximately $0.6 million of transaction expenses were incurred in the acquisition, which are not deductible for tax purposes.
The Steelman Companies
On July 1, 2017, the Company acquired 100% of the outstanding stock of The Steelman Companies (Steelman), based in Springfield, Missouri, for consideration of $18.8 million, consisting of $11.2 million in cash and 746,170 shares of Daseke common stock valued at $7.6 million. The fair value of the 746,170 shares issued was determined based on the closing price of the stock on the acquisition close date. The cash consideration was funded through cash on hand. The acquisition was a stock purchase under GAAP. A Section 338(h)(10) election was filed for certain of the entities acquired which will deem those acquisitions as an asset purchase for tax purposes; therefore, approximately $14.9 million of the values assigned to the intangible assets and goodwill are expected to be deductible for tax purposes. Approximately $0.3 million of transaction expenses were incurred in the acquisition, which are not deductible for tax purposes. As of June 30, 2018, the provisional amount of goodwill was increased by $1.7 million with a corresponding increase to deferred tax liability.
Schilli Transportation Services
On May 1, 2017, the Company acquired 100% of the outstanding stock of Schilli Transportation Services, Inc. and certain of its affiliates (Schilli), based in Remington, Indiana. Total consideration paid was $27.4 million, consisting of $21.0 million in cash, 232,885 shares of Daseke common stock valued at $2.3 million and the refinancing of $4.0 million of long-term debt by the Company. The fair value of the 232,885 shares issued was determined based on the closing price of the stock on the acquisition close date. The cash consideration was funded through a delayed draw on May 1, 2017 under the Term Loan Facility. The acquisition was a stock purchase; therefore, the values assigned to the intangible assets and goodwill are not deductible for tax purposes. Approximately $0.4 million of transaction expenses were incurred in the acquisition, which are not deductible for tax purposes. As of June 30, 2018, the provisional balance of goodwill was increased by $2.8 million for fair value adjustments to assets as of the acquisition date with a decrease to receivables of $0.9 million, held-for-sale assets of $0.3 million and fixed assets of $1.6 million. Additionally, the deferred tax liability was decreased by $0.7 million, with a corresponding decrease to goodwill.
Big Freight Systems
On May 1, 2017, the Company acquired 100% of the outstanding stock of Big Freight Systems, Inc. (Big Freight), based in Steinbach, Manitoba. Total consideration paid was $16.7 million consisting of $12.4 million in cash, 109,248 shares of Daseke common stock valued at $1.1 million and the assumption of approximately $3.2 million of outstanding debt by the Company. The fair value of the 109,248 shares issued was determined based on the closing price of the stock on the acquisition close date. Big Freight’s purchase agreement also contains an earn-out for additional cash consideration to be paid on the excess of each of 2017, 2018 and 2019’s earnings before interest, taxes,
19
DASEKE, INC. AND SUBSIDIARIES
NOTES TO CONSOLIDATED FINANCIAL STATEMENTS
(Unaudited)
depreciation and amortization (EBITDA Amount) over 2016’s EBITDA Amount (as defined in the purchase agreement), multiplied by 0.4. A contingent liability of $1.1 million was included in the allocation of the purchase price for this earn-out. The cash consideration was funded through a delayed draw on May 1, 2017 under the Term Loan Facility and cash on hand. The acquisition was a stock purchase; therefore, the values assigned to the intangible assets and goodwill are not deductible for tax purposes. Approximately $0.6 million of transaction expenses were incurred in the acquisition, which are not deductible for tax purposes. As of June 30, 2018, the provisional amount of goodwill was increased by $0.6 million (net of a $0.3 million foreign currency translation adjustment) with a corresponding increase to deferred tax liability.
Supplemental Pro Forma Information (Unaudited)
The following supplemental pro forma financial information reflects the 2018 acquisitions as if they occurred on January 1, 2017. This pro forma financial information has been presented for illustrative purposes only and is not necessarily indicative of the operating results that would have been achieved had the pro forma events taken place on January 1, 2017. Further, the pro forma financial information does not purport to project the future operating results of the consolidated company.
|
|
|
|
|
|
|
|
|
|
|
|
|
|
|
|
|
Three Months Ended September 30, |
|
Nine Months Ended September 30, |
||||||||
|
(in millions) |
|
2018 |
|
2017 |
|
2018 |
|
2017 |
||||
|
|
|
|
|
|
|
|
|
|
|
|
|
|
|
Pro forma revenue |
|
$ |
468.2 |
|
$ |
302.3 |
|
$ |
1,293.5 |
|
$ |
789.6 |
|
Pro forma net loss |
|
$ |
2.7 |
|
$ |
(0.6) |
|
$ |
12.6 |
|
$ |
(14.9) |
|
Pro forma net loss per common share: |
|
|
|
|
|
|
|
|
|
|
|
|
|
Basic and Diluted |
|
$ |
0.04 |
|
$ |
(0.02) |
|
$ |
0.21 |
|
$ |
(0.43) |
For the three months ended September 30, 2018, actual revenue and net loss included in the Company’s consolidated statements of operations and comprehensive income (loss) attributable to the 2018 acquisitions were $79.5 million and $(0.4) million, respectively, and for the nine months ended September 30, 2018, $94.5 million and $(1.1) million, respectively.
NOTE 5 – PREPAID AND OTHER CURRENT ASSETS
The components of prepaid expenses and other current assets are as follows as of September 30, 2018 and December 31, 2017 (in thousands):
|
|
|
2018 |
|
2017 |
||
|
Assets held for sale |
|
$ |
10,369 |
|
$ |
9,907 |
|
Insurance |
|
|
7,057 |
|
|
7,642 |
|
Other prepaids |
|
|
5,826 |
|
|
2,948 |
|
Licensing, permits and tolls |
|
|
5,600 |
|
|
4,096 |
|
Highway and fuel taxes |
|
|
1,655 |
|
|
1,238 |
|
Other assets |
|
|
2,951 |
|
|
2,409 |
|
|
|
$ |
33,458 |
|
$ |
28,240 |
20
DASEKE, INC. AND SUBSIDIARIES
NOTES TO CONSOLIDATED FINANCIAL STATEMENTS
(Unaudited)
NOTE 6 – GOODWILL AND INTANGIBLE ASSETS
Goodwill represents the excess of the purchase price of all acquisitions over the estimated fair value of the net assets acquired. The Company performs an impairment test of goodwill annually as of October 1 or when impairment indicators arise. There was no goodwill impairment identified for nine months ended September 30, 2018. The summary of changes in goodwill follows for the nine months ended September 30, 2018 (in thousands):
|
|
|
Flatbed |
|
Specialized |
|
Total |
|||
|
Goodwill balance at December 31, 2017 |
|
$ |
105,866 |
|
$ |
196,836 |
|
$ |
302,702 |
|
Goodwill acquired and adjustments to previously recorded goodwill |
|
|
(8,602) |
|
|
(19,402) |
|
|
(28,004) |
|
Foreign currency translation adjustment |
|
|
— |
|
|
(407) |
|
|
(407) |
|
Goodwill balance at September 30, 2018 |
|
$ |
97,264 |
|
$ |
177,027 |
|
$ |
274,291 |
Intangible assets consisted of the following at September 30, 2018 and December 31, 2017 (in thousands):
|
|
|
As of September 30, 2018 |
|
As of December 31, 2017 |
||||||||||||||
|
|
|
Intangible |
|
Accumulated |
|
Intangible |
|
Intangible |
|
Accumulated |
|
Intangible |
||||||
|
|
|
Assets |
|
Amortization |
|
Assets, net |
|
Assets |
|
Amortization |
|
Assets, net |
||||||
|
Non-competition agreements |
|
$ |
36,563 |
|
$ |
(10,989) |
|
$ |
25,574 |
|
$ |
12,230 |
|
$ |
(5,765) |
|
$ |
6,465 |
|
Customer relationships |
|
|
130,649 |
|
|
(30,871) |
|
|
99,778 |
|
|
69,090 |
|
|
(23,921) |
|
|
45,169 |
|
Trade names |
|
|
86,497 |
|
|
(18) |
|
|
86,479 |
|
|
41,180 |
|
|
— |
|
|
41,180 |
|
Foreign currency translation adjustment |
|
|
178 |
|
|
— |
|
|
178 |
|
|
306 |
|
|
— |
|
|
306 |
|
Total intangible assets |
|
$ |
253,887 |
|
$ |
(41,878) |
|
$ |
212,009 |
|
$ |
122,806 |
|
$ |
(29,686) |
|
$ |
93,120 |
As of September 30, 2018, non-competition agreements and customer relationships had weighted average remaining useful lives of 3.42 and 10.24 years, respectively.
Amortization expense for intangible assets with definite lives was $4.1 million and $1.8 million for the three months ended September 30, 2018 and 2017, respectively, and $12.2 million and $4.6 million for the nine months ended September 30, 2018 and 2017, respectively. Projected amortization expense for the next five fiscal years ending December 31, 2018, 2019, 2020, 2021 and 2022 will be $18.2 million, $17.5 million, $16.2 million, $15.4 million and $14.6 million, respectively.
In June 2018, the Company recorded an impairment charge of $2.8 million related to the trade names category of intangible assets. The trade name was impaired as a result of the reorganization and merger of two of the Company’s operating companies.
NOTE 7 – PROPERTY AND EQUIPMENT
The components of property and equipment are as follows at September 30, 2018 and December 31, 2017 (in thousands):
|
|
|
2018 |
|
2017 |
||
|
Revenue equipment |
|
$ |
708,865 |
|
$ |
544,876 |
|
Buildings and improvements |
|
|
60,980 |
|
|
53,366 |
|
Furniture and fixtures, office and computer equipment and vehicles |
|
|
34,622 |
|
|
20,805 |
|
|
|
|
804,467 |
|
|
619,047 |
|
Accumulated depreciation |
|
|
(241,808) |
|
|
(189,408) |
|
|
|
$ |
562,659 |
|
$ |
429,639 |
Depreciation expense on property and equipment was $32.8 million and $18.0 million for the three months ended September 30, 2018 and 2017, respectively, and $81.6 million and $49.1 million for the nine months ended September 30, 2018 and 2017, respectively.
21
DASEKE, INC. AND SUBSIDIARIES
NOTES TO CONSOLIDATED FINANCIAL STATEMENTS
(Unaudited)
NOTE 8 – SALES-TYPE LEASES
The Company leases revenue equipment to certain of its owner-operators and accounts for these transactions as sales-type leases. These leases have terms of 30 to 72 months and are collateralized by a security interest in the related revenue equipment. A minimum lease receivable is recorded, net of unearned interest income and deferred gain on sale of the equipment. The gain is recognized as payments are collected, rather than in the period the lease is recorded due to the uncertainty of collection.
The components of the net investment in sales-type leases are as follows at September 30, 2018 and December 31, 2017 (in thousands):
|
|
|
2018 |
|
2017 |
||
|
Minimum lease receivable |
|
$ |
78,525 |
|
$ |
62,587 |
|
Deferred gain |
|
|
(10,094) |
|
|
(9,352) |
|
Net minimum lease receivable |
|
|
68,431 |
|
|
53,235 |
|
Unearned interest income |
|
|
(11,437) |
|
|
(10,432) |
|
|
|
|
|
|
|
|
|
Net investment in sales-type leases |
|
|
56,994 |
|
|
42,803 |
|
Current portion |
|
|
(15,744) |
|
|
(10,979) |
|
|
|
$ |
41,250 |
|
$ |
31,824 |
The long-term portion of sales-type leases is classified in other long-term assets on the consolidated balance sheets at September 30, 2018 and December 31, 2017.
Gain or loss on disposition of revenue equipment leased to owner-operators is included as a component of purchased freight in the consolidated statements of operations and comprehensive income (loss). The gain totaled approximately $0.6 million and $0.5 million for the three months ended September 30, 2018 and 2017, respectively, and $2.0 million and $0.8 million for the nine months ended September 30, 2018 and 2017, respectively.
NOTE 9 – ACCRUED EXPENSES AND OTHER LIABILITIES
The components of accrued expenses and other liabilities are as follows at September 30, 2018 and December 31, 2017 (in thousands):
|
|
|
2018 |
|
2017 |
||
|
Brokerage and escorts |
|
$ |
15,181 |
|
$ |
6,264 |
|
Unvouchered payables |
|
|
9,984 |
|
|
4,156 |
|
Other accrued expenses |
|
|
14,976 |
|
|
4,977 |
|
Owner-operator deposits |
|
|
11,373 |
|
|
8,431 |
|
Interest |
|
|
601 |
|
|
540 |
|
Fuel |
|
|
1,763 |
|
|
1,130 |
|
Fuel taxes |
|
|
492 |
|
|
378 |
|
|
|
$ |
54,370 |
|
$ |
25,876 |
22
DASEKE, INC. AND SUBSIDIARIES
NOTES TO CONSOLIDATED FINANCIAL STATEMENTS
(Unaudited)
NOTE 10 – LONG-TERM DEBT
Long-term debt consists of the following at September 30, 2018 and December 31, 2017 (in thousands):
|
|
|
2018 |
|
2017 |
||
|
Line of credit |
|
$ |
15,664 |
|
$ |
4,561 |
|
Term loan facility |
|
|
494,724 |
|
|
498,462 |
|
Equipment term loans |
|
|
156,057 |
|
|
126,227 |
|
Capital leases |
|
|
18,412 |
|
|
5,757 |
|
|
|
|
684,857 |
|
|
635,007 |
|
Less current portion |
|
|
(58,407) |
|
|
(43,056) |
|
Less unamortized debt issuance costs |
|
|
(16,426) |
|
|
(17,650) |
|
Total long-term debt |
|
$ |
610,024 |
|
$ |
574,301 |
Term Loan Facility
In conjunction with the close of the Business Combination on February 27, 2017, the Company entered into the $350.0 million Term Loan Facility under a loan agreement with Credit Suisse AG, Cayman Islands Branch, as administrative agent, and the lenders party thereto. The Term Loan Facility consists of (i) a $250.0 million term loan funded on the closing date of the Term Loan Facility (the Closing Date Term Loan); and (ii) up to $100.0 million of term loans to be funded from time to time under a delayed draw feature that was available until February 27, 2018.
The size of the Term Loan Facility could increase from time to time pursuant to an uncommitted incremental facility in an aggregate amount for all such incremental loans and commitments up to the sum of (a) $65.0 million and (b) an uncapped amount based on the maximum first lien, secured and total leverage ratio-based formulas depending upon the security and ranking of the relevant incremental facility. The proceeds from the Closing Date Term Loan were used to partially refinance certain of the Company’s capital leases, purchase money debt, equipment and real estate financings and to pay transaction costs associated with the Business Combination and refinance the Line of Credit and the Senior Term Loan.
The Term Loan Facility has a scheduled maturity date of February 27, 2024. Term loans under the Term Loan Facility are, at the Company’s election from time to time, comprised of alternate base rate loans (an ABR Borrowing) or adjusted LIBOR loans (a Eurodollar Rate Borrowing), with the applicable margins of interest being an alternate base rate (subject to a 2.00% floor) plus 4.50% per annum through November 28, 2017, amended to 4.00% on that date for ABR Borrowings and LIBOR (subject to a 1.00% floor) plus 5.50% per annum through November 28, 2017, amended to 5.00% on that date for Eurodollar Rate Borrowings. At September 30, 2018, the average interest rate on the Term Loan Facility was 6.9%.
On August 16, 2017, the Company obtained an amendment of the Term Loan Facility that increased the delayed draw incurrence condition relating to pro forma total leverage ratio to 4.25x from 3.5x, effective August 15, 2017 through the maturity of the delayed draw Term Loan Facility in February 2018, which enabled the Company to access $60.5 million from the delayed draw Term Loan Facility.
On November 28, 2017, the Term Loan Facility was amended to provide for a $150.0 million tack-on to the existing Term Loan Facility.
The Term Loan Facility is secured by all assets of the Company, except those assets collateralizing equipment and certain real estate lenders debt and subject to certain customary exceptions.
As amended, on August 16, 2017, the Term Loan Facility contains a financial covenant requiring the Company to maintain a consolidated total leverage ratio as of the last day of any fiscal quarter of less than or equal to 4.25 to 1.00, stepping down to 4.00 to 1.00 on March 31, 2019 and stepping down to 3.75 to 1.00 on March 31, 2021. Additionally, as amended, the Term Loan Facility contains a pro forma total leverage ratio of less than or equal to 4.25 to 1.00 for term loans funded from the delayed draw feature. The consolidated total leverage ratio is defined as the ratio of (i) consolidated total debt minus unrestricted cash and cash equivalents and cash and cash equivalents restricted in favor of the administrative agent and the lenders, to (ii) consolidated adjusted EBITDA for the trailing 12 month period (with customary add-backs permitted to consolidated adjusted EBITDA, including in respect of synergies and cost-savings reasonably identifiable and
23
DASEKE, INC. AND SUBSIDIARIES
NOTES TO CONSOLIDATED FINANCIAL STATEMENTS
(Unaudited)
factually supportable that are anticipated to be realized in an aggregate amount not to exceed 25% of consolidated adjusted EBITDA and subject to other customary limitations).
The Term Loan Facility permits voluntary prepayments of borrowings. In certain circumstances (subject to exceptions, exclusions and, in the case of excess cash flow, step-downs described below), the Company may also be required to make an offer to prepay the Term Loan Facility if it receives proceeds as a result of certain asset sales, debt issuances, casualty or similar events of loss, or if it has excess cash flow (defined as an annual amount calculated using a customary formula based on consolidated adjusted EBITDA, including, among other things, deductions for (i) the amount of certain voluntary prepayments of the Term Loan Facility and (ii) the amount of certain capital expenditures, acquisitions, investments and restricted payments). The percentage of excess cash flow that must be applied as a mandatory prepayment is 50% with respect to the initial excess cash flow period (the fiscal year ending on December 31, 2018) and will be 50%, 25% or 0% for future excess cash flow periods depending upon the first lien leverage ratio.
The Term Loan Facility contains (i) certain customary affirmative covenants that, among other things, require compliance with applicable laws, periodic financial reporting and notices of material events, payment of taxes and other obligations, maintenance of property and insurance, and provision of additional guarantees and collateral, and (ii) certain customary negative covenants that, among other things, restrict the incurrence of additional indebtedness, liens on property, sale and leaseback transactions, investments, mergers, consolidations, liquidations and dissolutions, asset sales, acquisitions, the payment of distributions, dividends, redemptions and repurchases of equity interests, transactions with affiliates, prepayments and redemptions of certain other indebtedness, burdensome agreements, holding company limitations, changes in fiscal year and modifications of organizational documents.
ABL Facility
Also, in conjunction with the Closing on February 27, 2017, the Company entered into a five-year, senior secured asset-based revolving line of credit with an aggregate maximum credit amount equal to $70.0 million, amended on June 15, 2018 to $100.0 million (subject to availability under a borrowing base equal to 85% of the Company’s eligible accounts receivable, 80% of the Company’s eligible unbilled accounts receivable and 50% of parts supplies) under a credit agreement with PNC Bank, National Association, as administrative agent and the lenders party thereto. As amended on June 15, 2018, the ABL Facility’s maximum credit amount was increased by $30.0 million pursuant to an uncommitted accordion. The ABL Facility also provides for the issuance of letters of credit subject to certain restrictions and a sublimit of $20 million, as defined in the credit agreement. The ABL Facility matures on February 27, 2022. As of September 30, 2018, the Company had borrowings of $15.7 million, $10.1 million in letters of credit outstanding, and could incur approximately $83.3 million of additional indebtedness under the ABL Facility.
Borrowings under the ABL Facility bear interest at rates based upon the Company’s fixed charge coverage ratio and, at the Company’s election from time to time, either a base rate plus an applicable margin or an adjusted LIBOR rate plus an applicable margin. Margins on the ABL Facility are adjusted, if necessary to the applicable rates set forth in the following table corresponding to the fixed charge coverage ratio for the trailing 12 month period on the last day of the most recently completed fiscal quarter.
|
Fixed Charge Coverage Ratio |
|
Base Rate Margins |
|
LIBOR Rate Margins |
|
|
Less than 1.25 to 1.00 |
|
2.25 |
% |
3.25 |
% |
|
Greater than or equal to 1.25 to 1.00, but less than 1.50 to 1.00 |
|
1.75 |
% |
2.75 |
% |
|
Greater than or equal to 1.50 to 1.00, but less than 1.75 to 1.00 |
|
1.25 |
% |
2.25 |
% |
|
Greater than or equal to 1.75 to 1.00 |
|
0.75 |
% |
1.75 |
% |
The ABL Facility was amended on June 15, 2018, to adjust margins, if necessary, on the ABL Facility beginning in the fiscal quarter ended September 30, 2018, to the applicable rates set forth in the following table corresponding to the average RLOC Utilization for the trailing 12 month period on the last day of the most recently completed fiscal quarter. RLOC Utilization at a particular date shall mean an amount equal to (a)(i) outstanding amount of Revolving Advances plus (ii) the outstanding amount of the Swing Loans plus (iii) the aggregate Maximum Undrawn Amount of all outstanding Letters of Credit, divided by (b) Maximum Revolving Advance Amount.
|
RLOC Utilization |
|
Base Rate Margins |
|
LIBOR Rate Margins |
|
|
Less than 33.3% |
|
0.50 |
% |
1.50 |
% |
|
Greater than or equal to 33.3%, but less than 66.6% |
|
0.75 |
% |
1.75 |
% |
|
Greater than or equal to 66.6% |
|
1.00 |
% |
2.00 |
% |
24
DASEKE, INC. AND SUBSIDIARIES
NOTES TO CONSOLIDATED FINANCIAL STATEMENTS
(Unaudited)
At September 30, 2018, the interest rate on the ABL Facility was 6.00%.
The ABL Facility is secured by all of the Company’s U.S.-based accounts receivable, parts supplies, cash and cash equivalents excluding proceeds of Term Loan Facility, securities and deposit accounts and other general assets not included in the Term Loan Facility collateral.
The ABL Facility contains (i) a financial covenant similar to the consolidated total leverage ratio required under the Term Loan Facility (but, as amended on August 31, 2017, in any event requiring a leverage ratio of less than or equal to 4.25 to 1.00 for the fiscal quarter, stepping down to 3.75 to 1.00 on March 31, 2021, in the same increments as the Term Loan Facility noted above) and (ii) during any period after a default or event of default or after excess availability falling below the greater of (x) $15.0 million and (y) 20% of the maximum credit amount, continuing until such time as no default or event of default has existed and excess availability has exceeded such amounts for a period of 60 consecutive days, a financial covenant requiring the Company to maintain a minimum consolidated fixed charge coverage ratio of 1.00x, tested on a quarterly basis. The Company’s fixed charge coverage ratio is defined as the ratio of (1) consolidated adjusted EBITDA minus unfinanced capital expenditures, cash taxes and cash dividends or distributions, to (2) the sum of all funded debt payments for the four-quarter period then ending (with customary add-backs permitted to consolidated adjusted EBITDA).
The ABL Facility contains affirmative and negative covenants similar to those in the Term Loan Facility, together with such additional terms as are customary for a senior secured asset-based revolving credit facility.
As of September 30, 2018, the Company was in compliance with all covenants contained in the Term Loan and ABL Facilities.
Equipment Term Loans and Mortgages
As of September 30, 2018, the Company had term loans collateralized by equipment in the aggregate amount of $152.0 million with 37 lenders (Equipment Term Loans). The Equipment Term Loans bear interest at rates ranging from 1.4% to 10.8%, require monthly payments of principal and interest and mature at various dates through January 2028. Certain of the Equipment Term Loans contain conditions, covenants, representations and warranties, events of default, and indemnification provisions applicable to the Company and certain of its subsidiaries that are customary for equipment financings, including, but not limited to, limitations on the incurrence of additional debt and the prepayment of existing indebtedness, certain payments (including dividends and other distributions to persons not party to its credit facility) and transfers of assets.
As of September 30, 2018, the Company has a bank mortgage loan with a balance of $3.5 million incurred to finance the construction of the headquarters and terminal in Redmond, Oregon. The mortgage loan is collateralized by such property and buildings. The mortgage is payable in monthly installments of $15,776, including interest at 3.7% through November 2020.
The interest rate and monthly payments will be adjusted on November 1, 2020 to a rate of 2.5%, plus the three-year advance rate published by the Federal Home Loan Bank of Seattle in effect 45 days prior to November 1, 2020 (which will not be less than 3.7%). The bank mortgage loan matures November 1, 2023.
25
DASEKE, INC. AND SUBSIDIARIES
NOTES TO CONSOLIDATED FINANCIAL STATEMENTS
(Unaudited)
Real Estate Term Loan
In April 2016, the Company refinanced $14.2 million of its Line of Credit with bank debt (Real Estate Term Loan) utilizing nine wholly-owned real estate assets which previously served as collateral on the PNC Term Loan. The Real Estate Term Loan was subordinate to the PNC Credit Agreement and Equipment Term Loans and was due in monthly installments of $59,109 (based on 20 year amortization schedule), plus applicable interest at either (a) the Libor Rate (as defined in the loan agreement), plus a margin of 2.75%, or (b) the Default Rate (as defined in the loan agreement). The Company incurred debt issuance costs of $0.4 million, which were being amortized to interest expense over five years using the straight-line method. In conjunction with the Business Combination, the Real Estate Term Loan was repaid and all unamortized debt issuance costs written off to interest expense. See Note 3 for additional details on the Business Combination.
Capital Leases
The Company leases certain equipment under long-term capital lease agreements that expire on various dates through May 2025. As of September 30, 2018 and December 31, 2017, the book value of the property and equipment recorded under capital leases was $18.2 million and $7.0 million, net of accumulated depreciation of $7.1 million and $5.8 million, respectively. Depreciation expense related to lease equipment was $0.8 million and $0.6 million for the three months ended September 30, 2018 and 2017, respectively, and $2.2 million and $1.8 million for the nine months ended September 30, 2018 and 2017, respectively.
Main Street Capital Corporation
In 2013, Main Street Capital Corporation (Main Street) loaned the Company $20.0 million under a senior subordinated secured term loan (the Main Street Loan). The Main Street Loan was subordinate to the PNC Credit Agreement and Equipment Term Loans. Interest payments were due monthly through maturity at the rate of 12% per annum. Paid-in kind (PIK) interest, at a rate of 2.5% per annum, could have been paid monthly or accrued and added to the principal balance quarterly, at the option of the Company. For the nine months ended September 30, 2017, $0.1 million of accrued PIK interest was added to the principal balance. In conjunction with Business Combination, the Main Street Loan was repaid in February 2017. See Note 3 for additional details on the Business Combination.
Prudential Capital Partners
In 2013, the Company issued senior secured subordinated promissory notes in the initial aggregate principal amount of $20.0 million (PCP Subordinated Notes) to Prudential Capital Partners IV, L.P., Prudential Capital Partners (Parallel Fund) IV, L.P. and Prudential Capital Partners Management Fund IV, L.P. (collectively, the PCP Investors) pursuant to the Securities Purchase Agreement, dated as of November 12, 2013, by and among the Company, certain of its subsidiaries and the PCP Investors. The PCP Subordinated Notes were subordinate to the PNC Credit Agreement and Equipment Term Loans. Interest payments were due monthly through maturity at the rate of 12% per annum. PIK interest, at a rate of 2.5% per annum, could have been paid monthly or accrued and added to the principal balance quarterly, at the option of the Company. For the nine months ended September 30, 2017, $0.1 million of accrued PIK interest was added to the principal balance. In conjunction with Business Combination, the PCP Subordinated Notes were repaid in February 2017. See Note 3 for additional details on the Business Combination.
The Main Street Loan and the PCP Subordinated Notes (Subordinated Debt) were collateralized by all assets of the Company, except those assets collateralizing the Equipment Term Loans. The Main Street Loan and the PCP Subordinated Notes contained certain financial covenants, including a minimum fixed charge coverage ratio, a senior secured debt to consolidated EBITDA ratio and a funded debt to consolidated EBITDA ratio. Additionally, they contained negative covenants limiting, among other things, additional indebtedness, capital expenditures, transactions with affiliates, additional liens, sales of assets, dividends, investments and advances, prepayments of debt, mergers and acquisitions, and other matters customarily restricted in such agreements. The Main Street Loan and the PCP Subordinated Notes were subject to a make-whole payment of 5.0% of the prepayment amount if such prepayment was made before the third anniversary of the agreements.
LST Seller
As part of the consideration paid to the seller of Lone Star Transportation, LLC and affiliates (LST), Daseke Lone Star, Inc. (a subsidiary of the Company) issued $22.0 million of subordinated notes (the LST Seller Notes). The LST Seller Notes bore interest at 10% payable monthly and were subordinate to the PNC Credit Agreement, Main Street Loan and PCP Subordinated Notes. In conjunction with the Business Combination, the LST Seller Notes were repaid in February 2017. See Note 3 for additional details on the Business Combination.
26
DASEKE, INC. AND SUBSIDIARIES
NOTES TO CONSOLIDATED FINANCIAL STATEMENTS
(Unaudited)
DTR Sellers
As part of the consideration paid to the sellers of Davenport Transport & Rigging, LLC, LST issued $1.0 million of subordinated notes (the DTR Seller Notes). The DTR Seller Notes bore interest at 5% payable monthly and were subordinate to the PNC Credit Agreement, Main Street Loan and PCP Subordinated Notes. In conjunction with Business Combination, the DTR Seller Notes were repaid in February 2017. See Note 3 for additional details on the Business Combination.
BHE Sellers
As part of the consideration paid to the sellers of Bulldog Hiway Express (BHE), the Company issued $2.0 million of subordinated notes (the BHE Seller Notes). The BHE Seller Notes bore interest at 7% payable monthly. On December 19, 2016, a portion of the outstanding principal amount under the BHE Seller Notes was forgiven in exchange for the payment by the Company of certain pension liabilities of BHE. The BHE Seller Notes were subordinate to the PNC Credit Agreement and the Main Street Loan and the PCP Subordinated Notes. In conjunction with Business Combination, the BHE Seller Notes were repaid in February 2017. See Note 3 for additional details on the Business Combination.
Future Payments
Future principal payments on long-term debt as of September 30, 2018 are as follows (in thousands):
|
|
|
Line Of Credit |
|
Term Loan Facility |
|
Equipment Term Loans |
|
Capital |
|
Total |
|||||
|
|
|
|
|
|
|
|
|
|
|
|
|
|
|
|
|
|
2018 |
|
$ |
— |
|
$ |
4,985 |
|
$ |
48,602 |
|
$ |
6,257 |
|
$ |
59,844 |
|
2019 |
|
|
— |
|
|
2,500 |
|
|
40,168 |
|
|
4,998 |
|
|
47,666 |
|
2020 |
|
|
— |
|
|
2,500 |
|
|
28,191 |
|
|
3,581 |
|
|
34,272 |
|
2021 |
|
|
— |
|
|
2,500 |
|
|
20,812 |
|
|
2,387 |
|
|
25,699 |
|
2022 |
|
|
15,664 |
|
|
2,500 |
|
|
9,047 |
|
|
1,439 |
|
|
28,650 |
|
Thereafter |
|
|
— |
|
|
479,739 |
|
|
9,237 |
|
|
765 |
|
|
489,741 |
|
|
|
|
|
|
|
|
|
|
|
|
|
|
|
|
|
|
Total minimum lease payments |
|
|
|
|
|
|
|
|
|
|
|
19,427 |
|
|
|
|
Loan amount attributable to interest |
|
|
|
|
|
|
|
|
|
|
|
(1,015) |
|
|
(1,015) |
|
|
|
|
|
|
|
|
|
|
|
|
|
|
|
|
|
|
Total (Present value of minimum lease payments on capital leases) |
|
$ |
15,664 |
|
$ |
494,724 |
|
$ |
156,057 |
|
|
18,412 |
|
$ |
684,857 |
|
Less current portion |
|
|
|
|
|
|
|
|
|
|
|
(4,820) |
|
|
|
|
Long-term capital leases |
|
|
|
|
|
|
|
|
|
|
$ |
13,592 |
|
|
|
|
|
|
|
|
|
|
|
|
|
|
|
|
|
|
|
|
NOTE 11 – INCOME TAXES
The effective tax rates for the three months ended September 30, 2018 and 2017 were 23.5% and 101.8%, respectively, and (2,333.6%) and 22.6% for the nine months ended September 30, 2018 and 2017, respectively. The increase is primarily the result of recognized deferred tax liabilities for final valuations of intangible assets related to the December 2017 acquisitions and then remeasured using the Tax Cuts and Jobs Act (TCJA) rates, which resulted in the recognition of an approximately $14.0 million deferred tax benefit during the nine months ended September 30, 2018. Differences between the Company’s effective tax rate and the federal statutory rate also result from state income taxes and nondeductible expenses, including the effect of the per diem pay structure for drivers and transaction expenses. Additionally, difference in the effective tax rate in 2018 compared to 2017 are also the result of the change in the federal tax rate from 35% to 21% applied to pre-tax book income and increased by permanent items in 2018 compared to a pre-tax book loss offset by permanent items in 2017.
On December 22, 2017, the U.S. government enacted the TCJA comprehensive tax reform legislation. Effective January 2018, the TCJA, among other things, reduces the marginal U.S. corporate income tax rate from 35% to 21%, limits the deductibility of interest expenses, limits the deduction for net operating losses, eliminates net operating loss carrybacks and modifies or eliminates many business deductions
27
DASEKE, INC. AND SUBSIDIARIES
NOTES TO CONSOLIDATED FINANCIAL STATEMENTS
(Unaudited)
and credits. The TCJA also includes international provisions, which generally establish a territorial-style system for taxing foreign source income of domestic multinational corporations and imposes a mandatory one-time transition tax on undistributed international earnings.
For year-end 2017, the Company recorded provisional amounts for the impacts of the new tax law including: the re-measurement of deferred tax assets and liabilities, estimated stock compensation and 162(m) limitations and unremitted foreign earnings. The Company considers it likely that further technical guidance regarding certain components of the new provisions included in the TCJA, as well as clarity regarding state income tax conformity to current federal tax code, may be issued.
There were no changes in uncertain tax positions during the nine months ended September 30, 2018.
NOTE 12 – STOCKHOLDERS’ EQUITY
Common Stock
Common stock has voting rights – one vote for each share of common stock.
On September 19, 2017, the Company and certain stockholders of the Company entered into an underwriting agreement with Stifel, Nicolaus & Company, Incorporated and Cowen and Company, LLC, as representatives of the several underwriters named therein, in connection with an underwritten public offering of 5,292,000 shares of the Company’s common stock, at a price to the public of $12.00 per share. Pursuant to the Underwriting Agreement, the Company granted the underwriters a 30-day option to purchase up to an additional 793,800 shares of common stock, which was exercised in full on September 20, 2017 and closed simultaneously with the offering on September 22, 2017. Net proceeds received by the Company were approximately $63.6 million, after deducting underwriting discounts and commissions and estimated offering expenses payable by the Company. The Company used the net proceeds from the Offering for general corporate purposes, including, among other things, working capital, capital expenditures, debt repayment or refinancing or the financing of possible future acquisitions.
On February 14, 2018, the Company and one of the Company’s stockholders entered into an underwriting agreement with Cowen and Company, LLC and Stifel, Nicolaus & Company, Incorporated, as representatives of the several underwriters named therein, in connection with an underwritten public offering of 7,500,000 shares of the Company’s common stock, at a price to the public of $10.60 per share. Pursuant to the underwriting agreement, the Company granted the underwriters a 30-day option to purchase up to an additional 1,125,000 shares of common stock, which was exercised in full on February 16, 2018 and closed simultaneously with the offering on February 20, 2018. Net proceeds received by the Company were approximately $84.6 million, after deducting underwriting discounts and commissions and estimated offering expenses payable by the Company. The Company has used and intends to continue to use the net proceeds from the offering for general corporate purposes, including, among other things, working capital, capital expenditures, debt repayment or refinancing or the financing of possible future acquisitions.
On June 1, 2018, after having met the earnout provisions contained in the Merger Agreement, the Company issued 5,000,000 shares of the Company’s common stock, par value $0.0001 per share, pro rata among the Private Daseke Stockholders (Earnout Shares).
The Earnout Shares were issued in reliance upon an exemption from the registration requirements of the Securities Act of 1933, as amended (the Securities Act), pursuant to Section 4(a)(2) thereof, which exempts transactions by an issuer not involving any public offering on the basis that the securities were offered and sold in a non-public offering to “accredited investors” (as defined in Rule 501(a) of Regulation D under the Securities Act). Private Daseke engaged a purchaser representative to serve as the purchaser representative for two Private Daseke Stockholders who were not “accredited investors,” which purchaser representative met all of the conditions set forth in Rule 501(i) of Regulation D, as required to comply with applicable federal securities laws in connection with the issuance of shares of the Company’s common stock to these two Private Daseke Stockholders pursuant to the Merger Agreement.
On June 6, 2018, as part of the consideration paid for the Aveda acquisition, the Company issued 1,612,979 shares of Daseke common stock valued at $15.4 million. See Note 4 for additional details about the Aveda acquisition.
28
DASEKE, INC. AND SUBSIDIARIES
NOTES TO CONSOLIDATED FINANCIAL STATEMENTS
(Unaudited)
On July 1, 2018, as part of the consideration paid for the Kelsey Trail acquisition, the Company issued 95,859 shares of Daseke common stock valued at $0.9 million. See Note 4 for additional details about the Kelsey Trail acquisition.
On August 1, 2018, as part of the consideration paid for the Builders acquisition, the Company issued 399,530 shares of Daseke common stock valued at $3.4 million. See Note 4 for additional details about the Builders acquisition.
As of September 30, 2018, the Company has approximately 1.5 million shares of common stock reserved for future issuances of stock options and restricted stock units under the Company’s 2017 Omnibus Incentive Plan. See Note 13 for additional details about the Company’s stock-based compensation plan.
Preferred Stock
At the Closing, the Company issued 650,000 shares of Series A Preferred Stock for cash of $65.0 million. Proceeds from the sales were part of the consideration received as part of a recapitalization and reverse acquisition completed in the Business Combination. See Note 3 for additional details about the Business Combination. The par value of Series A Preferred Stock is $0.0001 per share. Additional features of this preferred stock are as follows:
Under the Certificate of Designations, Preferences, Rights and Limitations of the Series A Preferred Stock (the Certificate of Designations), each share of Series A Preferred Stock will be convertible, at the holder’s option at any time, initially into approximately 8.6957 shares of the Company’s common stock (assuming a conversion price of approximately $11.50 per share), subject to specified adjustments as set forth in the Certificate of Designations. If any holder elects to convert its Series A Preferred Stock after the seven-year anniversary of the issue date, if the then-current Conversion Price (as defined in the Certificate of Designations) exceeds the Weighted Average Price (as defined in the Certificate of Designations) for the common stock during any ten consecutive Trading Days (as defined in the Certificate of Designations), at its option by delivery of a Notice of Conversion in accordance with Section 8(b) of the Certificate of Designations no later than five business days following such tenth consecutive Trading Day, to convert any or all of such holder’s shares of Series A Preferred Stock into, at the Company’s sole discretion, either common stock, cash or a combination of common stock and cash; provided, that the Company shall provide such converting holder notice of its election within two Trading Days of receipt of the Notice of Conversion; provided further, that in the event the Company elects to issue common stock for all or a portion of such conversion, the Conversion Rate for such conversion (subject to the limitations set forth in Section 11 of the Certificate of Designations) shall mean the quotient of the Liquidation Preference (as defined in the Certificate of Designations) divided by the average Weighted Average Price for the common stock during the 20 consecutive Trading Days commencing on the Trading Day immediately following the Trading Day on which the Company provided such notice. If the Company does not elect a settlement method prior to the deadline set forth in the Certificate of Designations, the Company shall be deemed to have elected to settle the conversion entirely in common stock. Based on the assumed conversion rate, a total of 5,652,173 shares of common stock would be issuable upon conversion of all of the currently outstanding shares of Series A Preferred Stock.
On or after the third anniversary of the initial issuance date but prior to the fifth anniversary of the initial issuance date, the Company will have the right, at its option, to give notice of its election to cause all outstanding shares of the Series A Preferred Stock to be automatically converted into shares of the Company’s common stock at the then-effective conversion rate, if the Weighted Average Price of Company’s common stock equals or exceeds 140% of the then-current conversion price for at least 20-trading days (whether or not consecutive) in a period of 30 consecutive trading days. On or after the fifth anniversary of the initial issuance date but prior to the seventh anniversary of the initial issuance date, the Company will have the right, at its option, to give notice of its election to cause all outstanding shares of the Series A Preferred Stock to be automatically converted into shares of Company’s common stock at the then-effective conversion rate, if the Weighted Average Price of Company’s common stock equals or exceeds 115% of the then-current conversion price for at least 20-trading days (whether or not consecutive) in a period of 30 consecutive trading days. On or after the seventh anniversary of the initial issuance date, the Company will have the right, at its option, to give notice of its election to cause all outstanding shares of the Series A Preferred Stock to be automatically converted into shares of Company’s common stock at the then-effective conversion rate, if the Weighted Average Price of Company’s common stock equals or exceeds the then-current conversion price for at least 10 consecutive trading days. If the Company undergoes certain fundamental changes (as more fully described in the Certificate of Designations but including, among other things, certain change-in-control transactions, recapitalizations, asset sales and liquidation events), each outstanding share of Series A Preferred Stock may, within 15 days following the effective date of such fundamental change and at the election of the holder, be converted into Company’s common stock at a conversion rate (subject to certain adjustments) equal to (i) the greater of (A) the sum of the conversion rate on the effective date of such fundamental change plus the additional shares received by holders of Series A Preferred Stock following such fundamental change (as set forth in the Certificate of Designations) and (B) the quotient of (x) $100.00, divided by (y) the greater of (1) the applicable holder stock price and (2) 66 2/3% of the closing sale price of the Company’s common stock on the issue date plus (ii) the number
29
DASEKE, INC. AND SUBSIDIARIES
NOTES TO CONSOLIDATED FINANCIAL STATEMENTS
(Unaudited)
of shares of Company’s common stock that would be issued if any and all accumulated and unpaid dividends were paid in shares of Company’s common stock.
The Series A Preferred Stock contains limitations that prevent the holders thereof from acquiring shares of the Company’s common stock upon conversion that would result in (i) the number of shares beneficially owned by such holder and its affiliates exceeding 9.99% of the total number of shares of the Company’s common stock then outstanding or (ii) the Series A Preferred Stock being converted into more than 19.99% of the shares of the Company’s common stock outstanding on the initial issue date of the Series A Preferred Stock (subject to appropriate adjustment in the event of a stock split, stock dividend, combination or other similar recapitalization) without, in the latter instance, stockholder approval of such issuance.
Additional features of the Series A Preferred Stock are as follows:
|
a. |
Liquidation – In the event of liquidation, holders of Series A Preferred Stock have preferential rights to liquidation payments over holders of common stock. Holders of Series A Preferred Stock shall be paid out of the assets of the Company at an amount equal to $100 per share plus all accumulated and unpaid dividends. |
|
b. |
Dividends – Dividends on the Series A Preferred Stock are cumulative at the Dividend Rate. The “Dividend Rate” is the rate per annum of 7.625% per share of Series A Preferred Stock on the liquidation preference ($100 per share). Dividends are payable quarterly in arrears in cash or, at the Company’s election and subject to the receipt of the necessary shareholder approval (to the extent necessary), in shares of the Company’s common stock. The Company’s board of directors declared quarterly dividends of $0.68 per share on April 24, 2017, and $1.91 per share on July 18, 2017, which were both then paid on July 28, 2017. On February 27, 2018 the Company’s board of directors declared a quarterly dividend of $1.91 per share, which was paid on March 15, 2018. On May 22, 2018, the Company’s board of directors declared a second quarterly dividend of $1.91 per share, which was paid on June 20, 2018. On August 21, 2018 the Company’s board of directors declared a third quarterly dividend of $1.91 per share, which was paid on September 14, 2018. |
|
c. |
Voting rights – Except as required by Delaware law, holders of the Series A Preferred Stock will have no voting rights except with respect to the approval of any material and adverse amendment to the Company’s certificate of incorporation, and certain significant holders of Series A Preferred Stock may have approval rights with respect to certain key economic terms of the Series A Preferred Stock, as set forth in the Certificate of Designations. |
In February 2017, in connection with, and immediately prior to, the Closing, 64,500 shares of issued and outstanding Series B Preferred Stock were converted into 9,301,150 shares of Private Daseke’s common stock. Private Daseke’s board of directors had declared a quarterly dividend on the Series B Preferred Stock of $12.50 per share on February 21, 2017, which was paid on February 27, 2017.
Warrants
At September 30, 2018, there were a total of 35,040,658 warrants outstanding to purchase 17,520,329 shares of the Company’s common stock.
Hennessy has issued warrants to purchase its common stock which were originally issued as part of units in the IPO (the Public Warrants). There are 19,959,902 Public Warrants outstanding. Hennessy has also issued 15,080,756 warrants (the Private Placement Warrants) to Sponsor in a private placement that closed simultaneously with the consummation of the IPO.
Each warrant entitles the registered holder to purchase one-half of one share of the Company’s common stock at a price of $5.75 per one-half of one share ($11.50 per whole share), subject to adjustment. The warrants may be exercised only for a whole number of shares of the Company’s common stock. No fractional shares will be issued upon exercise of the warrants. The warrants will expire on February 27, 2022, five years after the completion of the Business Combination, or earlier upon redemption or liquidation. The warrants are listed on the NASDAQ market under the symbol DSKEW.
The Company may call the Public Warrants for redemption at a price of $0.01 per warrant if, and only if, the reported last sale price of the Company’s common stock equals or exceeds $24.00 per share for any 20-trading days within a 30-trading day period ending on the third trading day prior to the date the Company sends the notice of redemption to the Public Warrant holders.
30
DASEKE, INC. AND SUBSIDIARIES
NOTES TO CONSOLIDATED FINANCIAL STATEMENTS
(Unaudited)
NOTE 13 – STOCK-BASED COMPENSATION
On February 27, 2017, the Company and Hennessy’s common stockholders approved the 2017 Omnibus Incentive Plan (the Plan), whereby the Company may grant awards of stock options, stock appreciation rights, restricted stock, restricted stock units, other stock-based awards and performance awards. Under the Plan, the Company is authorized to issue up to 4.5 million shares of common stock. All awards granted were authorized under the Plan.
Stock Options
The following table summarizes stock option grants under the Plan from February 27, 2017 through September 30, 2018:
|
Grantee Type |
|
# of |
|
Issued and |
|
Vesting |
|
Weighted |
|
Weighted Average |
||
|
|
|
|
|
|
|
|
|
|
|
|
|
|
|
Director Group |
|
150,000 |
|
145,000 |
|
5 years |
|
$ |
9.98 |
|
$ |
632,200 |
|
Employee Group |
|
1,806,590 |
|
1,734,401 |
|
5 years |
|
$ |
10.50 |
|
$ |
7,908,869 |
|
Total |
|
|
|
1,879,401 |
|
|
|
|
|
|
|
|
The Company’s calculations of the fair value of stock options granted through September 30, 2018 were made using the Black-Scholes option-pricing model. The fair value of the Company’s stock option grants was estimated utilizing the following assumptions as of September 30, 2018:
|
Weighted average expected life |
|
6.5 years |
|
Risk-free interest rate |
|
2.28% to 2.77% |
|
Expected volatility |
|
36.7% to 39.9% |
|
Expected dividend yield |
|
0.00% |
Since the Company does not have a sufficient history of exercise behavior, expected term is calculated using the assumption that the options will be exercised ratably from the date of vesting to the end of the contractual term for each vesting tranche of awards. Risk-free interest rate is based on the U.S. Treasury yield curve for the period of the expected term of the stock option. Expected volatility is calculated using an index of publicly traded peer companies.
A summary of option activity under the Plan as of September 30, 2018 and changes during the nine months then ended are as follows:
|
|
|
Shares |
|
Weighted |
|
Weighted |
|
Aggregate |
||
|
Outstanding as of January 1, 2018 |
|
1,655,995 |
|
$ |
10.36 |
|
9.3 |
|
$ |
6,505 |
|
Granted |
|
291,595 |
|
|
11.03 |
|
10.0 |
|
|
— |
|
Exercised |
|
(5,000) |
|
|
9.98 |
|
— |
|
|
— |
|
Forfeited or expired |
|
(63,189) |
|
|
10.45 |
|
— |
|
|
— |
|
Outstanding as of September 30, 2018 |
|
1,879,401 |
|
|
10.46 |
|
8.7 |
|
|
— |
|
|
|
|
|
|
|
|
|
|
|
|
|
Exercisable as of September 30, 2018 |
|
283,395 |
|
$ |
9.99 |
|
8.4 |
|
$ |
— |
The stock options’ maximum contract term is ten years.
31
DASEKE, INC. AND SUBSIDIARIES
NOTES TO CONSOLIDATED FINANCIAL STATEMENTS
(Unaudited)
Restricted Stock Units
Restricted stock units are nontransferable until vested and the holders are entitled to receive dividends with respect to the non-vested units. Prior to vesting, the grantees of restricted stock units are not entitled to vote the shares. Restricted stock unit awards vest in equal annual increments over the vesting period.
The following table summarizes restricted stock unit grants under the Plan from June 1, 2017 through September 30, 2018:
|
Grantee Type |
|
# of |
|
Issued and Outstanding |
|
Vesting |
|
Grant Date |
|
|
|
|
|
|
|
|
|
|
|
|
|
Employee Group |
|
1,600,883 |
|
956,910 |
|
5 years |
|
$ |
16,921,333 |
All stock-based compensation cost is measured at the grant date, based on the estimated fair value of the award, and is recognized on a straight-line basis as expense over the employees’ requisite service period. Forfeitures are recorded as a cumulative adjustment to stock-based compensation expense in the period forfeitures occur.
A summary of restricted stock unit awards activity under the Plan as of September 30, 2018 and changes during the nine months then ended are as follows:
|
|
|
Units |
|
Weighted |
|
|
|
|
|
|
|
|
|
Outstanding as of January 1, 2018 |
|
763,591 |
|
$ |
9.98 |
|
Granted |
|
592,015 |
|
|
11.57 |
|
Exercised |
|
(114,136) |
|
|
9.50 |
|
Forfeited |
|
(284,560) |
|
|
11.49 |
|
Outstanding as of September 30, 2018 |
|
956,910 |
|
$ |
10.57 |
Aggregate stock-based compensation expense, net of forfeitures, was $0.9 million and $0.7 million during the three months ended September 30, 2018 and 2017, respectively, and $2.7 million and $1.2 million during the nine months ended September 30, 2018 and 2017, respectively. These expenses are included as a component of salaries, wages and employee benefits in the accompanying consolidated statements of operations and comprehensive income (loss). As of September 30, 2018, there was $6.2 million and $9.0 million of unrecognized stock-based compensation expense related to stock options and restricted stock units, respectively. This expense will be recognized over the weighted average periods of 3.7 years for stock options and 4.0 years for restricted stock units.
NOTE 14 – DEFINED CONTRIBUTION PLAN
On January 1, 2015, the Company established the Daseke, Inc. 401(k) Retirement Plan (the Retirement Plan). The Retirement Plan is a defined contribution plan and intended to qualify under The Employee Retirement Income Security Act of 1974 (ERISA) provisions of 401(k). Under the safe harbor matching requirements, the Company had expenses of $0.9 million and $0.6 million for the three months ended September 30, 2018 and 2017, respectively and $2.8 million and $1.8 million for the nine months ended September 30, 2018 and 2017, respectively. The Company sponsors defined contribution profit-sharing plans, including 401(k) provisions for substantially all employees of acquired companies whose plans have not been merged into the Retirement Plan at September 30, 2018. Matching contributions for 401(k) defined contribution plans not yet merged into the Retirement Plan totaled approximately $0.1 million and $0.3 million for the three and nine months ended September 30, 2018, respectively, and $47,000 for both the three or nine months ended September 30, 2017.
32
DASEKE, INC. AND SUBSIDIARIES
NOTES TO CONSOLIDATED FINANCIAL STATEMENTS
(Unaudited)
NOTE 15 – COMMITMENTS AND CONTINGENCIES
Operating Leases
The Company leases certain office building facilities, terminal locations and revenue equipment under non-cancelable operating leases. Certain of the Company’s operating lease agreements contain provisions for future rent increases, free rent periods or periods in which rent payments are reduced (abated). The total amount of rent payments due over the lease terms are charged to rent expense on the straight-line, undiscounted method over the lease terms. Building and terminal rent expense under operating leases was $3.9 million and $2.1 million for the three months ended September 30, 2018 and 2017, respectively, and $9.6 million and $4.5 million for the nine months ended September 30, 2018 and 2017, respectively. Tractor, trailer and other revenue equipment rent expense under operating leases was $5.8 million and $4.7 million for the three months ended September 30, 2018 and 2017, respectively, and $14.8 million and $12.7. million for the nine months ended September 30, 2018 and 2017, respectively.
Letters of Credit
The Company had outstanding letters of credit at September 30, 2018 totaling approximately $12.0 million, including those disclosed in Note 10. These letters of credit are related to liability and workers compensation insurance claims.
Contingencies
The Company is involved in certain claims and pending litigation arising in the normal course of business. These proceedings primarily involve claims for personal injury or property damage incurred in the transportation of freight or for personnel matters. The Company maintains liability insurance to cover liabilities arising from these matters but is responsible to pay self-insurance and deductibles on such matters up to a certain threshold before the insurance is applied.
NOTE 16 – REPORTABLE SEGMENTS
The Company evaluates the performance of the segments primarily based on their respective revenues and operating income. Accordingly, interest expense and other non-operating items are not reported in segment results. In addition, the Company has disclosed a corporate segment, which is not an operating segment and includes acquisition transaction expenses, corporate salaries, interest expense and other corporate administrative expenses and intersegment eliminations.
The Company’s operating segments also provide transportation and related services for one another. Such services are generally billed at cost, and no profit is earned. Such intersegment revenues and expenses are eliminated in the Company’s consolidated results. Intersegment revenues and expenses for the Flatbed Solutions segment totaled $1.1 million and $0.7 million for the three months ended September 30, 2018 and 2017, respectively, and $3.2 million and $2.4 million for the nine months ended September 30, 2018 and 2017, respectively. Intersegment revenues and expenses for the Specialized Solutions segment totaled $2.6 million and $1.2 million for the three months ended September 30, 2018 and 2017, respectively, and $6.5 million and $2.6 million for the nine months ended September 30, 2018 and 2017, respectively.
33
DASEKE, INC. AND SUBSIDIARIES
NOTES TO CONSOLIDATED FINANCIAL STATEMENTS
(Unaudited)
The following tables reflect certain financial data of the Company’s reportable segments for the three and nine months ended September 30, 2018 and 2017 (in thousands):
|
|
|
Flatbed |
|
Specialized |
|
|
|
|
|
|
||
|
|
|
Solutions |
|
Solutions |
|
Corporate/ |
|
Consolidated |
||||
|
|
|
Segment |
|
Segment |
|
Eliminations |
|
Total |
||||
|
Three Months Ended September 30, 2018 |
|
|
|
|
|
|
|
|
|
|
|
|
|
Total revenue |
|
$ |
181,494 |
|
$ |
283,891 |
|
$ |
(3,796) |
|
$ |
461,589 |
|
Operating income (loss) |
|
|
12,230 |
|
|
11,815 |
|
|
(10,128) |
|
|
13,917 |
|
Depreciation |
|
|
7,751 |
|
|
24,981 |
|
|
25 |
|
|
32,757 |
|
Amortization of intangible assets |
|
|
1,450 |
|
|
2,593 |
|
|
— |
|
|
4,043 |
|
Interest expense |
|
|
2,206 |
|
|
2,898 |
|
|
6,735 |
|
|
11,839 |
|
Income (loss) before income tax |
|
|
10,122 |
|
|
9,481 |
|
|
(16,752) |
|
|
2,851 |
|
Total assets |
|
|
474,218 |
|
|
906,562 |
|
|
25,754 |
|
|
1,406,534 |
|
Net capital expenditures |
|
|
8,531 |
|
|
40,709 |
|
|
658 |
|
|
49,898 |
|
|
|
|
|
|
|
|
|
|
|
|
|
|
|
Three Months Ended September 30, 2017 |
|
|
|
|
|
|
|
|
|
|
|
|
|
Total revenue |
|
$ |
85,592 |
|
$ |
147,631 |
|
$ |
(1,901) |
|
$ |
231,322 |
|
Operating income (loss) |
|
|
4,755 |
|
|
7,159 |
|
|
(6,210) |
|
|
5,704 |
|
Depreciation |
|
|
6,713 |
|
|
11,290 |
|
|
37 |
|
|
18,040 |
|
Amortization of intangible assets |
|
|
437 |
|
|
1,328 |
|
|
— |
|
|
1,765 |
|
Interest expense |
|
|
1,777 |
|
|
2,138 |
|
|
4,709 |
|
|
8,624 |
|
Income (loss) before income tax |
|
|
2,997 |
|
|
5,060 |
|
|
(10,869) |
|
|
(2,812) |
|
Total assets |
|
|
272,686 |
|
|
472,761 |
|
|
111,974 |
|
|
857,421 |
|
Net capital expenditures |
|
|
4,485 |
|
|
10,390 |
|
|
55 |
|
|
14,930 |
|
|
|
|
|
|
|
|
|
|
|
|
|
|
|
|
|
Flatbed |
|
Specialized |
|
|
|
|
|
|
||
|
|
|
Solutions |
|
Solutions |
|
Corporate/ |
|
Consolidated |
||||
|
|
|
Segment |
|
Segment |
|
Eliminations |
|
Total |
||||
|
Nine Months Ended September 30, 2018 |
|
|
|
|
|
|
|
|
|
|
|
|
|
Total revenue |
|
$ |
488,681 |
|
$ |
687,137 |
|
$ |
(9,749) |
|
$ |
1,166,069 |
|
Operating income (loss) |
|
|
28,462 |
|
|
24,065 |
|
|
(22,345) |
|
|
30,182 |
|
Depreciation |
|
|
21,420 |
|
|
60,070 |
|
|
82 |
|
|
81,572 |
|
Amortization of intangible assets |
|
|
4,395 |
|
|
7,781 |
|
|
— |
|
|
12,176 |
|
Interest expense |
|
|
6,011 |
|
|
8,131 |
|
|
19,104 |
|
|
33,246 |
|
Income (loss) before income tax |
|
|
22,754 |
|
|
17,657 |
|
|
(39,800) |
|
|
611 |
|
Net capital expenditures |
|
|
11,256 |
|
|
72,972 |
|
|
1,068 |
|
|
85,296 |
|
|
|
|
|
|
|
|
|
|
|
|
|
|
|
Nine Months Ended September 30, 2017 |
|
|
|
|
|
|
|
|
|
|
|
|
|
Total revenue |
|
$ |
253,794 |
|
$ |
340,289 |
|
$ |
(5,004) |
|
$ |
589,079 |
|
Operating income (loss) |
|
|
14,955 |
|
|
12,756 |
|
|
(18,391) |
|
|
9,320 |
|
Depreciation |
|
|
20,619 |
|
|
28,375 |
|
|
115 |
|
|
49,109 |
|
Amortization of intangible assets |
|
|
1,310 |
|
|
3,339 |
|
|
— |
|
|
4,649 |
|
Interest expense |
|
|
5,263 |
|
|
5,832 |
|
|
9,969 |
|
|
21,064 |
|
Income (loss) before income tax |
|
|
9,725 |
|
|
7,004 |
|
|
(31,979) |
|
|
(15,250) |
|
Net capital expenditures |
|
|
6,653 |
|
|
17,166 |
|
|
103 |
|
|
23,922 |
34
DASEKE, INC. AND SUBSIDIARIES
NOTES TO CONSOLIDATED FINANCIAL STATEMENTS
(Unaudited)
NOTE 17 – EARNINGS PER SHARE
|
|
|
Three Months Ended |
|
Nine Months Ended |
||||||||
|
|
|
September 30, |
|
September 30, |
||||||||
|
(in thousands, except per share data) |
|
2018 |
|
2017 |
|
2018 |
|
2017 |
||||
|
|
|
|
|
|
|
|
|
|
|
|
|
|
|
Numerator: |
|
|
|
|
|
|
|
|
|
|
|
|
|
Net income (loss) |
|
$ |
2,181 |
|
$ |
50 |
|
$ |
14,869 |
|
$ |
(11,802) |
|
Less Series A preferred dividends |
|
|
(1,239) |
|
|
(1,225) |
|
|
(3,717) |
|
|
(2,919) |
|
Less Series B preferred dividends |
|
|
— |
|
|
— |
|
|
— |
|
|
(806) |
|
Allocation of earnings to non-vested participating restricted stock units |
|
|
(15) |
|
|
— |
|
|
(180) |
|
|
— |
|
Numerator for basic and diluted EPS |
|
$ |
927 |
|
$ |
(1,175) |
|
$ |
10,972 |
|
$ |
(15,527) |
|
|
|
|
|
|
|
|
|
|
|
|
|
|
|
Denominator: |
|
|
|
|
|
|
|
|
|
|
|
|
|
Weighted-average shares outstanding |
|
|
64,310 |
|
|
39,360 |
|
|
59,398 |
|
|
34,791 |
|
Weighted average non-vested participating restricted stock units |
|
|
979 |
|
|
- |
|
|
1,015 |
|
|
- |
|
Denominator for basic and diluted EPS – weighted-average shares |
|
|
65,289 |
|
|
39,360 |
|
|
60,413 |
|
|
34,791 |
|
|
|
|
|
|
|
|
|
|
|
|
|
|
|
Basic and diluted EPS |
|
$ |
0.01 |
|
$ |
(0.03) |
|
$ |
0.18 |
|
$ |
(0.45) |
35
Item 2. Management’s Discussion and Analysis of Financial Condition and Results of Operations
Overview
Daseke, Inc. (Daseke or the Company) is a leading provider and consolidator of transportation and logistics solutions focused exclusively on flatbed and specialized freight in North America. The transportation and logistics market is one of the largest industries in the United States. The flatbed and specialized freight market currently represents approximately 10% of the more than 1.5 million population of trucks used in the broader transportation and logistics market.
The Company believes it provides one of the most comprehensive transportation and logistics solution offerings in the open deck industry. The Company delivers a diverse offering of transportation and logistics solutions to approximately 5,400 customers across the continental United States, Canada and Mexico through two reportable segments: Flatbed Solutions and Specialized Solutions. The Flatbed Solutions segment focuses on delivering transportation and logistics solutions that principally require the use of flatbed and retractable-sided transportation equipment, and the Specialized Solutions segment focuses on delivering transportation and logistics solutions that principally include super heavy haul, high-value customized, over-dimensional, commercial glass and high security cargo solutions.
Both of the Company’s reportable segments operate highly flexible business models comprised of company-owned tractors and asset-light operations (which consist of owner-operator transportation, freight brokerage and logistics). The Company’s asset-based operations have the benefit of providing shippers with certainty of delivery and continuity of operations. Alternatively, the Company’s asset-light operations offer flexibility and scalability to meet customers’ dynamic needs and have lower capital expenditure and fixed cost requirements. Approximately 48% of freight, logistics and brokerage revenue for the nine months ended September 30, 2018 was derived from company-owned equipment and approximately 52% was derived from asset-light services.
Business Combination and Other Recent Developments
On February 27, 2017, Hennessy consummated the merger of Hennessy’s wholly-owned subsidiary with and into Private Daseke, with Private Daseke surviving as a direct wholly-owned subsidiary of Hennessy. The aggregate consideration received by Private Daseke stockholders upon closing was $266.7 million, consisting of newly issued shares of common stock at a value of $10.00 per share. The Merger Agreement contains an earn-out provision through which Private Daseke stockholders could receive up to 15 million additional shares of common stock (with up to 5 million shares payable annually with respect to 2017, 2018 and 2019 performance). Daseke met the earn-out provision for the year ended December 31, 2017 and 5 million shares were issued to the Private Daseke stockholders in the second quarter of 2018. See Note 3 of Notes to Consolidated Financial Statements for more information regarding the Business Combination.
On June 6, 2018, the Company acquired all of the outstanding common shares of Aveda Transportation and Energy Services Inc., a corporation existing under the laws of the Province of Alberta, Canada (Aveda), for total consideration of $117.8 million, consisting of $27.3 million in cash, 1,612,979 shares of Daseke common stock valued at $15.4 million, and the payoff of $54.8 million of outstanding debt. Aveda transports equipment required for the exploration, development and production of petroleum resources in the United States and Canada, expanding the Specialized Segment.
On August 1, 2018, the Company acquired all of the outstanding shares of Builders Transportation Co., LLC (Builders) based in Memphis, Tennessee for total consideration of $36.3 million, consisting of $30.0 million in cash, 399,530 shares of Daseke common stock valued at $3.4 million and the assumption by the Company of $2.9 million of long-term debt. Builders transports metals and building materials, expanding the Flatbed Segment.
On July 1 and August 1, 2018, the Company closed two acquisitions to acquire 100% of the outstanding shares of the entities for aggregate consideration of $31.6 million, consisting of $20.1 million in cash and 95,803 shares of Daseke common stock valued at $0.9 million. Additionally, the Company assumed approximately $10.6 million of debt and capital lease obligations. These two acquisitions expand operations in the northwest United States and Canada, in the Flatbed and Specialized Segments.
How The Company Evaluates Its Operations
The Company uses a number of primary indicators to monitor its revenue and expense performance and efficiency, including Adjusted EBITDA, Adjusted EBITDAR, free cash flow and adjusted operating ratio, and its key drivers of revenue quality, growth, expense control and operating efficiency. Adjusted EBITDA, Adjusted EBITDAR, free cash flow and adjusted operating ratio are not recognized measures under GAAP and should not be considered alternatives to, or more meaningful than, net income (loss), cash flows from operating activities, operating income, operating ratio, operating margin or any other measure derived in accordance with GAAP. See “Non-GAAP Financial Measures” for more information on the Company’s use of these non-GAAP measures, as well as a description of the computation and reconciliation of the Company’s Adjusted EBITDA, Adjusted EBITDAR and free cash flow to net income (loss) and adjusted operating ratio to operating ratio.
36
Revenue
The Company records four types of revenue: freight, brokerage, logistics and fuel surcharge. Freight revenue is generated by hauling freight for the Company’s customers using its trucks or its owner-operators’ equipment. Generally, the Company’s customers pay for its services based on the number of miles in the most direct route between pick-up and delivery locations and other ancillary services the Company provides. Freight revenue is the product of the number of revenue-generating miles driven and the rate per mile the Company receives from customers plus accessorial charges, such as loading and unloading freight for its customers, cargo protection, fees for detaining its equipment or fees for route planning and supervision. Freight revenue is affected by fluctuations in North American economic activity as well as changes in specific customer demand, the level of capacity in the industry and driver availability.
The Company’s brokerage revenue is generated by its use of third-party carriers when it needs capacity to move its customers’ loads. The main factor that affects brokerage revenue is the availability of the Company’s drivers and owner-operators (and hence the need for third-party carriers) and the rate for the load. Brokerage revenue is also affected by fluctuations in North American economic activity as well as changes in the level of capacity in the industry and driver availability.
Logistics revenue is generated from a range of services, including value-added warehousing, loading and unloading, vehicle maintenance and repair, preparation and packaging, fuel management, and other fleet management solutions. Logistics revenue is primarily driven by specific customer requirements for additional services and may fluctuate depending on customers’ utilization of these services due to changes in cargo specifications, delivery staging and fluctuations in North American economic activity.
Fuel surcharges are designed to compensate the Company for fuel costs above a certain cost per gallon base. Generally, the Company receives fuel surcharges on the miles for which it is compensated by customers. However, the Company continues to have exposure to increasing fuel costs related to empty miles, fuel efficiency due to engine idle time and other factors and to the extent the surcharge paid by the customer is insufficient. The main factors that affect fuel surcharge revenue are the price of diesel fuel and the number of loaded miles. In general, a declining energy and fuel price environment, such as in 2015 and most of 2016, negatively affects the Company’s fuel surcharge revenues, and conversely, an environment with rising fuel and energy prices benefits its fuel surcharge revenues. Although the Company’s surcharge programs vary by customer, they typically involve a computation based on the change in national or regional fuel prices. The Company’s fuel surcharges are billed on a lagging basis, meaning it typically bills customers in the current week based on a previous week’s applicable index. Therefore, in times of increasing fuel prices, the Company does not recover as much as it is currently paying for fuel. In periods of declining prices, the opposite is true. Also, its fuel surcharge programs typically require a specified minimum change in fuel cost to prompt a change in fuel surcharge revenue. Therefore, many of these programs have a time lag between when fuel costs change and when the change is reflected in fuel surcharge revenue.
Expenses
The Company’s most significant expenses vary with miles traveled and include driver wages, services purchased from owner-operators and other transportation providers (which are recorded on the “Purchased freight” line of the Company’s consolidated statements of operations) and fuel. Although driver-related expenses vary with miles traveled, the Company currently expects that its expenses relating to driver wages, as a percentage of operating revenues, will increase in the near-term, with or without changes in total miles, due to expected increases in average driver wages paid per mile in the general trucking industry. The expected increases in driver wages per mile are due to current market conditions caused by a shortage of qualified drivers in the industry when compared to current demand.
Maintenance and tire expenses and cost of insurance and claims generally vary with the miles the Company travels but also have a controllable component based on safety improvements, fleet age, efficiency and other factors. The Company’s primary fixed costs are depreciation of long-term assets (such as tractors, trailers and terminals), interest expense, rent and non-driver compensation.
The Company’s fuel surcharge programs help to offset increases in fuel prices but typically do not offset empty miles, idle time and out of route miles driven. As discussed above under “Revenue”, its fuel surcharge programs have a time lag between when fuel costs change and when the change is reflected in fuel surcharge revenue. Due to this time lag, the Company’s fuel expense, net of fuel surcharge, negatively impacts its operating income during periods of sharply rising fuel costs and positively impacts its operating income during periods of falling fuel costs. In general, due to the fuel surcharge programs, its operating income is less negatively affected by an environment with higher, stable fuel prices than an environment with lower fuel prices. In addition to its fuel surcharge programs, the Company believes the most effective protection against fuel cost increases is to maintain a fuel-efficient fleet by incorporating fuel efficiency measures. Also, the Company has arrangements with some of its significant fuel suppliers to buy the majority of its fuel at contracted pricing schedules that fluctuate with the market price of diesel fuel. The Company has not used derivatives as a hedge against higher fuel costs in the past but continues to evaluate this possibility.
37
Factors Affecting the Comparability of the Company’s Financial Results
Acquisitions
The comparability of the Company’s results of operations among the periods presented is impacted by the acquisitions listed below. Also, as a result of the below acquisitions, the Company’s historical results of operations may not be comparable or indicative of future results.
Flatbed Solutions Acquisitions
|
· |
Builders Acquisition – Effective August 1, 2018, the Company acquired 100% of the outstanding equity interests of Builders, to expand its presence in the steel and construction materials markets. |
|
· |
Leavitt’s Acquisition – Effective August 1, 2018, a Company subsidiary acquired 100% of the outstanding equity interests of Leavitt’s Freight Service (Leavitt’s), to strengthen its operations in Central Oregon and expand its capabilities to the lumber industry. |
|
· |
Tennessee Steel Haulers Acquisition – Effective December 1, 2017, the Company acquired 100% of the outstanding equity interests of TSH & Co. to expand its presence on the East Coast and in the Southeastern United States in both the steel and building materials industries. |
The Company refers to the 2017 and 2018 acquisitions described above collectively as the “Flatbed Solutions Acquisitions.”
Specialized Solutions Acquisitions
|
· |
Kelsey Trail Acquisition – Effective July 1, 2018, a Company subsidiary acquired 100% of the outstanding equity interests of Kelsey Trail Trucking (Kelsey Trail), to strengthen and grow its operations in Canada. |
|
· |
Aveda Acquisition – Effective June 6, 2018, the Company acquired 100% of the outstanding equity interests of Aveda, to expand its capabilities to include the specialized transportation of equipment required for the exploration, development and production of petroleum resources in the United States and Canada. |
|
· |
Belmont Acquisition – Effective December 29, 2017, a Company subsidiary acquired 100% of the outstanding equity interests of Belmont, as a dedicated glass hauler that will complement the Company’s existing glass hauling capabilities. |
|
· |
Moore Freight Services Acquisition – Effective December 1, 2017, the Company acquired 100% of the outstanding equity interests of Moore Freight Services to expand its capabilities as a commercial sheet glass carrier. |
|
· |
Roadmaster Group Acquisition – Effective December 1, 2017, the Company acquired 100% of the outstanding equity interests of Roadmaster Group to expand its capabilities as a market leader in high security cargo. |
|
· |
R&R Acquisition – Effective September 1, 2017, the Company acquired 100% of the outstanding stock of R&R, to expand its capabilities to include government and commercial arms, ammunitions and explosives. |
|
· |
Steelman Acquisition – Effective July 1, 2017, the Company acquired 100% of the outstanding stock of Steelman, to expand its presence in the Midwestern United States and in both the power sports and heavy haul industries. |
|
· |
Schilli Acquisition – Effective May 1, 2017, the Company acquired 100% of the outstanding stock of Schilli, to expand its presence in the Midwestern United States. |
|
· |
Big Freight Acquisition - Effective May 1, 2017, the Company acquired 100% of the outstanding stock of Big Freight, to expand its presence into Canada and the power sports industry. |
The Company refers to the 2017 and 2018 acquisitions described above collectively as the “Specialized Solutions Acquisitions.”
The Company refers to the Flatbed Solutions Acquisitions and Specialized Solutions Acquisitions described above collectively as the “Recent Acquisitions.”
38
The Business Combination
The Company’s historical results of operations may not be comparable or indicative of results after the consummation of the Business Combination as a result of the following:
|
· |
Transaction Costs. During the nine months ended September 30, 2017, the Company expensed $2.0 million of transaction costs related to the Business Combination. There were no such expenses for the nine months ended September 30, 2018. |
|
· |
Deferred Financing Fees. During the nine months ended September 30, 2017, the Company expensed $3.9 million of unamortized deferred financing fees associated with debt refinanced in conjunction with the Business Combination. There were no such expenses for the nine months ended September 30, 2018. |
Daseke Fleet Services
In May 2018, the Company launched Daseke Fleet Services (DFS) as a new department to support the Company’s growing scale by leveraging areas such as purchasing, equipment optimization and maintenance to improve cost efficiencies in ways that support both the Company’s operating companies and overall organic growth.
DFS focuses on lifecycle management of revenue equipment including maximization of national purchasing power, enhanced maintenance programs, strategic disposition of assets, and high-level warranty management. The formation of DFS is expected to reduce operating expenses which will improve the Company’s operating income, operating ratio and margins.
39
Results of Operations
The following table sets forth items derived from the Company’s consolidated statements of operations and comprehensive income (loss) for the three months ended September 30, 2018 and 2017 in dollars and as a percentage of total revenue and the increase or decrease in the dollar amounts of those items.
|
|
|
Three Months Ended September 30, |
|
|
|
|
|
||||||||
|
|
|
2018 |
|
2017 |
|
Increase (Decrease) |
|||||||||
|
(Dollars in thousands) |
|
$ |
|
% |
|
$ |
|
% |
|
$ |
|
% |
|||
|
|
|
|
|
|
|
|
|
|
|
|
|
|
|
|
|
|
REVENUE: |
|
|
|
|
|
|
|
|
|
|
|
|
|
|
|
|
Freight |
|
$ |
329,474 |
|
71.4 |
|
$ |
171,245 |
|
74.0 |
|
$ |
158,229 |
|
92.4 |
|
Brokerage |
|
|
82,203 |
|
17.8 |
|
|
34,198 |
|
14.8 |
|
|
48,005 |
|
140.4 |
|
Logistics |
|
|
11,656 |
|
2.5 |
|
|
7,871 |
|
3.4 |
|
|
3,785 |
|
48.1 |
|
Fuel surcharge |
|
|
38,256 |
|
8.3 |
|
|
18,008 |
|
7.8 |
|
|
20,248 |
|
112.4 |
|
Total revenue |
|
|
461,589 |
|
100.0 |
|
|
231,322 |
|
100.0 |
|
|
230,267 |
|
99.5 |
|
|
|
|
|
|
|
|
|
|
|
|
|
|
|
|
|
|
OPERATING EXPENSES: |
|
|
|
|
|
|
|
|
|
|
|
|
|
|
|
|
Salaries, wages and employee benefits |
|
|
114,776 |
|
24.9 |
|
|
64,955 |
|
28.1 |
|
|
49,821 |
|
76.7 |
|
Fuel |
|
|
38,931 |
|
8.4 |
|
|
24,734 |
|
10.7 |
|
|
14,197 |
|
57.4 |
|
Operations and maintenance |
|
|
51,494 |
|
11.2 |
|
|
35,132 |
|
15.2 |
|
|
16,362 |
|
46.6 |
|
Communications |
|
|
920 |
|
0.2 |
|
|
539 |
|
0.2 |
|
|
381 |
|
70.7 |
|
Purchased freight |
|
|
170,548 |
|
36.9 |
|
|
61,598 |
|
26.6 |
|
|
108,950 |
|
176.9 |
|
Administrative expenses |
|
|
16,075 |
|
3.5 |
|
|
8,619 |
|
3.7 |
|
|
7,456 |
|
86.5 |
|
Sales and marketing |
|
|
1,007 |
|
0.2 |
|
|
488 |
|
0.2 |
|
|
519 |
|
106.4 |
|
Taxes and licenses |
|
|
4,681 |
|
1.0 |
|
|
2,963 |
|
1.3 |
|
|
1,718 |
|
58.0 |
|
Insurance and claims |
|
|
12,738 |
|
2.8 |
|
|
6,351 |
|
2.7 |
|
|
6,387 |
|
100.6 |
|
Acquisition-related transaction expenses |
|
|
601 |
|
0.1 |
|
|
773 |
|
0.3 |
|
|
(172) |
|
(22.3) |
|
Depreciation and amortization |
|
|
36,800 |
|
8.0 |
|
|
19,805 |
|
8.6 |
|
|
16,995 |
|
85.8 |
|
(Gain) loss on disposition of revenue property and equipment |
|
|
(899) |
|
(0.2) |
|
|
(339) |
|
(0.1) |
|
|
(560) |
|
165.2 |
|
Total operating expenses |
|
|
447,672 |
|
97.0 |
|
|
225,618 |
|
97.5 |
|
|
222,054 |
|
98.4 |
|
Operating ratio |
|
|
97.0% |
|
|
|
|
97.5% |
|
|
|
|
|
|
|
|
Adjusted operating ratio(1) |
|
|
94.9% |
|
|
|
|
95.4% |
|
|
|
|
|
|
|
|
INCOME FROM OPERATIONS |
|
|
13,917 |
|
3.0 |
|
|
5,704 |
|
2.5 |
|
|
8,213 |
|
144.0 |
|
|
|
|
|
|
|
|
|
|
|
|
|
|
|
|
|
|
Other expense (income): |
|
|
|
|
|
|
|
|
|
|
|
|
|
|
|
|
Interest income |
|
|
(170) |
|
* |
|
|
(76) |
|
* |
|
|
(94) |
|
123.7 |
|
Interest expense |
|
|
11,839 |
|
2.6 |
|
|
8,624 |
|
3.7 |
|
|
3,215 |
|
37.3 |
|
Other |
|
|
(603) |
|
(0.1) |
|
|
(32) |
|
* |
|
|
(571) |
|
1,784.4 |
|
Total other expense |
|
|
11,066 |
|
2.4 |
|
|
8,516 |
|
3.7 |
|
|
2,550 |
|
29.9 |
|
|
|
|
|
|
|
|
|
|
|
|
|
|
|
|
|
|
Income (loss) before provision (benefit) for income taxes |
|
|
2,851 |
|
0.6 |
|
|
(2,812) |
|
(1.2) |
|
|
5,663 |
|
(201.4) |
|
Provision (benefit) for income taxes |
|
|
670 |
|
0.1 |
|
|
(2,862) |
|
(1.2) |
|
|
3,532 |
|
(123.4) |
|
Net income |
|
$ |
2,181 |
|
0.5 |
|
$ |
50 |
|
* |
|
$ |
2,131 |
|
4,262.0 |
*indicates not meaningful.
|
(1) |
Adjusted operating ratio is not a recognized measure under GAAP. For a definition of adjusted operating ratio and reconciliation of adjusted operating ratio to operating ratio, see “Non-GAAP Financial Measures” below. |
40
The following table sets forth the Company’s Flatbed Solutions segment’s revenue, operating expenses, operating ratio, adjusted operating ratio and operating income for the three months ended September 30, 2018 and 2017 in dollars and as a percentage of its Flatbed Solutions segment’s total revenue and the increase or decrease in the dollar amounts of those items. The following table also sets forth certain operating statistics for the Company’s Flatbed Solutions segment for the three months ended September 30, 2018 and 2017.
FLATBED SOLUTIONS
|
|
|
Three Months Ended September 30, |
|
|
|
|
|
||||||||
|
|
|
2018 |
|
2017 |
|
Increase (Decrease) |
|||||||||
|
(Dollars in thousands) |
|
$ |
|
% |
|
$ |
|
% |
|
$ |
|
% |
|||
|
|
|
|
|
|
|
|
|
|
|
|
|
|
|
|
|
|
REVENUE(1): |
|
|
|
|
|
|
|
|
|
|
|
|
|
|
|
|
Freight |
|
$ |
130,678 |
|
72.0 |
|
$ |
67,807 |
|
79.2 |
|
$ |
62,871 |
|
92.7 |
|
Brokerage |
|
|
29,134 |
|
16.1 |
|
|
9,385 |
|
11.0 |
|
|
19,749 |
|
210.4 |
|
Logistics |
|
|
824 |
|
0.5 |
|
|
— |
|
* |
|
|
824 |
|
* |
|
Fuel surcharge |
|
|
20,858 |
|
11.5 |
|
|
8,400 |
|
9.8 |
|
|
12,458 |
|
148.3 |
|
Total revenue |
|
|
181,494 |
|
100.0 |
|
|
85,592 |
|
100.0 |
|
|
95,902 |
|
112.0 |
|
|
|
|
|
|
|
|
|
|
|
|
|
|
|
|
|
|
OPERATING EXPENSES(1): |
|
|
|
|
|
|
|
|
|
|
|
|
|
|
|
|
Salaries, wages and employee benefits |
|
|
32,951 |
|
18.2 |
|
|
23,538 |
|
27.5 |
|
|
9,413 |
|
40.0 |
|
Fuel |
|
|
13,682 |
|
7.5 |
|
|
10,212 |
|
11.9 |
|
|
3,470 |
|
34.0 |
|
Operations and maintenance |
|
|
12,617 |
|
7.0 |
|
|
9,584 |
|
11.2 |
|
|
3,033 |
|
31.6 |
|
Purchased freight |
|
|
90,321 |
|
49.8 |
|
|
24,536 |
|
28.7 |
|
|
65,785 |
|
268.1 |
|
Depreciation and amortization |
|
|
9,201 |
|
5.1 |
|
|
7,150 |
|
8.4 |
|
|
2,051 |
|
28.7 |
|
Other operating expenses |
|
|
10,492 |
|
5.8 |
|
|
5,817 |
|
6.8 |
|
|
4,675 |
|
80.4 |
|
Total operating expenses |
|
|
169,264 |
|
93.3 |
|
|
80,837 |
|
94.4 |
|
|
88,427 |
|
109.4 |
|
Operating ratio |
|
|
93.3% |
|
|
|
|
94.4% |
|
|
|
|
|
|
|
|
Adjusted operating ratio(2) |
|
|
92.4% |
|
|
|
|
93.5% |
|
|
|
|
|
|
|
|
INCOME FROM OPERATIONS |
|
$ |
12,230 |
|
6.7 |
|
$ |
4,755 |
|
5.6 |
|
$ |
7,475 |
|
157.2 |
|
|
|
|
|
|
|
|
|
|
|
|
|
|
|
|
|
|
OPERATING STATISTICS: |
|
|
|
|
|
|
|
|
|
|
|
|
|
|
|
|
Total miles |
|
|
64,073,858 |
|
|
|
|
36,646,345 |
|
|
|
|
27,427,513 |
|
74.8 |
|
Company-operated tractors, at quarter-end |
|
|
1,363 |
|
|
|
|
1,141 |
|
|
|
|
222 |
|
19.5 |
|
Owner-operated tractors, at quarter-end |
|
|
1,636 |
|
|
|
|
463 |
|
|
|
|
1,173 |
|
253.3 |
|
Number of trailers, at quarter-end |
|
|
5,173 |
|
|
|
|
2,878 |
|
|
|
|
2,295 |
|
79.7 |
|
|
|
|
|
|
|
|
|
|
|
|
|
|
|
|
|
|
Company-operated tractors, average for the quarter |
|
|
1,244 |
|
|
|
|
1,144 |
|
|
|
|
100 |
|
8.7 |
|
Owner-operated tractors, average for the quarter |
|
|
1,611 |
|
|
|
|
469 |
|
|
|
|
1,142 |
|
243.5 |
*indicates not meaningful.
|
(1) |
Includes intersegment revenues and expenses, as applicable, which are eliminated in the Company’s consolidated results. |
|
(2) |
Adjusted operating ratio is not a recognized measure under GAAP. For a definition of adjusted operating ratio and reconciliation of adjusted operating ratio to operating ratio, see “Non-GAAP Financial Measures” below. |
41
The following table sets forth the Company’s Specialized Solutions segment’s revenue, operating expenses, operating ratio, adjusted operating ratio and operating income for the three months ended September 30, 2018 and 2017 in dollars and as a percentage of its Specialized Solutions segment’s total revenue and the increase or decrease in the dollar amounts of those items. The following table also sets forth certain operating statistics for the Company’s Specialized Solutions segment for the three months ended September 30, 2018 and 2017.
SPECIALIZED SOLUTIONS
|
|
|
Three Months Ended September 30, |
|
|
|
|
|
||||||||
|
|
|
2018 |
|
2017 |
|
Increase (Decrease) |
|||||||||
|
(Dollars in thousands) |
|
$ |
|
% |
|
$ |
|
% |
|
$ |
|
% |
|||
|
|
|
|
|
|
|
|
|
|
|
|
|
|
|
|
|
|
REVENUE(1): |
|
|
|
|
|
|
|
|
|
|
|
|
|
|
|
|
Freight |
|
$ |
202,085 |
|
71.2 |
|
$ |
105,137 |
|
71.2 |
|
$ |
96,948 |
|
92.2 |
|
Brokerage |
|
|
53,233 |
|
18.8 |
|
|
24,852 |
|
16.8 |
|
|
28,381 |
|
114.2 |
|
Logistics |
|
|
10,855 |
|
3.8 |
|
|
7,886 |
|
5.3 |
|
|
2,969 |
|
37.6 |
|
Fuel surcharge |
|
|
17,718 |
|
6.2 |
|
|
9,756 |
|
6.6 |
|
|
7,962 |
|
81.6 |
|
Total revenue |
|
|
283,891 |
|
100.0 |
|
|
147,631 |
|
100.0 |
|
|
136,260 |
|
92.3 |
|
|
|
|
|
|
|
|
|
|
|
|
|
|
|
|
|
|
OPERATING EXPENSES(1): |
|
|
|
|
|
|
|
|
|
|
|
|
|
|
|
|
Salaries, wages and employee benefits |
|
|
79,369 |
|
28.0 |
|
|
39,507 |
|
26.8 |
|
|
39,862 |
|
100.9 |
|
Fuel |
|
|
25,249 |
|
8.9 |
|
|
14,521 |
|
9.8 |
|
|
10,728 |
|
73.9 |
|
Operations and maintenance |
|
|
38,736 |
|
13.6 |
|
|
25,180 |
|
17.1 |
|
|
13,556 |
|
53.8 |
|
Purchased freight |
|
|
84,014 |
|
29.6 |
|
|
38,965 |
|
26.4 |
|
|
45,049 |
|
115.6 |
|
Depreciation and amortization |
|
|
27,574 |
|
9.7 |
|
|
12,618 |
|
8.5 |
|
|
14,956 |
|
118.5 |
|
Impairment |
|
|
— |
|
* |
|
|
— |
|
* |
|
|
— |
|
* |
|
Other operating expenses |
|
|
17,134 |
|
6.0 |
|
|
9,681 |
|
6.6 |
|
|
7,453 |
|
77.0 |
|
Total operating expenses |
|
|
272,076 |
|
95.8 |
|
|
140,472 |
|
95.2 |
|
|
131,604 |
|
93.7 |
|
Operating ratio |
|
|
95.8% |
|
|
|
|
95.2% |
|
|
|
|
|
|
|
|
Adjusted operating ratio(2) |
|
|
93.0% |
|
|
|
|
92.6% |
|
|
|
|
|
|
|
|
INCOME FROM OPERATIONS |
|
$ |
11,815 |
|
4.2 |
|
$ |
7,159 |
|
4.8 |
|
$ |
4,656 |
|
65.0 |
|
|
|
|
|
|
|
|
|
|
|
|
|
|
|
|
|
|
OPERATING STATISTICS: |
|
|
|
|
|
|
|
|
|
|
|
|
|
|
|
|
Total miles |
|
|
57,228,358 |
|
|
|
|
38,948,331 |
|
|
|
|
18,280,027 |
|
46.9 |
|
Company-operated tractors, at quarter-end |
|
|
2,436 |
|
|
|
|
1,716 |
|
|
|
|
720 |
|
42.0 |
|
Owner-operated tractors, at quarter-end |
|
|
678 |
|
|
|
|
452 |
|
|
|
|
226 |
|
50.0 |
|
Number of trailers, at quarter-end |
|
|
8,724 |
|
|
|
|
5,266 |
|
|
|
|
3,458 |
|
65.7 |
|
|
|
|
|
|
|
|
|
|
|
|
|
|
|
|
|
|
Company-operated tractors, average for the quarter |
|
|
2,446 |
|
|
|
|
1,638 |
|
|
|
|
808 |
|
49.3 |
|
Owner-operated tractors, average for the quarter |
|
|
721 |
|
|
|
|
408 |
|
|
|
|
313 |
|
76.7 |
*indicates not meaningful.
|
(1) |
Includes intersegment revenues and expenses, as applicable, which are eliminated in the Company’s consolidated results. |
|
(2) |
Adjusted operating ratio is not a recognized measure under GAAP. For a definition of adjusted operating ratio and reconciliation of adjusted operating ratio to operating ratio, see “Non-GAAP Financial Measures” below. |
Revenue. Total revenue increased 99.5% to $461.6 million for the three months ended September 30, 2018 from $231.3 million for the three months ended September 30, 2017, primarily due to the Recent Acquisitions. The increase in total revenue, excluding the effect of the Recent Acquisitions, was an increase of $40.3 million, or 17.4%, due to increases in freight revenue, brokerage revenue and fuel surcharge. Freight revenue, excluding the effect of the Recent Acquisitions, increased $19.1 million, or 11.1%, from $171.2 million for the three months ended September 30, 2017 to $190.3 million for the three months ended September 30, 2018. Brokerage revenue, excluding the effect of the Recent Acquisitions, increased $10.5 million, or 30.7%, from $34.2 million for the three months ended September 30, 2017 to $44.7 million for the three months ended September 30, 2018. The increases in freight and brokerage revenue were primarily a result of increases in rates, while miles driven were relatively flat when compared to the same period in 2017, excluding the effect of the Recent Acquisitions. Fuel surcharges, excluding the effect of the Recent Acquisitions, increased $8.9 million, or 49.2%, from $18.0 million for the three months ended September 30, 2017 to $26.9 million for the three months ended September 30, 2018.
42
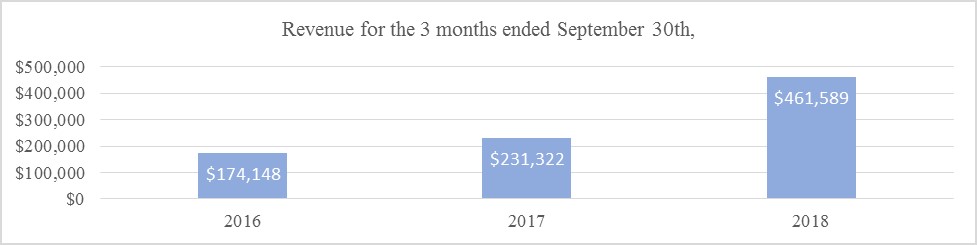
The Company’s Flatbed Solutions segment’s revenue was $181.5 million for the three months ended September 30, 2018 as compared to $85.6 million for the three months ended September 30, 2017, an increase of 112.0%, which was primarily the result of the Flatbed Solutions Acquisitions. The increase in revenue, excluding the effect of the Flatbed Solutions Acquisitions was 18.0%, or $15.4 million, due to increases in freight revenue, brokerage revenue and fuel surcharge. Freight revenue, excluding the effect of the Flatbed Solutions Acquisitions, increased $9.4 million, or 13.8%, from $67.8 million for the three months ended September 30, 2017 to $77.2 million for the three months ended September 30, 2018. Brokerage revenue, excluding the effect of the Recent Acquisitions, increased $1.2 million, or 12.7%, from $9.4 million for the three months ended September 30, 2017 to $10.6 million for the three months ended September 30, 2018. The increases in freight and brokerage revenue were primarily a result of increases in rates, while miles driven were relatively flat when compared to the same period in 2017, excluding the effect of the Flatbed Solutions Acquisitions. Fuel surcharges, excluding the effect of the Flatbed Solutions Acquisitions, increased $4.8 million, or 57.2%, from $8.4 million for the three months ended September 30, 2017 to $13.2 million for the three months ended September 30, 2018.
The Company’s Specialized Solutions segment’s revenue was $283.9 million for the three months ended September 30, 2018 as compared to $147.6 million for the three months ended September 30, 2017, an increase of 92.3%, which was primarily due to the Specialized Solutions Acquisitions. The increase in revenue, excluding the effect of the Specialized Solutions Acquisitions, was an increase of $29.1 million, or 19.7%, due to increases in freight revenue, brokerage revenue and fuel surcharge. Freight revenue, excluding the effect of the Specialized Solutions Acquisitions, increased $13.5 million, or 12.8%, from $105.1 million for the three months ended September 30, 2017 to $118.6 million for the three months ended September 30, 2018. Brokerage revenue, excluding the effect of the Specialized Solutions Acquisitions, increased $9.4 million, or 37.9%, from $24.9 million for the three months ended September 30, 2017 to $34.3 million for the three months ended September 30, 2018. The increases in freight and brokerage revenue were primarily a result of increases in rates, while miles driven where relatively flat when compared to the same period in 2017, excluding the effect of the Specialized Solutions Acquisitions. Fuel surcharges, excluding the effect of the Specialized Solutions Acquisitions, increased $4.4 million, or 45.4%, from $9.8 million for the three months ended September 30, 2017 to $14.2 million for the three months ended September 30, 2018.
In both segments, the increase in fuel surcharge revenue was the result of increases in fuel prices, which increased by 23.8% in the third quarter of 2018 compared to the same period in 2017.
Salaries, Wages and Employee Benefits. Salaries, wages and employee benefits expense, which consists of compensation for all employees, is primarily affected by the number of miles driven by Company drivers, the rate per mile paid to Company drivers, employee benefits including, but not limited to, health care and workers’ compensation, and to a lesser extent, the number of, and compensation and benefits paid to, non-driver employees. In general, the Specialized Solutions segment drivers receive a higher driver pay per total mile than Flatbed Solutions segment drivers due to the former requiring a higher level of training and expertise.
Salaries, wages and employee benefits expense increased 76.7% to $114.8 million for the three months ended September 30, 2018 from $65.0 million for the three months ended September 30, 2017, primarily due to the Recent Acquisitions. The increase in salaries, wages and employee benefits expense, excluding the effect of the Recent Acquisitions, was 12.9%, or $8.4 million, and was primarily due to increased employee compensation, due to increases in average driver wages in the trucking industry and general inflation. Excluding the effect of the Recent Acquisitions, salaries, wages and employee benefits expense, as a percentage of consolidated revenue (excluding brokerage revenue), decreased less than 1% for the three months ended September 30, 2018 as compared to the same period in 2017.
The Company’s Flatbed Solutions segment had a $9.5 million, or 40.0%, increase in salaries, wages and employee benefits expense for the three months ended September 30, 2018 compared to the three months ended September 30, 2017, primarily as a result of the Flatbed Solutions Acquisitions, which resulted in a $7.7 million increase. Excluding the effect of the Flatbed Solutions Acquisitions, salaries, wages and employee benefit expense increased 7.5%, or $1.8 million for the three months ended September 30, 2018 as compared to the three months ended September 30, 2017. This increase was primarily due to increased employee compensation, due to increases in average driver wages in the trucking industry and general inflation. Excluding the effect of the Flatbed Solutions Acquisitions, salaries, wages and employee benefits expense, as a percentage of Flatbed Solutions revenue (excluding brokerage revenue), decreased 2.9% for the three months ended September 30, 2018 as compared to the same period in 2017. This decrease is a result of higher utilization of owner-operators with a decrease
43
in Company drivers for the three months ended September 30, 2018 as compared to the same period in 2017. This change in the mix of drivers reduced salaries, wages and employee benefits expense and increased purchased freight expense (see Purchased Freight below).
The Company’s Specialized Solutions segment had a $39.9 million, or 100.9%, increase in salaries, wages and employee benefits expense for the three months ended September 30, 2018 compared to the three months ended September 30, 2017, primarily as a result of the Specialized Solutions Acquisitions. The increase, excluding the effect of the Specialized Solutions Acquisitions, was 17.4%, or $6.9 million, and was primarily due to increased employee compensation, due to increases in average driver wages in the trucking industry and general inflation, as discussed above. Excluding the effect of the Specialized Solutions Acquisitions, salaries, wages and employee benefits expense, as a percentage of Specialized Solutions revenue (excluding brokerage revenue), increased less than 1% for the three months ended September 30, 2018 as compared to the same period in 2017.
Fuel. Fuel expense consists primarily of diesel fuel expense for company-owned tractors and fuel taxes. The primary factors affecting fuel expense are the cost of diesel fuel, the miles per gallon realized with company equipment and the number of miles driven by Company drivers.
Total fuel expense increased $14.2 million, or 57.4%, to $38.9 million for the three months ended September 30, 2018 from $24.7 million for the three months ended September 30, 2017. This increase was primarily a result of higher fuel prices and the Recent Acquisitions. Excluding the effect of the Recent Acquisitions, fuel expense increased 17.5%, or $4.3 million. The U.S. national average diesel fuel price, as published by the U.S. Department of Energy, was $3.237 for the three months ended September 30, 2018, compared to $2.615 for the same period in 2017, a 23.8% increase. Total miles driven, excluding the Recent Acquisitions, were relatively flat for the three months ended September 30, 2018 as compared to the three months ended September 30, 2017.
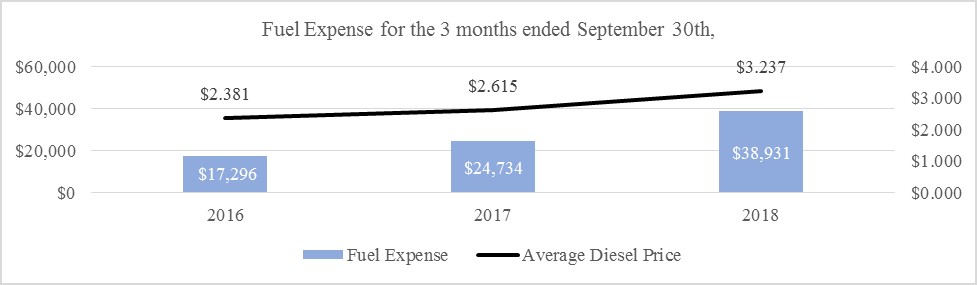
The Company’s Flatbed Solutions segment’s fuel expense increased 34.0% to $13.7 million for the three months ended September 30, 2018 from $10.2 million for the three months ended September 30, 2017, primarily as a result of the Flatbed Solutions Acquisitions and higher fuel prices. Excluding the effect of the Flatbed Solutions Acquisitions, fuel expense in the Flatbed Solutions segment increased 14.8% to $11.7 million. Total miles driven, excluding the Flatbed Solutions Acquisitions, were relatively flat for the three months ended September 30, 2018 as compared to the three months ended September 30, 2017.
The Company’s Specialized Solutions segment’s fuel expense increased 73.9% to $25.2 million for the three months ended September 30, 2018 from $14.5 million for the three months ended September 30, 2017, primarily as the result of the Specialized Solutions Acquisitions and higher fuel prices. Excluding the effect of the Specialized Solutions Acquisitions, fuel expense in the Specialized Solutions segment increased 20.9% to $17.6 million. Total miles driven, excluding the Specialized Solutions Acquisitions, were relatively flat for the three months ended September 30, 2018 as compared to the three months ended September 30, 2017.
Operations and Maintenance. Operations and maintenance expense consists primarily of ordinary vehicle repairs and maintenance, costs associated with preparing tractors and trailers for sale or trade-in, driver recruiting, training and safety costs, permitting and pilot car fees and other general operations expenses. Operations and maintenance expense is primarily affected by the age of company-owned tractors and trailers, the number of miles driven in a period and driver turnover.
Operations and maintenance expense increased 46.6% to $51.5 million for the three months ended September 30, 2018 from $35.1 million for the three months ended September 30, 2017, primarily as a result of the Recent Acquisitions. After adjusting for the effect of the Recent Acquisitions, operations and maintenance expense increased 5.8% for the three months ended September 30, 2018 as compared to the three months ended September 30, 2017. Excluding the effect of the Recent Acquisitions, operations and maintenance expense, as a percentage of consolidated revenue (excluding brokerage revenue), decreased 1.4% for the three months ended September 30, 2018 as compared to the same period in 2017. This decrease is a result of higher utilization of owner-operators with a decrease in Company drivers for the three months ended September 30, 2018 as compared to the same period in 2017. This change in the mix of drivers reduced operations and maintenance expense and increased purchased freight expense (see Purchased Freight below).
44
The Company’s Flatbed Solutions segment’s operations and maintenance expense increased $3.0 million, or 31.6%, for the three months ended September 30, 2018 as compared to the three months ended September 30, 2017, primarily as a result of the Flatbed Solutions Acquisitions. Excluding the effect of the Flatbed Solutions Acquisitions, operations and maintenance expense increased $0.4 million, or 4.3%, for the three months ended September 30, 2018 as compared to the three months ended September 30, 2017, primarily as a result of an increase in maintenance expense, due to normal replacement cycles of tractors and trailers. Excluding the effect of the Flatbed Solutions Acquisitions, operations and maintenance expense, as a percentage of Flatbed Solutions revenue (excluding brokerage revenue), decreased 1.5% for the three months ended September 30, 2018 as compared to the same period in 2017.
The Company’s Specialized Solutions segment’s operations and maintenance expense increased $13.6 million, or 53.8%, for the three months ended September 30, 2018 as compared to the three months ended September 30, 2017, primarily as a result of the Specialized Solutions Acquisitions. Excluding the effect of the Specialized Solutions Acquisitions, operations and maintenance expense increased $1.9 million, or 7.5%, for the three months ended September 30, 2018 as compared to the three months ended September 30, 2017, primarily as a result of increased pilot car and permit expenses, an increase in maintenance expense, due to normal replacement cycles of tractors and trailers and increased logistics activities. Excluding the effect of the Specialized Solutions Acquisitions, operations and maintenance expense, as a percentage of Specialized Solutions revenue (excluding brokerage revenue), decreased 1.5% for the three months ended September 30, 2018 as compared to the same period in 2017. This decrease is a result of higher utilization of owner-operators with a decrease in Company drivers for the three months ended September 30, 2018 as compared to the same period in 2017. This change in the mix of drivers reduced operations and maintenance expense and increased purchased freight expense (see Purchased Freight below).
Purchased Freight. Purchased freight expense consists of the payments to owner-operators, including fuel surcharge reimbursements, and payments to third-party capacity providers that haul loads brokered to them. Purchased freight expense generally takes into account changes in diesel fuel prices, resulting in lower payments during periods of declining fuel prices.
Total purchased freight expense increased 176.9% from $61.6 million during the three months ended September 30, 2017 to $170.5 million during the three months ended September 30, 2018, primarily as a result of the Recent Acquisitions. Excluding the effect of the Recent Acquisitions on purchased freight expense, total purchased freight expense increased 25.3% to $77.2 million for the three months ended September 30, 2018. Purchased freight expense from owner-operators, excluding the Recent Acquisitions, increased 25.9% from $34.8 million during the three months ended September 30, 2017 to $43.8 million during the three months ended September 30, 2018, primarily as a result of higher rates and increases in fuel surcharge reimbursements made to owner-operators as a result of higher fuel prices. Purchased freight expense from third-party capacity providers, excluding the Recent Acquisitions, increased 26.9% from $25.1 million during the three months ended September 30, 2017 to $31.9 million during the three months ended September 30, 2018, primarily as a result of higher rates and increased utilization of third-party capacity providers. Excluding the effect of the Recent Acquisitions, purchased freight expense, as a percentage of consolidated revenue, increased 1.8% for the three months ended September 30, 2018 as compared to the same period in 2017 as a result of higher utilization of owner-operators and third-party capacity providers.
The Company’s Flatbed Solutions segment’s purchased freight expense increased 268.1% to $90.3 million for the three months ended September 30, 2018 from $24.5 million for the three months ended September 30, 2017, primarily as a result of the Flatbed Solutions Acquisitions, which resulted in a $57.4 million increase to purchased freight expense. Excluding the effect of the Flatbed Solutions Acquisitions, the Company’s Flatbed Solutions segment’s purchased freight expense increased 34.1% to $32.9 million for the three months ended September 30, 2018 as compared to the three months ended September 30, 2017. Purchased freight expense from owner-operators, excluding the Flatbed Solutions Acquisitions, increased 44.7% to $25.0 million for the three months ended September 30, 2018 from $17.3 million for the three months ended September 30, 2017, primarily as a result of higher rates and increases in fuel surcharge reimbursements made to owner-operators as a result of higher fuel prices. Purchased freight expense from third-party capacity providers, excluding the Flatbed Solutions Acquisitions, increased 6.2% from $6.7 million during the three months ended September 30, 2017 to $7.1 million during the three months ended September 30, 2018, primarily as a result of higher rates and increased utilization of third-party capacity providers. Excluding the effect of the Flatbed Solutions Acquisitions, purchased freight expense, as a percentage of Flatbed Solutions revenue, increased 3.9% for the three months ended September 30, 2018 as compared to the same period in 2017 as a result of higher utilization of owner-operators and third-party capacity providers.
The Company’s Specialized Solutions segment’s purchased freight expense increased 115.6% to $84.0 million during the three months ended September 30, 2018 from $39.0 million during the three months ended September 30, 2017, primarily as a result of the Specialized Solutions Acquisitions. Excluding the effect of the Specialized Solutions Acquisitions on purchased freight expense, total purchased freight expense increased 23.4% to $48.1 million for the three months ended September 30, 2018. Purchased freight expense from owner-operators, excluding the Specialized Solutions Acquisitions, increased 7.7% from $17.5 million during the three months ended September 30, 2017 to $18.9 million during the three months ended September 30, 2018, primarily as a result of higher rates and increases in fuel surcharge reimbursements made to owner-operators as a result of higher fuel prices. Purchased freight expense from third-party capacity providers, excluding the Specialized Solutions Acquisitions, increased 34.4% from $18.4 million during the three months ended September 30, 2017 to $24.7 million during the three months ended September 30, 2018, primarily as a result of higher rates and increased utilization of third-party capacity providers. Excluding the effect of the Specialized Solutions Acquisitions, purchased freight expense, as a percentage of
45
Specialized Solutions revenue, increased less than 1.0% for the three months ended September 30, 2018 as compared to the same period in 2017 as a result of higher utilization of owner-operators and third-party capacity providers.
Depreciation and Amortization. Depreciation and amortization expense consists primarily of depreciation for company-owned tractors and trailers or amortization of those financed with capital leases. The primary factors affecting these expense items include the size and age of company-owned tractors and trailers and the cost of new equipment.
Depreciation and amortization expense increased 85.8% to $36.8 million during the three months ended September 30, 2018 from $19.8 million during the three months ended September 30, 2017, as a result of the Recent Acquisitions. After adjusting for the effect of the Recent Acquisitions, depreciation and amortization expense was relatively flat for the three months ended September 30, 2018 as compared to the three months ended September 30, 2017.
The Company’s Flatbed Solutions segment’s depreciation and amortization expense increased 28.7% for the three months ended September 30, 2018 as compared to the three months ended September 30, 2017. Excluding the Flatbed Solutions Acquisitions, depreciation and amortization expense during the three months ended September 30, 2018 decreased 4.5% primarily as a result of a 8.8% reduction in company-owned tractors and a 2.0% reduction in trailers, as compared to the same period in 2017.
The Company’s Specialized Solutions segment’s depreciation and amortization expense increased 118.5% for the three months ended September 30, 2018 as compared to the three months ended September 30, 2017 as a result of the Specialized Solutions Acquisitions. After adjusting for the effect of the Specialized Solutions Acquisitions, depreciation and amortization expense increased 3.6% for the three months ended September 30, 2018 as compared to the three months ended September 30, 2017, primarily as a result of a 1.9% increase in company-owned tractors and a 11.1% increase in trailers, as compared to the same period in 2017.
Taxes and Licenses. Operating taxes and licenses expense primarily represents the costs of taxes and licenses associated with the Company’s fleet of equipment and will vary according to the size of its equipment fleet. Taxes and license expense increased from $3.0 million for the three months ended September 30, 2017 to $4.7 million for the three months ended September 30, 2018. Excluding the effect of the Recent Acquisitions, operating taxes and license expense, as a percentage of revenue, was 1.3% for the three months ended September 30, 2018 and 2017.
Insurance and Claims. Insurance and claims expense consists of insurance premiums and the accruals the Company makes for estimated payments and expenses for claims for bodily injury, property damage, cargo damage and other casualty events. The primary factor affecting the Company’s insurance and claims expense is seasonality (the Company typically experiences higher accident frequency in winter months), the frequency and severity of accidents, trends in the development factors used in its accruals and developments in large, prior-year claims. The frequency of accidents tends to increase with the miles the Company travels. Insurance and claims expense increased 100.6% to $12.7 million during the three months ended September 30, 2018 from $6.3 million during the three months ended September 30, 2017, partially as a result of the Recent Acquisitions. Excluding the effect of the Recent Acquisitions, insurance and claims, as a percentage of revenue, increased from 2.7% for the three months ended September 30, 2017 to 3.7% for the three months ended September 30, 2018 primarily due to increases in claims accruals and liability premiums.
Interest Expense. Interest expense consists of cash interest, non-cash paid-in-kind interest, amortization of related issuance costs and fees and prepayment penalties. Interest expense increased 37.3% to $11.8 million during the three months ended September 30, 2018 from $8.6 million during the three months ended September 30, 2017. This increase was primarily attributable to an increase in amortization of debt issuance costs and higher interest rates on the Term Loan Facility as compared to debt outstanding in 2017 under the Senior Term Loan and Equipment Term Loans.
Income Tax. Income taxes increased from a benefit of $2.9 million for the three months ended September 30, 2017 to an expense of $0.7 million for the three months ended September 30, 2018. The increase is primarily the result of the increase in income before income taxes of $5.7 million from the three months ended September 30, 2017 when compared with the three months ended September 30, 2018. The effective tax rate was 23.5% for the three months ended September 30, 2018, compared to 101.8% for the three months ended September 30, 2017. The effective income tax rate varies from the federal statutory rate primarily due to state income taxes and the impact of nondeductible permanent differences, including driver per diems and transaction expenses.
46
The following table sets forth items derived from the Company’s consolidated statements of operations and comprehensive income (loss) for the nine months ended September 30, 2018 and 2017 in dollars and as a percentage of total revenue and the increase or decrease in the dollar amounts of those items.
|
|
|
Nine Months Ended September 30, |
|
|
|
|
|
||||||||
|
|
|
2018 |
|
2017 |
|
Increase (Decrease) |
|||||||||
|
(Dollars in thousands) |
|
$ |
|
% |
|
$ |
|
% |
|
$ |
|
% |
|||
|
|
|
|
|
|
|
|
|
|
|
|
|
|
|
|
|
|
REVENUE: |
|
|
|
|
|
|
|
|
|
|
|
|
|
|
|
|
Freight |
|
$ |
842,128 |
|
72.2 |
|
$ |
446,454 |
|
75.8 |
|
$ |
395,674 |
|
88.6 |
|
Brokerage |
|
|
188,432 |
|
16.2 |
|
|
83,723 |
|
14.2 |
|
|
104,709 |
|
125.1 |
|
Logistics |
|
|
31,265 |
|
2.7 |
|
|
10,571 |
|
1.8 |
|
|
20,694 |
|
195.8 |
|
Fuel surcharge |
|
|
104,244 |
|
8.9 |
|
|
48,331 |
|
8.2 |
|
|
55,913 |
|
115.7 |
|
Total revenue |
|
|
1,166,069 |
|
100.0 |
|
|
589,079 |
|
100.0 |
|
|
576,990 |
|
97.9 |
|
|
|
|
|
|
|
|
|
|
|
|
|
|
|
|
|
|
OPERATING EXPENSES: |
|
|
|
|
|
|
|
|
|
|
|
|
|
|
|
|
Salaries, wages and employee benefits |
|
|
287,735 |
|
24.7 |
|
|
174,253 |
|
29.6 |
|
|
113,482 |
|
65.1 |
|
Fuel |
|
|
103,666 |
|
8.9 |
|
|
64,423 |
|
10.9 |
|
|
39,243 |
|
60.9 |
|
Operations and maintenance |
|
|
126,427 |
|
10.8 |
|
|
86,332 |
|
14.7 |
|
|
40,095 |
|
46.4 |
|
Communications |
|
|
2,426 |
|
0.2 |
|
|
1,491 |
|
0.3 |
|
|
935 |
|
62.7 |
|
Purchased freight |
|
|
429,948 |
|
36.9 |
|
|
148,945 |
|
25.3 |
|
|
281,003 |
|
188.7 |
|
Administrative expenses |
|
|
41,290 |
|
3.5 |
|
|
24,019 |
|
4.1 |
|
|
17,271 |
|
71.9 |
|
Sales and marketing |
|
|
2,295 |
|
0.2 |
|
|
1,425 |
|
0.2 |
|
|
870 |
|
61.1 |
|
Taxes and licenses |
|
|
12,265 |
|
1.1 |
|
|
7,855 |
|
1.3 |
|
|
4,410 |
|
56.1 |
|
Insurance and claims |
|
|
32,350 |
|
2.8 |
|
|
15,516 |
|
2.6 |
|
|
16,834 |
|
108.5 |
|
Acquisition-related transaction expenses |
|
|
2,442 |
|
0.2 |
|
|
2,255 |
|
0.4 |
|
|
187 |
|
8.3 |
|
Depreciation and amortization |
|
|
93,748 |
|
8.0 |
|
|
53,758 |
|
9.1 |
|
|
39,990 |
|
74.4 |
|
Gain on disposition of revenue property and equipment |
|
|
(1,545) |
|
(0.1) |
|
|
(513) |
|
(0.1) |
|
|
(1,032) |
|
201.2 |
|
Impairment |
|
|
2,840 |
|
0.2 |
|
|
— |
|
* |
|
|
2,840 |
|
* |
|
Total operating expenses |
|
|
1,135,887 |
|
97.4 |
|
|
579,759 |
|
98.4 |
|
|
556,128 |
|
95.9 |
|
Operating ratio |
|
|
97.4% |
|
|
|
|
98.4% |
|
|
|
|
|
|
|
|
Adjusted operating ratio(1) |
|
|
95.1% |
|
|
|
|
96.2% |
|
|
|
|
|
|
|
|
INCOME FROM OPERATIONS |
|
|
30,182 |
|
2.6 |
|
|
9,320 |
|
1.6 |
|
|
20,862 |
|
223.8 |
|
|
|
|
|
|
|
|
|
|
|
|
|
|
|
|
|
|
Other expense (income): |
|
|
|
|
|
|
|
|
|
|
|
|
|
|
|
|
Interest income |
|
|
(1,213) |
|
(0.1) |
|
|
(130) |
|
* |
|
|
(1,083) |
|
833.1 |
|
Interest expense |
|
|
33,246 |
|
2.9 |
|
|
21,064 |
|
3.6 |
|
|
12,182 |
|
57.8 |
|
Write-off of unamortized deferred financing fees |
|
|
— |
|
* |
|
|
3,883 |
|
0.7 |
|
|
(3,883) |
|
(100.0) |
|
Other |
|
|
(2,462) |
|
(0.2) |
|
|
(247) |
|
* |
|
|
(2,215) |
|
896.8 |
|
Total other expense |
|
|
29,571 |
|
2.5 |
|
|
24,570 |
|
4.2 |
|
|
5,001 |
|
20.4 |
|
|
|
|
|
|
|
|
|
|
|
|
|
|
|
|
|
|
Income (loss) before benefit for income taxes |
|
|
611 |
|
0.1 |
|
|
(15,250) |
|
(2.6) |
|
|
15,861 |
|
(104.0) |
|
Benefit for income taxes |
|
|
(14,258) |
|
(1.2) |
|
|
(3,448) |
|
(0.6) |
|
|
(10,810) |
|
313.5 |
|
Net income (loss) |
|
$ |
14,869 |
|
1.3 |
|
$ |
(11,802) |
|
(2.0) |
|
$ |
26,671 |
|
(226.0) |
*indicates not meaningful.
|
(1) |
Adjusted operating ratio is not a recognized measure under GAAP. For a definition of adjusted operating ratio and reconciliation of adjusted operating ratio to operating ratio, see “Non-GAAP Financial Measures” below. |
47
The following table sets forth the Company’s Flatbed Solutions segment’s revenue, operating expenses, operating ratio, adjusted operating ratio and operating income for the nine months ended September 30, 2018 and 2017 in dollars and as a percentage of its Flatbed Solutions segment’s total revenue and the increase or decrease in the dollar amounts of those items. The following table also sets forth certain operating statistics for the Company’s Flatbed Solutions segment for the nine months ended September 30, 2018 and 2017.
FLATBED SOLUTIONS
|
|
|
Nine Months Ended September 30, |
|
|
|
|
|
||||||||
|
|
|
2018 |
|
2017 |
|
Increase (Decrease) |
|||||||||
|
(Dollars in thousands) |
|
$ |
|
% |
|
$ |
|
% |
|
$ |
|
% |
|||
|
|
|
|
|
|
|
|
|
|
|
|
|
|
|
|
|
|
REVENUE(1): |
|
|
|
|
|
|
|
|
|
|
|
|
|
|
|
|
Freight |
|
$ |
353,676 |
|
72.4 |
|
$ |
200,670 |
|
79.1 |
|
$ |
153,006 |
|
76.2 |
|
Brokerage |
|
|
76,006 |
|
15.6 |
|
|
27,979 |
|
11.0 |
|
|
48,027 |
|
171.7 |
|
Logistics |
|
|
2,231 |
|
0.5 |
|
|
— |
|
* |
|
|
2,231 |
|
* |
|
Fuel surcharge |
|
|
56,768 |
|
11.6 |
|
|
25,145 |
|
9.9 |
|
|
31,623 |
|
125.8 |
|
Total revenue |
|
|
488,681 |
|
100.0 |
|
|
253,794 |
|
100.0 |
|
|
234,887 |
|
92.6 |
|
|
|
|
|
|
|
|
|
|
|
|
|
|
|
|
|
|
OPERATING EXPENSES(1): |
|
|
|
|
|
|
|
|
|
|
|
|
|
|
|
|
Salaries, wages and employee benefits |
|
|
86,924 |
|
17.8 |
|
|
71,723 |
|
28.3 |
|
|
15,201 |
|
21.2 |
|
Fuel |
|
|
36,922 |
|
7.6 |
|
|
30,594 |
|
12.1 |
|
|
6,328 |
|
20.7 |
|
Operations and maintenance |
|
|
34,354 |
|
7.0 |
|
|
27,475 |
|
10.8 |
|
|
6,879 |
|
25.0 |
|
Purchased freight |
|
|
247,561 |
|
50.7 |
|
|
70,211 |
|
27.7 |
|
|
177,350 |
|
252.6 |
|
Depreciation and amortization |
|
|
25,815 |
|
5.3 |
|
|
21,929 |
|
8.6 |
|
|
3,886 |
|
17.7 |
|
Other operating expenses |
|
|
28,643 |
|
5.9 |
|
|
16,907 |
|
6.7 |
|
|
11,736 |
|
69.4 |
|
Total operating expenses |
|
|
460,219 |
|
94.2 |
|
|
238,839 |
|
94.1 |
|
|
221,380 |
|
92.7 |
|
Operating ratio |
|
|
94.2% |
|
|
|
|
94.1% |
|
|
|
|
|
|
|
|
Adjusted operating ratio(2) |
|
|
93.2% |
|
|
|
|
93.1% |
|
|
|
|
|
|
|
|
INCOME FROM OPERATIONS |
|
$ |
28,462 |
|
5.8 |
|
$ |
14,955 |
|
5.9 |
|
$ |
13,507 |
|
90.3 |
|
|
|
|
|
|
|
|
|
|
|
|
|
|
|
|
|
|
OPERATING STATISTICS: |
|
|
|
|
|
|
|
|
|
|
|
|
|
|
|
|
Total miles |
|
|
180,415,251 |
|
|
|
|
112,318,418 |
|
|
|
|
68,096,833 |
|
60.6 |
|
Company-operated tractors, at period-end |
|
|
1,363 |
|
|
|
|
1,141 |
|
|
|
|
222 |
|
19.5 |
|
Owner-operated tractors, at period-end |
|
|
1,636 |
|
|
|
|
463 |
|
|
|
|
1,173 |
|
253.3 |
|
Number of trailers, at period-end |
|
|
5,173 |
|
|
|
|
2,878 |
|
|
|
|
2,295 |
|
79.7 |
|
|
|
|
|
|
|
|
|
|
|
|
|
|
|
|
|
|
Company-operated tractors, average for the period |
|
|
1,151 |
|
|
|
|
1,158 |
|
|
|
|
(7) |
|
(0.6) |
|
Owner-operated tractors, average for the period |
|
|
1,524 |
|
|
|
|
454 |
|
|
|
|
1,070 |
|
235.7 |
*indicates not meaningful.
|
(1) |
Includes intersegment revenues and expenses, as applicable, which are eliminated in the Company’s consolidated results. |
|
(1) |
Adjusted operating ratio is not a recognized measure under GAAP. For a definition of adjusted operating ratio and reconciliation of adjusted operating ratio to operating ratio, see “Non-GAAP Financial Measures” below. |
48
The following table sets forth the Company’s Specialized Solutions segment’s revenue, operating expenses, operating ratio, adjusted operating ratio and operating income for the nine months ended September 30, 2018 and 2017 in dollars and as a percentage of its Specialized Solutions segment’s total revenue and the increase or decrease in the dollar amounts of those items. The following table also sets forth certain operating statistics for the Company’s Specialized Solutions segment for the nine months ended September 30, 2018 and 2017.
SPECIALIZED SOLUTIONS
|
|
|
Nine Months Ended September 30, |
|
|
|
|
|
||||||||
|
|
|
2018 |
|
2017 |
|
Increase (Decrease) |
|||||||||
|
(Dollars in thousands) |
|
$ |
|
% |
|
$ |
|
% |
|
$ |
|
% |
|||
|
|
|
|
|
|
|
|
|
|
|
|
|
|
|
|
|
|
REVENUE(1): |
|
|
|
|
|
|
|
|
|
|
|
|
|
|
|
|
Freight |
|
$ |
496,712 |
|
72.3 |
|
$ |
250,255 |
|
73.5 |
|
$ |
246,457 |
|
98.5 |
|
Brokerage |
|
|
112,823 |
|
16.4 |
|
|
55,820 |
|
16.4 |
|
|
57,003 |
|
102.1 |
|
Logistics |
|
|
29,128 |
|
4.2 |
|
|
10,594 |
|
3.1 |
|
|
18,534 |
|
174.9 |
|
Fuel surcharge |
|
|
48,474 |
|
7.1 |
|
|
23,620 |
|
6.9 |
|
|
24,854 |
|
105.2 |
|
Total revenue |
|
|
687,137 |
|
100.0 |
|
|
340,289 |
|
100.0 |
|
|
346,848 |
|
101.9 |
|
|
|
|
|
|
|
|
|
|
|
|
|
|
|
|
|
|
OPERATING EXPENSES(1): |
|
|
|
|
|
|
|
|
|
|
|
|
|
|
|
|
Salaries, wages and employee benefits |
|
|
197,506 |
|
28.7 |
|
|
97,880 |
|
28.8 |
|
|
99,626 |
|
101.8 |
|
Fuel |
|
|
66,744 |
|
9.7 |
|
|
33,829 |
|
9.9 |
|
|
32,915 |
|
97.3 |
|
Operations and maintenance |
|
|
91,639 |
|
13.3 |
|
|
57,990 |
|
17.0 |
|
|
33,649 |
|
58.0 |
|
Purchased freight |
|
|
192,117 |
|
28.0 |
|
|
83,704 |
|
24.6 |
|
|
108,413 |
|
129.5 |
|
Depreciation and amortization |
|
|
67,851 |
|
9.9 |
|
|
31,714 |
|
9.3 |
|
|
36,137 |
|
113.9 |
|
Impairment |
|
|
2,840 |
|
1.0 |
|
|
— |
|
* |
|
|
2,840 |
|
* |
|
Other operating expenses |
|
|
44,375 |
|
6.5 |
|
|
22,416 |
|
6.6 |
|
|
21,959 |
|
98.0 |
|
Total operating expenses |
|
|
663,072 |
|
96.5 |
|
|
327,533 |
|
96.3 |
|
|
335,539 |
|
102.4 |
|
Operating ratio |
|
|
96.5% |
|
|
|
|
96.3% |
|
|
|
|
|
|
|
|
Adjusted operating ratio(2) |
|
|
93.4% |
|
|
|
|
94.0% |
|
|
|
|
|
|
|
|
INCOME FROM OPERATIONS |
|
$ |
24,065 |
|
3.5 |
|
$ |
12,756 |
|
3.7 |
|
$ |
11,309 |
|
88.7 |
|
|
|
|
|
|
|
|
|
|
|
|
|
|
|
|
|
|
OPERATING STATISTICS: |
|
|
|
|
|
|
|
|
|
|
|
|
|
|
|
|
Total miles |
|
|
163,313,962 |
|
|
|
|
94,967,882 |
|
|
|
|
68,346,080 |
|
72.0 |
|
Company-operated tractors, at period-end |
|
|
2,436 |
|
|
|
|
1,716 |
|
|
|
|
720 |
|
42.0 |
|
Owner-operated tractors, at period-end |
|
|
678 |
|
|
|
|
452 |
|
|
|
|
226 |
|
50.0 |
|
Number of trailers, at period-end |
|
|
8,724 |
|
|
|
|
5,266 |
|
|
|
|
3,458 |
|
65.7 |
|
|
|
|
|
|
|
|
|
|
|
|
|
|
|
|
|
|
Company-operated tractors, average for the period |
|
|
2,173 |
|
|
|
|
1,375 |
|
|
|
|
798 |
|
58.0 |
|
Owner-operated tractors, average for the period |
|
|
618 |
|
|
|
|
295 |
|
|
|
|
323 |
|
109.5 |
*indicates not meaningful.
|
(1) |
Includes intersegment revenues and expenses, as applicable, which are eliminated in the Company’s consolidated results. |
|
(1) |
Adjusted operating ratio is not a recognized measure under GAAP. For a definition of adjusted operating ratio and reconciliation of adjusted operating ratio to operating ratio, see “Non-GAAP Financial Measures” below. |
Revenue. Total revenue increased 97.9% to $1,166.1 million for the nine months ended September 30, 2018 from $589.1 million for the nine months ended September 30, 2017, primarily due to the Recent Acquisitions. The increase in total revenue, excluding the effect of the Recent Acquisitions, was an increase of $80.4 million, or 13.7%, due to increases in freight revenue, brokerage revenue and fuel surcharge. Freight revenue, excluding the effect of the Recent Acquisitions, increased $37.8 million, or 8.5%, from $446.5 million for the nine months ended September 30, 2017 to $484.3 million for the nine months ended September 30, 2018. Brokerage revenue, excluding the effect of the Recent Acquisitions, increased $18.0 million, or 21.4%, from $83.7 million for the nine months ended September 30, 2017 to $101.7 million for the nine months ended September 30, 2018. The increases in freight and brokerage revenue were primarily a result of increases in rates, while miles driven were relatively flat when compared to the same period in 2017, excluding the effect of the Recent Acquisitions. Fuel surcharges, excluding the effect of the Recent Acquisitions, increased $20.5 million, or 42.4%, from $48.3 million for the nine months ended September 30, 2017 to $68.8 million for the nine months ended September 30, 2018.
49
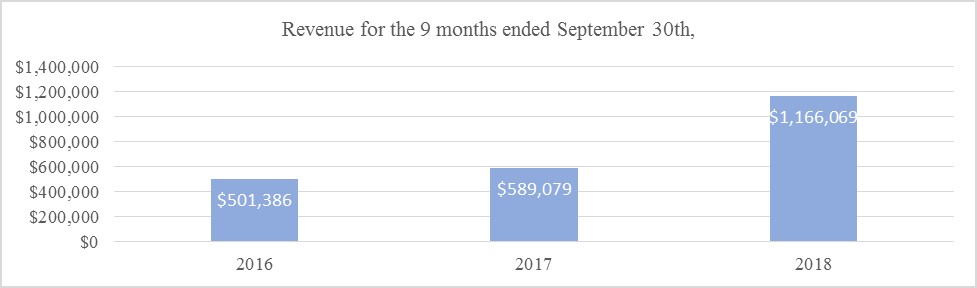
The Company’s Flatbed Solutions segment’s revenue was $488.7 million for the nine months ended September 30, 2018 as compared to $253.8 million for the nine months ended September 30, 2017, an increase of 92.6%, which was primarily the result of the Flatbed Solutions Acquisitions. The increase in revenue, excluding the effect of the Flatbed Solutions Acquisitions was 13.2%, or $33.4 million, due to increases in freight revenue, brokerage revenue and fuel surcharge. Freight revenue, excluding the effect of the Flatbed Solutions Acquisitions, increased $19.9 million, or 9.9%, from $200.7 million for the nine months ended September 30, 2017 to $220.6 million for the nine months ended September 30, 2018. Brokerage revenue, excluding the effect of the Recent Acquisitions, increased $2.0 million, or 7.2%, from $28.0 million for the nine months ended September 30, 2017 to $30.0 million for the three months ended September 30, 2018. The increases in freight and brokerage revenue were primarily a result of increases in rates, while miles driven were relatively flat when compared to the same period in 2017, excluding the effect of the Flatbed Solutions Acquisitions. Fuel surcharges, excluding the effect of the Flatbed Solutions Acquisitions, increased $11.5 million, or 45.8%, from $25.1 million for the nine months ended September 30, 2017 to $36.6 million for the nine months ended September 30, 2018.
The Company’s Specialized Solutions segment’s revenue was $687.1 million for the nine months ended September 30, 2018 as compared to $340.3 million for the nine months ended September 30, 2017, an increase of 101.9%, which was primarily due to the Specialized Solutions Acquisitions. The increase in revenue, excluding the effect of the Specialized Solutions Acquisitions, was an increase of $51.7 million, or 15.2%, due to increases in freight revenue, brokerage revenue and fuel surcharge. Freight revenue, excluding the effect of the Specialized Solutions Acquisitions, increased to $21.7 million, or 8.7%, from $250.3 million for the nine months ended September 30, 2017 to $272.0 million for the nine months ended September 30, 2018. Brokerage revenue, excluding the effect of the Specialized Solutions Acquisitions, increased $16.2 million, or 29.1%, from $55.8 million for the nine months ended September 30, 2017 to $72.0 million. The increases in freight and brokerage revenue were primarily a result of increases in rates, while miles driven were relatively flat when compared to the same period in 2017, excluding the effect of the Specialized Solutions Acquisitions. Fuel surcharges, excluding the effect of the Specialized Solutions Acquisitions, increased $9.6 million, or 40.5%, from $23.6 million for the nine months ended September 30, 2017 to $33.2 million for the nine months ended September 30, 2018.
In both segments, the increase in fuel surcharge revenue was the result of increases in fuel prices, which increased by 22.1% for the nine month period ended September 30, 2018 when compared to the same period in 2017.
Salaries, Wages and Employee Benefits. Salaries, wages and employee benefits expense increased 65.1% to $287.7 million for the nine months ended September 30, 2018 from $174.3 million for the nine months ended September 30, 2017, primarily due to the Recent Acquisitions. The increase in salaries, wages and employee benefits expense, excluding the effect of the Recent Acquisitions, was 6.7%, or $11.7 million, and was primarily due to increased employee compensation, due to increases in average driver wages in the trucking industry and general inflation. This increase was offset by a decrease in employee health insurance cost as a result of cost savings obtained by changing insurance providers. Excluding the effect of the Recent Acquisitions, salaries, wages and employee benefits expense, as a percentage of consolidated revenue (excluding brokerage revenue), decreased 1.7% for the nine months ended September 30, 2018 as compared to the same period in 2017. This decrease is the result of higher utilization of owner-operators with a decrease in Company drivers for the nine months ended September 30, 2018 as compared to the same period in 2017. This change in the mix of drivers reduced salaries, wages and employee benefits expense and increased purchased freight expense (see Purchased Freight below).
The Company’s Flatbed Solutions segment had a $15.2 million, or 21.2%, increase in salaries, wages and employee benefits expense for the nine months ended September 30, 2018 compared to the nine months ended September 30, 2017, primarily as a result of the Flatbed Solutions Acquisitions, which resulted in a $13.5 million increase. Excluding the effect of the Flatbed Solutions Acquisitions, salaries, wages and employee benefit expense increased 2.4% for the nine months ended September 30, 2018 as compared to the nine months ended September 30, 2017. The increase was due to increased employee compensation, due to increases in average driver wages in the trucking industry and general inflation, partially offset by a reduction in employee health insurance cost and workers’ compensation insurance cost as a result of cost savings obtained by changing insurance providers. Excluding the effect of the Flatbed Solutions Acquisitions, wages and employee benefits expense, as a percentage of Flatbed Solutions revenue (excluding brokerage revenue), decreased 3.2% for the nine months
50
ended September 30, 2018 as compared to the same period in 2017. This decrease is the result of higher utilization of owner-operators with a decrease in Company drivers for the nine months ended September 30, 2018 as compared to the same period in 2017. This change in the mix of drivers reduced salaries, wages and employee benefits expense and increased purchased freight expense (see Purchased Freight below).
The Company’s Specialized Solutions segment had a $99.6 million, or 101.8%, increase in salaries, wages and employee benefits expense for the nine months ended September 30, 2018 compared to the nine months ended September 30, 2017, primarily as a result of the Specialized Solutions Acquisitions. This increase, excluding the effect of the Specialized Solutions Acquisitions, was 11.6%, or $11.4 million, and was primarily due to increased employee compensation, due to increases in average driver wages in the trucking industry and general inflation. Excluding the effect of the Specialized Solutions Acquisitions, salaries, wages and employee benefits expense, as a percentage of Specialized Solutions revenue (excluding brokerage revenue), decreased less than 1% for the nine months ended September 30, 2018 as compared to the same period in 2017.
Fuel. Total fuel expense increased $39.3 million, or 60.9%, to $103.7 million for the nine months ended September 30, 2018 from $64.4 million for the nine months ended September 30, 2017. This increase was primarily a result of higher fuel prices and the Recent Acquisitions. Excluding the effect of the Recent Acquisitions, fuel expense increased 20.4%, or $13.1 million. The U.S. national average diesel fuel price, as published by the U.S. Department of Energy, was $3.148 for the nine months ended September 30, 2018, compared to $2.578 for the same period in 2017, a 22.1% increase. Total miles driven, excluding the Recent Acquisitions, were relatively flat for the nine months ended September 30, 2018 as compared to the nine months ended September 30, 2017.
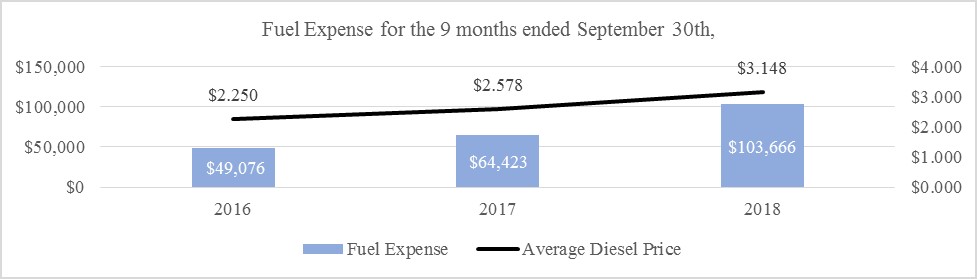
The Company’s Flatbed Solutions segment’s fuel expense increased 20.7% to $36.9 million for the nine months ended September 30, 2018 from $30.6 million for the nine months ended September 30, 2017, primarily as a result of higher fuel prices and the Flatbed Solutions Acquisitions. Excluding the effect of the Flatbed Solutions Acquisitions, fuel expense in the Flatbed Solutions segment increased 14.2% to $34.9 million as a result of higher fuel prices. Total miles driven for the Flatbed Solutions segment, excluding the Flatbed Solutions Acquisitions, were relatively flat for the nine months ended September 30, 2018 as compared to the nine months ended September 30, 2017.
The Company’s Specialized Solutions segment’s fuel expense increased 97.3% to $66.7 million for the nine months ended September 30, 2018 from $33.8 million for the nine months ended September 30, 2017, primarily as the result higher fuel prices and the Specialized Solutions Acquisitions. Excluding the effect of the Specialized Solutions Acquisitions, fuel expense in the Specialized Solutions segment increased 26.0% to $42.6 million as a result of higher fuel prices. Total miles driven for the Specialized Solutions segment, excluding the Specialized Solutions Acquisitions, were relatively flat for the nine months ended September 30, 2018 as compared to the nine months ended September 30, 2017.
Operations and Maintenance. Operations and maintenance expense increased 46.4% to $126.4 million for the nine months ended September 30, 2018 from $86.3 million for the nine months ended September 30, 2017, primarily as a result of the Recent Acquisitions. After adjusting for the effect of the Recent Acquisitions, operations and maintenance expense increased 4.5% for the nine months ended September 30, 2018 as compared to the nine months ended September 30, 2017. Excluding the effect of the Recent Acquisitions, operations and maintenance expense, as a percentage of consolidated revenue (excluding brokerage revenue), decreased 1.2% for the nine months ended September 30, 2018 as compared to the same period in 2017. This decrease is the result of higher utilization of owner-operators with a decrease in Company drivers for the nine months ended September 30, 2018 as compared to the same period in 2017. This change in the mix of drivers reduced operations and maintenance expense and increased purchased freight expense (see Purchased Freight below).
The Company’s Flatbed Solutions segment’s operations and maintenance expense increased $6.9 million, or 25.0%, for the nine months ended September 30, 2018 as compared to the nine months ended September 30, 2017, primarily as a result of the Flatbed Solutions Acquisitions. Excluding the effect of the Flatbed Solutions Acquisitions, operations and maintenance expense increased $1.8 million, or 6.4%, for the nine months ended September 30, 2018 as compared to the nine months ended September 30, 2017, primarily as a result of an increase in maintenance expense, due to normal replacement cycles of tractors and trailers, and increased tire replacement expense. These
51
increases were partially offset by decreased tractor lease costs as the Flatbed Solutions segment’s utilization of operating leases to finance tractor purchases decreased in 2018. Excluding the effect of the Flatbed Solutions Acquisitions, operations and maintenance expense, as a percentage of Flatbed Solutions revenue (excluding brokerage revenue), was a decrease of less than 1% for the nine months ended September 30, 2018 as compared to the same period in 2017.
The Company’s Specialized Solutions segment’s operations and maintenance expense increased $33.6 million, or 58.0%, for the nine months ended September 30, 2018 as compared to the nine months ended September 30, 2017, primarily as a result of the Specialized Solutions Acquisitions. Excluding the effect of the Specialized Solutions Acquisitions, operations and maintenance expense increased $2.6 million, or 4.4%, for the nine months ended September 30, 2018 as compared to the nine months ended September 30, 2017, primarily as a result of increased maintenance expense, due to normal replacement cycles of tractors and trailers and increased logistics activities. Excluding the effect of the Specialized Solutions Acquisitions, operations and maintenance expense, as a percentage of Specialized Solutions revenue (excluding brokerage revenue), decreased 1.5% for the nine months ended September 30, 2018 as compared to the same period in 2017. This decrease is the result of higher utilization of owner-operators with a decrease in Company drivers for the nine months ended September 30, 2018 as compared to the same period in 2017. This change in the mix of drivers reduced operations and maintenance expense and increased purchased freight expense (see Purchased Freight below).
Purchased Freight. Total purchased freight expense increased 188.7% from $148.9 million during the nine months ended September 30, 2017 to $429.9 million during the nine months ended September 30, 2018, primarily as a result of the Recent Acquisitions. Excluding the effect of the Recent Acquisitions on purchased freight expense, total purchased freight expense increased 21.4% to $180.8 million for the nine months ended September 30, 2018. Purchased freight expense from owner-operators, excluding the Recent Acquisitions, increased 25.0% from $84.7 million during the nine months ended September 30, 2017 to $105.9 million during the nine months ended September 30, 2018, primarily as a result of higher rates and increases in fuel surcharge reimbursements made to owner-operators as a result of higher fuel prices. Purchased freight expense from third-party capacity providers, excluding the Recent Acquisitions, increased 18.9% from $60.9 million during the nine months ended September 30, 2017 to $72.4 million during the nine months ended September 30, 2018, primarily as a result of increased utilization of third-party capacity providers. Excluding the effect of the Recent Acquisitions, purchased freight expense, as a percentage of consolidated revenue, increased 1.7% for the nine months ended September 30, 2018 as compared to the same period in 2017 as a result of higher utilization of owner-operators and third-party capacity providers.
The Company’s Flatbed Solutions segment’s purchased freight expense increased 252.6% to $247.6 million for the nine months ended September 30, 2018 from $70.2 million for the nine months ended September 30, 2017, primarily as a result of the Flatbed Solutions Acquisitions, which resulted in a $157.1 million increase to purchased freight expense. Excluding the effect of the Flatbed Solutions Acquisitions, the Company’s Flatbed Solutions segment’s purchased freight expense increased 28.8% to $90.4 million for the nine months ended September 30, 2018 as compared to the nine months ended September 30, 2017, primarily due to increases in the utilization of owner-operators and third-party capacity providers in the Company’s Flatbed Solutions segment. Purchased freight expense from owner-operators, excluding the Flatbed Solutions Acquisitions, increased 37.6% to $67.6 million for the nine months ended September 30, 2018 from $49.2 million for the nine months ended September 30, 2017, primarily as a result of higher rates and increases in fuel surcharge reimbursements made to owner-operators as a result of higher fuel prices. Purchased freight expense from third-party capacity providers, excluding the Flatbed Solutions Acquisitions, increased 6.8% to $20.1 million for the nine months ended September 30, 2018 from $18.8 million for the nine months ended September 30, 2017, primarily as a result of increased utilization of third-party capacity providers. Excluding the effect of the Flatbed Solutions Acquisitions, purchased freight expense, as a percentage of Flatbed Solutions revenue, increased 3.8% for the nine months ended September 30, 2018 as compared to the same period in 2017 from higher utilization of owner-operators and third-party capacity providers.
The Company’s Specialized Solutions segment’s purchased freight expense increased 129.5% to $192.1 million during the nine months ended September 30, 2018 from $83.7 million during the nine months ended September 30, 2017, primarily as a result of the Specialized Solutions Acquisitions. Excluding the effect of the Specialized Solutions Acquisitions on purchased freight expense, total purchased freight expense increased 19.5% to $100.0 million for the nine months ended September 30, 2018. Purchased freight expense from owner-operators, excluding the Specialized Solutions Acquisitions, increased 7.6% from $35.6 million during the nine months ended September 30, 2017 to $38.3 million during the nine months ended September 30, 2018, primarily as a result of higher rates and increases in fuel surcharge reimbursements made to owner-operators as a result of higher fuel prices. Purchased freight expense from third-party capacity providers, excluding the Specialized Solutions Acquisitions, increased 24.3% from $42.0 million during the nine months ended September 30, 2017 to $52.2 million during the nine months ended September 30, 2018, primarily as a result of increased utilization of third-party capacity providers. Excluding the effect of the Specialized Solutions Acquisitions, purchased freight expense, as a percentage of Specialized Solutions revenue, increased 0.9% for the nine months ended September 30, 2018 as compared to the same period in 2017 from higher utilization of owner-operators and third-party capacity providers.
Depreciation and Amortization. Depreciation and amortization expense increased 74.4% to $93.7 million during the nine months ended September 30, 2018 from $53.8 million during the nine months ended September 30, 2017, as a result of the Recent Acquisitions. After adjusting for the effect of the Recent Acquisitions, depreciation and amortization expense was relatively flat for the nine months ended September 30, 2018 as compared to the nine months ended September 30, 2017.
52
The Company’s Flatbed Solutions segment’s depreciation and amortization expense increased 17.7% for the nine months ended September 30, 2018 as compared to the nine months ended September 30, 2017. Excluding the Flatbed Solutions Acquisitions, depreciation and amortization expense during the nine months ended September 30, 2018 decreased 4.9% primarily as a result of a 7.2% reduction in company-owned tractors and a 5.6% reduction in trailers, as compared to the same period in 2017.
The Company’s Specialized Solutions segment’s depreciation and amortization expense increased 113.9% for the nine months ended September 30, 2018 as compared to the nine months ended September 30, 2017 as a result of the Specialized Solutions Acquisitions. After adjusting for the effect of the Specialized Solutions Acquisitions, depreciation and amortization expense increased 2.4% for the nine months ended September 30, 2018 as compared to the nine months ended September 30, 2017, primarily as a result of a 1.1% increase in company-owned tractors and a 1.7% increase in trailers, as compared to the same period in 2017.
Taxes and Licenses. Taxes and license expense increased from $7.9 million for the nine months ended September 30, 2017 to $12.3 million for the nine months ended September 30, 2018. Excluding the effect of the Recent Acquisitions, operating taxes and license expense, as a percentage of revenue, was 1.3% for the nine months ended September 30, 2018 and 2017.
Insurance and Claims. Insurance and claims expense increased 108.5% to $32.4 million during the nine months ended September 30, 2018 from $15.5 million during the nine months ended September 30, 2017, primarily as a result of the Recent Acquisitions. Excluding the effect of the Recent Acquisitions, insurance and claims, as a percentage of revenue, increased from 2.6% for the nine months ended September 30, 2017 to 3.5% for the nine months ended September 30, 2018 primarily due to increases in claims accruals and liability premiums.
Interest Expense. Interest expense increased 57.8% to $33.2 million during the nine months ended September 30, 2018 from $21.1 million during the nine months ended September 30, 2017. This increase was primarily attributable to an increase in amortization of debt issuance costs and higher interest rates on the Term Loan Facility as compared to debt outstanding in 2017 under the Senior Term Loan and Equipment Term Loans.
Income Tax. Benefit from income taxes increased from a benefit of $3.4 million for the nine months ended September 30, 2017 to a benefit of $14.3 million for the nine months ended September 30, 2018. The increase is primarily the result of recognized deferred tax liabilities for final valuations of intangible assets related to the December 2017 acquisitions and then remeasured using the TCJA rates, which resulted in the recognition of an approximately $14.0 million deferred tax benefit during the nine months ended September 30, 2018. The effective tax rate was (2,333.6%) for the nine months ended September 30, 2018, compared to 22.6% for the nine months ended September 30, 2017. The effective income tax rate varies from the federal statutory rate primarily due to state income taxes and the impact of nondeductible permanent differences, including driver per diems and transaction expenses.
Non-GAAP Financial Measures
Adjusted EBITDA, Adjusted EBITDAR and Free Cash Flow
Adjusted EBITDA, Adjusted EBITDAR and free cash flow are not recognized measures under GAAP. The Company uses these non-GAAP measures as supplements to its GAAP results in evaluating certain aspects of its business, as described below.
The Company defines Adjusted EBITDA as net income (loss) plus (i) depreciation and amortization, (ii) interest expense, including other fees and charges associated with indebtedness, net of interest income, (iii) income taxes, (iv) acquisition-related transaction expenses (including due diligence costs, legal, accounting and other advisory fees and costs, retention and severance payments and financing fees and expenses), (v) non-cash impairment, (vi) expenses related to the Business Combination and related transactions, (vii) non-cash stock and equity-compensation expense, and (viii) accounting charges resulting from accounting for the possible earn-out pursuant to the Business Combination. The Company defines Adjusted EBITDAR as Adjusted EBITDA plus tractor operating lease charges.
The Company’s board of directors and executive management team use Adjusted EBITDA and Adjusted EBITDAR as key measures of its performance and for business planning. Adjusted EBITDA and Adjusted EBITDAR assist them in comparing its operating performance over various reporting periods on a consistent basis because they remove from the Company’s operating results the impact of items that, in their opinion, do not reflect the Company’s core operating performance. Adjusted EBITDA and Adjusted EBITDAR also allow the Company to more effectively evaluate its operating performance by allowing it to compare the results of operations against its peers without regard to its or its peers’ financing method or capital structure. Adjusted EBITDAR is used to view operating results before lease charges as these charges can vary widely among trucking companies due to differences in the way that trucking companies finance their fleet acquisitions. The Company’s method of computing Adjusted EBITDA is substantially consistent with that used in its debt covenants and also is routinely reviewed by its management for that purpose.
The Company believes its presentation of Adjusted EBITDA and Adjusted EBITDAR is useful because they provide investors and industry analysts the same information that the Company uses internally for purposes of assessing its core operating performance. However, Adjusted
53
EBITDA and Adjusted EBITDAR are not substitutes for, or more meaningful than, net income (loss), cash flows from operating activities, operating income or any other measure prescribed by GAAP, and there are limitations to using non-GAAP measures such as Adjusted EBITDA and Adjusted EBITDAR. Certain items excluded from Adjusted EBITDA and Adjusted EBITDAR are significant components in understanding and assessing a company’s financial performance, such as a company’s cost of capital, tax structure and the historic costs of depreciable assets. Also, other companies in its industry may define Adjusted EBITDA and Adjusted EBITDAR differently than the Company does, and as a result, it may be difficult to use Adjusted EBITDA, Adjusted EBITDAR or similarly named non-GAAP measures that other companies may use to compare the performance of those companies to its performance. Because of these limitations, Adjusted EBITDA and Adjusted EBITDAR should not be considered measures of the income generated by the Company’s business or discretionary cash available to it to invest in the growth of its business. The Company’s management compensates for these limitations by relying primarily on the Company’s GAAP results and using Adjusted EBITDA and Adjusted EBITDAR supplementally.
The Company defines free cash flow as Adjusted EBITDA less net capital expenditures (capital expenditures less proceeds from equipment sales). Its board of directors and executive management team use free cash flow to assess its performance and ability to fund operations and make additional investments. Free cash flow represents the cash that its business generates from operations, before taking into account cash movements that are non-operational. The Company believes its presentation of free cash flow is useful because it is one of several indicators of its ability to service debt, make investments and/or return capital to its stockholders. The Company also believes that free cash flow is one of several benchmarks used by investors and industry analysts for comparison of performance in its industry, although its measure of free cash flow may not be directly comparable to similar measures reported by other companies. Furthermore, free cash flow is not a substitute for, or more meaningful than, net income (loss), cash flows from operating activities, operating income or any other measure prescribed by GAAP, and there are limitations to using non-GAAP measures such as free cash flow. Accordingly, free cash flow should not be considered a measure of the income generated by its business or discretionary cash available to it to invest in the growth of its business. The Company’s management compensates for these limitations by relying primarily on the Company’s GAAP results and using free cash flow supplementally.
A reconciliation of Adjusted EBITDA, Adjusted EBITDAR and free cash flow to net income (loss) for the three and nine months ended September 30, 2018 and 2017 is as follows:
|
|
|
Three Months Ended September 30, |
|
Nine Months Ended September 30, |
||||||||
|
(In thousands) |
|
2018 |
|
2017 |
|
2018 |
|
2017 |
||||
|
|
|
|
|
|
|
|
|
|
|
|
|
|
|
Net income (loss) |
|
$ |
2,181 |
|
$ |
50 |
|
$ |
14,869 |
|
$ |
(11,802) |
|
Depreciation and amortization |
|
|
36,800 |
|
|
19,805 |
|
|
93,748 |
|
|
53,758 |
|
Interest income |
|
|
(170) |
|
|
(76) |
|
|
(1,213) |
|
|
(130) |
|
Interest expense |
|
|
11,839 |
|
|
8,624 |
|
|
33,246 |
|
|
21,064 |
|
Write-off of unamortized deferred financing fees |
|
|
— |
|
|
— |
|
|
— |
|
|
3,883 |
|
Income tax provision (benefit) |
|
|
670 |
|
|
(2,862) |
|
|
(14,258) |
|
|
(3,448) |
|
Acquisition-related transaction expenses |
|
|
601 |
|
|
773 |
|
|
2,442 |
|
|
2,255 |
|
Impairment |
|
|
— |
|
|
— |
|
|
2,840 |
|
|
— |
|
Stock based compensation |
|
|
928 |
|
|
663 |
|
|
2,716 |
|
|
1,201 |
|
Expenses related to the Business Combination and related transactions |
|
|
— |
|
|
— |
|
|
— |
|
|
2,034 |
|
Tractor operating lease charges |
|
|
5,432 |
|
|
4,448 |
|
|
14,693 |
|
|
12,366 |
|
Adjusted EBITDAR |
|
$ |
58,281 |
|
$ |
31,425 |
|
$ |
149,083 |
|
$ |
81,181 |
|
Less tractor operating lease charges |
|
|
(5,432) |
|
|
(4,448) |
|
|
(14,693) |
|
|
(12,366) |
|
Adjusted EBITDA |
|
$ |
52,849 |
|
$ |
26,977 |
|
$ |
134,390 |
|
$ |
68,815 |
|
Net capital expenditures |
|
|
(49,898) |
|
|
(14,930) |
|
|
(85,296) |
|
|
(23,922) |
|
Free cash flow |
$ |
2,951 |
$ |
12,047 |
$ |
49,094 |
$ |
44,893 |
||||
Adjusted Operating Ratio
Adjusted operating ratio is not a recognized measure under GAAP. The Company uses adjusted operating ratio as a supplement to its GAAP results in evaluating certain aspects of its business, as described below. The Company defines adjusted operating ratio as (a) total operating expenses (i) less fuel surcharges, acquisition-related transaction expenses, non-cash impairment charges and expenses related to the Business Combination and related transactions and (ii) further adjusted for the net impact of the step-up in basis resulting from acquisitions (such as increased depreciation and amortization expense), as a percentage of (b) total revenue excluding fuel surcharge revenue.
The Company’s board of directors and executive management team view adjusted operating ratio, and its key drivers of revenue quality, growth, expense control and operating efficiency, as a very important measure of the Company’s performance. The Company believes fuel surcharge is often volatile and eliminating the impact of this source of revenue (by eliminating fuel surcharge from revenue and by netting
54
fuel surcharge against fuel expense) affords a more consistent basis for comparing its results of operations between periods. The Company also believes excluding acquisition-related transaction expenses, additional depreciation and amortization expenses as a result of acquisitions, non-cash impairment and withdrawn initial public offering-related expenses enhances the comparability of its performance between periods.
The Company believes its presentation of adjusted operating ratio is useful because it provides investors and industry analysts the same information that it uses internally for purposes of assessing its core operating profitability. However, adjusted operating ratio is not a substitute for, or more meaningful than, operating ratio, operating margin or any other measure derived solely from GAAP measures, and there are limitations to using non-GAAP measures such as adjusted operating ratio. Although the Company believes that adjusted operating ratio can make an evaluation of its operating performance more consistent because it removes items that, in its opinion, do not reflect its core operations, other companies in its industry may define adjusted operating ratio differently than it does. As a result, it may be difficult to use adjusted operating ratio or similarly named non-GAAP measures that other companies may use to compare the performance of those companies to the Company’s performance. The Company’s management compensates for these limitations by relying primarily on its GAAP results and using adjusted operating ratio supplementally.
A reconciliation of adjusted operating ratio to operating ratio for each of the three and nine months ended September 30, 2018 and 2017 is as follows:
|
|
Three Months Ended September 30, |
|
Nine Months Ended September 30, |
||||||||
|
(Dollars in thousands) |
2018 |
|
2017 |
|
2018 |
|
2017 |
||||
|
|
|
|
|
|
|
|
|
|
|
|
|
|
Total revenue |
$ |
461,589 |
|
$ |
231,322 |
|
$ |
1,166,069 |
|
$ |
589,079 |
|
Fuel surcharge |
|
38,256 |
|
|
18,008 |
|
|
104,244 |
|
|
48,331 |
|
Operating revenue, net of fuel surcharge |
$ |
423,333 |
|
$ |
213,314 |
|
$ |
1,061,825 |
|
$ |
540,748 |
|
|
|
|
|
|
|
|
|
|
|
|
|
|
Total operating expenses |
$ |
447,672 |
|
$ |
225,618 |
|
$ |
1,135,887 |
|
$ |
579,759 |
|
Fuel surcharge |
|
38,256 |
|
|
18,008 |
|
|
104,244 |
|
|
48,331 |
|
Acquisition-related transaction expenses |
|
601 |
|
|
773 |
|
|
2,442 |
|
|
2,255 |
|
Impairment |
|
— |
|
|
— |
|
|
2,840 |
|
|
— |
|
Expenses related to the Business Combination and related transactions |
|
— |
|
|
— |
|
|
— |
|
|
2,034 |
|
Net impact of step-up in basis of acquired assets |
|
6,957 |
|
|
3,260 |
|
|
16,421 |
|
|
7,088 |
|
Adjusted operating expenses |
$ |
401,858 |
|
$ |
203,577 |
|
$ |
1,009,940 |
|
$ |
520,051 |
|
|
|
|
|
|
|
|
|
|
|
|
|
|
Operating ratio |
|
97.0% |
|
|
97.5% |
|
|
97.4% |
|
|
98.4% |
|
Adjusted operating ratio |
|
94.9% |
|
|
95.4% |
|
|
95.1% |
|
|
96.2% |
A reconciliation of the Company’s Flatbed Solutions segment’s adjusted operating ratio to operating ratio for the three and nine months ended September 30, 2018 and 2017 is as follows:
|
|
|
Three Months Ended September 30, |
|
Nine Months Ended September 30, |
||||||||
|
(Dollars in thousands) |
|
2018 |
|
2017 |
|
2018 |
|
2017 |
||||
|
|
|
|
|
|
|
|
|
|
|
|
|
|
|
Total revenue(1) |
|
$ |
181,494 |
|
$ |
85,592 |
|
$ |
488,681 |
|
$ |
253,794 |
|
Fuel surcharge |
|
|
20,858 |
|
|
8,400 |
|
|
56,768 |
|
|
25,145 |
|
Operating revenue, net of fuel surcharge |
|
$ |
160,636 |
|
$ |
77,192 |
|
$ |
431,913 |
|
$ |
228,649 |
|
|
|
|
|
|
|
|
|
|
|
|
|
|
|
Total operating expenses |
|
$ |
169,264 |
|
$ |
80,837 |
|
$ |
460,219 |
|
$ |
238,839 |
|
Fuel surcharge |
|
|
20,858 |
|
|
8,400 |
|
|
56,768 |
|
|
25,145 |
|
Net impact of step-up in basis of acquired assets |
|
|
25 |
|
|
227 |
|
|
888 |
|
|
888 |
|
Adjusted operating expenses |
|
$ |
148,381 |
|
$ |
72,210 |
|
$ |
402,563 |
|
$ |
212,806 |
|
|
|
|
|
|
|
|
|
|
|
|
|
|
|
Operating ratio |
|
|
93.3% |
|
|
94.4% |
|
|
94.2% |
|
|
94.1% |
|
Adjusted operating ratio |
|
|
92.4% |
|
|
93.5% |
|
|
93.2% |
|
|
93.1% |
|
(1) |
Includes intersegment revenues and expenses, as applicable, which are eliminated in the Company’s consolidated results. |
55
A reconciliation of the Company’s Specialized Solutions segment’s adjusted operating ratio to operating ratio for the three and nine months ended September 30, 2018 and 2017 is as follows:
|
|
|
Three Months Ended September 30, |
|
Nine Months Ended September 30, |
||||||||
|
(Dollars in thousands) |
|
2018 |
|
2017 |
|
2018 |
|
2017 |
||||
|
|
|
|
|
|
|
|
|
|
|
|
|
|
|
Total revenue(1) |
|
$ |
283,891 |
|
$ |
147,631 |
|
$ |
687,137 |
|
$ |
340,289 |
|
Fuel surcharge |
|
|
17,718 |
|
|
9,756 |
|
|
48,474 |
|
|
23,620 |
|
Operating revenue, net of fuel surcharge |
|
$ |
266,173 |
|
$ |
137,875 |
|
$ |
638,663 |
|
$ |
316,669 |
|
|
|
|
|
|
|
|
|
|
|
|
|
|
|
Total operating expenses |
|
$ |
272,076 |
|
$ |
140,472 |
|
$ |
663,072 |
|
$ |
327,533 |
|
Fuel surcharge |
|
|
17,718 |
|
|
9,756 |
|
|
48,474 |
|
|
23,620 |
|
Impairment |
|
|
— |
|
|
— |
|
|
2,840 |
|
|
— |
|
Net impact of step-up in basis of acquired assets |
|
|
6,932 |
|
|
3,033 |
|
|
15,533 |
|
|
6,200 |
|
Adjusted operating expenses |
|
$ |
247,426 |
|
$ |
127,683 |
|
$ |
596,225 |
|
$ |
297,713 |
|
|
|
|
|
|
|
|
|
|
|
|
|
|
|
Operating ratio |
|
|
95.8% |
|
|
95.2% |
|
|
96.5% |
|
|
96.3% |
|
Adjusted operating ratio |
|
|
93.0% |
|
|
92.6% |
|
|
93.4% |
|
|
94.0% |
|
(1) |
Includes intersegment revenues and expenses, as applicable, which are eliminated in the Company’s consolidated results. |
Liquidity and Capital Resources and Capital Requirements
Overview
The Company’s business requires substantial amounts of cash to cover operating expenses as well as to fund items such as cash capital expenditures on its fleet and other assets, working capital changes, principal and interest payments on debt obligations, payments for letters of credit to support insurance requirements and tax payments. The Company expects net replacement capital expenditures to range from $80 million to $90 million for 2018 and is evaluating growth capital expenditures of $30 million to $50 million.
The Company’s primary sources of liquidity have been provided by operations, issuances of capital stock and borrowings under its credit facilities. In February 2018, the Company completed an underwritten public offering of 8,625,000 shares of the Company’s common stock for its own account. After deducting underwriting discounts and commissions and offering expenses payable by the Company, the Company received approximately $84.6 million of net proceeds from the offering, which the Company has been using for general corporate purposes, which may include, among other things, working capital, capital expenditures, debt repayment or refinancing, and support the Company’s acquisition strategy.
The Company has from time to time considered the possibility of a private offering of debt securities, which may be secured or unsecured, which would not be registered under the Securities Act of 1933, as amended (the “Securities Act”), and which would be offered only to qualified institutional buyers pursuant to Rule 144A under the Securities Act and to persons outside the United States pursuant to Regulation S under the Securities Act. The proceeds of such an offering may be used for general corporate purposes, including the repayment of all or a portion of the Company’s term loan credit facility, repayment of outstanding balances on the ABL facility and to support the Company’s acquisition strategy. Also, in connection with such offering, the Company’s credit facilities may be amended or refinanced. There can be no assurance that the Company will conduct or complete such a debt offering.
The Company had the following sources of liquidity available at September 30, 2018 and December 31, 2017.
|
(In thousands) |
|
September 30, 2018 |
|
December 31, 2017 |
||
|
|
|
|
|
|
|
|
|
Cash |
|
$ |
18,077 |
|
$ |
90,679 |
|
Availability under line of credit |
|
|
83,274 |
|
|
55,500 |
|
Total |
|
$ |
101,351 |
|
$ |
146,179 |
Cash decreased by $72.6 million from December 31, 2017 to September 30, 2018. This decrease primarily resulted from net debt repayments and cash paid in acquisitions, offset by proceeds from the sale of common stock. For the nine months ended September 30, 2018, the Company completed acquisitions with cash of $131.8 million ($135.2 million cash paid, less $3.4 million cash acquired). See Note 4 of Notes to the Consolidated Financial Statements for more information. On February 20, 2018, the Company raised $84.6 million from an offering of 8,625,000 shares of its common stock. See Note 12 of Notes to the Consolidated Financial Statements for more information.
56
As of September 30, 2018, the Company has (i) a $500.0 million senior secured term loan credit facility, consisting of a $250.0 million term loan, a $150 million tack-on loan and $100.0 million of term loans funded under a delayed draw term loan facility, and (ii) an asset-based senior secured revolving credit facility with an aggregate maximum credit amount equal to $100.0 million (subject to availability under a borrowing base). The delayed draw term loans were used to support the Company’s acquisition activities. See Note 10 of Notes to Consolidated Financial Statements for more information regarding the Term Loan Facility, the ABL Facility, the Senior Term Loan and the Line of Credit.
The Company believes it can finance its expected cash needs, including debt repayment, in the short-term with cash flows from operations and borrowings available under the ABL Facility. The Company expects that the ABL Facility will provide sufficient credit availability to support its ongoing operations, fund its new debt service requirements, capital expenditures, and working capital needs. Over the long-term, the Company will continue to have significant capital requirements, and expects to devote substantial financial resources to grow its operations and fund its acquisition activities. As a result of these funding requirements, the Company likely will need to sell additional equity or debt securities or seek additional financing through additional borrowings, lease financing or equity capital, though it is not likely that the Company will issue any equity securities in the near term. The availability of financing or equity capital will depend upon the Company’s financial condition and results of operations as well as prevailing market conditions. If such additional borrowings, lease financing or equity capital is not available at the time it needs to incur such expenditures, the Company may be required to extend the maturity of then outstanding indebtedness, rely on alternative financing arrangements or engage in asset sales.
Cash Flows
The Company’s summary statements of cash flows information for the nine months ended September 30, 2018 and 2017 is set forth in the table below:
|
|
|
Nine Months Ended September 30, |
||||
|
(In thousands) |
|
2018 |
|
2017 |
||
|
|
|
|
|
|
|
|
|
Net cash provided by operating activities |
|
$ |
46,760 |
|
$ |
26,771 |
|
Net cash used in investing activities |
|
$ |
(175,084) |
|
$ |
(101,446) |
|
Net cash provided by financing activities |
|
$ |
55,750 |
|
$ |
183,520 |
Operating Activities. Cash provided by the Company’s operating activities consists of net income or loss adjusted for certain non-cash items, including depreciation and amortization, deferred interest, gain/loss on disposal of property and equipment, deferred income taxes, deferred gain and interest recognized on sales-type leases, stock-based compensation, bad debt expense and the effect of changes in working capital and other activities.
Cash provided by operating activities was $46.8 million during the nine months ended September 30, 2018 and consisted of $14.9 million of net income plus $81.7 million of non-cash items, consisting primarily of depreciation, amortization, deferred taxes and stock-based compensation, less $49.8 million of net cash used for working capital and other activities. Cash used for working capital and other activities during the nine months ended September 30, 2018 primarily reflect a $57.5 million increase in accounts receivable, a $9.5 million increase in prepaid and other current assets, offset by a $7.3 million increase in accounts payable and accrued expenses and $10.5 million in payments received on sales-type leases. Cash provided by operating activities was $26.8 million during the nine months ended September 30, 2017 and consisted of $11.8 million of net loss plus $59.3 million of non-cash items, consisting primarily of depreciation, amortization and stock-based compensation, partially offset by $4.8 million in deferred taxes, less $15.9 million of net cash used for working capital and other activities. Cash used for working capital and other activities during the nine months ended September 30, 2017 primarily reflect a $28.6 million increase in accounts receivable, $3.8 million in payments received on sales-type leases, and a $8.7 million increase in accounts payable and accrued expenses.
The $20.0 million increase in cash provided by operating activities during the nine months ended September 30, 2018, as compared with the nine months ended September 30, 2017, was primarily the result of a $26.7 million increase in net income, a $32.5 million increase in depreciation, a $7.5 million increase in amortization of intangible assets, and the recognition of a $2.8 million intangible impairment. These amounts were offset by a $33.9 million increase in net cash used for working capital and other activities, $11.3 million of tax benefits primarily due to re-measurements of deferred tax liabilities using the TCJA rates, and $3.9 million for the write-off of deferred financing fees during the nine months ended September 30, 2017 which did not occur during the nine months ended September 30, 2018.
Investing Activities. Cash flows used in investing activities increased from $101.4 million used in investing activities for the nine months ended September 30, 2017 to $175.1 million used in investing activities for the nine months ended September 30, 2018 due to acquisitions and an increase in net purchases of revenue equipment for the nine months ended September 30, 2018 compared to the same period in 2017.
57
Total net capital expenditures for the nine months ended September 30, 2018 and 2017 are shown below:
|
|
|
Nine Months Ended September 30, |
||||
|
(In thousands) |
|
2018 |
|
2017 |
||
|
Revenue equipment (tractors, trailers and trailer accessories) |
|
$ |
46,836 |
|
$ |
14,391 |
|
Buildings and building improvements |
|
|
8,374 |
|
|
174 |
|
Other |
|
|
3,634 |
|
|
1,000 |
|
Total cash capital expenditures |
|
$ |
58,844 |
|
$ |
15,565 |
|
Less: Proceeds from sales of property and equipment |
|
|
15,569 |
|
|
5,252 |
|
Net cash capital (proceeds) expenditures(1) |
|
$ |
43,275 |
|
$ |
10,313 |
(1) The Company acquires property and revenue equipment with debt and capital lease obligations. For the nine months ended September 30, 2018 and 2017, the Company incurred $42.0 million and $13.6 million, respectively, of debt and capital lease obligations to acquire property and revenue equipment.
The following tables provide details on the cash and noncash components of gross capital expenditures for the Company’s reportable segments for the three and nine months ended September 30, 2018 and 2017 (in thousands):
|
|
|
Flatbed |
|
Specialized |
|
|
|
|
|
|
||
|
|
|
Solutions |
|
Solutions |
|
Corporate/ |
|
Consolidated |
||||
|
|
|
Segment |
|
Segment |
|
Eliminations |
|
Total |
||||
|
Three Months Ended September 30, 2018 |
|
|
|
|
|
|
|
|
|
|
|
|
|
Cash flows from investing activities |
|
|
|
|
|
|
|
|
|
|
|
|
|
Purchases of property and equipment |
|
$ |
1,419 |
|
$ |
25,644 |
|
$ |
658 |
|
$ |
27,721 |
|
Proceeds from sale of property and equipment |
|
|
3 |
|
|
(3,896) |
|
|
— |
|
|
(3,893) |
|
|
|
|
|
|
|
|
|
|
|
|
|
|
|
Noncash investing and financing activities |
|
|
|
|
|
|
|
|
|
|
|
|
|
Property and equipment acquired with debt or capital lease obligations |
|
|
7,109 |
|
|
18,961 |
|
|
— |
|
|
26,070 |
|
Net capital expenditures |
|
$ |
8,531 |
|
$ |
40,709 |
|
$ |
658 |
|
$ |
49,898 |
|
|
|
|
|
|
|
|
|
|
|
|
|
|
|
Three Months Ended September 30, 2017 |
|
|
|
|
|
|
|
|
|
|
|
|
|
Cash flows from investing activities |
|
|
|
|
|
|
|
|
|
|
|
|
|
Purchases of property and equipment |
|
$ |
2,297 |
|
$ |
6,407 |
|
$ |
55 |
|
$ |
8,759 |
|
Proceeds from sale of property and equipment |
|
|
(110) |
|
|
(2,190) |
|
|
— |
|
|
(2,300) |
|
|
|
|
|
|
|
|
|
|
|
|
|
|
|
Noncash investing and financing activities |
|
|
|
|
|
|
|
|
|
|
|
|
|
Property and equipment acquired with debt or capital lease obligations |
|
|
2,298 |
|
|
6,173 |
|
|
— |
|
|
8,471 |
|
Net capital expenditures |
|
$ |
4,485 |
|
$ |
10,390 |
|
$ |
55 |
|
$ |
14,930 |
|
|
|
|
|
|
|
|
|
|
|
|
|
|
|
|
|
Flatbed |
|
Specialized |
|
|
|
|
|
|
||
|
|
|
Solutions |
|
Solutions |
|
Corporate/ |
|
Consolidated |
||||
|
|
|
Segment |
|
Segment |
|
Eliminations |
|
Total |
||||
|
Nine Months Ended September 30, 2018 |
|
|
|
|
|
|
|
|
|
|
|
|
|
Cash flows from investing activities |
|
|
|
|
|
|
|
|
|
|
|
|
|
Purchases of property and equipment |
|
$ |
3,815 |
|
$ |
53,961 |
|
$ |
1,068 |
|
$ |
58,844 |
|
Proceeds from sale of property and equipment |
|
|
(3,871) |
|
|
(11,698) |
|
|
— |
|
|
(15,569) |
|
|
|
|
|
|
|
|
|
|
|
|
|
|
|
Noncash investing and financing activities |
|
|
|
|
|
|
|
|
|
|
|
|
|
Property and equipment acquired with debt or capital lease obligations |
|
|
11,312 |
|
|
30,709 |
|
|
— |
|
|
42,021 |
|
Net capital expenditures |
|
$ |
11,256 |
|
$ |
72,972 |
|
$ |
1,068 |
|
$ |
85,296 |
|
|
|
|
|
|
|
|
|
|
|
|
|
|
|
Nine Months Ended September 30, 2017 |
|
|
|
|
|
|
|
|
|
|
|
|
|
Cash flows from investing activities |
|
|
|
|
|
|
|
|
|
|
|
|
|
Purchases of property and equipment |
|
$ |
2,521 |
|
$ |
12,941 |
|
$ |
103 |
|
$ |
15,565 |
|
Proceeds from sale of property and equipment |
|
|
(707) |
|
|
(4,545) |
|
|
— |
|
|
(5,252) |
|
|
|
|
|
|
|
|
|
|
|
|
|
|
|
Noncash investing and financing activities |
|
|
|
|
|
|
|
|
|
|
|
|
|
Property and equipment acquired with debt or capital lease obligations |
|
|
4,839 |
|
|
8,770 |
|
|
— |
|
|
13,609 |
|
Net capital expenditures |
|
$ |
6,653 |
|
$ |
17,166 |
|
$ |
103 |
|
$ |
23,922 |
Financing Activities. Cash flows from financing activities decreased from $183.5 million provided by financing activities for the nine months ended September 30, 2017 to $55.7 million provided by financing activities for the nine months ended September 30, 2018. This decrease was primarily a result of net debt repayments and stock dividends. Cash flows from financing activities for the nine months ended September 30, 2018 included $11.1 million net borrowings on the line of credit, net repayments of $34.9 million of long-term debt and $3.7
58
million paid for Series A Preferred Stock dividends. These amounts were offset by $84.6 million of net proceeds from the February 2018 offering of common stock.
Material Debt
Overview
As of September 30, 2018, the Company had the following material debt:
|
· |
the Term Loan Facility and the ABL Facility; |
|
· |
secured equipment loans and capital lease agreements; and |
|
· |
bank mortgage secured by real estate. |
The amounts outstanding under such agreements were as follows as of September 30, 2018 (in thousands):
|
Line of credit |
|
$ |
15,664 |
|
Term Loan Facility |
|
|
494,724 |
|
Mortgages |
|
|
3,494 |
|
Equipment term loans and capital leases |
|
|
170,975 |
|
Total long-term debt and capital leases |
|
|
684,857 |
|
Less: current portion |
|
|
(58,407) |
|
Long-term debt and capital leases, less current portion |
|
$ |
626,450 |
See Note 10 of Notes to Consolidated Financial Statements included herein for information regarding the Company’s material debt.
Off-Balance Sheet Arrangements
The Company’s financial condition, results of operations, liquidity, capital expenditures and capital resources are not materially affected by off-balance sheet transactions. The Company had stand-by letters of credit in the amount of $12.0 million at September 30, 2018. The letters of credit provide collateral primarily for liability insurance claims. Also, the Company leases certain revenue equipment, terminals and office building facilities under non-cancelable operating leases. The Company’s rent expense under these leases for the nine months ended September 30, 2018 was approximately $24.4 million.
At September 30, 2018, there were 17,520,329 shares of common stock issuable upon exercise of outstanding warrants.
Critical Accounting Policies
The Company’s significant accounting policies are described in Note 1 of Notes to Consolidated Financial Statements in the Company’s Annual Report on Form 10-K filed on March 16, 2018. The Company considers certain of these accounting policies to be “critical” to the portrayal of the Company’s financial position and results of operations, as they require the application of significant judgment by management. As a result, they are subject to an inherent degree of uncertainty. The Company identifies and discusses these “critical” accounting policies in the Management’s Discussion and Analysis of Financial Condition and Results of Operations section of the Company’s Annual Report on Form 10-K filed on March 16, 2018. Management bases its estimates and judgments on historical experience and on various other factors that management believes to be reasonable under the circumstances, the results of which form the basis for making judgments about the carrying values of assets and liabilities that are not readily apparent from other sources. Actual results may differ from these estimates under different assumptions or conditions. On an ongoing basis, management evaluates its estimates and judgments, including those considered “critical.” Management has discussed the development, selection and evaluation of accounting estimates, including those deemed “critical,” and the associated disclosures in this Quarterly Report on Form 10-Q with the Audit Committee of the Company’s board of directors.
Item 3. Quantitative and Qualitative Disclosures About Market Risk
There have been no material changes in the Company’s market risk since December 31, 2017. For further information on the Company’s market risk, refer to “Item 7A. Quantitative and Qualitative Disclosures About Market Risk” in the Company’s Annual Report on Form 10-K filed on March 16, 2018.
59
Item 4. Controls and Procedures
Evaluation of Disclosure Controls and Procedures
As of the end of the period covered by this Form 10-Q, the Company’s management conducted an evaluation, under the supervision and with the participation of the Chief Executive Officer and the Chief Financial Officer, of the effectiveness of the design and operation of the Company’s disclosure controls and procedures (as defined in Rule 13a-15(e) of the Exchange Act). Based on this evaluation, the Chief Executive Officer and Chief Financial Officer each concluded, as of the end the period, our disclosure controls and procedures were not effective as of September 30, 2018 because of deficiencies in the design and operating effectiveness of information technology controls related to user access and change management and management review controls related to the completeness and accuracy of certain system generated reports that aggregated to a material weakness in internal control over financial reporting and the continuing material weakness discussed below under “Changes in Internal Control over Financial Reporting”.
Management began implementing certain practices and procedures to address the foregoing material weakness with plans to complete the remediation by the end of fiscal year 2018. Such remediation efforts are discussed below under “Management’s Remediation Initiatives.”
Our management believes that the material weakness set forth above did not have an effect on our financial results.
Management’s Remediation Initiatives
Management believes that progress has been made during the quarter ended September 30, 2018, and through the date of this report, to remediate the underlying causes of the material weakness in internal control over financial reporting and has taken the following remediation steps:
|
· |
Installed a Senior Vice President of Business Systems at the corporate executive level, to lead remediation efforts and increase our technical expertise within the IT function |
|
· |
Discussed these issues with the impacted personnel, including IT personnel, operating company leadership, and business control owners |
|
· |
Each ITGC control deficiency has been identified and communicated to the impacted operating company with a resulting remediation plan |
|
· |
Reviewing all IT processes and controls and enhancing the overall design and procedures performed, with a focus on user access and program change management |
|
· |
Re-designing management review controls to ensure the completeness and accuracy of reports generated from IT systems is a component of that review |
To complete the remediation, we plan, with oversight from the Audit Committee, to continue to:
|
· |
Evaluate the sufficiency of our IT resources and personnel to determine whether additional resources are needed |
|
· |
Evaluate whether further enhancements are needed to the design of our IT procedures and controls |
|
· |
Demonstrate consistent operating effectiveness of our management review controls throughout the remainder of 2018 |
Changes in Internal Control over Financial Reporting
As previously disclosed in Item 4. “Controls and Procedures” of our 2018 second quarter Form 10-Q, management identified a material weakness in the income tax accounting process. During the third quarter of 2018, management conducted an extensive remediation plan. Management evaluated the sufficiency of our income tax resources and personnel, concluding that additional resources are not necessary. The remediation plan included a review of our income tax processes and controls, enhancing the overall design and procedures performed in recording the estimate of intangibles and deferred taxes in the opening balance sheet. It also included redesigning our management review controls and enhanced the precision of review around key income tax areas. The identified material weakness in income taxes will not be considered fully remediated until the internal controls over this area have been in operation for a sustained period and management has concluded, through testing, that these controls are operating effectively. We expect that the remediation of this material weakness will be completed prior to the end of fiscal year 2018.
Except as described above, there are no changes in our internal control over financial reporting that occurred during the three months ended September 30, 2018 that materially affected, or are reasonably likely to materially affect, our internal control over financial reporting.
60
The Company is involved in litigation and claims primarily arising in the normal course of business, which include claims for personal injury or property damage incurred in the transportation of freight. Based on its knowledge of the facts and, in certain cases, advice of outside counsel, the Company believes the resolution of claims and pending litigation will not have a material adverse effect on the Company’s financial position, results of operations or cash flows.
Other than as described below, there have been no material changes in the risks facing the Company as described in the Company’s Annual Report on Form 10-K filed on March 16, 2018.
Changes to trade regulation, quotas, duties or tariffs, caused by the changing U.S. and geopolitical environments or otherwise, may increase our costs and materially adversely affect our business.
Recent activity by the Trump administration has led to the imposition of tariffs on certain imported steel and aluminum as well as a broad range of other products imported into the United States. In response to the tariffs imposed by the United States, the European Union, Canada, Mexico and China have announced tariffs on U.S. goods and services. The implementation of these tariffs, as well as the imposition of additional tariffs or quotas or changes to certain trade agreements or retaliatory trade measures or tariffs implemented by other countries, could, among other things, increase the costs of the materials used by our suppliers to produce new revenue equipment or increase the price of fuel. Such cost increases for our revenue equipment suppliers might be passed on to us, and to the extent fuel prices increase, we may not be able to fully recover such increases through rate increases or our fuel surcharge program, either of which could have a material adverse effect on our business. Further, the continued threats of tariffs, trade restrictions, and trade barriers could have a generally disruptive impact on the domestic economy, including our customers, and decrease demand for our services.
We have identified material weaknesses in our internal control over financial reporting that, if not remediated, could result in material misstatements in our financial statements, cause us to fail to meet our periodic reporting obligations, or adversely affect investor confidence.
We have identified two material weaknesses in internal control over financial reporting in the 2018 fiscal year. A material weakness is a deficiency, or a combination of deficiencies, in internal control over financial reporting such that there is a reasonable possibility that a material misstatement of the Company’s annual or interim financial statements will not be prevented or detected on a timely basis. During the quarter ended June 30, 2018, a material weakness in the income tax accounting process was identified. We determined that the design and operation of the controls over our income tax accounting process specifically related to identifying and recording deferred tax liabilities on the final amounts allocated to intangible assets acquired in business combinations were ineffective. Additionally, as of September 30, 2018, we concluded that deficiencies in the design and operating effectiveness of information technology controls related to user access and change management and management review controls related to the completeness and accuracy of certain system-generated reports also aggregated to a material weakness. While we plan to complete our remediation efforts by the end of this fiscal year, we may not be able to complete our remediation, evaluation and testing in a timely fashion and our remediation efforts may not be successful once completed.
If the remedial measures implemented are determined to be insufficient to address our current material weaknesses or if additional material weaknesses are discovered or occur in the future, our ability to record, process and report financial information accurately, and to prepare financial statements within the time periods specified by the rules and forms of the SEC, could be adversely affected, and could result in material misstatements to our annual or interim financial statements. Ineffective internal controls could also cause investors to lose confidence in our reported financial information, which could have a negative effect on the trading price of our common stock.
When we cease to be an “emerging growth company” under the federal securities laws, our registered public accounting firm will be required to express an opinion on the effectiveness of our internal controls. Given the difficulties inherent in the design and operation of a system of internal controls over financial reporting, we can provide no assurance as to our, or our independent registered public accounting firms’, future conclusions about the effectiveness of our system of internal controls over financial reporting, and we may incur significant costs in our efforts to comply with Section 404 of the Sarbanes-Oxley Act. If we are unable to confirm that our internal control over financial reporting is effective, or if our registered public accounting firm is unable to express an opinion on the effectiveness of our internal controls, we could be subject to additional regulatory scrutiny and lose investor confidence in the accuracy and completeness of our financial reports, which could have an adverse effect on our business and would likely have a negative effect on the trading price of our common stock.
61
Item 2. Unregistered Sales of Equity Securities and Use of Proceeds
During the three months ended September 30, 2018, in connection with, and as partial consideration for, certain acquisitions, the Company issued shares of common stock that were not registered under the Securities Act, in reliance on the private offering exemption of Section 4(a)(2) of the Securities Act or the private offering safe harbor provision of Rule 506 of Regulation D promulgated thereunder based on the following factors: (i) the number of offerees or purchasers, as applicable, (ii) the absence of general solicitation, (iii) investment representations obtained from those receiving shares of the Company’s common stock, including with respect to their status as accredited investors, (iv) the provision of appropriate disclosure, and (v) the placement of restrictive legends on the certificates reflecting the securities. See Note 4 of Consolidated Financial Statements for additional details about these acquisitions.
On July 1, 2018, as part of the consideration paid for the Kelsey Trail acquisition, the Company issued 95,859 shares of Daseke common stock valued at $0.9 million. See Note 4 for additional details about the Kelsey Trail acquisition.
On August 1, 2018, as part of the consideration paid for the Builders acquisition, the Company issued 399,530 shares of Daseke common stock valued at $3.4 million. See Note 4 for additional details about the Builders acquisition.
62
|
Exhibit No. |
Exhibit |
|
3.1 |
|
|
|
|
|
3.2 |
|
|
|
|
|
3.3 |
|
|
|
|
|
10.1 |
|
|
|
|
|
31.1* |
Chief Executive Officer certification under Section 302 of Sarbanes-Oxley Act of 2002. |
|
|
|
|
31.2* |
Chief Financial Officer certification under Section 302 of Sarbanes-Oxley Act of 2002. |
|
|
|
|
32.1** |
Chief Executive Officer certification under Section 906 of Sarbanes-Oxley Act of 2002. |
|
|
|
|
32.2** |
Chief Financial Officer certification under Section 906 of Sarbanes-Oxley Act of 2002. |
|
|
|
|
101.INS* |
XBRL Instance Document. |
|
|
|
|
101.SCH* |
XBRL Taxonomy Extension Schema Document. |
|
|
|
|
101.CAL* |
XBRL Taxonomy Extension Calculation Linkbase Document. |
|
|
|
|
101.DEF* |
XBRL Taxonomy Extension Definition Linkbase Document. |
|
|
|
|
101.LAB* |
XBRL Taxonomy Extension Label Linkbase Document. |
|
|
|
|
101.PRE* |
XBRL Taxonomy Extension Presentation Linkbase Document. |
_____________________________
|
* |
Filed herewith. |
|
** |
Furnished herewith. |
63
Pursuant to the requirements of the Securities Exchange Act of 1934, the registrant has duly caused this report to be signed on its behalf by the undersigned, thereunto duly authorized.
|
Date: November 6, 2018 |
DASEKE, INC. |
|
|
|
|
|
|
|
By: |
/s/ Bharat Mahajan |
|
|
Name: |
Bharat Mahajan |
|
|
Title: |
Chief Financial Officer |
|
|
|
(On behalf of the Registrant and as the Registrant’s Principal Financial |
|
|
|
Officer) |
64