Attached files
| file | filename |
|---|---|
| EX-32.2 - EX-32.2 - Broadstone Net Lease, Inc. | ck0001424182-ex322_6.htm |
| EX-32.1 - EX-32.1 - Broadstone Net Lease, Inc. | ck0001424182-ex321_9.htm |
| EX-31.2 - EX-31.2 - Broadstone Net Lease, Inc. | ck0001424182-ex312_8.htm |
| EX-31.1 - EX-31.1 - Broadstone Net Lease, Inc. | ck0001424182-ex311_7.htm |
UNITED STATES
SECURITIES AND EXCHANGE COMMISSION
WASHINGTON, D.C. 20549
FORM 10-Q
|
☒ |
Quarterly report pursuant to Section 13 or 15(d) of the Securities Exchange Act of 1934 |
For the quarterly period ended September 30, 2018, or
|
☐ |
Transition report pursuant to section 13 or 15(d) of the Securities Exchange Act of 1934 |
Commission File Number 000-55774
BROADSTONE NET LEASE, INC.
(Exact name of registrant as specified in its charter)
|
Maryland |
26-1516177 |
|
(State or other jurisdiction of |
(I.R.S. Employer |
|
800 Clinton Square Rochester, New York |
14604 |
|
(Address of principal executive offices) |
(Zip Code) |
(585) 287-6500
(Registrant’s telephone number, including area code)
Indicate by check mark whether the registrant: (1) has filed all reports required to be filed by Section 13 or 15 (d) of the Securities Exchange Act of 1934 during the preceding 12 months (or for such shorter period that the registrant was required to file such reports), and (2) has been subject to such filing requirements for the past 90 days. Yes ☒ No ☐
Indicate by check mark whether the registrant has submitted electronically every Interactive Data File required to be submitted pursuant to Rule 405 of Regulation S-T (§232.405 of this chapter) during the preceding 12 months (or for such shorter period that the registrant was required to submit such files). Yes ☒ No ☐
Indicate by check mark whether the registrant is a large accelerated filer, an accelerated filer, a non-accelerated filer, a smaller reporting company, or an emerging growth company. See the definitions of “large accelerated filer,” “accelerated filer,” “smaller reporting company,” and “emerging growth company” in Rule 12b-2 of the Exchange Act.
|
Large accelerated filer |
|
☐ |
|
Accelerated filer |
|
☐ |
|
Non-accelerated filer |
|
☒ |
|
Smaller reporting company |
|
☐ |
|
Emerging growth company |
|
☒ |
|
|
|
|
If an emerging growth company, indicate by check mark if the registrant has elected not to use the extended transition period for complying with any new or revised financial accounting standards provided pursuant to Section 13(a) of the Exchange Act. ☒
Indicate by check mark whether the registrant is a shell company (as defined in Rule 12b-2 of the Exchange Act). Yes ☐ No ☒
There were 21,367,936.807 shares of the Registrant’s common stock, $0.001 par value per share, outstanding as of November 5, 2018.
TABLE OF CONTENTS
|
|
Page |
|
|
1 |
||
|
Item 1. |
1 |
|
|
|
1 |
|
|
|
Condensed Consolidated Statements of Income and Comprehensive Income (Unaudited) |
2 |
|
|
Condensed Consolidated Statements of Stockholders’ Equity (Unaudited) |
3 |
|
|
4 |
|
|
|
Notes to the Condensed Consolidated Financial Statements (Unaudited) |
5 |
|
Item 2. |
Management’s Discussion and Analysis of Financial Condition and Results of Operations |
28 |
|
|
28 |
|
|
|
28 |
|
|
|
38 |
|
|
|
42 |
|
|
|
42 |
|
|
|
43 |
|
|
|
43 |
|
|
|
48 |
|
|
|
52 |
|
|
|
52 |
|
|
Item 3. |
53 |
|
|
Item 4. |
54 |
|
|
55 |
||
|
Item 1. |
55 |
|
|
Item 1A. |
55 |
|
|
Item 2. |
55 |
|
|
Item 3. |
57 |
|
|
Item 4. |
57 |
|
|
Item 5. |
57 |
|
|
Item 6. |
58 |
|
Broadstone Net Lease, Inc. and Subsidiaries
Condensed Consolidated Balance Sheets
(Unaudited)
(in thousands, except per share amounts)
|
|
|
September 30, 2018 |
|
|
December 31, 2017 |
|
||
|
Assets |
|
|
|
|
|
|
|
|
|
Accounted for using the operating method, net of accumulated depreciation |
|
$ |
2,449,438 |
|
|
$ |
2,186,141 |
|
|
Accounted for using the direct financing method |
|
|
42,012 |
|
|
|
41,617 |
|
|
Investment in rental property, net |
|
|
2,491,450 |
|
|
|
2,227,758 |
|
|
Cash and cash equivalents |
|
|
17,301 |
|
|
|
9,355 |
|
|
Restricted cash |
|
|
10,727 |
|
|
|
744 |
|
|
Accrued rental income |
|
|
65,689 |
|
|
|
52,018 |
|
|
Tenant and other receivables, net |
|
|
214 |
|
|
|
897 |
|
|
Tenant and capital reserves |
|
|
1,087 |
|
|
|
943 |
|
|
Prepaid expenses and other assets |
|
|
2,932 |
|
|
|
267 |
|
|
Notes receivable |
|
|
— |
|
|
|
6,527 |
|
|
Investment in related party |
|
|
— |
|
|
|
10,000 |
|
|
Interest rate swap, assets |
|
|
35,525 |
|
|
|
11,008 |
|
|
Intangible lease assets, net |
|
|
264,038 |
|
|
|
242,659 |
|
|
Debt issuance costs – unsecured revolver, net |
|
|
2,453 |
|
|
|
3,026 |
|
|
Leasing fees, net |
|
|
13,929 |
|
|
|
13,554 |
|
|
Total assets |
|
$ |
2,905,345 |
|
|
$ |
2,578,756 |
|
|
|
|
|
|
|
|
|
|
|
|
Liabilities and equity |
|
|
|
|
|
|
|
|
|
Unsecured revolver |
|
$ |
— |
|
|
$ |
273,000 |
|
|
Mortgages and notes payable, net |
|
|
79,762 |
|
|
|
67,832 |
|
|
Unsecured term notes, net |
|
|
1,225,473 |
|
|
|
836,912 |
|
|
Interest rate swap, liabilities |
|
|
— |
|
|
|
5,020 |
|
|
Accounts payable and other liabilities |
|
|
21,453 |
|
|
|
20,345 |
|
|
Due to related parties |
|
|
47 |
|
|
|
722 |
|
|
Tenant improvement allowances |
|
|
2,920 |
|
|
|
5,669 |
|
|
Accrued interest payable |
|
|
7,018 |
|
|
|
3,311 |
|
|
Intangible lease liabilities, net |
|
|
86,301 |
|
|
|
81,744 |
|
|
Total liabilities |
|
|
1,422,974 |
|
|
|
1,294,555 |
|
|
|
|
|
|
|
|
|
|
|
|
Commitments and contingencies (See Note 16) |
|
|
|
|
|
|
|
|
|
|
|
|
|
|
|
|
|
|
|
Equity |
|
|
|
|
|
|
|
|
|
Broadstone Net Lease, Inc. stockholders' equity: |
|
|
|
|
|
|
|
|
|
Preferred stock, $0.001 par value; 20,000 shares authorized, no shares issued or outstanding |
|
|
— |
|
|
|
— |
|
|
Common stock, $0.001 par value; 80,000 shares authorized, 21,077 and 18,909 shares issued and outstanding at September 30, 2018 and December 31, 2017, respectively |
|
|
21 |
|
|
|
19 |
|
|
Additional paid-in capital |
|
|
1,479,339 |
|
|
|
1,301,979 |
|
|
Subscriptions receivable |
|
|
(1,690 |
) |
|
|
(15 |
) |
|
Cumulative distributions in excess of retained earnings |
|
|
(141,117 |
) |
|
|
(120,280 |
) |
|
Accumulated other comprehensive income |
|
|
33,114 |
|
|
|
5,122 |
|
|
Total Broadstone Net Lease, Inc. stockholders’ equity |
|
|
1,369,667 |
|
|
|
1,186,825 |
|
|
Non-controlling interests |
|
|
112,704 |
|
|
|
97,376 |
|
|
Total equity |
|
|
1,482,371 |
|
|
|
1,284,201 |
|
|
Total liabilities and equity |
|
$ |
2,905,345 |
|
|
$ |
2,578,756 |
|
The accompanying notes are an integral part of these condensed consolidated financial statements.
1
Broadstone Net Lease, Inc. and Subsidiaries
Condensed Consolidated Statements of Income and Comprehensive Income
(Unaudited)
(in thousands, except per share amounts)
|
|
|
For the three months ended September 30, |
|
|
For the nine months ended September 30, |
|
||||||||||
|
|
|
2018 |
|
|
2017 |
|
|
2018 |
|
|
2017 |
|
||||
|
Revenues |
|
|
|
|
|
|
|
|
|
|
|
|
|
|
|
|
|
Rental income from operating leases |
|
$ |
58,189 |
|
|
$ |
43,233 |
|
|
$ |
163,611 |
|
|
$ |
123,890 |
|
|
Earned income from direct financing leases |
|
|
1,017 |
|
|
|
968 |
|
|
|
2,936 |
|
|
|
3,175 |
|
|
Operating expenses reimbursed from tenants |
|
|
2,529 |
|
|
|
1,995 |
|
|
|
7,764 |
|
|
|
4,908 |
|
|
Other income from real estate transactions |
|
|
29 |
|
|
|
39 |
|
|
|
74 |
|
|
|
117 |
|
|
Total revenues |
|
|
61,764 |
|
|
|
46,235 |
|
|
|
174,385 |
|
|
|
132,090 |
|
|
|
|
|
|
|
|
|
|
|
|
|
|
|
|
|
|
|
|
Operating expenses |
|
|
|
|
|
|
|
|
|
|
|
|
|
|
|
|
|
Depreciation and amortization |
|
|
21,869 |
|
|
|
15,643 |
|
|
|
61,303 |
|
|
|
44,969 |
|
|
Asset management fees |
|
|
4,663 |
|
|
|
3,844 |
|
|
|
13,119 |
|
|
|
10,666 |
|
|
Property management fees |
|
|
1,680 |
|
|
|
1,249 |
|
|
|
4,792 |
|
|
|
3,635 |
|
|
Property and operating expense |
|
|
2,777 |
|
|
|
2,009 |
|
|
|
7,926 |
|
|
|
4,710 |
|
|
General and administrative |
|
|
1,664 |
|
|
|
1,173 |
|
|
|
4,451 |
|
|
|
3,297 |
|
|
State and franchise tax |
|
|
58 |
|
|
|
301 |
|
|
|
811 |
|
|
|
511 |
|
|
Provision for impairment of investment in rental properties |
|
|
2,061 |
|
|
|
2,608 |
|
|
|
2,061 |
|
|
|
2,608 |
|
|
Total operating expenses |
|
|
34,772 |
|
|
|
26,827 |
|
|
|
94,463 |
|
|
|
70,396 |
|
|
Operating income |
|
|
26,992 |
|
|
|
19,408 |
|
|
|
79,922 |
|
|
|
61,694 |
|
|
Other income (expenses) |
|
|
|
|
|
|
|
|
|
|
|
|
|
|
|
|
|
Preferred distribution income |
|
|
65 |
|
|
|
187 |
|
|
|
440 |
|
|
|
550 |
|
|
Interest income |
|
|
16 |
|
|
|
127 |
|
|
|
178 |
|
|
|
354 |
|
|
Interest expense |
|
|
(14,484 |
) |
|
|
(9,380 |
) |
|
|
(38,115 |
) |
|
|
(25,182 |
) |
|
Cost of debt extinguishment |
|
|
(50 |
) |
|
|
(1,404 |
) |
|
|
(101 |
) |
|
|
(5,019 |
) |
|
Gain on sale of real estate |
|
|
2,025 |
|
|
|
4,052 |
|
|
|
9,620 |
|
|
|
10,332 |
|
|
Gain on sale of investment in related party |
|
|
8,500 |
|
|
|
— |
|
|
|
8,500 |
|
|
|
— |
|
|
Net income |
|
|
23,064 |
|
|
|
12,990 |
|
|
|
60,444 |
|
|
|
42,729 |
|
|
Net income attributable to non-controlling interests |
|
|
(1,797 |
) |
|
|
(1,042 |
) |
|
|
(4,631 |
) |
|
|
(3,460 |
) |
|
Net income attributable to Broadstone Net Lease, Inc. |
|
$ |
21,267 |
|
|
$ |
11,948 |
|
|
$ |
55,813 |
|
|
$ |
39,269 |
|
|
|
|
|
|
|
|
|
|
|
|
|
|
|
|
|
|
|
|
Weighted average number of common shares outstanding |
|
|
|
|
|
|
|
|
|
|
|
|
|
|
|
|
|
Basic |
|
|
20,554 |
|
|
|
17,617 |
|
|
|
19,850 |
|
|
|
16,607 |
|
|
Diluted |
|
|
22,291 |
|
|
|
19,147 |
|
|
|
21,496 |
|
|
|
18,069 |
|
|
Net earnings per common share |
|
|
|
|
|
|
|
|
|
|
|
|
|
|
|
|
|
Basic and diluted |
|
$ |
1.03 |
|
|
$ |
0.68 |
|
|
$ |
2.81 |
|
|
$ |
2.36 |
|
|
|
|
|
|
|
|
|
|
|
|
|
|
|
|
|
|
|
|
Comprehensive income |
|
|
|
|
|
|
|
|
|
|
|
|
|
|
|
|
|
Net income |
|
$ |
23,064 |
|
|
$ |
12,990 |
|
|
$ |
60,444 |
|
|
$ |
42,729 |
|
|
Other comprehensive income |
|
|
|
|
|
|
|
|
|
|
|
|
|
|
|
|
|
Change in fair value of interest rate swaps |
|
|
6,299 |
|
|
|
283 |
|
|
|
30,296 |
|
|
|
(1,448 |
) |
|
Realized (gain) loss on interest rate swaps |
|
|
(4 |
) |
|
|
— |
|
|
|
(4 |
) |
|
|
(873 |
) |
|
Comprehensive income |
|
|
29,359 |
|
|
|
13,273 |
|
|
|
90,736 |
|
|
|
40,408 |
|
|
Comprehensive income attributable to non-controlling interests |
|
|
(2,288 |
) |
|
|
(1,046 |
) |
|
|
(6,931 |
) |
|
|
(3,271 |
) |
|
Comprehensive income attributable to Broadstone Net Lease, Inc. |
|
$ |
27,071 |
|
|
$ |
12,227 |
|
|
$ |
83,805 |
|
|
$ |
37,137 |
|
The accompanying notes are an integral part of these condensed consolidated financial statements.
2
Broadstone Net Lease, Inc. and Subsidiaries
Condensed Consolidated Statements of Stockholders’ Equity
(Unaudited)
(in thousands, except per share amounts)
|
|
|
Common Stock |
|
|
Additional Paid-in Capital |
|
|
Subscriptions Receivable |
|
|
Cumulative Distributions in Excess of Retained Earnings |
|
|
Accumulated Other Comprehensive Income (Loss) |
|
|
Non- controlling Interests |
|
|
Total |
|
|||||||
|
Balance, January 1, 2017 |
|
$ |
15 |
|
|
$ |
1,009,431 |
|
|
$ |
(9,790 |
) |
|
$ |
(89,960 |
) |
|
$ |
2,092 |
|
|
$ |
86,749 |
|
|
$ |
998,537 |
|
|
Net income |
|
|
— |
|
|
|
— |
|
|
|
— |
|
|
|
39,269 |
|
|
|
— |
|
|
|
3,460 |
|
|
|
42,729 |
|
|
Issuance of 3,163 shares of common stock, net |
|
|
3 |
|
|
|
249,942 |
|
|
|
9,320 |
|
|
|
— |
|
|
|
— |
|
|
|
— |
|
|
|
259,265 |
|
|
Other offering costs |
|
|
— |
|
|
|
(1,144 |
) |
|
|
— |
|
|
|
— |
|
|
|
— |
|
|
|
— |
|
|
|
(1,144 |
) |
|
Issuance of 103 membership units |
|
|
— |
|
|
|
— |
|
|
|
— |
|
|
|
— |
|
|
|
— |
|
|
|
8,278 |
|
|
|
8,278 |
|
|
Distributions declared ($0.410 per share January 2017, $0.415 per share February through September 2017) |
|
|
— |
|
|
|
— |
|
|
|
— |
|
|
|
(62,034 |
) |
|
|
— |
|
|
|
(5,719 |
) |
|
|
(67,753 |
) |
|
Change in fair value of interest rate swap agreements |
|
|
— |
|
|
|
— |
|
|
|
— |
|
|
|
— |
|
|
|
(1,328 |
) |
|
|
(120 |
) |
|
|
(1,448 |
) |
|
Realized loss on interest rate swap agreements |
|
|
— |
|
|
|
— |
|
|
|
— |
|
|
|
— |
|
|
|
(804 |
) |
|
|
(69 |
) |
|
|
(873 |
) |
|
Conversion of one membership unit to one share of common stock |
|
|
— |
|
|
|
27 |
|
|
|
— |
|
|
|
— |
|
|
|
— |
|
|
|
(27 |
) |
|
|
— |
|
|
Redemption of 62 shares of common stock |
|
|
— |
|
|
|
(4,825 |
) |
|
|
— |
|
|
|
— |
|
|
|
— |
|
|
|
— |
|
|
|
(4,825 |
) |
|
Balance, September 30, 2017 |
|
$ |
18 |
|
|
$ |
1,253,431 |
|
|
$ |
(470 |
) |
|
$ |
(112,725 |
) |
|
$ |
(40 |
) |
|
$ |
92,552 |
|
|
$ |
1,232,766 |
|
|
|
|
Common Stock |
|
|
Additional Paid-in Capital |
|
|
Subscriptions Receivable |
|
|
Cumulative Distributions in Excess of Retained Earnings |
|
|
Accumulated Other Comprehensive Income |
|
|
Non- controlling Interests |
|
|
Total |
|
|||||||
|
Balance, January 1, 2018 |
|
$ |
19 |
|
|
$ |
1,301,979 |
|
|
$ |
(15 |
) |
|
$ |
(120,280 |
) |
|
$ |
5,122 |
|
|
$ |
97,376 |
|
|
$ |
1,284,201 |
|
|
Net income |
|
|
— |
|
|
|
— |
|
|
|
— |
|
|
|
55,813 |
|
|
|
— |
|
|
|
4,631 |
|
|
|
60,444 |
|
|
Issuance of 2,275 shares of common stock, net |
|
|
2 |
|
|
|
186,810 |
|
|
|
(1,675 |
) |
|
|
— |
|
|
|
— |
|
|
|
— |
|
|
|
185,137 |
|
|
Other offering costs |
|
|
— |
|
|
|
(822 |
) |
|
|
— |
|
|
|
— |
|
|
|
— |
|
|
|
— |
|
|
|
(822 |
) |
|
Issuance of 194 membership units |
|
|
— |
|
|
|
— |
|
|
|
— |
|
|
|
— |
|
|
|
— |
|
|
|
15,797 |
|
|
|
15,797 |
|
|
Distributions declared ($0.415 per share January 2018, $0.43 per share February through September 2018) |
|
|
— |
|
|
|
— |
|
|
|
— |
|
|
|
(76,650 |
) |
|
|
— |
|
|
|
(6,716 |
) |
|
|
(83,366 |
) |
|
Change in fair value of interest rate swap agreements |
|
|
— |
|
|
|
— |
|
|
|
— |
|
|
|
— |
|
|
|
27,995 |
|
|
|
2,301 |
|
|
|
30,296 |
|
|
Realized gain on interest rate swap agreements |
|
|
— |
|
|
|
— |
|
|
|
— |
|
|
|
— |
|
|
|
(3 |
) |
|
|
(1 |
) |
|
|
(4 |
) |
|
Conversion of eight membership units to eight shares of common stock |
|
|
— |
|
|
|
684 |
|
|
|
— |
|
|
|
— |
|
|
|
— |
|
|
|
(684 |
) |
|
|
— |
|
|
Redemption of 106 shares of common stock |
|
|
— |
|
|
|
(8,564 |
) |
|
|
— |
|
|
|
— |
|
|
|
— |
|
|
|
— |
|
|
|
(8,564 |
) |
|
Cancellation of nine shares of common stock |
|
|
— |
|
|
|
(748 |
) |
|
|
— |
|
|
|
— |
|
|
|
— |
|
|
|
— |
|
|
|
(748 |
) |
|
Balance, September 30, 2018 |
|
$ |
21 |
|
|
$ |
1,479,339 |
|
|
$ |
(1,690 |
) |
|
$ |
(141,117 |
) |
|
$ |
33,114 |
|
|
$ |
112,704 |
|
|
$ |
1,482,371 |
|
The accompanying notes are an integral part of these condensed consolidated financial statements.
3
Broadstone Net Lease, Inc. and Subsidiaries
Condensed Consolidated Statements of Cash Flows
(Unaudited)
(in thousands)
|
|
|
For the nine months ended September 30, |
|
|||||
|
|
|
2018 |
|
|
2017 |
|
||
|
Operating activities |
|
|
|
|
|
|
|
|
|
Net income |
|
$ |
60,444 |
|
|
$ |
42,729 |
|
|
Adjustments to reconcile net income including non-controlling interest to net cash provided by operating activities: |
|
|
|
|
|
|
|
|
|
Depreciation and amortization including intangibles associated with investment in rental property |
|
|
61,515 |
|
|
|
45,456 |
|
|
Provision for impairment of investment in rental properties |
|
|
2,061 |
|
|
|
2,608 |
|
|
Amortization of debt issuance costs charged to interest expense |
|
|
1,303 |
|
|
|
1,478 |
|
|
Straight-line rent and financing lease adjustments |
|
|
(15,640 |
) |
|
|
(12,505 |
) |
|
Cost of debt extinguishment |
|
|
101 |
|
|
|
5,019 |
|
|
Gain on sale of real estate |
|
|
(9,620 |
) |
|
|
(10,332 |
) |
|
Settlement of interest rate swap |
|
|
760 |
|
|
|
(1,965 |
) |
|
Gain on sale of investment in related party |
|
|
(8,500 |
) |
|
|
— |
|
|
Leasing fees paid |
|
|
(1,325 |
) |
|
|
(2,597 |
) |
|
Non-cash interest |
|
|
(4 |
) |
|
|
(1,349 |
) |
|
Other non-cash items |
|
|
472 |
|
|
|
325 |
|
|
Changes in assets and liabilities: |
|
|
|
|
|
|
|
|
|
Tenant and other receivables |
|
|
(65 |
) |
|
|
(237 |
) |
|
Prepaid expenses and other assets |
|
|
(799 |
) |
|
|
(440 |
) |
|
Accounts payable and other liabilities |
|
|
(893 |
) |
|
|
897 |
|
|
Accrued interest payable |
|
|
3,707 |
|
|
|
3,278 |
|
|
Net cash provided by operating activities |
|
|
93,517 |
|
|
|
72,365 |
|
|
|
|
|
|
|
|
|
|
|
|
Investing activities |
|
|
|
|
|
|
|
|
|
Acquisition of rental property accounted for using the operating method, net of mortgage assumed of $20,845 and $0 in 2018 and 2017, respectively |
|
|
(329,664 |
) |
|
|
(345,789 |
) |
|
Acquisition of rental property accounted for using the direct financing method |
|
|
(430 |
) |
|
|
(3,546 |
) |
|
Capital expenditures and improvements |
|
|
(4,182 |
) |
|
|
(3,871 |
) |
|
Proceeds from sale of investment in related party |
|
|
18,500 |
|
|
|
— |
|
|
Proceeds from disposition of rental property, net |
|
|
41,330 |
|
|
|
55,296 |
|
|
Increase in tenant and capital reserves |
|
|
(144 |
) |
|
|
(130 |
) |
|
Net cash used in investing activities |
|
|
(274,590 |
) |
|
|
(298,040 |
) |
|
|
|
|
|
|
|
|
|
|
|
Financing activities |
|
|
|
|
|
|
|
|
|
Proceeds from issuance of common stock, net |
|
|
146,791 |
|
|
|
229,698 |
|
|
Redemptions of common stock |
|
|
(8,564 |
) |
|
|
(4,825 |
) |
|
Borrowings on mortgages, notes payable and unsecured term notes, net of mortgages assumed of $20,845 and $0 in 2018 and 2017, respectively |
|
|
415,000 |
|
|
|
400,000 |
|
|
Principal payments on mortgages and notes payable |
|
|
(33,930 |
) |
|
|
(384,087 |
) |
|
Borrowings on unsecured revolver |
|
|
189,500 |
|
|
|
220,000 |
|
|
Repayments on unsecured revolver |
|
|
(462,500 |
) |
|
|
(195,500 |
) |
|
Cash distributions paid to stockholders |
|
|
(38,410 |
) |
|
|
(32,533 |
) |
|
Cash distributions paid to non-controlling interests |
|
|
(6,630 |
) |
|
|
(5,669 |
) |
|
Debt issuance costs paid |
|
|
(2,255 |
) |
|
|
(9,889 |
) |
|
Net cash provided by financing activities |
|
|
199,002 |
|
|
|
217,195 |
|
|
Net increase (decrease) in cash and cash equivalents and restricted cash |
|
|
17,929 |
|
|
|
(8,480 |
) |
|
Cash and cash equivalents and restricted cash at beginning of period |
|
|
10,099 |
|
|
|
23,103 |
|
|
Cash and cash equivalents and restricted cash at end of period |
|
$ |
28,028 |
|
|
$ |
14,623 |
|
|
|
|
|
|
|
|
|
|
|
|
Reconciliation of cash and cash equivalents and restricted cash |
|
|
|
|
|
|
|
|
|
Cash and cash equivalents at beginning of period |
|
$ |
9,355 |
|
|
$ |
21,635 |
|
|
Restricted cash at beginning of period |
|
|
744 |
|
|
|
1,468 |
|
|
Cash and cash equivalents and restricted cash at beginning of period |
|
$ |
10,099 |
|
|
$ |
23,103 |
|
|
|
|
|
|
|
|
|
|
|
|
Cash and cash equivalents at end of period |
|
$ |
17,301 |
|
|
$ |
13,698 |
|
|
Restricted cash at end of period |
|
|
10,727 |
|
|
|
925 |
|
|
Cash and cash equivalents and restricted cash at end of period |
|
$ |
28,028 |
|
|
$ |
14,623 |
|
The accompanying notes are an integral part of these condensed consolidated financial statements.
4
Broadstone Net Lease, Inc. and Subsidiaries
Notes to the Condensed Consolidated Financial Statements (Unaudited)
(in thousands)
1. Business Description
Broadstone Net Lease, Inc. (the “Corporation”) is a Maryland corporation formed on October 18, 2007, that elected to be taxed as a real estate investment trust (“REIT”) commencing with the taxable year ended December 31, 2008. The Corporation focuses on investing in income-producing, net leased commercial properties. The Corporation leases properties to retail, healthcare, industrial, office, and other commercial businesses under long-term net lease agreements. As of September 30, 2018, the Corporation owned a diversified portfolio of 583 individual net leased commercial properties located in 42 states throughout the continental United States.
Broadstone Net Lease, LLC (the “Operating Company”), is the entity through which the Corporation conducts its business and owns (either directly or through subsidiaries) all of the Corporation’s properties. The Corporation is the sole managing member and primary owner of the economic interest of the Operating Company. The remaining interests in the Operating Company, which are referred to as non-controlling interests, are held by members who acquired their interest by contributing property to the Operating Company in exchange for membership units of the Operating Company. As the Corporation conducts substantially all of its operations through the Operating Company, it is structured as what is referred to as an Umbrella Partnership Real Estate Investment Trust (“UPREIT”). The following table summarizes the economic ownership interest in the Operating Company as of September 30, 2018 and December 31, 2017:
|
Percentage of shares owned by |
|
September 30, 2018 |
|
|
December 31, 2017 |
|
||
|
Corporation |
|
|
92.4 |
% |
|
|
92.4 |
% |
|
Non-controlling interests |
|
|
7.6 |
% |
|
|
7.6 |
% |
|
|
|
|
100.0 |
% |
|
|
100.0 |
% |
The Corporation operates under the direction of its board of directors (the “Board of Directors”), which is responsible for the management and control of the Company’s (as defined below) affairs. The Corporation is externally managed and its board of directors has retained the Corporation’s sponsor, Broadstone Real Estate, LLC (the “Manager”) and Broadstone Asset Management, LLC (the “Asset Manager”) to manage the Corporation’s day-to-day affairs, to implement the Corporation’s investment strategy, and to provide certain property management services for the Corporation’s properties, subject to the Board of Directors’ direction, oversight, and approval. The Asset Manager is a wholly-owned subsidiary of the Manager and all of the Corporation’s officers are employees of the Manager. Accordingly, both the Manager and the Asset Manager are related parties of the Company. Refer to Note 3 for further discussion over related parties and related party transactions.
2. Summary of Significant Accounting Policies
Interim Information
The accompanying Condensed Consolidated Financial Statements have been prepared in accordance with accounting principles generally accepted in the United States of America (“GAAP”) for interim financial information (Accounting Standards Codification (“ASC”) 270, Interim Reporting) and Article 10 of the Securities and Exchange Commission’s (“SEC”) Regulation S-X. Accordingly, the Corporation has omitted certain footnote disclosures which would substantially duplicate those contained within the audited consolidated financial statements for the year ended December 31, 2017, included in the Company’s 2017 Annual Report on Form 10-K, filed with the SEC on March 15, 2018. Therefore, the readers of this quarterly report should refer to those audited consolidated financial statements, specifically Note 2, Summary of Significant Accounting Policies, for further discussion of significant accounting policies and estimates. The Corporation believes all adjustments necessary for a fair presentation have been included in these interim Condensed Consolidated Financial Statements (which include only normal recurring adjustments).
Principles of Consolidation
The Condensed Consolidated Financial Statements include the accounts and operations of the Corporation, the Operating Company and its consolidated subsidiaries, all of which are wholly owned by the Operating Company (collectively, the “Company”). All intercompany balances and transactions have been eliminated in consolidation.
5
To the extent the Corporation has a variable interest in entities that are not evaluated under the variable interest entity (“VIE”) model, the Corporation evaluates its interests using the voting interest entity model. The Corporation holds a 92.4% interest in the Operating Company at September 30, 2018, and is the sole managing member of the Operating Company, which gives the Corporation exclusive and complete responsibility for the day-to-day management, authority to make decisions, and control of the Operating Company. Based on consolidation guidance, the Corporation concluded that the Operating Company is a VIE as the members in the Operating Company do not possess kick-out rights or substantive participating rights. Accordingly, the Corporation consolidates its interest in the Operating Company. However, as the Corporation holds the majority voting interest in the Operating Company, it qualifies for the exemption from providing certain disclosure requirements associated with investments in VIEs.
The portion of the Operating Company not owned by the Corporation is presented as non-controlling interests as of and during the periods presented.
Basis of Accounting
The Condensed Consolidated Financial Statements have been prepared in accordance with GAAP.
Use of Estimates
The preparation of Condensed Consolidated Financial Statements in conformity with GAAP requires management to make certain estimates and assumptions that affect the reported amounts of assets and liabilities and disclosure of contingent assets and liabilities at the date of the Condensed Consolidated Financial Statements and the reported amounts of revenues and expenses during the reporting periods. Significant estimates include, but are not limited to, the allocation of purchase price between investment in rental property and intangible assets acquired and liabilities assumed, the value of long-lived assets, the provision for impairment, the depreciable lives of rental property, the amortizable lives of intangible assets and liabilities, the allowance for doubtful accounts, the fair value of assumed debt and notes payable, the fair value of the Company’s interest rate swap agreements, and the determination of any uncertain tax positions. Accordingly, actual results may differ from those estimates.
Restricted Cash
Restricted cash includes escrow funds the Company maintains pursuant to the terms of certain mortgage and notes payable and lease agreements, and undistributed proceeds from the sale of properties under Section 1031 of the Internal Revenue Code.
The Company reviews long-lived assets to be held and used for possible impairment when events or changes in circumstances indicate that their carrying amounts may not be recoverable. If and when such events or changes in circumstances are present, an impairment exists to the extent the carrying value of the asset or asset group exceeds the sum of the undiscounted cash flows expected to result from the use of the asset or asset group and its eventual disposition. Such cash flows include expected future operating income, as adjusted for trends and prospects, as well as the effects of demand, competition, and other factors. An impairment loss is measured as the amount by which the carrying amount of the asset or asset group exceeds the fair value of the asset or asset group. A significant judgment is made as to if and when impairment should be taken. If our strategy, or one or more of the assumptions described above were to change in the future, an impairment may need to be recognized.
Inputs used in establishing fair value for real estate assets generally fall within Level 3 of the fair value hierarchy, which are characterized as requiring significant judgment as little or no current market activity may be available for validation. The main indicator used to establish the classification of the inputs is current market condition, as derived through our use of published commercial real estate market information. The Company determines the valuation of impaired assets using generally accepted valuation techniques including discounted cash flow analysis, income capitalization, analysis of recent comparable sales transactions, actual sales negotiations and bona fide purchase offers received from third parties. Management may consider a single valuation technique or multiple valuation techniques, as appropriate, when estimating the fair value of its real estate.
During the three months ended September 30, 2018 and 2017 we recorded impairment of $2,061 and $2,608, respectively, which resulted from non-payment of rental amounts, concerns over the respective tenant’s future viability, and changes to the overall investment strategy for certain real estate assets. The amount of the impairment charge was based on our consideration of the factors detailed above. In determining the fair value of the impaired assets at September 30, 2018, the time of measurement, we utilized capitalization rates ranging from 7.50% to 10.00% and a weighted average discount rate of 8.00%. In determining the fair value of the impaired assets at September 30, 2017, the time of measurement, we utilized capitalization rates ranging from 7.25% to 12.00%, and a weighted average discount rate of 8.00%.
6
The Company has reduced the carrying value of the impaired real estate assets to the estimated fair value as detailed below:
|
|
|
September 30, 2018 |
|
|
September 30, 2017 |
|
||||||||||||||||||
|
(in thousands) |
|
Carrying Amount |
|
|
Allocation of Impairment |
|
|
Net Carrying Amount |
|
|
Carrying Amount |
|
|
Allocation of Impairment |
|
|
Net Carrying Amount |
|
||||||
|
Investment in rental property accounted for using the operating method, net of accumulated depreciation |
|
$ |
12,834 |
|
|
$ |
(1,702 |
) |
|
$ |
11,132 |
|
|
$ |
16,159 |
|
|
$ |
(2,401 |
) |
|
$ |
13,758 |
|
|
Intangible lease assets, net |
|
|
2,305 |
|
|
|
(384 |
) |
|
|
1,921 |
|
|
|
1,263 |
|
|
|
(204 |
) |
|
|
1,059 |
|
|
Leasing fees, net |
|
|
131 |
|
|
|
(19 |
) |
|
|
112 |
|
|
|
123 |
|
|
|
(16 |
) |
|
|
107 |
|
|
Intangible lease liabilities, net |
|
|
(989 |
) |
|
|
44 |
|
|
|
(945 |
) |
|
|
(101 |
) |
|
|
13 |
|
|
|
(88 |
) |
|
|
|
$ |
14,281 |
|
|
$ |
(2,061 |
) |
|
$ |
12,220 |
|
|
$ |
17,444 |
|
|
$ |
(2,608 |
) |
|
$ |
14,836 |
|
Revenue Recognition
At the inception of a new lease arrangement, including new leases that arise from amendments, the Company assesses the terms and conditions to determine the proper lease classification. A lease arrangement is classified as an operating lease if none of the following criteria are met: (i) ownership transfers to the lessee prior to or shortly after the end of the lease term, (ii) lessee has a bargain purchase option during or at the end of the lease term, (iii) the lease term is greater than or equal to 75% of the underlying property’s estimated useful life, or (iv) the present value of the future minimum lease payments (excluding executory costs) is greater than or equal to 90% of the fair value of the leased property. If one or more of these criteria are met, and the minimum lease payments are determined to be reasonably predictable and collectible, the lease arrangement is generally accounted for as a direct financing lease. Consistent with Financial Accounting Standards Board (“FASB”) ASC 840, Leases, if the fair value of the land component is 25% or more of the total fair value of the leased property, the land is considered separately from the building for purposes of applying the lease term and minimum lease payments criterion in (iii) and (iv) above.
Revenue recognition methods for operating leases and direct financing leases are described below:
Rental property accounted for under operating leases – Revenue is recognized as rents are earned on a straight-line basis over the non-cancelable terms of the related leases. In most cases, revenue recognition under operating leases begins when the lessee takes possession of, or controls, the physical use of the leased asset. Generally, this occurs on the lease commencement date. For leases that have fixed and measurable rent escalations, the difference between such rental income earned and the cash rent due under the provisions of the lease is recorded as Accrued rental income on the Condensed Consolidated Balance Sheets.
Rental property accounted for under direct financing leases – The Company utilizes the direct finance method of accounting to record direct financing lease income. For a lease accounted for as a direct financing lease, the net investment in the direct financing lease represents receivables for the sum of future minimum lease payments and the estimated residual value of the leased property, less the unamortized unearned income. Unearned income is deferred and amortized into income over the lease terms so as to produce a constant periodic rate of return on the Company’s net investment in the leases.
Adoption of ASU 2014-09, described further in Recently Adopted Accounting Standards elsewhere in Note 2, did not have an impact on the nature, amount or timing of revenue recognized for operating leases and direct financing leases as revenue from these sources is derived from lease contracts and therefore falls outside the scope of this guidance.
Sales of Real Estate
As described further in Recently Adopted Accounting Standards elsewhere in Note 2, the Company adopted ASU 2017-05, effective January 1, 2018. Under ASU 2017-05, the Company’s sales of real estate are generally considered to be sales to non-customers, requiring the Company to identify each distinct non-financial asset promised to the buyer. The Company determines whether the buyer obtains control of the non-financial assets, achieved through the transfer of the risks and rewards of ownership of the non-financial assets. If control is transferred to the buyer, the Company derecognizes the asset.
If the Company determines that it did not transfer control of the non-financial assets to the buyer, the Company will analyze the contract for separate performance obligations and allocate a portion of the sales price to each performance obligation. As performance obligations are satisfied, the Company will recognize the respective income in the Condensed Consolidated Statements of Income and Comprehensive Income.
The Company accounts for discontinued operations if disposals of properties represent a strategic shift in operations. Those strategic shifts would need to have a major effect on the Company’s operations and financial results in order to meet the definition.
7
Rent received in advance represents tenant payments received prior to the contractual due date and are included in Accounts payable and other liabilities on the Condensed Consolidated Balance Sheets. Rents received in advance at September 30, 2018 and December 31, 2017 are as follows:
|
(in thousands) |
|
September 30, 2018 |
|
|
December 31, 2017 |
|
||
|
Rents received in advance |
|
$ |
6,396 |
|
|
$ |
8,585 |
|
Allowance for Doubtful Accounts
Management periodically reviews the sufficiency of the allowance for doubtful accounts, taking into consideration its historical losses and existing economic conditions, and adjusts the allowance as it considers necessary. Uncollected tenant receivables are written off against the allowance when all possible means of collection have been exhausted.
The following table summarizes the changes in the allowance for doubtful accounts for the nine months ended September 30, 2018 and the year ended December 31, 2017:
|
(in thousands) |
|
September 30, 2018 |
|
|
December 31, 2017 |
|
||
|
Beginning balance |
|
$ |
742 |
|
|
$ |
323 |
|
|
Provision for doubtful accounts |
|
|
1,053 |
|
|
|
419 |
|
|
Write-offs |
|
|
(177 |
) |
|
|
— |
|
|
Ending balance |
|
$ |
1,618 |
|
|
$ |
742 |
|
Derivative Instruments
The Company uses interest rate swap agreements to manage risks related to interest rate movements. The interest rate swap agreements, designated and qualifying as cash flow hedges, are reported at fair value. The gain or loss on the qualifying hedges is initially included as a component of other comprehensive income or loss and is subsequently reclassified into earnings when interest payments (the forecasted transactions) on the related debt are incurred and as the swap net settlements occur. When an existing cash flow hedge is terminated, the Company determines the accounting treatment for the accumulated gain or loss recognized in Accumulated other comprehensive income based on the probability of the hedged forecasted transaction occurring within the period the cash flow hedge was anticipated to affect earnings. If the Company determines that the hedged forecasted transaction is probable of occurring during the original period, the accumulated gain or loss is reclassified into earnings over the remaining life of the cash flow hedge using a straight-line method, which approximates an effective interest method. If the Company determines that the hedged forecasted transaction is not probable of occurring during the original period, the entire amount of accumulated gain or loss is reclassified into earnings in the period the cash flow hedge is terminated. The Company documents its risk management strategy and hedge effectiveness at the inception of and during the term of each hedge. The Company’s interest rate risk management strategy is intended to stabilize cash flow requirements by maintaining interest rate swap agreements to convert certain variable-rate debt to a fixed rate.
Non-controlling Interests
Non-controlling interests represents the membership interests held in the Operating Company of 7.6% at September 30, 2018 and December 31, 2017, by third parties which are accounted for as a separate component of equity.
The Company periodically adjusts the carrying value of non-controlling interests to reflect their share of the book value of the Operating Company. Such adjustments are recorded to Additional paid-in capital as a reallocation of Non-controlling interests in the Condensed Consolidated Statements of Stockholders’ Equity.
8
ASC 820, Fair Value Measurements and Disclosures, defines fair value as the price that would be received for an asset or paid to transfer a liability (an exit price) in the principal or most advantageous market for the asset or liability in an orderly transaction between market participants on the measurement date. ASC 820 also establishes a three-tier fair value hierarchy, which prioritizes the inputs used in measuring fair value.
The balances of financial instruments measured at fair value on a recurring basis at September 30, 2018 and December 31, 2017 are as follows (see Note 10):
|
|
|
September 30, 2018 |
|
|||||||||||||
|
(in thousands) |
|
Total |
|
|
Level 1 |
|
|
Level 2 |
|
|
Level 3 |
|
||||
|
Interest rate swap, assets |
|
$ |
35,525 |
|
|
$ |
— |
|
|
$ |
35,525 |
|
|
$ |
— |
|
|
Interest rate swap, liabilities |
|
|
— |
|
|
|
— |
|
|
|
— |
|
|
|
— |
|
|
|
|
$ |
35,525 |
|
|
$ |
— |
|
|
$ |
35,525 |
|
|
$ |
— |
|
|
|
|
December 31, 2017 |
|
|||||||||||||
|
(in thousands) |
|
Total |
|
|
Level 1 |
|
|
Level 2 |
|
|
Level 3 |
|
||||
|
Interest rate swap, assets |
|
$ |
11,008 |
|
|
$ |
— |
|
|
$ |
11,008 |
|
|
$ |
— |
|
|
Interest rate swap, liabilities |
|
|
(5,020 |
) |
|
|
— |
|
|
|
(5,020 |
) |
|
|
— |
|
|
|
|
$ |
5,988 |
|
|
$ |
— |
|
|
$ |
5,988 |
|
|
$ |
— |
|
The Company has estimated that the carrying amount reported on the Condensed Consolidated Balance Sheets for Cash and cash equivalents, Restricted cash, Tenant and other receivables, net, Notes receivable, and Accounts payable and other liabilities approximates their fair values due to their short-term nature.
The following table summarizes the carrying amount reported on the Condensed Consolidated Balance Sheets and the Company’s estimate of the fair value of the Mortgage and notes payable, net, Unsecured term notes, net, and Unsecured revolver at September 30, 2018 and December 31, 2017:
|
(in thousands) |
|
September 30, 2018 |
|
|
December 31, 2017 |
|
||
|
Carrying amount |
|
$ |
1,310,278 |
|
|
$ |
1,181,470 |
|
|
Fair value |
|
|
1,264,797 |
|
|
|
1,177,197 |
|
The fair value of the Company’s debt was estimated using Level 2 and Level 3 inputs based on recent financing transactions, estimates of the fair value of the property that serves as collateral for such debt, historical risk premiums for loans of comparable quality, current LIBOR, US treasury obligation interest rates, and on the discounted estimated future cash payments to be made on such debt. The discount rates estimated reflect the Company’s judgment as to the approximate current lending rates for loans or groups of loans with similar maturities and assumes that the debt is outstanding through maturity. Market information, as available, or present value techniques were utilized to estimate the amounts required to be disclosed. Since such amounts are estimates that are based on limited available market information for similar transactions and do not acknowledge transfer or other repayment restrictions that may exist on specific loans, it is unlikely that the estimated fair value of any such debt could be realized by immediate settlement of the obligation.
As disclosed under the Long-lived Asset Impairment section elsewhere in Note 2, the Company’s non-recurring fair value measurements at September 30, 2018 consisted of the fair value of impaired real estate assets that were determined using Level 3 inputs.
9
Taxes Collected From Tenants and Remitted to Governmental Authorities
In most situations, the Company’s properties are leased on a triple-net basis, which provides that the tenants are responsible for the payment of all property operating expenses, including, but not limited to, property taxes, maintenance, insurance, repairs, and capital costs, during the lease term. The Company records such expenses on a net basis.
The following table summarizes the approximate property tax payments made directly to the taxing authorities by the Company’s tenants, pursuant to their lease obligations, for the three and nine months ended September 30, 2018 and 2017:
|
|
|
For the three months ended September 30, |
|
|
For the nine months ended September 30, |
|
||||||||||
|
(in thousands) |
|
2018 |
|
|
2017 |
|
|
2018 |
|
|
2017 |
|
||||
|
Property taxes paid by tenants directly to taxing authority |
|
$ |
3,777 |
|
|
$ |
2,448 |
|
|
$ |
15,745 |
|
|
$ |
13,405 |
|
In other situations, the Company may collect property taxes from its tenants and remit those taxes to governmental authorities. Taxes collected from tenants and remitted to governmental authorities are presented on a gross basis, where revenue is included in Operating expenses reimbursed from tenants and expense is included in Property and operating expense in the accompanying Condensed Consolidated Statements of Income and Comprehensive Income.
The following table summarizes taxes collected from tenants and remitted to governmental authorities for the three and nine months ended September 30, 2018 and 2017:
|
|
|
For the three months ended September 30, |
|
|
For the nine months ended September 30, |
|
||||||||||
|
(in thousands) |
|
2018 |
|
|
2017 |
|
|
2018 |
|
|
2017 |
|
||||
|
Property taxes collected from tenants |
|
$ |
1,238 |
|
|
$ |
608 |
|
|
$ |
3,648 |
|
|
$ |
1,787 |
|
|
Property taxes remitted on behalf of tenants |
|
|
1,451 |
|
|
|
885 |
|
|
|
3,924 |
|
|
|
2,084 |
|
Recently Adopted Accounting Standards
In August 2017, the FASB issued Accounting Standards Update (“ASU”) 2017-12, Derivatives and Hedging (Topic 815): Targeted Improvements to Accounting for Hedging Activities. ASU 2017-12 amends the designation and measurement guidance for qualifying hedging transactions and the presentation of hedge results in an entity’s financial statements. The new guidance removes the concept of separately measuring and reporting hedge ineffectiveness and requires a company to present the earnings effect of the hedging instrument in the same income statement line item in which the earnings effect of the hedged item is reported. Disclosure requirements have been modified to include a tabular disclosure related to the effect of hedging instruments on the income statement and eliminate the requirement to disclose the ineffective portion of the change in fair value of such instruments. The new guidance is effective January 1, 2019, with early adoption permitted, and provides companies with a modified retrospective transition method for each cash flow and net investment hedge relationship existing on the date of adoption. This adoption method requires a company to recognize the cumulative effect of initially applying the ASU as an adjustment to accumulated other comprehensive income with a corresponding adjustment to the opening balance of retained earnings as of the beginning of the fiscal year that an entity adopts the update. The Company adopted the guidance effective January 1, 2018. The Company did not recognize a cumulative effect adjustment upon adoption as the Company had not recognized ineffectiveness on any of the hedging instruments existing as of the date of adoption.
In November 2016, the FASB issued ASU 2016-18, Statement of Cash Flows—Restricted Cash. ASU 2016-18 requires that the statement of cash flows explain the change during the period in the total of cash, cash equivalents, and amounts generally described as restricted cash or cash equivalents. Therefore, amounts generally described as restricted cash and equivalents should be included with cash and cash equivalents when reconciling the beginning and end of period total amounts on the statement of cash flows. Previously, there had been no specific guidance to address how to classify or present these changes. ASU 2016-18 became effective, on a retrospective basis, for interim and annual periods beginning after December 15, 2017, with early adoption permitted. The Company adopted ASU 2016-18 as of January 1, 2018. In line with the retrospective adoption of this standard, the Company removed the change in restricted cash from cash flows used in investing activities of $543 for the nine months ended September 30, 2017. See Reclassifications elsewhere in Note 2.
10
In August 2016, the FASB issued ASU 2016-15, Classification of Certain Cash Receipts and Cash Payments. ASU 2016-15 provides classification guidance for eight specific topics, including but not limited to, debt extinguishment costs, contingent consideration payments made after a business combination, and distributions received from equity method investees. ASU 2016-15 became effective, on a retrospective basis, for interim and annual periods beginning after December 15, 2017, with early adoption permitted. The Company adopted ASU 2016-15 as of January 1, 2018. The classification of debt extinguishment costs in the Condensed Consolidated Statements of Cash Flows addressed by ASU 2016-15 is applicable to the Company. However, adoption of this guidance did not have an impact on the Company’s Condensed Consolidated Statements of Cash Flows, as the Company historically classified these cash flows as required by the guidance.
In May 2014, the FASB issued ASU 2014-09, Revenue from Contracts with Customers (Topic 606). ASU 2014-09, including all updates, is a comprehensive new revenue recognition model requiring a company to recognize revenue to depict the transfer of goods or services to a customer at an amount reflecting the consideration it expects to receive in exchange for those goods or services. In adopting ASU 2014-09, companies may use either a full retrospective or a modified retrospective approach. Additionally, this guidance requires improved disclosures regarding the nature, amount, timing, and uncertainty of revenue and cash flows arising from contracts with customers. The Company adopted ASU 2014-09 as of January 1, 2018 on a modified retrospective basis. The adoption had no effect on the Company’s Condensed Consolidated Financial Statements as the Company’s revenues are lease related, which are not subject to the provisions of ASU 2014-09.
In February 2017, the FASB issued ASU 2017-05, Other Income – Gains and Losses from the Derecognition of Nonfinancial Assets. This new guidance was required to be adopted concurrently with the amendments in ASU 2014-09. The new pronouncement adds guidance for partial sales of nonfinancial assets, including real estate. In adopting ASU 2017-05, companies may use either a full retrospective or a modified retrospective approach. The Company previously recognized revenue on sales of real estate at the time the asset was transferred (i.e., at the time of closing). Upon adoption of ASU 2014-09, as discussed above, and therefore ASU 2017-05, the Company now evaluates any separate contract or performance obligation to determine proper timing of revenue recognition, as well as sales price allocation when a performance obligation is identified. Adoption of this pronouncement had no effect on the Company’s Condensed Consolidated Financial Statements during the three or nine months ended September 30, 2018 or in any periods.
Other Recently Issued Accounting Standards
In February 2016, the FASB issued ASU 2016-02, Leases (Topic 842), which supersedes the existing guidance for lease accounting, Leases (Topic 840). ASU 2016-02 requires lessees to recognize a right-of-use asset and a corresponding lease liability, initially measured at the present value of lease payments, for both operating and financing leases. For leases with a term of 12 months or less, lessees will be permitted to make an accounting policy election by class of underlying asset to not recognize lease liabilities and lease assets. Under the new pronouncement, lessor accounting will be largely unchanged from existing GAAP, however disclosures will be expanded. The standard also eliminates current real estate-specific provisions and changes the guidance on sale-leaseback transactions, initial direct costs and lease executory costs for all entities. The provisions of ASU 2016-02 that are relevant to the Company’s accounting as lessor include those relating to 1) identification of non-lease components of leases, 2) lease classification tests and 3) requirements to expense, on an as-incurred basis, certain initial direct costs that are not incremental in negotiating a lease. Under existing standards, certain of these costs are capitalizable and, therefore, adoption of this new standard may result in these costs being expensed as incurred. The Company is primarily a lessor and does not have any material leases where it is the lessee. Adoption of ASU 2016-02 is therefore not expected to have a material impact on the Company’s Condensed Financial Statements as it relates to leases where the Company is the lessee. Upon adoption of ASC 842, the Company may be required to record certain expenses paid directly by tenants that protect the Company’s interest as lessor in those properties, such as real estate taxes, on a gross basis, where revenue and the corresponding expense will be recorded and presented in the Consolidated Statements of Income and Comprehensive Income. The Company currently records and presents certain of these items on a net basis (see Taxes Collected From Tenants and Remitted to Governmental Authorities elsewhere in Note 2). Although there is not expected to be any impact to net income or cash flows as a result of a gross presentation of these payments, such presentation would have the impact of increasing both reported revenues and property expenses. The FASB recently decided to add additional guidance to ASC 842 to address the accounting treatment for these types of payments, and on October 31, 2018, tentatively concluded that lessors should exclude costs paid directly by the lessees from their financial statements; the Company will evaluate final guidance as it becomes available and continue to assess the impact of this potential change in presentation. The new standard provides a number of practical expedients that both lessors and lessees may elect as part of transitional reporting. These include 1) an election not to reassess upon transition whether any expired or existing contracts are leases or contain leases, the lease classification for any expired or existing leases, and initial direct costs for existing leases, and 2) an election to use hindsight when evaluating the lease term of existing contracts, and impairment of right of use assets. The Company currently anticipates it will only elect the first of these practical expedients.
11
As originally published, when adopting ASC 842, companies were required to recognize and measure leases at the beginning of the earliest period presented using a modified retrospective approach. In July 2018, the FASB issued ASU 2018-11, Leases (Topic 842) Targeted Improvements. ASU 2018-11 provides entities an additional (and optional) transition method to initially apply the new leases standard at the adoption date and recognize a cumulative-effect adjustment to the opening balance of retained earnings in the period of adoption. Consequently, an entity’s reporting for the comparative periods presented in the financial statements in which it adopts the new leases standard will continue to be in accordance with current GAAP (Topic 840, Leases). An entity that elects this additional transition method must provide the required ASC 840 disclosures for all periods that continue to be in accordance with ASC 840. The amendments do not change the existing disclosure requirements in ASC 840. The Company plans to adopt this optional transition method. ASU 2018-11 also provides lessors with a practical expedient, by class of underlying asset, to not separate nonlease components from the associated lease component and, instead, to account for those components as a single component if the nonlease components otherwise would be accounted for under the new revenue guidance (ASC 606) and certain conditions are met. If the nonlease component or components associated with the lease component are the predominant component of the combined component, an entity would account for the combined component in accordance with ASC 606. Otherwise, the entity would account for the combined component in accordance with ASC 842. The Company plans to elect this additional practical expedient, and based on its assessment of the current leases in its portfolio, anticipates that the combined components will be accounted for in accordance with ASC 842.
The amendments are effective January 1, 2019, with early adoption permitted. The Company has completed its initial inventory of leases and has identified changes needed to its processes and systems impacted by the new standard. The Company is continuing to evaluate the impact that adoption of this guidance will have on its Condensed Consolidated Financial Statements and footnote disclosures.
In August 2018, the FASB issued ASU 2018-13, Fair Value Measurement (Topic 820) Disclosure Framework—Changes to the Disclosure Requirements for Fair Value Measurement. The amendments under ASU 2018-13 remove, add and modify certain disclosure requirements on fair value measurements in ASC 820. The amendments are effective for fiscal years, and interim periods within those fiscal years, beginning after December 15, 2019. The Company is currently evaluating the impact the new standard will have on its Condensed Consolidated Financial Statements.
Reclassifications
As described below, certain prior period amounts have been reclassified to conform with the current period’s presentation.
In connection with the adoption of ASU 2016-18, discussed in Recently Adopted Accounting Standards elsewhere in Note 2, certain reclassifications have been made to prior period balances to conform to current presentation in the Condensed Consolidated Statements of Cash Flows. Under ASU 2016-18, changes in restricted cash which were previously shown in cash flows used in investing activities in the Condensed Consolidated Statements of Cash Flows are now reflected as part of the total change in cash, cash equivalents and restricted cash in the Condensed Consolidated Statements of Cash Flows.
3. Related-Party Transactions
Property Management Agreement
The Corporation and the Operating Company are a party to a property management agreement (as amended, the “Property Management Agreement”) with the Manager, a related party in which certain directors of the Corporation have either a direct or indirect ownership interest. Under the terms of the Property Management Agreement, the Manager manages and coordinates certain aspects of the leasing of the Corporation’s rental property.
In exchange for services provided under the Property Management Agreement, the Manager receives certain fees and other compensation as follows:
|
|
(a) |
3% of gross rentals collected each month from the rental property for property management services (other than one property, which has a separate agreement for 5% of gross rentals); and |
|
|
(b) |
Re-leasing fees for existing rental property equal to one month’s rent for a new lease with an existing tenant and two months’ rent for a new lease with a new tenant. |
12
Effective January 1, 2018, the Property Management Agreement was amended to, among other things, extend the recurring term of the agreement from one year to three years, clarify termination provisions, include a Termination Event concept and a Key Person Event concept, each as defined in the Property Management Agreement, and remove fee provisions relating to short-term financing or guarantees provided by the Manager to the Operating Company.
The Property Management Agreement will automatically renew on January 1, 2019 for three years ending December 31, 2021, subject to earlier termination pursuant to the terms of the Property Management Agreement. The Property Management Agreement provides for termination (i) immediately by the Corporation’s Independent Directors Committee (“IDC”) for Cause, as defined in the Property Management Agreement, (ii) by the IDC, upon 30 days’ written notice to the Manager, in connection with a change of control of the Manager, as defined in the Property Management Agreement, (iii) by the IDC, by providing the Manager with written notice of termination not less than one year prior to the last calendar day of any renewal term, (iv) by the Manager upon written notice to the Company not less than one year prior to the last calendar day of any renewal period, (v) automatically in the event of a Termination Event, and (vi) by the IDC upon a Key Person Event.
If the Corporation terminates the agreement prior to any renewal term or in any manner described above, other than termination by the Corporation for Cause, the Corporation will be subject to a termination fee equal to three times the Management Fees, as defined in the Property Management Agreement, to which the Manager was entitled during the 12-month period immediately preceding the date of such termination. Although not terminable as of September 30, 2018, if the Property Management Agreement had been terminated at September 30, 2018, subject to the conditions noted above, the termination fee would have been $18,435.
Asset Management Agreement
The Corporation and the Operating Company are party to an asset management agreement (as amended, the “Asset Management Agreement”) with the Asset Manager, a single member limited liability company with the Manager as the single member, and therefore a related party in which certain directors of the Corporation have an indirect ownership interest. Under the terms of the Asset Management Agreement, the Asset Manager is responsible for, among other things, the Corporation’s acquisition, initial leasing, and disposition strategies, financing activities, and providing support to the Corporation’s IDC for its valuation functions and other duties. The Asset Manager also designates two individuals to serve on the Board of Directors of the Corporation.
Effective January 1, 2018, the Asset Management Agreement was amended to, among other things, extend the recurring term of the agreement from one year to three years, provide for additional disposition fee provisions, and include a Disposition Event concept and Key Person Event concept, each as defined in the amended Asset Management Agreement. The Asset Management Agreement defines a Disposition Event in the same manner as a Termination Event is defined in the Property Management Agreement discussed above.
Under the terms of the Asset Management Agreement, the Asset Manager is compensated as follows:
|
|
(a) |
a quarterly asset management fee equal to 0.25% of the aggregate value of common stock, based on the per share value as determined by the IDC each quarter, on a fully diluted basis as if all interests in the Operating Company had been converted into shares of the Corporation’s common stock; |
|
|
(b) |
0.5% of the proceeds from future equity closings as reimbursement for offering, marketing, and brokerage expenses; |
|
|
(c) |
1% of the gross purchase price paid for each rental property acquired (other than acquisitions described in (d) below), including any property contributed in exchange for membership interests in the Operating Company; |
|
|
(d) |
2% of the gross purchase price paid for each rental property acquired in the event that the acquisition of a rental property requires a new lease (as opposed to the assumption of an existing lease), such as a sale-leaseback transaction; |
|
|
(e) |
1% of the gross sale price received for each rental property disposition; and |
|
|
(f) |
1% of the Aggregate Consideration, as defined in the Asset Management Agreement, received in connection with a Disposition Event. |
13
The Asset Management Agreement will automatically renew on January 1, 2019 for three years ending December 31, 2021, subject to earlier termination pursuant to the terms of the Asset Management Agreement. The Asset Management Agreement provides for termination (i) immediately by the IDC for Cause, as defined in the Asset Management Agreement, (ii) by the IDC, upon 30 days’ written notice to the Asset Manager, in connection with a change in control of the Asset Manager, as defined in the Asset Management Agreement, (iii) by the IDC, by providing the Asset Manager with written notice of termination not less than one year prior to the last calendar of any renewal term, (iv) by the Asset Manager upon written notice to the Company not less than one year prior to the last calendar day of any renewal period, (v) automatically in the event of a Disposition Event, and (vi) by the IDC upon a Key Person Event.
If the Corporation terminates the agreement prior to any renewal term or in any manner described above, other than termination by the Corporation for Cause, the Corporation will be required to pay to the Asset Manager a termination fee equal to three times the Asset Management Fee to which the Asset Manager was entitled during the 12-month period immediately preceding the date of such termination. Although not terminable as of September 30, 2018, if the Asset Management Agreement had been terminated at September 30, 2018, subject to the conditions noted above, the termination fee would have been $51,621.
Total fees incurred under the Property Management Agreement and Asset Management Agreement for the three and nine months ended September 30, 2018 and 2017, are as follows:
|
(in thousands) |
|
|
|
For the three months ended September 30, |
|
|
For the nine months ended September 30, |
|
||||||||||
|
Type of Fee |
|
Financial Statement Presentation |
|
2018 |
|
|
2017 |
|
|
2018 |
|
|
2017 |
|
||||
|
Asset management fee |
|
Asset management fees |
|
$ |
4,663 |
|
|
$ |
3,844 |
|
|
$ |
13,119 |
|
|
$ |
10,666 |
|
|
Property management fee |
|
Property management fees |
|
|
1,680 |
|
|
|
1,249 |
|
|
|
4,792 |
|
|
|
3,635 |
|
|
Total management fee expense |
|
|
|
|
6,343 |
|
|
|
5,093 |
|
|
|
17,911 |
|
|
|
14,301 |
|
|
|
|
|
|
|
|
|
|
|
|
|
|
|
|
|
|
|
|
|
|
Marketing fee (offering costs) |
|
Additional paid-in capital |
|
|
297 |
|
|
|
342 |
|
|
|
822 |
|
|
|
1,144 |
|
|
Acquisition fee |
|
Capitalized as a component of assets acquired |
|
|
1,105 |
|
|
|
1,591 |
|
|
|
3,491 |
|
|
|
3,520 |
|
|
Leasing fee |
|
Leasing fees, net |
|
|
148 |
|
|
|
801 |
|
|
|
1,325 |
|
|
|
2,597 |
|
|
Disposition fee |
|
Gain on sale of real estate |
|
|
116 |
|
|
|
219 |
|
|
|
439 |
|
|
|
522 |
|
|
Total management fees |
|
|
|
$ |
8,009 |
|
|
$ |
8,046 |
|
|
$ |
23,988 |
|
|
$ |
22,084 |
|
Included in management fees are $47 and $722 of unpaid fees recorded in Due to related parties on the Condensed Consolidated Balance Sheets at September 30, 2018 and December 31, 2017, respectively. All fees related to the Property Management Agreement and the Asset Management Agreement are paid for in cash within the Company’s normal payment cycle for vendors.
Investment in Related Party
On June 30, 2015, the Company issued 139 shares with a value of $10,000 to the Manager in exchange for 100 non-voting convertible preferred units of the Manager, which represented a 6.4% ownership interest in the Manager at the time of the transaction on a fully-diluted basis. The Company had the right to convert the preferred units to non-voting common units of the Manager between January 1, 2018 and December 31, 2019. Subsequent to the conversion period, the Manager had the option to redeem the convertible preferred units at their original value of $10,000, plus any accrued and unpaid preferred return. On July 31, 2018, the Company sold their investment to an existing owner of the Manager. The preferred units were sold for an aggregate sales price of $18,500 and had a carrying value of $10,000 at the time of sale. The transaction was approved by the Board of Directors and IDC. At December 31, 2017, the carrying amount of the investment was $10,000. The preferred units provided a stated preferred return at inception of 7.0% with 0.25% increases every June 30th. Preferred distributions related to the investment in the Manager for the three months ended September 30, 2018 and 2017 amounted to $65 and $187, respectively. Preferred distributions related to the investment in the Manager for the nine months ended September 30, 2018 and 2017 amounted to $440 and $550, respectively.
14
The Company closed on the following acquisitions during the nine months ended September 30, 2018:
|
(in thousands, except number of properties) |
|
|
|
|
|
|
|
|
|
||
|
Date |
|
Property Type |
|
Number of Properties |
|
|
Real Estate Acquisition Price |
|
|
||
|
March 27, 2018 |
|
Industrial |
|
|
1 |
|
|
$ |
22,000 |
|
|
|
March 30, 2018 |
|
Industrial/Retail |
|
|
26 |
|
|
|
78,530 |
|
|
|
April 30, 2018 |
|
Other |
|
|
1 |
|
|
|
16,170 |
|
|
|
June 6, 2018 |
|
Industrial |
|
|
1 |
|
|
|
8,500 |
|
|
|
June 14, 2018 |
|
Industrial |
|
|
1 |
|
|
|
39,700 |
|
|
|
June 14, 2018 |
|
Retail |
|
|
6 |
|
|
|
14,479 |
|
|
|
June 21, 2018 |
|
Retail |
|
|
1 |
|
|
|
20,231 |
|
|
|
June 21, 2018 |
|
Industrial |
|
|
1 |
|
|
|
38,340 |
|
(a) |
|
June 29, 2018 |
|
Industrial |
|
|
1 |
|
|
|
10,400 |
|
|
|
June 29, 2018 |
|
Retail |
|
|
2 |
|
|
|
6,433 |
|
|
|
July 12, 2018 |
|
Industrial |
|
|
1 |
|
|
|
11,212 |
|
|
|
July 17, 2018 |
|
Retail |
|
|
5 |
|
|
|
14,845 |
|
|
|
July 17, 2018 |
|
Office |
|
|
1 |
|
|
|
34,670 |
|
|
|
August 6, 2018 |
|
Industrial |
|
|
2 |
|
|
|
4,802 |
|
|
|
August 10, 2018 |
|
Retail |
|
|
6 |
|
|
|
26,545 |
|
|
|
August 10, 2018 |
|
Retail |
|
|
2 |
|
|
|
2,192 |
|
|
|
August 10, 2018 |
|
Retail |
|
|
1 |
|
|
|
3,650 |
|
|
|
August 10, 2018 |
|
Retail |
|
|
1 |
|
|
|
1,539 |
|
|
|
August 10, 2018 |
|
Retail |
|
|
10 |
|
|
|
11,051 |
|
|
|
|
|
|
|
|
70 |
|
|
$ |
365,289 |
|
(b) |
|
(a) |
In conjunction with this acquisition, the Company assumed a mortgage with a principal balance of $20,845 with an interest rate of 4.36% and a maturity date of August 2025 (see Note 9). |
|
(b) |
Acquisition price does not include capitalized acquisition costs of $8,019. |
The Company closed on the following acquisitions during the nine months ended September 30, 2017:
|
(in thousands, except number of properties) |
|
|
|
|
|
|
|
|
|
||
|
Date |
|
Property Type |
|
Number of Properties |
|
|
Real Estate Acquisition Price |
|
|
||
|
January 18, 2017 |
|
Retail |
|
|
1 |
|
|
$ |
2,520 |
|
|
|
March 1, 2017 |
|
Retail |
|
|
9 |
|
|
|
87,196 |
|
|
|
April 28, 2017 |
|
Retail |
|
|
25 |
|
|
|
48,898 |
|
|
|
June 2, 2017 |
|
Healthcare |
|
|
2 |
|
|
|
13,300 |
|
|
|
June 15, 2017 |
|
Retail |
|
|
2 |
|
|
|
2,700 |
|
|
|
June 30, 2017 |
|
Industrial |
|
|
2 |
|
|
|
12,250 |
|
|
|
June 30, 2017 |
|
Healthcare |
|
|
7 |
|
|
|
25,989 |
|
|
|
July 7, 2017 |
|
Office |
|
|
1 |
|
|
|
32,210 |
|
|
|
August 4, 2017 |
|
Healthcare |
|
|
3 |
|
|
|
11,732 |
|
|
|
August 31, 2017 |
|
Healthcare |
|
|
3 |
|
|
|
16,700 |
|
|
|
August 31, 2017 |
|
Industrial |
|
|
2 |
|
|
|
6,148 |
|
|
|
September 13, 2017 |
|
Retail |
|
|
5 |
|
|
|
4,994 |
|
|
|
September 29, 2017 |
|
Industrial/Retail |
|
|
7 |
|
|
|
30,012 |
|
|
|
September 29, 2017 |
|
Industrial |
|
|
1 |
|
|
|
57,372 |
|
|
|
|
|
|
|
|
70 |
|
|
$ |
352,021 |
|
(c) |
|
(c) |
Acquisition price does not include capitalized acquisition costs of $6,583. |
15
The Company allocated the purchase price of these properties to the fair value of the assets acquired and liabilities assumed. The following table summarizes the purchase price allocation for acquisitions completed during the nine months ended September 30, 2018 and 2017, discussed above:
|
|
|
For the nine months ended September 30, |
|
|||||
|
(in thousands) |
|
2018 |
|
|
2017 |
|
||
|
Land |
|
$ |
47,930 |
|
|
$ |
18,499 |
|
|
Land improvements |
|
|
20,815 |
|
|
|
28,463 |
|
|
Buildings and other improvements |
|
|
271,696 |
|
|
|
279,110 |
|
|
Equipment |
|
|
2,891 |
|
|
|
508 |
|
|
Acquired in-place leases(d) |
|
|
36,342 |
|
|
|
37,110 |
|
|
Acquired above-market leases(e) |
|
|
3,347 |
|
|
|
13,229 |
|
|
Acquired below-market leases(f) |
|
|
(10,143 |
) |
|
|
(21,861 |
) |
|
Direct financing investments |
|
|
430 |
|
|
|
3,546 |
|
|
Mortgage payable |
|
|
(20,845 |
) |
|
|
— |
|
|
|
|
$ |
352,463 |
|
|
$ |
358,604 |
|
|
(d) |
The weighted average amortization period for acquired in-place leases is 14 years and 17 years for acquisitions completed during the nine months ended September 30, 2018 and 2017, respectively. |
|
(e) |
The weighted average amortization period for acquired above-market leases is 15 years and 17 years for acquisitions completed during the nine months ended September 30, 2018 and 2017, respectively. |
|
(f) |
The weighted average amortization period for acquired below-market leases is 13 years and 17 years for acquisitions completed during the nine months ended September 30, 2018 and 2017, respectively. |
The above acquisitions were funded using a combination of available cash on hand and proceeds from the Company’s unsecured revolving line of credit. All of the acquisitions closed during the nine months ended September 30, 2018 and 2017, qualified as asset acquisitions and, as such, acquisition costs were capitalized in accordance with ASU 2017-01, Business Combinations (Topic 805): Clarifying the Definition of a Business.
Subsequent to September 30, 2018, the Company closed on the following acquisitions (see Note 17):
|
(in thousands, except number of properties) |
|
|
|
|
|
|
|
|
|
Date |
|
Property Type |
|
Number of Properties |
|
Acquisition Price |
|
|
|
October 11, 2018 |
|
Healthcare |
|
4 |
|
$ |
17,448 |
|
|
October 26, 2018 |
|
Industrial |
|
1 |
|
|
8,817 |
|
|
October 31, 2018 |
|
Retail |
|
1 |
|
|
2,016 |
|
|
|
|
|
|
6 |
|
$ |
28,281 |
|
The Company has not completed the allocation of the acquisition date fair values for the properties acquired subsequent to September 30, 2018; however, it expects the acquisitions to qualify as asset acquisitions and that the purchase price of these properties will primarily be allocated to land, land improvements, building and acquired lease intangibles.
5. Sale of Real Estate
The Company closed on the following sales of real estate, none of which qualified as discontinued operations, during the three and nine months ended September 30, 2018 and 2017:
|
|
|
For the three months ended September 30, |
|
|
For the nine months ended September 30, |
|
||||||||||
|
(in thousands, except number of properties) |
|
2018 |
|
|
2017 |
|
|
2018 |
|
|
2017 |
|
||||
|
Number of properties disposed |
|
|
4 |
|
|
|
4 |
|
|
|
15 |
|
|
|
10 |
|
|
Aggregate sale price |
|
$ |
11,609 |
|
|
$ |
27,725 |
|
|
$ |
43,951 |
|
|
$ |
58,170 |
|
|
Aggregate carrying value |
|
|
(9,016 |
) |
|
|
(22,335 |
) |
|
|
(31,710 |
) |
|
|
(44,984 |
) |
|
Additional sales expenses |
|
|
(568 |
) |
|
|
(1,338 |
) |
|
|
(2,621 |
) |
|
|
(2,854 |
) |
|
Gain on sale of real estate |
|
$ |
2,025 |
|
|
$ |
4,052 |
|
|
$ |
9,620 |
|
|
$ |
10,332 |
|
16
6. Investment in Rental Property and Lease Arrangements
The Company generally leases its investment rental property to established tenants. At September 30, 2018, the Company had 567 real estate properties which were leased under leases that have been classified as operating leases and 16 that have been classified as direct financing leases. Of the 16 leases classified as direct financing leases, four include land portions which are accounted for as operating leases (see Revenue Recognition within Note 2). Substantially all leases have initial terms of 10 to 20 years and provide for minimum rentals as defined in ASC 840, Leases. In addition, the leases generally provide for limited increases in rent as a result of fixed increases, increases in the Consumer Price Index, or increases in the tenant’s sales volume. Generally, the tenant is also required to pay all property taxes and assessments, substantially maintain the interior and exterior of the building, and maintain property and liability insurance coverage. The leases also typically provide one or more multiple year renewal options subject to generally the same terms and conditions as the initial lease.
Investment in Rental Property – Accounted for Using the Operating Method
Rental property subject to non-cancelable operating leases with tenants are as follows at September 30, 2018 and December 31, 2017:
|
(in thousands) |
|
September 30, 2018 |
|
|
December 31, 2017 |
|
||
|
Land |
|
$ |
389,127 |
|
|
$ |
348,940 |
|
|
Land improvements |
|
|
228,806 |
|
|
|
211,674 |
|
|
Buildings |
|
|
2,009,417 |
|
|
|
1,754,796 |
|
|
Tenant improvements |
|
|
1,729 |
|
|
|
11,425 |
|
|
Equipment |
|
|
11,492 |
|
|
|
7,689 |
|
|
|
|
|
2,640,571 |
|
|
|
2,334,524 |
|
|
Less accumulated depreciation |
|
|
(191,133 |
) |
|
|
(148,383 |
) |
|
|
|
$ |
2,449,438 |
|
|
$ |
2,186,141 |
|
Depreciation expense on investment in rental property was as follows for the three and nine months ended September 30, 2018 and 2017:
|
|
|
For the three months ended September 30, |
|
|
For the nine months ended September 30, |
|
||||||||||
|
(in thousands) |
|
2018 |
|
|
2017 |
|
|
2018 |
|
|
2017 |
|
||||
|
Depreciation |
|
$ |
17,196 |
|
|
$ |
12,600 |
|
|
$ |
48,345 |
|
|
$ |
36,455 |
|
Estimated minimum future rental receipts required under non-cancelable operating leases with tenants at September 30, 2018 are as follows:
|
(in thousands) |
|
|
|
|
|
Remainder of 2018 |
|
$ |
53,323 |
|
|
2019 |
|
|
216,102 |
|
|
2020 |
|
|
219,327 |
|
|
2021 |
|
|
222,074 |
|
|
2022 |
|
|
224,399 |
|
|
Thereafter |
|
|
2,120,958 |
|
|
|
|
$ |
3,056,183 |
|
Since lease renewal periods are exercisable at the option of the tenant, the above amounts only include future minimum lease payments due during the initial lease terms. In addition, such amounts exclude any potential variable rent increases that are based on the Consumer Price Index, or future contingent rents which may be received under the leases based on a percentage of the tenant’s gross sales.
17
Investment in Rental Property – Accounted for Using the Direct Financing Method
The Company’s net investment in direct financing leases is as follows at September 30, 2018 and December 31, 2017:
|
(in thousands) |
|
September 30, 2018 |
|
|
December 31, 2017 |
|
||
|
Minimum lease payments to be received |
|
$ |
77,833 |
|
|
$ |
77,889 |
|
|
Estimated unguaranteed residual values |
|
|
20,358 |
|
|
|
19,758 |
|
|
Less unearned revenue |
|
|
(56,179 |
) |
|
|
(56,030 |
) |
|
Net investment in direct financing leases |
|
$ |
42,012 |
|
|
$ |
41,617 |
|
Minimum future rental receipts required under non-cancelable direct financing leases with tenants at September 30, 2018 are as follows:
|
(in thousands) |
|
|
|
|
|
Remainder of 2018 |
|
$ |
1,003 |
|
|
2019 |
|
|
4,076 |
|
|
2020 |
|
|
4,194 |
|
|
2021 |
|
|
4,283 |
|
|
2022 |
|
|
4,369 |
|
|
Thereafter |
|
|
59,908 |
|
|
|
|
$ |
77,833 |
|
The above rental receipts do not include future minimum lease payments for renewal periods, potential variable Consumer Price Index rent increases, or contingent rental payments that may become due in future periods.
7. Intangible Assets and Liabilities
The following is a summary of intangible assets and liabilities and related accumulated amortization at September 30, 2018 and December 31, 2017:
|
(in thousands) |
|
September 30, 2018 |
|
|
December 31, 2017 |
|
||
|
Lease intangibles: |
|
|
|
|
|
|
|
|
|
Acquired above-market leases |
|
$ |
62,149 |
|
|
$ |
59,502 |
|
|
Less accumulated amortization |
|
|
(13,668 |
) |
|
|
(9,183 |
) |
|
Acquired above-market leases, net |
|
|
48,481 |
|
|
|
50,319 |
|
|
Acquired in-place leases |
|
|
251,926 |
|
|
|
216,858 |
|
|
Less accumulated amortization |
|
|
(36,369 |
) |
|
|
(24,518 |
) |
|
Acquired in-place leases, net |
|
|
215,557 |
|
|
|
192,340 |
|
|
Total intangible lease assets, net |
|
$ |
264,038 |
|
|
$ |
242,659 |
|
|
Acquired below-market leases |
|
$ |
100,308 |
|
|
$ |
91,667 |
|
|
Less accumulated amortization |
|
|
(14,007 |
) |
|
|
(9,923 |
) |
|
Intangible lease liabilities, net |
|
$ |
86,301 |
|
|
$ |
81,744 |
|
|
Leasing fees |
|
$ |
17,269 |
|
|
$ |
16,286 |
|
|
Less accumulated amortization |
|
|
(3,340 |
) |
|
|
(2,732 |
) |
|
Leasing fees, net |
|
$ |
13,929 |
|
|
$ |
13,554 |
|
Amortization for intangible lease assets and liabilities for the three and nine months ended September 30, 2018 and 2017 is as follows:
|
(in thousands) |
|
|
|
For the three months ended September 30, |
|
|
For the nine months ended September 30, |
|
||||||||||
|
Intangible |
|
Financial Statement Presentation |
|
2018 |
|
|
2017 |
|
|
2018 |
|
|
2017 |
|
||||
|
Acquired in-place leases and leasing fees |
|
Depreciation and amortization |
|
$ |
4,673 |
|
|
$ |
3,043 |
|
|
$ |
12,958 |
|
|
$ |
8,514 |
|
|
Above-market and below-market leases |
|
Increase (decrease) to rental income from operating leases |
|
|
255 |
|
|
|
(99 |
) |
|
|
(212 |
) |
|
|
(487 |
) |
18
Estimated future amortization of intangible assets and liabilities at September 30, 2018 is as follows:
|
(in thousands) |
|
|
|
|
|
Remainder of 2018 |
|
$ |
4,275 |
|
|
2019 |
|
|
16,041 |
|
|
2020 |
|
|
15,764 |
|
|
2021 |
|
|
15,575 |
|
|
2022 |
|
|
15,360 |
|
|
Thereafter |
|
|
124,651 |
|
|
|
|
$ |
191,666 |
|
8. Unsecured Credit Agreements
The following table summarizes the Company’s unsecured credit agreements at September 30, 2018 and December 31, 2017:
|
|
|
Outstanding Balance |
|
|
|
|
|
|
|
|||||
|
(in thousands) |
|
September 30, 2018 |
|
|
December 31, 2017 |
|
|
Interest Rate(d) |
|
|
Maturity Date |
|||
|
2015 Unsecured Term Loan Agreement(a), (b) |
|
$ |
300,000 |
|
|
$ |
325,000 |
|
|
one-month LIBOR + 1.40% |
|
|
Feb. 2019 (f) |
|
|
2017 Unsecured Revolving Credit and Term Loan Agreement(a) |
|
|
|
|
|
|
|
|
|
|
|
|
|
|
|
Revolver |
|
|
— |
|
|
|
273,000 |
|
|
one- and three- month LIBOR + 1.20% (e) |
|
|
Jan. 2022 |
|
|
5.5-Year term loan |
|
|
265,000 |
|
|
|
265,000 |
|
|
one- month LIBOR + 1.35% |
|
|
Jan. 2023 |
|
|
7-Year term loan |
|
|
190,000 |
|
|
|
100,000 |
|
|
one- month LIBOR + 1.90% |
|
|
Jun. 2024 |
|
|
|
|
|
455,000 |
|
|
|
638,000 |
|
|
|
|
|
|
|
|
Senior Notes(a) |
|
|
|
|
|
|
|
|
|
|
|
|
|
|
|
Series A |
|
|
150,000 |
|
|
|
150,000 |
|
|
4.84% |
|
|
Apr. 2027 |
|
|
Series B |
|
|
225,000 |
|
|
|
— |
|
|
5.09% |
|
|
Jul. 2028 |
|
|
Series C |
|
|
100,000 |
|
|
|
— |
|
|
5.19% |
|
|
Jul. 2030 |
|
|
|
|
|
475,000 |
|
|
|
150,000 |
|
|
|
|
|
|
|
|
Total |
|
|
1,230,000 |
|
|
|
1,113,000 |
|
|
|
|
|
|
|
|
Debt issuance costs, net(c) |
|
|
(4,527 |
) |
|
|
(3,088 |
) |
|
|
|
|
|
|
|
|
|
$ |
1,225,473 |
|
|
$ |
1,109,912 |
|
|
|
|
|
|
|
|
(a) |
The Company believes it was in compliance with all financial covenants for all periods presented. |
|
(b) |
In September 2018, the Company paid down $25,000 of the outstanding balance. |
|
(c) |
Amounts presented include debt issuance costs, net, related to the unsecured term notes and senior notes only. |
|
(d) |
At September 30, 2018 and December 31, 2017, one-month LIBOR was 2.11% and 1.37%, respectively. At September 30, 2018 and December 31, 2017, the three-month LIBOR was 2.32% and 1.49%, respectively. |
|
(e) |
At December 31, 2017, $223,000 of the balance is at one-month LIBOR plus 1.20%, while the remaining $50,000 balance is at three-month LIBOR plus 1.20%. |
|
(f) |
The agreement provides for two one-year extension options, at the election of the Company, subject to compliance with all covenants and the payment of a 0.10% fee. |
On July 2, 2018, the Company entered into a Note and Guaranty Agreement (the “NGA Agreement”) with each of the purchasers of unsecured, fixed-rate, interest-only, guaranteed senior promissory notes. Under the NGA Agreement, the Operating Company issued and sold senior promissory notes in two series, Series B Guaranteed Senior Notes (the “Series B Notes”) and Series C Guaranteed Senior Notes (the “Series C Notes”), for an aggregate principal amount of $325,000. The Series B Notes provide for an aggregate principal amount of $225,000 with a fixed-rate of 5.09% through the maturity date of July 2, 2028. The Series C Notes provide for an aggregate principal amount of $100,000 with a fixed-rate of 5.19% through the maturity date of July 2, 2030. On July 2, 2018, the Operating Company issued $100,000 of the Series B Notes and $50,000 of the Series C Notes. The remaining $125,000 principal of the Series B Notes and $50,000 principal of the Series C Notes were funded on September 13, 2018. The proceeds of both issuances were used to pay off borrowings on the Revolver, along with $25,000 of the outstanding principal on the 2015 Unsecured Term Loan.
19
At September 30, 2018 and December 31, 2017, the weighted average interest rate on all outstanding borrowings was 4.17% and 3.03%, respectively. The Revolver is subject to a facility fee of 0.25% per annum. In addition, the 5.5-Year Term Loan and 7-Year Term Loan are subject to a fee of 0.25% per annum on the amount of the commitments, reduced by the amount of term loans outstanding under the applicable loan. The 5.5-Year and 7-Year term loans were fully drawn as of September 30, 2018.
Debt issuance costs are amortized as a component of interest expense in the accompanying Condensed Consolidated Statements of Income and Comprehensive Income. The following table summarizes debt issuance cost amortization for the three and nine months ended September 30, 2018 and 2017:
|
|
|
For the three months ended September 30, |
|
|
For the nine months ended September 30, |
|
||||||||||
|
(in thousands) |
|
2018 |
|
|
2017 |
|
|
2018 |
|
|
2017 |
|
||||
|
Debt issuance costs amortization |
|
$ |
477 |
|
|
$ |
486 |
|
|
$ |
1,410 |
|
|
$ |
1,343 |
|
For the three and nine months ended September 30, 2018, the Company paid $2,209 in debt issuance costs related to the Series B Notes and Series C Notes.
For the nine months ended September 30, 2017, the Company paid $8,344 in debt issuance costs associated with the Series A Notes, the Credit Agreement, and the 2015 Unsecured Term Loan Agreement. For each separate debt instrument, on a lender by lender basis, in accordance with ASC 470-50, Debt Modifications and Extinguishment, the Company performed an assessment of whether the transaction was deemed to be new debt, a modification of existing debt, or an extinguishment of existing debt. Debt issuance costs are either deferred and amortized over the term of the associated debt or expensed as incurred. Based on this assessment, $5,443 of the debt issuance costs related to the issuance of new debt and therefore have been deferred and are being amortized over the term of the associated debt. The remaining $2,901 of debt issuance costs were associated with lenders whose commitments under the new agreements have been determined to be an extinguishment and such debt issuance costs were expensed as a component of the Cost of debt extinguishment in the accompanying Condensed Consolidated Statements of Income and Comprehensive Income for the nine months ended September 30, 2017. Additionally, $654 of unamortized debt issuance costs were expensed and included in Cost of debt extinguishment in the accompanying Condensed Consolidated Statements of Income and Comprehensive Income for the nine months ended September 30, 2017.
20
9. Mortgages and Notes Payable
The Company’s mortgages and notes payable consist of the following at September 30, 2018 and December 31, 2017:
|
(in thousands, except interest rates) |
|||||||||||||||||||
|
Lender |
|
Original/ Assumption Date (Month/Year) |
|
Maturity Date (Month/Year) |
|
Interest Rate |
|
|
September 30, 2018 |
|
|
December 31, 2017 |
|
|
|
||||
|
(1) |
Wilmington Trust National Association |
|
Jun-18 |
|
Aug-25 |
|
4.36% |
|
|
$ |
20,761 |
|
|
$ |
— |
|
|
(a) (b) (c) (m) |
|
|
(2) |
PNC Bank |
|
Oct-16 |
|
Nov-26 |
|
3.62% |
|
|
|
18,352 |
|
|
|
18,622 |
|
|
(b) (c) |
|
|
(3) |
Sun Life |
|
Mar-12 |
|
Oct-21 |
|
5.13% |
|
|
|
11,385 |
|
|
|
11,670 |
|
|
(b) (g) |
|
|
(4) |
Aegon |
|
Apr-12 |
|
Oct-23 |
|
6.38% |
|
|
|
8,668 |
|
|
|
9,168 |
|
|
(b) (h) |
|
|
(5) |
Symetra Financial |
|
Nov-17 |
|
Oct-26 |
|
3.65% |
|
|
|
6,522 |
|
|
|
6,685 |
|
|
(a) (b) (k) (l) |
|
|
(6) |
M&T Bank |
|
Oct-17 |
|
Aug-21 |
|
one - month LIBOR+3% |
|
|
|
5,085 |
|
|
|
5,183 |
|
|
(b) (d) (i) (j) |
|
|
(7) |
Legg Mason Mortgage Capital Corporation |
|
Aug-10 |
|
Aug-22 |
|
7.06% |
|
|
|
4,950 |
|
|
|
5,670 |
|
|
(b) (e) |
|
|
(8) |
Standard Insurance Co. |
|
Apr-09 |
|
May-34 |
|
6.88% |
|
|
|
1,767 |
|
|
|
1,813 |
|
|
(b) (c) (f) |
|
|
(9) |
Columbian Mutual Life Insurance Company |
|
Aug-10 |
|
Sep-25 |
|
7.00% |
|
|
|
1,470 |
|
|
|
1,500 |
|
|
(b) (c) (d) |
|
|
(10) |
Note holders |
|
Dec-08 |
|
Dec-23 |
|
6.25% |
|
|
|
750 |
|
|
|
750 |
|
|
(d) |
|
|
(11) |
Standard Insurance Co. |
|
Jul-10 |
|
Aug-30 |
|
6.75% |
|
|
|
568 |
|
|
|
581 |
|
|
(b) (c) (d) (f) |
|
|
(12) |
Siemens Financial Services, Inc. |
|
Sep-10 |
|
Sep-20 |
|
5.47% |
|
|
|
— |
|
|
|
5,820 |
|
|
(a) (b) |
|
|
(13) |
Symetra Financial |
|
Mar-11 |
|
Apr-31 |
|
6.34% |
|
|
|
— |
|
|
|
1,008 |
|
|
(a) (b) |
|
|
|
|
|
|
|
|
|
|
|
|
|
|
80,278 |
|
|
|
68,470 |
|
|
|
|
|
Debt issuance costs, net |
|
|
|
|
|
|
|
|
|
|
(516 |
) |
|
|
(638 |
) |
|
|
|
|
|
|
|
|
|
|
|
|
|
|
$ |
79,762 |
|
|
$ |
67,832 |
|
|
|
|
(a) |
Non-recourse debt includes the indemnification/guaranty of the Corporation and/or Operating Company pertaining to fraud, environmental claims, insolvency and other matters. |
|
(b) |
Debt secured by related rental property and lease rents. |
|
(c) |
Debt secured by guaranty of the Operating Company. |
|
(d) |
Debt secured by guaranty of the Corporation. |
|
(e) |
Debt is guaranteed by a third party. |
|
(f) |
The interest rate represents the initial interest rate on the respective notes. The interest rate will be adjusted at Standard Insurance’s discretion at certain times throughout the term of the note, ranging from 59 to 239 months, and the monthly installments will be adjusted accordingly. At the time Standard Insurance may adjust the interest rate for notes payable, the Company has the right to prepay the note without penalty. |
|
(g) |
Mortgage was assumed in March 2012 as part of an UPREIT transaction. The debt was recorded at fair value at the time of the assumption. |
|
(h) |
Mortgage was assumed in April 2012 as part of the acquisition of the related property. The debt was recorded at fair value at the time of the assumption. |
|
(i) |
The Company entered into an interest rate swap agreement in connection with the mortgage note, as further described in Note 10. |
|
(j) |
Mortgage was assumed in October 2017 as part of an UPREIT transaction. The debt was recorded at fair value at the time of the assumption. |
|
(k) |
Mortgage was assumed in November 2017 as part of the acquisition of the related property. The debt was recorded at fair value at the time of the assumption. |
|
(l) |
The interest rate will be adjusted to the holder’s quoted five-year commercial mortgage rate for similar size and quality. |
|
(m) |
Mortgage was assumed in June 2018 as part of the acquisition of the related property. The debt was recorded at fair value at the time of the assumption. |
At September 30, 2018, investment in rental property of $140,639 is pledged as collateral against the Company’s mortgages and notes payable.
The following table summarizes the mortgages extinguished by the Company during the nine months ended September 30, 2018 and the year ended December 31, 2017:
|
(in thousands) |
|
For the nine months ended September 30, 2018 |
|
|
For the year ended December 31, 2017 |
|
||
|
Number |
|
2 |
|
|
7 |
|
||
|
Outstanding balance of Mortgages |
|
$ |
6,666 |
|
|
$ |
48,108 |
|
21
The following table summarizes the cost of mortgage extinguishment for the three and nine months ended September 30, 2018 and 2017:
|
|
|
For the three months ended September 30, |
|
|
For the nine months ended September 30, |
|
||||||||||
|
(in thousands, except number of mortgages extinguished) |
|
2018 |
|
|
2017 |
|
|
2018 |
|
|
2017 |
|
||||
|
Cost of mortgage extinguishment |
|
$ |
50 |
|
|
$ |
1,404 |
|
|
$ |
101 |
|
|
$ |
1,464 |
|
Estimated future principal payments to be made under the above mortgage and note payable agreements and the Company’s unsecured credit agreements (see Note 8) at September 30, 2018 are as follows:
|
(in thousands) |
|
|
|
|
|
Remainder of 2018 |
|
$ |
827 |
|
|
2019 |
|
|
303,433 |
|
|
2020 |
|
|
3,672 |
|
|
2021 |
|
|
18,584 |
|
|
2022 |
|
|
3,066 |
|
|
Thereafter |
|
|
980,696 |
|
|
|
|
$ |
1,310,278 |
|
Certain of the Company’s mortgage and note payable agreements provide for prepayment fees and can be terminated under certain events of default as defined under the related agreements which are not reflected as part of the table above.
22
Interest rate swaps were entered into with certain financial institutions in order to mitigate the impact of interest rate variability over the term of the related debt agreements. The interest rate swaps are considered cash flow hedges. In order to reduce counterparty concentration risk, the Company has a diversification policy for institutions that serve as swap counterparties. Under these agreements, the Company receives monthly payments from the counterparties on these interest rate swaps equal to the related variable interest rates multiplied by the outstanding notional amounts. Certain interest rate swaps amortize on a monthly basis. In turn, the Company pays the counterparties each month an amount equal to a fixed rate multiplied by the related outstanding notional amounts. The intended net impact of these transactions is that the Company pays a fixed interest rate on its variable-rate borrowings.
The following is a summary of the Company’s outstanding interest rate swap agreements at September 30, 2018 and December 31, 2017:
|
(in thousands, except interest rates) |
|
|
|
|
|
|
|
|
|
|
|
Fair Value |
|
|
|||||||
|
Counterparty |
|
Maturity Date |
|
Fixed Rate |
|
|
Variable Rate Index |
|
Notional Amount |
|
|
September 30, 2018 |
|
|
December 31, 2017 |
|
|
||||
|
Bank of America, N.A. |
|
November 2023 |
|
|
2.80 |
% |
|
one-month LIBOR |
|
$ |
25,000 |
|
|
$ |
129 |
|
|
$ |
(863 |
) |
|
|
Bank of Montreal |
|
July 2024 |
|
|
1.16 |
% |
|
one-month LIBOR |
|
|
40,000 |
|
|
|
3,775 |
|
|
|
2,503 |
|
|
|
Bank of Montreal |
|
January 2025 |
|
|
1.91 |
% |
|
one-month LIBOR |
|
|
25,000 |
|
|
|
1,451 |
|
|
|
464 |
|
|
|
Bank of Montreal |
|
July 2025 |
|
|
2.32 |
% |
|
one-month LIBOR |
|
|
25,000 |
|
|
|
921 |
|
|
|
(194 |
) |
|
|
Bank of Montreal |
|
January 2026 |
|
|
1.92 |
% |
|
one-month LIBOR |
|
|
25,000 |
|
|
|
1,655 |
|
|
|
561 |
|
|
|
Bank of Montreal |
|
January 2026 |
|
|
2.05 |
% |
|
one-month LIBOR |
|
|
40,000 |
|
|
|
2,309 |
|
|
|
520 |
|
|
|
Bank of Montreal |
|
December 2026 |
|
|
2.33 |
% |
|
one-month LIBOR |
|
|
10,000 |
|
|
|
445 |
|
|
|
(63 |
) |
|
|
Bank of Montreal |
|
December 2027 |
|
|
2.37 |
% |
|
one-month LIBOR |
|
|
25,000 |
|
|
|
1,180 |
|
|
|
(192 |
) |
|
|
Capital One, N.A. |
|
December 2021 |
|
|
1.05 |
% |
|
one-month LIBOR |
|
|
15,000 |
|
|
|
867 |
|
|
|
607 |
|
|
|
Capital One, N.A. |
|
December 2024 |
|
|
1.58 |
% |
|
one-month LIBOR |
|
|
15,000 |
|
|
|
1,157 |
|
|
|
603 |
|
|
|
Capital One, N.A. |
|
January 2026 |
|
|
2.08 |
% |
|
one-month LIBOR |
|
|
35,000 |
|
|
|
1,996 |
|
|
|
399 |
|
|
|
Capital One, N.A. |
|
July 2026 |
|
|
1.32 |
% |
|
one-month LIBOR |
|
|
35,000 |
|
|
|
4,007 |
|
|
|
2,565 |
|
|
|
Capital One, N.A. |
|
December 2027 |
|
|
2.37 |
% |
|
one-month LIBOR |
|
|
25,000 |
|
|
|
1,215 |
|
|
|
(189 |
) |
|
|
Capital One, N.A. |
|
April 2026 |
|
|
2.68 |
% |
|
one-month LIBOR |
|
|
15,000 |
|
|
|
267 |
|
|
|
— |
|
(a) |
|
M&T Bank |
|
August 2021 |
|
|
1.02 |
% |
|
one-month LIBOR |
|
|
5,085 |
|
|
|
306 |
|
|
|
182 |
|
(b), (c) |
|
M&T Bank |
|
September 2022 |
|
|
2.83 |
% |
|
one-month LIBOR |
|
|
25,000 |
|
|
|
59 |
|
|
|
(810 |
) |
|
|
M&T Bank |
|
November 2023 |
|
|
2.65 |
% |
|
one-month LIBOR |
|
|
25,000 |
|
|
|
250 |
|
|
|
(686 |
) |
|
|
Regions Bank |
|
March 2018 |
|
|
1.77 |
% |
|
one-month LIBOR |
|
|
— |
|
|
|
— |
|
|
|
(9 |
) |
(a) |
|
Regions Bank |
|
March 2019 |
|
|
1.91 |
% |
|
three-month LIBOR |
|
|
— |
|
|
|
— |
|
|
|
2 |
|
(a) |
|
Regions Bank |
|
May 2020 |
|
|
2.12 |
% |
|
one-month LIBOR |
|
|
50,000 |
|
|
|
501 |
|
|
|
(153 |
) |
|
|
Regions Bank |
|
March 2022 |
|
|
2.43 |
% |
|
three-month LIBOR |
|
|
— |
|
|
|
— |
|
|
|
(254 |
) |
(a) |
|
Regions Bank |
|
December 2023 |
|
|
1.18 |
% |
|
one-month LIBOR |
|
|
25,000 |
|
|
|
2,130 |
|
|
|
1,402 |
|
|
|
SunTrust Bank |
|
April 2024 |
|
|
1.99 |
% |
|
one-month LIBOR |
|
|
25,000 |
|
|
|
1,181 |
|
|
|
261 |
|
|
|
SunTrust Bank |
|
April 2025 |
|
|
2.20 |
% |
|
one-month LIBOR |
|
|
25,000 |
|
|
|
1,074 |
|
|
|
— |
|
|
|
SunTrust Bank |
|
July 2025 |
|
|
1.99 |
% |
|
one-month LIBOR |
|
|
25,000 |
|
|
|
1,444 |
|
|
|
386 |
|
|
|
SunTrust Bank |
|
December 2025 |
|
|
2.30 |
% |
|
one-month LIBOR |
|
|
25,000 |
|
|
|
1,035 |
|
|
|
(138 |
) |
|
|
SunTrust Bank |
|
January 2026 |
|
|
1.93 |
% |
|
one-month LIBOR |
|
|
25,000 |
|
|
|
1,651 |
|
|
|
553 |
|
|
|
Wells Fargo Bank, N.A. |
|
February 2021 |
|
|
2.39 |
% |
|
one-month LIBOR |
|
|
35,000 |
|
|
|
363 |
|
|
|
(369 |
) |
|
|
Wells Fargo Bank, N.A. |
|
October 2024 |
|
|
2.72 |
% |
|
one-month LIBOR |
|
|
15,000 |
|
|
|
162 |
|
|
|
(510 |
) |
|
|
Wells Fargo Bank, N.A. |
|
January 2028 |
|
|
2.37 |
% |
|
one-month LIBOR |
|
|
75,000 |
|
|
|
3,580 |
|
|
|
(590 |
) |
|
|
Wells Fargo Bank, N.A. |
|
April 2027 |
|
|
2.72 |
% |
|
one-month LIBOR |
|
|
25,000 |
|
|
|
415 |
|
|
|
— |
|
|
|
|
|
|
|
|
|
|
|
|
|
|
|
|
|
$ |
35,525 |
|
|
$ |
5,988 |
|
|
|
(a) |
Notional amount at December 31, 2017 was $25,000. |
|
(b) |
Notional amount at December 31, 2017 was $5,183. |
|
(c) |
Interest rate swap was assumed in October 2017 as part of an UPREIT transaction. |
23
The total amounts recognized and the location in the accompanying Condensed Consolidated Statements of Income and Comprehensive Income, from converting from variable rates to fixed rates under these agreements is as follows for the three and nine months ended September 30, 2018 and 2017:
|
|
|
|
|
|
|
|
|
|
|
|
|
Total Interest Expense |
|
|
|
|
|
Amount of Gain |
|
|
|
|
|
|
|
|
Presented in the |
|
||
|
|
|
Recognized in |
|
|
Reclassification from Accumulated Other |
|
|
Consolidated Statements of |
|
|||||
|
(in thousands) |
|
Accumulated Other |
|
|
Comprehensive Income |
|
|
Income and Comprehensive |
|
|||||
|
Three Months Ended September 30, |
|
Comprehensive Income |
|
|
Location |
|
Amount of Loss |
|
|
Income |
|
|||
|
2018 |
|
$ |
6,299 |
|
|
Interest expense |
|
$ |
20 |
|
|
$ |
14,484 |
|
|
2017 |
|
|
283 |
|
|
Interest expense |
|
|
448 |
|
|
|
9,380 |
|
|
|
|
|
|
|
|
|
|
|
|
|
|
|
|
|
|
|
|
|
|
|
|
|
|
|
|
|
|
|
|
|
|
|
|
|
|
|
|
|
|
|
|
|
|
Total Interest Expense |
|
|
|
|
|
Amount of Gain (Loss) |
|
|
|
|
|
|
|
|
Presented in the |
|
||
|
|
|
Recognized in |
|
|
Reclassification from Accumulated Other |
|
|
Consolidated Statements of |
|
|||||
|
(in thousands) |
|
Accumulated Other |
|
|
Comprehensive Income |
|
|
Income and Comprehensive |
|
|||||
|
Nine Months Ended September 30, |
|
Comprehensive Income |
|
|
Location |
|
Amount of Loss |
|
|
Income |
|
|||
|
2018 |
|
$ |
30,296 |
|
|
Interest expense |
|
$ |
1,287 |
|
|
$ |
38,115 |
|
|
2017 |
|
|
(1,448 |
) |
|
Interest expense |
|
|
3,152 |
|
|
|
25,182 |
|
Amounts related to the interest rate swaps expected to be reclassified out of Accumulated other comprehensive income to Interest expense during the next twelve months are estimated to be a gain of $4,054.
11. Non-Controlling Interests
Under the Company’s UPREIT structure, entities and individuals can contribute their properties in exchange for membership interests in the Operating Company. Properties contributed as part of UPREIT transactions during the nine months ended September 30, 2018 and 2017 were valued at $15,797 and $8,278, respectively, which represents the estimated fair value of the properties contributed, less any assumed debt.
The Company recognized rental income related to UPREIT transactions for the three and nine months ended September 30, 2018 and 2017 as follows:
|
|
|
For the three months ended September 30, |
|
|
For the nine months ended September 30, |
|
||||||||||
|
(in thousands) |
|
2018 |
|
|
2017 |
|
|
2018 |
|
|
2017 |
|
||||
|
UPREIT rental income |
|
$ |
3,990 |
|
|
$ |
3,539 |
|
|
$ |
11,421 |
|
|
$ |
9,503 |
|
12. Credit Risk Concentrations
The Company maintained bank balances that, at times, exceeded the federally insured limit during the nine months ended September 30, 2018. The Company has not experienced losses relating to these deposits and management does not believe that the Company is exposed to any significant credit risk with respect to these amounts.
The Company’s rental property is managed by the Manager and the Asset Manager as described in Note 3. Management fees paid to the Manager and Asset Manager represent 20% and 21% of the Company’s total operating expenses for the three months ended September 30, 2018 and 2017, respectively, and 19% and 21% of the Company’s total operating expenses for the nine months ended September 30, 2018 and 2017, respectively. The Company has mortgages and notes payable with four institutions that comprise 26%, 23%, 14% and 11% of total mortgages and notes payable at September 30, 2018. The Company has mortgages and notes payable with four institutions that comprise 27%, 17%, 13% and 11% of total mortgages and notes payable at December 31, 2017. For the three and nine months ended September 30, 2018 and 2017, the Company had no individual tenants or common franchises that accounted for more than 10% of total revenues.
24
Share Redemption Program
The following table summarizes redemptions under the Share Redemption Program for the three and nine months ended September 30, 2018 and 2017:
|
|
|
For the three months ended September 30, |
|
|
For the nine months ended September 30, |
|
||||||||||
|
(in thousands, except number of stockholders) |
|
2018 |
|
|
2017 |
|
|
2018 |
|
|
2017 |
|
||||
|
Number of stockholders |
|
11 |
|
|
6 |
|
|
33 |
|
|
20 |
|
||||
|
Number of shares |
|
32 |
|
|
23 |
|
|
106 |
|
|
62 |
|
||||
|
Aggregate redemption price |
|
$ |
2,675 |
|
|
$ |
1,808 |
|
|
$ |
8,564 |
|
|
$ |
4,825 |
|
Distribution Reinvestment Plan
The Corporation has adopted the Distribution Reinvestment Plan (“DRIP”), pursuant to which the Corporation’s stockholders and holders of membership units in the Operating Company (other than the Corporation), may elect to have cash distributions reinvested in additional shares of the Corporation’s common stock. Cash distributions will be reinvested in additional shares of common stock pursuant to the DRIP at a per share price equal to 98% of the Determined Share Value as of the applicable distribution date. The Corporation may amend, suspend, or terminate the DRIP at any time upon 30 days’ prior written notice to each stockholder. At September 30, 2018 and December 31, 2017, a total of 2,064 and 1,592 shares of common stock, respectively, have been issued under the DRIP.
14. Earnings per Share
The following table summarizes the components used in the calculation of basic and diluted earnings per share (“EPS”):
|
|
|
For the three months ended September 30, |
|
|
For the nine months ended September 30, |
|
||||||||||
|
(in thousands, except per share) |
|
2018 |
|
|
2017 |
|
|
2018 |
|
|
2017 |
|
||||
|
Basic earnings: |
|
|
|
|
|
|
|
|
|
|
|
|
|
|
|
|
|
Net earnings attributable to Broadstone Net Lease, Inc. |
|
$ |
21,267 |
|
|
$ |
11,948 |
|
|
$ |
55,813 |
|
|
$ |
39,269 |
|
|
Diluted earnings: |
|
|
|
|
|
|
|
|
|
|
|
|
|
|
|
|
|
Net earnings attributable to Broadstone Net Lease, Inc. |
|
$ |
21,267 |
|
|
$ |
11,948 |
|
|
$ |
55,813 |
|
|
$ |
39,269 |
|
|
Net earnings attributable to non-controlling interests |
|
|
1,797 |
|
|
|
1,042 |
|
|
|
4,631 |
|
|
|
3,460 |
|
|
|
|
$ |
23,064 |
|
|
$ |
12,990 |
|
|
$ |
60,444 |
|
|
$ |
42,729 |
|
|
|
|
|
|
|
|
|
|
|
|
|
|
|
|
|
|
|
|
Basic and diluted weighted average shares outstanding: |
|
|
|
|
|
|
|
|
|
|
|
|
|
|
|
|
|
Weighted average number of common shares outstanding used in basic earnings per share |
|
|
20,554 |
|
|
|
17,617 |
|
|
|
19,850 |
|
|
|
16,607 |
|
|
Effects of convertible membership units |
|
|
1,737 |
|
|
|
1,530 |
|
|
|
1,646 |
|
|
|
1,462 |
|
|
Weighted average number of common shares outstanding used in diluted earnings per share |
|
|
22,291 |
|
|
|
19,147 |
|
|
|
21,496 |
|
|
|
18,069 |
|
|
Basic and diluted net earnings per common share |
|
$ |
1.03 |
|
|
$ |
0.68 |
|
|
$ |
2.81 |
|
|
$ |
2.36 |
|
In the table above, outstanding membership units are included in the diluted earnings per share calculation. However, because such membership units would also require that the share of the Operating Company income attributable to such membership units also be added back to net income, there is no effect on EPS.
25
15. Supplemental Cash Flow Disclosures
Cash paid for interest was $33,108 and $20,364 for the nine months ended September 30, 2018 and 2017, respectively. Cash paid for state income and franchise tax was $307 and $751 for the nine months ended September 30, 2018 and 2017, respectively.
The following are non-cash transactions and have been excluded from the accompanying Condensed Consolidated Statements of Cash Flows:
|
|
• |
During the nine months ended September 30, 2018 and 2017, the Corporation issued 458 and 375 shares, respectively, of common stock with a value of approximately $37,055 and $29,031, respectively, under the terms of the DRIP (see Note 13). |
|
|
• |
During the nine months ended September 30, 2018 and 2017, the Company issued 194 and 103 membership units of the Operating Company in exchange for property contributed in UPREIT transactions valued at $15,797 and $8,278, respectively (see Note 11). |
|
|
• |
During the nine months ended September 30, 2018, the Corporation cancelled nine thousand shares of common stock with a value of $748 that were pledged as collateral by a tenant. The cancellation of the shares was used to settle $748 in outstanding receivables associated with the tenant. |
|
|
• |
At September 30, 2018 and 2017, dividend amounts declared and accrued but not yet paid amounted to $9,722 and $8,099, respectively. |
|
|
• |
In connection with real estate transactions conducted during the nine months ended September 30, 2018, the Company settled notes receivable in the amount of $6,527 in exchange for a reduction to the cash paid for the associated real estate assets. |
|
|
• |
In connection with fire damage incurred at three properties during the nine months ended September 30, 2017, the Company recognized $2,857 in insurance recovery receivables which were a reduction to depreciation expense for the associated real estate assets. |
16. Commitments and Contingencies
From time to time, the Company is a party to various litigation matters incidental to the conduct of the Company’s business. While the resolution of such matters cannot be predicted with certainty, based on currently available information, the Company does not believe that the final outcome of any of these matters will have a material effect on its consolidated financial position, results of operations or liquidity.
In connection with ownership and operation of real estate, the Company may potentially be liable for cost and damages related to environmental matters. The Company is not aware of any non-compliance, liability, claim, or other environmental condition that would have a material effect on its consolidated financial position, results of operations, or liquidity.
Tenant improvement allowances at September 30, 2018 and December 31, 2017 were as follows:
|
(in thousands) |
|
September 30, 2018 |
|
|
December 31, 2017 |
|
||
|
Tenant improvement allowances |
|
$ |
2,920 |
|
|
$ |
5,669 |
|
Payments made for work completed under the tenant improvement allowances were as follows:
|
(in thousands) |
|
For the nine months ended September 30, 2018 |
|
|
For the year ended December 31, 2017 |
|
||
|
Payments for tenant improvement allowances |
|
$ |
3,174 |
|
|
$ |
6,598 |
|
26
Through November 5, 2018, the Company has raised $24,671 through the sale of 291 shares of the Corporation’s common stock from monthly equity closings, including dividend reinvestments. Through November 5, 2018, the Company has paid $9,722 in distributions, including dividend reinvestments.
Subsequent to September 30, 2018, the Company continued to expand its operations through the acquisition of additional rental property and associated intangible assets and liabilities. The Company acquired approximately $28,281 of rental property and associated intangible assets and liabilities (see Note 4). Through November 5, 2018, the Company sold four properties for total proceeds of $10,995 with an aggregate carrying value of approximately $9,100. The Company incurred additional expenses related to the sales of approximately $640 resulting in a gain on sale of real estate of approximately $1,255.
On November 2, 2018, the Board of Directors declared a distribution of $0.43 per share on the Corporation’s common stock and approved a distribution of $0.43 per membership unit of the Operating Company for monthly distributions through January 2019. The distributions are payable on or prior to the 15th of the following month to stockholders and unit holders of record on the last day of the month. In addition, the IDC determined the share value for the Corporation’s common stock and the Operating Company’s membership units to be $86.00 per share or unit for subscription agreements received from November 1, 2018 through January 31, 2019.
Subsequent to September 30, 2018, the Operating Company paid off borrowings on the Revolver in the aggregate amount of $13,000 and drew additional borrowings on the Revolver in the aggregate amount of $13,000.
27
Except where the context suggests otherwise, the terms “we,” “us,” “our,” and “our company” refer to Broadstone Net Lease, Inc., a Maryland corporation, and, as required by context, Broadstone Net Lease, LLC, a New York limited liability company, which we refer to as the or our “Operating Company,” and to their respective subsidiaries.
The following Management’s Discussion and Analysis of Financial Condition and Results of Operations (“MD&A”) is intended to help the reader understand our results of operations and financial condition. This MD&A is provided as a supplement to, and should be read in conjunction with, our Condensed Consolidated Financial Statements and the accompanying Notes to the Condensed Consolidated Financial Statements appearing elsewhere in this Form 10-Q.
Cautionary Note Regarding Forward-Looking Statements
This Quarterly Report on Form 10-Q may contain forward-looking statements within the meaning of Section 27A of the Securities Act of 1933, as amended (the “Securities Act”), and Section 21E of the Securities Exchange Act of 1934, as amended (the “Exchange Act”), regarding, among other things, our plans, strategies, and prospects, both business and financial. Forward-looking statements include, but are not limited to, statements that represent our beliefs concerning future operations, strategies, financial results or other developments. Forward-looking statements can be identified by the use of forward-looking terminology such as, but not limited to, “may,” “will,” “should,” “expect,” “intend,” “anticipate,” “estimate,” “would be,” “believe,” or “continue” or the negative or other variations of comparable terminology. Because these forward-looking statements are based on estimates and assumptions that are subject to significant business, economic, and competitive uncertainties, many of which are beyond our control or are subject to change, actual results could be materially different. Although we believe that our plans, intentions, and expectations reflected in or suggested by these forward-looking statements are reasonable, we cannot assure you that we will achieve or realize these plans, intentions or expectations. Forward-looking statements are inherently subject to known and unknown risks, uncertainties, and assumptions, including risks related to general economic conditions, local real estate conditions, tenant financial health, property acquisitions and the timing of these acquisitions, and the availability of capital to finance planned growth, among others. Readers are cautioned not to place undue reliance on these forward-looking statements, which speak only as of the date this Form 10-Q is filed with the Securities and Exchange Commission (the “SEC”). Except as required by law, we do not undertake any obligation to update or revise any forward-looking statements contained in this Form 10-Q. Important factors that could cause actual results to differ materially from the forward-looking statements are disclosed in Item 1A. “Risk Factors” in our Form 10-K for the year ended December 31, 2017, filed with the SEC on March 15, 2018 (the “Form 10-K”).
We are an externally managed real estate investment trust (“REIT”), formed as a Maryland corporation in 2007 to acquire and hold single-tenant, commercial real estate properties throughout the United States, substantially all of which are leased to the properties’ operators under long-term net leases. Under a “net lease,” the tenant occupying the leased property (usually as a single tenant) does so in much the same manner as if the tenant were the owner of the property. There are various forms of net leases, most typically classified as triple-net or double-net. Triple-net leases typically require that the tenant pay all expenses associated with the property (e.g., real estate taxes, insurance, maintenance, repairs and capital costs). Double-net leases typically require that the tenant pay all operating expenses associated with the property (e.g., real estate taxes, insurance and maintenance), but exclude some or all major repairs (e.g., roof, structure and parking lot). Accordingly, the owner receives the rent “net” of these expenses, rendering the cash flow associated with the lease predictable for the term of the lease. Under a net lease, the tenant generally agrees to lease the property for a significant term and agrees that it will either have no ability or only limited ability to terminate the lease or abate rent prior to the expiration of the term of the lease as a result of real estate driven events such as casualty, condemnation or failure by the landlord to fulfill its obligations under the lease. Substantially all of the properties in our portfolio are subject to net leases.
We focus on real estate that is operated by a single tenant where the real estate is an integral part of the tenant’s business. Our diversified portfolio of real estate includes retail properties (such as quick service and casual dining restaurants), healthcare facilities, industrial manufacturing facilities, warehouse and distribution centers, and corporate offices, among others. We target properties with credit-worthy tenants that look to engage in a long-term lease relationship. Through long-term leases, our tenants are able to retain operational control of their critical locations, while conserving their debt and equity capital to fund their fundamental business operations.
As of September 30, 2018, we owned a diversified portfolio of 583 individual leased commercial properties located in 42 states, comprising approximately 18.0 million rentable square feet of operational space. As of September 30, 2018, our properties were 100% leased, and 99.4% occupied by 142 different commercial tenants, with no single tenant accounting for more than 4% of our annual rental stream.
28
We operate under the direction of our board of directors, which is responsible for the management and control of our affairs. Our board of directors has retained our sponsor, Broadstone Real Estate, LLC (the “Manager”), to provide certain property management services for our properties, and Broadstone Asset Management, LLC, a wholly owned subsidiary of the Manager (the “Asset Manager”), to manage our day-to-day affairs and implement our investment strategy, subject to our board of director’s direction, oversight, and approval.
We conduct substantially all of our activities through, and all of our properties are held directly or indirectly by, the Operating Company. We are the sole managing member of the Operating Company and as of September 30, 2018, we owned approximately 92.4% of its issued and outstanding membership units, with the remaining 7.6% held by persons who were issued membership units in exchange for their interests in properties acquired by the Operating Company.
As we conduct substantially all our operations through the Operating Company, we are structured as what is referred to as an Umbrella Partnership Real Estate Investment Trust (“UPREIT”). The UPREIT structure allows a property owner to contribute their property to the Operating Company in exchange for membership units and generally defer taxation of a resulting gain until the contributor later disposes of the membership units or the property is sold in a taxable transaction. The membership units of the Operating Company held by members of the Operating Company other than us are referred to herein and in our consolidated financial statements as “non-controlling interests,” “non-controlling membership units,” or “membership units,” and are convertible into shares of our common stock on a one-for-one basis, subject to certain restrictions. We allocate consolidated earnings to holders of our common stock and holders of non-controlling membership units based on the weighted average number of shares of our common stock and non-controlling membership units outstanding during the year. For the nine months ended September 30, 2018, the weighted average number of non-controlling membership units outstanding was 1.45 million.
We commenced our ongoing private offering of shares of our common stock (our “private offering”) in 2007. The first closing of our private offering occurred on December 31, 2007, and we have conducted additional closings at least once every calendar quarter since then. Currently, we close sales of additional shares of our common stock monthly. In November 2017, we instituted a monthly equity cap and queue program for new and additional investments in our common stock. The cap does not apply to investments made pursuant to our Distribution Reinvestment Plan (“DRIP”) or equity capital received in connection with UPREIT transactions. For the months of February 2018 through June 2018, new and additional investments were capped at $15.0 million per month. Based on anticipated acquisition activity, we increased the cap to $20.0 million for the months of July, August, September, and October 2018, and to $30.0 million for the months of November 2018 through January 2019.
Shares of our common stock are currently being offered in our private offering at the Determined Share Value (as defined below) of $86.00 per share. For the nine months ended September 30, 2018, we sold 2.27 million shares of our common stock in our private offering, including 0.47 million shares of common stock issued pursuant to our DRIP, for gross offering proceeds of approximately $186.3 million. In addition, we issued 194,035 membership units valued at $15.8 million during the nine months ended September 30, 2018. We intend to use substantially all of the net proceeds from our private offering, supplemented with additional borrowings, to continue to invest in additional net leased properties and for general corporate purposes. See Part II, Item 2. “Unregistered Sales of Equity Securities and Use of Proceeds” of this Form 10-Q for further information.
As of September 30, 2018, there were 21.08 million shares of our common stock issued and outstanding, and 1.74 million non-controlling membership units issued and outstanding.
Our principal executive offices are located at 800 Clinton Square, Rochester, New York, 14604, and our telephone number is (585) 287-6500.
29
For the three months ended September 30, 2018, we:
|
|
• |
Increased revenues to $61.8 million, representing growth of 33.6% compared to the three months ended September 30, 2017. |
|
|
• |
Generated earnings per diluted share on a GAAP basis (as defined below) of $1.03, compared to $0.68 for the three months ended September 30, 2017, representing growth of 51.5%. |
|
|
• |
Generated funds from operations (“FFO”), a non-GAAP financial measure, of $2.02 per diluted share, compared to $1.42 for the three months ended September 30, 2017, representing growth of 42.3%. |
|
|
• |
Generated adjusted funds from operations (“AFFO”), a non-GAAP financial measure, of $1.40 per diluted share, compared to $1.30 for the three months ended September 30, 2017, representing growth of 7.7%. |
|
|
• |
Subsequent to quarter end, the committee of our board of directors comprised of independent directors (the “Independent Directors Committee”) approved increasing the Determined Share Value (as defined below) to $86.00 per share, from $85.00 per share, effective for transactions from November 1, 2018 through January 31, 2019. |
|
|
• |
Disposed of four properties, representing 0.4% of our portfolio value as of December 31, 2017. Net proceeds from the dispositions were $11.0 million, representing a gain of $2.0 million over carrying value. |
|
|
• |
Received $72.6 million in investments from new and existing stockholders. As of the end of the quarter, we had 2,974 common stockholders and 67 holders of non-controlling membership units. |
|
|
• |
Collected more than 99% of rents due and maintained a 100% leased portfolio. |
Year-to-Date 2018 Highlights
For the nine months ended September 30, 2018, we:
|
|
• |
Increased revenues to $174.4 million, representing growth of 32.0% compared to the nine months ended September 30, 2017. |
|
|
• |
Generated earnings per diluted share on a GAAP basis (as defined below) of $2.81, compared to $2.36 for the nine months ended September 30, 2017, representing growth of 19.1%. |
|
|
• |
Generated FFO of $5.31 per diluted share, compared to $4.43 for the nine months ended September 30, 2017, representing growth of 19.9%. |
|
|
• |
Generated AFFO of $4.26 per diluted share, compared to $4.04 for the nine months ended September 30, 2017, representing growth of 5.4%. |
|
|
• |
Closed 15 real estate acquisitions totaling $365.3 million, excluding capitalized acquisition expenses, adding 70 new properties at a weighted average initial cash capitalization rate of 6.93%. At the time of acquisition, the properties had a weighted average lease term of 14.0 years and weighted average annual rent increases of 1.7%. |
|
|
• |
Disposed of 15 properties, representing 1.5% of our portfolio value as of December 31, 2017. Net proceeds from the dispositions were $41.3 million, representing a gain of $9.6 million over carrying value. |
|
|
• |
Received $202.1 million in investments from new and existing stockholders, including property contributed through UPREIT transactions. |
|
|
• |
Collected more than 99% of rents due and maintained a 100% leased portfolio. |
FFO and AFFO are performance measures that are not calculated in accordance with accounting principles generally accepted in the United States of America (“GAAP”). We present these non-GAAP measures as we believe certain investors and other users of our financial information use them as part of evaluating our historical operating performance. Please see our discussion below under the heading Net Income and Non-GAAP Measures (FFO and AFFO), which includes discussion of the definition, purpose, and use of these non-GAAP measures as well as a reconciliation of each to the most comparable GAAP measure.
30
Our Properties and Investment Objectives
We target acquisitions of fee simple interests in individual properties priced between $5 million and $75 million. Property portfolios that we acquire may be significantly larger, depending on our balance sheet capacity and whether the portfolio is diversified or concentrated by tenant, geography, or brand. Our investment policy (“Investment Policy”) has three primary objectives:
|
|
• |
preserve, protect, and return capital to investors, |
|
|
• |
realize increased cash available for distributions and long-term capital appreciation from growth in the rental income and value of our properties, and |
|
|
• |
maximize the level of sustainable cash distributions to our investors. |
We primarily acquire freestanding, single-tenant commercial properties located in the United States either directly from our credit-worthy tenants in sale-leaseback transactions, where they sell us their properties and simultaneously lease them back through long-term, net leases, or through the purchase of properties already under a net lease (i.e., a lease assumption). Under either scenario, our properties are generally under lease and fully occupied at the time of acquisition. We focus on properties in growth markets with at least ten years of lease term remaining that are expected to achieve financial returns on equity of greater than 9.5%, net of fees, calculated based on the average return recognized across all acquisitions during a calendar year, provided that all acquisitions must have a minimum remaining lease term of seven years and a minimum return on equity of 8.5%, net of fees, unless otherwise approved by the Independent Directors Committee. Our criteria for selecting properties are based on the following underwriting principles:
|
|
• |
fundamental value and characteristics of the underlying real estate, |
|
|
• |
credit-worthiness of the tenant, and |
|
|
• |
transaction structure and pricing. |
We believe we can achieve an appropriate risk-adjusted return through these underwriting principles and conservatively project a property’s potential to generate targeted returns from current and future cash flows. We believe targeted returns are achieved through a combination of in-place income at the time of acquisition, rent growth, and a property’s potential for appreciation.
To achieve an appropriate risk-adjusted return, we maintain a diversified portfolio of real estate spread across multiple tenants, industries, and geographic locations. The following charts summarize our portfolio diversification by property type and geographic location as of September 30, 2018. The percentages below are calculated based on our contractual rental revenue over the next twelve months (“NTM Rent”) as of September 30, 2018, on a per property type basis divided by total NTM Rent. Late payments, non-payments or other unscheduled payments are not considered in the calculation. NTM Rent includes the impact of contractual rent escalations.
31
Property Type, by % of NTM Rent
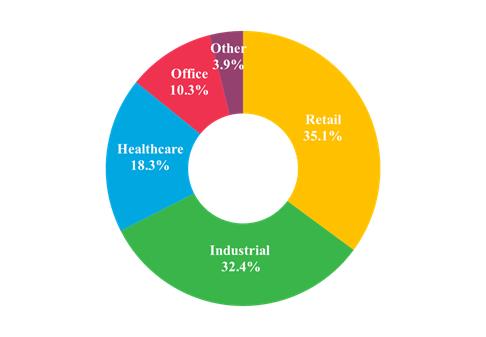
|
Property Type |
|
% NTM Rent |
|
|
|
Retail – other |
|
|
13.0 |
% |
|
Retail – casual dining |
|
|
11.3 |
% |
|
Retail – quick service restaurants ("QSR") |
|
|
10.8 |
% |
|
Total Retail |
|
|
35.1 |
% |
|
Industrial – warehouse/distribution |
|
|
13.1 |
% |
|
Industrial – manufacturing |
|
|
9.8 |
% |
|
Industrial – flex |
|
|
6.1 |
% |
|
Industrial – other |
|
|
3.4 |
% |
|
Total Industrial |
|
|
32.4 |
% |
|
Healthcare – clinical |
|
|
10.2 |
% |
|
Healthcare – surgical |
|
|
4.5 |
% |
|
Healthcare – other |
|
|
3.6 |
% |
|
Total Healthcare |
|
|
18.3 |
% |
|
Office |
|
|
10.3 |
% |
|
Other |
|
|
3.9 |
% |
|
Total |
|
|
100.0 |
% |
32
Tenant Industry, by % of NTM Rent
|
Industry |
|
% NTM Rent |
|
|
|
Restaurants |
|
|
22.4 |
% |
|
Healthcare Facilities |
|
|
15.7 |
% |
|
Home Furnishing Retail |
|
|
5.4 |
% |
|
Specialized Consumer Services |
|
|
4.8 |
% |
|
Packaged Foods & Meats |
|
|
4.1 |
% |
|
Auto Parts & Equipment |
|
|
4.0 |
% |
|
Air Freight & Logistics |
|
|
3.4 |
% |
|
Healthcare Services |
|
|
3.0 |
% |
|
Distributors |
|
|
2.2 |
% |
|
Industrial Conglomerates |
|
|
2.1 |
% |
|
Multi-line Insurance |
|
|
1.8 |
% |
|
Life Sciences Tools & Services |
|
|
1.8 |
% |
|
Industrial Machinery |
|
|
1.8 |
% |
|
Application Software |
|
|
1.7 |
% |
|
Aerospace & Defense |
|
|
1.6 |
% |
|
Top 15 Tenant Industries |
|
|
75.8 |
% |
|
Other (31 industries) |
|
|
24.2 |
% |
|
Total |
|
|
100.0 |
% |
Geographic Diversification, by % of NTM Rent
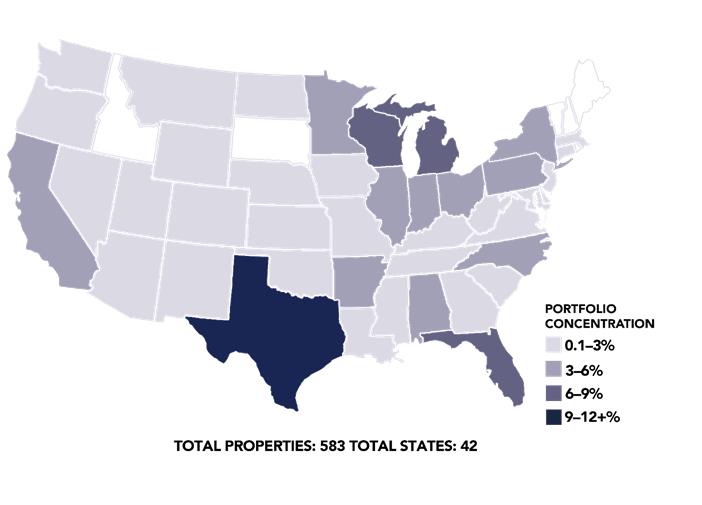
33
At September 30, 2018, all of our properties are subject to leases, substantially all of which are net leases. We do not currently engage in the development of real estate, which could cause a delay in timing between the funds used to invest in properties and the corresponding cash inflows from rental receipts. Our cash flows from operations are primarily generated through our real estate investment portfolio and the monthly lease payments under our long-term leases with our tenants. To increase value to our stockholders, we strive to implement periodic rent escalations within our leases.
Due to the fact that all of our properties are leased to single tenants under long-term leases, we are not currently required to perform significant ongoing leasing activities on our properties. The leases for only eight of our properties, representing less than 1% of our annual rental streams (calculated based on NTM Rent), will expire before 2021. As of September 30, 2018, the weighted average remaining term of our leases (calculated based on NTM Rent) was approximately 12.8 years, excluding renewal options which are exercisable at the option of our tenants upon expiration of their base lease term. Less than 5% of the properties in our portfolio are subject to leases without at least one renewal option. Furthermore, the weighted average lease term on the $365.3 million in properties acquired during the nine months ended September 30, 2018, was 14.0 years at the time of acquisition. More than 56% of our rental revenue is from leases that expire during 2030 and thereafter. As of September 30, 2018, not more than 9% of our rental revenue is derived from leases that expire in any single year in the decade between 2020 and 2030. The following chart sets forth our lease expirations based upon the terms of our leases in place as of September 30, 2018.
Lease Maturity Schedule, by % of NTM Rent
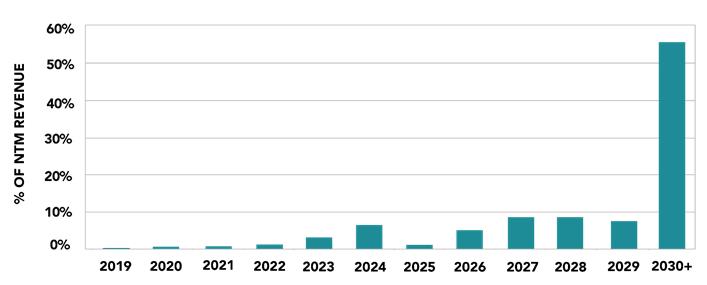
The following table presents the lease expirations by year, including the number of tenants and properties with leases expiring, the square footage covered by the leases expiring, the NTM Rent, and the percentage of NTM Rent for the leases expiring. Late payments, non-payments, or other unscheduled payments are not considered in the NTM Rent amounts. NTM Rent includes the impact of contractual rent escalations. Amounts are in thousands, except the number of tenants and properties.
|
Year |
|
Number of Tenants |
|
|
Number of Properties |
|
|
Square Footage |
|
|
NTM Rent |
|
|
Percentage of NTM Rent |
|
|||||
|
2019 |
|
|
2 |
|
|
|
3 |
|
|
|
21 |
|
|
$ |
314 |
|
|
|
0.1 |
% |
|
2020 |
|
|
4 |
|
|
|
5 |
|
|
|
109 |
|
|
|
1,309 |
|
|
|
0.6 |
% |
|
2021 |
|
|
5 |
|
|
|
9 |
|
|
|
59 |
|
|
|
1,332 |
|
|
|
0.6 |
% |
|
2022 |
|
|
4 |
|
|
|
3 |
|
|
|
87 |
|
|
|
2,494 |
|
|
|
1.1 |
% |
|
2023 |
|
|
10 |
|
|
|
14 |
|
|
|
722 |
|
|
|
6,909 |
|
|
|
3.2 |
% |
|
2024 |
|
|
13 |
|
|
|
16 |
|
|
|
1,787 |
|
|
|
14,461 |
|
|
|
6.6 |
% |
|
2025 |
|
|
4 |
|
|
|
10 |
|
|
|
170 |
|
|
|
2,190 |
|
|
|
1.0 |
% |
|
2026 |
|
|
17 |
|
|
|
27 |
|
|
|
797 |
|
|
|
12,037 |
|
|
|
5.5 |
% |
|
2027 |
|
|
20 |
|
|
|
33 |
|
|
|
1,939 |
|
|
|
19,102 |
|
|
|
8.7 |
% |
|
2028 |
|
|
18 |
|
|
|
31 |
|
|
|
1,633 |
|
|
|
19,075 |
|
|
|
8.7 |
% |
|
2029 |
|
|
13 |
|
|
|
60 |
|
|
|
2,442 |
|
|
|
16,749 |
|
|
|
7.6 |
% |
|
2030 and thereafter |
|
|
82 |
|
|
|
372 |
|
|
|
8,277 |
|
|
|
123,139 |
|
|
|
56.3 |
% |
34
Our top tenants and brands at September 30, 2018, are listed in the tables below. The percentages are calculated based on our NTM Rent on a per property type basis divided by total NTM Rent. Late payments, non-payments, or other unscheduled payments are not considered in the calculation. NTM Rent includes the impact of contractual rent escalations.
Top Ten Tenants, by % of NTM Rent
|
Tenant |
|
Property Type |
|
% NTM Rent |
|
|
Properties |
|
||
|
Art Van Furniture, LLC |
|
Retail |
|
|
3.7 |
% |
|
|
10 |
|
|
Red Lobster Hospitality LLC & Red Lobster Restaurants LLC |
|
Retail |
|
|
3.4 |
% |
|
|
25 |
|
|
Jack's Family Restaurants LP |
|
Retail |
|
|
2.7 |
% |
|
|
36 |
|
|
Outback Steakhouse of Florida LLC (1) |
|
Retail |
|
|
2.5 |
% |
|
|
24 |
|
|
Krispy Kreme Doughnut Corporation |
|
Industrial/Retail |
|
|
2.2 |
% |
|
|
26 |
|
|
Big Tex Trailer Manufacturing, Inc. |
|
Industrial/Retail/Office |
|
|
2.1 |
% |
|
|
17 |
|
|
Siemens Medical Solutions USA, Inc. & Siemens Corporation |
|
Industrial |
|
|
2.1 |
% |
|
|
2 |
|
|
Nestle' Dreyer's Ice Cream Company |
|
Industrial |
|
|
2.0 |
% |
|
|
1 |
|
|
WendPartners & Subsidiaries |
|
Retail |
|
|
1.9 |
% |
|
|
28 |
|
|
Arkansas Surgical Hospital, LLC |
|
Healthcare |
|
|
1.8 |
% |
|
|
1 |
|
|
Total Top Ten |
|
|
|
|
24.4 |
% |
|
|
170 |
|
|
All Other |
|
|
|
|
75.6 |
% |
|
|
413 |
|
|
Total |
|
|
|
|
100.0 |
% |
|
|
583 |
|
|
(1) |
Tenant’s properties include 22 Outback Steakhouse restaurants and two Carrabba’s Italian Grill restaurants. |
Top Ten Brands, by % of NTM Rent
|
Brand |
|
Property Type |
|
% NTM Rent |
|
|
Properties |
|
||
|
Art Van Furniture |
|
Retail |
|
|
3.7 |
% |
|
|
10 |
|
|
Bob Evans Farms(1) |
|
Industrial/Retail |
|
|
3.4 |
% |
|
|
27 |
|
|
Red Lobster |
|
Retail |
|
|
3.4 |
% |
|
|
25 |
|
|
Wendy's |
|
Retail |
|
|
2.7 |
% |
|
|
41 |
|
|
Jack's Family Restaurants |
|
Retail |
|
|
2.7 |
% |
|
|
36 |
|
|
Taco Bell |
|
Retail |
|
|
2.4 |
% |
|
|
41 |
|
|
Krispy Kreme |
|
Industrial/Retail |
|
|
2.2 |
% |
|
|
26 |
|
|
Outback Steakhouse |
|
Retail |
|
|
2.2 |
% |
|
|
22 |
|
|
Big Tex Trailers |
|
Industrial/Retail/Office |
|
|
2.1 |
% |
|
|
17 |
|
|
Siemens |
|
Industrial |
|
|
2.1 |
% |
|
|
2 |
|
|
Total Top Ten |
|
|
|
|
26.9 |
% |
|
|
247 |
|
|
All Other |
|
|
|
|
73.1 |
% |
|
|
336 |
|
|
Total |
|
|
|
|
100.0 |
% |
|
|
583 |
|
|
(1) |
Brand includes two BEF Foods, Inc. properties and 25 Bob Evans Restaurants, LLC properties. |
Leverage Policy
Moody’s Investor Services (“Moody’s”) has assigned the Operating Company an investment grade credit rating of Baa3 with a stable outlook, which allows us to take advantage of preferential borrowing margins and provides more attractive access to the debt markets. The rating is based on a number of factors, including an assessment of our financial strength, portfolio size and diversification, credit and operating metrics, corporate governance policies, and sustainability of cash flows and earnings. We are strongly committed to maintaining modest leverage, commensurate with our investment grade rating. While Moody’s utilizes other factors outside of our leverage ratio, our leverage policy (“Leverage Policy”) is to maintain a leverage ratio in the 35% to 45% range based on the approximate market value of assets, recognizing that the actual leverage ratio will vary over time and there may be opportunistic reasons to exceed a 45% leverage ratio; provided, however, that we cannot exceed a 50% leverage ratio without the approval of the Independent Directors Committee.
The Independent Directors Committee reviews our Leverage Policy at least annually; however, depending on market conditions and other factors, they may change our Leverage Policy from time to time.
35
To reduce its exposure to variable-rate debt, the Operating Company enters into interest rate swap agreements to fix the rate of interest as a hedge against interest rate fluctuations. These interest rate hedges have staggered maturities to reduce the exposure to interest rate fluctuations in any one year, and generally extend up to 10 years. The interest rate swaps are applied against a pool of debt, which offers flexibility in maintaining our hedge designation concurrent with our ongoing capital markets activity. We attempt to limit our total exposure to floating-rate debt to no more than 5% of the approximate market value of total assets, measured at quarter end.
We strategically use the fixed-rate, debt private placement market to help mitigate interest rate risk, lengthen our maturity profile, and diversify our sources of debt capital. At September 30, 2018, we had $475.0 million of unsecured senior notes outstanding.
As of September 30, 2018, our total outstanding indebtedness was $1,310.3 million, and the ratio of our total indebtedness to the approximate market value of our assets was 40.3%.
Determined Share Value
Our shares of common stock are sold by us in our ongoing private offering at a price equal to a determined share value (the “Determined Share Value”), which is established quarterly by the Independent Directors Committee based on the net asset value (“NAV”) of our portfolio, input from management and third-party consultants, and such other factors as the Independent Directors Committee may determine. Shares of our common stock are also sold pursuant to our DRIP, and repurchased by us pursuant to our share redemption program, at a price based upon the Determined Share Value. For additional information regarding our valuation policy and procedures, please see the section titled Determined Share Value in Part II, Item 5. “Market for Registrant’s Common Equity, Related Stockholder Matters and Issuer Purchases of Equity Securities” of our Form 10-K. The following table presents our Determined Share Value for each period indicated below, together with the corresponding NAV per diluted share as of the preceding quarter end:
|
Period |
|
NAV as of |
|
Determined Share Value |
|
|
NAV per diluted share |
|
||
|
November 1, 2018 - January 31, 2019 |
|
September 30, 2018 |
|
$ |
86.00 |
|
|
$ |
85.66 |
|
|
August 1, 2018 - October 31, 2018 |
|
June 30, 2018 |
|
$ |
85.00 |
|
|
$ |
84.63 |
|
|
May 1, 2018 - July 31, 2018 |
|
March 31, 2018 |
|
$ |
83.00 |
|
|
$ |
83.14 |
|
The adjustments to NAV per diluted share in arriving at the Determined Share Value for the periods presented above account for the inherent imprecision in the valuation estimates. In February 2019, the Independent Directors Committee will review the NAV per diluted share calculations as of December 31, 2018, and will assess whether adjustments to the current Determined Share Value of $86.00 are appropriate.
The following table provides a breakdown of the major components of our estimated NAV and NAV per diluted share amounts as of September 30, 2018, and June 30, 2018 (in thousands, except per share amounts):
|
NAV component: |
|
September 30, 2018 |
|
|
June 30, 2018 |
|
||
|
Investment in rental property |
|
$ |
3,214,063 |
|
|
$ |
3,100,313 |
|
|
Debt |
|
|
(1,259,645 |
) |
|
|
(1,251,104 |
) |
|
Other assets and liabilities, net |
|
|
(263 |
) |
|
|
10,548 |
|
|
NAV |
|
$ |
1,954,155 |
|
|
$ |
1,859,757 |
|
|
Number of outstanding shares, including noncontrolling interests |
|
|
22,814 |
|
|
|
21,976 |
|
|
NAV per diluted share |
|
$ |
85.66 |
|
|
$ |
84.63 |
|
The following table details the implied market capitalization rates (shown on a weighted average basis) used to value the investment in rental property, by property type, as of September 30, 2018, and June 30, 2018, supporting the Determined Share Value in effect for the periods of November 1, 2018, through January 31, 2019, and August 1, 2018, through October 31, 2018, respectively:
|
Market capitalization rates, as of: |
|
Retail |
|
|
Industrial |
|
|
Healthcare |
|
|
Office |
|
|
Other |
|
|
Portfolio Total |
|
||||||
|
September 30, 2018 |
|
|
6.44 |
% |
|
|
6.96 |
% |
|
|
6.92 |
% |
|
|
7.07 |
% |
|
|
7.23 |
% |
|
|
6.78 |
% |
|
June 30, 2018 |
|
|
6.37 |
% |
|
|
6.96 |
% |
|
|
6.90 |
% |
|
|
7.07 |
% |
|
|
7.20 |
% |
|
|
6.75 |
% |
36
While we believe our assumptions are reasonable, a change in these assumptions would impact the calculation of the value of our real estate investments. For example, assuming all other factors remain unchanged, an increase in the weighted average implied market capitalization rate used as of September 30, 2018, of 0.25%, would result in a decrease in the fair value of our investment in rental property of 3.6%, and our NAV per diluted share would have been $80.64. Conversely, a decrease in the weighted average implied market capitalization rate used as of September 30, 2018, of 0.25% would result in an increase in the fair value of our investment in rental property of 3.8%, and our NAV per diluted share would have been $91.06.
Distributions and Distribution Reinvestment
At its November 2, 2018, meeting, our board of directors declared monthly distributions of $0.43 per share of our common stock and unit of membership interest in the Operating Company to be paid by us to our stockholders and members of the Operating Company (other than us) of record as follows:
|
Dividend Per Share/Unit |
|
|
Record Date |
|
Payment Date (on or before) |
|
|
$ |
0.43 |
|
|
November 29, 2018 |
|
December 14, 2018 |
|
$ |
0.43 |
|
|
December 28, 2018 |
|
January 15, 2019 |
|
$ |
0.43 |
|
|
January 30, 2019 |
|
February 15, 2019 |
Investors may purchase additional shares of our common stock by electing to reinvest their distributions through our DRIP. Cash distributions will be reinvested in additional shares of common stock pursuant to our DRIP at a per share price equal to 98% of the Determined Share Value as of the applicable distribution date. Please refer to the section titled Distribution and Distribution Reinvestment in Item 5. “Market for Registrant’s Common Equity, Related Stockholder Matters and Issuer Purchases of Equity Securities” of our Form 10-K, for additional discussion of our DRIP.
The following table summarizes distributions paid in cash and pursuant to our DRIP for the nine months ended September 30, 2018 (in thousands).
|
Month |
|
Year |
|
Cash Distribution - Common Stockholders |
|
|
Cash Distribution - Membership Units |
|
|
Distribution Paid Pursuant to DRIP on Common Stock (1) |
|
|
Distribution Paid Pursuant to DRIP on Membership Units (1) |
|
|
Total Amount of Distribution |
|
|||||
|
January |
|
2018 |
|
$ |
4,021 |
|
|
$ |
536 |
|
|
$ |
3,769 |
|
|
$ |
123 |
|
|
$ |
8,449 |
|
|
February |
|
2018 |
|
|
4,029 |
|
|
|
521 |
|
|
|
3,839 |
|
|
|
123 |
|
|
|
8,512 |
|
|
March |
|
2018 |
|
|
4,201 |
|
|
|
539 |
|
|
|
4,052 |
|
|
|
128 |
|
|
|
8,920 |
|
|
April |
|
2018 |
|
|
4,267 |
|
|
|
540 |
|
|
|
4,084 |
|
|
|
127 |
|
|
|
9,018 |
|
|
May |
|
2018 |
|
|
4,331 |
|
|
|
536 |
|
|
|
4,106 |
|
|
|
127 |
|
|
|
9,100 |
|
|
June |
|
2018 |
|
|
4,386 |
|
|
|
602 |
|
|
|
4,154 |
|
|
|
128 |
|
|
|
9,270 |
|
|
July |
|
2018 |
|
|
4,382 |
|
|
|
602 |
|
|
|
4,255 |
|
|
|
127 |
|
|
|
9,366 |
|
|
August |
|
2018 |
|
|
4,393 |
|
|
|
617 |
|
|
|
4,333 |
|
|
|
130 |
|
|
|
9,473 |
|
|
September |
|
2018 |
|
|
4,386 |
|
|
|
618 |
|
|
|
4,463 |
|
|
|
130 |
|
|
|
9,597 |
|
|
TOTAL |
|
|
|
$ |
38,396 |
|
|
$ |
5,111 |
|
|
$ |
37,055 |
|
|
$ |
1,143 |
|
|
$ |
81,705 |
|
|
(1) |
Distributions are paid in shares of common stock. |
The following table summarizes our distributions paid during the nine months ended September 30, 2018 and 2017, including the source of distributions and a comparison against FFO (in thousands).
|
|
|
For the nine months ended |
|
|||||
|
|
|
September 30, |
|
|||||
|
|
|
2018 |
|
|
2017 |
|
||
|
Distributions: |
|
|
|
|
|
|
|
|
|
Paid in cash |
|
$ |
44,650 |
|
|
$ |
37,929 |
|
|
Reinvested in shares |
|
|
37,055 |
|
|
|
28,095 |
|
|
Total Distributions |
|
$ |
81,705 |
|
|
$ |
66,024 |
|
|
Source of Distributions: |
|
|
|
|
|
|
|
|
|
Cash flow from operating activities |
|
$ |
81,705 |
|
|
$ |
66,024 |
|
|
FFO |
|
$ |
114,188 |
|
|
$ |
79,974 |
|
37
For the nine months ended September 30, 2018 and 2017, we paid distributions from our cash flow from operating activities. Refer to Net Income and Non-GAAP Measures (FFO and AFFO) below for further discussion of our FFO. We intend to fund future distributions from cash generated by operations; however, we may fund distributions from the sale of assets, borrowings, or proceeds from the sale of our securities.
Liquidity and Capital Resources
General
We acquire real estate with a combination of debt and equity capital and with cash from operations that is not otherwise distributed to our stockholders. Our focus is on maximizing the risk-adjusted return to our stockholders through an appropriate balance of debt and equity in our capital structure. Therefore, we attempt to maintain a conservative debt level on our balance sheet with appropriate interest and fixed charge coverage ratios. We target a leverage ratio with total debt equal to 35% to 45% of the approximate market value of our assets. We believe our current leverage model has allowed us to take advantage of the lower cost of debt while simultaneously strengthening our balance sheet, as evidenced by the Operating Company’s investment grade credit rating. Our actual leverage ratio will vary over time but may not exceed 50% without the approval of the Independent Directors Committee. As of September 30, 2018, the leverage ratio was 40.3% of the approximate market value of our assets. From a management perspective and in communications with the credit rating agencies, we also consider our leverage position as a multiple of Earnings Before Interest Taxes Depreciation and Amortization (“EBITDA”), a non-GAAP financial measure. EBITDA is a tool we use to measure leverage in the context of our cash flow expectations and projections. However, given the significance of our recent growth, adding $365.3 million in investments during the nine months ended September 30, 2018, $683.6 million in investments during 2017, and $518.8 million in investments during 2016, coupled with our continued strategic growth initiatives, historical EBITDA may not provide investors with an adequate picture of the contractual cash in-flows associated with these investments. Our investments are typically made throughout the year (with a significant portion typically occurring in the second half of the year), and therefore the full year, or “normalized,” cash flows will not be realized until subsequent years. Accordingly, we look at contractual, “normalized,” cash flows and EBITDA as an appropriate tool to manage our leverage profile. We utilize this analysis inclusive of our focus on debt-to-market value metrics.
Liquidity
Our primary cash expenditures are the monthly interest payments we make on the debt we use to finance our real estate investment portfolio, asset management and property management fees for servicing the portfolio, acquisition expenses related to the growth of our portfolio, and the general and administrative expenses of operating our business. Since substantially all of our leases are net leases, our tenants are generally responsible for the maintenance, insurance, property taxes and capital costs associated with the properties they lease from us. In certain circumstances, the terms of the lease require us to pay these expenses, however, in most cases we are reimbursed by the tenants. Accordingly, we do not currently anticipate making significant capital expenditures or incurring other significant property costs during the term of a property lease, unless we incur substantial vacancies. To the extent that we have vacant properties, we will incur certain costs to operate and maintain the properties, however, we do not currently expect these costs to be material.
As shown in the table below, net cash provided by operating activities increased by approximately $21.1 million, to $93.5 million for the nine months ended September 30, 2018, from $72.4 million for the nine months ended September 30, 2017. The increase in cash provided by operating activities is primarily due to the increase in the size of our real estate investment portfolio. Our real estate investing activities have grown in volume as we continue to identify favorable investment opportunities. We funded real estate investment activity with a combination of proceeds from the issuance of unsecured debt obligations and from the issuance of common stock. We paid cash dividends to our stockholders and holders of non-controlling membership units, net of reinvestments through our DRIP, totaling $45.0 million and $38.2 million for the nine months ended September 30, 2018 and 2017, respectively. Cash used to fund the increase in dividends between periods related primarily to the increase in cash provided by our operations. Cash and cash equivalents and restricted cash totaled $28.0 million and $14.6 million at September 30, 2018, and 2017, respectively.
|
|
|
For the nine months ended |
|
|||||
|
|
|
September 30, |
|
|||||
|
(In thousands) |
|
2018 |
|
|
2017 |
|
||
|
Net cash provided by operating activities |
|
$ |
93,517 |
|
|
$ |
72,365 |
|
|
Net cash used in investing activities |
|
|
(274,590 |
) |
|
|
(298,040 |
) |
|
Net cash provided by financing activities |
|
|
199,002 |
|
|
|
217,195 |
|
|
Increase in cash and cash equivalents and restricted cash |
|
$ |
17,929 |
|
|
$ |
(8,480 |
) |
38
As of September 30, 2018, the historical cost basis of our real estate investment portfolio totaled $2.49 billion, consisting of investments in 583 properties with rent and interest due from our tenants aggregating $18.5 million per month on a straight-line basis and $16.4 million per month in monthly cash inflows for the first nine months of the year. During the nine months ended September 30, 2018, we closed 15 real estate acquisitions totaling $365.3 million, excluding capitalized acquisition expenses, adding 70 new properties to our portfolio. The new properties will provide approximately $2.4 million in monthly rent on a straight-line basis and $2.1 million in monthly cash rents. Substantially all of our cash from operations is generated by our real estate portfolio.
We intend to continue to grow through additional real estate investments. To accomplish this objective, we must continue to identify acquisitions that are consistent with our underwriting guidelines and raise additional debt and equity capital. We have financed our acquisition of properties using a combination of equity investments, unsecured term loans, revolving debt, senior unsecured notes, and mortgage loans. We seek to maintain an appropriate balance of debt and equity capital in our overall leverage policy, while maintaining a focus on increasing core value for existing stockholders (achieved via earnings growth and share price appreciation).
The mix of financing sources may change over time based on market conditions and our liquidity needs. The availability of debt to finance commercial real estate can be impacted by economic and other factors that are beyond our control. We seek to reduce the risk that long-term debt capital may be unavailable to us by strengthening our balance sheet through our investments in real estate with credit-worthy tenants and lease guarantors and maintaining an appropriate mix of debt and equity capitalization. Specifically, we recognized a 99+% collection rate on rentals during 2017 and for the nine months ended September 30, 2018. Moody’s assignment and reaffirmations of an investment grade credit rating of Baa3 to the Operating Company is further evidence of our active management of a conservative capital structure. As we grow our real estate portfolio, we also intend to manage our debt maturities to reduce the risk that a significant amount of our debt will come due in any single year. For example, during the third quarter of 2018, we repaid a portion of our Revolver and 2015 Unsecured Term Loan Agreement (each as defined below), replacing those borrowings with a portion of our longer maturity Series B Notes and Series C Notes (as defined below). Refer to Contractual Obligations below for further details regarding our long-term debt maturities.
The Operating Company achieved its investment grade credit rating based on our conservative leverage profile, diversified portfolio, and earnings stability based on the credit-worthiness of our tenants, which we intend to maintain concurrent with our growth objectives. Factors that could negatively impact our credit rating include, but are not limited to: a significant increase in our leverage on a sustained basis, a significant increase in secured debt levels, a significant decline in our unencumbered asset base, weakening of our corporate governance structure, and a significant decline in our portfolio diversification. We have aligned our strategic growth priorities with these factors, as we believe the favorable debt pricing and access to additional sources of debt capital resulting from the investment grade credit rating, provide us with an advantageous cost of capital and risk-adjusted return on investment for our stockholders.
Our equity capital for our real estate acquisition activity is provided from the proceeds of our ongoing private offering, including distributions reinvested through our DRIP. During the three and nine months ended September 30, 2018, we raised $72.6 million and $202.1 million in equity capital, respectively, to be used in our acquisition activities, including distributions reinvested through our DRIP and, for the nine-month period, properties exchanged through UPREIT transactions.
39
Our debt capital is provided through unsecured term notes, revolving debt facilities, and senior unsecured notes. We also, from time to time, obtain non-recourse mortgage financing from banks and insurance companies secured by mortgages on the corresponding specific property. Mortgages, however, are not a strategic focus of the active management of our leverage profile. Rather, we enter into mortgages and notes payable as ancillary business transactions on an as-needed basis, most often as the result of lease assumption transactions.
Recent Activity
On July 2, 2018, we entered into a Note and Guaranty Agreement (the “NGA”) by and among us, as parent guarantor, the Operating Company, as issuer, and the purchasers party thereto (the “Purchasers”). Pursuant to the terms of the NGA, the Operating Company issued and sold to the Purchasers $325.0 million aggregate principal amount of unsecured, fixed-rate, interest-only senior notes in two series: (i) $225.0 million aggregate principal amount of 5.09% Series B Guaranteed Senior Notes (the “Series B Notes”), and (ii) $100.0 million aggregate principal amount of 5.19% Series C Guaranteed Senior Notes (the “Series C Notes”).
Pursuant to the NGA, $100.0 million aggregate principal amount of the Series B Notes were issued on July 2, 2018, and $125.0 million aggregate principal amount were issued on September 13, 2018. The Series B Notes have a 10-year term and mature on July 2, 2028, unless earlier redeemed or prepaid pursuant to the terms of the NGA. The Series B Notes were issued at par and the unpaid balance of the Series B Notes bear interest at a rate of 5.09% per annum (priced at 210 basis points above the 10-year U.S. Treasury yield at the time of pricing). Also pursuant to the NGA, $50.0 million aggregate principal amount of the Series C Notes were issued on July 2, 2018, and $50.0 million aggregate principal amount were issued on September 13, 2018. The Series C Notes have a 12-year term and mature on July 2, 2030, unless earlier redeemed or prepaid pursuant to the terms of the NGA. The Series C Notes were issued at par and the unpaid balance of the Series C Notes bear interest at a rate of 5.19% per annum (priced at 220 basis points above the 10-year U.S. Treasury yield at the time of pricing).
In addition to funding acquisitions during the third quarter, a portion of the net proceeds from the Series B Notes and Series C Notes were used to repay outstanding borrowings under the Revolver (as defined below) as well as $25.0 million of the outstanding principal balance of our 2015 Unsecured Term Loan Agreement (as defined below).
Existing Debt Facilities
Credit Facility
In 2017, together with the Operating Company, we closed on an $880.0 million unsecured credit facility (the “Credit Facility”), comprised of (i) a $425.0 million senior unsecured revolving credit facility (the “Revolver”), (ii) a five-and-a-half-year, $265.0 million senior unsecured delayed draw term loan (the “5.5-Year Term Loan”), and (iii) a seven-year, $190.0 million senior unsecured delayed draw term loan (the “7-Year Term Loan”). The Credit facility contains an accordion feature that can increase the facility size up to a total of $1.0 billion of available capacity. Borrowings under the Credit Facility are payable interest only during the term of the appropriate loan tranche, with the principal amount due in full at maturity. The following table summarizes the amounts drawn and available to be drawn on the Credit Facility as of September 30, 2018 (in thousands, excluding Loan Tranche and Maturity Date).
|
Loan Tranche |
|
Amount Drawn |
|
|
Amount Available |
|
|
Total Capacity |
|
|
Maturity Date |
|||
|
Revolver |
|
$ |
— |
|
|
$ |
425,000 |
|
|
$ |
425,000 |
|
|
January 21, 2022(1) |
|
5.5-Year Term Loan |
|
|
265,000 |
|
|
|
— |
|
|
|
265,000 |
|
|
January 23, 2023 |
|
7-Year Term Loan |
|
|
190,000 |
|
|
|
— |
|
|
|
190,000 |
|
|
June 21, 2024 |
|
(1) |
The Revolver contains one extension option that would extend the maturity date by five months, to June 21, 2022, subject to certain conditions set forth in the Credit Facility, including payment of an extension fee equal to 0.0625% of the revolving commitments. |
40
At September 30, 2018, we had $225.0 million of unsecured, fixed-rate, interest-only Series B Notes and $100.0 million of unsecured, fixed-rated, interest only Series C Notes outstanding. In addition, we had $150.0 million of unsecured, fixed-rate, interest-only senior promissory notes issued in April 2017 (the “Series A Notes”) outstanding. The Series A Notes bear interest at a fixed rate of 4.84% per annum, and mature in April 2027.
2015 Unsecured Term Loan Agreement
At September 30, 2018 we had outstanding a $300.0 million unsecured term note (“2015 Unsecured Term Loan Agreement”). The 2015 Unsecured Term Loan Agreement matures on February 6, 2019, and provides for two one-year extension options, at our option, subject to compliance with all covenants and the payment of a 0.10% fee. The 2015 Unsecured Term Loan Agreement contains an accordion feature that can increase the note size by up to $275 million.
Debt Covenants
We are subject to various covenants and financial reporting requirements pursuant to the loan agreements we have entered into. The table below summarizes the applicable financial covenants, which are substantially the same across each of our loan agreements. As of September 30, 2018, we were in compliance with all of our covenants. In the event of default, either through default on payments or breach of covenants, we may be prohibited from paying dividends on our common stock above the annual 90% REIT taxable income distribution requirement. For each of the previous three years, we paid dividends out of our cash flows from operations in excess of the required distribution amounts.
|
Covenants |
|
Required |
|
Actual (as of September 30, 2018) |
|
|
|
Leverage Ratio(1) |
|
≤ 0.60 to 1.00 |
|
|
0.41 |
|
|
Secured Indebtedness Ratio(2) |
|
≤ 0.40 to 1.00 |
|
|
0.02 |
|
|
Unencumbered Coverage Ratio(3) |
|
≥ 1.75 to 1.00 |
|
|
3.26 |
|
|
Fixed Charge Coverage Ratio(4) |
|
≥ 1.50 to 1.00 |
|
|
2.83 |
|
|
Total Unsecured Indebtedness to Total Unencumbered Eligible Property Value(5) |
|
≤ 0.60 to 1.00 |
|
|
0.47 |
|
|
Dividends and Other Restricted Payments |
|
Only applicable in case of default |
|
Not Applicable |
|
|
|
(2) |
The secured indebtedness ratio is the ratio of secured indebtedness to total market value. The secured indebtedness represents outstanding mortgage borrowings. |
|
(3) |
The unencumbered coverage ratio is the ratio of adjusted EBITDA (as defined within the respective loan agreement) to interest expense for the most recent fiscal quarter. Adjusted EBITDA is calculated as net income adjusted for depreciation and amortization, interest, taxes, gain/loss on sale of properties, dividend income, gain/loss on debt extinguishment, straight-line rent adjustments, transaction costs expensed, amortization of intangibles, and interest rate swap ineffectiveness, if applicable. |
|
(4) |
The fixed charge coverage ratio is the ratio of adjusted EBITDA to fixed charges for the most recent fiscal quarter. Fixed charges are calculated as interest expense plus any principal payments on debt, excluding balloon payments, if applicable. |
|
(5) |
The total unsecured indebtedness to total unencumbered eligible property value ratio is calculated as the ratio of total unsecured indebtedness to unencumbered property value. Unsecured indebtedness represents the outstanding balances on the revolver, term notes and Senior Notes. Unencumbered eligible property value includes all real estate properties that are not secured by mortgages. |
Capital Strategy
We believe our leverage policy and capital structure provides us with several advantages, including the ability to:
|
|
• |
create a growing and diversified real estate portfolio with a flexible capital structure that allows for independent investing and financing decisions; |
|
|
• |
capitalize on competitive debt pricing; |
|
|
• |
add value to our investors through earnings growth on a growing pool of assets; and |
|
|
• |
issue unsecured debt having relatively limited negative financial covenants and maintain the distributions necessary to retain our tax-sheltered REIT status in the event of contractual default, which we believe increases our corporate flexibility. |
41
We intend to exercise the extension provisions of our debt instruments, refinance, or replace the existing borrowings as they become due, including via additional private debt placements, all with the goal of limiting future debt service to interest payments only. As a result, we do not intend to make principal payments on our debt obligations for the foreseeable future. Additionally, we may be required to increase our borrowing capacity to partially fund future acquisitions. We assess market conditions and the availability and pricing of debt on an ongoing basis, which are critical inputs in our strategic planning and decision-making process. While we believe the current market conditions provide our stockholders with an advantageous capitalization structure and risk-adjusted return, we believe our conservative capital structure is appropriate to absorb temporary market fluctuations. Significant adverse market conditions could impact the availability of debt to fund future acquisitions, our ability to recognize growth in earnings and return on investment for stockholders, and our ability to recast the debt facilities at cost-advantageous pricing points. In the event of such conditions, we would plan to revise our capitalization structure and strategic initiatives to maximize return on investment for our investors. To the extent that we are unable to recast our debt facilities, our cash flows from operations will not be adequate to pay the principal amount of debt, and we may be forced to liquidate properties to satisfy our obligations.
We believe that the cash generated by our operations and our ongoing private offering, our cash and cash equivalents at September 30, 2018, our current borrowing capacity under our unsecured credit facility, and our access to long-term debt capital, including through the debt private placement market, will be sufficient to fund our operations for the foreseeable future and allow us to acquire the real estate necessary to achieve our strategic objectives.
Our leases with tenants of our properties are long-term in nature, with a current weighted average remaining lease term of 12.8 years as of September 30, 2018. To mitigate the impact of inflation on our fixed revenue streams, we have implemented limited escalation clauses in our leases. As of September 30, 2018, nearly all of our leases had contractual lease escalations, with a weighted average of 2.0%. A substantial majority of our leases have fixed annual rent increases, and the remainder have annual lease escalations based on increases in the consumer price index (“CPI”), or periodic escalations over the term of the lease (e.g., a 10% increase every five years). These lease escalations mitigate the risk of earnings erosion on our revenue streams in the case of an inflationary economic environment, and provide increased return in otherwise stable market conditions. As a majority of our portfolio has fixed lease escalations, there is a risk that inflation could be greater than the contractual rent increases.
Our focus on single-tenant, triple-net leases also shelters us from fluctuations in the cost of services and maintenance as a result of inflation. For a portion of our portfolio, we have leases that are not fully triple-net, and, therefore, we bear certain responsibilities for the maintenance and structural component replacements (e.g., roof, structure, or parking lot) that may be required in the future, although the tenants are still required to pay all operating expenses associated with the property (e.g., real estate taxes, insurance, and maintenance). Inflation and increased costs may have an adverse impact to our tenants and their credit-worthiness if the increase in costs are greater than their increase in revenue. In the limited circumstances where we cannot implement a triple-net lease, we attempt to limit our exposure to inflation through the use of warranties and other remedies that reduce the likelihood of a significant capital outlay.
Off-Balance Sheet Arrangements
We had no off-balance sheet arrangements as of September 30, 2018, or December 31, 2017.
42
The following table provides information with respect to our contractual commitments and obligations as of September 30, 2018 (in thousands).
|
Year of Maturity |
|
2015 Unsecured Term Loan Agreement(1) |
|
|
5.5-Year Term Loan |
|
|
7-Year Term Loan |
|
|
Senior Notes |
|
|
Mortgages and Notes Payable |
|
|
Interest Expense(2) |
|
|
Tenant Improvement Allowances |
|
|
Total |
|
||||||||
|
2018 |
|
$ |
— |
|
|
$ |
— |
|
|
$ |
— |
|
|
$ |
— |
|
|
$ |
827 |
|
|
$ |
14,109 |
|
|
$ |
— |
|
|
$ |
14,936 |
|
|
2019 |
|
|
300,000 |
|
|
|
— |
|
|
|
— |
|
|
|
— |
|
|
|
3,433 |
|
|
|
46,423 |
|
|
|
2,920 |
|
|
|
352,776 |
|
|
2020 |
|
|
— |
|
|
|
— |
|
|
|
— |
|
|
|
— |
|
|
|
3,672 |
|
|
|
45,165 |
|
|
|
— |
|
|
|
48,837 |
|
|
2021 |
|
|
— |
|
|
|
— |
|
|
|
— |
|
|
|
— |
|
|
|
18,584 |
|
|
|
44,758 |
|
|
|
— |
|
|
|
63,342 |
|
|
2022 |
|
|
— |
|
|
|
— |
|
|
|
— |
|
|
|
— |
|
|
|
3,066 |
|
|
|
43,121 |
|
|
|
— |
|
|
|
46,187 |
|
|
Thereafter |
|
|
— |
|
|
|
265,000 |
|
|
|
190,000 |
|
|
|
475,000 |
|
|
|
50,696 |
|
|
|
152,312 |
|
|
|
— |
|
|
|
1,133,008 |
|
|
Total |
|
$ |
300,000 |
|
|
$ |
265,000 |
|
|
$ |
190,000 |
|
|
$ |
475,000 |
|
|
$ |
80,278 |
|
|
$ |
345,888 |
|
|
$ |
2,920 |
|
|
$ |
1,659,086 |
|
|
(1) |
We may extend the 2015 Unsecured Term Loan Agreement twice, for a one-year period each time, subject to compliance with all covenants and the payment of 0.10% fee. |
|
(2) |
Interest expense is projected based on the outstanding borrowings and interest rates in effect as of September 30, 2018. This amount includes the impact of interest rate swap agreements. |
As part of acquiring rental properties, we may enter into tenant improvement allowances. As of September 30, 2018, tenant improvement allowances totaled $2.9 million. We expect to pay the tenant improvement allowances out of cash flows from operations or from additional borrowings.
At September 30, 2018, investment in rental property of $140.6 million is pledged as collateral against our mortgages and notes payable.
Additionally, as of September 30, 2018, we are a party to three separate Tax Protection Agreements (the “Agreements”) with the contributing members (the “Protected Members”) of three distinct UPREIT transactions conducted in November 2015, February 2016, and October 2017. The Agreements require us to pay monetary damages in the event of a sale, exchange, transfer, or other disposal of the contributed property in a taxable transaction that would cause a Protected Member to recognize a Protected Gain, as defined in the Agreements, subject to certain exceptions. As of September 30, 2018, the maximum aggregate amount we may be liable for under the Agreements is approximately $12.3 million. Based on information available, we do not believe that the events resulting in damages as detailed above have occurred or are likely to occur in the foreseeable future. Accordingly, we have excluded these commitments from the contractual commitments table above. See a more detailed discussion of the Tax Protection Agreements in Item 7. “Management’s Discussion and Analysis of Financial Condition and Results of Operations — Contractual Obligations”, in our Form 10-K.
Overview
As of September 30, 2018, our real estate investment portfolio had a net book value of $2.49 billion, consisting of investments in 583 property locations in 42 states and various industries. All of our real estate investment portfolio represents commercial real estate properties subject to long-term leases, all of our owned properties were subject to a lease as of September 30, 2018, and all of our leasing activity related to our real estate acquisitions. During the three and nine months ended September 30, 2018, a tenant renewed one lease that had been set to expire in 2018. The lease renewal was immaterial to our portfolio of real estate and results of operations.
43
For the three months ended September 30, 2018 and 2017
Revenues
|
|
|
For the three months ended |
|
|
|
|
|
|
|
|
|||||
|
|
September 30, |
|
|
Increase/(Decrease) |
|
||||||||||
|
(in thousands) |
|
2018 |
|
|
2017 |
|
|
$ |
|
% |
|
||||
|
Revenues: |
|
|
|
|
|
|
|
|
|
|
|
|
|
|
|
|
Rental income from operating leases |
|
$ |
58,189 |
|
|
$ |
43,233 |
|
|
$ |
14,956 |
|
|
34.6 |
% |
|
Earned income from direct financing leases |
|
|
1,017 |
|
|
|
968 |
|
|
|
49 |
|
|
5.1 |
% |
|
Operating expenses reimbursed from tenants |
|
|
2,529 |
|
|
|
1,995 |
|
|
|
534 |
|
|
26.8 |
% |
|
Other income from real estate transactions |
|
|
29 |
|
|
|
39 |
|
|
|
(10 |
) |
|
(25.6 |
)% |
|
Total revenues |
|
$ |
61,764 |
|
|
$ |
46,235 |
|
|
$ |
15,529 |
|
|
33.6 |
% |
Total revenues increased to $61.8 million for the three months ended September 30, 2018, compared to $46.2 million for the three months ended September 30, 2017. The increase in revenue period-over-period is primarily attributable to the growth in our real estate portfolio. We acquired $683.6 million in real estate throughout 2017, excluding capitalized acquisition expenses. These properties provide annual straight-line rental income of $56.1 million, or $14.0 million per quarter. In addition, during the first and second quarters of 2018, we acquired $254.8 million of real estate, excluding capitalized acquisition expenses, which provided $4.8 million of straight-line rental income in the third quarter. The acquisitions occurring during the three months ended September 30, 2018 did not materially impact reported rental income, due to the timing of acquisitions. These incremental revenues were somewhat offset by the elimination of revenues associated with properties that we have recently sold. The rental rates we receive on sale-leaseback transactions and lease assumptions on the various types of properties we target across the United States vary from transaction to transaction based on many factors, such as the terms of the lease, each property’s real estate fundamentals, and the market rents in the area. The initial cash capitalization rate on acquisitions made during the three months ended September 30, 2018, was 7.48%.
Operating Expenses
|
|
|
For the three months ended |
|
|
|
|
|
|
|
|
|||||
|
|
September 30, |
|
|
Increase/(Decrease) |
|
||||||||||
|
(in thousands) |
|
2018 |
|
|
2017 |
|
|
$ |
|
% |
|
||||
|
Operating expenses |
|
|
|
|
|
|
|
|
|
|
|
|
|
|
|
|
Depreciation and amortization |
|
$ |
21,869 |
|
|
$ |
15,643 |
|
|
$ |
6,226 |
|
|
39.8 |
% |
|
Asset management fees |
|
|
4,663 |
|
|
|
3,844 |
|
|
|
819 |
|
|
21.3 |
% |
|
Property management fees |
|
|
1,680 |
|
|
|
1,249 |
|
|
|
431 |
|
|
34.5 |
% |
|
Property and operating expense |
|
|
2,777 |
|
|
|
2,009 |
|
|
|
768 |
|
|
38.2 |
% |
|
General and administrative |
|
|
1,664 |
|
|
|
1,173 |
|
|
|
491 |
|
|
41.9 |
% |
|
State and franchise tax |
|
|
58 |
|
|
|
301 |
|
|
|
(243 |
) |
|
(80.7 |
)% |
|
Provision for impairment of investment in rental properties |
|
|
2,061 |
|
|
|
2,608 |
|
|
|
(547 |
) |
|
(21.0 |
)% |
|
Total operating expenses |
|
$ |
34,772 |
|
|
$ |
26,827 |
|
|
$ |
7,945 |
|
|
29.6 |
% |
Depreciation and amortization
Depreciation and amortization increased to $21.9 million for the three months ended September 30, 2018, compared to $15.6 million for the three months ended September 30, 2017. The increase is primarily due to the growth in our real estate portfolio, as discussed above.
Asset management fees
Asset management fees increased to $4.7 million for the three months ended September 30, 2018, compared to $3.8 million for the three months ended September 30, 2017. We pay the Asset Manager a quarterly fee equal to 0.25% of the aggregate value of our equity on a fully diluted basis, based on the Determined Share Value. The increase in asset management fees during the three months ended September 30, 2018, compared to the comparable period in 2017, is the result of an increase in our outstanding equity on a fully diluted basis, combined with an increase in the Determined Share Value.
44
The $85.00 Determined Share Value in effect as of September 30, 2018, reflected an increase of 6.3% from the $80.00 Determined Share Value in effect as of September 30, 2017. Additionally, the number of shares of our common stock and non-controlling membership units outstanding increased as the result of continued equity capital investments. As of September 30, 2018, there were 22.81 million shares of our common stock and non-controlling membership units outstanding, compared to 20.46 million as of December 31, 2017 and 19.79 million as of September 30, 2017. The increase in equity capital was used to partially fund the continued growth in our real estate portfolio.
Property and operating expense
Property and operating expense increased to $2.8 million for the three months ended September 30, 2018, compared to $2.0 million for the three months ended September 30, 2017. The increase is mainly attributable to the number of properties we own for which we are responsible for engaging a third-party property manager to manage ongoing property maintenance, along with insurance and real estate taxes associated with those properties. These expenses are paid by us and reimbursed by the tenant under the terms of the respective leases. There was a corresponding increase in the operating expenses reimbursed by tenants balance included in total revenues.
Provision for impairment of investment in rental properties
During the three months ended September 30, 2018, we recognized $2.1 million of impairment on our investments in rental properties. We review long-lived assets to be held and used for possible impairment when events or changes in circumstances indicate that their carrying amounts may not be recoverable. If and when such events or changes in circumstances are present, an impairment exists to the extent the carrying value of the asset or asset group exceeds the sum of the undiscounted cash flows expected to result from the use of the asset or asset group and its eventual disposition. The impairment recognized during the three months ended September 30, 2018, related to five properties whose carrying amounts we determined were not recoverable. In determining the fair value of the assets at the time of measurement, we utilized capitalization rates ranging from 7.50% to 10%, and a weighted average discount rate of 8%. During the three months ended September 30, 2017, we recognized $2.6 million of impairment on four properties whose carrying amounts we determined were not recoverable. In determining the fair value of the assets at the time of measurement, we utilized capitalization rates ranging from 7.25% to 12%, and a weighted average discount rate of 8%.
Other income (expenses)
|
|
|
For the three months ended |
|
|
|
|
|
|
|
|
|||||
|
|
|
September 30, |
|
|
Increase/(Decrease) |
|
|||||||||
|
(in thousands) |
|
2018 |
|
|
2017 |
|
|
$ |
|
% |
|
||||
|
Other income (expenses) |
|
|
|
|
|
|
|
|
|
|
|
|
|
|
|
|
Preferred distribution income |
|
$ |
65 |
|
|
$ |
187 |
|
|
$ |
(122 |
) |
|
(65.2 |
)% |
|
Interest income |
|
|
16 |
|
|
|
127 |
|
|
|
(111 |
) |
|
(87.4 |
)% |
|
Interest expense |
|
|
(14,484 |
) |
|
|
(9,380 |
) |
|
|
5,104 |
|
|
54.4 |
% |
|
Cost of debt extinguishment |
|
|
(50 |
) |
|
|
(1,404 |
) |
|
|
(1,354 |
) |
|
(96.4 |
)% |
|
Gain on sale of real estate |
|
|
2,025 |
|
|
|
4,052 |
|
|
|
(2,027 |
) |
|
(50.0 |
)% |
|
Gain on sale of investment in related party |
|
|
8,500 |
|
|
|
— |
|
|
|
8,500 |
|
>100.0 |
% |
|
Interest expense
Interest expense increased to $14.5 million for the three months ended September 30, 2018, compared to $9.4 million for the three months ended September 30, 2017, due primarily to an increase in unsecured long-term borrowings in each of the periods. Total outstanding debt on our unsecured credit facilities and unsecured Senior Notes, excluding capitalized debt issuance costs, increased from $851.5 million at September 30, 2017, to $1,230.0 million at September 30, 2018, reflecting net increased borrowings under our Credit Facility, as well as to the issuance of the Series B Notes and Series C Notes.
Cost of debt extinguishment
Cost of debt extinguishment decreased to $0.1 million for the three months ended September 30, 2018, compared to $1.4 million for the three months ended September 30, 2017. The cost of debt extinguishment represents the difference between the price paid to extinguish the debt compared to the carrying value of the debt, plus any unamortized debt acquisition costs at the time of extinguishment. To the extent that the price paid to extinguish the debt is greater than the carrying value of debt, we would recognize a loss (cost) on extinguishment. The loss would be increased by the amount of previously capitalized debt acquisition costs that remain unamortized at the time of extinguishment. These amounts fluctuate period-over-period based on the variability in the interest rate environment, changes in financial institutions’ credit standards, and our activity in capital markets to manage our leverage position.
45
During the three months ended September 30, 2018, we recognized gains of $2.0 million on the sale of real estate, compared to gains of $4.1 million during the three months ended September 30, 2017. We sold four properties in both periods. Our recognition of a gain or loss on the sale of real estate varies from transaction to transaction based on fluctuations in asset prices and demand in the real estate market.
Gain on sale of investment in related party
During the three months ended September 30, 2018, we sold our investment of 100 non-voting convertible preferred units of our Manager, a related party. The preferred units were sold to another related party of the Manager. The preferred units were sold for an aggregate sales price of $18.5 million and had a carrying value of $10.0 million at the time of sale, resulting in a gain of $8.5 million. Prior to the sale, we received preferred distribution income on the preferred units.
For the nine months ended September 30, 2018 and 2017
Revenues
|
|
|
For the nine months ended |
|
|
|
|
|
|
|
|
|||||
|
|
|
September 30, |
|
|
Increase/(Decrease) |
|
|||||||||
|
(in thousands) |
|
2018 |
|
|
2017 |
|
|
$ |
|
% |
|
||||
|
Revenues: |
|
|
|
|
|
|
|
|
|
|
|
|
|
|
|
|
Rental income from operating leases |
|
$ |
163,611 |
|
|
$ |
123,890 |
|
|
$ |
39,721 |
|
|
32.1 |
% |
|
Earned income from direct financing leases |
|
|
2,936 |
|
|
|
3,175 |
|
|
|
(239 |
) |
|
(7.5 |
)% |
|
Operating expenses reimbursed from tenants |
|
|
7,764 |
|
|
|
4,908 |
|
|
|
2,856 |
|
|
58.2 |
% |
|
Other income from real estate transactions |
|
|
74 |
|
|
|
117 |
|
|
|
(43 |
) |
|
(36.8 |
)% |
|
Total revenues |
|
$ |
174,385 |
|
|
$ |
132,090 |
|
|
$ |
42,295 |
|
|
32.0 |
% |
Total revenues increased to $174.4 million for the nine months ended September 30, 2018, compared to $132.1 million for the nine months ended September 30, 2017. The increase in revenue period-over-period is primarily attributable to the growth in our real estate portfolio as discussed in Results of Operations — For the three months ended September 30, 2018 and 2017 — Revenues above. The initial cash capitalization rate on acquisitions made during the nine months ended September 30, 2018, was 6.93%.
Operating Expenses
|
|
|
For the nine months ended |
|
|
|
|
|
|
|
|
|||||
|
|
|
September 30, |
|
|
Increase/(Decrease) |
|
|||||||||
|
(in thousands) |
|
2018 |
|
|
2017 |
|
|
$ |
|
% |
|
||||
|
Operating expenses |
|
|
|
|
|
|
|
|
|
|
|
|
|
|
|
|
Depreciation and amortization |
|
$ |
61,303 |
|
|
$ |
44,969 |
|
|
$ |
16,334 |
|
|
36.3 |
% |
|
Asset management fees |
|
|
13,119 |
|
|
|
10,666 |
|
|
|
2,453 |
|
|
23.0 |
% |
|
Property management fees |
|
|
4,792 |
|
|
|
3,635 |
|
|
|
1,157 |
|
|
31.8 |
% |
|
Property and operating expense |
|
|
7,926 |
|
|
|
4,710 |
|
|
|
3,216 |
|
|
68.3 |
% |
|
General and administrative |
|
|
4,451 |
|
|
|
3,297 |
|
|
|
1,154 |
|
|
35.0 |
% |
|
State and franchise tax |
|
|
811 |
|
|
|
511 |
|
|
|
300 |
|
|
58.7 |
% |
|
Provision for impairment of investment in rental properties |
|
|
2,061 |
|
|
|
2,608 |
|
|
|
(547 |
) |
|
(21.0 |
)% |
|
Total operating expenses |
|
$ |
94,463 |
|
|
$ |
70,396 |
|
|
$ |
24,067 |
|
|
34.2 |
% |
Depreciation and amortization
Depreciation and amortization increased to $61.3 million for the nine months ended September 30, 2018, compared to $45.0 million for the nine months ended September 30, 2017. The increase is primarily due to the growth in our real estate portfolio, as discussed in Results of Operations — For the three months ended September 30, 2018 and 2017 — Revenues above.
46
Asset management fees increased to $13.1 million for the nine months ended September 30, 2018, compared to $10.7 million in the nine months ended September 30, 2017. The increase in asset management fees during the nine months ended September 30, 2018, compared to the comparable period in 2017, is a result of an increase in our outstanding equity on a fully diluted basis, combined with the increase in the Determined Share Value.
The $85.00 per share Determined Share Value in effect as of September 30, 2018, reflected an increase of 6.3% from the $80.00 per share Determined Share Value in effect as of September 30, 2017. Additionally, the number of shares of our common stock and non-controlling membership units outstanding increased as the result of continued equity capital investments. As of September 30, 2018, there were 22.81 million shares of our common stock and non-controlling membership units outstanding, compared to 20.46 million as of December 31, 2017 and 19.79 million as of September 30, 2017. The increase in equity capital was used to partially fund the continued growth in our real estate portfolio.
Property and operating expense
Property and operating expense increased to $7.9 million for the nine months ended September 30, 2018, compared to $4.7 million for the nine months ended September 30, 2017. The increase is attributable to the number of properties we own for which we are responsible for engaging a third-party property manager to manage ongoing property maintenance, along with insurance and real estate taxes associated with those properties. These expenses are paid by us and reimbursed by the tenant under the terms of the respective leases. There was a corresponding increase in the operating expenses reimbursed by tenants balance included in total revenues.
47
|
|
|
For the nine months ended |
|
|
|
|
|
|
|
|
|||||
|
|
|
September 30, |
|
|
Increase/(Decrease) |
|
|||||||||
|
(in thousands) |
|
2018 |
|
|
2017 |
|
|
$ |
|
% |
|
||||
|
Other income (expenses) |
|
|
|
|
|
|
|
|
|
|
|
|
|
|
|
|
Preferred distribution income |
|
$ |
440 |
|
|
$ |
550 |
|
|
$ |
(110 |
) |
|
(20.0 |
)% |
|
Interest income |
|
|
178 |
|
|
|
354 |
|
|
|
(176 |
) |
|
(49.7 |
)% |
|
Interest expense |
|
|
(38,115 |
) |
|
|
(25,182 |
) |
|
|
12,933 |
|
|
51.4 |
% |
|
Cost of debt extinguishment |
|
|
(101 |
) |
|
|
(5,019 |
) |
|
|
(4,918 |
) |
|
(98.0 |
)% |
|
Gain on sale of real estate |
|
|
9,620 |
|
|
|
10,332 |
|
|
|
(712 |
) |
|
(6.9 |
)% |
|
Gain on sale of investment in related party |
|
|
8,500 |
|
|
|
— |
|
|
|
8,500 |
|
>100.0 |
% |
|
Interest expense
Interest expense increased to $38.1 million for the nine months ended September 30, 2018, compared to $25.2 million for the nine months ended September 30, 2017, due primarily to an increase in long-term borrowings used to partially fund the acquisition of properties for our growing real estate investment portfolio. This primarily reflected the issuance of the Series A Notes in April 2017 and the Series B Notes and Series C Notes in 2018, along with increased borrowings under our Credit Facility, which was renegotiated on June 23, 2017. In addition, interest expense reported for the nine months ended September 30, 2017 was reduced by a $1.2 million gain related to the termination of an interest rate swap that occurred concurrent with the paydown of a mortgage.
Cost of debt extinguishment
Cost of debt extinguishment decreased to $0.1 million for the nine months ended September 30, 2018, compared to $5.0 million for the nine months ended September 30, 2017. The fluctuation is a direct result of our closing the $880 million Credit Facility on June 23, 2017, concurrent with the extinguishment of prior existing debt. There was no similar transaction during the nine months ended September 30, 2018.
Gain on sale of investment in related party
See discussion at Results of Operations — For the three months ended September 30, 2018 and 2017 — Gain on sale of investment in related party, above.
Net Income and Non-GAAP Measures (FFO and AFFO)
Our reported results and net earnings per diluted share are presented in accordance with GAAP. We also disclose FFO and AFFO, each of which are non-GAAP measures. We believe the presentation of FFO and AFFO are useful to investors because they are widely accepted industry measures used by analysts and investors to compare the operating performance of REITs. FFO and AFFO should not be considered alternatives to net income as a performance measure or to cash flows from operations, as reported on our statement of cash flows, or as a liquidity measure, and should be considered in addition to, and not in lieu of, GAAP financial measures.
We compute FFO in accordance with the standards established by the 2002 White Paper on FFO approved by the Board of Governors of Nareit, the worldwide representative voice for REITs and publicly traded real estate companies with an interest in the U.S. real estate and capital markets.. Nareit defines FFO as GAAP net income or loss adjusted to exclude net gains (losses) from sales of depreciated real estate assets, depreciation and amortization expense from real estate assets, and impairment charges related to previously depreciated real estate assets. To derive AFFO, we modify the Nareit computation of FFO to include other adjustments to GAAP net income related to certain non-cash revenues and expenses, including straight-line rents, cost of debt extinguishments, acquisition expenses, amortization of lease intangibles, amortization of debt issuance costs, amortization of net mortgage premiums, (gain) loss on interest rate swaps and other non-cash interest expense, extraordinary items and other specified non-cash items. We believe that such items are not a result of normal operations and thus we believe excluding such items assists management and investors in distinguishing whether changes in our operations are due to growth or decline of operations at our properties or from other factors.
48
Our leases include cash rents that increase over the term of the lease to compensate us for anticipated increases in market rentals over time. Our leases do not include significant front-loading or back-loading of payments, or significant rent-free periods. Therefore, we find it useful to evaluate rent on a contractual basis as it allows for comparison of existing rental rates to market rental rates. We further exclude costs or gains recorded on the extinguishment of debt, non-cash interest expense and gains, and the amortization of debt issuance costs, net mortgage premiums, and lease intangibles, as these items are not indicative of ongoing operational results. We use AFFO as a measure of our performance when we formulate corporate goals.
FFO is used by management, investors, and analysts to facilitate meaningful comparisons of operating performance between periods and among our peers, primarily because it excludes the effect of real estate depreciation and amortization and net gains on sales, which are based on historical costs and implicitly assume that the value of real estate diminishes predictably over time, rather than fluctuating based on existing market conditions. We believe that AFFO is a useful supplemental measure for investors to consider because it will help them to better assess our operating performance without the distortions created by non-cash revenues or expenses. FFO and AFFO may not be comparable to similarly titled measures employed by other REITs, and comparisons of our FFO and AFFO with the same or similar measures disclosed by other REITs may not be meaningful.
Neither the SEC nor any other regulatory body has passed judgment on the acceptability of the adjustments that we use to calculate FFO and AFFO. In the future, the SEC, Nareit or another regulatory body may decide to standardize the allowable adjustments across the REIT industry and in response to such standardization we may have to adjust our calculation and characterization of FFO and AFFO accordingly.
Net Income, FFO, and AFFO for the three months ended September 30, 2018 and 2017
The following table presents our net income and our non-GAAP FFO and AFFO for the three months ended September 30, 2018 and 2017. Our measures of FFO and AFFO are computed on the basis of amounts attributable to both us and non-controlling interests. As the non-controlling interests share in our net income on a one-for-one basis, the basic and diluted per share amounts are the same.
|
|
|
For the three months ended |
|
|
|
|
|
|
|
|
|||||
|
|
|
September 30, |
|
|
Increase/(Decrease) |
|
|||||||||
|
(in thousands, except per share data) |
|
2018 |
|
|
2017 |
|
|
$ |
|
% |
|
||||
|
Net income |
|
$ |
23,064 |
|
|
$ |
12,990 |
|
|
$ |
10,074 |
|
|
77.6 |
% |
|
Net earnings per diluted share |
|
|
1.03 |
|
|
|
0.68 |
|
|
|
0.35 |
|
|
51.5 |
% |
|
FFO |
|
|
44,969 |
|
|
|
27,189 |
|
|
|
17,780 |
|
|
65.4 |
% |
|
FFO per diluted share |
|
|
2.02 |
|
|
|
1.42 |
|
|
|
0.60 |
|
|
42.3 |
% |
|
AFFO |
|
|
31,315 |
|
|
|
24,813 |
|
|
|
6,502 |
|
|
26.2 |
% |
|
AFFO per diluted share |
|
|
1.40 |
|
|
|
1.30 |
|
|
|
0.10 |
|
|
7.7 |
% |
|
Diluted WASO(1) |
|
|
22,291 |
|
|
|
19,147 |
|
|
|
3,144 |
|
|
16.4 |
% |
|
(1) |
Weighted average number of shares of our common stock and membership units outstanding (“WASO”), computed in accordance with GAAP. |
Net income increased to $23.1 million for the three months ended September 30, 2018, compared to $13.0 million for the three months ended September 30, 2017. Net earnings per diluted share increased $0.35 per share during the same period, to $1.03 per share. The increase in net income is mainly attributable to increased operating income, reflecting the net growth in the number of investments in real estate properties in our portfolio, as discussed in Results of Operations — For the three months ended September 30, 2018 and 2017 — Revenues above. This portfolio growth generated increased revenues which were partially offset by increased depreciation and amortization, asset management and property management expenses. Additional contributing factors to net income growth were an $8.5 million gain on sale of an investment in a related party in 2018, for which there was no comparable transaction in 2017, and decreased impairment charges as compared to the prior-year period. These factors were partially offset by increased interest expense and decreased gains on sale of real estate in 2018, as compared to 2017. See further discussion in Results of Operations — For the three months ended September 30, 2018 and 2017— Other income (expenses), above.
The per-share impact of increased net income used in the numerator of the earnings per share calculation was somewhat offset by the effect of an increase in the diluted weighted average number of shares outstanding used in the denominator. The increase in the diluted weighted average number of shares reflected shares issued as part of our ongoing equity raises. We use proceeds from the sale of stock to partially fund acquisitions of real estate, which contributed to the increased revenues discussed above.
49
FFO increased to $45.0 million for the three months ended September 30, 2018, compared to $27.2 million for the three months ended September 30, 2017. FFO per diluted share increased to $2.02 per diluted share, compared to $1.42 per diluted share for the three months ended September 30, 2017. The increase in FFO is primarily due to the factors associated with growth in our real estate portfolio, discussed above, which were factors accounting for an increase in net income. Growth in FFO was greater than growth in net income, as there was a smaller deduction from net income in the three months ended September 30, 2018, related to gains on the sale of real estate as compared to the three months ended September 30, 2017. These factors were partially offset by a decrease in asset impairment charges in the three months ended September 30, 2018 as compared to the three months ended September 30, 2017, which are added back when computing FFO. The impact of the increase in FFO in the numerator of the FFO per share computation was partially mitigated by the increase in the weighted average number of shares outstanding used in the denominator.
AFFO
AFFO increased to $31.3 million for the three months ended September 30, 2018, compared to $24.8 million for the three months ended September 30, 2017. AFFO per diluted share increased to $1.40 per diluted share in the three months ended September 30, 2018, compared to $1.30 per diluted share in the three months ended September 30, 2017. As compared to the increase in FFO, the lower year-over-year growth in AFFO and AFFO per diluted share was mainly due to a $8.5 million gain on sale of our investment in a related party in the 2018 period, which is subtracted from FFO to compute AFFO; combined with a $1.4 million decrease in the addback adjustment for cost of debt extinguishment as compared to the 2017 period.
Net Income, FFO, and AFFO for the nine months ended September 30, 2018 and 2017
The following table presents our net income and our non-GAAP FFO and AFFO for the nine months ended September 30, 2018 and 2017. Our measures of FFO and AFFO are computed on the basis of amounts attributable to both us and non-controlling interests. As the non-controlling interests share in our net income on a one-for-one basis, the basic and diluted per share amounts are the same.
|
|
|
For the nine months ended |
|
|
|
|
|
|
|
|
|||||
|
|
|
September 30, |
|
|
Increase/(Decrease) |
|
|||||||||
|
(in thousands, except per share data) |
|
2018 |
|
|
2017 |
|
|
$ |
|
% |
|
||||
|
Net income |
|
$ |
60,444 |
|
|
$ |
42,729 |
|
|
$ |
17,715 |
|
|
41.5 |
% |
|
Net earnings per diluted share |
|
|
2.81 |
|
|
|
2.36 |
|
|
|
0.45 |
|
|
19.1 |
% |
|
FFO |
|
|
114,188 |
|
|
|
79,974 |
|
|
|
34,214 |
|
|
42.8 |
% |
|
FFO per diluted share |
|
|
5.31 |
|
|
|
4.43 |
|
|
|
0.88 |
|
|
19.9 |
% |
|
AFFO |
|
|
91,513 |
|
|
|
72,946 |
|
|
|
18,567 |
|
|
25.5 |
% |
|
AFFO per diluted share |
|
|
4.26 |
|
|
|
4.04 |
|
|
|
0.22 |
|
|
5.4 |
% |
|
Diluted WASO(1) |
|
|
21,496 |
|
|
|
18,069 |
|
|
|
3,427 |
|
|
19.0 |
% |
|
(1) |
Weighted average number of shares of our common stock and membership units outstanding (“WASO”), computed in accordance with GAAP. |
Net income
Net income increased to $60.4 million for the nine months ended September 30, 2018, compared to $42.7 million for the nine months ended September 30, 2017. Net earnings per diluted share increased to $2.81 per diluted share for the nine months ended September 30, 2018, compared to $2.36 per diluted share for the nine months ended September 30, 2017. The increase is mainly attributable to increased operating income, which was primarily due to the net growth in the number of investments in real estate properties in our portfolio, as discussed in Results of Operations — For the three months ended September 30, 2018 and 2017 — Revenues above. This portfolio growth generated increased revenues which were partially offset by increased depreciation and amortization, asset management, and property management expenses. Additional contributing factors to net income growth were an $8.5 million gain on sale of an investment in a related party in 2018, for which there was no comparable transaction in 2017, and decreased impairment charges as compared to the prior-year period. In addition, we recorded decreased expense associated with the extinguishment of debt during the nine months ended September 30, 2018, as compared to the prior-year period, discussed in Results of Operations — For the nine months ended September 30, 2018 and 2017— Other income (expenses), above. These factors were partially offset by increased interest expense.
The per-share impact of increased in net income used in the numerator of the earnings per share calculation was partially offset by the impact of increased diluted weighted average number of shares of our common stock outstanding used in the denominator, as compared to the nine months ended September 30, 2017. The increase in the diluted weighted average number of shares reflected shares issued as part of our ongoing equity raises. We use proceeds from the sale of stock to partially fund acquisitions of real estate, which contributes to the increased revenues discussed above.
50
FFO increased to $114.2 million for the nine months ended September 30, 2018, compared to $80.0 million for the nine months ended September 30, 2017. FFO per diluted share increased to $5.31 per diluted share for the nine months ended September 30, 2018, compared to $4.43 per diluted share for the nine months ended September 30, 2017. The increase in FFO is primarily due to the factors associated with growth in our real estate portfolio, discussed above, which were factors accounting for an increase in net income. The impact of the increase in FFO in the numerator of the FFO per share calculation was partially mitigated by the increase in the weighted average number of shares outstanding used in the denominator.
AFFO
AFFO increased to $91.5 million for the nine months ended September 30, 2018, compared to $72.9 million for the nine months ended September 30, 2017. AFFO per diluted share increased to $4.26 per diluted share for the nine months ended September 30, 2018, compared to $4.04 for the nine months ended September 30, 2017. As compared to the increase in FFO, the lower year-over-year growth in AFFO and AFFO per diluted share was mainly due to a $8.5 million gain on sale of our investment in a related party in the 2018 period, which is subtracted from FFO to compute AFFO; combined with a $4.9 million decrease in the addback adjustment for cost of debt extinguishment as compared to the 2017 period, which reflected the renegotiation of our Credit Facility in June 2017. In addition, the deduction for straight-line rent adjustments used to compute AFFO increased by $3.1 million, reflecting the growth in our real estate investment portfolio. These factors were somewhat offset by a $1.3 million decrease in the deduction related to gains on interest rate swaps, mainly reflecting the termination of an interest rate swap that occurred concurrent with the paydown of a mortgage in the prior year.
Reconciliation of Non-GAAP Measures
The following is a reconciliation of net income to FFO and AFFO for the three and nine months ended September 30, 2018 and 2017. Also presented is information regarding the weighted average number of shares of our common stock and non-controlling membership units used for the basic and diluted per share computation:
|
|
|
For the three months ended |
|
|
For the nine months ended |
|
||||||||||
|
(in thousands, except per share data) |
|
September 30, |
|
|
September 30, |
|
||||||||||
|
|
|
2018 |
|
|
2017 |
|
|
2018 |
|
|
2017 |
|
||||
|
Net income |
|
$ |
23,064 |
|
|
$ |
12,990 |
|
|
$ |
60,444 |
|
|
$ |
42,729 |
|
|
Real property depreciation and amortization |
|
|
21,869 |
|
|
|
15,643 |
|
|
|
61,303 |
|
|
|
44,969 |
|
|
Gain on sale of real estate |
|
|
(2,025 |
) |
|
|
(4,052 |
) |
|
|
(9,620 |
) |
|
|
(10,332 |
) |
|
Asset impairment |
|
|
2,061 |
|
|
|
2,608 |
|
|
|
2,061 |
|
|
|
2,608 |
|
|
FFO |
|
$ |
44,969 |
|
|
$ |
27,189 |
|
|
$ |
114,188 |
|
|
$ |
79,974 |
|
|
Capital improvements / reserves |
|
|
(49 |
) |
|
|
(49 |
) |
|
|
(147 |
) |
|
|
(147 |
) |
|
Straight line rent adjustment |
|
|
(5,337 |
) |
|
|
(4,521 |
) |
|
|
(15,640 |
) |
|
|
(12,585 |
) |
|
Cost of debt extinguishment |
|
|
50 |
|
|
|
1,404 |
|
|
|
101 |
|
|
|
5,019 |
|
|
Gain on sale of investment in related party |
|
|
(8,500 |
) |
|
|
— |
|
|
|
(8,500 |
) |
|
|
— |
|
|
Amortization of debt issuance costs |
|
|
477 |
|
|
|
486 |
|
|
|
1,410 |
|
|
|
1,343 |
|
|
Amortization of net mortgage premiums |
|
|
(36 |
) |
|
|
205 |
|
|
|
(107 |
) |
|
|
135 |
|
|
Gain on interest rate swaps and other non-cash interest expense |
|
|
(4 |
) |
|
|
— |
|
|
|
(4 |
) |
|
|
(1,280 |
) |
|
Amortization of lease intangibles |
|
|
(255 |
) |
|
|
99 |
|
|
|
212 |
|
|
|
487 |
|
|
AFFO |
|
$ |
31,315 |
|
|
$ |
24,813 |
|
|
$ |
91,513 |
|
|
$ |
72,946 |
|
|
|
|
|
|
|
|
|
|
|
|
|
|
|
|
|
|
|
|
Diluted WASO(1) |
|
|
22,291 |
|
|
|
19,147 |
|
|
|
21,496 |
|
|
|
18,069 |
|
|
|
|
|
|
|
|
|
|
|
|
|
|
|
|
|
|
|
|
Net earnings per share, basic and diluted |
|
$ |
1.03 |
|
|
$ |
0.68 |
|
|
$ |
2.81 |
|
|
$ |
2.36 |
|
|
FFO per diluted share |
|
|
2.02 |
|
|
|
1.42 |
|
|
|
5.31 |
|
|
|
4.43 |
|
|
AFFO per diluted share |
|
$ |
1.40 |
|
|
$ |
1.30 |
|
|
$ |
4.26 |
|
|
$ |
4.04 |
|
|
(1) |
Weighted average number of shares of our common stock and membership units outstanding (“WASO”), computed in accordance with GAAP |
51
This Management’s Discussion and Analysis of Financial Condition and Results of Operations is based upon our Condensed Consolidated Financial Statements, which have been prepared in accordance with GAAP. The preparation of these Condensed Consolidated Financial Statements requires management to make estimates and judgments that affect the reported amounts of assets, liabilities, revenues and expenses. Management bases its estimates on historical experience and assumptions that are believed to be reasonable under the circumstances, the results of which form the basis for making judgments about carrying value of assets and liabilities that are not readily apparent from other sources. Actual results may differ from these estimates under different assumptions or conditions. We believe there have been no significant changes during the nine months ended September 30, 2018 to the items that we disclosed as our critical accounting policies and estimates under Item 7. “Management’s Discussion and Analysis of Financial Condition and Results of Operations,” in our Form 10-K.
Impact of Recent Accounting Pronouncements
For information on the impact of recent accounting pronouncements on our business, see Note 2 of the notes to the condensed consolidated financial statements included in this Form 10-Q.
52
We are exposed to interest rate risk arising from changes in interest rates on the floating-rate indebtedness under our unsecured credit facilities and certain mortgages. Borrowings pursuant to our unsecured credit facilities and floating-rate mortgages bear interest at floating rates based on LIBOR plus an applicable margin. Accordingly, fluctuations in market interest rates may increase or decrease our interest expense, which will in turn increase or decrease our net income and cash flow.
We manage a portion of our interest rate risk by entering into interest rate swap agreements. Our interest rate risk management strategy is intended to stabilize cash flow requirements by maintaining interest rate swap agreements to convert certain variable-rate debt to fixed-rate debt. As of September 30, 2018, we had 28 interest rate swap agreements outstanding, with an aggregate notional amount of $760.1 million. Under these agreements, we receive monthly payments from the counterparties equal to the related variable interest rates multiplied by the outstanding notional amounts. In turn, we pay the counterparties each month an amount equal to a fixed interest rate multiplied by the related outstanding notional amounts. The intended net impact of these transactions is that we pay a fixed interest rate on our variable-rate borrowings. The interest rate swaps have been designated by us as cash flow hedges for accounting purposes and are reported at fair value. We assess, both at inception and on an ongoing basis, the effectiveness of our qualifying cash flow hedges. We have not entered, and do not intend to enter, into derivative or interest rate transactions for speculative purposes.
The table below summarizes the terms of the current swap agreements relating to our unsecured credit facilities. Several of the interest rate swap agreements set forth in the table below were entered into in conjunction with previous secured and unsecured borrowings that were retired, and the swaps have since been reapplied in support of the current unsecured credit facilities.
|
(in thousands, except interest rates) |
|
|
|
|
|
|
|
|
|
|
|
|
|
|
|
|
|
Counterparty |
|
Maturity Date |
|
Fixed Rate |
|
|
Variable Rate Index |
|
Notional Amount |
|
|
Fair Value |
|
|||
|
Bank of America, N.A. |
|
November 2023 |
|
|
2.80 |
% |
|
one-month LIBOR |
|
$ |
25,000 |
|
|
$ |
129 |
|
|
Bank of Montreal |
|
July 2024 |
|
|
1.16 |
% |
|
one-month LIBOR |
|
|
40,000 |
|
|
|
3,775 |
|
|
Bank of Montreal |
|
January 2025 |
|
|
1.91 |
% |
|
one-month LIBOR |
|
|
25,000 |
|
|
|
1,451 |
|
|
Bank of Montreal |
|
July 2025 |
|
|
2.32 |
% |
|
one-month LIBOR |
|
|
25,000 |
|
|
|
921 |
|
|
Bank of Montreal |
|
January 2026 |
|
|
1.92 |
% |
|
one-month LIBOR |
|
|
25,000 |
|
|
|
1,655 |
|
|
Bank of Montreal |
|
January 2026 |
|
|
2.05 |
% |
|
one-month LIBOR |
|
|
40,000 |
|
|
|
2,309 |
|
|
Bank of Montreal |
|
December 2026 |
|
|
2.33 |
% |
|
one-month LIBOR |
|
|
10,000 |
|
|
|
445 |
|
|
Bank of Montreal |
|
December 2027 |
|
|
2.37 |
% |
|
one-month LIBOR |
|
|
25,000 |
|
|
|
1,180 |
|
|
Capital One, N.A. |
|
December 2021 |
|
|
1.05 |
% |
|
one-month LIBOR |
|
|
15,000 |
|
|
|
867 |
|
|
Capital One, N.A. |
|
December 2024 |
|
|
1.58 |
% |
|
one-month LIBOR |
|
|
15,000 |
|
|
|
1,157 |
|
|
Capital One, N.A. |
|
January 2026 |
|
|
2.08 |
% |
|
one-month LIBOR |
|
|
35,000 |
|
|
|
1,996 |
|
|
Capital One, N.A. |
|
July 2026 |
|
|
1.32 |
% |
|
one-month LIBOR |
|
|
35,000 |
|
|
|
4,007 |
|
|
Capital One, N.A. |
|
December 2027 |
|
|
2.37 |
% |
|
one-month LIBOR |
|
|
25,000 |
|
|
|
1,215 |
|
|
Capital One, N.A. |
|
April 2026 |
|
|
2.68 |
% |
|
one-month LIBOR |
|
|
15,000 |
|
|
|
267 |
|
|
M&T Bank |
|
August 2021 |
|
|
1.02 |
% |
|
one-month LIBOR |
|
|
5,085 |
|
|
|
306 |
|
|
M&T Bank |
|
September 2022 |
|
|
2.83 |
% |
|
one-month LIBOR |
|
|
25,000 |
|
|
|
59 |
|
|
M&T Bank |
|
November 2023 |
|
|
2.65 |
% |
|
one-month LIBOR |
|
|
25,000 |
|
|
|
250 |
|
|
Regions Bank |
|
May 2020 |
|
|
2.12 |
% |
|
one-month LIBOR |
|
|
50,000 |
|
|
|
501 |
|
|
Regions Bank |
|
December 2023 |
|
|
1.18 |
% |
|
one-month LIBOR |
|
|
25,000 |
|
|
|
2,130 |
|
|
SunTrust Bank |
|
April 2024 |
|
|
1.99 |
% |
|
one-month LIBOR |
|
|
25,000 |
|
|
|
1,181 |
|
|
SunTrust Bank |
|
April 2025 |
|
|
2.20 |
% |
|
one-month LIBOR |
|
|
25,000 |
|
|
|
1,074 |
|
|
SunTrust Bank |
|
July 2025 |
|
|
1.99 |
% |
|
one-month LIBOR |
|
|
25,000 |
|
|
|
1,444 |
|
|
SunTrust Bank |
|
December 2025 |
|
|
2.30 |
% |
|
one-month LIBOR |
|
|
25,000 |
|
|
|
1,035 |
|
|
SunTrust Bank |
|
January 2026 |
|
|
1.93 |
% |
|
one-month LIBOR |
|
|
25,000 |
|
|
|
1,651 |
|
|
Wells Fargo Bank, N.A. |
|
February 2021 |
|
|
2.39 |
% |
|
one-month LIBOR |
|
|
35,000 |
|
|
|
363 |
|
|
Wells Fargo Bank, N.A. |
|
October 2024 |
|
|
2.72 |
% |
|
one-month LIBOR |
|
|
15,000 |
|
|
|
162 |
|
|
Wells Fargo Bank, N.A. |
|
January 2028 |
|
|
2.37 |
% |
|
one-month LIBOR |
|
|
75,000 |
|
|
|
3,580 |
|
|
Wells Fargo Bank, N.A. |
|
April 2027 |
|
|
2.72 |
% |
|
one-month LIBOR |
|
|
25,000 |
|
|
|
415 |
|
|
|
|
|
|
|
|
|
|
|
|
$ |
760,085 |
|
|
$ |
35,525 |
|
With the exception of our interest rate swap transactions, we have not engaged in transactions in derivative financial instruments or derivative commodity instruments.
As of September 30, 2018, our financial instruments were not exposed to significant market risk due to foreign currency exchange risk.
53
Evaluation of Disclosure Controls and Procedures
We maintain disclosure controls and procedures (as defined in Rules 13a-15(e) and 15d-15(e) of the Securities Exchange Act of 1934, as amended (the “Exchange Act”)), that are designed to ensure that information required to be disclosed in our Exchange Act reports is recorded, processed, summarized, and reported within the time periods specified in the Securities and Exchange Commission’s rules and forms, and that such information is accumulated and communicated to our management, including our Chief Executive Officer and Chief Financial Officer, as appropriate, to allow timely decisions regarding required disclosure. As of and for the quarter ended September 30, 2018, we carried out an evaluation of the effectiveness of the design and operation of our disclosure controls and procedures, under the supervision and with the participation of management, including our Chief Executive Officer and Chief Financial Officer. Based on the foregoing, our Chief Executive Officer and Chief Financial Officer concluded that our disclosure controls and procedures were effective and were operating at a reasonable assurance level.
Changes in Internal Control over Financial Reporting
There were no changes to our internal control over financial reporting that occurred during the quarter ended September 30, 2018, that have materially affected, or are reasonably likely to materially affect, our internal control over financial reporting.
54
From time to time, we are subject to legal proceedings and claims that arise in the ordinary course of our business. These matters are generally covered by insurance or are subject to our right to be indemnified by our tenants that we include in our leases. Management is not aware of any material pending legal proceedings to which we or any of our subsidiaries are a party or to which any of our property is subject, nor are we aware of any such legal proceedings contemplated by government agencies.
There have been no material changes from the risk factors set forth in our Form 10-K.
Sales of Common Stock
We commenced our ongoing private offering of shares of our common stock in 2007. The first closing of our private offering occurred on December 31, 2007, and we have conducted additional closings at least once every calendar quarter since then. Currently, we close sales of additional shares of our common stock monthly. In November 2017, we instituted a monthly equity cap and queue program for new and additional investments in our common stock. The cap does not apply to investments made pursuant to our DRIP or equity capital received in connection with UPREIT transactions. For the months of February 2018 through June 2018, new and additional investments were capped at $15.0 million per month. Based on anticipated acquisition activity, we increased the cap to $20.0 million for the months of July through October 2018, and to $30.0 million for the months of November 2018 through January 2019.
If the total subscriptions for shares of our common stock exceed the cap for a month, subscriptions will generally be accepted at that month’s closing in the order in which they were submitted. In our or the Asset Manager’s discretion, however, certain subscriptions may be given priority over other subscriptions based on factors other than the order of submission, including the size of the subscription, the size of a stockholder’s existing investment, whether the subscription was sourced through an existing or new intermediary relationship, and such other factors we or the Asset Manager may consider. Any subscription for shares that we do not accept at any closing may be held for two subsequent closings and, if so held, shall be treated as a continuing subscription to purchase any remaining shares at the two subsequent closings (and, if applicable, any additional subsequent closings resulting from the subscriber’s exercise of the renewal option discussed below) at the offering price established at the initially subscribed for closing. If we do not accept and request payment for all of the shares subscribed for at one of the first three closings after receipt of a subscription, the subscriber will have the option to renew its subscription for three additional closings and maintain its position in any equity subscription queue by providing written notice of the subscriber’s election to exercise such option. The same option will be available to the subscriber for each subsequent three-closing period.
For the nine months ended September 30, 2018, we sold 2.3 million shares of our common stock in our private offering, including 0.5 million shares of common stock issued pursuant to our DRIP, for gross offering proceeds of approximately $186.3 million. We intend to use substantially all of the net proceeds from our private offering, supplemented with additional borrowings, to continue to invest in additional net leased properties and for general corporate purposes.
55
The following table provides information regarding the sale of shares of our common stock pursuant to our ongoing private offering during the nine months ended September 30, 2018 (in thousands, except year and Determined Share Value amounts).
|
Month |
|
Year |
|
Common Shares Sold |
|
|
Weighted Average Determined Share Value — Common Shares1 |
|
|
Total Proceeds — Common Shares Sold |
|
|
Common Shares DRIP |
|
|
Weighted Average Determined Share Value — DRIP2 |
|
|
Total Proceeds — Common Share DRIP3 |
|
|
Total Proceeds |
|
|||||||
|
January |
|
2018 |
|
|
185 |
|
|
$ |
81 |
|
|
$ |
15,000 |
|
|
|
49 |
|
|
$ |
79 |
|
|
$ |
3,892 |
|
|
$ |
18,892 |
|
|
February |
|
2018 |
|
|
185 |
|
|
|
81 |
|
|
|
14,941 |
|
|
|
50 |
|
|
|
79 |
|
|
|
3,962 |
|
|
|
18,903 |
|
|
March |
|
2018 |
|
|
185 |
|
|
|
81 |
|
|
|
15,000 |
|
|
|
53 |
|
|
|
79 |
|
|
|
4,175 |
|
|
|
19,175 |
|
|
April |
|
2018 |
|
|
184 |
|
|
|
81 |
|
|
|
14,897 |
|
|
|
50 |
|
|
|
79 |
|
|
|
4,008 |
|
|
|
18,905 |
|
|
May |
|
2018 |
|
|
173 |
|
|
|
83 |
|
|
|
14,325 |
|
|
|
53 |
|
|
|
79 |
|
|
|
4,234 |
|
|
|
18,559 |
|
|
June |
|
2018 |
|
|
181 |
|
|
|
83 |
|
|
|
15,000 |
|
|
|
53 |
|
|
|
81 |
|
|
|
4,281 |
|
|
|
19,281 |
|
|
July |
|
2018 |
|
|
231 |
|
|
|
83 |
|
|
|
19,193 |
|
|
|
54 |
|
|
|
81 |
|
|
|
4,380 |
|
|
|
23,573 |
|
|
August |
|
2018 |
|
|
238 |
|
|
|
84 |
|
|
|
20,000 |
|
|
|
55 |
|
|
|
81 |
|
|
|
4,463 |
|
|
|
24,463 |
|
|
September |
|
2018 |
|
|
235 |
|
|
|
85 |
|
|
|
20,000 |
|
|
|
55 |
|
|
|
83 |
|
|
|
4,593 |
|
|
|
24,593 |
|
|
Total |
|
|
|
|
1,797 |
|
|
|
|
|
|
$ |
148,356 |
|
|
|
472 |
|
|
|
|
|
|
$ |
37,988 |
|
|
$ |
186,344 |
|
|
(1) |
Shares of our common stock are sold in our ongoing private offering at a price per share equal to the applicable Determined Share Value at the time subscriptions are received. |
|
(2) |
DRIP shares are purchased at a discounted rate of 98% of the Determined Share Value. |
|
(3) |
For common shares reinvested under our DRIP there is no corresponding cash flow from the transaction. Refer to Note 15 to the Condensed Consolidated Financial Statements included in this Form 10-Q for further discussion. |
None of the shares of our common stock set forth in the table above were registered under the Securities Act in reliance upon the exemption from registration under the Securities Act provided by Rule 506(c) under Regulation D promulgated under the Securities Act. All of the shares of our common stock set forth in the table above were sold to persons who represented to us in writing that they qualified as an “Accredited Investor” as such term is defined by Regulation D promulgated under the Securities Act, and provided us with additional documentation to assist us in verifying such person’s status as accredited investors.
Repurchases of Equity Securities
During the three months ended September 30, 2018, we fulfilled repurchase requests and repurchased shares of our common stock pursuant to our share redemption program as follows.
|
Period |
|
Total Number of Shares Requested to be Redeemed (1) |
|
|
Total Number of Shares Redeemed |
|
|
Average Price Paid Per Share (2) |
|
|
Approximate Dollar Value of Shares Available That May Yet Be Redeemed Under the Program |
|||
|
July 2018 |
|
|
— |
|
|
|
— |
|
|
|
— |
|
|
(3) |
|
August 2018 |
|
|
— |
|
|
|
— |
|
|
|
— |
|
|
(3) |
|
September 2018 |
|
|
32,502 |
|
|
|
32,502 |
|
|
$ |
82.29 |
|
|
(3) |
|
(1) |
Repurchases of shares of our common stock pursuant to the share redemption program will be made quarterly, at the end of the quarter, upon written request to us delivered at least 10 calendar days prior to the last business day of the applicable calendar quarter, and the redemption price paid for redeemed shares will be paid in cash within three business days of the last business day of the applicable calendar quarter. |
|
(2) |
Shares held for more than 12 months, but less than five years, will be redeemed at a purchase price equal to 95% of the Determined Share Value in effect as of the last business day of the quarter in which the shares are timely tendered for redemption and shares held for five years or more will be redeemed at a purchase price equal to 100% of the Determined Share Value in effect as of the last business day of the quarter in which the shares are timely tendered for redemption, subject to certain exceptions as set forth in the share redemption program. |
|
(3) |
The total number of shares redeemed pursuant to the share redemption program in any quarter may not exceed (i) 1% of the total number of shares outstanding at the beginning of the applicable calendar year, plus (ii) 50% of the total number of any additional shares of our common stock issued during the prior calendar quarter pursuant to our DRIP; provided, however, that the total number of shares redeemed during any calendar year may not exceed 5% of the number of shares outstanding as of the first day of such calendar year. |
56
None.
Not applicable.
Not applicable.
57
|
No. |
|
Description |
|
|
|
|
|
3.1 |
|
|
|
|
|
|
|
3.2 |
|
|
|
|
|
|
|
4.1 |
|
|
|
|
|
|
|
4.2 |
|
|
|
|
|
|
|
10.1 |
|
|
|
|
|
|
|
31.1* |
|
|
|
|
|
|
|
|
||
|
|
|
|
|
32.1*† |
|
|
|
|
|
|
|
32.2*† |
|
|
|
|
|
|
|
101.1 |
|
The following materials from the Company’s Quarterly Report on Form 10-Q for the quarterly period ended September 30, 2018, formatted in XBRL (eXtensible Business Reporting Language): (i) Condensed Consolidated Balance Sheets, (ii) Condensed Consolidated Statements of Income and Comprehensive Income, (iii) Condensed Consolidated Statements of Stockholders’ Equity, (iv) Condensed Consolidated Statements of Cash Flows, and (v) Notes to Condensed Consolidated Financial Statements |
|
* |
Filed herewith. |
|
† |
In accordance with Item 601(b)(32) of Regulation S-K, this Exhibit is not deemed “filed” for purposes of Section 18 of the Exchange Act or otherwise subject to the liabilities of that section. Such certifications will not be deemed incorporated by reference into any filing under the Securities Act or the Exchange Act, except to the extent that the Registrant specifically incorporates it by reference. |
58
Pursuant to the requirements of the Securities Exchange Act of 1934, the registrant has duly caused this report to be signed on its behalf by the undersigned thereunto duly authorized.
|
|
|
BROADSTONE NET LEASE, INC. |
|
|
|
|
|
Date: November 5, 2018 |
|
/s/ Christopher J. Czarnecki |
|
|
|
Christopher J. Czarnecki |
|
|
|
Chief Executive Officer and President |
|
|
|
|
|
Date: November 5, 2018 |
|
/s/ Ryan M. Albano |
|
|
|
Ryan M. Albano |
|
|
|
Executive Vice President and Chief Financial Officer |
59