Attached files
| file | filename |
|---|---|
| 8-K - FORM 8-K - WESCO INTERNATIONAL INC | wcc-3q2018earnings8k.htm |
| EX-99.1 - NEWS RELEASE - WESCO INTERNATIONAL INC | wcc-3q2018earningsrelease.htm |

Q3 2018 Earnings Webcast Presentation – November 1, 2018

Safe Harbor Statement All statements made herein that are not historical facts should be considered as “forward-looking statements” within the meaning of the Private Securities Litigation Act of 1995. Such statements involve known and unknown risks, uncertainties and other factors that may cause actual results to differ materially. Such risks, uncertainties and other factors include, but are not limited to: adverse economic conditions; disruptions in operations or information technology systems; increase in competition; expansion of business activities; supply chain disruptions, changes in supplier strategy or loss of key suppliers; personnel turnover or labor cost increases; risks related to acquisitions, including the integration of acquired businesses; tax law changes or challenges to tax matters, including uncertainties in the interpretation and application of the Tax Cuts and Jobs Act of 2017; exchange rate fluctuations; debt levels, terms, financial market conditions or interest rate fluctuations; stock market, economic or political instability; legal or regulatory matters; litigation, disputes, contingencies or claims; and other factors described in detail in the Form 10-K for WESCO International, Inc. for the year ended December 31, 2017 and any subsequent filings with the Securities & Exchange Commission. The following presentation includes a discussion of certain non-GAAP financial measures. Information required by Regulation G with respect to such non-GAAP financial measures can be found in the appendix and obtained via WESCO’s website, www.wesco.com. 2 Q3 2018 Earnings Webcast 11/1/18

Q3 2018 Highlights July 5% Aug 5% • Continued strong results in the third quarter Organic Growth Sept 3% ‒ Double digit EBIT and EPS growth versus prior year (%) ‒ Gross margin and operating margin expansion, both 10.9 10.1 sequentially and year-over-year 8.6 9.0 • Continued positive business momentum and growth across all end markets • Reported sales were up 3%, organic sales were up 4%: Up 4% in the U.S. 4.2 ‒ ‒ Up 8% in Canada 1.0 ‒ Down 3% in International (1.7) • Q3 monthly organic sales were up 13% each month on a two year (3.1) (3.6) stack basis • Estimated pricing impact +2% (6.7) (6.2) • October preliminary workday adjusted sales up low single digits • Q3 backlog at record levels, up 7% versus prior year Q1 Q2 Q3 Q4 Q1 Q2 Q3 Q4 Q1 Q2 Q3 • Free cash flow at 121% of net income in Q3 and at 90% of net 2016 2017 2018 income YTD Note: Organic growth excludes the impact of: acquisitions in the first year of • Repurchased $25 million of shares in Q3; increased current ownership, foreign exchange rates and number of workdays. See appendix for authorization to $400M non-GAAP reconciliations. …double digit operating profit, net income and EPS growth versus prior year 3 Q3 2018 Earnings Webcast 11/1/18

Industrial End Market Organic Sales Growth versus Prior Year • Q3 2018 Sales − Organic sales were up 1% versus prior year • Global Accounts (up 3% in the U.S. and up 4% in Canada in local 37% • Integrated Supply • OEM currency) • General Industrial Industrial 13.9% − Down 3% sequentially 11.2% 10.4% • Industrial recovery continues with positive customer sentiment driven by increasing production and capacity 2017 utilization; labor constraints support higher capital 8.0% 6.0% 5.8% spending • Global Account and Integrated Supply opportunity 1.2% 0.8% pipeline and bidding activity levels remain strong • Customer trends include continued high expectations Q1 2017 Q2 2017 Q3 2017 Q4 2017 Q1 2018 Q2 2018 Q3 2018 for supply chain process improvements, cost Note: See appendix for non-GAAP reconciliations. reductions, and supplier consolidation Awarded a multi-year contract to provide an integrated supply solution to support a large oil and gas customer’s upstream operations in the United States. 4 Q3 2018 Earnings Webcast 11/1/18

Construction End Market Organic Sales Growth versus Prior Year • Q3 2018 Sales − Organic sales were up 3% versus prior year 33% • Non-Residential • Contractors (flat in the U.S. and up 12% in Canada in local Construction currency) 8.9% 9.4% 7.9% 6.0% − Up 2% sequentially 2.8% • Strong backlog and business momentum continues 2017 with construction/contractor customers 1.7% • Backlog up 7% versus prior year and down 3% from Q2 (in line with normal seasonality) (3.6%) • Expecting moderate growth and uptrend in non- (4.4%) residential construction market to continue Q1 2017 Q2 2017 Q3 2017 Q4 2017 Q1 2018 Q2 2018 Q3 2018 Note: See appendix for non-GAAP reconciliations. As a follow-on to winning the electrical materials scope, we were awarded a contract to provide data communications for the construction of a new medical center in Canada. 5 Q3 2018 Earnings Webcast 11/1/18

Utility End Market Organic Sales Growth versus Prior Year • Q3 2018 Sales − Organic sales were up 11% versus prior year (up 13% in the U.S. and down 4% in Canada in local • Investor Owned 17.9% 18.8% 16% • Public Power currency) • Utility Contractors Utility − Up 4% sequentially 11.0% 8.6% 9.1% • Continued scope expansion and value creation with investor owned utility, public power, and generation customers 2017 2.3% • Continued interest in Integrated Supply solution offerings (4.5%)(4.4%) • Favorable economic conditions, continued improvement in construction market, renewables growth, and Q1 2017 Q2 2017 Q3 2017 Q4 2017 Q1 2018 Q2 2018 Q3 2018 consolidation trend within Utility industry remain positive catalysts for future spending Note: See appendix for non-GAAP reconciliations. Entered into a multi-year renewal of a contract to provide an integrated supply solution for the generation and transmission operations of a U.S. utility. 6 Q3 2018 Earnings Webcast 11/1/18
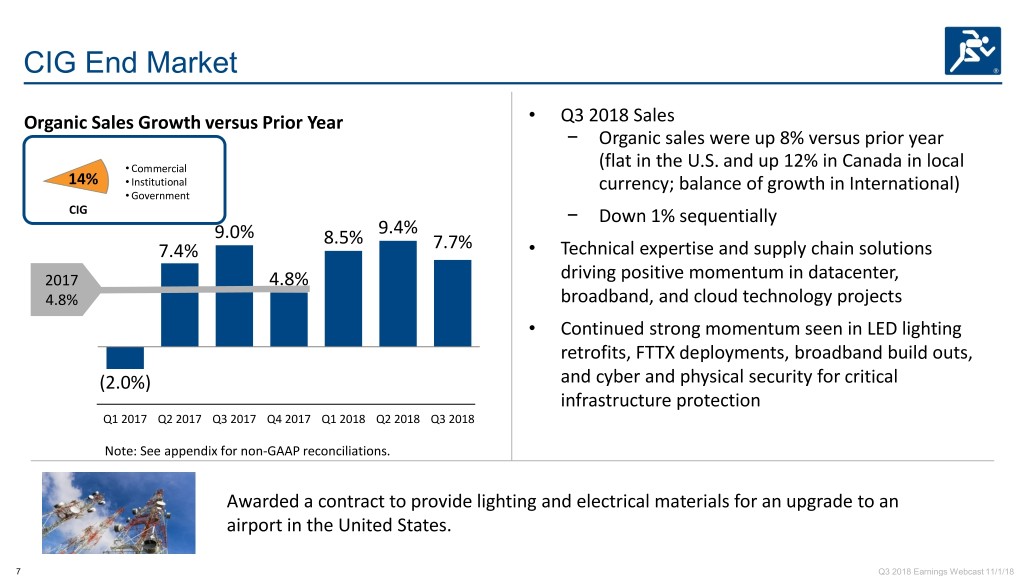
CIG End Market Organic Sales Growth versus Prior Year • Q3 2018 Sales − Organic sales were up 8% versus prior year • Commercial (flat in the U.S. and up 12% in Canada in local 14% • Institutional currency; balance of growth in International) • Government CIG − Down 1% sequentially 9.4% 9.0% 8.5% 7.4% 7.7% • Technical expertise and supply chain solutions 2017 4.8% driving positive momentum in datacenter, 4.8% broadband, and cloud technology projects • Continued strong momentum seen in LED lighting retrofits, FTTX deployments, broadband build outs, (2.0%) and cyber and physical security for critical infrastructure protection Q1 2017 Q2 2017 Q3 2017 Q4 2017 Q1 2018 Q2 2018 Q3 2018 Note: See appendix for non-GAAP reconciliations. Awarded a contract to provide lighting and electrical materials for an upgrade to an airport in the United States. 7 Q3 2018 Earnings Webcast 11/1/18
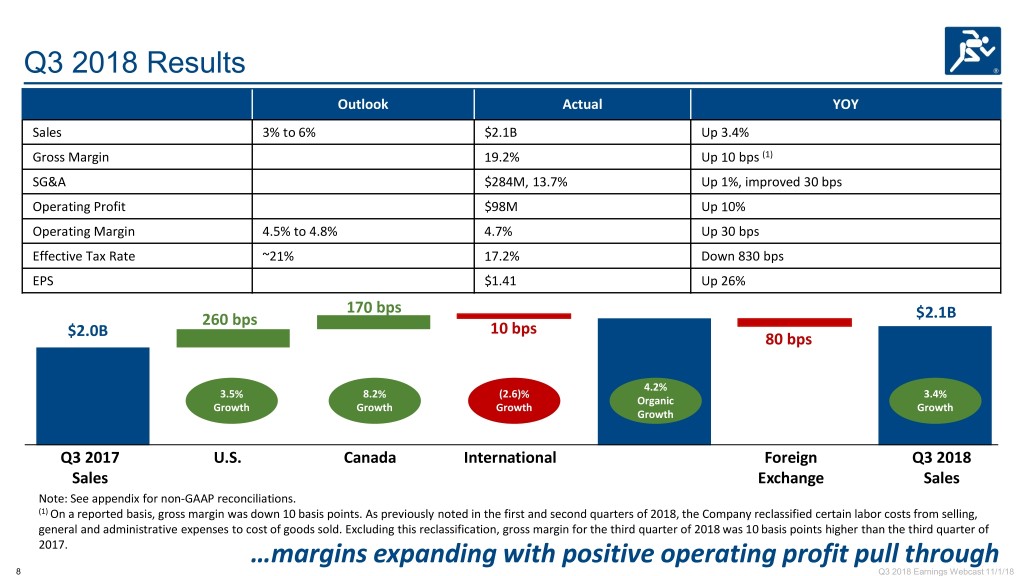
Q3 2018 Results Outlook Actual YOY Sales 3% to 6% $2.1B Up 3.4% Gross Margin 19.2% Up 10 bps (1) SG&A $284M, 13.7% Up 1%, improved 30 bps Operating Profit $98M Up 10% Operating Margin 4.5% to 4.8% 4.7% Up 30 bps Effective Tax Rate ~21% 17.2% Down 830 bps EPS $1.41 Up 26% 170 bps 260 bps $2.1B 10 bps $2.0B 80 bps 4.2% 3.5% 8.2% (2.6)% 3.4% Organic Growth Growth Growth Growth Growth Q3 2017 U.S. Canada International Foreign Q3 2018 Sales Exchange Sales Note: See appendix for non-GAAP reconciliations. (1) On a reported basis, gross margin was down 10 basis points. As previously noted in the first and second quarters of 2018, the Company reclassified certain labor costs from selling, general and administrative expenses to cost of goods sold. Excluding this reclassification, gross margin for the third quarter of 2018 was 10 basis points higher than the third quarter of 2017. …margins expanding with positive operating profit pull through 8 Q3 2018 Earnings Webcast 11/1/18
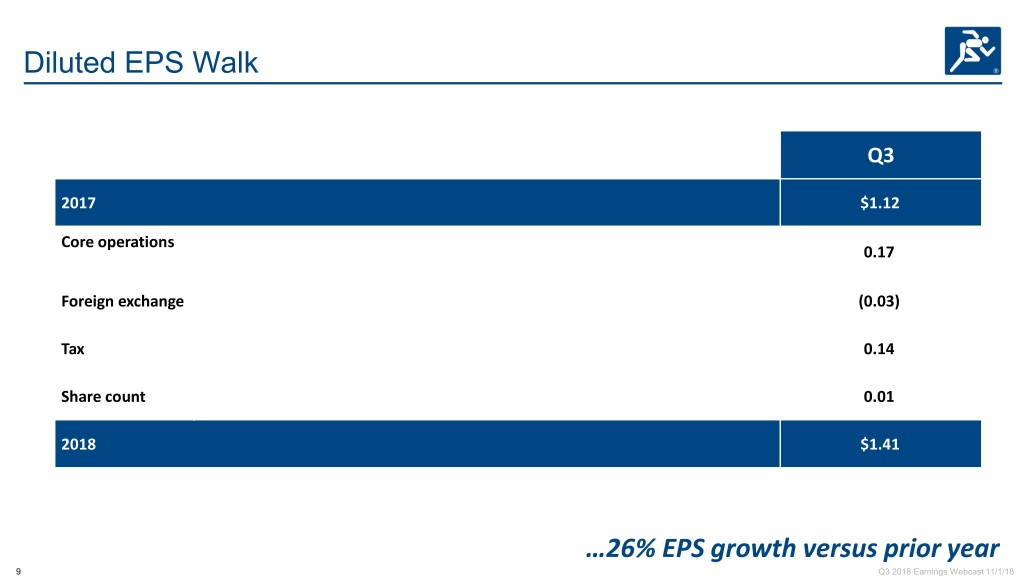
Diluted EPS Walk Q3 2017 $1.12 Core operations 0.17) Foreign exchange (0.03) Tax 0.14) Share count 0.01) 2018 $1.41 …26% EPS growth versus prior year 9 Q3 2018 Earnings Webcast 11/1/18

Free Cash Flow & Leverage Free Cash Flow Leverage ($ Millions) (Total Debt to TTM EBITDA) ~ $1.2B of free 4.0x cash flow over Target last 5 years Leverage $150.8 3.5x 2.0x – 3.5x 3.1X 3.0x 2.5x $65.1 2.0x 46% 90% of net of net 1.5x income income Q1 Q2 Q3 Q4 Q1 Q2 Q3 Q4 Q1 Q2 Q3 2017 YTD 2018 YTD 2016 2017 2018 Note: See appendix for non-GAAP reconciliations. …strong free cash flow generation and financial leverage improvement in Q3 10 Q3 2018 Earnings Webcast 11/1/18

Effective Capital Allocation Consistent Cash Deployment Priorities Increased Share Repurchase Authorization • Support organic growth • Up to $400M through end of 2020 − $100M increase in authorization • Fund accretive acquisitions − utilized $25M in 3Q18 − anticipate utilizing additional $175M of • Manage financial leverage authorization through first half of 2019 (subject to market conditions) • Repurchase shares • Authorization enables WESCO to: − offset dilution from annual equity awards − make opportunistic purchases …strong cash flow permits simultaneous investment across all priorities 11 Q3 2018 Earnings Webcast 11/1/18
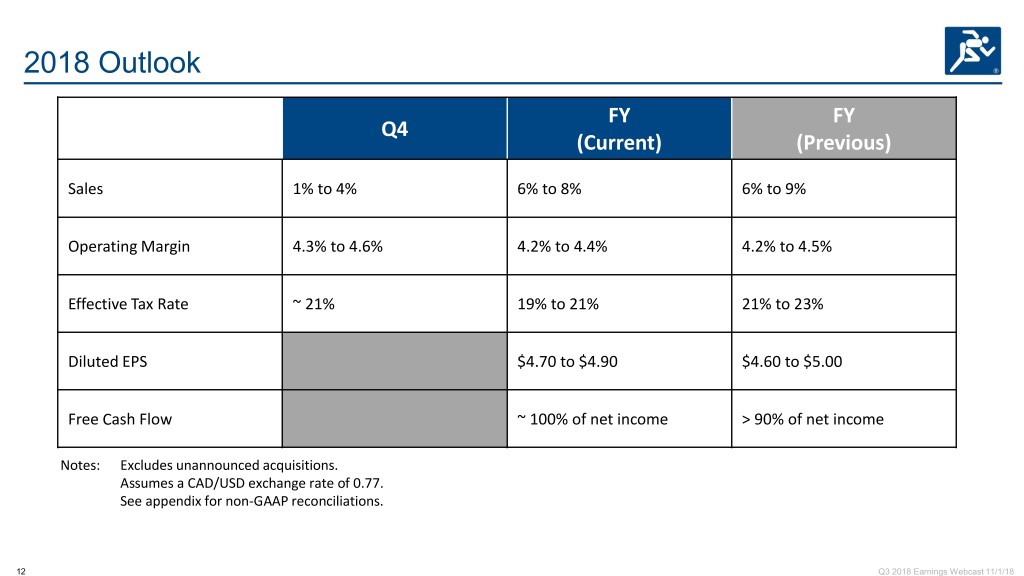
2018 Outlook FY FY Q4 (Current) (Previous) Sales 1% to 4% 6% to 8% 6% to 9% Operating Margin 4.3% to 4.6% 4.2% to 4.4% 4.2% to 4.5% Effective Tax Rate ~ 21% 19% to 21% 21% to 23% Diluted EPS $4.70 to $4.90 $4.60 to $5.00 Free Cash Flow ~ 100% of net income > 90% of net income Notes: Excludes unannounced acquisitions. Assumes a CAD/USD exchange rate of 0.77. See appendix for non-GAAP reconciliations. 12 Q3 2018 Earnings Webcast 11/1/18

2019 Sales Outlook Sales Outlook End markets in U.S. and Canada LSD to MSD growth in all end markets End Market Sales Growth 2% to 5% Market outperformance 1% to 2% Foreign currency slightly unfavorable Consolidated WESCO 3% to 6% Note: Excludes future acquisitions …another year of market outperformance in 2019 13 Q3 2018 Earnings Webcast 11/1/18

Appendix NON-GAAP FINANCIAL MEASURES This presentation includes certain non-GAAP financial measures. These financial measures include organic sales growth, gross margin, financial leverage, earnings before interest, taxes, depreciation and amortization (EBITDA), and free cash flow. Management believes that these non-GAAP measures are useful to investors as they provide a better understanding of sales performance, and the use of debt and liquidity on a comparable basis. Management does not use these non-GAAP financial measures for any purpose other than the reasons stated above. 14 Q3 2018 Earnings Webcast 11/1/18

WESCO Profile 2018 Markets & Customers Products & Services 8% 14% 10% 40% 16% 37% 12% 33% 15% 15% Industrial Global Accounts | Integrated Supply General Supplies OEM | General Industrial Communications & Security Construction Wire, Cable & Conduit Non-Residential | Contractors Utility Lighting & Sustainability Investor Owned | Public Power Electrical Distribution & Controls Utility Contractors Automation, Controls & Motors CIG Commercial | Institutional | Government Note: Markets & Customers and Products & Services percentages reported on a TTM consolidated basis. 15 Q3 2018 Earnings Webcast 11/1/18

Sales Growth (%) 2016 2017 2018 Q1 Q2 Q3 Q4 FY Q1 Q2 Q3 Q4 FY Q1 Q2 Q3 Change in Net Sales (2.2) (0.3) (3.6) (3.7) (2.4) (0.2) (0.1) 7.8 11.3 4.7 12.5 10.2 3.4 Acquisition Impact 3.9 3.7 2.9 1.8 3.1 0.9 0.2 Core (6.1) (4.0) (6.5) (5.5) (5.5) (1.1) (0.1) 7.8 11.3 4.5 12.5 10.2 3.4 FX Impact (2.6) (0.9) (0.3) (0.3) (1.0) 0.6 (1.1) 0.8 1.2 0.4 1.6 1.2 (0.8) Workday Impact 3.2 (1.6) 0.4 (1.6) (0.4) Organic (6.7) (3.1) (6.2) (3.6) (4.9) (1.7) 1.0 8.6 10.1 4.5 10.9 9.0 4.2 Note: Core sales growth excludes acquisitions during the first year of ownership. 16 Q3 2018 Earnings Webcast 11/1/18

Q3 2018 Organic Sales Growth by Geography (%) U.S. Canada International WESCO Change in net sales (USD) 3.5 4.8 (4.2) 3.4 Impact from acquisitions - - - - Impact from foreign exchange rates - (3.4) (1.6) (0.8) Impact from number of workdays - - - - Organic sales growth 3.5 8.2 (2.6) 4.2 17 Q3 2018 Earnings Webcast 11/1/18
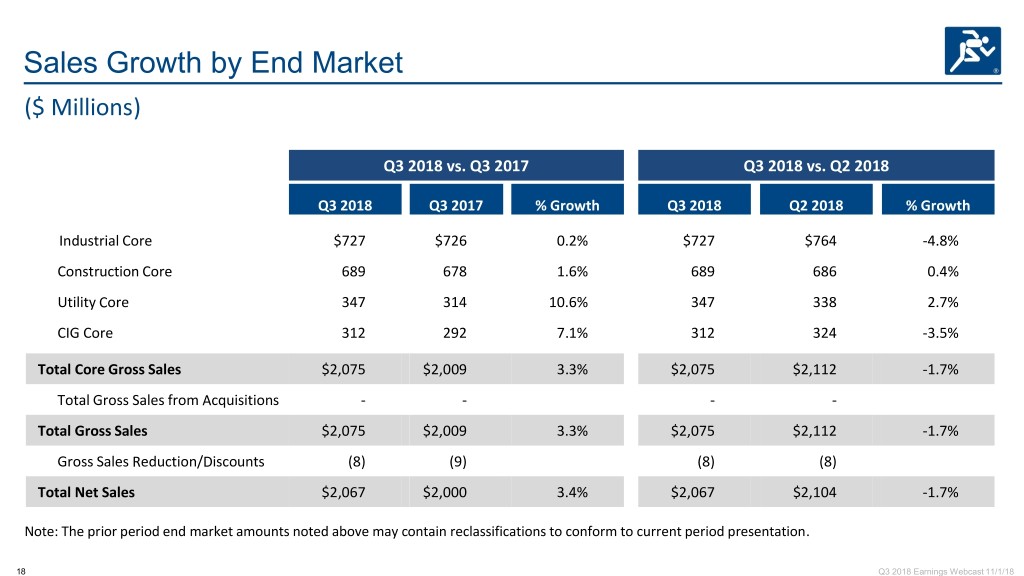
Sales Growth by End Market ($ Millions) Q3 2018 vs. Q3 2017 Q3 2018 vs. Q2 2018 Q3 2018 Q3 2017 % Growth Q3 2018 Q2 2018 % Growth Industrial Core $727 $726 0.2% $727 $764 -4.8% Construction Core 689 678 1.6% 689 686 0.4% Utility Core 347 314 10.6% 347 338 2.7% CIG Core 312 292 7.1% 312 324 -3.5% Total Core Gross Sales $2,075 $2,009 3.3% $2,075 $2,112 -1.7% Total Gross Sales from Acquisitions - - - - Total Gross Sales $2,075 $2,009 3.3% $2,075 $2,112 -1.7% Gross Sales Reduction/Discounts (8) (9) (8) (8) Total Net Sales $2,067 $2,000 3.4% $2,067 $2,104 -1.7% Note: The prior period end market amounts noted above may contain reclassifications to conform to current period presentation. 18 Q3 2018 Earnings Webcast 11/1/18

Q3 2018 Organic Sales by End Market (%) Industrial Construction Utility CIG WESCO Core Sales Growth 0.2 1.6 10.6 7.1 3.4 FX Impact (0.6) (1.2) (0.4) (0.6) (0.8) Workday Impact - - - - - Organic Growth 0.8 2.8 11.0 7.7 4.2 19 Q3 2018 Earnings Webcast 11/1/18

Gross Margin ($ Millions) Three Months Ended September 30, September 30, 2018 2017 Net sales $2,067 $2,000 Cost of goods sold (excluding depreciation and amortization) 1,670 1,615 Gross profit (1) $397 $385 Gross margin (1) 19.2% 19.3% (1) Gross profit is calculated by deducting cost of goods sold, excluding depreciation and amortization, from net sales. Gross margin is calculated by dividing gross profit by net sales. Note: For gross margin in prior periods, see quarterly earnings webcasts as previously furnished to the Securities & Exchange Commission, which can be obtained from the Investor Relations page of WESCO’s website at www.wesco.com. 20 Q3 2018 Earnings Webcast 11/1/18

Capital Structure ($ Millions) Outstanding at Outstanding at Debt December 31, 2017 September 30, 2018 Maturity Schedule AR Revolver (V) 380 365 2020 Inventory Revolver (V) 12 - 2020 2019 Term Loans (V) 85 25 2019 2021 Senior Notes (F) 500 500 2021 2024 Senior Notes (F) 350 350 2024 Other (V) 36 32 N/A Total Debt 1,363 1,272 Key Financial Metrics YE 2017 Q3 2018 Cash 118 143 Capital Expenditures 22 7 Free Cash Flow (1) 128 80 Liquidity (2) 794 828 (V) Variable Rate Debt (1) Cash flow provided by operations less capital expenditures. (F) Fixed Rate Debt (2) Total availability under asset-backed credit facilities plus cash in investment accounts. 21 Q3 2018 Earnings Webcast 11/1/18

Financial Leverage ($ Millions) Twelve Months Ended September 30, 2018 Income from operations (1) $343 Depreciation and amortization 64 EBITDA $407 September 30, 2018 Short-term borrowings and current debt $32 Long-term debt 1,229 Debt discount and debt issuance costs (2) 11 Total debt $1,272 Less: cash and cash equivalents 143 Total debt, net of cash $1,129 Financial leverage ratio 3.1X Financial leverage ratio, net of cash 2.8X (1) Due to the adoption of ASU 2017-07 on a retrospective basis in the first quarter of 2018, the Company classified the non-service cost components of net periodic benefit cost as part of net interest and other for the twelve months ended September 30, 2018. These components aggregate to a benefit of $1.9 million. (2) Long-term debt is presented in the condensed consolidated balance sheet as of September 30, 2018 net of debt discount and debt issuance costs. Note: For financial leverage ratio in prior periods, see quarterly earnings webcasts as previously furnished to the Securities & Exchange Commission, which can be obtained from the Investor Relations page of WESCO’s website at www.wesco.com. 22 Q3 2018 Earnings Webcast 11/1/18

Free Cash Flow Reconciliation ($ Millions) YTD YTD 2017 2018 Cash flow provided by operations $81.1 $174.5 Less: Capital expenditures (16.0) (23.7) Free cash flow 65.1 150.8 Net income $140.9 $167.3 Percentage of net income 46% 90% Note: Free cash flow is provided by the Company as an additional liquidity measure. Capital expenditures are deducted from operating cash flow to determine free cash flow. Free cash flow is available to fund investing and financing activities. 23 Q3 2018 Earnings Webcast 11/1/18

Work Days Q1 Q2 Q3 Q4 FY 2016 64 64 64 62 254 2017 64 64 63 62 253 2018 64 64 63 62 253 2019 63 64 63 62 252 24 Q3 2018 Earnings Webcast 11/1/18
