Attached files
| file | filename |
|---|---|
| EX-99.1 - EXHIBIT 99.1 - Prestige Consumer Healthcare Inc. | exhibit991fy19-q2earningsr.htm |
| 8-K - 8-K - Prestige Consumer Healthcare Inc. | a8-kpressreleaseseptember3.htm |

Exhibit 99.2

This presentation contains certain “forward-looking” statements within the meaning of the Private Securities Litigation Reform Act of 1995, such as statements regarding the Company’s expected financial performance, including revenue growth, organic revenue growth, online sales revenue, adjusted EPS, and adjusted free cash flow; the market position and consumption trends for the Company’s brands; timing of revenue growth, impact of consumption growth, the Company’s focus on brand-building; the Company’s ability to increase online sales, the timing and impact of the packaging rollout for BC & Goody’s and the impact of the divestiture of the Household Cleaning business. Words such as “trend,” “continue,” “will,” “expect,” “project,” “anticipate,” “likely,” “estimate,” “may,” “should,” “could,” “would,” and similar expressions identify forward-looking statements. Such forward-looking statements represent the Company’s expectations and beliefs and involve a number of known and unknown risks, uncertainties and other factors that may cause actual results to differ materially from those expressed or implied by such forward-looking statements. These factors include, among others, general economic and business conditions, regulatory matters, competitive pressures, supplier issues, consumer acceptance of new packaging, disruptions to distribution, unexpected costs or liabilities, and other risks set forth in Part I, Item 1A. Risk Factors in the Company’s Annual Report on Form 10-K for the year ended March 31, 2018. You are cautioned not to place undue reliance on these forward-looking statements, which speak only as of the date this presentation. Except to the extent required by applicable law, the Company undertakes no obligation to update any forward-looking statement contained in this presentation, whether as a result of new information, future events, or otherwise. All adjusted GAAP numbers presented are footnoted and reconciled to their closest GAAP measurement in the attached reconciliation schedules or in our November 1, 2018 earnings release in the “About Non-GAAP Financial Measures” section.


Q2 Revenue of $239.4 million, up 1.6%(1) versus PY Q2 adjusted for the Household divestiture – Solid consumption growth in-line with full-year expectations – Strong growth in international segment – Revenue continues to be impacted by shipment timing of new BC/Goody’s packaging and change in revenue recognition accounting policies Adjusted Gross Margin of 57.4%(2) up 200 bps sequentially versus Q1 FY 19 and up 110 bps versus Q2 FY 18 – Continued progress on improving freight and warehouse costs – Improved portfolio margin profile post-Household divestiture Adjusted EPS of $0.65(2), up 6.6% versus PY Q2 Continued solid Adjusted Free Cash Flow of $44.1 million(2), resulting in leverage of 5.2x(4) Total debt paydown of $100 million in the quarter – $50 million of net proceeds from Household divestiture used to paydown debt – Enables future capital allocation optionality

Consistently Outpacing the Category(3) Professional FY 2014 – L-52 Consumption CAGR Marketing 3x 6.5% Brand Innovation 2.2% Digital Marketing Ear Wax Removers Category

Continues Brand-Building Efforts Product has begun to arrive on top customer shelves while continuing to build inventory Revenue and Gross Margin headwinds from rollout in Q2 Marketing efforts began in October Began building inventory Products begin to arrive on Launch marketing of new product shelves of top customers campaign Q1 FY 19 Q2 FY 19 Q3 FY 19 Q4 FY 19 First shipments of new Continue rollout to major 70% of customer sales Final Conversion of products accounts converted as of October 1st Remaining Customers Expect to be Largely Complete with Rollout of New Product by the End of FY 19

E-Commerce Brand of Choice Strong Online Sales Trajectory Channel remains an opportunity, not a threat $32+ Ongoing channel investments – Effective digital marketing efforts 2H Optimal consumer connection opportunities FY19E ~$20 Run-Rate ~$10 1H ~$16 FY19 “Hard to find” “Shy to buy” “Regimen” #6 PBH SKU in #3 PBH Brand on #1 PBH Brand on E-Commerce E-Commerce E-Commerce FY17 FY18 FY19E Dollar values in millions.


Overall financial performance as expected in the quarter: − Q2 Revenue of $239.4 million, an organic growth increase of 1.6%(1) vs prior year − Q2 Adjusted EBITDA(2) of $80.1 million, a decrease of (7.3%) vs prior year − Q2 Adjusted EPS of $0.65(2), an increase of 6.6% vs prior year, and YTD 2019 Adjusted EPS of $1.33(2), up 4.7% vs prior year Q2 FY 19 Q2 FY 18 YTD FY 19 YTD FY 18 0.4% 1.6% $473.5 $471.6 (8.3%) $239.4 $235.6 4.7% (7.3%) 6.6% $162.5 $177.2 $80.1 $86.5 $0.65 $0.61 $1.33 $1.27 Organic Revenue (1) Adjusted EBITDA(2) Adjusted EPS (2) Organic Revenue (1) Adjusted EBITDA(2) Adjusted EPS(2) Dollar values in millions, except per share data.

Organic revenue growth of 1.6%(1) Q2 FY 19 Q2 FY 18 % Chg Q2 FY 19 Q2 FY 18 % Chg in Q2 Total Revenue $ 239.4 $ 258.0 (7.2%) $ 493.3 $ 514.6 (4.1%) (2) – Impacted by shipment Adjusted Gross Margin 137.5 145.2 (5.3%) 278.3 291.3 (4.5%) timing of new BC/Goody’s % Margin 57.4% 56.3% 56.4% 56.6% packaging and change in Adjusted A&P (2) 37.0 39.4 (6.0%) 74.2 76.3 (2.8%) revenue recognition % Total Revenue 15.5% 15.3% 15.0% 14.8% accounting policies (2) Adjusted G&A 21.2 21.1 0.3% 43.7 40.9 6.8% Adjusted Gross Margin(2) of 57.4% % Total Revenue 8.9% 8.2% 8.9% 8.0% in Q2, up 110 bps vs prior year D&A (ex. COGS D&A) 6.8 7.2 (6.0%) 13.8 14.4 (3.6%) % Total Revenue 2.8% 2.8% 2.8% 2.8% – Continued sequential (2) improvement post- Adjusted Operating Income $ 72.5 $ 77.5 (6.5%) $ 146.6 $ 159.7 (8.2%) Household divestiture % Margin 30.3% 30.0% 29.7% 31.0% (2) Adjusted Earnings Per Share (2) $ 0.65 $ 0.61 6.6% $ 1.33 $ 1.27 4.7% Adjusted EBITDA percent of sales of 33.5% in Q2 in-line with (2) Adjusted EBITDA $ 80.1 $ 86.5 (7.3%) $ 162.5 $ 177.2 (8.3%) expectations % Margin 33.5% 33.5% 32.9% 34.4% Dollar values in millions, except per share data.

Q2 Adjusted Free Cash Flow(2) impacted by BC and Q2 FY 19 Q2 FY 18 1H FY 19 1H FY 18 Goody’s inventory build to support new product launch as well as cadence of profitability (12.3%) Net Debt(2) at September 30 of $1,876 million; (4) $111.4 leverage ratio of 5.2x at end of Q2 $97.7 Completed $50 million opportunistic share (19.6%) repurchase program in Q1 $54.8 $100 million debt paydown in Q2 $44.1 Adjusted Free Cash Flow (2) Adjusted Free Cash Flow (2) Dollar values in millions.


Strong momentum across our portfolio; continue to win share versus categories and private label Household divestiture enables sole focus on consumer healthcare business Continue to gain market share with consumers and grow categories with retailers Prestige’s portfolio of leading brands continues to be well positioned for long-term growth despite macro headwinds at retail Revenue outlook of $985 to $995 million; organic growth of 0.5% to 1.5% – Expect consumption growth in excess of shipment growth – 2H FY 19 Revenue growth concentrated in Q4 Adjusted EPS +10% to +13% ($2.84 to $2.92)(5) – 2H FY 19 EPS growth concentrated in Q4 due to multiple timing factors Adjusted Free Cash Flow of $205 million or more(6) Dollar values in millions, except per share data.

(1) Organic Revenue Growth is a Non-GAAP financial measure and is reconciled to the most closely related GAAP financial measure in the attached Reconciliation Schedules and / or our earnings release in the “About Non-GAAP Financial Measures” section. (2) Adjusted Gross Margin, Adjusted A&P, Adjusted G&A, Adjusted EBITDA, Adjusted Operating Income, Adjusted Net Income, Adjusted EPS, Adjusted Free Cash Flow and Net Debt are Non-GAAP financial measures and are reconciled to their most closely related GAAP financial measures in the attached Reconciliation Schedules and / or in our earnings release in the “About Non- GAAP Financial Measures” section. (3) Total company consumption is based on domestic IRI multi-outlet + C-Store retail dollar sales for the twelve month period ending 9-9-18 and net revenues as a proxy for consumption for certain untracked channels, and international consumption which includes Canadian consumption for leading retailers, Australia consumption for leading brands, and other international net revenues as a proxy for consumption. (4) Leverage ratio reflects net debt / covenant defined EBITDA. (5) Adjusted EPS for FY 19 is a projected Non-GAAP financial measure, is reconciled to projected GAAP EPS in the attached Reconciliation Schedules and / or in our earnings release in the “About Non-GAAP Financial Measures” section and is calculated based on projected GAAP EPS less costs associated with acquisitions and divestitures. (6) Adjusted Free Cash Flow for FY 19 is a projected Non-GAAP financial measure, is reconciled to projected GAAP Net Cash Provided by Operating Activities in the attached Reconciliation Schedules and / or in our earnings release in the “About Non- GAAP Financial Measures” section and is calculated based on projected Net Cash Provided by Operating Activities less projected capital expenditures plus payments associated with acquisitions and divestitures less tax effect of payments associated with acquisitions and divestitures.

Three Months Ended Sept. 30, Six Months Ended Sept. 30, 2018 2017 2018 2017 (In Thousands) GAAP Total Revenues $ 239,357 $ 258,026 $ 493,337 $ 514,599 Revenue Growth (7.2%) (4.1%) Adjustments: Revenue associated with divestiture - (21,767) (19,811) (41,627) Allocated costs that remain after divestiture - (700) - (1,400) Total Adjustments $ - $ (22,467) $ (19,811) $ (43,027) Non-GAAP Organic Revenues $ 239,357 $ 235,559 $ 473,526 $ 471,572 Non-GAAP Organic Revenues Growth 1.6% 0.4%

Three Months Ended Sept. 30, Six Months Ended Sept. 30, 2018 2017 2018 2017 (In Thousands) GAAP Total Revenues $ 239,357 $ 258,026 $ 493,337 $ 514,599 GAAP Gross Profit $ 137,472 $ 144,098 $ 278,095 $ 287,574 GAAP Gross Profit as a Percentage of GAAP Total Revenue 57.4% 55.8% 56.4% 55.9% Adjustments: Integration, transition and other costs associated with divestiture and acquisition - 1,143 170 3,719 Total adjustments - 1,143 170 3,719 Non-GAAP Adjusted Gross Margin $ 137,472 $ 145,241 $ 278,265 $ 291,293 Non-GAAP Adjusted Gross Margin as a Percentage of GAAP Total Revenues 57.4% 56.3% 56.4% 56.6%

Three Months Ended Sept. 30, Six Months Ended Sept. 30, 2018 2017 2018 2017 (In Thousands) GAAP Advertising and Promotion Expense $ 37,042 $ 39,188 $ 74,153 $ 76,132 GAAP Advertising and Promotion Expense as a Percentage of GAAP Total Revenue 15.5% 15.2% 15.0% 14.8% Adjustments: Integration, transition and other costs associated with acquisition - (231) - (192) Total adjustments - (231) - (192) Non-GAAP Adjusted Advertising and Promotion Expense $ 37,042 $ 39,419 $ 74,153 $ 76,324 Non-GAAP Adjusted Advertising and Promotion Expense as a Percentage of GAAP Total Revenues 15.5% 15.3% 15.0% 14.8%

Three Months Ended Sept. 30, Six Months Ended Sept. 30, 2018 2017 2018 2017 (In Thousands) GAAP General and Administrative Expense $ 24,034 $ 21,999 $ 47,975 $ 42,409 GAAP General and Administrative Expense as a Percentage of GAAP Total Revenue 10.0% 8.5% 9.7% 8.2% Adjustments: Integration, transition and other costs associated with divestiture and acquisition 2,850 888 4,272 1,472 Total adjustments 2,850 888 4,272 1,472 Non-GAAP Adjusted General and Administrative Expense $ 21,184 $ 21,111 $ 43,703 $ 40,937 Non-GAAP Adjusted General and Administrative Expense Percentage as a Percentage of GAAP Total Revenues 8.9% 8.2% 8.9% 8.0%

Three Months Ended Sept. 30, Six Months Ended Sept. 30, 2018 2017 2018 2017 (In Thousands) GAAP Net Income $ 30,841 $ 30,705 $ 65,307 $ 64,464 Interest expense, net 27,070 26,836 53,010 53,177 Provision for income taxes 12,678 18,616 24,672 37,545 Depreciation and amortization 7,994 8,534 16,366 17,041 Non-GAAP EBITDA 78,583 84,691 159,355 172,227 Non-GAAP EBITDA Margin 32.8% 32.8% 32.3% 33.5% Adjustments: Integration, transition and other costs associated with divestiture and acquisition in Cost of Goods Sold - 1,143 170 3,719 Integration, transition and other costs associated with acquisition in Advertising and Promotion Expense - (231) - (192) Integration, transition and other costs associated with divestiture and acquisition in General and Administrative Expense 2,850 888 4,272 1,472 Gain on divestiture (1,284) - (1,284) - Total adjustments 1,566 1,800 3,158 4,999 Non-GAAP Adjusted EBITDA $ 80,149 $ 86,491 $ 162,513 $ 177,226 Non-GAAP Adjusted EBITDA Margin 33.5% 33.5% 32.9% 34.4%
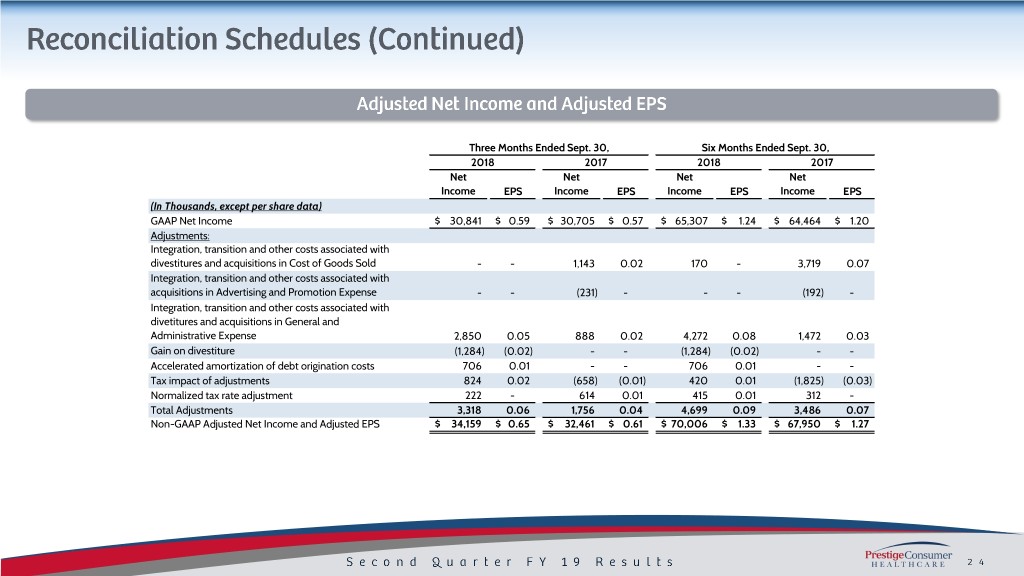
Three Months Ended Sept. 30, Six Months Ended Sept. 30, 2018 2017 2018 2017 Net Net Net Net Income EPS Income EPS Income EPS Income EPS (In Thousands, except per share data) GAAP Net Income $ 30,841 $ 0.59 $ 30,705 $ 0.57 $ 65,307 $ 1.24 $ 64,464 $ 1.20 Adjustments: Integration, transition and other costs associated with divestitures and acquisitions in Cost of Goods Sold - - 1,143 0.02 170 - 3,719 0.07 Integration, transition and other costs associated with acquisitions in Advertising and Promotion Expense - - (231) - - - (192) - Integration, transition and other costs associated with divetitures and acquisitions in General and Administrative Expense 2,850 0.05 888 0.02 4,272 0.08 1,472 0.03 Gain on divestiture (1,284) (0.02) - - (1,284) (0.02) - - Accelerated amortization of debt origination costs 706 0.01 - - 706 0.01 - - Tax impact of adjustments 824 0.02 (658) (0.01) 420 0.01 (1,825) (0.03) Normalized tax rate adjustment 222 - 614 0.01 415 0.01 312 - Total Adjustments 3,318 0.06 1,756 0.04 4,699 0.09 3,486 0.07 Non-GAAP Adjusted Net Income and Adjusted EPS $ 34,159 $ 0.65 $ 32,461 $ 0.61 $ 70,006 $ 1.33 $ 67,950 $ 1.27

Three Months Ended Sept. 30, Six Months Ended Sept. 30, 2018 2017 2018 2017 (In Thousands) GAAP Net Income $ 30,841 $ 30,705 $ 65,307 $ 64,464 Adjustments: Adjustments to reconcile net income to net cash provided by operating activities as shown in the Statement of Cash Flows 5,349 21,530 23,054 43,513 Changes in operating assets and liabilities as shown in the 3,065 2,184 6,746 563 Statement of Cash Flows Total Adjustments 8,414 23,714 29,800 44,076 GAAP Net cash provided by operating activities 39,255 54,419 95,107 108,540 Purchase of property and equipment (2,605) (2,231) (5,074) (4,785) Non-GAAP Free Cash Flow 36,650 52,188 90,033 103,755 Integration, transition and other payments associated with divestiture and acquisition 7,429 2,654 7,618 7,602 Non-GAAP Adjusted Free Cash Flow $ 44,079 $ 54,842 $ 97,651 $ 111,357

2019 Projected Free Cash Flow 2019 Projected EPS Low High (In millions) Projected FY'19 GAAP EPS $ 2.75 $ 2.83 Projected FY'19 GAAP Net Cash provided by operating activities $ 195 Adjustments: Additions to property and equipment for cash (13) Sale of Household Cleaning Business 0.07 0.07 Projected Non-GAAP Free Cash Flow 182 Tax Adjustment 0.02 0.02 Total Adjustments 0.09 0.09 Payments associated with divestiture 23 Projected Non-GAAP Adjusted EPS $ 2.84 $ 2.92 Projected Non-GAAP Adjusted Free Cash Flow $ 205
