Attached files
| file | filename |
|---|---|
| EX-99.1 - EXHIBIT 99.1 - OWENS & MINOR INC/VA/ | ex991q318.htm |
| 8-K - 8-K - OWENS & MINOR INC/VA/ | q32018earnings8k.htm |

3rd Quarter 2018 Earnings October 31, 2018 1
Safe Harbor This presentation is intended to be disclosure through methods reasonably designed to provide broad, non- exclusionary distribution to the public in compliance with the SEC's Fair Disclosure Regulation. This presentation contains certain ''forward-looking'' statements made pursuant to the Safe Harbor provisions of the Private Securities Litigation Reform Act of 1995. These statements include, but are not limited to, the statements in this presentation regarding our expectations with respect to our 2018 and 2019 financial performance, as well as other statements related to the company’s expectations regarding the performance of its business, growth, improvement of operational performance, and the performance of and synergies from the recently acquired Byram Healthcare and Halyard businesses. Forward-looking statements involve known and unknown risks and uncertainties that may cause our actual results in future periods to differ materially from those projected or contemplated in the forward-looking statements. Investors should refer to Owens & Minor’s Annual Report on Form 10-K for the year ended December 31, 2017, filed with the SEC including the sections captioned “Cautionary Note Regarding Forward-Looking Statements” and “Item 1A. Risk Factors,” and subsequent quarterly reports on Form 10-Q and current reports on Form 8-K filed with or furnished to the SEC, for a discussion of certain known risk factors that could cause the company’s actual results to differ materially from its current estimates. These filings are available at www.owens- minor.com. Given these risks and uncertainties, Owens & Minor can give no assurance that any forward- looking statements will, in fact, transpire and, therefore, caution investors not to place undue reliance on them. Owens & Minor specifically disclaims any obligation to update or revise any forward-looking statements, whether as a result of new information, future developments or otherwise. Owens & Minor uses its web site, www.owens-minor.com, as a channel of distribution for material company information, including news releases, investor presentations and financial information. This information is routinely posted and accessible under the Investor Relations section. Included with the press release financial tables are reconciliations of the differences between the historical non-GAAP financial measures contained in this presentation, which exclude acquisition-related and exit and realignment charges, and their most directly comparable GAAP financial measures. 2
Cody Phipps Chairman, President & CEO Robert Snead Interim CFO, GVP Global Solutions 6
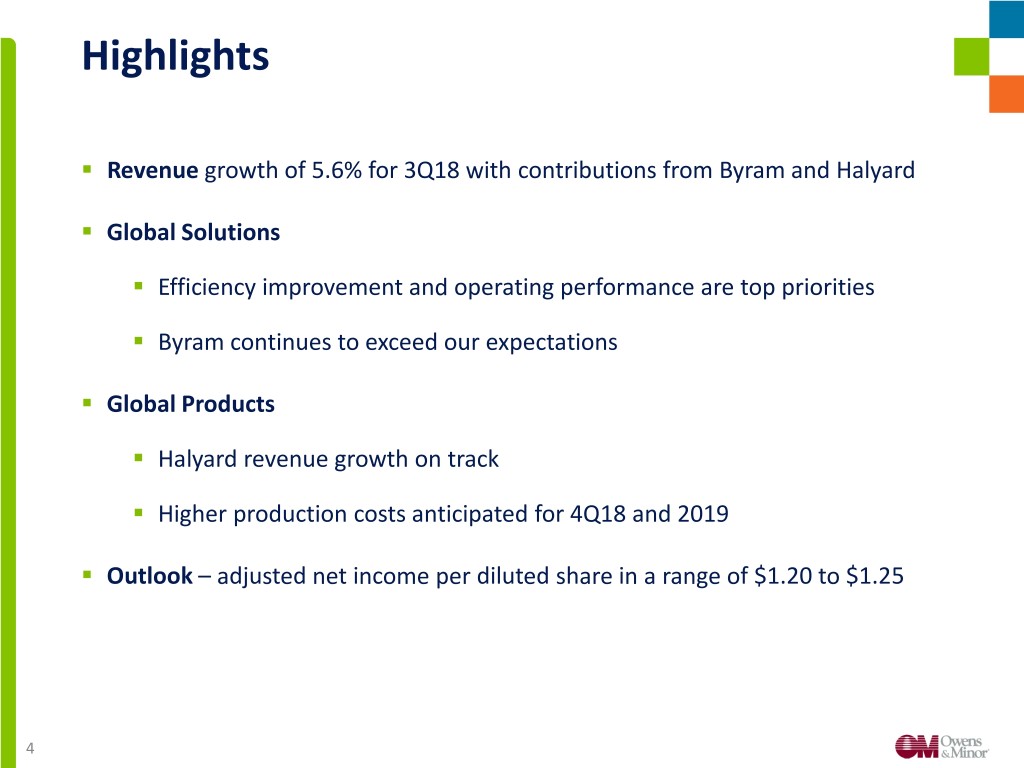
Highlights . Revenue growth of 5.6% for 3Q18 with contributions from Byram and Halyard . Global Solutions . Efficiency improvement and operating performance are top priorities . Byram continues to exceed our expectations . Global Products . Halyard revenue growth on track . Higher production costs anticipated for 4Q18 and 2019 . Outlook – adjusted net income per diluted share in a range of $1.20 to $1.25 4
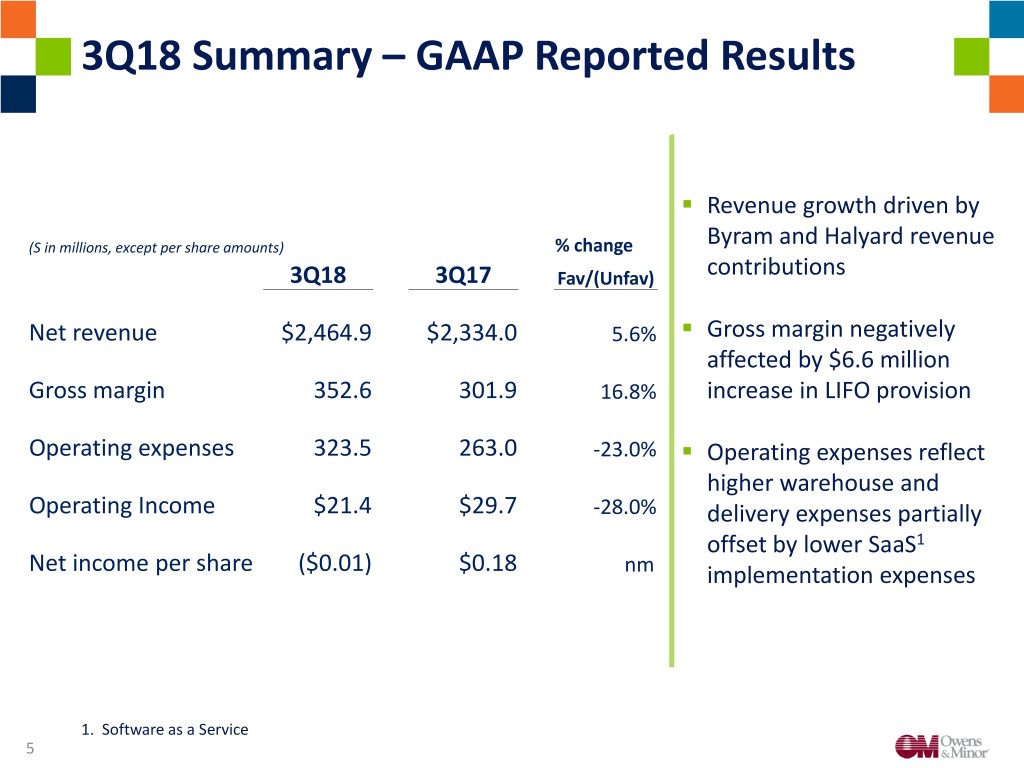
3Q18 Summary – GAAP Reported Results . Revenue growth driven by (S in millions, except per share amounts) % change Byram and Halyard revenue 3Q18 3Q17 Fav/(Unfav) contributions Net revenue $2,464.9 $2,334.0 5.6% . Gross margin negatively affected by $6.6 million Gross margin 352.6 301.9 16.8% increase in LIFO provision Operating expenses 323.5 263.0 -23.0% . Operating expenses reflect higher warehouse and Operating Income $21.4 $29.7 -28.0% delivery expenses partially offset by lower SaaS1 Net income per share ($0.01) $0.18 nm implementation expenses 1. Software as a Service 5
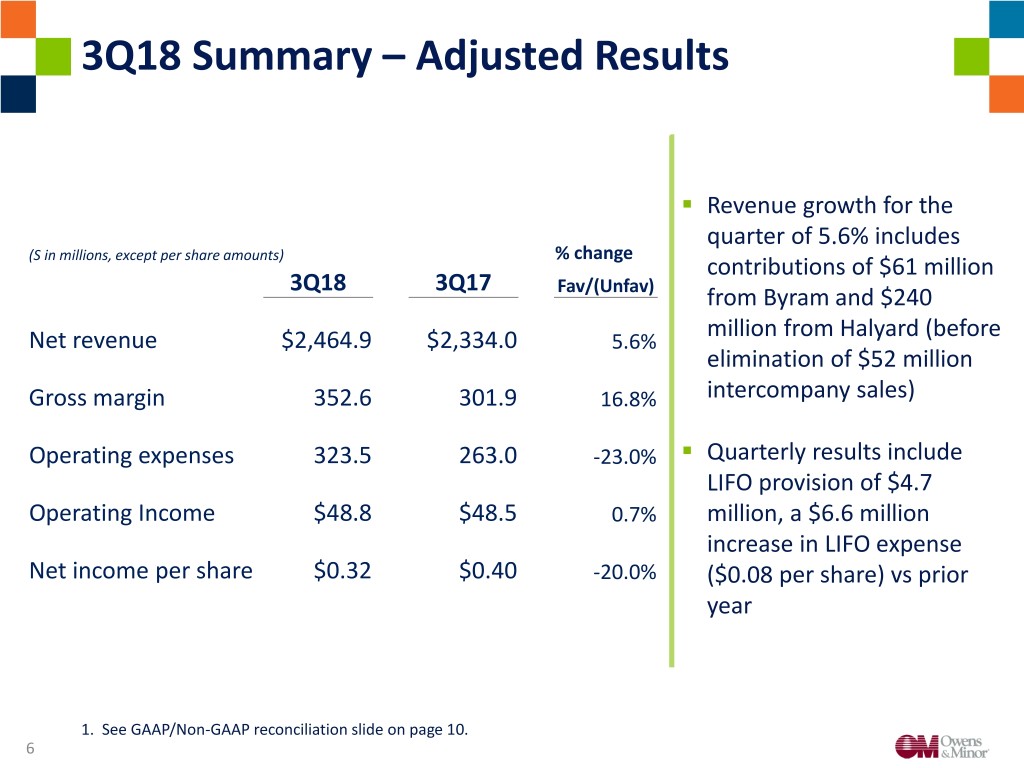
3Q18 Summary – Adjusted Results . Revenue growth for the quarter of 5.6% includes (S in millions, except per share amounts) % change contributions of $61 million 3Q18 3Q17 Fav/(Unfav) from Byram and $240 million from Halyard (before Net revenue $2,464.9 $2,334.0 5.6% elimination of $52 million Gross margin 352.6 301.9 16.8% intercompany sales) Operating expenses 323.5 263.0 -23.0% . Quarterly results include LIFO provision of $4.7 Operating Income $48.8 $48.5 0.7% million, a $6.6 million increase in LIFO expense Net income per share $0.32 $0.40 -20.0% ($0.08 per share) vs prior year 1. See GAAP/Non-GAAP reconciliation slide on page 10. 6
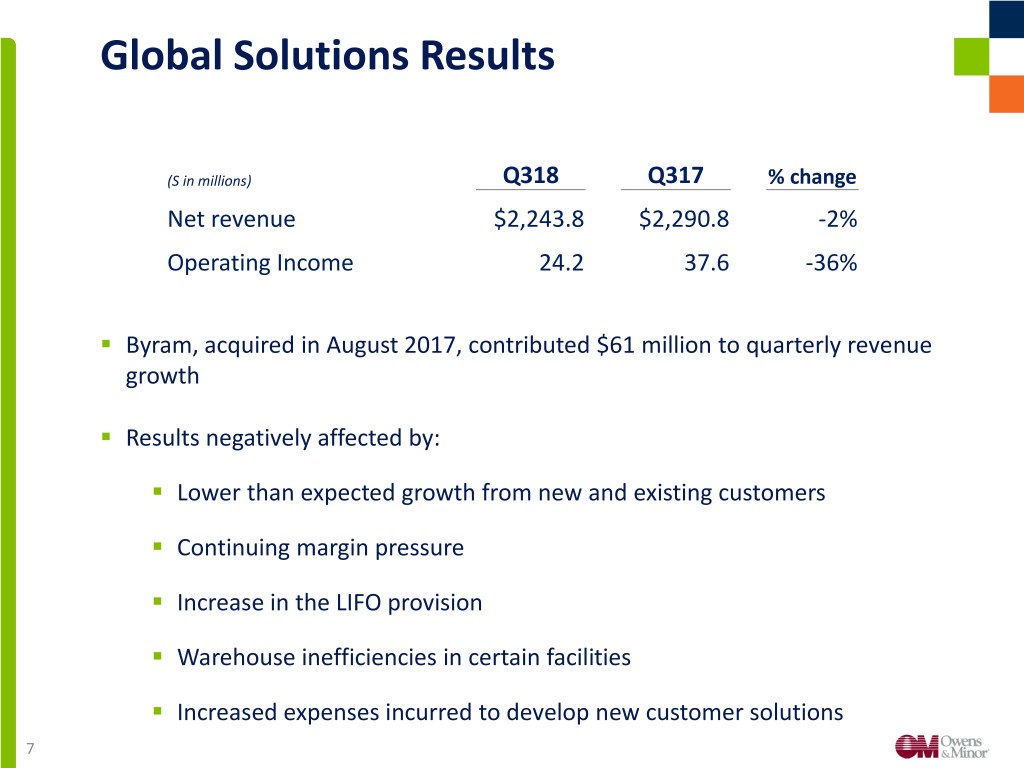
Global Solutions Results (S in millions) Q318 Q317 % change Net revenue $2,243.8 $2,290.8 -2% Operating Income 24.2 37.6 -36% . Byram, acquired in August 2017, contributed $61 million to quarterly revenue growth . Results negatively affected by: . Lower than expected growth from new and existing customers . Continuing margin pressure . Increase in the LIFO provision . Warehouse inefficiencies in certain facilities . Increased expenses incurred to develop new customer solutions 7
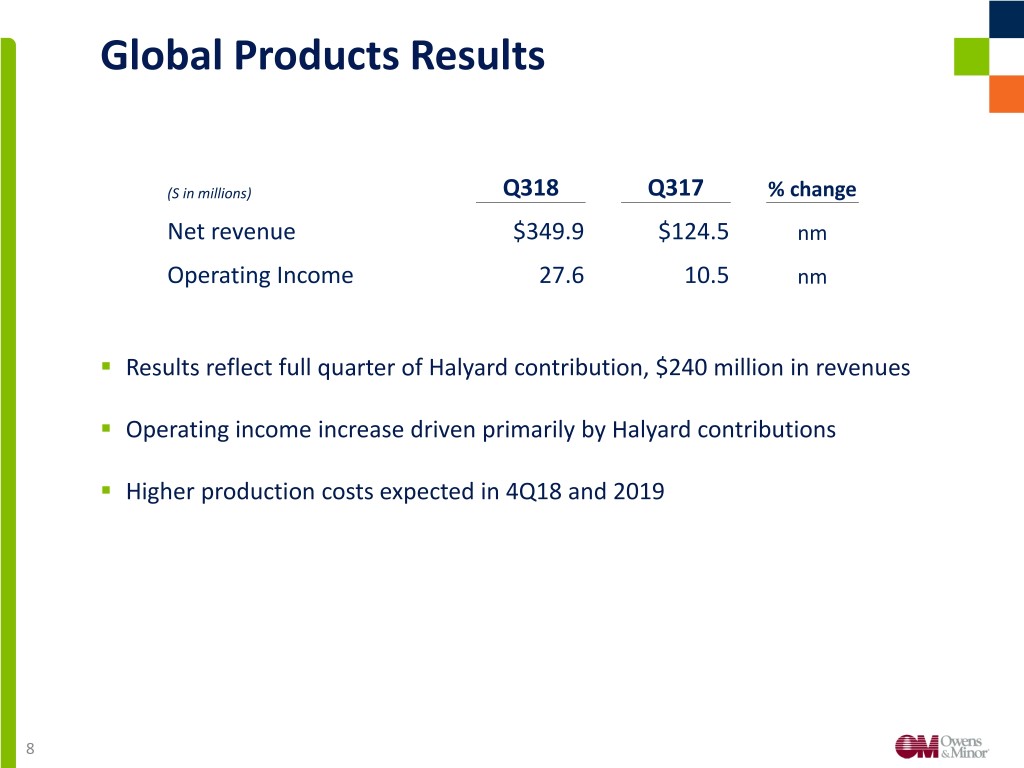
Global Products Results (S in millions) Q318 Q317 % change Net revenue $349.9 $124.5 nm Operating Income 27.6 10.5 nm . Results reflect full quarter of Halyard contribution, $240 million in revenues . Operating income increase driven primarily by Halyard contributions . Higher production costs expected in 4Q18 and 2019 8
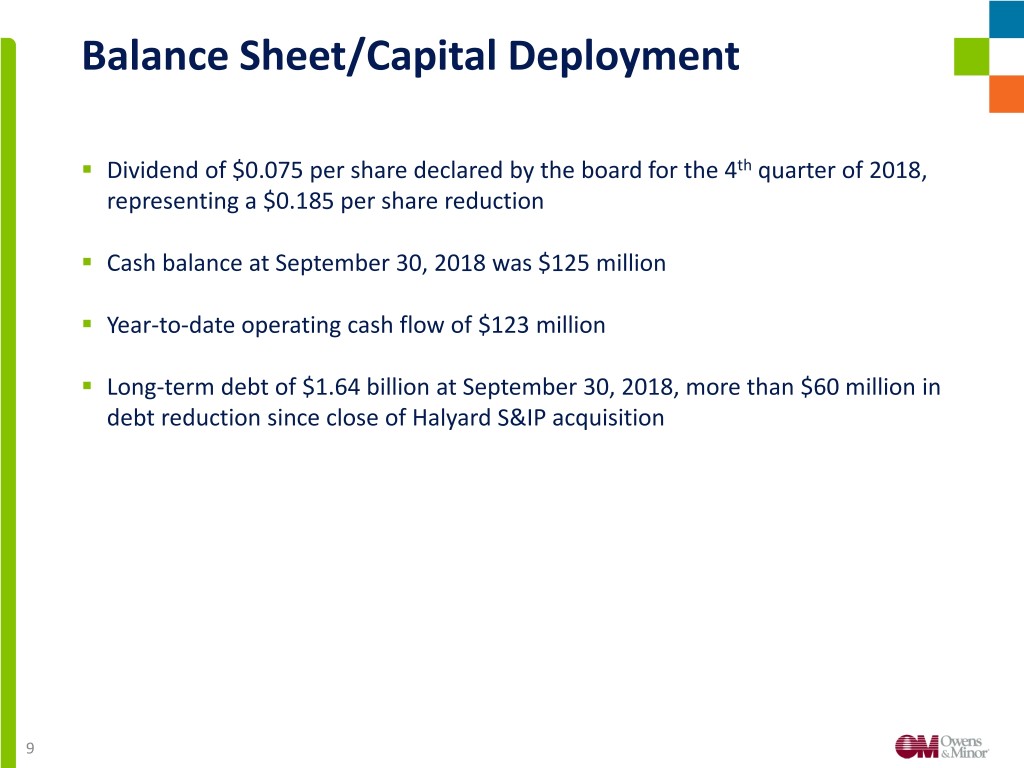
Balance Sheet/Capital Deployment . Dividend of $0.075 per share declared by the board for the 4th quarter of 2018, representing a $0.185 per share reduction . Cash balance at September 30, 2018 was $125 million . Year-to-date operating cash flow of $123 million . Long-term debt of $1.64 billion at September 30, 2018, more than $60 million in debt reduction since close of Halyard S&IP acquisition 9
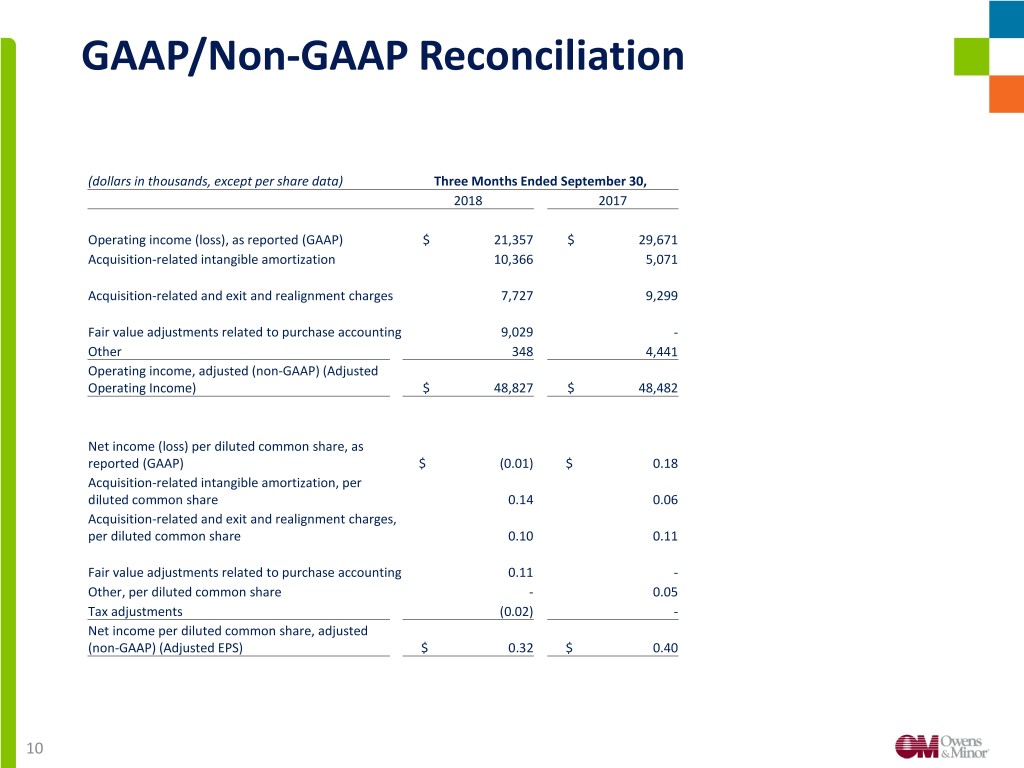
GAAP/Non-GAAP Reconciliation (dollars in thousands, except per share data) Three Months Ended September 30, 2018 2017 Operating income (loss), as reported (GAAP) $ 21,357 $ 29,671 Acquisition-related intangible amortization 10,366 5,071 Acquisition-related and exit and realignment charges 7,727 9,299 Fair value adjustments related to purchase accounting 9,029 - Other 348 4,441 Operating income, adjusted (non-GAAP) (Adjusted Operating Income) $ 48,827 $ 48,482 Net income (loss) per diluted common share, as reported (GAAP) $ (0.01) $ 0.18 Acquisition-related intangible amortization, per diluted common share 0.14 0.06 Acquisition-related and exit and realignment charges, per diluted common share 0.10 0.11 Fair value adjustments related to purchase accounting 0.11 - Other, per diluted common share - 0.05 Tax adjustments (0.02) - Net income per diluted common share, adjusted (non-GAAP) (Adjusted EPS) $ 0.32 $ 0.40 10
