Attached files
| file | filename |
|---|---|
| EX-32.1 - EXHIBIT 32.1 - OWENS & MINOR INC/VA/ | dex321.htm |
| EX-23.1 - EXHIBIT 23.1 - OWENS & MINOR INC/VA/ | dex231.htm |
| EX-31.1 - EXHIBIT 31.1 - OWENS & MINOR INC/VA/ | dex311.htm |
| EX-31.2 - EXHIBIT 31.2 - OWENS & MINOR INC/VA/ | dex312.htm |
| EX-21.1 - EXHIBIT 21.1 - OWENS & MINOR INC/VA/ | dex211.htm |
| EX-32.2 - EXHIBIT 32.2 - OWENS & MINOR INC/VA/ | dex322.htm |
| EX-10.24 - EXHIBIT 10.24 - OWENS & MINOR INC/VA/ | dex1024.htm |
| EX-10.33 - EXHIBIT 10.33 - OWENS & MINOR INC/VA/ | dex1033.htm |
| EX-10.15 - EXHIBIT 10.15 - OWENS & MINOR INC/VA/ | dex1015.htm |
| EX-10.36 - EXHIBIT 10.36 - OWENS & MINOR INC/VA/ | dex1036.htm |
| EX-10.13 - EXHIBIT 10.13 - OWENS & MINOR INC/VA/ | dex1013.htm |
Table of Contents
UNITED STATES
SECURITIES AND EXCHANGE COMMISSION
WASHINGTON, D.C. 20549
FORM 10-K
| x | Annual Report Pursuant to Section 13 or 15(d) of the Securities Exchange Act of 1934 |
For the year ended December 31, 2009
| ¨ | Transition Report Pursuant to Section 13 or 15(d) of the Securities Exchange Act of 1934 |
For the transition period from to
Commission File Number 1-9810
OWENS & MINOR, INC.
(Exact name of registrant as specified in its charter)
| Virginia | 54-1701843 | |
| (State or other jurisdiction of incorporation or organization) |
(I.R.S. Employer Identification No.) | |
| 9120 Lockwood Boulevard, Mechanicsville, Virginia | 23116 | |
| (Address of principal executive offices) | (Zip Code) | |
Registrant’s telephone number, including area code (804) 723-7000
Securities registered pursuant to Section 12(b) of the Act:
| Title of each class |
Name of each exchange on which registered | |
| Common Stock, $2 par value | New York Stock Exchange | |
| Preferred Stock Purchase Rights | New York Stock Exchange | |
| 6.35% Senior Notes due 2016 | Not Listed |
Securities registered pursuant to Section 12(g) of the Act: None
Indicate by check mark if the registrant is a well-known seasoned issuer (as defined in Rule 405 of the Securities Act). Yes x No ¨
Indicate by check mark if the registrant is not required to file reports pursuant to Section 13 or Section 15(d) of the Act. Yes ¨ No x
Indicate by check mark whether the registrant (1) has filed all reports required to be filed by Section 13 or 15(d) of the Securities Exchange Act of 1934 during the preceding 12 months (or for such shorter period that the registrant was required to file such reports), and (2) has been subject to such filing requirements for the past 90 days. Yes x No ¨
Indicate by check mark whether the registrant has submitted electronically and posted on its corporate Website, if any, every Interactive Data File required to be submitted and posted pursuant to Rule 405 of Regulation S-T (§232.405 of this chapter) during the preceding 12 months (or for such shorter period that the registrant was required to submit and post such files). Yes ¨ No ¨
Indicate by check mark if disclosure of delinquent filers pursuant to Item 405 of Regulation S-K (§229.405 of this chapter) is not contained herein, and will not be contained, to the best of registrant’s knowledge, in definitive proxy or information statements incorporated by reference in Part III of this Form 10-K or any amendment to this Form 10-K. ¨
Indicate by check mark whether the registrant is a large accelerated filer, an accelerated filer, or a non-accelerated filer or a smaller reporting company. See the definitions of “large accelerated filer,” “accelerated filer” and “smaller reporting company” in Rule 12b-2 of the Exchange Act.
| Large accelerated filer x | Accelerated filer ¨ | |
| Non-accelerated filer ¨ | Smaller reporting company ¨ |
Indicate by check mark whether the registrant is a shell company (as defined in Rule 12b-2 of the Exchange Act). Yes ¨ No x
The aggregate market value of Common Stock held by non-affiliates (based upon the closing sales price) was approximately $1,827,205,921 as of June 30, 2009.
The number of shares of the Company’s common stock outstanding as of February 19, 2010 was 41,959,865 shares.
Documents Incorporated by Reference
The proxy statement for the annual meeting of shareholders on April 30, 2010, is incorporated by reference for Item of Part II and Part III.
Table of Contents
| Item No. |
Page | |||
| Part I |
||||
| 1. |
3 | |||
| 1A. |
10 | |||
| 1B. |
12 | |||
| 2. |
12 | |||
| 3. |
13 | |||
| 4. |
13 | |||
| Part II |
||||
| 5. |
Market for Registrant’s Common Equity and Related Stockholder Matters |
14 | ||
| 6. |
16 | |||
| 7. |
Management’s Discussion and Analysis of Financial Condition and Results of Operations |
17 | ||
| 7A. |
24 | |||
| 8. |
24 | |||
| 9. |
Changes in and Disagreements with Accountants on Accounting and Financial Disclosure |
24 | ||
| 9A. |
24 | |||
| 9B. |
24 | |||
| Management’s Report on Internal Control over Financial Reporting |
25 | |||
| 26 | ||||
| Part III |
||||
| 10. |
27 | |||
| 11. |
27 | |||
| 12. |
Security Ownership of Certain Beneficial Owners and Management |
27 | ||
| 13. |
27 | |||
| 14. |
27 | |||
| Part IV |
||||
| 15. |
28 | |||
Corporate Officers, located on page 8 of the company’s printed Annual Report, can be found at the end of the electronic filing of this Form 10-K.
Table of Contents
Part I
The Company
Owens & Minor, Inc. and subsidiaries (Owens & Minor, O&M or the company) is a Fortune 500 company providing distribution and other supply chain management services to healthcare providers and suppliers of medical and surgical products, and is a leading national distributor of medical and surgical supplies to the acute-care market. The description of the company’s business should be read in conjunction with the consolidated financial statements and supplementary data included in this Form 10-K.
The company’s core service consists of the distribution of finished medical and surgical products procured from over 1,400 suppliers to approximately 4,600 healthcare provider customers from 51 distribution and service centers nationwide. In serving its healthcare customers, including acute-care and alternate site providers and healthcare products suppliers, O&M also provides a range of data analysis tools and outsourced resource management and consulting services, such as inventory, supply spending and contract management.
The company typically provides its supply chain management services, including distribution services, under contractual arrangements with healthcare providers such as hospitals, hospital-based systems, and alternate site providers. Most of O&M’s revenue is derived from the distribution to healthcare providers of consumable medical and surgical goods. In addition, in providing consulting and outsourcing services to the healthcare market, Owens & Minor enters into fee-based service contracts of varying lengths and terms with customers.
Owens & Minor was founded in 1882 and incorporated in 1926 in Richmond, Virginia, as a wholesale drug company. Since 1992, the company has been focused on medical and surgical supply distribution. O&M has significantly expanded and strengthened its national presence through internal growth and acquisitions. Additional information regarding the company’s recent acquisition activity is included in Note 3 of the Notes to Consolidated Financial Statements included in this Form 10-K.
The Healthcare Supply Distribution Industry
Distributors of medical and surgical supplies provide a wide variety of products and services to healthcare providers and suppliers. Healthcare providers include hospitals, hospital-based systems and alternate site providers. Distributors contract with healthcare providers, including integrated healthcare networks (IHNs), directly and with group purchasing organizations (GPOs) that negotiate distribution contracts on behalf of their members. Distributors also serve healthcare suppliers by selling and distributing suppliers’ healthcare products, including supplies used in medical treatment and surgical procedures.
The healthcare supply distribution industry continues to grow, as the aging population in the United States increases its use of healthcare services, and as emerging medical technology leads to the development of new products and procedures. The healthcare distribution industry is also growing as healthcare providers and suppliers focus on improving the management of their supply chain operations. Healthcare providers rely on strategic relationships with national medical and surgical supply distributors to perform traditional warehousing and delivery functions, as well as to efficiently manage their entire supply chain. Healthcare product suppliers also turn to distributors for supply chain management expertise and services.
Consolidation trends in the overall healthcare market have led to the creation of larger and more sophisticated healthcare providers, which increasingly seek methods to lower the total cost of delivering healthcare services. These healthcare providers face a variety of financial challenges, including the cost of purchasing, receiving, storing and tracking medical and surgical supplies. These trends have driven significant consolidation within the healthcare supply distribution industry due to the competitive advantages enjoyed by larger distributors, which include, among other things, the ability to serve customers with multiple locations, buy inventory in large volume, and develop technology platforms and decision support systems. Distributors have
3
Table of Contents
also developed services to help reduce supply chain costs for both healthcare providers and suppliers by streamlining the supply chain through more effective inventory, supply spending and contract management.
The Healthcare Supply Distribution Business Model
Through its healthcare provider distribution business, the company purchases a large volume of medical and surgical products from suppliers, stores these items at its distribution centers, and provides delivery of these products and related services to its customers.
In serving the healthcare industry, O&M also provides outsourced resource management and consulting services, which make use of the company’s proprietary supply chain management programs and technology. The company’s OMSolutionsSM team provides to acute-care providers fee-based consulting and outsourcing services designed to improve the provider supply chain through better management of inventory, supply spending and related data.
In addition, O&M works closely with healthcare suppliers to furnish mutual healthcare provider customers with vital medical and surgical supplies. In 2009, the company expanded its supplier-oriented supply chain management services to include a third-party logistics offering branded as OM Healthcare LogisticsSM (OM HCL). OM HCL offers flexible warehousing and distribution services and business process outsourcing services to healthcare suppliers, enabling them to take advantage of O&M’s advanced supply chain management expertise and significant presence in the healthcare industry.
The company has 51 distribution centers located throughout the continental United States; three of these are integrated service centers serving the needs of specific healthcare systems and one is dedicated to OM HCL’s third-party logistics services. The company’s distribution centers generally serve hospitals and other customers within a 200-mile radius, delivering most customer orders with a fleet of leased trucks. Almost all of O&M’s delivery personnel are employees of the company, thereby increasing the consistency of customer service. Contract carriers and parcel services are used in situations where they are more cost-effective, including for OM HCL. The company customizes its product pallets, truckloads and delivery schedules according to customers’ needs, to increase their efficiency in receiving and storing the product. Sales, logistics, credit management and operations teammates are located at or near distribution centers to manage service to customers. In certain of its distribution centers, Owens & Minor uses automation equipment in its low-unit-of-measure picking modules, and has deployed voice-pick technology to improve speed and accuracy in certain warehousing processes.
O&M’s supply chain management offering is supported by a significant investment in information technology infrastructure and services. O&M uses a variety of software and information technology systems to support its business needs and efficiently manage its business growth, including warehouse management systems, customer service functions, and demand forecasting programs. The company employs a number of customer-facing technology solutions, including OMDirectSM, an Internet-based product catalog and direct ordering system that facilitates commerce with customers and suppliers.
Products & Services
The company offers customers a portfolio of products and services. Distribution of medical and surgical supplies to healthcare providers, including O&M’s MediChoice® private label product line, accounts for over 95% of the company’s revenues. Additional services include logistics, supplier management, analytics, inventory and outsourced resource management and consulting and clinical supply management. Examples of the company’s service offerings include the following:
| • | PANDAC® is O&M’s operating room-focused inventory management program that helps healthcare providers reduce and control suture and endo-mechanical inventory. Detailed analysis and ongoing reporting decreases redundancy and obsolescence, and increases inventory turns, which in turn reduces investment in these high-cost products. |
4
Table of Contents
| • | SurgiTrack® is O&M’s customizable surgical supply service that includes the assembly and delivery of surgical supplies in procedure-based totes, based on a healthcare provider’s surgical schedule. The SurgiTrack® program also provides in-depth assessment and information to enable healthcare providers to standardize their procedure-based totes, reduce inventory and streamline workflow. |
| • | OMSolutionsSM is O&M’s supply chain consulting, customer technology and resource management service offering. OMSolutions SM implements customized healthcare supply chain solutions through the integration of people, processes and technologies. Services offered by OMSolutionsSM decrease supply chain costs while increasing operating efficiency. For example, OMSolutionsSM provides clinician consultants who work one-on-one with hospital staff to standardize and efficiently utilize products, processes and technologies. Other examples of OMSolutionsSM services are in-depth value analysis and cost management, receiving and storeroom redesign, conducting physical inventories, and configuration of automatic inventory replenishment systems. Additional service offerings provided by OMSolutionsSM are WISDOM GoldSM and Clinical Supply SolutionsSM (CSS). |
WISDOM GoldSM is an Internet-based supply spend management, data normalization and contract management solution which is supported by OMSolutionsSM analysts, either on-site or remote, who identify cost saving opportunities for customers. WISDOM GoldSM enables customers to gain deeper understanding and control over their supply procurement and contracting efforts.
CSS is an inventory and contract management service that enables healthcare providers to reduce expenses by accurately tracking and managing physician-preference products and medical/surgical inventories in high-cost clinical specialty departments, such as cardiac catheterization labs, radiology and operating rooms. CSS is enabled by O&M’s proprietary web-based technology, including a complete database of products, and the expertise of the company’s inventory specialists and professional analysts.
| • | OM Healthcare LogisticsSM is O&M’s offering of customized third-party logistics and business process outsourcing services, primarily provided to medical device and life science companies. This business provides flexible warehousing and distribution services to meet unique product requirements. OM HCL also includes full order-to-cash services, including reverse logistics and chargeback management. The distribution center dedicated to OM HCL has earned ISO 9001 quality management certification. OM HCL’s services are enabled by sophisticated supply chain management software and technology. |
Customers
The company currently provides distribution, outsourced resource management and consulting services to approximately 4,600 healthcare providers, including acute-care hospitals, which are the company’s primary customers. Many of the hospital customers are represented by IHNs or GPOs that negotiate pricing with suppliers and also contract for distribution services with the company. Other customers include the federal government, for which Owens & Minor serves as a prime vendor for medical and surgical supply distribution services for the U.S. Department of Defense. On a more limited basis, the company serves alternate site providers including ambulatory surgery centers, physicians’ practices, clinics, home healthcare organizations, nursing homes and rehabilitation facilities. The company also provides supply chain management services including third-party logistics and business process outsourcing services to manufacturers of medical and surgical products.
GPOs and IHNs
GPOs are entities that act on behalf of a group of healthcare providers to obtain better pricing and other benefits than may be available to individual providers. Hospitals, physicians and other types of healthcare providers have joined GPOs to take advantage of improved economies of scale and to obtain services from medical and surgical supply distributors ranging from discounted product pricing to logistical and clinical support. GPOs negotiate directly with medical and surgical product suppliers and distributors on behalf of their members, establishing exclusive or multi-supplier relationships; however, GPOs cannot ensure that members will purchase their supplies from a particular distributor.
5
Table of Contents
O&M has contracts to provide distribution services to the members of a number of national GPOs, including Novation, LLC (Novation), Premier Purchasing Partners, L.P. (Premier) and Broadlane, Inc. (Broadlane). O&M’s agreement with Novation expires in August 2011 and is renewable for two additional years. Sales to Novation members represented approximately 37% and 38% of the company’s revenue in 2009 and 2008. The company’s agreement with Premier expires December 2011. Sales to Premier members represented approximately 20% of O&M’s revenue in both 2009 and 2008. The company has a five-year agreement with Broadlane expiring in January 2012. Sales to Broadlane members represented approximately 12% of O&M’s revenue in both 2009 and 2008.
IHNs are typically networks of commonly owned or managed healthcare providers that seek to offer a broad spectrum of healthcare services and geographic coverage to a particular market. IHNs are significant in the acute-care market because of their expanding role in healthcare delivery and cost containment and their reliance upon the hospital as a key component of their organizations. Because IHNs frequently rely on cost containment as a competitive advantage, IHNs have become an important source of demand for O&M’s enhanced inventory management and other value-added services.
Individual Providers
In addition to contracting with healthcare providers at the IHN level and through GPOs, O&M contracts directly with individual healthcare providers and smaller networks of healthcare providers that have joined together to negotiate terms.
Sales and Marketing
O&M’s healthcare provider sales and marketing function is organized to support field sales teams throughout the United States. Local sales teams are positioned to respond to customer needs quickly and efficiently. National account directors work closely with IHNs and GPOs to meet their needs and coordinate activities with individual members. The company also has an enterprise sales team that coordinates the company’s service offerings for large customers. The company’s integrated sales and marketing strategy offers customers value-added services in supplier management, distribution and logistics, analytics, outsourced resource management and consulting, and clinical supply management. The company provides training and sales tools to help its sales teammates demonstrate the value of its portfolio of programs and services.
Pricing
Industry practice is for healthcare providers, or their IHNs or GPOs, to negotiate product pricing directly with suppliers and then negotiate distribution pricing terms with distributors. The medical/surgical supply distribution industry is characterized by intense pricing pressure.
The majority of O&M’s distribution arrangements compensate the company on a cost-plus percentage basis, under which a negotiated fixed-percentage distribution fee is added to the product cost agreed to by the customer and the supplier or the cost to O&M of procuring the product. The determination of this percentage distribution fee is typically based on purchase volume, as well as other factors, and usually remains constant for the life of the contract. In many cases, distribution contracts in the medical/surgical supply industry specify a minimum volume of product to be purchased and are terminable by either party upon relatively short notice.
In some cases, the company may offer pricing that varies during the life of the contract depending upon purchase volume, and, as a result, the negotiated fixed-percentage distribution fee may increase or decrease over time as purchase volumes change. Under these contracts, customers’ distribution fees may be reset after a measurement period to either more or less favorable pricing based on significant changes in purchase volume. If a customer’s distribution fee percentage is adjusted, the modified percentage distribution fee applies only to
6
Table of Contents
purchases made following the change. Because customer sales volumes typically change gradually, changes in distribution fee percentages for individual customers under this type of arrangement have an insignificant effect on total company results.
Pricing under O&M’s CostTrackSM activity-based pricing model differs from pricing under a traditional cost-plus model. With CostTrackSM, the pricing of services is based on the costs to O&M of providing the services required by the customer. As a result, this pricing model aligns distribution fees charged with the costs of the individual services provided.
OMSolutionsSM pricing is based on professional rates and costs of managing and providing a team or individual to provide specific services. Additionally, pricing for technology services is based on the structure and complexity of the customer engagement, including spending level and number of contracts, system interfaces and facilities. The company has contracts for its OMSolutionsSM and other supply chain management services which include performance targets related to cost-saving initiatives for customers that result from the company’s services. Achievement against these performance targets is measured as determined by contractual terms. In the event the performance targets are not achieved, the company may be obligated to refund or reduce a portion of its fees or to provide a credit toward future purchases by the customer.
OM Healthcare LogisticsSM pricing is activity-based, with service-based fees determined by customers’ particular requirements.
Suppliers
O&M believes that its size, strength and long-standing relationships enable it to obtain attractive terms from suppliers, and the company has well-established relationships with virtually all major suppliers of medical and surgical supplies. The company works with its largest suppliers to create operating efficiencies in the supply chain through a number of programs which drive product standardization and consolidation for the company and its healthcare provider customers. By increasing the volume of purchases from the company’s most efficient suppliers, the company provides operational benefits and cost savings throughout the supply chain.
The company works very closely with its supplier base to enlist participation in a variety of O&M supplier program offerings. O&M supplier programs provide for enhanced levels of support that are closely aligned with annual supplier objectives in the areas of product market share and sales growth attainment. O&M receives incentives from these suppliers, including cash discounts for prompt payment and operational efficiency and performance-based programs. Operational efficiency programs are negotiated annually. Sales of products from suppliers participating in these supply chain efficiency programs represented approximately 45% of O&M’s 2009 revenue.
O&M offers a private label brand of medical and surgical products and equipment, known as MediChoice®, which provides cost-saving alternatives on over 2,400 commodity products. O&M sources its MediChoice® products from a select group of manufacturers known for their quality and high service levels. Through its offering of both MediChoice® products and branded supplier products, the company offers a comprehensive product portfolio to its customers.
Sales of products supplied by Covidien accounted for approximately 14% of the company’s revenue for both 2009 and 2008. Sales of products supplied by Johnson & Johnson Health Care Systems, Inc. were approximately 10% and 11% of the company’s revenue for 2009 and 2008.
Information Technology
To support its strategic efforts, the company has implemented information systems to manage all aspects of operations, including order fulfillment, customer service, warehouse and inventory management, asset
7
Table of Contents
management, electronic commerce, and financial management. O&M believes its investment in and use of technology in the management of operations provides the company with a significant competitive advantage.
O&M has an agreement with Dell Perot Systems through July 2014 to outsource its information technology operations. This agreement includes the management and operation of information technology and infrastructure, as well as support, development and enhancement of all key business systems.
The company’s technology strategy and expenditures focus on customer service, electronic commerce, data warehousing, decision support, supply-chain management, warehousing management, and sales and marketing programs, as well as significant enhancements to back office systems and overall technology infrastructure. O&M uses electronic commerce technology to conduct business transactions with customers, suppliers and other trading partners. The company’s proprietary technology includes the OMDirectSM internet order fulfillment system and the WISDOM GoldSM knowledge management and decision support system.
Asset Management
In the healthcare supply distribution industry, a significant investment in inventory and accounts receivable is required to meet the rapid delivery requirements of customers and provide high-quality service. As a result, efficient asset management is essential to the company’s profitability. O&M is focused on effective processes to optimize inventory and collect accounts receivable.
Inventory
The significant and ongoing emphasis on cost control in the healthcare industry increases the pressure on suppliers, distributors and healthcare providers to manage their inventory more efficiently. O&M’s response to these ongoing challenges has been to develop inventory management capabilities based upon proven planning techniques; to utilize a highly flexible client/server warehouse management system; to standardize product whenever possible; and to collaborate with supply chain partners on inventory productivity initiatives, including vendor-managed inventory, freight optimization and lead-time reductions.
Accounts Receivable
O&M provides credit in the normal course of business to its customers and utilizes credit management techniques to evaluate customers’ creditworthiness and to facilitate collection. These techniques include performing initial and ongoing credit evaluations of customers based primarily on financial information provided by them and from sources available to the general public. As part of credit evaluations, the company also uses third-party information from sources such as credit reporting agencies, as well as bank and credit references. O&M actively manages its accounts receivable to minimize credit risk, days sales outstanding (DSO) and accounts receivable carrying costs. Field and home office specialists work together in collecting accounts receivable and resolving disputed balances. The company’s ability to properly invoice and ship product to its customers enhances its collection results and, accordingly, its DSO performance. Also, O&M has arrangements with certain customers under which they make deposits on account. These deposits are received from customers, either because they do not meet the company’s standards for creditworthiness or in order to obtain more favorable pricing.
Competition
The acute-care medical/surgical supply distribution industry in the United States is highly competitive. The sector includes two major nationwide distributors: O&M and Cardinal Health, Inc., a smaller national distributor of medical and surgical supplies, Medline, Inc., and a number of regional and local distributors, as well as customer self-distribution models.
Competitive factors within the medical/surgical supply distribution industry include market pricing, total delivered product cost, product availability, the ability to fill and invoice orders accurately, delivery time, range of services provided, efficient product sourcing, inventory management, information technology, electronic
8
Table of Contents
commerce capabilities, and the ability to meet customer-specific requirements. O&M believes its emphasis on technology, combined with a customer-focused approach to distribution and value-added services, enables it to compete effectively with both larger and smaller distributors.
Direct-to-Consumer Supply Distribution Business
The company exited its direct-to-consumer supply distribution business (DTC business) to focus on its distribution business for healthcare providers and suppliers. In January 2009, the company sold certain assets of this business, including customer data and intellectual property, to Liberty Healthcare Group, Inc., a subsidiary of Medco Health Solutions, Inc. for $63.0 million. O&M retained the remaining assets and liabilities of the business, including accounts receivable. The company operated the DTC business under the trade name AOM Healthcare Solutions (AOM) beginning with its acquisition of Access Diabetic Supply, LLC in 2005. AOM primarily marketed blood glucose monitoring devices, test strips and other ancillary products used by diabetic consumers for self-testing, mainly through direct-response advertising using a variety of media. The company substantially completed its exit from this business by the end of the second quarter of 2009, by liquidating its remaining assets and vacating its leased premises. Additional information regarding this discontinued operation is included in Note 4 of the Notes to Consolidated Financial Statements included in this Form 10-K.
Other Matters
Regulation
The medical/surgical supply distribution industry is subject to regulation by federal, state and local government agencies. Each of O&M’s distribution centers is licensed to distribute medical and surgical supplies, as well as certain pharmaceutical and related products. The company must comply with laws and regulations, including those governing operating, storage, transportation, safety and security standards for each of its distribution centers, of the Food and Drug Administration, the Department of Transportation, the Department of Homeland Security, the Occupational Safety and Health Administration, state boards of pharmacy, or similar state licensing boards and regulatory agencies. The company also is subject to various federal and state laws intended to protect the privacy of health or other personal information and prevent healthcare fraud and abuse. In addition, the DTC business was required to comply with Medicare regulations regarding billing practices. O&M believes it is in material compliance with all statutes and regulations applicable to distributors of medical and surgical supply products and pharmaceutical and related products, including the Healthcare Insurance Portability and Accountability Act of 1996 (HIPAA), Medicare, Medicaid, as well as applicable general employment and employee health and safety laws and regulations.
Employees
At the end of 2009, the company employed approximately 4,800 full- and part-time teammates. O&M believes that ongoing teammate training is critical to performance, using Owens & Minor University, an in-house training facility, to offer classes in leadership, management development, finance, operations, safety and sales. Management believes that relations with teammates are good.
Available Information
The company makes its Forms 10-K, Forms 10-Q and Forms 8-K (and all amendments to these reports) available free of charge through the SEC Filings link in the Investor Relations content section on the company’s website located at www.owens-minor.com as soon as reasonably practicable after they are filed with or furnished to the SEC. Information included on the company’s website is not incorporated by reference into this Annual Report on Form 10-K.
You may read and copy any materials the company files with the SEC at the SEC’s Public Reference Room at 100 F Street, NE, Washington, DC 20549. You may obtain information on the operation of the Public Reference Room by calling the SEC at 1-800-SEC-0330. The SEC also maintains an Internet site that contains reports, proxy and information statements, and other information regarding the company (http://www.sec.gov).
9
Table of Contents
Additionally, the company has adopted a written Code of Honor that applies to all of the company’s directors, officers and teammates, including its principal executive officer and senior financial officers. This Code of Honor (including any amendments to or waivers of a provision thereof) and the company’s Corporate Governance Guidelines are available on the company’s website at www.owens-minor.com.
Set forth below are certain risk factors that the company believes could materially affect its business, financial condition and prospects. These risk factors are in addition to those mentioned in other parts of this report and are not the only risks the company faces.
Competition
The medical/surgical supply distribution industry in the United States is highly competitive and characterized by intense pricing pressure. The company competes with other national distributors and a number of regional and local distributors as well as customer self-distribution models. Competitive factors within the medical/surgical supply distribution industry include market pricing, total delivered product cost, product availability, the ability to fill and invoice orders accurately, delivery time, range of services provided, efficient product sourcing, inventory management, information technology, electronic commerce capabilities, and the ability to meet special requirements of customers. The company’s success is dependent on its ability to compete on the above factors, while managing internal costs and expenses. These competitive pressures could have a material adverse effect on the company’s results of operations.
Dependence on Significant Customers
In 2009, the company’s top ten customers represented approximately 20% of its revenue. In addition, in 2009, approximately 70% of the company’s revenue was from sales to member hospitals under contract with its three largest GPOs: Novation, Premier and Broadlane. The company could lose a significant customer or GPO relationship if an existing contract expires without being replaced or is terminated by the customer or GPO prior to its expiration (if permitted by the applicable contract). Although the termination of the company’s relationship with a given GPO would not necessarily result in the loss of all of the member hospitals as customers, any such termination of a GPO relationship or a significant individual customer relationship could have a material adverse effect on the company’s results of operations.
The company has a contract with Defense Supply Center, Philadelphia (DSCP) under which the U.S. Department of Defense, the company’s largest customer, and other federal agencies purchase supplies and services. The DSCP contract expires in October 2010. A significant decline in volume of sales under this contract, less favorable terms or a failure to renew the contract upon expiration could have a material adverse effect on the company’s results of operations.
Dependence on Significant Suppliers
The company distributes products from over 1,400 suppliers and is dependent on these suppliers for the continuing supply of products. In 2009, sales of products of the company’s ten largest suppliers accounted for approximately 54% of revenue. The company relies on suppliers to provide agreeable purchasing and delivery terms and performance incentives. The company’s ability to sustain adequate operating earnings has been, and will continue to be, partially dependent upon its ability to obtain favorable terms and incentives from suppliers, as well as suppliers’ continuing use of third-party distributors to sell and deliver their products. A change in terms by a significant supplier, or the decision of such a supplier to distribute its products directly to healthcare providers rather than through third-party distributors, could have a material adverse effect on the company’s results of operations.
Bankruptcy, Insolvency or other Credit Failure of Customers
The company provides credit in the normal course of business to its customers. The company performs initial and ongoing credit evaluations of its customers and maintains reserves for credit losses. The bankruptcy,
10
Table of Contents
insolvency or other credit failure of one or more customers with substantial balances due to the company could have a material adverse effect on the company’s results of operations.
Changes in the Healthcare Environment
O&M, its customers and its suppliers are subject to extensive federal and state regulations relating to healthcare as well as the policies and practices of the private healthcare insurance industry. In recent years, there have been a number of government and private initiatives to reduce healthcare costs and government spending. These changes have included an increased reliance on managed care; consolidation of competitors, suppliers and customers; and the development of larger, more sophisticated purchasing groups. All of these changes place additional financial pressure on healthcare providers, who in turn seek to reduce the costs and pricing of products and services provided by the company. The company expects the healthcare industry to continue to change significantly and these potential changes, which may include a reduction in government support of healthcare services, adverse changes in legislation or regulations, and reductions in healthcare reimbursement practices, could have a material adverse effect on the company’s results of operations.
In addition, several healthcare reform initiatives are currently pending in Congress that, if passed, could fundamentally change current healthcare delivery and payment systems while expanding access to healthcare. The uncertainties surrounding the components of reform legislation and the effects any adopted legislation would ultimately have on the healthcare industry may have an adverse effect on both customer purchasing and payment behavior and supplier product prices and terms of sale, which would adversely affect the company’s results of operations.
Operating Margin Initiatives
Competitive pricing pressure has been a significant factor in recent years and management expects this trend to continue. In addition, suppliers continue to seek more restrictive agreements with distributors. The company is working to counteract the effects of these trends through several profitability improvement initiatives, including resource management outsourcing and consulting services offered through OMSolutionsSM, its MediChoice® private label brand of select medical and surgical products, the company’s provision of third-party logistics services through OM Healthcare LogisticsSM and investments in technology enhancements to increase operational efficiency in its distribution centers and to improve customer service support. In addition, the company offers customers a wide range of value-added services, including PANDAC®, Wisdom GoldSM, Clinical Supply SolutionsSM and others, all of which enhance profitability. If these initiatives fail to produce anticipated results, the company’s results of operations could be materially adversely affected.
Reliance on Information Systems and Technological Advancement
The company relies on information systems to receive, process, analyze and manage data in distributing thousands of inventory items to customers from numerous distribution centers across the country. These systems are also relied upon for billings to and collections from customers, as well as the purchase of and payment for inventory and related transactions from its suppliers. In addition, the success of the company’s long-term growth strategy is dependent upon its ability to continually monitor and upgrade its information systems to provide better service to customers. A third-party service provider, Dell Perot Systems, is responsible for managing a significant portion of the company’s information systems, including key operational and financial systems. The company’s business and results of operations may be materially adversely affected if its systems are interrupted or damaged by unforeseen events or fail to operate for an extended period of time, if it fails to appropriately enhance its systems to support growth and strategic initiatives or if its third-party service provider does not perform satisfactorily.
Regulatory Requirements
The company must comply with numerous laws and regulations, including those of the Food and Drug Administration, the Department of Transportation, the Department of Homeland Security, the Occupational
11
Table of Contents
Safety and Health Administration, state boards of pharmacy, or similar state licensing boards, and other regulatory agencies. Also, the company is subject to various federal and state laws intended to protect the privacy of health or other personal information and prevent healthcare fraud and abuse. Although the company believes it is in material compliance with all applicable laws and regulations, any failure to comply with existing laws and regulations or the imposition of any additional laws and regulations could have a material adverse effect on the company’s business.
Strategic Initiatives
The company has made and is continuing to make substantial investments in the development and implementation of certain strategic initiatives designed to produce long-term growth in profitability and shareholder value. There can be no assurance that the company will be able to successfully implement its strategic initiatives or that they will produce the desired results. If the company is unsuccessful it could have an adverse effect on the company’s future performance.
General Economic Climate
Deterioration in the financial and economic climate in recent years is continuing to have a negative impact on most sectors of the U.S. economy. This deterioration in the financial and economic climate could reduce patient demand for healthcare services, intensify pressures on healthcare providers to reduce both costs and purchases of products and services of the company and compromise customers’ ability to timely pay for their purchases. Poor economic conditions could lead the company’s suppliers to offer less favorable terms of purchase to distributors, which would negatively affect the company’s profitability. These and other possible consequences of financial and economic changes including, but not limited to, the ability of banks to honor commitments under the company’s credit facility, as well as the company’s ability to renew or replace its credit facility under favorable terms, could materially and adversely affect the company’s business and results of operations.
Item 1B. Unresolved Staff Comments
None.
The company has 51 distribution centers, including office and warehouse space, operating across the United States as of December 31, 2009. The company leases 50 of these distribution centers from unaffiliated third parties and owns one. Three of the distribution centers are operating as integrated service centers and one is dedicated to OM Healthcare LogisticsSM. The company also leases additional warehouse space in seven locations near the company’s distribution centers, as well as small offices for sales and consulting personnel across the United States. In addition, the company has a warehousing arrangement in Honolulu, Hawaii, with an unaffiliated third party, and leases space on a temporary basis from time to time to meet its inventory storage needs. The company owns its corporate headquarters building, and adjacent acreage, in Mechanicsville, Virginia, a suburb of Richmond, Virginia.
The company also owns six warehouses, which were acquired from The Burrows Company in 2008 and are closed as of December 31, 2009. These warehouses are being offered for sale. The company also has six leases with remaining terms of one to two years for offices and warehouse facilities that the company has vacated.
The company regularly assesses its business needs and makes changes to the capacity and location of distribution centers. The company believes that its facilities are adequate to carry on its business as currently conducted. A number of leases are scheduled to terminate within the next several years. The company believes that, if necessary, it could find facilities to replace these leased premises without suffering a material adverse effect on its business.
12
Table of Contents
The company is subject to various legal actions that are ordinary and incidental to its business, including contract disputes, employment, workers’ compensation, product liability, regulatory and other matters. The company establishes reserves from time to time based upon periodic assessment of the potential outcomes of pending matters. In addition, the company believes that any potential liability arising from employment, product liability, workers’ compensation and other personal injury litigation matters would be adequately covered by the company’s insurance coverage, subject to policy limits, applicable deductibles and insurer solvency. While the outcome of legal actions cannot be predicted with certainty, the company believes, based on current knowledge and the advice of counsel, that the outcome of these currently pending matters, individually or in the aggregate, will not have a material adverse effect on the company’s financial condition or results of operations.
Item 4. Submission of Matters to a Vote of Security Holders
During the fourth quarter of 2009, no matters were submitted to a vote of security holders.
13
Table of Contents
Part II
Item 5. Market for Registrant’s Common Equity and Related Stockholder Matters
Owens & Minor, Inc.’s common stock trades on the New York Stock Exchange under the symbol OMI. As of February 19, 2010, there were approximately 4,010 common shareholders of record. The company believes there are an estimated additional 37,200 beneficial holders of its common stock. See Selected Quarterly Financial Information in Item 15 of this report for high and low closing sales prices of the company’s common stock and quarterly cash dividends per common share and Item 7, Management’s Discussion and Analysis of Financial Condition and Results of Operations, for a discussion of the company’s dividend payments.
On February 8, 2010, the board of directors of Owens & Minor, Inc. announced a three-for-two stock split of the company’s common stock to be effected in the form of a stock dividend of one share of company common stock for every two shares outstanding. The record date for the stock split is March 15, 2010, and the stock dividend will be payable on March 31, 2010. The common stock will trade on a post-split basis beginning on April 1, 2010. Refer to Note 20 of Notes to Consolidated Financial Statements for pro forma information regarding this stock split.
The following performance graph compares the performance of the company’s common stock to the S&P 500 Index and an Industry Peer Group (which includes the companies listed below) for the last five years.
5-Year Total Shareholder Return
This graph assumes that the value of the investment in the common stock and each index was $100 on December 31, 2004, and that all dividends were reinvested.
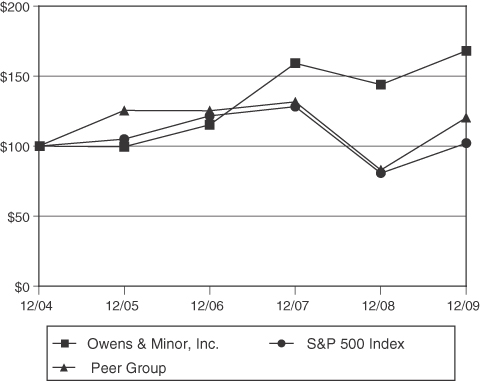
(Data provided by Standard & Poor’s)
14
Table of Contents
| Base Period 12/2004 |
12/2005 | 12/2006 | 12/2007 | 12/2008 | 12/2009 | |||||||||||||
| Owens & Minor, Inc. |
$ | 100 | $ | 99.49 | $ | 115.19 | $ | 159.13 | $ | 143.89 | $ | 167.82 | ||||||
| S&P 500 Index |
100 | 104.91 | 121.48 | 128.16 | 80.74 | 102.11 | ||||||||||||
| Peer Group |
100 | 125.38 | 125.23 | 131.62 | 82.89 | 120.24 | ||||||||||||
The Industry Peer Group, weighted by market capitalization, consists of companies engaged in the business of healthcare product distribution. The Peer Group includes pharmaceutical distribution companies: AmerisourceBergen Corporation, Cardinal Health, Inc., and McKesson Corporation; and medical product distribution companies: Henry Schein, Inc., Patterson Companies, Inc., and PSS World Medical, Inc.
15
Table of Contents
Item 6. Selected Consolidated Financial Data
(in thousands, except ratios and per share data)
| At or for the Year Ended December 31,(1) | ||||||||||||||||||||
| 2009 | 2008 | 2007 | 2006 | 2005 | ||||||||||||||||
| Summary of Operations: |
||||||||||||||||||||
| Revenue |
$ | 8,037,624 | $ | 7,243,237 | $ | 6,694,596 | $ | 5,441,266 | $ | 4,763,183 | ||||||||||
| Income from continuing operations |
$ | 116,859 | $ | 101,257 | $ | 71,411 | $ | 53,953 | $ | 60,343 | ||||||||||
| Income (loss) from discontinued operations, net of tax |
(12,201 | ) | (7,930 | ) | 1,299 | (5,201 | ) | 4,077 | ||||||||||||
| Net income |
$ | 104,658 | $ | 93,327 | $ | 72,710 | $ | 48,752 | $ | 64,420 | ||||||||||
| Per Common Share: |
||||||||||||||||||||
| Income (loss) per common share—basic(2): |
||||||||||||||||||||
| Continuing operations |
$ | 2.81 | $ | 2.46 | $ | 1.76 | $ | 1.35 | $ | 1.52 | ||||||||||
| Discontinued operations |
(0.29 | ) | (0.19 | ) | 0.04 | (0.13 | ) | 0.10 | ||||||||||||
| Net income per share—basic |
$ | 2.52 | $ | 2.27 | $ | 1.80 | $ | 1.22 | $ | 1.62 | ||||||||||
| Income (loss) per common share—diluted(2): |
||||||||||||||||||||
| Continuing operations |
$ | 2.79 | $ | 2.44 | $ | 1.76 | $ | 1.33 | $ | 1.51 | ||||||||||
| Discontinued operations |
(0.29 | ) | (0.19 | ) | 0.03 | (0.13 | ) | 0.10 | ||||||||||||
| Net income per share—diluted |
$ | 2.50 | $ | 2.25 | $ | 1.79 | $ | 1.20 | $ | 1.61 | ||||||||||
| Cash dividends |
$ | 0.92 | $ | 0.80 | $ | 0.68 | $ | 0.60 | $ | 0.52 | ||||||||||
| Stock price at year end |
$ | 42.93 | $ | 37.65 | $ | 42.43 | $ | 31.27 | $ | 27.53 | ||||||||||
| Book value at year end(3) |
$ | 18.35 | $ | 16.63 | $ | 15.03 | $ | 13.60 | $ | 12.84 | ||||||||||
| Summary of Financial Position: |
||||||||||||||||||||
| Total assets |
$ | 1,747,088 | $ | 1,776,190 | $ | 1,528,003 | $ | 1,697,044 | $ | 1,245,522 | ||||||||||
| Long-term debt, excluding current portion |
$ | 208,418 | $ | 359,237 | $ | 283,845 | $ | 433,133 | $ | 204,418 | ||||||||||
| Shareholders’ equity(4)(5) |
$ | 769,179 | $ | 689,051 | $ | 614,359 | $ | 547,454 | $ | 511,998 | ||||||||||
| Selected Ratios: |
||||||||||||||||||||
| Gross margin as a percent of revenue |
9.79 | % | 9.90 | % | 9.71 | % | 9.90 | % | 10.02 | % | ||||||||||
| Selling, general and administrative expenses as a percent of revenue |
7.04 | % | 7.20 | % | 7.39 | % | 7.64 | % | 7.43 | % | ||||||||||
| Operating earnings as a percent of revenue |
2.50 | % | 2.50 | % | 2.10 | % | 2.05 | % | 2.33 | % | ||||||||||
| Days sales outstanding(6) |
21.4 | 24.5 | 23.6 | 29.5 | 25.5 | |||||||||||||||
| Average annual inventory turnover(7) |
10.6 | 10.4 | 9.7 | 8.9 | 9.8 | |||||||||||||||
| Days payables outstanding(7) |
27.6 | 28.9 | 28.6 | 40.3 | 33.0 | |||||||||||||||
| Debt to equity(8) |
0.27 | 0.52 | 0.46 | 0.79 | 0.40 | |||||||||||||||
| (1) | In January 2009, the company exited its direct-to-consumer distribution business (DTC business). Accordingly, the DTC business is presented as discontinued operations for all periods presented. For additional information regarding discontinued operations, see Note 4 of Notes to Consolidated Financial Statements. |
| (2) | Certain adjustments have been made to previously reported amounts to conform to current year presentation. See Note 1 of Notes to Consolidated Financial Statements. |
| (3) | Represents shareholders’ equity divided by year-end common shares outstanding. |
| (4) | The company adopted Financial Accounting Standards Board (FASB) guidance related to accounting for uncertainty in income taxes on January 1, 2007. As a result, the company recognized an increase of $0.8 million to the January 1, 2007, balance of retained earnings. See Note 1 of Notes to Consolidated Financial Statements. |
16
Table of Contents
| (5) | On December 31, 2006, the company adopted FASB guidance related to defined benefit pension and other postretirement plans and recognized an increase of $3.1 million as a direct adjustment to accumulated other comprehensive loss. |
| (6) | Based on revenues for the fourth quarter of the year. |
| (7) | Based on cost of goods sold for the preceding 12 months. |
| (8) | Represents long-term debt, less current portion, divided by shareholders’ equity. |
Item 7. Management’s Discussion and Analysis of Financial Condition and Results of Operations
2009 Financial Results
Overview. In 2009, Owens & Minor, Inc. (Owens & Minor, O&M or the company) earned income from continuing operations of $116.9 million, improved from $101.3 million in 2008 and $71.4 million in 2007. Income from continuing operations per diluted common share was $2.79 in 2009, as compared with $2.44 in 2008 and $1.76 in 2007. Income from continuing operations in 2009 was positively affected by increased revenues from the acquired acute-care distribution business of The Burrows Company (Burrows) and other net new business. Income from continuing operations in 2008 reflects the cost of integrating a portion of the acquired acute-care distribution business of Burrows. Income from continuing operations in 2007 was affected by the cost of integrating the acquired acute-care distribution business of McKesson Medical-Surgical Inc., a subsidiary of McKesson Corporation (McKesson) and includes $6.7 million of service fees paid to McKesson for operational support during a transition period.
Divestiture. In January 2009, the company exited its direct-to-consumer distribution business (DTC business). Accordingly, the DTC business is presented as discontinued operations in the company’s consolidated financial statements, and all prior period information has been reclassified to be consistent with the current period presentation.
Acquisitions. The company acquired certain assets and liabilities of Burrows, a Chicago-based distributor of medical and surgical supplies to the acute-care market, in the fourth quarter of 2008, and also purchased certain real property used in the operation of the business. The adjusted purchase price, including transaction costs, was approximately $90.6 million.
In 2006, the company acquired certain assets of the acute-care medical and surgical supply distribution business of McKesson.
Results of Operations
The following table presents highlights from the company’s consolidated statements of income on a percentage of revenue basis:
| Year ended December 31, |
2009 | 2008 | 2007 | ||||||
| Gross margin |
9.79 | % | 9.90 | % | 9.71 | % | |||
| Selling, general and administrative expenses |
7.04 | % | 7.20 | % | 7.39 | % | |||
| Operating earnings |
2.50 | % | 2.50 | % | 2.10 | % | |||
| Income from continuing operations |
1.45 | % | 1.40 | % | 1.07 | % |
Revenue. Revenue was $8.0 billion for 2009, $7.2 billion for 2008 and $6.7 billion for 2007, representing an increase of 11.0% for 2009 compared to 2008 and an increase of 8.2% for 2008 compared to 2007. In comparing 2009 to 2008, slightly more than half of the increase in revenues was due to net new and acquired business, and the remaining revenue growth resulted from a 6% increase in sales to existing customers. Sales to customers acquired from Burrows and other new business represented approximately $715 million of the increase in revenues in 2009. In comparing 2008 to 2007, approximately one-tenth of the increase in revenues was due to net new and acquired business, and the remaining revenue growth resulted from an increase in sales to existing customers. Sales to customers acquired from Burrows and other new business represented approximately $282 million of the increase in revenues in 2008.
17
Table of Contents
Gross margin. Gross margin dollars increased 9.7% to $786.9 million for 2009, as compared with $717.3 million for 2008. The increase in gross margin dollars was primarily due to an increase in revenues. The decline of 11 basis points in gross margin as a percentage of revenue for 2009 as compared to 2008 was comprised of lower gross margin as a percentage of revenue on sales to new customers and customers obtained from the Burrows acquisition, and a decrease in supplier incentives as a percentage of revenue. These decreases were partially offset by the effect of net supplier price changes, as well as the impact of changes in inventory mix on the LIFO provision, which resulted in a $10.5 million lower last-in, first-out (LIFO) provision for 2009 compared to 2008.
Gross margin dollars increased 10.4% to $717.3 million in 2008, as compared with $650.0 million for 2007. The increase in gross margin as a percentage of revenue of 19 basis points for 2008 compared to 2007 resulted from: (i) improved gross margin as the acquired McKesson business transitioned to O&M systems; (ii) additional sales of programs and services; (iii) greater supplier incentives; and (iv) greater impact of manufacturers’ price changes. These increases were partially offset by a decrease in gross margin as a percentage of revenue from the acquired Burrows business and an increase in the LIFO provision.
The company values inventory under the LIFO method. Had inventory been valued under the first-in, first-out (FIFO) method, gross margin as a percentage of revenue would have been higher by 3 basis points in 2009, 18 basis points in 2008 and 13 basis points in 2007.
Selling, general and administrative (SG&A) expenses. SG&A expenses of $565.6 million for 2009 increased $44.2 million compared to 2008. Increases in labor costs of $27.6 million and occupancy costs of $3.4 million, both of which primarily relate to serving new and acquired customers, as well as increases of $5.7 million for information technology outsourcing and consulting services and $2.1 million in Burrows acquisition transition-related expenses, represented the majority of the increase. The increase in labor costs is net of a $4.6 million decrease in incentive expense reflecting decreased achievement against certain performance-based measures. Expenses related to the strategic initiative to introduce third-party logistics services in 2009 also contributed to the increase in SG&A expenses for the year.
SG&A expenses of $521.4 million for 2008 increased $26.9 million compared to 2007. The increase was primarily due to an increase of $28.2 million for labor costs, which included incentive and share-based compensation expenses of $18.1 million reflecting improved achievement against certain performance-based measures, as well as the impact of an increase in the price of the company’s common stock, which factored into the compensation cost of share-based awards granted in 2008. Also contributing to the increase in SG&A expenses were increases in occupancy expenses of $3.4 million to support sales growth, as well as information technology outsourcing and consulting expenses of $2.7 million. These increases were partially offset by costs incurred in 2007 associated with the integration of the acquired McKesson business, including service fees of $6.7 million paid to McKesson for operational support during the transition period, as well as a $3.4 million lower provision for losses on accounts and notes receivable.
Depreciation and amortization expense. Depreciation and amortization expense increased to $25.3 million for 2009 from $22.0 million for 2008. The increase was primarily due to depreciation of warehouse equipment and amortization of intangible assets and leasehold improvements related to the acquired Burrows business, as well as amortization of computer software related to warehouse automation and voice-pick technology. Depreciation and amortization expense for 2008 increased $1.1 million from $20.9 million for 2007. This increase was primarily due to greater depreciation expense from warehouse equipment purchased in 2008 to accommodate increased sales volume.
Other operating income, net. Other operating income, net, was $5.2 million, $6.8 million and $6.2 million for 2009, 2008 and 2007, including finance charge income of $4.8 million for 2009 and $4.4 million each for 2008 and 2007.
18
Table of Contents
Operating Earnings. Operating earnings for 2009 increased 11.4% to $201.3 million from $180.7 million for 2008, which increased 28.4% from $140.8 million for 2007. The increase in operating earnings in 2009 of $20.6 million was primarily due to sales to customers acquired from Burrows and other new business, partially offset by increased SG&A expenses to service the growth in sales. In comparing 2008 to 2007, operating earnings increased $39.9 million primarily due to an increase in sales to existing customers and customers acquired from Burrows in the fourth quarter of 2008. In addition, the company generated revenue growth from new customers in 2008 from its acquisition of the McKesson business. The increased revenue in 2008 was partially offset by increased SG&A expenses to service the growth in sales.
Interest expense, net. Interest expense, net of interest earned on the company’s cash balances, was $13.0 million for 2009, as compared with $16.0 million for 2008 and $23.1 million for 2007. Net interest expense for 2008 included a loss of $3.1 million on the termination of interest rate swaps. Excluding this loss, net interest expense increased slightly in 2009 compared to 2008 and decreased $10.2 million from 2007 to 2008. The decrease in 2008 is primarily due to lower balances outstanding under the company’s revolving credit agreement, as the company significantly reduced borrowings under this facility during 2008. Interest expense also decreased in 2008 due to a more favorable interest rate environment. These decreases were partially offset by interest expense recognized during 2008 on borrowings related to the Burrows acquisition.
The company’s effective interest rate was 6.5% on average borrowings of $207.5 million in 2009. Excluding the $3.1 million loss on interest rate swaps, the effective interest rate for 2008 was 6.2% on average borrowings of $215.8 million. For 2007, the effective interest rate was 6.8% on average borrowings of $346.3 million.
Income taxes. The provision for income taxes was $71.4 million for 2009, compared with $63.5 million for 2008, and $46.2 million for 2007. The company’s effective tax rate was 37.9% for 2009, as compared with 38.5% for 2008, and 39.3% for 2007. The lower effective tax rate for 2009 was primarily the result of recognizing tax benefits due to the conclusion of audits by the Internal Revenue Service of the company’s 2007 and 2006 income tax returns. The lower effective tax rate for 2008 compared to 2007 was due to decreases in tax accruals as a result of the resolution of outstanding tax issues.
Income from continuing operations. Income from continuing operations increased to $116.9 million for 2009, from $101.3 million for 2008, and $71.4 million for 2007. The increase for 2009 compared to 2008 is primarily due to an increase in operating earnings of $20.6 million and a decline in net interest expense of $3.0 million, partially offset by a $7.9 million greater income tax provision. In comparing 2008 to 2007, the increase in income from continuing operations is primarily due to an increase in operating earnings of $39.9 million and a decline in net interest expense of $7.1 million, partially offset by a $17.2 million greater income tax provision.
Income (loss) from discontinued operations, net of tax. Loss from discontinued operations, net of tax, was $12.2 million in 2009 and $7.9 million in 2008, compared to income of $1.3 million in 2007. The increased loss of $4.3 million for 2009 compared to 2008 was due to pre-tax charges associated with exiting the DTC business, including employee retention and lease exit costs, partially offset by a $3.2 million gain on the sale of the business. The decrease of $9.2 million for 2008 compared to 2007 was primarily due to pre-tax charges of $7.8 million associated with the exit from the DTC business, including losses recognized for abandoned software, employee severance and accrued contract termination costs.
19
Table of Contents
Financial Condition, Liquidity and Capital Resources
The following table summarizes the company’s Consolidated Statements of Cash Flows for the years ended December 31, 2009, 2008 and 2007:
(in millions)
| 2009 | 2008 | 2007 | ||||||||||
| Net cash provided by (used for)—continuing operations: |
||||||||||||
| Operating activities |
$ | 165.3 | $ | 62.9 | $ | 210.3 | ||||||
| Investing activities |
$ | (21.2 | ) | $ | (123.3 | ) | $ | (11.8 | ) | |||
| Financing activities |
$ | (129.1 | ) | $ | 65.3 | $ | (202.7 | ) | ||||
| Net cash provided by (used for) discontinued operations |
$ | 73.3 | $ | (7.3 | ) | $ | 6.5 | |||||
Liquidity and capital expenditures. Cash and cash equivalents increased to $96.1 million at December 31, 2009 from $7.9 million at December 31, 2008. The company generated cash from continuing operations of $165.3 million in 2009, $62.9 million in 2008 and $210.3 million in 2007. Cash from continuing operations for 2009 was positively affected by operating earnings and a decrease in accounts and notes receivable, and negatively affected by a decrease in accounts payable and an increase in inventory. Cash from continuing operations for 2008 was negatively affected by increases in accounts receivable and inventories largely as a result of the Burrows acquisition. Cash from continuing operations for 2007 was primarily driven by decreases in accounts receivable and inventory which had increased at the end of 2006 as a result of the acquisition of the McKesson business. Accounts receivable days outstanding (DSO) at December 31, 2009, based on three months’ sales, were 21.4 days, compared with 24.5 days at December 31, 2008, and 23.6 days at December 31, 2007. In 2009, DSO was positively affected by increased collections and the receipt of approximately $17 million in net customer deposits in the fourth quarter. Average annual inventory turnover was 10.6, 10.4 and 9.7 in 2009, 2008 and 2007. The improvements in average annual inventory turnover for 2009 and 2008 were the result of improved inventory management during these periods.
Cash used for investing activities decreased to $21.2 million for 2009 from $123.3 million for 2008, which increased from $11.8 million for 2007. In 2009, cash used for investing activities included capital expenditures of $32.3 million, primarily related to the company’s strategic initiatives, including leasehold improvements and information technology systems for OM HCL. During 2009, the company continued to invest in infrastructure initiatives designed to improve operational efficiency in its operating units. The company installed automation equipment in certain large distribution centers where the high volume of low unit-of-measure business is expected to benefit the most from the use of such equipment. The company believes it will achieve productivity improvements, such as an increase in the number of lines-picked-per-hour, by adding automation equipment. In addition, the company has installed voice-pick technology in 40 distribution centers. This hands-free communication technology enables warehouse teammates to improve speed and accuracy as they compile and pick customer orders in the warehouse setting. These capital expenditures were partially offset by proceeds from the sale of properties acquired from Burrows and the receipt of a $7.0 million purchase price adjustment.
Cash used for investing activities in 2008 was largely due to acquisition activity, as the company invested $96.8 million in the Burrows business, including intangible assets. The company acquired certain assets and liabilities of Burrows, in exchange for cash consideration of $17.5 million, net of a $7.0 million purchase price adjustment receivable at December 31, 2008, and including transaction costs, plus $56.1 million of assumed debt. The assumed debt was satisfied in full on the acquisition date. The company borrowed approximately $80 million under its revolving credit facility to fund this acquisition. In connection with the acquisition, the company also acquired real property from Burrows in December 2008 for $17.0 million. Of the real property acquired, two properties were sold in 2009, one is used in the company’s operations and the remaining six are being offered for sale. In 2008, the company invested $27.0 million in capital expenditures, primarily for software, warehouse equipment and additional land for possible future expansion of the company’s headquarters.
20
Table of Contents
Cash used for investing activities in 2007 included $27.5 million of capital expenditures primarily to accommodate the acquired McKesson and other new business. These expenditures were partially offset by $15.4 million related to acquisitions, which is primarily due to approximately $16.5 million received from McKesson, as the company finalized the determination of the value of inventory transferred.
The company’s financing activities used $129.1 million in cash in 2009, provided $65.3 million in cash in 2008, and used $202.7 million of cash in 2007. In 2009, proceeds of $63.0 million from the sale of the company’s DTC business, as well as cash from operating activities of continuing operations and discontinued operations, were used primarily to reduce the company’s revolving credit facility by $150.6 million and to pay dividends. These decreases were partially offset by an increase in drafts payable. In 2008, cash provided by financing activities was primarily due to net borrowings under the revolving credit facility of $73.7 million, partially offset by the payment of dividends of $33.0 million. These borrowings were used to partially fund the Burrows acquisition. In 2007, the company reduced net borrowings under its revolving credit facility by $152.6 million, which partially funded the McKesson acquisition and its related working capital needs. An additional $27.6 million of cash was used to pay dividends and $34.6 million to reduce drafts payable.
Cash generated by the operating activities of discontinued operations during 2009 was primarily from the collection of accounts receivable, partially offset by the payment of costs associated with exiting the DTC business.
Capital resources. The company’s sources of liquidity include cash and cash equivalents and a $306 million revolving credit facility which expires on May 3, 2011. In 2008, the credit agreement was amended to improve the company’s flexibility by changing certain restrictions and by releasing certain guarantors. The interest rate on the facility is based on, at the company’s discretion, LIBOR, the Federal Funds Rate or the Prime Rate, plus an adjustment based on the company’s leverage ratio, as defined by the credit agreement. The company is charged a commitment fee of between 0.05% and 0.15% on the unused portion of the facility. The terms of the agreement limit the amount of indebtedness that the company may incur, require the company to maintain certain levels of net worth, leverage ratio and fixed charge coverage ratio, and restrict the ability of the company to materially alter the character of the business through consolidation, merger, or purchase or sale of assets. At December 31, 2009, the following financial institutions had commitments under the facility: Bank of America, N.A., Citibank N.A., SunTrust Bank, Wachovia Bank, National Association, Comerica Bank, KeyBank National Association, Union Bank of California, N.A., U.S. Bank, National Association, The Bank of New York and Fifth Third Bank. The company had $10.9 million of letters of credit and no borrowings outstanding under the facility, leaving $295.1 million available for borrowing at December 31, 2009. Based on the company’s leverage ratio at December 31, 2009, the company’s interest rate under its revolving credit facility, which is subject to adjustment quarterly, will remain unchanged at LIBOR plus 50.0 basis points at the next adjustment date.
The company has $200 million of senior notes outstanding, which mature in 2016 and bear interest at 6.35%, payable semi-annually on April 15th and October 15th. The company has an investment grade rating of BBB- from Standard & Poor’s and Fitch Ratings and a rating of Ba2 from Moody’s Investor Service. The company’s revolving credit facility and senior notes contain cross-default provisions which could result in the acceleration of payments due in the event of default of either agreement. The company was in compliance with its debt covenants at December 31, 2009.
O&M paid quarterly cash dividends on its common stock at the rate of $0.23 per share during 2009. In February 2010, the company’s Board of Directors approved a 15% increase in the amount of the company’s quarterly dividend to $0.265 per share. The company’s annual dividend payout ratio for the three years ended December 31, 2009 was in the range of 35.6% to 38.0%. The company anticipates that it will continue to pay quarterly cash dividends in the future. However, the payment and amount of future dividends remain within the discretion of the Board of Directors and will depend upon the company’s results of operations, financial condition, capital requirements, and other factors.
21
Table of Contents
The company believes its available financing sources, including cash generated from continuing operations and borrowings under the revolving credit facility, will be sufficient to fund working capital needs, capital expenditures, long-term strategic growth, payments of quarterly cash dividends and other cash requirements. Although the company believes it will have the ability to meet its financing needs for the foreseeable future, this cannot be assured as economic conditions may impact the ability of financial institutions to meet their contractual commitments to the company, may impact the ability of the company’s customers and suppliers to meet their obligations to the company or may increase the company’s costs of borrowing. The following is a summary of the company’s significant contractual obligations as of December 31, 2009:
(in millions)
| Contractual obligations |
Total | Less than 1 year |
1-3 years | 4-5 years | After 5 years | ||||||||||
| Long-term debt, including interest payments(1) |
$ | 280.4 | $ | 12.7 | $ | 25.4 | $ | 25.4 | $ | 216.9 | |||||
| Operating leases(2) |
156.8 | 51.1 | 60.8 | 32.4 | 12.5 | ||||||||||
| Purchase obligations(2) |
146.6 | 33.1 | 64.0 | 49.5 | — | ||||||||||
| Unrecognized tax benefits, net(3) |
20.1 | 0.2 | — | — | — | ||||||||||
| Capital lease obligations(1) |
4.6 | 1.7 | 2.0 | 0.7 | 0.2 | ||||||||||
| Other long-term liabilities(4)(5) |
40.7 | 5.2 | 6.8 | 6.5 | 22.2 | ||||||||||
| Total contractual obligations(6) |
$ | 649.2 | $ | 104.0 | $ | 159.0 | $ | 114.5 | $ | 251.8 | |||||
| (1) | See Note 10 of Notes to Consolidated Financial Statements. Debt is assumed to be held to maturity with interest paid at the stated rate in effect at December 31, 2009. |
| (2) | See Note 17 of Notes to Consolidated Financial Statements. |
| (3) | Total liability for unrecognized tax benefits, net, includes $19.9 million, for which the company cannot reasonably estimate the timing of cash settlement. |
| (4) | Other long-term liabilities include estimated minimum required payments for defined benefit retirement plans. The company expects to terminate its pension plan and to make a cash contribution to the plan in the range of $8.0 million to $13.0 million through the final termination, which is targeted to be in 2011. See Note 13 of Notes to Consolidated Financial Statements. |
| (5) | Other long-term liabilities, including deferred tax liabilities, deferred compensation and post retirement benefit obligations are excluded as the company cannot reasonably estimate the timing of payments for these items. |
| (6) | Excludes certain contingent contractual obligations that are required to be paid in the event that performance targets specified by customer contracts are not achieved. See Note 17 of Consolidated Financial Statements. |
Critical Accounting Policies
The company’s consolidated financial statements and accompanying notes have been prepared in accordance with U.S. generally accepted accounting principles. The preparation of financial statements requires management to make estimates and assumptions that affect the reported amounts of assets and liabilities, the disclosure of contingent assets and liabilities at the date of the financial statements, and the reported amounts of revenues and expenses during the reporting periods. The company continually evaluates the accounting policies and estimates it uses to prepare its financial statements.
Critical accounting policies are defined as those policies that relate to estimates that require a company to make assumptions about matters that are highly uncertain at the time the estimate is made and could have a material impact on the company’s results due to changes in the estimate or the use of different estimates that could reasonably have been used. Management’s estimates are generally based on historical experience and various other assumptions that are judged to be reasonable in light of the relevant facts and circumstances. Because of the uncertainty inherent in such estimates, actual results may differ. Management believes its critical accounting policies and estimates include its allowances for losses on accounts and notes receivable, merchandise inventory valuation, accounting for goodwill, and self-insurance liabilities.
22
Table of Contents
Allowances for losses on accounts and notes receivable. The company maintains valuation allowances based upon the expected collectability of accounts and notes receivable. The allowances include specific amounts for accounts that are likely to be uncollectible, such as customer bankruptcies and disputed amounts, and general allowances for accounts that may become uncollectible. These allowances are estimated based on a number of factors, including industry trends, current economic conditions, creditworthiness of customers, age of the receivables, changes in customer payment patterns, and historical experience. At December 31, 2009, the company had accounts and notes receivable of $498.1 million, net of allowances of $16.4 million. An unexpected bankruptcy or other adverse change in the financial condition of a customer could result in increases in these allowances, which could have a material effect on the company’s results of operations. The company actively manages its accounts receivable to minimize credit risk.
Inventory valuation. The company values its merchandise inventories at the lower of cost or market, with cost determined using the last-in, first-out (LIFO) method. An actual valuation of inventory under the LIFO method is made only at the end of the year based on the inventory levels and costs at that time. LIFO calculations are required for interim reporting purposes and are based on the company’s estimates of the expected mix of products in year-end inventory. In addition, inventory valuation includes estimates of allowances for obsolescence and variances between actual inventory on-hand and perpetual inventory records that can arise between physical inventory dates. These estimates are based on factors such as the age of inventory and historical trends. At December 31, 2009, the carrying value of the company’s inventory was $689.9 million, which is $81.9 million less than the value of inventory accounted for on a current cost or first-in, first out (FIFO) basis.
Goodwill. The company evaluates goodwill for impairment annually and when an event occurs or circumstances change that indicate that the carrying amount may not be recoverable. In performing the impairment test, the company estimates the fair value of the reporting unit using valuation techniques which can include multiples of the unit’s earnings before interest, taxes, depreciation and amortization (EBITDA), present value of expected cash flows, and quoted market prices. The EBITDA multiples are based on an analysis of current market capitalizations and recent acquisition prices of similar companies, if available. The fair value of the reporting unit is then compared to its carrying value to determine potential impairment. The company’s goodwill totaled $247.3 million at December 31, 2009.
The impairment review requires the extensive use of accounting judgment and financial estimates. The application of alternative assumptions, such as different discount rates or EBITDA multiples, or the testing for impairment at a different level of organization or under a different organization structure, could produce materially different results.
Self-insurance liabilities. The company is self-insured for most employee healthcare, workers’ compensation and automobile liability costs; however, the company maintains insurance for individual losses exceeding certain limits. The company estimates its liabilities for healthcare costs using current and historical claims data. Liabilities for workers’ compensation and automobile liability claims are estimated using historical claims data and loss development factors. If the underlying facts and circumstances of existing claims change or historical trends are not indicative of future trends, then the company may be required to record additional expense or reductions to expense that could be material to the company’s financial condition and results of operations. Self-insurance liabilities recorded in the company’s consolidated balance sheet for employee healthcare, workers’ compensation and automobile liability costs totaled $12.5 million at December 31, 2009.
23
Table of Contents
Recent Accounting Pronouncements
For a discussion of recent accounting pronouncements, see Note 1 of Notes to the Consolidated Financial Statements.
Item 7A. Quantitative and Qualitative Disclosures About Market Risk
Owens & Minor provides credit in the normal course of business to its customers and is exposed to losses resulting from nonpayment or delinquent payment by customers. The company performs initial and ongoing credit evaluations of its customers and maintains reserves for estimated credit losses. The company measures its performance in collecting customer accounts receivable in terms of days sales outstanding (DSO). Accounts receivable from continuing operations at December 31, 2009, were $498.1 million, and DSO at December 31, 2009, was 21.4, based on three months’ sales. A hypothetical increase in DSO of one day would result in a decrease in the company’s cash balances, an increase in borrowings against the company’s revolving credit facility or a combination thereof of approximately $22 million.
The company is exposed to market risk from changes in interest rates related to its revolving credit facility. The company had no outstanding borrowings and $10.9 million in letters of credit under the facility at December 31, 2009. A hypothetical increase in interest rates of 100 basis points would result in a potential reduction in future pre-tax earnings of approximately $0.1 million per year for every $10 million of outstanding borrowings under the revolving credit facility.
Item 8. Financial Statements and Supplementary Data
See Item 15, Exhibits and Financial Statement Schedules.
Item 9. Changes in and Disagreements with Accountants on Accounting and Financial Disclosure
None.
Item 9A. Controls and Procedures
The company carried out an evaluation, with the participation of the company’s management, including its principal executive officer and principal financial officer, of the effectiveness of the company’s disclosure controls and procedures (pursuant to Rule 13a-15(e) under the Securities Exchange Act of 1934, as amended) as of the end of the period covered by this report. Based upon that evaluation, the principal executive officer and principal financial officer concluded that the company’s disclosure controls and procedures were effective as of December 31, 2009, in timely alerting them to material information relating to the company required to be included in the company’s periodic SEC filings.
There has been no change in the company’s internal controls over financial reporting during its last fiscal quarter (its fourth quarter in the case of an annual report) ended December 31, 2009, that has materially affected, or is reasonably likely to materially affect, the company’s internal control over financial reporting.
Not applicable.
24
Table of Contents
Management’s Report on Internal Control over Financial Reporting
Management is responsible for establishing and maintaining adequate internal control over financial reporting, as such term is defined in Exchange Act Rules 13a-15(f). Under the supervision and with the participation of management, including the company’s principal executive officer and principal financial officer, we conducted an evaluation of the effectiveness of our internal control over financial reporting as of December 31, 2009, based on the framework in Internal Control—Integrated Framework issued by the Committee of Sponsoring Organizations of the Treadway Commission (COSO). Based on our evaluation under the COSO framework, management concluded that the company’s internal control over financial reporting was effective as of December 31, 2009. The effectiveness of the company’s internal control over financial reporting as of December 31, 2009, has been audited by KPMG LLP, an independent registered public accounting firm, as stated in their report which is included in this annual report.

|
| Craig R. Smith |
| President & Chief Executive Officer |

|
| James L. Bierman |
| Senior Vice President & Chief Financial Officer |
25
Table of Contents
Report of Independent Registered Public Accounting Firm
The Board of Directors and Shareholders
Owens & Minor, Inc.:
We have audited Owens & Minor, Inc.’s (the Company) internal control over financial reporting as of December 31, 2009, based on criteria established in Internal Control—Integrated Framework issued by the Committee of Sponsoring Organizations of the Treadway Commission (COSO). The Company’s management is responsible for maintaining effective internal control over financial reporting and for its assessment of the effectiveness of internal control over financial reporting. Our responsibility is to express an opinion on the Company’s internal control over financial reporting based on our audit.
We conducted our audit in accordance with the standards of the Public Company Accounting Oversight Board (United States). Those standards require that we plan and perform the audit to obtain reasonable assurance about whether effective internal control over financial reporting was maintained in all material respects. Our audit included obtaining an understanding of internal control over financial reporting, assessing the risk that a material weakness exists, and testing and evaluating the design and operating effectiveness of internal control based on the assessed risk. Our audit also included performing such other procedures as we considered necessary in the circumstances. We believe that our audit provides a reasonable basis for our opinion.
A company’s internal control over financial reporting is a process designed to provide reasonable assurance regarding the reliability of financial reporting and the preparation of financial statements for external purposes in accordance with generally accepted accounting principles. A company’s internal control over financial reporting includes those policies and procedures that (1) pertain to the maintenance of records that, in reasonable detail, accurately and fairly reflect the transactions and dispositions of the assets of the company; (2) provide reasonable assurance that transactions are recorded as necessary to permit preparation of financial statements in accordance with generally accepted accounting principles, and that receipts and expenditures of the company are being made only in accordance with authorizations of management and directors of the company; and (3) provide reasonable assurance regarding prevention or timely detection of unauthorized acquisition, use, or disposition of the company’s assets that could have a material effect on the financial statements.
Because of its inherent limitations, internal control over financial reporting may not prevent or detect misstatements. Also, projections of any evaluation of effectiveness to future periods are subject to the risk that controls may become inadequate because of changes in conditions, or that the degree of compliance with the policies or procedures may deteriorate.
In our opinion, the Company maintained, in all material respects, effective internal control over financial reporting as of December 31, 2009, based on criteria established in Internal Control—Integrated Framework issued by the Committee of Sponsoring Organizations of the Treadway Commission.
We also have audited, in accordance with the standards of the Public Company Accounting Oversight Board (United States), the consolidated balance sheets of Owens & Minor, Inc. and subsidiaries as of December 31, 2009 and 2008, and the related consolidated statements of income, changes in shareholders’ equity, and cash flows for each of the years in the three-year period ended December 31, 2009, and our report dated February 25, 2010, expressed an unqualified opinion on those consolidated financial statements.

Richmond, Virginia
February 25, 2010
26
Table of Contents
Part III
Information required by Items 10-14 can be found under Corporate Officers on page 8 of the Annual Report (or at the end of the electronic filing of this Form 10-K) and the registrant’s 2010 Proxy Statement pursuant to instructions (1) and G(3) of the General Instructions to Form 10-K.
Because the company’s common stock is listed on the New York Stock Exchange (NYSE), the company’s Chief Executive Officer is required to make, and he has made, an annual certification to the NYSE stating that he was not aware of any violation by the company of the corporate governance listing standards of the NYSE. The company’s Chief Executive Officer made his annual certification to that effect to the NYSE as of May 18, 2009. In addition, the company has filed, as exhibits to this Annual Report on Form 10-K, the certifications of its principal executive officer and principal financial officer required under Sections 906 and 302 of the Sarbanes-Oxley Act of 2002 to be filed with the Securities and Exchange Commission regarding the quality of the company’s public disclosure.
27
Table of Contents
Part IV
Item 15. Exhibits and Financial Statement Schedules
a) The following documents are filed as part of this report:
b) Exhibits:
See Index to Exhibits on page 67.
28
Table of Contents
OWENS & MINOR, INC. AND SUBSIDIARIES
CONSOLIDATED STATEMENTS OF INCOME
(in thousands, except per share data)
| Year ended December 31, |
2009 | 2008 | 2007 | |||||||||
| Revenue |
$ | 8,037,624 | $ | 7,243,237 | $ | 6,694,596 | ||||||
| Cost of revenue |
7,250,709 | 6,525,977 | 6,044,631 | |||||||||
| Gross margin |
786,915 | 717,260 | 649,965 | |||||||||
| Selling, general and administrative expenses |
565,620 | 521,401 | 494,515 | |||||||||
| Depreciation and amortization |
25,265 | 21,955 | 20,856 | |||||||||
| Other operating income, net |
(5,245 | ) | (6,821 | ) | (6,187 | ) | ||||||
| Operating earnings |
201,275 | 180,725 | 140,781 | |||||||||
| Interest expense, net |
13,028 | 15,999 | 23,148 | |||||||||
| Income from continuing operations before income taxes |
188,247 | 164,726 | 117,633 | |||||||||
| Income tax provision |
71,388 | 63,469 | 46,222 | |||||||||
| Income from continuing operations |
116,859 | 101,257 | 71,411 | |||||||||
| Income (loss) from discontinued operations, net of tax |
(12,201 | ) | (7,930 | ) | 1,299 | |||||||
| Net income |
$ | 104,658 | $ | 93,327 | $ | 72,710 | ||||||
| Income (loss) per common share—basic: |
||||||||||||
| Continuing operations |
$ | 2.81 | $ | 2.46 | $ | 1.76 | ||||||
| Discontinued operations |
(0.29 | ) | (0.19 | ) | 0.04 | |||||||
| Net income per share—basic |
$ | 2.52 | $ | 2.27 | $ | 1.80 | ||||||
| Income (loss) per common share—diluted: |
||||||||||||
| Continuing operations |
$ | 2.79 | $ | 2.44 | $ | 1.76 | ||||||
| Discontinued operations |
(0.29 | ) | (0.19 | ) | 0.03 | |||||||
| Net income per share—diluted |
$ | 2.50 | $ | 2.25 | $ | 1.79 | ||||||
| Cash dividends per common share |
$ | 0.92 | $ | 0.80 | $ | 0.68 | ||||||
See accompanying notes to consolidated financial statements.
29
Table of Contents
OWENS & MINOR, INC. AND SUBSIDIARIES
(in thousands, except per share data)
| December 31, |
2009 | 2008 | ||||||
| Assets |
||||||||
| Current assets |
||||||||
| Cash and cash equivalents |
$ | 96,136 | $ | 7,886 | ||||
| Accounts and notes receivable, net |
498,080 | 521,311 | ||||||
| Merchandise inventories |
689,889 | 679,069 | ||||||
| Other current assets |
57,962 | 71,329 | ||||||
| Current assets of discontinued operations |
— | 32,199 | ||||||
| Total current assets |
1,342,067 | 1,311,794 | ||||||
| Property and equipment, net |
84,965 | 76,949 | ||||||
| Goodwill, net |
247,271 | 252,412 | ||||||
| Intangible assets, net |
27,809 | 27,802 | ||||||
| Other assets, net |
44,976 | 44,875 | ||||||
| Other assets of discontinued operations |
— | 62,358 | ||||||
| Total assets |
$ | 1,747,088 | $ | 1,776,190 | ||||
| Liabilities and shareholders’ equity |
||||||||
| Current liabilities |
||||||||
| Accounts payable |
$ | 546,989 | $ | 513,026 | ||||
| Accrued payroll and related liabilities |
34,885 | 40,018 | ||||||
| Deferred income taxes |
25,784 | 34,407 | ||||||
| Other accrued liabilities |
90,519 | 69,022 | ||||||
| Current liabilities of discontinued operations |
1,939 | 11,038 | ||||||
| Total current liabilities |
700,116 | 667,511 | ||||||
| Long-term debt, excluding current portion |
208,418 | 359,237 | ||||||
| Deferred income taxes |
8,947 | 2,658 | ||||||
| Other liabilities |
60,428 | 57,733 | ||||||
| Total liabilities |
977,909 | 1,087,139 | ||||||
| Commitments and contingencies |
||||||||
| Shareholders’ equity |
||||||||
| Preferred stock, par value $100 per share; authorized—10,000 shares; Series A Participating Cumulative Preferred Stock; none issued |
— | — | ||||||
| Common stock, par value $2 per share; authorized—200,000 shares; issued and outstanding—41,913 shares and 41,441 shares |
83,827 | 82,881 | ||||||
| Paid-in capital |
193,905 | 180,074 | ||||||
| Retained earnings |
504,480 | 438,192 | ||||||
| Accumulated other comprehensive loss |
(13,033 | ) | (12,096 | ) | ||||
| Total shareholders’ equity |
769,179 | 689,051 | ||||||
| Total liabilities and shareholders’ equity |
$ | 1,747,088 | $ | 1,776,190 | ||||
See accompanying notes to consolidated financial statements.
30
Table of Contents
OWENS & MINOR, INC. AND SUBSIDIARIES
CONSOLIDATED STATEMENTS OF CASH FLOWS
| (in thousands) | ||||||||||||
| Year ended December 31, |
2009 | 2008 | 2007 | |||||||||
| Operating activities: |
||||||||||||
| Net income |
$ | 104,658 | $ | 93,327 | $ | 72,710 | ||||||
| Adjustments to reconcile net income to cash provided by operating activities of continuing operations: |
||||||||||||
| Loss (income) from discontinued operations |
12,201 | 7,930 | (1,299 | ) | ||||||||
| Depreciation and amortization |
25,265 | 21,955 | 20,856 | |||||||||
| Share-based compensation expense |
7,035 | 7,563 | 5,830 | |||||||||
| Deferred income tax provision (benefit) |
10,869 | 17,618 | (5,939 | ) | ||||||||
| Provision for losses on accounts and notes receivable |
3,976 | 4,274 | 8,009 | |||||||||
| Provision for LIFO reserve |
2,708 | 13,172 | 8,424 | |||||||||
| Loss on interest rate swaps |
— | 3,141 | — | |||||||||
| Changes in operating assets and liabilities: |
||||||||||||
| Accounts and notes receivable |
19,255 | (48,464 | ) | 70,747 | ||||||||
| Merchandise inventories |
(13,528 | ) | (56,156 | ) | 60,742 | |||||||
| Accounts payable |
(18,755 | ) | (13,584 | ) | (33,000 | ) | ||||||
| Net change in other current assets and current liabilities |
12,722 | 9,833 | 7,100 | |||||||||
| Other, net |
(1,086 | ) | 2,269 | (3,832 | ) | |||||||
| Cash provided by operating activities of continuing operations |
165,320 | 62,878 | 210,348 | |||||||||
| Investing activities: |
||||||||||||
| Additions to property and equipment |
(19,746 | ) | (17,669 | ) | (19,104 | ) | ||||||
| Additions to computer software |
(12,543 | ) | (9,281 | ) | (8,444 | ) | ||||||
| Net cash received (paid) related to acquisitions of businesses |
6,994 | (96,790 | ) | 15,441 | ||||||||
| Proceeds from sale of property and equipment |
4,080 | 409 | 327 | |||||||||
| Cash used for investing activities of continuing operations |
(21,215 | ) | (123,331 | ) | (11,780 | ) | ||||||
| Financing activities: |
||||||||||||
| Net (payments) borrowings on revolving credit facility |
(150,578 | ) | 73,670 | (152,600 | ) | |||||||
| Cash dividends paid |
(38,370 | ) | (33,048 | ) | (27,637 | ) | ||||||
| Increase (decrease) in drafts payable |
52,718 | 11,316 | (34,634 | ) | ||||||||
| Proceeds from exercise of stock options |
6,593 | 8,968 | 9,621 | |||||||||
| Excess tax benefits related to stock-based compensation |
2,570 | 3,421 | 4,084 | |||||||||
| Proceeds from termination of interest rate swaps |
— | 3,795 | — | |||||||||
| Other, net |
(2,045 | ) | (2,859 | ) | (1,491 | ) | ||||||
| Cash (used for) provided by financing activities of continuing operations |
(129,112 | ) | 65,263 | (202,657 | ) | |||||||
| Discontinued operations: |
||||||||||||
| Operating cash flows |
10,257 | (7,115 | ) | 9,489 | ||||||||
| Investing cash flows |
63,000 | (204 | ) | (2,995 | ) | |||||||
| Net cash provided by (used for) discontinued operations |
73,257 | (7,319 | ) | 6,494 | ||||||||
| Net increase (decrease) in cash and cash equivalents |
88,250 | (2,509 | ) | 2,405 | ||||||||
| Cash and cash equivalents at beginning of year |
7,886 | 10,395 | 7,990 | |||||||||
| Cash and cash equivalents at end of year |
$ | 96,136 | $ | 7,886 | $ | 10,395 | ||||||
See accompanying notes to consolidated financial statements.
31
Table of Contents
OWENS & MINOR, INC. AND SUBSIDIARIES
CONSOLIDATED STATEMENTS OF CHANGES IN SHAREHOLDERS’ EQUITY
| (in thousands, except per share data) | |||||||||||||||||||||||
| Common Shares Outstanding |
Common Stock |
Paid-In Capital |
Retained Earnings |
Accumulated Other Comprehensive Loss |
Total Shareholders’ Equity |
||||||||||||||||||
| Balance December 31, 2006 |
40,257 | $ | 80,515 | $ | 143,557 | $ | 332,013 | $ | (8,631 | ) | $ | 547,454 | |||||||||||
| Net income |
72,710 | 72,710 | |||||||||||||||||||||
| Other comprehensive income: |
|||||||||||||||||||||||
| Retirement benefit plan adjustments, net of $896 tax expense |
1,402 | 1,402 | |||||||||||||||||||||
| Cash flow hedge activity, net of $32 tax benefit |
(51 | ) | (51 | ) | |||||||||||||||||||
| Comprehensive income |
74,061 | ||||||||||||||||||||||
| Adjustment to unrecognized tax benefits |
827 | 827 | |||||||||||||||||||||
| Issuance of restricted stock, net of forfeitures |
113 | 225 | (225 | ) | — | ||||||||||||||||||
| Amortization of unearned compensation |
6,507 | 6,507 | |||||||||||||||||||||
| Cash dividends ($0.68 per share) |
(27,637 | ) | (27,637 | ) | |||||||||||||||||||
| Exercise of stock options, including excess tax benefits of $4,084 |
521 | 1,042 | 12,663 | 13,705 | |||||||||||||||||||
| Other |
(17 | ) | (34 | ) | (524 | ) | (558 | ) | |||||||||||||||
| Balance December 31, 2007 |
40,874 | $ | 81,748 | $ | 161,978 | $ | 377,913 | $ | (7,280 | ) | $ | 614,359 | |||||||||||
| Net income |
93,327 | 93,327 | |||||||||||||||||||||
| Other comprehensive income: |
|||||||||||||||||||||||
| Retirement benefit plan adjustments, net of $3,049 tax benefit |
(4,768 | ) | (4,768 | ) | |||||||||||||||||||
| Cash flow hedge activity, net of $32 tax benefit |
(48 | ) | (48 | ) | |||||||||||||||||||
| Comprehensive income |
88,511 | ||||||||||||||||||||||
| Issuance of restricted stock, net of forfeitures |
210 | 420 | (420 | ) | — | ||||||||||||||||||
| Amortization of unearned compensation |
8,067 | 8,067 | |||||||||||||||||||||
| Cash dividends ($0.80 per share) |
(33,048 | ) | (33,048 | ) | |||||||||||||||||||
| Exercise of stock options, including excess tax benefits of $3,421 |
383 | 766 | 11,623 | 12,389 | |||||||||||||||||||
| Other |
(26 | ) | (53 | ) | (1,174 | ) | (1,227 | ) | |||||||||||||||
| Balance December 31, 2008 |
41,441 | $ | 82,881 | $ | 180,074 | $ | 438,192 | $ | (12,096 | ) | $ | 689,051 | |||||||||||
| Net income |
104,658 | 104,658 | |||||||||||||||||||||
| Other comprehensive income: |
|||||||||||||||||||||||
| Retirement benefit plan adjustments, net of $566 tax benefit |
(885 | ) | (885 | ) | |||||||||||||||||||
| Cash flow hedge activity, net of $32 tax benefit |
(52 | ) | (52 | ) | |||||||||||||||||||
| Comprehensive income |
103,721 | ||||||||||||||||||||||
| Issuance of restricted stock, net of forfeitures |
193 | 387 | (387 | ) | — | ||||||||||||||||||
| Amortization of unearned compensation |
7,035 | 7,035 | |||||||||||||||||||||
| Cash dividends ($0.92 per share) |
(38,370 | ) | (38,370 | ) | |||||||||||||||||||
| Exercise of stock options, including excess tax benefits of $2,570 |
316 | 631 | 8,532 | 9,163 | |||||||||||||||||||
| Other |
(37 | ) | (72 | ) | (1,349 | ) | (1,421 | ) | |||||||||||||||
| Balance December 31, 2009 |
41,913 | $ | 83,827 | $ | 193,905 | $ | 504,480 | $ | (13,033 | ) | $ | 769,179 | |||||||||||
See accompanying notes to consolidated financial statements.
32
Table of Contents
OWENS & MINOR, INC. AND SUBSIDIARIES
Notes to Consolidated Financial Statements
(in thousands, unless otherwise indicated)
Note 1—Summary of Significant Accounting Policies
Owens & Minor, Inc. (Owens & Minor, O&M or the company) is a Fortune 500 company providing distribution and other supply chain management services to healthcare providers and suppliers of medical and surgical products, and is a leading national distributor of medical and surgical supplies to the acute-care market. Prior to January 2009, the company had operations in the direct-to-consumer distribution of diabetic supplies and products for certain other chronic diseases (DTC business).
Basis of Presentation. The consolidated financial statements include the accounts of Owens & Minor, Inc. and its wholly owned subsidiaries (the company). All significant intercompany accounts and transactions have been eliminated.
In January 2009, the company exited the DTC business. Accordingly, the DTC business is reported as discontinued operations for all periods presented and, unless otherwise noted, all amounts presented in the accompanying consolidated financial statements, including note disclosures, contain only information related to the company’s continuing operations.
Reclassifications. Certain prior year amounts have been reclassified to conform to the current year presentation.
Use of Estimates. The preparation of the consolidated financial statements in conformity with U.S. generally accepted accounting principles (GAAP) requires management to make assumptions and estimates that affect amounts reported. Estimates are used for, but are not limited to, the allowances for losses on accounts and notes receivable, inventory valuation allowances, depreciation and amortization, goodwill valuation, valuation of intangible assets, valuation of property held for sale, self-insurance liabilities, tax liabilities, defined benefit obligations, share-based compensation and other contingencies. Actual results may differ from these estimates.
Cash and Cash Equivalents. Cash and cash equivalents includes cash and marketable securities with an original maturity or maturity at acquisition of three months or less. Cash and cash equivalents are stated at cost.
Accounts and Notes Receivable, Net. Accounts receivable from customers are recorded at the invoiced amount. The company assesses finance charges on overdue accounts receivable that are recognized as other operating income based on their estimated ultimate collectability. O&M has arrangements with certain customers under which they make deposits on account. Customer deposits in excess of outstanding receivable balances are classified as other current liabilities.
The company maintains valuation allowances based upon the expected collectability of accounts and notes receivable. The allowances include specific amounts for accounts that are likely to be uncollectible, such as customer bankruptcies and disputed amounts, and general allowances for accounts that may become uncollectible and for product returns. The allowances are estimated based on a number of factors, including industry trends, current economic conditions, creditworthiness of customers, age of the receivables, changes in customer payment patterns, and historical experience. Account balances are charged off against the allowance after all means of collection have been exhausted and the potential for recovery is considered remote.
Merchandise Inventories. The company’s merchandise inventories are valued at the lower of cost or market, with cost determined by the last-in, first-out (LIFO) method.
33
Table of Contents
OWENS & MINOR, INC. AND SUBSIDIARIES
Notes to Consolidated Financial Statements—(Continued)
(in thousands unless otherwise indicated)
Property and Equipment. Property and equipment are stated at cost less accumulated depreciation or, if acquired under capital leases, at the lower of the present value of minimum lease payments or fair market value at the inception of the lease less accumulated amortization. Depreciation and amortization expense for financial reporting purposes is computed on a straight-line method over the estimated useful lives of the assets or, for capital leases and leasehold improvements, over the term of the lease, if shorter. In general, the estimated useful lives for computing depreciation and amortization are four to eight years for warehouse equipment, five to 40 years for buildings and building improvements, and three to eight years for computers, furniture and fixtures, and office and other equipment. Straight-line and accelerated methods of depreciation are used for income tax purposes. Normal maintenance and repairs are expensed as incurred, and renovations and betterments are capitalized.
Leases. The company has entered into non-cancelable agreements to lease most of its office and warehouse facilities with remaining terms generally ranging from one to ten years. The company also leases most of its transportation and material handling equipment for terms generally ranging from five to eight years. The company accounts for certain information technology assets embedded in an outsourcing agreement as capital leases. Leases are classified as operating leases or capital leases at their inception. Rent expense for leases with rent holidays or pre-determined rent increases is recognized on a straight-line basis over the lease term. Incentives and allowances for leasehold improvements are deferred and recognized as a reduction of rent expense over the lease term.
Goodwill. The company evaluates goodwill for impairment annually, as of April 30th and when an event occurs or circumstances change that indicate that the carrying value may not be recoverable. The company tests goodwill for impairment by first comparing the book value of its net assets to the fair value of the reporting unit. If the fair value is determined to be less than book value, a second step is performed to compute the amount of impairment as the difference between the estimated fair value of goodwill and the carrying value. The company estimates the fair value of the reporting unit using valuation techniques which can include multiples of the unit’s earnings before interest, taxes, depreciation and amortization (EBITDA), present value of expected cash flows, and quoted market prices. The EBITDA multiples are based on an analysis of current market capitalizations and recent acquisition prices of similar companies, if available. During 2009, 2008, and 2007, the fair value of the company’s reporting unit substantially exceeded its carrying value.
Intangible Assets. Intangible assets acquired through purchases or business combinations are stated at fair value at the acquisition date, net of accumulated amortization. Intangible assets consisting of customer relationships, non-competition agreements and trademarks are amortized over their estimated useful lives. In determining the useful life of an intangible asset, the company considers its historical experience in renewing or extending similar arrangements. Customer relationships are generally amortized for 15 years. Other intangible assets are amortized on a straight-line basis, generally for periods between three and 15 years.
Computer Software. The company develops and purchases software for internal use. Software development costs incurred during the application development stage are capitalized. Once the software has been installed and tested, and is ready for use, additional costs incurred in connection with the software are expensed as incurred. Capitalized computer software costs are amortized over the estimated useful life of the software, usually between three and five years. Computer software costs are included in other assets, net, in the consolidated balance sheets. Unamortized software at December 31, 2009 and 2008 was $25.3 million and $19.6 million. Depreciation and amortization expense includes $6.7 million, $5.9 million and, $5.8 million of software amortization for the years ended December 31, 2009, 2008 and 2007.
34
Table of Contents
OWENS & MINOR, INC. AND SUBSIDIARIES
Notes to Consolidated Financial Statements—(Continued)
(in thousands unless otherwise indicated)
Self-Insurance Liabilities. The company is self-insured for most employee healthcare, workers’ compensation and automobile liability costs; however, the company maintains insurance for individual losses exceeding certain limits. The company estimates its liabilities for healthcare costs using current and historical claims data. Liabilities for workers’ compensation and automobile liability claims are estimated using historical claims data and loss development factors. If the underlying facts and circumstances of existing claims change or historical trends are not indicative of future trends, then the company may be required to record additional expense or reductions to expense. Self-insurance liabilities, accrued operating expenses, accrued sales and use taxes, unfunded defined benefit obligations and customer deposits in excess of related accounts receivable are included in other accrued liabilities.
Revenue Recognition. The company recognizes revenue when persuasive evidence of an arrangement exists, delivery has occurred or services have been rendered, the price or fee is fixed or determinable, and collectability is reasonably assured.
Under most of the company’s healthcare provider distribution contracts, title passes to the customer when the product is received by the customer. The company records product revenue at the time that shipment is completed. Distribution fee revenue, when calculated as a mark-up of the product cost, is also recognized at the time that shipment is completed. Revenue for activity-based distribution fees and other services is recognized once service has been rendered.
The company allocates revenue for arrangements with multiple deliverables meeting the criteria for a separate unit of accounting using the relative fair value method and recognizes revenue for each deliverable in accordance with applicable revenue recognition criteria. The company generates fees from arrangements that also include performance targets related to cost-saving initiatives for customers that result from the company’s supply chain management services. Achievement against performance targets is measured as determined by contractual terms. In the event the performance targets are not achieved, the company may be obligated to refund or reduce a portion of its fees or to provide credit toward future purchases by the customer. For these arrangements, all contingent revenue is deferred and recognized as the performance target is achieved and the applicable contingency is released. When the company determines that a loss is probable under a contract, the estimated loss is accrued.
In most cases, the company records revenue gross, as the company is the primary obligor in its sales arrangements and bears the risk of general and physical inventory loss. The company also has some discretion in supplier selection and carries all credit risk associated with its sales. Sales taxes collected from customers and remitted to governmental authorities are excluded from revenues.
Supplier Incentives. The company has contractual arrangements with certain suppliers that provide incentives, including cash discounts for prompt payment, operational efficiency programs and performance-based incentives. These incentives are recognized as a reduction in cost of revenue when earned.
Share-Based Compensation. The company accounts for share-based payments to employees at fair value and recognizes the related expense in selling, general and administrative expenses over the service period for awards expected to vest.
Derivative Financial Instruments. During 2008 and 2007, the company held interest rate swaps as part of its interest rate risk management strategy. The purpose of these swaps was to maintain a mix of fixed to floating
35
Table of Contents
OWENS & MINOR, INC. AND SUBSIDIARIES
Notes to Consolidated Financial Statements—(Continued)
(in thousands unless otherwise indicated)
rate financing in order to manage interest rate risk. These swaps were recognized on the balance sheet at their fair value, based on estimates of the prices obtained from a dealer. All of the company’s interest rate swaps were designated as hedges of the fair value of a portion of the company’s long-term debt using the shortcut method, as both the swaps and the long-term debt met all of the conditions for the use of this method. Accordingly, no net gains or losses were recorded in the consolidated statements of income related to the company’s underlying debt and interest rate swap. The fair value of the swaps was determined using observable market inputs (Level 2). The swaps were terminated in the third quarter of 2008, and the company did not hold any derivative financial instruments during 2009.
Income Taxes. Income taxes are accounted for under the asset and liability method. Deferred tax assets and liabilities are recognized for the future tax consequences attributable to differences between the financial statement carrying amounts of existing assets and liabilities and their respective tax bases and operating loss and tax credit carryforwards. Deferred tax assets and liabilities are measured using enacted tax rates expected to apply to taxable income in the years in which those temporary differences are expected to be recovered or settled. The effect on deferred tax assets and liabilities of a change in tax rates is recognized in income from continuing operations in the period that includes the enactment date. Valuation allowances are provided if it is more likely than not that a deferred tax asset will not be realized. When the company has claimed tax benefits that may be challenged by a tax authority, an estimate of the effect of these uncertain tax positions is recorded. It is the company’s policy to provide for uncertain tax positions and the related interest and penalties based upon management’s assessment of whether a tax benefit is more likely than not to be sustained upon examination by tax authorities. To the extent that the tax outcome of these uncertain tax positions changes, based on management’s assessment, such changes in estimate may impact the income tax provision in the period in which such determination is made.
Fair Value Measurements. Fair value is determined based on assumptions that a market participant would use in pricing an asset or liability. The assumptions used are in accordance with a three-tier hierarchy, defined by GAAP, that draws a distinction between market participant assumptions based on (i) observable inputs such as quoted prices in active markets (Level 1), (ii) inputs other than quoted prices in active markets that are observable either directly or indirectly (Level 2) and (iii) unobservable inputs that require the company to use present value and other valuation techniques in the determination of fair value (Level 3).
The carrying amounts of cash and cash equivalents, accounts receivable and accounts payable reported in the consolidated balance sheets approximate fair value due to the short-term nature of these instruments. Property held for sale is reported at estimated fair value less selling costs with fair value determined based on recent sales prices for comparable properties in similar locations (Level 2). The fair value of the company’s long-term debt is estimated based on quoted market prices or dealer quotes for the identical liability when traded as an asset in an active market (Level 1) or, if quoted market prices or dealer quotes are not available, on the borrowing rates currently available to the company for loans with similar terms and average maturities (Level 2). See Notes 7, 10 and 11 for the fair value of the company’s property held for sale, debt instruments and interest rate swaps.
Recent Accounting Pronouncements
In 2009, the company adopted Financial Accounting Standards Board (FASB) Statement of Financial Accounting Standard (SFAS) No. 168, The FASB Accounting Standards Codification and the Hierarchy of Generally Accepted Accounting Principles, a replacement of FASB Statement No. 162. This statement modified the GAAP hierarchy by establishing only two levels of GAAP, authoritative and nonauthoritative accounting literature. Effective July 1, 2009, the FASB Accounting Standards Codification (ASC), became the single source
36
Table of Contents
OWENS & MINOR, INC. AND SUBSIDIARIES
Notes to Consolidated Financial Statements—(Continued)
(in thousands unless otherwise indicated)
of authoritative U.S. accounting and reporting standards, except for additional authoritative rules and interpretive releases issued by the SEC. The adoption of the ASC had no impact on the company’s financial position and results of operations.
On January 1, 2007, the company adopted authoritative guidance that is now codified as ASC 740, Income Taxes. This guidance prescribes a recognition threshold and measurement attribute for the financial statement recognition and measurement of a tax position taken or expected to be taken in a tax return. As a result of the implementation of this guidance, the company recognized a decrease of approximately $0.8 million in its liability for unrecognized tax benefits, which was accounted for as an increase to the January 1, 2007, balance of retained earnings.
On January 1, 2009, the company adopted FASB authoritative guidance that expands the definition of a business combination and requires acquisitions to be accounted for at fair value, including the value of contingent consideration, in-process research and development, and acquisition contingencies. Additional guidance adopted on the same date addressed the initial recognition, measurement and subsequent accounting for assets and liabilities arising from contingencies in a business combination. The adoption of this authoritative guidance had no impact on the company’s accounting and disclosure practices for 2009, as the guidance was applied prospectively, and the company did not complete any business combinations during 2009. The adoption of this guidance will have an impact on the company’s accounting and disclosure practices for any future business combinations.
On January 1, 2009, the company adopted FASB authoritative guidance that amended the factors that should be considered in developing renewal or extension assumptions used to determine the useful life of a recognized intangible asset. The adoption of this guidance had no impact on the company’s financial position and results of operations.
On January 1, 2009, the company adopted FASB authoritative guidance that addressed whether instruments granted in share-based payment transactions are participating securities prior to vesting and, therefore, are included in the earnings allocation in computing earnings per share under the two-class method. The adoption of this guidance decreased previously reported income from continuing operations per basic share and net income per basic share by $0.02 and $0.01 for the years ended December 31, 2008 and 2007.
In the second quarter of 2009, the company adopted FASB authoritative guidance that established requirements for the accounting for and disclosure of events that occur after the balance sheet date, but before the financial statements are issued or available to be issued. The adoption of this guidance had no impact on the company’s financial position or results of operations for the year ended December 31, 2009.
In the third quarter of 2009, the company adopted an ASC update that provided additional implementation guidance related to uncertainty in income taxes. The adoption of this update had no impact on the company’s financial position and results of operations.
In the fourth quarter of 2009, the company adopted an ASC update for fair value measurements and disclosures. The update provided guidance regarding circumstances in which a quoted price in an active market for an identical liability is not available and allows for a reporting entity to measure fair value using one or more techniques, including the quoted price of an identical liability when traded as an asset. The adoption of this update had no impact on the company’s financial position and results of operations.
37
Table of Contents
OWENS & MINOR, INC. AND SUBSIDIARIES
Notes to Consolidated Financial Statements—(Continued)
(in thousands unless otherwise indicated)
For the year ended December 31, 2009, the company adopted FASB authoritative guidance requiring disclosures about retirement plan assets, including information about how investment allocation decisions are made, the major categories of plan assets, the inputs and valuation techniques used to measure plan assets, the effect of fair value measurements using significant unobservable inputs on changes in plan assets and significant concentrations of risk within plan assets.
For the year ended December 31, 2009, the company adopted an ASC update for fair value measurements and disclosures related to certain alternative investments. This guidance permits the use of a qualifying investment’s net asset value per share to estimate fair value, as a practical expedient to measuring fair value. The update also requires additional disclosures by major category of investment about the nature and risks of investments within its scope that are measured at fair value on a recurring or nonrecurring basis. This update is effective for the company for the year ended December 31, 2009. The adoption of this update had no impact on the company’s financial position and results of operations.
In the fourth quarter of 2009, the FASB updated the ASC topic for multiple-deliverable revenue arrangements. The update requires entities to allocate revenue in an arrangement using estimated selling prices of the delivered goods and services based on a selling price hierarchy. The update eliminates the residual method of revenue allocation and requires revenue to be allocated using the relative selling price method. The company is required to adopt this update as of January 1, 2011, with early adoption permitted. The company is evaluating the impact of adoption of this update on its consolidated financial position and results of operations.
Note 2—Significant Risks and Uncertainties
The company has limited concentrations of credit risk with respect to financial instruments. Temporary cash investments are placed with high-credit-quality institutions, and concentrations within accounts and notes receivable are limited due to their geographic dispersion.
Many of the company’s hospital customers are represented by group purchasing organizations (GPOs) that contract with the company for distribution services on behalf of the GPO’s members. GPOs representing a significant portion of the company’s business are Novation, LLC (Novation), Premier Purchasing Partners, L.P. (Premier), and Broadlane, Inc. (Broadlane). Revenue from member hospitals under contract with Novation totaled $3.0 billion in 2009, $2.8 billion in 2008, and $2.7 billion in 2007, which is approximately 37%, 38%, and 41% of the company’s revenue. Revenue from member hospitals under contract with Premier totaled $1.6 billion in 2009, $1.5 billion in 2008 and $1.3 billion in 2007, or approximately 20% of the company’s revenue for each year. Revenue from member hospitals under contract with Broadlane totaled $0.9 billion in 2009 and 2008, and $0.8 billion in 2007, or approximately 12% of the company’s revenue for each year. Members of Novation, Premier and Broadlane have incentives to purchase from their primary selected distributor; however, they operate independently and are free to negotiate directly with distributors and manufacturers.
Sales of products supplied by Covidien accounted for approximately 14% for both 2009 and 2008, of the company’s revenue. Sales of products supplied by Johnson & Johnson Health Care Systems, Inc. were approximately 10% and 11% of the company’s revenue for 2009 and 2008.
Note 3—Acquisitions of Businesses
On October 1, 2008, the company acquired certain assets and liabilities of The Burrows Company (Burrows), a Chicago-based, privately-held distributor of medical and surgical supplies to the acute-care market,
38
Table of Contents
OWENS & MINOR, INC. AND SUBSIDIARIES
Notes to Consolidated Financial Statements—(Continued)
(in thousands unless otherwise indicated)
and entered into an agreement to purchase certain real property used in the operation of the business. The acquisition cost was approximately $90.6 million, including transaction costs, comprised of $17.5 million of cash paid at acquisition, net of a $7.0 million purchase price adjustment receivable at December 31, 2008, $56.1 million of assumed debt which was satisfied in full on the acquisition date, and $17.0 million cash paid in December 2008 for the real property. The acquisition was financed with borrowings under the company’s revolving credit facility and available cash.
The group of assets acquired constitutes a business; therefore, the acquisition was accounted for as a business combination. The acquired assets and liabilities were recorded based on their estimated fair values as of the acquisition date. During the third quarter of 2009, the company finalized its allocation of the purchase price, including the values assigned to real property, acquired customer relationships, a non-compete agreement, involuntary termination costs, and lease exit liabilities. These adjustments resulted in a $5.1 million decrease in goodwill. Approximately $14.4 million of the purchase price has been allocated to goodwill, all of which is deductible for tax purposes over 15 years. The following table presents the adjusted purchase price allocation of the estimated fair values of the assets acquired and liabilities assumed as of the acquisition date:
| Purchase allocation |
|||
| Assets acquired |
|||
| Accounts receivable |
$ | 37,484 | |
| Inventory |
58,164 | ||
| Other current assets |
292 | ||
| Property and equipment |
2,094 | ||
| Property held for sale |
15,150 | ||
| Intangible assets |
13,900 | ||
| Goodwill |
14,425 | ||
| Total assets acquired |
141,509 | ||
| Liabilities assumed |
|||
| Current liabilities |
51,411 | ||
| Total liabilities assumed |
51,411 | ||
| Net assets acquired, less cash assumed |
$ | 90,098 | |
The results of operations of the acquired business are included in the company’s financial statements as of the acquisition date. The unaudited pro forma impact of the acquisition, as if the acquisition had been completed as of the beginning of each year, is an increase of less than 10% of consolidated revenues for 2008 and 2007. The unaudited pro forma impact of the acquisition on income from continuing operations and income from continuing operations per diluted common share for 2008 and 2007 is not material.
Note 4—Discontinued Operations
In January 2009, the company sold certain assets of the DTC business to Liberty Healthcare Group, Inc., a subsidiary of Medco Health Solutions, Inc. for $63.0 million in cash and recognized a gain on sale of $3.2 million.
39
Table of Contents
OWENS & MINOR, INC. AND SUBSIDIARIES
Notes to Consolidated Financial Statements—(Continued)
(in thousands unless otherwise indicated)
The following table provides summary financial information for the DTC business for the years ended December 31, 2009, 2008, and 2007:
| December 31, |
2009 | 2008 | 2007 | |||||||||
| Revenue |
$ | — | $ | 94,417 | $ | 105,870 | ||||||
| Income (loss) from discontinued operations before income taxes |
$ | (19,570 | ) | $ | (12,487 | ) | $ | 2,597 | ||||
| Income tax benefit (expense) |
7,369 | 4,557 | (1,298 | ) | ||||||||
| Income (loss) from discontinued operations |
$ | (12,201 | ) | $ | (7,930 | ) | $ | 1,299 | ||||
The company incurred charges associated with exiting the DTC business during 2009 related to the valuation of accounts receivable, as the company entered into an agreement with a third party during 2009 to pursue collection of remaining accounts receivable; losses on the disposal of other remaining assets; costs associated with leased facilities; and payroll costs, including severance. The company incurred charges totaling $7.8 million in 2008 for costs associated with exiting the DTC business, including abandoned software, employee severance and accrued contract termination costs. No debt was required to be repaid as a result of the sale. The company elected not to allocate a portion of consolidated interest expense to discontinued operations.
The assets and liabilities of the discontinued DTC business reflected on the consolidated balance sheets at December 31, 2009 and 2008, are as follows:
| December 31, |
2009 | 2008 | ||||
| Accounts and notes receivable, net |
$ | — | $ | 26,606 | ||
| Merchandise inventories |
— | 4,549 | ||||
| Other current assets |
— | 1,044 | ||||
| Current assets of discontinued operations |
$ | — | $ | 32,199 | ||
| Property and equipment, net |
— | 2,633 | ||||
| Goodwill |
— | 38,852 | ||||
| Intangible assets, net |
— | 6,611 | ||||
| Direct response advertising costs, net |
— | 13,937 | ||||
| Other assets, net |
— | 325 | ||||
| Other assets of discontinued operations |
$ | — | $ | 62,358 | ||
| Accounts payable |
— | 5,294 | ||||
| Accrued payroll and related liabilities |
— | 3,494 | ||||
| Other accrued liabilities |
1,939 | 2,250 | ||||
| Current liabilities of discontinued operations |
$ | 1,939 | $ | 11,038 | ||
Prior to exiting the DTC business, the company deferred certain direct-response advertising costs that met capitalization requirements. The company amortized these costs over a four-year period on an accelerated basis. The company’s ability to realize the value of these assets was evaluated periodically by comparing the carrying amounts of the assets to the future net revenues expected to result from sales to customers obtained through the advertising.
40
Table of Contents
OWENS & MINOR, INC. AND SUBSIDIARIES
Notes to Consolidated Financial Statements—(Continued)
(in thousands unless otherwise indicated)
The following table presents the activity in capitalized direct-response advertising for the years ended December 31, 2009 and 2008:
| 2009 | 2008 | |||||||
| Beginning, capitalized direct-response advertising, net |
$ | 13,937 | $ | 10,469 | ||||
| Deferred direct-response advertising costs |
— | 10,886 | ||||||
| Amortization |
— | (7,418 | ) | |||||
| Write-off on sale of DTC assets |
(13,937 | ) | — | |||||
| Ending, capitalized direct-response advertising, net |
$ | — | $ | 13,937 | ||||
Note 5—Accounts and Notes Receivable, Net
Allowances for losses on accounts and notes receivable of $16.4 million, $14.8 million and $13.3 million have been applied as reductions of accounts receivable at December 31, 2009, 2008, and 2007. Write-offs of accounts and notes receivable were $2.4 million, $2.8 million and $3.0 million for 2009, 2008 and 2007.
Note 6—Merchandise Inventories
At December 31, 2009 and 2008, the company had inventory of $689.9 million and $679.1 million. If LIFO inventories had been valued on a current cost or first-in, first-out (FIFO) basis, they would have been greater by $81.9 million and $79.2 million as of December 31, 2009 and 2008.
Note 7—Property and Equipment
Property and equipment consists of the following:
| December 31, |
2009 | 2008 | ||||||
| Warehouse equipment |
$ | 57,884 | $ | 51,361 | ||||
| Computer equipment |
32,665 | 31,503 | ||||||
| Building and improvements |
25,128 | 23,587 | ||||||
| Leasehold improvements |
15,613 | 11,758 | ||||||
| Land and improvements |
13,759 | 13,246 | ||||||
| Furniture and fixtures |
10,586 | 10,110 | ||||||
| Office equipment and other |
5,904 | 6,596 | ||||||
| 161,539 | 148,161 | |||||||
| Accumulated depreciation and amortization |
(76,574 | ) | (71,212 | ) | ||||
| Property and equipment, net |
$ | 84,965 | $ | 76,949 | ||||
Depreciation and amortization expense for property and equipment was $15.6 million, $13.9 million, and $12.7 million for the years ended December 31, 2009, 2008, and 2007.
Property held for sale of $11.5 million and $15.7 million at December 31, 2009 and 2008 is included in other assets, net, in the consolidated balance sheets. The company is actively marketing the property for sale within one year, however the ultimate timing is dependent on local market conditions.
41
Table of Contents
OWENS & MINOR, INC. AND SUBSIDIARIES
Notes to Consolidated Financial Statements—(Continued)
(in thousands unless otherwise indicated)
Note 8—Goodwill and Intangible Assets
The following table presents the activity in goodwill for the years ended December 31, 2009 and 2008:
| Balance, December 31, 2007 |
$ | 232,846 | ||
| Additions due to acquisitions |
19,566 | |||
| Balance, December 31, 2008 |
252,412 | |||
| Reduction due to purchase price allocation adjustments |
(5,141 | ) | ||
| Balance, December 31, 2009 |
$ | 247,271 | ||
Intangible assets at December 31, 2009 and 2008, are as follows:
| 2009 | 2008 | |||||||||||||||
| Customer Relationships |
Other Intangibles |
Customer Relationships |
Other Intangibles |
|||||||||||||
| Gross intangible assets |
$ | 31,300 | $ | 4,631 | $ | 29,183 | $ | 4,131 | ||||||||
| Accumulated amortization |
(5,187 | ) | (2,935 | ) | (3,513 | ) | (1,999 | ) | ||||||||
| Net intangible assets |
$ | 26,113 | $ | 1,696 | $ | 25,670 | $ | 2,132 | ||||||||
| Weighted average useful life |
15 years | 5 years | 15 years | 5 years | ||||||||||||
Amortization expense for intangible assets was $3.0 million, $2.1 million, and $2.4 million for the years ended December 31, 2009, 2008, and 2007.
Based on the current carrying value of intangible assets subject to amortization, estimated future amortization expense for the next five years is as follows: 2010—$3.0 million; 2011—$2.8 million; 2012—$2.1 million; 2013—$2.1 million; 2014—$2.1 million.
Note 9—Accounts Payable
Accounts payable consists of the following:
| December 31, |
2009 | 2008 | ||||
| Accounts payable—trade |
$ | 438,689 | $ | 457,444 | ||
| Drafts payable |
108,300 | 55,582 | ||||
| Total |
$ | 546,989 | $ | 513,026 | ||
Drafts payable are checks written in excess of bank balances to be funded upon clearing the bank.
42
Table of Contents
OWENS & MINOR, INC. AND SUBSIDIARIES
Notes to Consolidated Financial Statements—(Continued)
(in thousands unless otherwise indicated)
Note 10—Debt
Debt consists of the following:
| December 31, |
2009 | 2008 | ||||||||||||||
| Carrying Amount |
Estimated Fair Value |
Carrying Amount |
Estimated Fair Value |
|||||||||||||
| 6.35% Senior Notes, $200 million par value, maturing April 2016 |
$ | 205,682 | $ | 196,250 | $ | 206,579 | $ | 174,250 | ||||||||
| Revolving credit facility with interest based on London Interbank Offered Rate (LIBOR), Federal Funds Rate or Prime Rate, expires May 2011, credit limit of $306 million |
— | — | 150,578 | 150,578 | ||||||||||||
| Capital leases |
4,236 | 4,236 | 3,847 | 3,847 | ||||||||||||
| Other |
999 | 999 | 999 | 999 | ||||||||||||
| Total debt |
210,917 | 201,485 | 362,003 | 329,674 | ||||||||||||
| Less current maturities |
(2,499 | ) | (2,499 | ) | (2,766 | ) | (2,766 | ) | ||||||||
| Long-term debt |
$ | 208,418 | $ | 198,986 | $ | 359,237 | $ | 326,908 | ||||||||
At December 2009 and 2008, the company had $200 million of 6.35% Senior Notes outstanding, which mature on April 15, 2016 (Senior Notes). Interest on the Senior Notes is payable semi-annually on April 15 and October 15. The Senior Notes are redeemable at the company’s option, subject to certain restrictions, and are unconditionally guaranteed on a joint and several basis by certain subsidiaries of the company.
The company has a $306 million revolving credit facility which expires on May 3, 2011. In July 2008, the company amended its credit facility to change certain restrictions and to release certain guarantors. The interest rate of the amended facility is based on, at the company’s discretion, the London Interbank Offered Rate (LIBOR), the Federal Funds Rate or the Prime Rate, plus an adjustment based on the company’s leverage ratio. The company is charged a commitment fee of between 0.05% and 0.15% on the unused portion of the facility. The terms of the agreement limit the amount of indebtedness that the company may incur, require the company to maintain certain levels of net worth, leverage ratio and fixed charge coverage ratio, and restrict the ability of the company to materially alter the character of the business through consolidation, merger, or purchase or sale of assets.
The company’s revolving credit facility and Senior Notes contain cross-default provisions which could result in the acceleration of payments due in the event of default of either agreement. At December 31, 2009, the company was in compliance with its debt covenants.
Cash payments for interest during 2009, 2008 and 2007 were $13.2 million, $12.9 million and $23.5 million.
At December 31, 2009, the company had no borrowings and letters of credit of $10.9 million outstanding on the revolving credit facility, leaving $295.1 million available for borrowing. At December 31, 2009, the company had long-term debt of $2.5 million due within the next five years, excluding capital lease obligations. Future minimum capital lease payments, net of interest, for the five years subsequent to December 31, 2009, are $1.4 million in 2010, $1.1 million in 2011, $0.6 million in 2012, $0.4 million in 2013, and $0.2 million in 2014.
43
Table of Contents
OWENS & MINOR, INC. AND SUBSIDIARIES
Notes to Consolidated Financial Statements—(Continued)
(in thousands unless otherwise indicated)
Note 11—Derivative Financial Instruments
In April 2006, in conjunction with the issuance of the Senior Notes, the company entered into interest rate swap agreements of $100 million notional amounts, under which the company paid counterparties a variable rate based on LIBOR, and the counterparties paid the company a fixed interest rate of 6.35%, effectively converting one-half of the Senior Notes to variable-rate debt. The swaps were designated as a fair value hedge of a portion of the Senior Notes using the shortcut method, as both the swaps and the Senior Notes met all of the conditions for the use of this method. Accordingly, no net gains or losses were recorded on the consolidated statements of income related to the company’s underlying debt and interest rate swap agreements. The fair value of the swaps was determined using observable market inputs (Level 2).
During 2008, Lehman Brothers Holdings, Inc., guarantor of one of the interest rate swaps, declared bankruptcy. The company determined at that date that the swaps were no longer expected to be effective in offsetting interest rate risk. The company discontinued accounting for the swaps as a fair value hedge as of that date. The company terminated the swaps in the third quarter of 2008 and received proceeds of $3.8 million, plus accrued interest of $0.9 million. The company realized a loss of $3.1 million, included in interest expense, net, in 2008. This loss represents the difference between the fair value of the swaps as of the date that hedge accounting was discontinued and the proceeds received on the termination of the swaps. The fair value adjustment of $6.9 million to the carrying value of the related debt, recorded prior to the discontinuance of hedge accounting, is being recognized as an offset to interest expense using the interest method over the remaining life of the debt.
The company had no interest rate swap agreements or other derivative financial instruments at December 31, 2009 and 2008.
Note 12—Share-Based Compensation
The company maintains a share-based compensation plan (Plan) that provides for the granting of equity-based compensation. The Plan is administered by the Compensation and Benefits Committee of the Board of Directors and allows the company to award or grant to officers, directors and employees incentive, non-qualified and deferred compensation stock options, stock appreciation rights (SARs), performance shares and restricted and unrestricted stock. The company uses authorized and unissued common shares for grants of restricted stock or for stock option exercises. At December 31, 2009, approximately 1.8 million common shares were available for issuance under the Plan.
Restricted stock awarded under the Plan generally vests over one, three or five years. Certain restricted stock grants contain accelerated vesting provisions, based on the satisfaction of certain performance criteria related to the achievement of certain financial and operational results. At December 31, 2009, there were no SARs outstanding. Stock options awarded under the Plan are generally subject to graded vesting over three years and expire seven to ten years from the date of grant. The options are granted at a price equal to fair market value at the date of grant.
The company has a Management Equity Ownership Program that requires each of the company’s officers to own the company’s common stock at specified levels, which gradually increase over five years. Officers and certain other employees who meet specified ownership goals in a given year are awarded restricted stock or performance shares under the provisions of the program. Upon issuance of restricted stock, unearned compensation is charged to shareholders’ equity for the market value of the shares and recognized ratably over the vesting period as compensation expense.
44
Table of Contents
OWENS & MINOR, INC. AND SUBSIDIARIES
Notes to Consolidated Financial Statements—(Continued)
(in thousands unless otherwise indicated)
The following table summarizes the activity and terms of outstanding options at December 31, 2009, and for each of the years in the three-year period then ended:
| Number of Options (000’s) |
Weighted Average Exercise Price (per share) |
Weighted Average Remaining Contractual Life (years) |
Aggregate Intrinsic Value (millions) | ||||||||
| Options outstanding at December 31, 2006 |
1,780 | $ | 23.05 | ||||||||
| Granted |
408 | 36.03 | |||||||||
| Exercised |
(471 | ) | 18.74 | ||||||||
| Forfeited |
(58 | ) | 32.41 | ||||||||
| Options outstanding at December 31, 2007 |
1,659 | $ | 27.14 | ||||||||
| Exercised |
(382 | ) | 23.43 | ||||||||
| Forfeited |
(23 | ) | 33.53 | ||||||||
| Options outstanding at December 31, 2008 |
1,254 | $ | 28.15 | ||||||||
| Exercised |
(316 | ) | 20.88 | ||||||||
| Forfeited |
(1 | ) | 34.00 | ||||||||
| Options outstanding at December 31, 2009 |
937 | $ | 30.59 | 3.83 | $ | 11.6 | |||||
| Vested or expected to vest at December 31, 2009 |
928 | $ | 30.54 | 3.82 | $ | 11.5 | |||||
| Exercisable at December 31, 2009 |
847 | $ | 30.01 | 3.77 | $ | 10.9 | |||||
At December 31, 2009, the following option groups were outstanding:
| Outstanding | Exercisable | |||||||||||||
| Range of Exercise Prices (per share) |
Number of Options (000’s) |
Weighted Average Exercise Price (per share) |
Weighted Average Remaining Contractual Life (years) |
Number of Options (000’s) |
Weighted Average Exercise Price (per share) |
Weighted Average Remaining Contractual Life (years) | ||||||||
| $11.94—20.00 |
60 | $ | 18.19 | 2.10 | 60 | $ | 18.19 | 2.10 | ||||||
| $20.01—25.00 |
148 | 24.50 | 2.04 | 148 | 24.50 | 2.04 | ||||||||
| $25.01—30.00 |
234 | 29.61 | 4.77 | 234 | 29.61 | 4.77 | ||||||||
| $30.01—35.00 |
209 | 32.06 | 4.09 | 206 | 32.03 | 4.08 | ||||||||
| $35.01—40.00 |
286 | 36.08 | 4.15 | 199 | 36.06 | 4.08 | ||||||||
| 937 | $ | 30.59 | 3.83 | 847 | $ | 30.01 | 3.77 | |||||||
The total intrinsic value of options exercised during the years ended December 31, 2009, 2008, and 2007, was $6.5 million, $8.2 million, and $10.4 million. The weighted average fair value of options granted was $9.12 per share for the year ended December 31, 2007. No options were granted in 2008 or 2009.
The grant-date fair value of each option grant is estimated using the Black-Scholes option pricing model. Use of a valuation model requires management to make certain assumptions with respect to selected model inputs. Expected volatility is calculated based on the historical volatility of the company’s stock over the most recent period of time equal to the expected term of the option. The average expected life is based on the
45
Table of Contents
OWENS & MINOR, INC. AND SUBSIDIARIES
Notes to Consolidated Financial Statements—(Continued)
(in thousands unless otherwise indicated)
contractual term of the option and expected employee exercise and post-vesting employment termination behavior based on historical patterns. The risk-free interest rate is based on U.S. Treasury zero-coupon issues with a remaining term equal to the expected life assumed at the date of grant. Forfeitures are estimated based on historical voluntary termination behavior, as well as an analysis of actual option forfeitures. The following table summarizes the assumptions used to determine the fair value of options granted during 2007:
| Expected term |
5.0 -5.9 years | |
| Expected volatility |
24.9% -26.7% | |
| Expected dividend yield |
1.9% | |
| Risk-free interest rate |
4.02% -5.13% |
The following table summarizes the activity and value of nonvested restricted stock for the years ended December 31, 2009, 2008 and 2007:
| 2009 | 2008 | 2007 | ||||||||||||||||
| Number of Shares (000’s) |
Weighted Average Grant-date Value (per share) |
Number of Shares (000’s) |
Weighted Average Grant-date Value (per share) |
Number of Shares (000’s) |
Weighted Average Grant-date Value (per share) | |||||||||||||
| Nonvested shares at beginning of year |
489 | $ | 37.98 | 368 | $ | 31.95 | 301 | $ | 28.25 | |||||||||
| Granted |
211 | 34.40 | 232 | 43.46 | 134 | 35.17 | ||||||||||||
| Vested |
(96 | ) | 21.26 | (89 | ) | 30.76 | (46 | ) | 23.31 | |||||||||
| Forfeited |
(18 | ) | 38.91 | (22 | ) | 35.90 | (21 | ) | 31.15 | |||||||||
| Nonvested shares at end of year |
586 | $ | 37.50 | 489 | $ | 37.98 | 368 | $ | 31.95 | |||||||||
The total value of restricted stock vesting during the years ended December 31, 2009, 2008, and 2007, was $2.1 million, $2.7 million, and $1.1 million.
Total share-based compensation expense for December 31, 2009, 2008, and 2007, was $7.0 million, $7.6 million, and $5.8 million, with recognized tax benefits of $2.7 million, $2.9 million, and $2.3 million. The total unrecognized compensation cost related to nonvested awards was $8.7 million, expected to be recognized over a weighted-average period of 2.0 years at December 31, 2009.
Note 13—Retirement Plans
Savings and Retirement Plans. The company maintains a voluntary 401(k) savings and retirement plan covering substantially all full-time employees who have completed one month of service and have attained age 18. The company matches a certain percentage of each employee’s contribution. The plan also provides for a minimum contribution by the company to the plan for all eligible employees of 1% of their salary, subject to certain limits. This contribution can be increased at the company’s discretion. The company incurred $9.3 million, $8.1 million, and $7.7 million of expense related to this plan in 2009, 2008, and 2007.
Additionally, a 401(k) plan was offered to employees of the DTC business. In connection with exiting the DTC business in 2009, the company began the process of terminating this plan. This plan was voluntary to all full-time and part-time employees of this business who had completed three months of service, attained age 18 and met certain other criteria. The company matched a certain percentage of each employee’s contribution and made additional discretionary contributions to eligible employees.
46
Table of Contents
OWENS & MINOR, INC. AND SUBSIDIARIES
Notes to Consolidated Financial Statements—(Continued)
(in thousands unless otherwise indicated)
Pension Plan. In December 2009, the company’s Board of Directors approved a plan to fund and terminate the company’s noncontributory defined benefit pension plan (the Pension Plan). The plan covers substantially all employees who had earned benefits as of December 31, 1996. On that date, substantially all of the benefits of employees under this plan were frozen, with all participants becoming fully vested. Termination of the plan must be approved by the Internal Revenue Service and the Pension Benefit Guaranty Corporation. The company expects to make cash contributions to the plan in the range of $8.0 million to $13.0 million through the final termination, which is targeted to be in 2011. The company contributed $1.5 million to the plan in 2009.
The objective of the company’s investment policy for the management of the assets of the Pension Plan has been to achieve an adequate rate of return to satisfy the obligations of the plan while keeping long-term risk to an acceptable level. In preparation for the final termination and distribution, the company has adjusted the Pension Plan’s target asset allocation to provide the necessary liquidity for settlement of the plan’s benefit obligations. As of December 31, 2009 and 2008, the Pension Plan’s assets consisted of the following types of investments, compared to the target allocation:
| December 31, |
2009 | 2008 | ||||||||||
| Actual | Target | Actual | Target | |||||||||
| Cash and cash equivalents |
67 | % | 67 | % | — | % | — | % | ||||
| Equity securities |
5 | 6 | 41 | 45 | ||||||||
| Debt securities |
— | — | 29 | 25 | ||||||||
| Alternative investment funds |
28 | 27 | 30 | 30 | ||||||||
| Total |
100 | % | 100 | % | 100 | % | 100 | % | ||||
The major categories of assets held by the Pension Plan and measured at fair value as of December 31, 2009 and 2008 are as follows:
| December 31, |
2009 | 2008 | ||||
| Level 1: |
||||||
| Cash and cash equivalents |
$ | 17,784 | $ | 2,770 | ||
| Mutual funds—equity |
— | 7,715 | ||||
| Mutual funds—fixed-income |
— | 6,318 | ||||
| Common stock |
1,479 | 1,297 | ||||
| Level 3: |
||||||
| Alternative investment funds |
7,430 | 6,494 | ||||
| Total investments |
$ | 26,693 | $ | 24,594 | ||
Common stock investments consist of 34,444 shares of the company’s common stock, representing 5% and 6% of total plan assets at December 31, 2009 and 2008, which are valued at the closing price reported on the New York Stock Exchange. Equity and fixed income mutual funds are valued at the net asset value of shares held by the plan. Alternative investment funds are valued at the plan’s proportionate share of the net asset value of the fund, adjusted for significant restrictions on redemption and other factors, as applicable. Assets valued at net asset value met the criteria for use of net asset value as a practical expedient to estimating fair value at December 31, 2009 and 2008. The investment objective of equity mutual funds is long-term capital appreciation with current income. The investment objective of fixed-income mutual funds is to maximize investment return while preserving investment principal.
47
Table of Contents
OWENS & MINOR, INC. AND SUBSIDIARIES
Notes to Consolidated Financial Statements—(Continued)
(in thousands unless otherwise indicated)
The table below sets forth a summary of changes in the fair value of the Pension Plan’s Level 3 assets for the year ended December 31, 2009:
| Alternative Investment Funds | |||
| Balance, beginning of year |
$ | 6,494 | |
| Unrealized gains |
936 | ||
| Balance, end of year |
$ | 7,430 | |
At December 31, 2009, the Level 3 assets held by the Pension Plan consisted of multi-strategy funds with a fair value of $7.4 million. The company is permitted to redeem its ownership interest from each of the funds at the end of each quarter, with 95 days advance notice. Multi-strategy funds invest in funds of funds, including hedge funds that pursue multiple strategies to diversify risks and reduce volatility. As of December 31, 2009, the company had requested redemption of the plan’s ownership interest in each of these alternative investment funds.
Retirement Plan. The company also has a noncontributory, unfunded retirement plan for certain officers and other key employees. Benefits are based on a percentage of the employees’ compensation.
48
Table of Contents
OWENS & MINOR, INC. AND SUBSIDIARIES
Notes to Consolidated Financial Statements—(Continued)
(in thousands unless otherwise indicated)
The following table sets forth the plans’ financial status and the amounts recognized in the company’s consolidated balance sheets:
| Pension Plan | Retirement Plan | |||||||||||||||
| December 31, |
2009 | 2008 | 2009 | 2008 | ||||||||||||
| Change in benefit obligation |
||||||||||||||||
| Benefit obligation, beginning of year |
$ | 31,022 | $ | 30,641 | $ | 27,628 | $ | 26,733 | ||||||||
| Service cost |
— | — | 1,206 | 1,233 | ||||||||||||
| Interest cost |
1,853 | 1,833 | 1,630 | 1,584 | ||||||||||||
| Actuarial loss (gain) |
4,564 | (88 | ) | 811 | (633 | ) | ||||||||||
| Benefits paid |
(1,398 | ) | (1,364 | ) | (1,364 | ) | (1,289 | ) | ||||||||
| Benefit obligation, end of year |
$ | 36,041 | $ | 31,022 | $ | 29,911 | $ | 27,628 | ||||||||
| Change in plan assets |
||||||||||||||||
| Fair value of plan assets, beginning of year |
$ | 21,841 | $ | 29,209 | $ | — | $ | — | ||||||||
| Actual return on plan assets |
4,750 | (7,504 | ) | — | — | |||||||||||
| Employer contribution |
1,500 | 1,500 | 1,364 | 1,289 | ||||||||||||
| Benefits paid |
(1,398 | ) | (1,364 | ) | (1,364 | ) | (1,289 | ) | ||||||||
| Fair value of plan assets, end of year |
$ | 26,693 | $ | 21,841 | $ | — | $ | — | ||||||||
| Funded status at December 31 |
$ | (9,348 | ) | $ | (9,181 | ) | $ | (29,911 | ) | $ | (27,628 | ) | ||||
| Amounts recognized in the consolidated balance sheets |
||||||||||||||||
| Other accrued liabilities |
$ | — | $ | — | $ | (1,414 | ) | $ | (1,390 | ) | ||||||
| Other liabilities |
(9,348 | ) | (9,181 | ) | (28,497 | ) | (26,238 | ) | ||||||||
| Accumulated other comprehensive loss |
16,020 | 15,104 | 5,859 | 5,323 | ||||||||||||
| Net amount recognized |
$ | 6,672 | $ | 5,923 | $ | (24,052 | ) | $ | (22,305 | ) | ||||||
| Accumulated benefit obligation |
$ | 36,041 | $ | 31,022 | $ | 26,657 | $ | 24,452 | ||||||||
| Weighted average assumptions used to determine benefit obligation |
||||||||||||||||
| Discount rate |
5.00 | % | 6.20 | % | 5.75 | % | 6.20 | % | ||||||||
| Rate of increase in compensation levels |
— | — | 5.5 | % | 5.5 | % | ||||||||||
Plan assets and benefit obligations were measured as of December 31 for each year presented. Benefit obligations are determined using assumptions developed at the end of each year. The weighted average discount rate, which is used to calculate the present value of plan liabilities, is an estimate of the interest rate at which the plan liabilities could be effectively settled at the end of the year. When estimating the discount rate, the company reviews yields available on high-quality, fixed income debt instruments and uses a yield curve model from which the discount rate is derived by applying the projected benefit payments under the plan to points on a published yield curve.
49
Table of Contents
OWENS & MINOR, INC. AND SUBSIDIARIES
Notes to Consolidated Financial Statements—(Continued)
(in thousands unless otherwise indicated)
The components of net periodic pension cost for the Pension and Retirement Plans are as follows:
| Year ended December 31, |
2009 | 2008 | 2007 | |||||||||
| Service cost |
$ | 1,206 | $ | 1,233 | $ | 847 | ||||||
| Interest cost |
3,482 | 3,417 | 3,147 | |||||||||
| Expected return on plan assets |
(1,834 | ) | (1,960 | ) | (1,761 | ) | ||||||
| Amortization of prior service cost |
158 | 158 | 158 | |||||||||
| Recognized net actuarial loss |
851 | 770 | 757 | |||||||||
| Net periodic pension cost |
$ | 3,863 | $ | 3,618 | $ | 3,148 | ||||||
| Weighted average assumptions used to determine net periodic pension cost |
||||||||||||
| Discount rate |
6.20 | % | 6.00 | % | 6.00 | % | ||||||
| Rate of increase in future compensation levels |
5.00 | % | 5.50 | % | 5.50 | % | ||||||
| Expected long-term rate of return on plan assets |
7.00 | % | 7.00 | % | 7.00 | % | ||||||
Net periodic pension cost is determined using assumptions developed at the beginning of each year. To develop the expected long-term rate of return on assets assumption, the company considered the historical returns and the future expectations for returns for each asset class, as well as the target asset allocation of the pension portfolio. The assumption also takes into account expenses that are paid directly by the plan.
Amounts related to the company’s Pension and Retirement Plans recognized as a component of other comprehensive income are as follows:
| Year ended December 31, |
2009 | 2008 | 2007 | |||||||||
| Net actuarial (loss) gain |
$ | (1,451 | ) | $ | (7,817 | ) | $ | 2,298 | ||||
| Deferred tax benefit (expense) |
566 | 3,049 | (896 | ) | ||||||||
| Other comprehensive income, net of tax |
$ | (885 | ) | $ | (4,768 | ) | $ | 1,402 | ||||
Amounts recognized as a component of accumulated other comprehensive loss as of year end that have not been recognized as a component of the net periodic pension cost of the company’s pension and retirement plans are presented in the following table. The company expects to recognize approximately $1.4 million of the net actuarial loss and $0.3 million of the prior service cost reported in the following table as of December 31, 2009, as a component of net periodic pension cost during 2010. If the company receives required approvals to terminate the Pension Plan and settles its obligations under the plan in 2010, the company estimates that it would recognize approximately $16.0 million of the net actuarial loss as a component of net periodic pension cost during 2010.
| Year ended December 31, |
2009 | 2008 | ||||||
| Net actuarial loss |
$ | (21,160 | ) | $ | (19,553 | ) | ||
| Prior service cost |
(717 | ) | (875 | ) | ||||
| Deferred tax benefit |
8,532 | 7,967 | ||||||
| Amounts included in accumulated other comprehensive loss, net of tax |
$ | (13,345 | ) | $ | (12,461 | ) | ||
50
Table of Contents
OWENS & MINOR, INC. AND SUBSIDIARIES
Notes to Consolidated Financial Statements—(Continued)
(in thousands unless otherwise indicated)
As of December 31, 2009, the expected benefit payments required for each of the next five years and the five-year period thereafter for the pension and retirement plans are as follows:
| Year |
Pension Plan |
Retirement Plan | ||||
| 2010 |
$ | 1,622 | $ | 1,454 | ||
| 2011 |
1,703 | 1,497 | ||||
| 2012 |
1,780 | 1,645 | ||||
| 2013 |
1,839 | 1,707 | ||||
| 2014 |
1,905 | 1,827 | ||||
| 2015-2019 |
10,633 | 10,750 | ||||
The total expected cash contribution required to settle the company’s obligations upon termination of the plan is estimated to be in the range of $8.0 million to $13.0 million.
Note 14—Income Taxes
Total income tax expense (benefit) is allocated as follows:
| Year ended December 31, |
2009 | 2008 | 2007 | ||||||||
| Continuing operations |
$ | 71,388 | $ | 63,469 | $ | 46,222 | |||||
| Discontinued operations |
(7,369 | ) | (4,557 | ) | 1,298 | ||||||
| Total income tax expense |
$ | 64,019 | $ | 58,912 | $ | 47,520 | |||||
The income tax provision for continuing operations consists of the following:
| Year ended December 31, |
2009 | 2008 | 2007 | |||||||
| Current tax provision: |
||||||||||
| Federal |
$ | 51,548 | $ | 39,571 | $ | 45,895 | ||||
| State |
8,971 | 6,280 | 6,266 | |||||||
| Total current provision |
60,519 | 45,851 | 52,161 | |||||||
| Deferred tax provision (benefit): |
||||||||||
| Federal |
9,794 | 15,510 | (5,488 | ) | ||||||
| State |
1,075 | 2,108 | (451 | ) | ||||||
| Total deferred provision (benefit) |
10,869 | 17,618 | (5,939 | ) | ||||||
| Total income tax provision |
$ | 71,388 | $ | 63,469 | $ | 46,222 | ||||
A reconciliation of the federal statutory rate to the company’s effective income tax rate for continuing operations is shown below:
| Year ended December 31, |
2009 | 2008 | 2007 | ||||||
| Federal statutory rate |
35.0 | % | 35.0 | % | 35.0 | % | |||
| Increases in the rate resulting from: |
|||||||||
| State income taxes, net of federal income tax impact |
3.5 | 3.3 | 3.2 | ||||||
| Other |
(0.6 | ) | 0.2 | 1.1 | |||||
| Effective income tax rate |
37.9 | % | 38.5 | % | 39.3 | % | |||
51
Table of Contents
OWENS & MINOR, INC. AND SUBSIDIARIES
Notes to Consolidated Financial Statements—(Continued)
(in thousands unless otherwise indicated)
The tax effects of temporary differences that give rise to significant portions of the deferred tax assets and deferred tax liabilities are presented below:
| Year ended December 31, |
2009 | 2008 | ||||||
| Deferred tax assets: |
||||||||
| Employee benefit plans |
$ | 24,844 | $ | 24,047 | ||||
| Allowance for losses on accounts and notes receivable |
12,452 | 7,608 | ||||||
| Accrued liabilities not currently deductible |
10,081 | 10,643 | ||||||
| Finance charges |
8,609 | 8,558 | ||||||
| Intangible assets |
3,100 | 10,788 | ||||||
| Other |
540 | 352 | ||||||
| Total deferred tax assets |
59,626 | 61,996 | ||||||
| Deferred tax liabilities: |
||||||||
| Merchandise inventories |
59,428 | 53,795 | ||||||
| Goodwill |
23,157 | 24,033 | ||||||
| Property and equipment |
7,759 | 2,805 | ||||||
| Insurance |
1,958 | 2,591 | ||||||
| Computer software |
1,555 | 3,161 | ||||||
| Other |
500 | 349 | ||||||
| Direct-response advertising costs |
— | 5,436 | ||||||
| Total deferred tax liabilities |
94,357 | 92,170 | ||||||
| Net deferred tax liability |
$ | (34,731 | ) | $ | (30,174 | ) | ||
At December 31, 2009 and 2008, the company had deferred tax assets related to discontinued operations of $12.6 million and $6.9 million. These significant deferred tax items include allowances for losses on accounts and notes receivable, accrued liabilities not currently deductible, intangible assets, and direct response advertising costs. Upon the sale of the discontinued operations, the tax attributes of the discontinued operations remained with the continuing operations.
Based on management’s judgments using available evidence about future events, management believes it is more likely than not that the company will realize the benefits of the company’s deferred tax assets. The company’s valuation allowance at December 31, 2009 and 2008 and changes in the valuation allowance for 2009, 2008 and 2007 were not material.
Cash payments for income taxes, including interest, for 2009, 2008, and 2007, were $57.3 million, $58.1 million, and $34.2 million.
52
Table of Contents
OWENS & MINOR, INC. AND SUBSIDIARIES
Notes to Consolidated Financial Statements—(Continued)
(in thousands unless otherwise indicated)
At December 31, 2009 and 2008, the liability for unrecognized tax benefits was $21.4 million and $21.1 million. At December 31, 2009, the liability for unrecognized tax benefits of the discontinued operations was approximately $2.5 million. A reconciliation of the changes in unrecognized tax benefits from the beginning to the end of the reporting period is as follows:
| 2009 | 2008 | |||||||
| Unrecognized tax benefits at January 1, |
$ | 21,081 | $ | 18,570 | ||||
| Increases for positions taken during current period |
2,259 | 4,155 | ||||||
| Increases for positions taken during prior periods |
3,237 | 1,054 | ||||||
| Decreases for positions taken during prior periods |
(3,287 | ) | (1,064 | ) | ||||
| Lapse of statute of limitations |
(1,304 | ) | (1,355 | ) | ||||
| Settlements with taxing authorities |
(555 | ) | (279 | ) | ||||
| Unrecognized tax benefit at December 31, |
$ | 21,431 | $ | 21,081 | ||||
Included in the liability for unrecognized tax benefits at December 31, 2009 and 2008, were $18.9 million and $17.9 million of tax positions for which the ultimate deductibility is highly certain but for which there is uncertainty about the timing of such deductibility. These tax positions are temporary differences which do not impact the annual effective tax rate under deferred tax accounting. Any change in the deductibility period of these tax positions would impact the timing of cash payments to taxing jurisdictions. Unrecognized tax benefits of $2.3 million and $4.3 million at December 31, 2009 and 2008, would impact the company’s effective tax rate if recognized.
The company recognizes accrued interest and penalties related to unrecognized tax benefits in income tax expense. Interest accrued at December 31, 2009 and 2008, of $0.5 million and $1.9 million is included in the liability for unrecognized tax benefits. Interest income recognized during 2009 and 2008 was $1.4 million and $0.3 million. Interest expense recognized in 2007 was $1.2 million. There were no penalties accrued at December 31, 2009 or 2008 or recognized in 2009, 2008 and 2007.
Included in the net balance of unrecognized tax benefits at December 31, 2009, is $6.0 million related to tax positions for which it is reasonably possible that the total amounts could significantly change during 2010. This potential change relates to the implementation of changes in accounting method, approved by the IRS in 2009, related to the company’s tax LIFO calculation that will be included in its 2009 federal income tax return when filed. The implementation of these changes will be audited by the IRS.
The company’s 2008 federal income tax return is subject to examination. The company’s income tax returns for state and local jurisdictions are generally open for years 2006 through 2008, but certain returns may be subject to examination for differing periods.
53
Table of Contents
OWENS & MINOR, INC. AND SUBSIDIARIES
Notes to Consolidated Financial Statements—(Continued)
(in thousands unless otherwise indicated)
Note 15—Income from Continuing Operations per Common Share
The following summarizes the calculation of income from continuing operations per common share for the years ended December 31, 2009, 2008, and 2007.
| (in thousands, except per share data) | ||||||||||||
| Year ended December 31, |
2009 | 2008 | 2007 | |||||||||
| Numerator: |
||||||||||||
| Income from continuing operations |
$ | 116,859 | $ | 101,257 | $ | 71,411 | ||||||
| Less: income allocated to unvested restricted shares |
(1,282 | ) | (793 | ) | (404 | ) | ||||||
| Income from continuing operations attributable to common shareholders—basic |
115,577 | 100,464 | 71,007 | |||||||||
| Add: undistributed income attributable to unvested restricted shares—basic |
787 | 534 | 248 | |||||||||
| Less: undistributed income reallocated to unvested restricted shares—diluted |
(783 | ) | (529 | ) | (247 | ) | ||||||
| Income from continuing operations attributable to common shareholders—diluted |
$ | 115,581 | $ | 100,469 | $ | 71,008 | ||||||
| Denominator: |
||||||||||||
| Weighted average shares outstanding—basic |
41,144 | 40,793 | 40,250 | |||||||||
| Dilutive shares—stock options |
245 | 381 | 176 | |||||||||
| Weighted average shares outstanding—diluted |
41,389 | 41,174 | 40,426 | |||||||||
| Income from continuing operations per share attributable to common shareholders: |
||||||||||||
| Basic |
$ | 2.81 | $ | 2.46 | $ | 1.76 | ||||||
| Diluted |
$ | 2.79 | $ | 2.44 | $ | 1.76 | ||||||
Note 16—Shareholders’ Equity
The company has a shareholder rights agreement under which one Right is attendant to each outstanding share of common stock of the company. Each Right entitles the registered holder to purchase from the company one one-thousandth of a share of a new Series A Participating Cumulative Preferred Stock (New Series A Preferred Stock) at an exercise price of $100 (New Purchase Price). The Rights will become exercisable, if not earlier redeemed, only if a person or group acquires more than 15% of the outstanding shares of the company’s common stock, or if the company’s board of directors so determines following the commencement of a public announcement of a tender or exchange offer, the consummation of which would result in ownership by a person or group of more than 15% of such outstanding shares. Each holder of a Right, upon the occurrence of certain events, will become entitled to receive, upon exercise and payment of the New Purchase Price, New Series A Preferred Stock (or in certain circumstances, cash, property or other securities of the company or a potential acquirer) having a value equal to twice the amount of the New Purchase Price. The agreement is subject to review every three years by the company’s independent directors. The Rights will expire on April 30, 2014, if not earlier redeemed.
Note 17—Commitments and Contingencies
The company has a contractual commitment to outsource information technology operations, including the management and operation of its mainframe computer and distributed services processing, as well as application
54
Table of Contents
OWENS & MINOR, INC. AND SUBSIDIARIES
Notes to Consolidated Financial Statements—(Continued)
(in thousands unless otherwise indicated)
support, development and enhancement services through July 2014. The commitment is cancelable with 180 days’ notice and payment of a termination fee. The termination fee is based upon certain costs which would be incurred by the vendor as a direct result of the early termination of the agreement. The maximum termination fee payable was $5.2 million at December 31, 2009, declining each year to zero at the end of the final contract year.
Assuming no early termination of the contract, the fixed and determinable portion of the remaining obligations under this agreement ranges from $32.1 million in 2010 to $18.2 million in 2014, totaling $145.6 million. These obligations can vary annually up to a certain level for changes in the Consumer Price Index or for a significant increase in the company’s medical/surgical distribution business. Additionally, the service fees under this contract can vary to the extent additional services are provided by the vendor which are not covered by the negotiated base fees, or as a result of reduction in services that were included in these base fees. The company paid $52.9 million, $51.8 million, and $49.0 million under this contract in 2009, 2008, and 2007. The company has recorded approximately $4.8 million of capital lease assets associated with this outsourcing contract.
The company has a non-cancelable agreement through September 2011 to receive support and upgrades for certain computer software. The final minimum payment under this agreement is for $1.0 million in 2010.
The company has entered into non-cancelable agreements to lease most of its office and warehouse facilities with remaining terms generally ranging from one to ten years. Certain leases include renewal options, generally for five-year increments. The company also leases most of its transportation and material handling equipment for terms generally ranging from five to eight years. At December 31, 2009, future minimum annual payments under non-cancelable operating lease agreements with original terms in excess of one year are as follows:
| Total | |||
| 2010 |
$ | 51,070 | |
| 2011 |
34,252 | ||
| 2012 |
26,537 | ||
| 2013 |
21,324 | ||
| 2014 |
11,079 | ||
| Later years |
12,503 | ||
| Total minimum payments |
$ | 156,765 | |
Rent expense for all operating leases for the years ended December 31, 2009, 2008, and 2007, was $54.2 million, $50.7 million, and $49.1 million.
The company has contractual obligations that are required to be paid to customers in the event that certain contractual performance targets are not achieved as of specified dates, generally within 36 months from inception of the contract. These contingent obligations total $3.9 million as of December 31, 2009. If none of the performance targets are met as of the specified dates, and customers have met their contractual commitments, payments will be due as follows: 2010—$0.2 million; 2011—$1.5 million; 2012—$0.8 million; 2013—none and 2014—$1.4 million. None of these contingent obligations were accrued at December 31, 2009, as the company does not consider any of them probable. The company deferred the recognition of fees that are contingent upon the company’s future performance under the terms of these contracts. As of December 31, 2009, $0.9 million of deferred revenue related to outstanding contractual performance targets is included in other accrued liabilities.
55
Table of Contents
OWENS & MINOR, INC. AND SUBSIDIARIES
Notes to Consolidated Financial Statements—(Continued)
(in thousands unless otherwise indicated)
The state of California is conducting an administrative review of certain ongoing local sales tax incentives that may be available to the company beginning with the third quarter of 2007. As a result of this review, the Company may receive tax incentive payments of up to $1.05 million per quarter for all or some of these periods. The exact amount, if any, is dependent upon a number of factors, including the timing of negotiation and execution of certain customer agreements, the variability in sales and company operations in California. The company believes that this matter may be resolved in 2010.
Prior to exiting the DTC business, the company received reimbursements from Medicare, Medicaid, and private healthcare insurers for certain customer billings. The company is subject to audits of these reimbursements for up to seven years from the date of the service.
Note 18—Legal Proceedings
The company is subject to various legal actions that are ordinary and incidental to its business, including contract disputes, employment, workers’ compensation, product liability, regulatory and other matters. The company establishes reserves from time to time based upon periodic assessment of the potential outcomes of pending matters. In addition, the company believes that any potential liability arising from employment, product liability, workers’ compensation and other personal injury litigation matters would be adequately covered by the company’s insurance coverage, subject to policy limits, applicable deductibles and insurer solvency. While the outcome of legal actions cannot be predicted with certainty, the company believes, based on current knowledge and the advice of counsel, that the outcome of currently pending matters, individually or in the aggregate, will not have a material adverse effect on the company’s financial condition or results of operations.
56
Table of Contents
OWENS & MINOR, INC. AND SUBSIDIARIES
Notes to Consolidated Financial Statements—(Continued)
(in thousands unless otherwise indicated)
Note 19—Condensed Consolidating Financial Information
The following tables present condensed consolidating financial information for: Owens & Minor, Inc., on a combined basis; the guarantors of Owens & Minor, Inc.’s Senior Notes; and the non-guarantor subsidiaries of the Senior Notes. Separate financial statements of the guarantor subsidiaries are not presented because the guarantors are jointly, severally and unconditionally liable under the guarantees, and the company believes the condensed consolidating financial information is more meaningful in understanding the financial position, results of operations and cash flows of the guarantor subsidiaries.
Condensed Consolidating Financial Information
| Year ended December 31, 2009 |
Owens & Minor, Inc. |
Guarantor Subsidiaries |
Non-guarantor Subsidiaries |
Eliminations | Consolidated | |||||||||||||||
| Statements of Operations |
||||||||||||||||||||
| Revenue |
$ | — | $ | 8,036,886 | $ | 738 | $ | — | $ | 8,037,624 | ||||||||||
| Cost of revenue |
— | 7,250,657 | 52 | — | 7,250,709 | |||||||||||||||
| Gross margin |
— | 786,229 | 686 | — | 786,915 | |||||||||||||||
| Selling, general and administrative expenses |
2,254 | 562,305 | 1,061 | — | 565,620 | |||||||||||||||
| Depreciation and amortization |
— | 25,233 | 32 | — | 25,265 | |||||||||||||||
| Other operating income and expense, net |
— | (5,370 | ) | 125 | — | (5,245 | ) | |||||||||||||
| Operating earnings (loss) |
(2,254 | ) | 204,061 | (532 | ) | — | 201,275 | |||||||||||||
| Interest expense (income), net |
(1,317 | ) | 14,277 | 68 | — | 13,028 | ||||||||||||||
| Intercompany dividends |
(15,000 | ) | (30,000 | ) | — | 45,000 | — | |||||||||||||
| Income (loss) from continuing operations before income taxes |
14,063 | 219,784 | (600 | ) | (45,000 | ) | 188,247 | |||||||||||||
| Income tax provision (benefit) |
(355 | ) | 71,971 | (228 | ) | — | 71,388 | |||||||||||||
| Income (loss) from continuing operations |
14,418 | 147,813 | (372 | ) | (45,000 | ) | 116,859 | |||||||||||||
| Loss from discontinued operations, net of tax |
— | — | (12,201 | ) | — | (12,201 | ) | |||||||||||||
| Net income (loss) |
$ | 14,418 | $ | 147,813 | $ | (12,573 | ) | $ | (45,000 | ) | $ | 104,658 | ||||||||
57
Table of Contents
OWENS & MINOR, INC. AND SUBSIDIARIES
Notes to Consolidated Financial Statements—(Continued)
(in thousands unless otherwise indicated)
| Year ended December 31, 2008 |
Owens & Minor, Inc. |
Guarantor Subsidiaries |
Non-guarantor Subsidiaries |
Eliminations | Consolidated | |||||||||||||||
| Statements of Operations |
||||||||||||||||||||
| Revenue |
$ | — | $ | 7,243,237 | $ | — | $ | — | $ | 7,243,237 | ||||||||||
| Cost of revenue |
— | 6,525,977 | — | — | 6,525,977 | |||||||||||||||
| Gross margin |
— | 717,260 | — | — | 717,260 | |||||||||||||||
| Selling, general and administrative expenses |
1,607 | 519,794 | — | — | 521,401 | |||||||||||||||
| Depreciation and amortization |
— | 21,955 | — | — | 21,955 | |||||||||||||||
| Other operating income and expense, net |
— | (6,821 | ) | — | — | (6,821 | ) | |||||||||||||
| Operating earnings (loss) |
(1,607 | ) | 182,332 | — | — | 180,725 | ||||||||||||||
| Interest expense (income), net |
(598 | ) | 16,597 | — | — | 15,999 | ||||||||||||||
| Intercompany dividends |
(15,000 | ) | (30,000 | ) | — | 45,000 | — | |||||||||||||
| Income (loss) from continuing operations before income taxes |
13,991 | 195,735 | — | (45,000 | ) | 164,726 | ||||||||||||||
| Income tax provision (benefit) |
(390 | ) | 63,859 | — | — | 63,469 | ||||||||||||||
| Income (loss) from continuing operations |
14,381 | 131,876 | — | (45,000 | ) | 101,257 | ||||||||||||||
| Loss from discontinued operations, net of tax |
— | — | (7,930 | ) | — | (7,930 | ) | |||||||||||||
| Net income (loss) |
$ | 14,381 | $ | 131,876 | $ | (7,930 | ) | $ | (45,000 | ) | $ | 93,327 | ||||||||
Condensed Consolidating Financial Information
| Year ended December 31, 2007 |
Owens & Minor, Inc. |
Guarantor Subsidiaries |
Non-guarantor Subsidiaries |
Eliminations | Consolidated | ||||||||||||||
| Statements of Operations |
|||||||||||||||||||
| Revenue |
$ | — | $ | 6,694,596 | $ | — | $ | — | $ | 6,694,596 | |||||||||
| Cost of revenue |
— | 6,044,631 | — | — | 6,044,631 | ||||||||||||||
| Gross margin |
— | 649,965 | — | — | 649,965 | ||||||||||||||
| Selling, general and administrative expenses |
2,007 | 492,508 | — | — | 494,515 | ||||||||||||||
| Depreciation and amortization |
— | 20,856 | — | — | 20,856 | ||||||||||||||
| Other operating income and expense, net |
— | (6,187 | ) | — | — | (6,187 | ) | ||||||||||||
| Operating earnings (loss) |
(2,007 | ) | 142,788 | — | — | 140,781 | |||||||||||||
| Interest expense (income), net |
(290 | ) | 23,438 | — | — | 23,148 | |||||||||||||
| Intercompany dividends |
(15,000 | ) | (30,000 | ) | — | 45,000 | — | ||||||||||||
| Income from continuing operations before income taxes |
13,283 | 149,350 | — | (45,000 | ) | 117,633 | |||||||||||||
| Income tax provision (benefit) |
(678 | ) | 46,900 | — | — | 46,222 | |||||||||||||
| Income (loss) from continuing operations |
13,961 | 102,450 | — | (45,000 | ) | 71,411 | |||||||||||||
| Income from discontinued operations, net of tax |
— | — | 1,299 | — | 1,299 | ||||||||||||||
| Net income |
$ | 13,961 | $ | 102,450 | $ | 1,299 | $ | (45,000 | ) | $ | 72,710 | ||||||||
58
Table of Contents
OWENS & MINOR, INC. AND SUBSIDIARIES
Notes to Consolidated Financial Statements—(Continued)
(in thousands unless otherwise indicated)
Condensed Consolidating Financial Information
| December 31, 2009 |
Owens & Minor, Inc. |
Guarantor Subsidiaries |
Non-guarantor Subsidiaries |
Eliminations | Consolidated | ||||||||||||||
| Balance Sheets |
|||||||||||||||||||
| Assets |
|||||||||||||||||||
| Current assets |
|||||||||||||||||||
| Cash and cash equivalents |
$ | 92,088 | $ | 3,765 | $ | 283 | $ | — | $ | 96,136 | |||||||||
| Accounts and notes receivable, net |
— | 498,080 | — | — | 498,080 | ||||||||||||||
| Merchandise inventories |
— | 689,889 | — | — | 689,889 | ||||||||||||||
| Intercompany receivables |
— | — | 43,380 | (43,380 | ) | — | |||||||||||||
| Other current assets |
136 | 57,824 | 2 | — | 57,962 | ||||||||||||||
| Total current assets |
92,224 | 1,249,558 | 43,665 | (43,380 | ) | 1,342,067 | |||||||||||||
| Property and equipment, net |
— | 84,960 | 5 | — | 84,965 | ||||||||||||||
| Goodwill, net |
— | 247,271 | — | — | 247,271 | ||||||||||||||
| Intangible assets, net |
— | 27,809 | — | — | 27,809 | ||||||||||||||
| Intercompany investments |
445,228 | — | — | (445,228 | ) | — | |||||||||||||
| Other assets, net |
1,633 | 43,341 | 2 | — | 44,976 | ||||||||||||||
| Total assets |
$ | 539,085 | $ | 1,652,939 | $ | 43,672 | $ | (488,608 | ) | $ | 1,747,088 | ||||||||
| Liabilities and shareholders’ equity |
|||||||||||||||||||
| Current liabilities |
|||||||||||||||||||
| Accounts payable |
$ | — | $ | 546,984 | $ | 5 | $ | — | $ | 546,989 | |||||||||
| Accrued payroll and related liabilities |
— | 34,870 | 15 | — | 34,885 | ||||||||||||||
| Intercompany payables |
38,682 | 4,698 | — | (43,380 | ) | — | |||||||||||||
| Other accrued liabilities |
5,684 | 110,217 | 402 | — | 116,303 | ||||||||||||||
| Current liabilities of discontinued operations |
— | — | 1,939 | — | 1,939 | ||||||||||||||
| Total current liabilities |
44,366 | 696,769 | 2,361 | (43,380 | ) | 700,116 | |||||||||||||
| Long-term debt, excluding current portion |
205,682 | 2,736 | — | — | 208,418 | ||||||||||||||
| Intercompany long-term debt |
— | 138,890 | — | (138,890 | ) | — | |||||||||||||
| Other liabilities |
— | 69,375 | — | — | 69,375 | ||||||||||||||
| Total liabilities |
250,048 | 907,770 | 2,361 | (182,270 | ) | 977,909 | |||||||||||||
| Shareholders’ equity |
|||||||||||||||||||
| Common stock |
83,827 | — | 1,500 | (1,500 | ) | 83,827 | |||||||||||||
| Paid-in capital |
193,905 | 242,024 | 62,814 | (304,838 | ) | 193,905 | |||||||||||||
| Retained earnings (deficit) |
10,992 | 516,491 | (23,003 | ) | — | 504,480 | |||||||||||||
| Accumulated other comprehensive income (loss) |
313 | (13,346 | ) | — | — | (13,033 | ) | ||||||||||||
| Total shareholders’ equity |
289,037 | 745,169 | 41,311 | (306,338 | ) | 769,179 | |||||||||||||
| Total liabilities and shareholders’ equity |
$ | 539,085 | $ | 1,652,939 | $ | 43,672 | $ | (488,608 | ) | $ | 1,747,088 | ||||||||
59
Table of Contents
OWENS & MINOR, INC. AND SUBSIDIARIES
Notes to Consolidated Financial Statements—(Continued)
(in thousands unless otherwise indicated)
Condensed Consolidating Financial Information
| December 31, 2008 |
Owens & Minor, Inc. |
Guarantor Subsidiaries |
Non-guarantor Subsidiaries |
Eliminations | Consolidated | ||||||||||||||
| Balance Sheets |
|||||||||||||||||||
| Assets |
|||||||||||||||||||
| Current assets |
|||||||||||||||||||
| Cash and cash equivalents |
$ | 13,425 | $ | (6,590 | ) | $ | 1,051 | $ | — | $ | 7,886 | ||||||||
| Accounts and notes receivable, net |
— | 521,295 | 16 | — | 521,311 | ||||||||||||||
| Merchandise inventories |
— | 679,059 | 10 | — | 679,069 | ||||||||||||||
| Intercompany advances, net |
11,903 | (11,903 | ) | — | — | — | |||||||||||||
| Other current assets |
98 | 65,074 | 6,157 | — | 71,329 | ||||||||||||||
| Current assets of discontinued operations |
— | — | 32,199 | — | 32,199 | ||||||||||||||
| Total current assets |
25,426 | 1,246,935 | 39,433 | — | 1,311,794 | ||||||||||||||
| Property and equipment, net |
— | 76,949 | — | — | 76,949 | ||||||||||||||
| Goodwill, net |
— | 252,412 | — | — | 252,412 | ||||||||||||||
| Intangible assets, net |
— | 27,799 | 3 | — | 27,802 | ||||||||||||||
| Intercompany payable (receivable) |
37,118 | — | — | (37,118 | ) | — | |||||||||||||
| Intercompany investments |
445,228 | — | — | (445,228 | ) | — | |||||||||||||
| Other assets, net |
1,817 | 42,167 | 891 | — | 44,875 | ||||||||||||||
| Other assets of discontinued operations |
— | — | 62,358 | — | 62,358 | ||||||||||||||
| Total assets |
$ | 509,589 | $ | 1,646,262 | $ | 102,685 | $ | (482,346 | ) | $ | 1,776,190 | ||||||||
| Liabilities and shareholders’ equity |
|||||||||||||||||||
| Current liabilities |
|||||||||||||||||||
| Accounts payable |
$ | — | $ | 512,971 | $ | 55 | $ | — | $ | 513,026 | |||||||||
| Accrued payroll and related liabilities |
— | 39,993 | 25 | — | 40,018 | ||||||||||||||
| Other accrued liabilities |
4,747 | 98,673 | 9 | — | 103,429 | ||||||||||||||
| Current liabilities of discontinued operations |
— | — | 11,038 | — | 11,038 | ||||||||||||||
| Total current liabilities |
4,747 | 651,637 | 11,127 | — | 667,511 | ||||||||||||||
| Long-term debt, excluding current portion |
206,580 | 152,657 | — | — | 359,237 | ||||||||||||||
| Intercompany long-term debt |
— | 138,465 | 37,543 | (176,008 | ) | — | |||||||||||||
| Other liabilities |
— | 60,261 | 130 | — | 60,391 | ||||||||||||||
| Total liabilities |
211,327 | 1,003,020 | 48,800 | (176,008 | ) | 1,087,139 | |||||||||||||
| Shareholders’ equity |
|||||||||||||||||||
| Common stock |
82,881 | — | 1,500 | (1,500 | ) | 82,881 | |||||||||||||
| Paid-in capital |
180,074 | 242,024 | 62,814 | (304,838 | ) | 180,074 | |||||||||||||
| Retained earnings (deficit) |
34,944 | 413,677 | (10,429 | ) | — | 438,192 | |||||||||||||
| Accumulated other comprehensive income (loss) |
363 | (12,459 | ) | — | — | (12,096 | ) | ||||||||||||
| Total shareholders’ equity |
298,262 | 643,242 | 53,885 | (306,338 | ) | 689,051 | |||||||||||||
| Total liabilities and shareholders’ equity |
$ | 509,589 | $ | 1,646,262 | $ | 102,685 | $ | (482,346 | ) | $ | 1,776,190 | ||||||||
60
Table of Contents
OWENS & MINOR, INC. AND SUBSIDIARIES
Notes to Consolidated Financial Statements—(Continued)
(in thousands unless otherwise indicated)
Condensed Consolidating Financial Information
| Year ended December 31, 2009 |
Owens & Minor, Inc. |
Guarantor Subsidiaries |
Non-guarantor Subsidiaries |
Eliminations | Consolidated | |||||||||||||||
| Statements of Cash Flows |
||||||||||||||||||||
| Operating activities: |
||||||||||||||||||||
| Net income (loss) |
$ | 14,418 | $ | 147,813 | $ | (12,573 | ) | $ | (45,000 | ) | $ | 104,658 | ||||||||
| Adjustments to reconcile net income to cash provided by (used for) operating activities: |
||||||||||||||||||||
| Loss from discontinued operations |
— | — | 12,201 | — | 12,201 | |||||||||||||||
| Depreciation and amortization |
— | 25,233 | 32 | — | 25,265 | |||||||||||||||
| Provision for losses on accounts and notes receivable |
— | 3,976 | — | — | 3,976 | |||||||||||||||
| Provision for LIFO reserve |
— | 2,708 | — | — | 2,708 | |||||||||||||||
| Share-based compensation expense |
520 | 6,515 | — | — | 7,035 | |||||||||||||||
| Deferred income tax provision |
— | 10,869 | — | — | 10,869 | |||||||||||||||
| Intercompany dividends |
(15,000 | ) | (30,000 | ) | — | 45,000 | — | |||||||||||||
| Changes in operating assets and liabilities: |
||||||||||||||||||||
| Accounts and notes receivable |
— | 19,239 | 16 | — | 19,255 | |||||||||||||||
| Merchandise inventories |
— | (13,538 | ) | 10 | — | (13,528 | ) | |||||||||||||
| Accounts payable |
— | (18,705 | ) | (50 | ) | — | (18,755 | ) | ||||||||||||
| Net change in other current assets and liabilities |
899 | 11,791 | 32 | — | 12,722 | |||||||||||||||
| Other, net |
(2,247 | ) | 1,289 | (128 | ) | — | (1,086 | ) | ||||||||||||
| Cash provided by (used for) operating activities of continuing operations |
(1,410 | ) | 167,190 | (460 | ) | — | 165,320 | |||||||||||||
| Investing activities: |
||||||||||||||||||||
| Additions to property and equipment |
— | (19,739 | ) | (7 | ) | — | (19,746 | ) | ||||||||||||
| Additions to computer software |
— | (12,543 | ) | — | — | (12,543 | ) | |||||||||||||
| Net cash received for acquisition of business |
— | 6,994 | — | — | 6,994 | |||||||||||||||
| Proceeds from sale of property and equipment |
— | 4,080 | — | — | 4,080 | |||||||||||||||
| Cash provided by (used for) investing activities of continuing operations |
— | (21,208 | ) | (7 | ) | — | (21,215 | ) | ||||||||||||
| Financing activities: |
||||||||||||||||||||
| Change in intercompany advances |
109,280 | (35,722 | ) | (73,558 | ) | — | — | |||||||||||||
| Net borrowings on revolving credit facility |
— | (150,578 | ) | — | — | (150,578 | ) | |||||||||||||
| Cash dividends paid |
(38,370 | ) | — | — | — | (38,370 | ) | |||||||||||||
| Increase in drafts payable |
— | 52,718 | — | — | 52,718 | |||||||||||||||
| Proceeds from exercise of stock options |
6,593 | — | — | — | 6,593 | |||||||||||||||
| Excess tax benefits related to share-based compensation |
2,570 | — | — | — | 2,570 | |||||||||||||||
| Other, net |
— | (2,045 | ) | — | — | (2,045 | ) | |||||||||||||
| Cash provided by (used for) financing activities of continuing operations |
80,073 | (135,627 | ) | (73,558 | ) | — | (129,112 | ) | ||||||||||||
| Discontinued operations: |
||||||||||||||||||||
| Operating cash flows |
— | — | 10,257 | — | 10,257 | |||||||||||||||
| Investing cash flows |
— | — | 63,000 | — | 63,000 | |||||||||||||||
| Net cash provided by discontinued operations |
— | — | 73,257 | — | 73,257 | |||||||||||||||
| Net increase (decrease) in cash and cash equivalents |
78,663 | 10,355 | (768 | ) | — | 88,250 | ||||||||||||||
| Cash and cash equivalents at beginning of year |
13,425 | (6,590 | ) | 1,051 | — | 7,886 | ||||||||||||||
| Cash and cash equivalents at end of year |
$ | 92,088 | $ | 3,765 | $ | 283 | $ | — | $ | 96,136 | ||||||||||
61
Table of Contents
OWENS & MINOR, INC. AND SUBSIDIARIES
Notes to Consolidated Financial Statements—(Continued)
(in thousands unless otherwise indicated)
Condensed Consolidating Financial Information
| Year ended December 31, 2008 |
Owens & Minor, Inc. |
Guarantor Subsidiaries |
Non-guarantor Subsidiaries |
Eliminations | Consolidated | |||||||||||||||
| Statements of Cash Flows |
||||||||||||||||||||
| Operating activities: |
||||||||||||||||||||
| Net income (loss) |
$ | 14,381 | $ | 131,876 | $ | (7,930 | ) | $ | (45,000 | ) | $ | 93,327 | ||||||||
| Adjustments to reconcile net income to cash provided by (used for) operating activities: |
||||||||||||||||||||
| Loss from discontinued operations |
— | — | 7,930 | — | 7,930 | |||||||||||||||
| Depreciation and amortization |
— | 21,955 | — | — | 21,955 | |||||||||||||||
| Provision for losses on accounts and notes receivable |
— | 4,274 | — | — | 4,274 | |||||||||||||||
| Provision for LIFO reserve |
— | 13,172 | — | — | 13,172 | |||||||||||||||
| Share-based compensation expense |
654 | 6,909 | — | — | 7,563 | |||||||||||||||
| Deferred income tax provision |
— | 17,618 | — | — | 17,618 | |||||||||||||||
| Intercompany dividend income |
(15,000 | ) | (30,000 | ) | — | 45,000 | — | |||||||||||||
| Loss on interest rate swaps |
3,141 | — | — | 3,141 | ||||||||||||||||
| Changes in operating assets and liabilities: |
||||||||||||||||||||
| Accounts and notes receivable |
— | (48,464 | ) | — | — | (48,464 | ) | |||||||||||||
| Merchandise inventories |
— | (56,150 | ) | (6 | ) | — | (56,156 | ) | ||||||||||||
| Accounts payable |
— | (13,454 | ) | (130 | ) | — | (13,584 | ) | ||||||||||||
| Net change in other current assets and liabilities |
121 | 9,708 | 4 | — | 9,833 | |||||||||||||||
| Other, net |
(1,840 | ) | 4,109 | — | — | 2,269 | ||||||||||||||
| Cash provided by (used for) operating activities of continuing operations |
1,457 | 61,553 | (132 | ) | — | 62,878 | ||||||||||||||
| Investing activities: |
||||||||||||||||||||
| Additions to property and equipment |
— | (17,669 | ) | — | — | (17,669 | ) | |||||||||||||
| Additions to computer software |
— | (9,339 | ) | 58 | — | (9,281 | ) | |||||||||||||
| Net cash paid for acquisition of business |
— | (96,790 | ) | — | — | (96,790 | ) | |||||||||||||
| Proceeds from sale of property and equipment |
— | 409 | — | — | 409 | |||||||||||||||
| Cash provided by (used for) investing activities of continuing operations |
— | (123,389 | ) | 58 | — | (123,331 | ) | |||||||||||||
| Financing activities: |
||||||||||||||||||||
| Change in intercompany advances |
28,124 | (36,197 | ) | 8,073 | — | — | ||||||||||||||
| Cash dividends paid |
(33,048 | ) | — | — | — | (33,048 | ) | |||||||||||||
| Net borrowings on revolving credit facility |
— | 73,670 | — | — | 73,670 | |||||||||||||||
| Proceeds from exercise of stock options |
8,968 | — | — | — | 8,968 | |||||||||||||||
| Excess tax benefits related to share-based compensation |
3,421 | — | — | — | 3,421 | |||||||||||||||
| Increase in drafts payable |
— | 11,316 | — | — | 11,316 | |||||||||||||||
| Proceeds from termination of interest rate swaps |
3,795 | — | — | — | 3,795 | |||||||||||||||
| Other, net |
— | (2,859 | ) | — | — | (2,859 | ) | |||||||||||||
| Cash provided by financing activities of continuing operations |
11,260 | 45,930 | 8,073 | — | 65,263 | |||||||||||||||
| Discontinued operations: |
||||||||||||||||||||
| Operating cash flows |
— | — | (7,115 | ) | — | (7,115 | ) | |||||||||||||
| Investing cash flows |
— | — | (204 | ) | — | (204 | ) | |||||||||||||
| Net cash used for discontinued operations |
— | — | (7,319 | ) | — | (7,319 | ) | |||||||||||||
| Net increase (decrease) in cash and cash equivalents |
12,717 | (15,906 | ) | 680 | — | (2,509 | ) | |||||||||||||
| Cash and cash equivalents at beginning of year |
708 | 9,316 | 371 | — | 10,395 | |||||||||||||||
| Cash and cash equivalents at end of year |
$ | 13,425 | $ | (6,590 | ) | $ | 1,051 | $ | — | $ | 7,886 | |||||||||
62
Table of Contents
OWENS & MINOR, INC. AND SUBSIDIARIES
Notes to Consolidated Financial Statements—(Continued)
(in thousands unless otherwise indicated)
Condensed Consolidating Financial Information
| Year ended December 31, 2007 |
Owens & Minor, Inc. |
Guarantor Subsidiaries |
Non-guarantor Subsidiaries |
Eliminations | Consolidated | |||||||||||||||
| Statements of Cash Flows |
||||||||||||||||||||
| Operating activities: |
||||||||||||||||||||
| Net income (loss) |
$ | 13,961 | $ | 102,450 | $ | 1,299 | $ | (45,000 | ) | $ | 72,710 | |||||||||
| Adjustments to reconcile net income to cash provided by (used for) operating activities: |
||||||||||||||||||||
| Income from discontinued operations |
— | — | (1,299 | ) | — | (1,299 | ) | |||||||||||||
| Depreciation and amortization |
— | 20,856 | — | — | 20,856 | |||||||||||||||
| Provision for losses on accounts and notes receivable |
— | 8,009 | — | — | 8,009 | |||||||||||||||
| Provision for LIFO reserve |
— | 8,424 | — | — | 8,424 | |||||||||||||||
| Share-based compensation expense |
676 | 5,154 | — | — | 5,830 | |||||||||||||||
| Deferred income tax provision |
— | (5,939 | ) | — | — | (5,939 | ) | |||||||||||||
| Intercompany dividend income |
(15,000 | ) | (30,000 | ) | — | 45,000 | — | |||||||||||||
| Changes in operating assets and liabilities: |
||||||||||||||||||||
| Accounts and notes receivable |
— | 70,768 | (21 | ) | — | 70,747 | ||||||||||||||
| Merchandise inventories |
— | 60,746 | (4 | ) | — | 60,742 | ||||||||||||||
| Accounts payable |
— | (33,096 | ) | 96 | — | (33,000 | ) | |||||||||||||
| Net change in other current assets and liabilities |
630 | 6,510 | (40 | ) | — | 7,100 | ||||||||||||||
| Other, net |
(414 | ) | (3,416 | ) | (2 | ) | — | (3,832 | ) | |||||||||||
| Cash provided by (used for) operating activities of continuing operations |
(147 | ) | 210,466 | 29 | — | 210,348 | ||||||||||||||
| Investing activities: |
||||||||||||||||||||
| Additions to property and equipment |
— | (19,104 | ) | — | (19,104 | ) | ||||||||||||||
| Additions to computer software |
— | (8,440 | ) | (4 | ) | — | (8,444 | ) | ||||||||||||
| Net cash received for acquisition of business |
— | 15,441 | — | 15,441 | ||||||||||||||||
| Other, net |
— | 327 | — | — | 327 | |||||||||||||||
| Cash used for investing activities of continuing operations |
— | (11,776 | ) | (4 | ) | — | (11,780 | ) | ||||||||||||
| Financing activities: |
||||||||||||||||||||
| Change in intercompany advances |
13,937 | (4,728 | ) | (9,209 | ) | — | — | |||||||||||||
| Cash dividends paid |
(27,637 | ) | — | — | — | (27,637 | ) | |||||||||||||
| Net payments on revolving credit facility |
— | (152,600 | ) | — | — | (152,600 | ) | |||||||||||||
| Proceeds from exercise of stock options |
9,621 | — | — | — | 9,621 | |||||||||||||||
| Excess tax benefits related to share–based compensation |
4,084 | — | — | — | 4,084 | |||||||||||||||
| Decrease in drafts payable |
— | (34,634 | ) | — | — | (34,634 | ) | |||||||||||||
| Other, net |
— | (1,491 | ) | — | — | (1,491 | ) | |||||||||||||
| Cash provided by (used for) financing activities of continuing operations |
5 | (193,453 | ) | (9,209 | ) | — | (202,657 | ) | ||||||||||||
| Discontinued operations: |
||||||||||||||||||||
| Operating cash flows |
— | — | 9,489 | — | 9,489 | |||||||||||||||
| Investing cash flows |
— | — | (2,995 | ) | — | (2,995 | ) | |||||||||||||
| Net cash provided by discontinued operations |
— | — | 6,494 | — | 6,494 | |||||||||||||||
| Net increase (decrease) in cash and cash equivalents |
(142 | ) | 5,237 | (2,690 | ) | — | 2,405 | |||||||||||||
| Cash and cash equivalents at beginning of year |
850 | 4,079 | 3,061 | — | 7,990 | |||||||||||||||
| Cash and cash equivalents at end of year |
$ | 708 | $ | 9,316 | $ | 371 | $ | — | $ | 10,395 | ||||||||||
63
Table of Contents
OWENS & MINOR, INC. AND SUBSIDIARIES
Notes to Consolidated Financial Statements—(Continued)
(in thousands unless otherwise indicated)
Note 20—Subsequent Events
The company has evaluated subsequent events through February 25, 2010, the date the consolidated financial statements were issued.
On February 8, 2010, the company’s board of directors announced a three-for-two stock split of the company’s common stock to be effected in the form of a stock dividend of one share of company common stock for every two shares outstanding. The record date for the stock split is March 15, 2010, and the stock dividend will be payable on March 31, 2010. The common stock will trade on a post-split basis beginning on April 1, 2010. The accompanying consolidated financial statements do not reflect this stock split.
The company’s historical income (loss) per common share on a pro forma basis, assuming the stock split had occurred on January 1, 2007, is as follows:
| 2009 | 2008 | 2007 | |||||||||
| Income (loss) per common share—basic: |
|||||||||||
| Continuing operations |
$ | 1.87 | $ | 1.64 | $ | 1.18 | |||||
| Discontinued operations |
(0.19 | ) | (0.13 | ) | 0.02 | ||||||
| Net income per share—basic |
$ | 1.68 | $ | 1.51 | $ | 1.20 | |||||
| Income (loss) per common share—diluted: |
|||||||||||
| Continuing operations |
$ | 1.86 | $ | 1.63 | $ | 1.17 | |||||
| Discontinued operations |
(0.19 | ) | (0.13 | ) | 0.02 | ||||||
| Net income per share—diluted |
$ | 1.67 | $ | 1.50 | $ | 1.19 | |||||
64
Table of Contents
Report of Independent Registered Public Accounting Firm
The Board of Directors and Shareholders
Owens & Minor, Inc.:
We have audited the accompanying consolidated balance sheets of Owens & Minor, Inc. and subsidiaries (the Company) as of December 31, 2009 and 2008, and the related consolidated statements of income, changes in shareholders’ equity, and cash flows for each of the years in the three-year period ended December 31, 2009. These consolidated financial statements are the responsibility of the Company’s management. Our responsibility is to express an opinion on these consolidated financial statements based on our audits.
We conducted our audits in accordance with the standards of the Public Company Accounting Oversight Board (United States). Those standards require that we plan and perform the audit to obtain reasonable assurance about whether the financial statements are free of material misstatement. An audit includes examining, on a test basis, evidence supporting the amounts and disclosures in the financial statements. An audit also includes assessing the accounting principles used and significant estimates made by management, as well as evaluating the overall financial statement presentation. We believe that our audits provide a reasonable basis for our opinion.
In our opinion, the consolidated financial statements referred to above present fairly, in all material respects, the financial position of Owens & Minor, Inc. and subsidiaries as of December 31, 2009 and 2008, and the results of their operations and their cash flows for each of the years in the three-year period ended December 31, 2009, in conformity with U.S. generally accepted accounting principles.
We also have audited, in accordance with the standards of the Public Company Accounting Oversight Board (United States), the Company’s internal control over financial reporting as of December 31, 2009, based on criteria established in Internal Control—Integrated Framework issued by the Committee of Sponsoring Organizations of the Treadway Commission (COSO), and our report dated February 25, 2010 expressed an unqualified opinion on the effectiveness of the Company’s internal control over financial reporting.
Richmond, Virginia
February 25, 2010
65
Table of Contents
SELECTED QUARTERLY FINANCIAL INFORMATION
(unaudited)
| Year Ended December 31, 2009 | ||||||||||||||||
| (in thousands, except per share data) |
1st Quarter |
2nd Quarter |
3rd Quarter |
4th Quarter |
||||||||||||
| Revenue |
$ | 1,948,628 | $ | 2,013,780 | $ | 2,034,792 | $ | 2,040,424 | ||||||||
| Gross margin |
183,633 | 197,699 | 204,342 | 201,241 | ||||||||||||
| Income from continuing operations |
$ | 22,358 | $ | 27,775 | $ | 34,687 | $ | 32,039 | ||||||||
| Income (loss) from discontinued operations, net of tax(2) |
(8,382 | ) | (4,127 | ) | — | 308 | ||||||||||
| Net income |
$ | 13,976 | $ | 23,648 | $ | 34,687 | $ | 32,347 | ||||||||
| Income (loss) per common share—basic: |
||||||||||||||||
| Continued operations |
$ | 0.54 | $ | 0.67 | $ | 0.83 | $ | 0.77 | ||||||||
| Discontinued operations |
(0.20 | ) | (0.10 | ) | — | 0.01 | ||||||||||
| Net income per share—basic |
$ | 0.34 | $ | 0.57 | $ | 0.83 | $ | 0.78 | ||||||||
| Income (loss) per common share—diluted: |
||||||||||||||||
| Continued operations |
$ | 0.54 | $ | 0.67 | $ | 0.83 | $ | 0.76 | ||||||||
| Discontinued operations |
(0.20 | ) | (0.10 | ) | — | 0.01 | ||||||||||
| Net income per share—diluted |
$ | 0.34 | $ | 0.57 | $ | 0.83 | $ | 0.77 | ||||||||
| Cash dividends per common share |
$ | 0.23 | $ | 0.23 | $ | 0.23 | $ | 0.23 | ||||||||
| Market price: |
||||||||||||||||
| High |
$ | 42.59 | $ | 44.09 | $ | 46.24 | $ | 48.37 | ||||||||
| Low |
30.19 | 31.71 | 42.30 | 38.28 | ||||||||||||
| Year Ended December 31, 2008 | ||||||||||||||||
| (in thousands, except per share data) |
1st Quarter |
2nd Quarter |
3rd Quarter |
4th Quarter |
||||||||||||
| Revenue |
$ | 1,727,301 | $ | 1,771,230 | $ | 1,786,858 | $ | 1,957,848 | ||||||||
| Gross margin |
170,213 | 175,342 | 178,749 | 192,956 | ||||||||||||
| Income from continuing operations |
$ | 24,040 | $ | 24,460 | $ | 25,348 | $ | 27,409 | ||||||||
| Income (loss) from discontinued operations, net of tax(2) |
168 | (828 | ) | (64 | ) | (7,206 | ) | |||||||||
| Net income |
$ | 24,208 | $ | 23,632 | $ | 25,284 | $ | 20,203 | ||||||||
| Income (loss) per common share—basic(1): |
||||||||||||||||
| Continued operations |
$ | 0.59 | $ | 0.60 | $ | 0.62 | $ | 0.66 | ||||||||
| Discontinued operations |
— | (0.02 | ) | (0.01 | ) | (0.17 | ) | |||||||||
| Net income per share—basic |
$ | 0.59 | $ | 0.58 | $ | 0.61 | $ | 0.49 | ||||||||
| Income (loss) per common share—diluted(1): |
||||||||||||||||
| Continued operations |
$ | 0.58 | $ | 0.59 | $ | 0.61 | $ | 0.66 | ||||||||
| Discontinued operations |
0.01 | (0.02 | ) | — | (0.17 | ) | ||||||||||
| Net income per share—diluted |
$ | 0.59 | $ | 0.57 | $ | 0.61 | $ | 0.49 | ||||||||
| Cash dividends per common share |
$ | 0.20 | $ | 0.20 | $ | 0.20 | $ | 0.20 | ||||||||
| Market price: |
||||||||||||||||
| High |
$ | 45.85 | $ | 49.75 | $ | 55.00 | $ | 48.51 | ||||||||
| Low |
39.09 | 38.99 | 44.00 | 34.90 | ||||||||||||
| (1) | Certain adjustments have been made to previously reported amounts to conform to current year presentation. See Note 1 of Notes to Consolidated Financial Statements. |
| (2) | In January 2009, the company exited its direct to consumer distribution business (DTC business). The company incurred charges associated with exiting the DTC business in the fourth quarter of 2008 and in the first and second quarters of 2009. See Note 4 of Notes to Consolidated Financial Statements. |
66
Table of Contents
Index to Exhibits
| 2.1 | Asset Purchase and Sale Agreement, dated as of July 10, 2006, among Owens & Minor Distribution, Inc., Owens and Minor, Inc., McKesson Medical-Surgical Inc. and McKesson Corporation (incorporated herein by reference to the Company’s Current Report on Form 8-K, Exhibit 2.1, dated July 14, 2006) | |
| 2.2 | Form of Asset Purchase Agreement dated as of August 19, 2008 by and among Owens & Minor Distribution, Inc., The Burrows Company and George J. Burrows (incorporated herein by reference to the Company’s Current Report on Form 8-K, Exhibit 2.1, dated August 22, 2008) | |
| 2.3 | Form of First Amendment to Asset Purchase Agreement dated as of September 30, 2008 by and among Owens & Minor Distribution, Inc., The Burrows Company and George J. Burrows (incorporated herein by reference to the Company’s Current Report on Form 8-K, Exhibit 2.1, dated October 6, 2008) | |
| 3.1 | Amended and Restated Articles of Incorporation of Owens & Minor, Inc. (incorporated herein by reference to the Company’s Current Report on Form 8-K, Exhibit 3.1, dated July 29, 2008) | |
| 3.2 | Amended and Restated Bylaws of Owens & Minor, Inc. (incorporated herein by reference to the Company’s Current Report on Form 8-K, Exhibit 3.1, dated July 28, 2009) | |
| 4.1 | Amended and Restated Credit Agreement dated as of May 4, 2004, by and among Owens & Minor Distribution, Inc., and Owens & Minor Medical, Inc. as Borrowers, Owens & Minor, Inc. and certain of its Subsidiaries, as Guarantors, the banks identified herein, Wachovia Bank, National Association and SunTrust Bank, as Syndication Agents, and Bank of America, N.A., as Administrative Agent (incorporated herein by reference to the Company’s Quarterly Report on Form 10-Q, Exhibit 4.1, for the quarter ended March 31, 2004) | |
| 4.2 | First Amendment to Amended and Restated Credit Agreement, dated as of April 3, 2006, among Owens & Minor Distribution, Inc. and Owens & Minor Medical, Inc., as borrowers, the Company and certain of its Subsidiaries, as guarantors, the banks identified on the signature pages thereto and Bank of America, N.A., as Administrative Agent (incorporated herein by reference to the Company’s Current Report on Form 8-K, Exhibit 4.1, dated April 7, 2006) | |
| 4.3 | Form of Second Amendment to Amended and Restated Credit Agreement, dated as of January 29, 2007, among Owens & Minor Medical, Inc., Owens & Minor Distribution, Inc., the Company, certain subsidiaries of the Company, the banks identified on the signature pages hereto and Bank of America, N.A. (as administrative agent) (incorporated herein by reference to the Company’s Current Report 8-K, Exhibit 4.1, dated February 1, 2007) | |
| 4.4 | Form of Third Amendment and Consent to Amended and Restated Credit Agreement, dated July 14, 2008, among Owens & Minor Medical, Inc., Owens & Minor Distribution, Inc., the Company, certain subsidiaries of the Company, the banks identified on the signature pages hereto and Bank of America, N.A. (as administrative agent) (incorporated herein by reference to the Company’s Current Report on Form 8-K, Exhibit 4.1, dated July 18, 2008) | |
| 4.5 | Indenture, dated as of April 7, 2006, for the Senior Notes due 2016 among the Company, Owens & Minor Distribution, Inc., Owens & Minor Medical, Inc., Owens & Minor Healthcare Supply, Inc., Access Diabetic Supply, LLC and SunTrust Bank, as trustee (incorporated herein by reference to the Company’s Current Report on Form 8-K, Exhibit 4.2, dated April 7, 2006) | |
| 4.6 | Form of Global Security for the Senior Notes due 2016 (incorporated herein by reference to the Company’s Current Report on Form 8-K, Exhibit 4.3, dated April 7, 2006) | |
| 4.7 | Rights Agreement dated as of April 30, 2004, between Owens & Minor, Inc., and Bank of New York, as Rights Agent (incorporated herein by reference to the Company’s Annual Report on Form 10-K, Exhibit 4.6, for the year ended December 31, 2003) | |
67
Table of Contents
| 10.1 | Owens & Minor, Inc. 1993 Stock Option Plan (incorporated herein by reference to the Company’s Annual Report on Form 10-K, Exhibit 10(k), for the year ended December 31, 1993)* | |
| 10.2 | Owens & Minor, Inc. 1998 Stock Option and Incentive Plan, as amended (incorporated herein by reference to the Company’s Registration Statement on Form S-8, Registration No. 333-61550, Exhibit 4)* | |
| 10.3 | Owens & Minor, Inc. 1998 Directors’ Compensation Plan (incorporated herein by reference from Annex B of the Company’s definitive Proxy Statement filed pursuant to Section 14(a) of the Securities Exchange Act on March 13, 1998 (File No. 001-09810))* | |
| 10.4 | Amendment No. 1 to Owens & Minor, Inc. 1998 Directors’ Compensation Plan (incorporated herein by reference to the Company’s Annual Report on Form 10-K, Exhibit 10.15, for the year ended December 31, 1998)* | |
| 10.5 | Amendment to Owens & Minor, Inc. 1998 Directors’ Compensation Plan (incorporated herein by reference to the Company’s Quarterly Report on Form 10-Q, Exhibit 10.5, for the quarter ended March 31, 2008)* | |
| 10.6 | Owens & Minor, Inc. 2003 Directors’ Compensation Plan (incorporated herein by reference to Annex B of the Company’s definitive Proxy Statement filed pursuant to Section 14(a) of the Securities Exchange Act on March 13, 2003 (File No. 001-09810))* | |
| 10.7 | Amendment to 2003 Directors’ Compensation Plan (incorporated herein by reference to the Company’s Quarterly Report on Form 10-Q, Exhibit 10.6, for the quarter ended March 31, 2008)* | |
| 10.8 | Form of agreement with directors for entering into (i) Deferred Fee Program and (ii) Stock Purchase Program of the Directors’ Plan (incorporated herein by reference to the Company’s Annual Report on Form 10-K, Exhibit 10.9, for the year ended December 31, 2004)* | |
| 10.9 | Form of Director Restricted Stock Grant Agreement (incorporated herein by reference to the Company’s Current Report on Form 8-K, Exhibit 10.4, dated May 3, 2006)* | |
| 10.10 | Form of Director Restricted Stock Grant Agreement (incorporated herein by reference to the Company’s Quarterly Report on Form 10-Q, Exhibit 10.3, for the quarter ended March 31, 2008)* | |
| 10.11 | Owens & Minor, Inc. Directors Deferred Compensation Plan, as amended and restated effective January 1, 2005 (incorporated herein by reference to the Company’s Quarterly Report on Form 10-Q, Exhibit 10.3, for the quarter ended September 30, 2008)* | |
| 10.12 | Form of Owens & Minor, Inc. Executive Severance Agreement (incorporated herein by reference to the Company’s Current Report on Form 8-K, Exhibit 10.6, dated December 31, 2004)* | |
| 10.13 | Form of Owens & Minor, Inc. Executive Severance Agreement (effective January 1, 2011)* filed herewith. | |
| 10.14 | Owens & Minor, Inc. Supplemental Executive Retirement Plan, as amended and restated effective January 1, 2005 (incorporated herein by reference to the Company’s Quarterly Report on Form 10-Q, Exhibit 10.1, for the quarter ended September 30, 2008)* | |
| 10.15 | Owens & Minor, Inc. Amended and Restated Management Equity Ownership Program and Stock Ownership Rewards Program * filed herewith. | |
| 10.16 | Owens & Minor, Inc. Executive Deferred Compensation Plan (incorporated herein by reference to the Company’s Current Report on Form 8-K, Exhibit 10.5, dated December 31, 2004)* | |
| 10.17 | Amended and Restated Owens & Minor, Inc. Deferred Compensation Trust Agreement (“Deferred Compensation Trust”) (incorporated herein by reference to the Company’s Current Report on Form 8-K, Exhibit 10.4, dated December 31, 2004)* | |
68
Table of Contents
| 10.18 | Resolutions of the Board of Directors of the Company amending the Deferred Compensation Trust (incorporated herein by reference to the Company’s Current Report on Form 8-K, Exhibit 10.3, dated December 31, 2004)* | |
| 10.19 | Owens & Minor, Inc. Pension Plan, as amended and restated effective January 1, 1994 (“Pension Plan”) (incorporated herein by reference to the Company’s Annual Report on Form 10-K, Exhibit 10(c), for the year ended December 31, 1996)* | |
| 10.20 | Amendment No. 1 to Pension Plan (incorporated herein by reference to the Company’s Annual Report on Form 10-K, Exhibit 10(d), for the year ended December 31, 1996)* | |
| 10.21 | Amendment No. 2 to Pension Plan (incorporated herein by reference to the Company’s Annual Report on Form 10-K, Exhibit 10.5, for the year ended December 31, 1998)* | |
| 10.22 | Resolutions of the Board of Directors of the Company amending the Owens & Minor, Inc. Pension Plan. (incorporated herein by reference to the Company’s Current Report on Form 8-K, Exhibit 10.5, dated May 3, 2006)* | |
| 10.23 | Amendment No. 3 to Pension Plan (incorporated herein by reference to the Company’s Quarterly Report on Form 10-Q, Exhibit 10.2, for the quarter ended September 30, 2008)* | |
| 10.24 | Fourth Amendment to Pension Plan* filed herewith. | |
| 10.25 | Owens & Minor, Inc. 2005 Stock Incentive Plan, as amended (incorporated herein by reference to the Company’s Registration Statement on Form S-8, Registration No. 333-124965)* | |
| 10.26 | Resolution of the Board of Directors of the Company amending the Owens & Minor, Inc. 2005 Stock Incentive Plan (incorporated herein by reference to the Company’s Annual Report on Form 10-K, Exhibit 10.21, for the year ended December 31, 2007)* | |
| 10.27 | Amendment to Owens & Minor, Inc. 2005 Stock Incentive Plan (incorporated herein by reference to the Company’s Quarterly Report on Form 10-Q, Exhibit 10.4, for the quarter ended March 31, 2008)* | |
| 10.28 | Form of Owens & Minor, Inc. Stock Option Grant Agreement under 2005 Stock Incentive Plan (incorporated herein by reference to the company’s Current Report on Form 8-K, Exhibit 10.1, dated June 23, 2005)* | |
| 10.29 | Form of Owens & Minor, Inc. Restricted Stock Grant Agreement under 2005 Stock Incentive Plan (incorporated herein by reference to the Company’s Quarterly Report on Form 10-Q, Exhibit 10.2, for the quarter ended March 31, 2008)* | |
| 10.30 | Form of Performance Accelerated Restricted Stock Grant Agreement (incorporated herein by reference to the Company’s Current Report on Form 8-K, Exhibit 10.2, dated May 3, 2006)* | |
| 10.31 | Form of 2008 Performance Share Award Agreement (incorporated herein by reference to the Company’s Quarterly Report on Form 10-Q, Exhibit 10.1, for the quarter ended March 31, 2008)* | |
| 10.32 | Form of 2009 Performance Share Award Agreement (incorporated herein by reference to the Company’s Annual Report on Form 10-K, Exhibit 10.33, for the year ended December 31, 2008)* | |
| 10.33 | Form of Performance Share Award Agreement* filed herewith. | |
| 10.34 | 2010 Incentive Program (incorporated herein by reference to the Company’s Current Report on Form 8-K, dated November 21, 2009)* | |
| 10.35 | Owens & Minor, Inc. Officer Severance Policy Terms (incorporated herein by reference to the Company’s Current Report on Form 8-K, Exhibit 10.1, dated December 19, 2005)* | |
| 10.36 | Policy on Recoupment of Executive Incentive Compensation* filed herewith. | |
| 10.37 | Medical-Surgical Distribution Agreement between Novation, LLC and Owens & Minor Distribution, Inc. effective September 1, 2006 (incorporated herein by reference to the company’s Quarterly Report on Form 10-Q for the quarter ended June 30, 2006)** | |
69
Table of Contents
| 11.1 | Calculation of Net Income per Common Share. Information related to this item is in Part II, Item 8, Notes to Consolidated Financial Statements, Note 15—Net Income per Common Share | |
| 21.1 | Subsidiaries of Registrant | |
| 23.1 | Consent of KPMG LLP, independent registered public accounting firm | |
| 31.1 | Certification of Chief Executive Officer pursuant to Rule 13(a)-14(a) under the Securities Exchange Act of 1934, as adopted pursuant to Section 302 of the Sarbanes-Oxley Act of 2002 | |
| 31.2 | Certification of Chief Financial Officer pursuant to Rule 13(a)-14(a) under the Securities Exchange Act of 1934, as adopted pursuant to Section 302 of the Sarbanes-Oxley Act of 2002 | |
| 32.1 | Certification of Chief Executive Officer Pursuant to 18 U.S.C. Section 1350, as Adopted Pursuant to Section 906 of the Sarbanes-Oxley Act of 2002 | |
| 32.2 | Certification of Chief Financial Officer Pursuant to 18 U.S.C. Section 1350, as Adopted Pursuant to Section 906 of the Sarbanes-Oxley Act of 2002 | |
| * | Management contract or compensatory plan or arrangement. |
| ** | The Company has requested confidential treatment by the Commission of certain portions of this Agreement, which portions have been omitted and filed separately with the Commission. |
70
Table of Contents
SIGNATURES
Pursuant to the requirements of Section 13 or 15(d) of the Securities Exchange Act of 1934, the registrant has duly caused this report to be signed on its behalf by the undersigned, thereunto duly authorized, on the 25th day of February, 2010.
| OWENS & MINOR, INC. |
| /s/ CRAIG R. SMITH |
| Craig R. Smith President & Chief Executive Officer |
Pursuant to the requirements of the Securities Exchange Act of 1934, this report has been signed below by the following persons on behalf of the registrant and in the capacities indicated on the 25th day of February, 2010:
| /s/ CRAIG R. SMITH Craig R. Smith President & Chief Executive Officer |
/s/ RICHARD E. FOGG Richard E. Fogg Director | |
| /s/ JAMES L. BIERMAN James L. Bierman Senior Vice President & Chief Financial Officer |
/s/ EDDIE N. MOORE, JR. Eddie N. Moore, Jr. Director | |
| /s/ OLWEN B. CAPE Olwen B. Cape Vice President, Controller (Principal Accounting Officer) |
/s/ PETER S. REDDING Peter S. Redding Director | |
| /s/ G. GILMER MINOR, III G. Gilmer Minor, III Chairman of the Board of Directors |
/s/ JAMES E. ROGERS James E. Rogers Lead Director | |
| /s/ A. MARSHALL ACUFF, JR. A. Marshall Acuff, Jr. Director |
/s/ ROBERT C. SLEDD Robert C. Sledd Director | |
| /s/ J. ALFRED BROADDUS, JR. J. Alfred Broaddus, Jr. Director |
/s/ JAMES E. UKROP James E. Ukrop Director | |
| /s/ JOHN T. CROTTY John T. Crotty Director |
/s/ ANNE MARIE WHITTEMORE Anne Marie Whittemore Director | |
71
Table of Contents
Corporate Officers
Craig R. Smith (58)
President & Chief Executive Officer
President since 1999 and Chief Executive Officer since July 2005. Mr. Smith has been with the company since 1989.
Charles C. Colpo (52)
Executive Vice President & Chief Operating Officer
Executive Vice President, Administration, from 2008 to March 2010. Previously, Mr. Colpo served as Senior Vice President, Operations, from 1999 until 2008. Prior to that, he served as Senior Vice President, Operations & Technology, from April 2005 to July 2006. Mr. Colpo has been with the company since 1981.
James L. Bierman (57)
Senior Vice President & Chief Financial Officer
Senior Vice President & Chief Financial Officer since joining Owens & Minor in June 2007. Previously, Mr. Bierman served as Executive Vice President & Chief Financial Officer at Quintiles Transnational Corp. from 2001 to 2004. He joined Quintiles in 1998. Prior to that Mr. Bierman was a partner of Arthur Andersen LLP from 1988 to 1998.
Olwen B. Cape (60)
Vice President, Controller
Vice President, Controller, since 1997. Ms. Cape has been with the company since 1997.
E.V. Clarke (49)
Executive Vice President, Distribution
Executive Vice President, Distribution, since 2008. Previously Mr. Clarke served as Group Vice President, Sales & Distribution, from October 2006 until 2008. Prior to that, he served as President of Acute-Care for McKesson Medical-Surgical from April 2002 until September 2006, when the business was acquired by Owens & Minor.
Erika T. Davis (46)
Senior Vice President, Human Resources
Senior Vice President, Human Resources, since 2001. From 1999 to 2001, Ms. Davis was Vice President of Human Resources. Ms. Davis has been with the company since 1993.
D. Andrew Edwards (51)
Vice President, Finance
Vice President, Finance, since joining Owens & Minor in December 2009. Previously, Mr. Edwards served as Vice President & Chief Financial Officer at Tredegar Corporation from August 2003 to December 2009. He joined Tredegar in 1992.
Grace R. den Hartog (58)
Senior Vice President, General Counsel & Corporate Secretary
Senior Vice President, General Counsel & Corporate Secretary, since joining Owens & Minor in 2003. Previously, Ms. den Hartog served as a partner of McGuireWoods LLP from 1990 to 2003.
72
Table of Contents
Hugh F. Gouldthorpe, Jr. (71)
Vice President, Quality & Communications
Vice President, Quality & Communications, since 1993. Mr. Gouldthorpe has been with the company since 1986.
Richard W. Mears (49)
Senior Vice President, Chief Information Officer
Senior Vice President, Chief Information Officer, since joining Owens & Minor in 2005. Previously, Mr. Mears was an Executive Director with Perot Systems (now Dell Perot Systems) from 2003 to 2005, and an account executive from 1998 to 2003.
W. Marshall Simpson (41)
Senior Vice President, Sales & Marketing
Senior Vice President, Sales & Marketing, since November 2007. Previously, Mr. Simpson served as Group Vice President, Sales & Distribution, from 2005 until 2007, and as Regional Vice President from 2004 to 2005. Prior to that, Mr. Simpson served as Operating Vice President of Corporate Accounts from 2003 until 2004, and as Operating Vice President of Business Integration from 2002 to 2003. Mr. Simpson has been with the company since 1991.
Mark A. Van Sumeren (52)
Senior Vice President, Strategic Planning & Business Development
Senior Vice President, Strategic Planning & Business Development, since 2007, and Senior Vice President, Business Development, since 2006. Prior to that, Mr. Van Sumeren was Senior Vice President, OMSolutions SM from 2003 to 2006. Mr. Van Sumeren previously served as Vice President for Cap Gemini Ernst & Young from 2000 to 2003. He has been with the company since 2003.
Numbers inside parentheses indicate age.
73