Attached files
| file | filename |
|---|---|
| 8-K - FORM 8-K - Kennedy-Wilson Holdings, Inc. | kw201809308kq3earningsrele.htm |
Kennedy-Wilson Holdings, Inc.
Supplemental Financial Information
For the Quarter Ended September 30, 2018
TABLE OF CONTENTS
Supplemental Financial Information (unaudited) | ||
Components of Value | ||
Components of Value Summary | ||
All Property Multifamily and Commercial Investment Summary by Ownership | ||
Multifamily Investment Detail | ||
Commercial Investment Detail | ||
Unstabilized and Development Detail | ||
Debt Schedule | ||
Other Portfolio and Financial Information | ||
Appendix | ||
Cover
The property depicted on the cover of this earnings release and supplemental financial information is Pioneer Point, an apartment community in Ilford, UK.
Certain terms used in this release are defined below under the caption "Common Definitions". Certain information included in
this release constitutes non-GAAP financial measures. For a definition of the non-GAAP financial measures used in this release, see "Common Definitions" below, and for a reconciliation of those measures to their most comparable GAAP measure, see the tables set forth in the Company's supplemental financial information available at www.kennedywilson.com.
 | ||
Contact: Daven Bhavsar, CFA | ||
Director of Investor Relations | ||
(310) 887-3431 | ||
dbhavsar@kennedywilson.com | 151 S. El Camino Drive | |
www.kennedywilson.com | Beverly Hills, CA 90212 | |
NEWS RELEASE
KENNEDY WILSON REPORTS RECORD THIRD QUARTER 2018 RESULTS
Company increases quarterly dividend by 11%
BEVERLY HILLS, Calif. (October 31, 2018) - Kennedy-Wilson Holdings, Inc. (NYSE: KW) today reported results for 3Q-2018:
3Q | YTD | ||||||||||||||
(Amounts in millions, except per share data) | 2018 | 2017 | 2018 | 2017 | |||||||||||
GAAP Results | |||||||||||||||
GAAP Net Income (Loss) to Common Shareholders | $12.1 | ($8.9 | ) | $119.3 | $1.3 | ||||||||||
Per Diluted Share | 0.09 | (0.08 | ) | 0.83 | 0.01 | ||||||||||
Non-GAAP Results | |||||||||||||||
Adjusted EBITDA | $141.9 | $75.5 | $535.0 | $255.0 | |||||||||||
Adjusted Net Income | 74.1 | 34.8 | 308.2 | 128.5 | |||||||||||
*Please refer to pages 9-10 for a reconciliation of GAAP to Non-GAAP results.
"We delivered a record third quarter driven by strong operational performance and continued progress on the completion of our development and value-add initiatives," said William McMorrow, Chairman and CEO of Kennedy Wilson. "We look to continue executing our asset sale program, with a focus on smaller and non-core assets, while also driving organic NOI growth through upgrading our existing portfolio and acquiring well-located high quality assets and development sites in under-supplied and growing multifamily markets. Our global real estate portfolio and investment management business both remain well-positioned for continued growth."
3Q Highlights
• | Adjusted EBITDA Increased by $66 million to $142 million: |
◦ | The Company's share of Property NOI increased by $41 million from 3Q-17, primarily driven by the acquisition of KWE in 4Q-17. |
◦ | The Company's share of Net Gains and promotes increased by $32 million to $58 million from 3Q-17. |
3
• | Strong Same Property Performance with NOI up 4% Driven by Continued Growth in our Multifamily Portfolio: |
3Q - 2018 vs 3Q - 2017 | YTD - 2018 vs YTD - 2017 | |||||||||
Occupancy | Revenue | NOI | Occupancy | Revenue | NOI | |||||
Multifamily - Market Rate | 0.3% | 4.7% | 4.9% | 0.1% | 5.1% | 5.9% | ||||
Multifamily - Affordable | (0.5)% | 5.1% | 6.7% | (0.4)% | 5.6% | 7.0% | ||||
Commercial | 0.6% | 2.7% | 1.8% | —% | 4.1% | 2.7% | ||||
Hotel | N/A | 5.6% | 11.7% | NA | 4.5% | 12.4% | ||||
Total | 4.2% | 4.3% | 4.6% | 5.0% | ||||||
• | In-Place Estimated Annual NOI of $416 Million and Targeting Approximately an Additional $100 Million from Unstabilized and Development Assets by the End of 2023: |
◦ | Estimated Annual NOI from the stabilized portfolio decreased by 5% to $416 million from $439 million at year-end 2017. The decrease is primarily a result of the net sale of assets for the nine months ended September 30, 2018. |
◦ | Completed the lease-up and stabilization of the 300 Capital Dock office building and the Northbank apartments in Dublin, Pioneer Point apartments in London, and Vintage at Mill Creek apartments in Washington, which added $8 million to Estimated Annual NOI. |
◦ | Targeting an additional $26 million of Estimated Annual NOI to be in place by the end of 2019 (of which 76% is either multifamily or pre-leased office development), and an incremental $72-78 million to be in place by the end of 2023, through the planned completion of development and stabilization initiatives. |
Investment Activity
• | Capital Recycling: In the quarter, the Company invested $189 million of capital, allocating 78% to new acquisitions and 22% to capex and share repurchases. For the year, the Company invested $506 million of capital, allocating 50% to new acquisitions, 31% to share repurchases, and 19% to value-add capital expenditures. The Company generated $159 million of cash to KW from the sale of assets during 3Q-18, bringing its year-to-date total to $466 million of cash generated from dispositions. |
• | Acquisitions: The Company, together with its equity partners, completed $309 million of acquisitions in 3Q-18, including the following key transactions: |
◦ | City Block 3, Dublin, Ireland: The Company's largest acquisition for the quarter was a $131 million, six-acre, mixed use development site in Dublin, Ireland. The Company holds a 50% ownership interest with an initial equity investment of $79 million (inclusive of closing costs). The site contains planning permission to develop 452 apartment units and 300,000 square feet of commercial space, which is currently expected to complete in 2022. |
◦ | Southridge, Reno, Nevada: The Company acquired a multifamily property in Reno, Nevada, totaling 293 units, for $36 million. The Company invested approximately $16 million of equity and secured a seven-year fixed rate loan of $20 million. In total, the Company has an interest in 1,241 multifamily units in Reno, including 648 units in its Vintage Housing affordable housing platform that are currently under development. |
• | Dispositions: The Company, together with its equity partners, completed $321 million of dispositions in 3Q-18, including the following key transactions: |
◦ | Italian Office Sale: The Company's largest sale of the quarter was a 283,000 square foot office asset in Milan, Italy, which was sold for $81 million. |
4
◦ | AXA JV Contribution: The Company contributed a 50% interest in three wholly-owned Irish multifamily assets - the Elysian, Northbank, and Liffey Trust - into its joint venture with AXA Investment Managers - Real Assets. |
Investment Management and Real Estate Services Business
• | Adjusted Fees: For the quarter, adjusted fees were $20 million, a decrease of $7 million from 3Q-2017. The decrease is related to lower base investment management fees of $6 million resulting primarily from the acquisition of KWE in 4Q-17, lower property management fees of $5 million primarily related to the sale of the Company's loan servicing platform in Spain in 4Q-2017, offset by higher investment management performance, acquisition, and disposition fees of $4 million. |
• | Fee-Bearing Capital Growth: The Company has raised $678 million of new fee-bearing capital over the last 12 months, bringing its total fee-bearing capital to $2.0 billion. |
Balance Sheet and Liquidity
• | Liquidity: Liquidity totaled $919 million, including cash of $419 million(1) and $500 million of capacity on the Company's undrawn revolving line of credit. |
• | Global Debt Profile: Kennedy Wilson's debt had a weighted average interest rate of 4.0% and a weighted average remaining maturity of 5.6 years, with 77% of total debt (at share) fixed and another 14% hedged against increases in interest rates. 45% of the Company's debt is either Euro or Sterling denominated and 55% is U.S. dollar denominated. |
• | Share Repurchase Plan(2): In 2018, the Company has repurchased 8.8 million shares for $157 million. As of September 30, 2018, the Company had $103 million remaining under its $250 million share repurchase plan. |
Dividend
• | Kennedy Wilson announced an 11% increase in its quarterly common dividend to $0.21 cents per share, or $0.84 on an annualized basis. The fourth quarter dividend is payable on January 3, 2019 to common shareholders of record as of December 28, 2018. |
Foreign Currency Fluctuations and Hedging
• | Income Statement |
◦ | 3Q Impact: For 3Q-2018, changes in foreign currency rates decreased both consolidated revenue and Adjusted EBITDA by 2% compared to foreign currency rates as of September 30, 2017. |
◦ | YTD Impact: For YTD-2018, changes in foreign currency rates increased consolidated revenue by 1% and Adjusted EBITDA remained flat compared to foreign currency rates as of September 30, 2017. |
• | Shareholders' Equity |
◦ | During the first nine months of the year, GBP and EUR foreign currency rates decreased by 4% and 3%, respectively, on average against the USD. The net decrease in shareholders' equity related to fluctuations in foreign currency and related hedges (in the GBP and EUR) was $16 million, equating to 1% of total Kennedy-Wilson Holdings, Inc. shareholders' equity. |
5
Subsequent Events
The Company and AXA Investment Managers - Real Assets in a 50/50 joint venture completed the acquisition of 274 units and a four-acre development site at the Grange, in the South Dublin suburb of Sandyford. The purchase was made from Grant Thornton Receiver, on behalf of the National Asset Management Agency (“NAMA”) for $183 million.
Footnotes
(1) Includes $60.1 million of restricted cash, which is included in cash and cash equivalents.
(2) Future purchases under the program may be made in the open market, in privately negotiated transactions, through the net settlement of the company's restricted stock grants or otherwise, with the amount and timing of the repurchases dependent on market conditions and subject to the Company's discretion.
Conference Call and Webcast Details
Kennedy Wilson will hold a live conference call and webcast to discuss results at 7:00 a.m. PT/ 10:00 a.m. ET on Thursday, November 1. The direct dial-in number for the conference call is (844) 340-4761 for U.S. callers and (412) 717-9616 for international callers.
A replay of the call will be available for one week beginning two hours after the live call and can be accessed by (877) 344-7529 for U.S. callers and (412) 317-0088 for international callers. The passcode for the replay is 10124756.
The webcast will be available at: https://services.choruscall.com/links/kw181101SioXWJVG.html. A replay of the webcast will be available one hour after the original webcast on the Company’s investor relations web site for three months.
About Kennedy Wilson
Kennedy Wilson (NYSE:KW) is a leading global real estate investment company. We own, operate, and invest in real estate both on our own and through our investment management platform. We focus on multifamily and office properties located in the Western U.S., UK, and Ireland. For further information on
Kennedy Wilson, please visit www.kennedywilson.com.
Tables Follow
6
Kennedy-Wilson Holdings, Inc.
Consolidated Balance Sheets
(Unaudited)
(Dollars in millions)
September 30, 2018 | December 31, 2017 | |||||||
Assets | ||||||||
Cash and cash equivalents | $ | 419.4 | $ | 351.3 | ||||
Accounts receivable | 75.8 | 62.7 | ||||||
Loan purchases and originations | 29.4 | 84.7 | ||||||
Real estate and acquired in place lease values, net of accumulated depreciation and amortization | 5,820.3 | 6,443.7 | ||||||
Unconsolidated investments | 789.7 | 519.3 | ||||||
Other assets | 246.8 | 263.1 | ||||||
Total assets | $ | 7,381.4 | $ | 7,724.8 | ||||
Liabilities | ||||||||
Accounts payable | $ | 28.1 | $ | 19.5 | ||||
Accrued expenses and other liabilities | 506.2 | 465.9 | ||||||
Mortgage debt | 2,872.2 | 3,156.6 | ||||||
KW unsecured debt | 1,250.6 | 1,179.4 | ||||||
KWE unsecured bonds | 1,282.5 | 1,325.9 | ||||||
Total liabilities | 5,939.6 | 6,147.3 | ||||||
Equity | ||||||||
Common stock | — | — | ||||||
Additional paid-in capital | 1,753.1 | 1,883.3 | ||||||
Accumulated deficit | (56.7 | ) | (90.6 | ) | ||||
Accumulated other comprehensive loss | (443.4 | ) | (427.1 | ) | ||||
Total Kennedy-Wilson Holdings, Inc. shareholders’ equity | 1,253.0 | 1,365.6 | ||||||
Noncontrolling interests | 188.8 | 211.9 | ||||||
Total equity | 1,441.8 | 1,577.5 | ||||||
Total liabilities and equity | $ | 7,381.4 | $ | 7,724.8 | ||||
7
Kennedy-Wilson Holdings, Inc.
Consolidated Statements of Operations
(Unaudited)
(Dollars in millions, except share amounts and per share data)
Three Months Ended September 30, | Nine Months Ended September 30, | |||||||||||||||
2018 | 2017 | 2018 | 2017 | |||||||||||||
Revenue | ||||||||||||||||
Rental | $ | 123.4 | $ | 125.5 | $ | 392.6 | $ | 373.6 | ||||||||
Hotel | 43.5 | 37.3 | 117.6 | 95.8 | ||||||||||||
Sale of real estate | 6.5 | 89.8 | 48.7 | 103.4 | ||||||||||||
Investment management, property services and research fees | 12.4 | 11.4 | 34.8 | 32.7 | ||||||||||||
Loan purchases, loan originations and other | — | 8.5 | 1.1 | 15.0 | ||||||||||||
Total revenue | 185.8 | 272.5 | 594.8 | 620.5 | ||||||||||||
Operating expenses | ||||||||||||||||
Rental operating | 38.2 | 38.0 | 119.5 | 110.5 | ||||||||||||
Hotel operating | 30.6 | 26.1 | 90.8 | 73.3 | ||||||||||||
Cost of real estate sold | 5.8 | 63.4 | 45.6 | 73.7 | ||||||||||||
Commission and marketing | 1.1 | 2.1 | 4.6 | 5.9 | ||||||||||||
Compensation and related | 38.3 | 35.4 | 122.8 | 113.5 | ||||||||||||
General and administrative | 11.7 | 10.8 | 36.6 | 30.7 | ||||||||||||
Depreciation and amortization | 51.5 | 55.4 | 158.7 | 157.2 | ||||||||||||
Total operating expenses | 177.2 | 231.2 | 578.6 | 564.8 | ||||||||||||
Income from unconsolidated investments, net of depreciation and amortization | 24.0 | 17.6 | 60.9 | 57.4 | ||||||||||||
Operating income | 32.6 | 58.9 | 77.1 | 113.1 | ||||||||||||
Non-operating income (expense) | ||||||||||||||||
Gain on sale of real estate, net | 39.4 | 5.3 | 304.2 | 77.0 | ||||||||||||
Acquisition-related expenses | (0.4 | ) | (1.0 | ) | (0.6 | ) | (2.3 | ) | ||||||||
Interest expense | (55.2 | ) | (56.8 | ) | (181.3 | ) | (158.9 | ) | ||||||||
Other income (loss) | 3.4 | (0.3 | ) | 13.5 | 4.6 | |||||||||||
Income before (provision for) benefit from income taxes | 19.8 | 6.1 | 212.9 | 33.5 | ||||||||||||
(Provision for) benefit from income taxes | (6.9 | ) | 3.7 | (33.7 | ) | (0.9 | ) | |||||||||
Net income | 12.9 | 9.8 | 179.2 | 32.6 | ||||||||||||
Net income attributable to noncontrolling interests | (0.8 | ) | (18.7 | ) | (59.9 | ) | (31.3 | ) | ||||||||
Net income (loss) attributable to Kennedy-Wilson Holdings, Inc. common shareholders | $ | 12.1 | $ | (8.9 | ) | $ | 119.3 | $ | 1.3 | |||||||
Basic earnings per share(1) | ||||||||||||||||
Income (loss) per basic | $ | 0.09 | $ | (0.08 | ) | $ | 0.83 | $ | 0.01 | |||||||
Weighted average shares outstanding for basic | 141,003,413 | 111,966,716 | 143,450,695 | 111,955,924 | ||||||||||||
Diluted earnings per share(1) | ||||||||||||||||
Income (loss) per diluted | $ | 0.09 | $ | (0.08 | ) | $ | 0.83 | $ | 0.01 | |||||||
Weighted average shares outstanding for diluted | 141,800,972 | 111,966,716 | 144,516,045 | 111,955,924 | ||||||||||||
Dividends declared per common share | $ | 0.19 | $ | 0.17 | $ | 0.57 | $ | 0.51 | ||||||||
(1) Includes impact of the Company allocating income and dividends per basic and diluted share to participating securities.
8
Kennedy-Wilson Holdings, Inc.
Adjusted EBITDA
(Unaudited)
(Dollars in millions)
The table below reconciles Adjusted EBITDA to net income attributable to Kennedy-Wilson Holdings, Inc. common shareholders, using Kennedy Wilson’s pro-rata share amounts for each adjustment item.
Three Months Ended | Nine Months Ended | |||||||||||||||
September 30, | September 30, | |||||||||||||||
2018 | 2017 | 2018 | 2017 | |||||||||||||
Net income (loss) attributable to Kennedy-Wilson Holdings, Inc. common shareholders | $ | 12.1 | $ | (8.9 | ) | $ | 119.3 | $ | 1.3 | |||||||
Non-GAAP adjustments: | ||||||||||||||||
Add back (Kennedy Wilson's Share)(1): | ||||||||||||||||
Interest expense | 60.9 | 46.1 | 193.1 | 129.7 | ||||||||||||
Depreciation and amortization | 52.8 | 34.4 | 161.0 | 97.8 | ||||||||||||
Provision for (benefit from) income taxes | 6.9 | (5.4 | ) | 33.7 | (3.2 | ) | ||||||||||
Share-based compensation | 9.2 | 9.3 | 27.9 | 29.4 | ||||||||||||
Adjusted EBITDA | $ | 141.9 | $ | 75.5 | $ | 535.0 | $ | 255.0 | ||||||||
(1) See Appendix for reconciliation of Kennedy Wilson's Share amounts.
The table below provides a detailed reconciliation of Adjusted EBITDA to net income.
Three Months Ended | Nine Months Ended | |||||||||||||||
September 30, | September 30, | |||||||||||||||
2018 | 2017 | 2018 | 2017 | |||||||||||||
Net income | $ | 12.9 | $ | 9.8 | $ | 179.2 | $ | 32.6 | ||||||||
Non-GAAP adjustments: | ||||||||||||||||
Add back: | ||||||||||||||||
Interest expense | 55.2 | 56.8 | 181.3 | 158.9 | ||||||||||||
Kennedy Wilson's share of interest expense included in unconsolidated investments | 7.1 | 5.5 | 18.3 | 17.0 | ||||||||||||
Depreciation and amortization | 51.5 | 55.4 | 158.7 | 157.2 | ||||||||||||
Kennedy Wilson's share of depreciation and amortization included in unconsolidated investments | 3.4 | 4.3 | 10.0 | 13.0 | ||||||||||||
Provision for (benefit from) income taxes | 6.9 | (3.7 | ) | 33.7 | 0.9 | |||||||||||
Share-based compensation | 9.2 | 9.3 | 27.9 | 29.4 | ||||||||||||
EBITDA attributable to noncontrolling interests(1) | (4.3 | ) | (61.9 | ) | (74.1 | ) | (154.0 | ) | ||||||||
Adjusted EBITDA | $ | 141.9 | $ | 75.5 | $ | 535.0 | $ | 255.0 | ||||||||
(1) EBITDA attributable to noncontrolling interest includes $2.1 million and $25.3 million of depreciation and amortization, $1.4 million and $16.2 million of interest, and $0.0 million and $1.7 million of taxes, for the three months ended September 30, 2018 and 2017, respectively. EBITDA attributable to noncontrolling interest includes $7.7 million and $72.4 million of depreciation and amortization, $6.5 million and $46.2 million of interest, and $0.0 million and $4.1 million of taxes, for the nine months ended September 30, 2018 and 2017, respectively.
9
Kennedy-Wilson Holdings, Inc.
Adjusted Net Income
(Unaudited)
(Dollars in millions, except share data)
The table below reconciles Adjusted Net Income to net income attributable to Kennedy-Wilson Holdings, Inc. common shareholders, using Kennedy Wilson’s pro-rata share amounts for each adjustment item.
Three Months Ended | Nine Months Ended | |||||||||||||||
September 30, | September 30, | |||||||||||||||
2018 | 2017 | 2018 | 2017 | |||||||||||||
Net income (loss) attributable to Kennedy-Wilson Holdings, Inc. common shareholders | $ | 12.1 | $ | (8.9 | ) | $ | 119.3 | $ | 1.3 | |||||||
Non-GAAP adjustments: | ||||||||||||||||
Add back (Kennedy Wilson's Share)(1): | ||||||||||||||||
Depreciation and amortization | 52.8 | 34.4 | 161.0 | 97.8 | ||||||||||||
Share-based compensation | 9.2 | 9.3 | 27.9 | 29.4 | ||||||||||||
Adjusted Net Income | $ | 74.1 | $ | 34.8 | $ | 308.2 | $ | 128.5 | ||||||||
Weighted average shares outstanding for diluted | 141,800,972 | 111,966,716 | 144,516,045 | 111,955,924 | ||||||||||||
(1) See Appendix for reconciliation of Kennedy Wilson's Share amounts.
The table below provides a detailed reconciliation of Adjusted Net Income to net income.
Three Months Ended | Nine Months Ended | |||||||||||||||
September 30, | September 30, | |||||||||||||||
2018 | 2017 | 2018 | 2017 | |||||||||||||
Net income | $ | 12.9 | $ | 9.8 | $ | 179.2 | $ | 32.6 | ||||||||
Non-GAAP adjustments: | ||||||||||||||||
Add back (less): | ||||||||||||||||
Depreciation and amortization | 51.5 | 55.4 | 158.7 | 157.2 | ||||||||||||
Kennedy Wilson's share of depreciation and amortization included in unconsolidated investments | 3.4 | 4.3 | 10.0 | 13.0 | ||||||||||||
Share-based compensation | 9.2 | 9.3 | 27.9 | 29.4 | ||||||||||||
Net income attributable to the noncontrolling interests, before depreciation and amortization(1) | (2.9 | ) | (44.0 | ) | (67.6 | ) | (103.7 | ) | ||||||||
Adjusted Net Income | $ | 74.1 | $ | 34.8 | $ | 308.2 | $ | 128.5 | ||||||||
Weighted average shares outstanding for diluted | 141,800,972 | 111,966,716 | 144,516,045 | 111,955,924 | ||||||||||||
(1) Includes $2.1 million and $25.3 million of depreciation and amortization for the three months ended September 30, 2018 and 2017, respectively, and $7.7 million and $72.4 million of depreciation and amortization for the nine months ended September 30, 2018 and 2017.
10
Forward-Looking Statements
Statements made by us in this report and in other reports and statements released by us that are not historical facts constitute "forward-looking statements" within the meaning of Section 27A of the Securities Act of 1933, as amended, and Section 21E of the Securities Exchange Act of 1934, as amended. These forward-looking statements are necessarily estimates reflecting the judgment of our senior management based on our current estimates, expectations, forecasts and projections and include comments that express our current opinions about trends and factors that may impact future operating results. Disclosures that use words such as "believe," "anticipate," "estimate," "intend," "may," "could," "plan," "expect," "project" or the negative of these, as well as similar expressions, are intended to identify forward-looking statements. These statements are not guarantees of future performance, rely on a number of assumptions concerning future events, many of which are outside of our control, and involve known and unknown risks and uncertainties that could cause our actual results, performance or achievement, or industry results, to differ materially from any future results, performance or achievements expressed or implied by such forward-looking statements. These risks and uncertainties may include the factors and the risks and uncertainties described elsewhere in this report and other filings with the Securities and Exchange Commission (the "SEC"), including the Item 1A. "Risk Factors" section of our Annual Report on Form 10-K for the year ended December 31, 2017, as amended by our subsequent filings with the SEC. Any such forward-looking statements, whether made in this report or elsewhere, should be considered in the context of the various disclosures made by us about our businesses including, without limitation, the risk factors discussed in our filings with the SEC. Except as required under the federal securities laws and the rules and regulations of the SEC, we do not have any intention or obligation to update publicly any forward-looking statements, whether as a result of new information, future events, changes in assumptions, or otherwise.
Common Definitions
· “KWH,” "KW," “Kennedy Wilson,” the "Company," "we," "our," or "us" refers to Kennedy-Wilson Holdings, Inc. and its wholly-owned subsidiaries. The consolidated financial statements of the Company include the results of the Company's consolidated subsidiaries.
· “KWE” refers to Kennedy Wilson Europe Real Estate plc, which was a London Stock Exchange-listed company that we externally managed through a wholly-owned subsidiary. On October 20, 2017 we acquired KWE, which is now a wholly-owned subsidiary. Prior to the acquisition, we owned approximately 24% and in accordance with U.S. GAAP, the results of KWE were consolidated in our financial statements.
· “Adjusted EBITDA” represents net income before interest expense, our share of interest expense included in income from investments in unconsolidated investments, depreciation and amortization, our share of depreciation and amortization included in income from unconsolidated investments, loss on early extinguishment of corporate debt and income taxes, share-based compensation expense for the Company and EBITDA attributable to noncontrolling interests.
Please also see the reconciliation to GAAP in the Company’s supplemental financial information included in this release and also available at www.kennedywilson.com. Our management uses Adjusted EBITDA to analyze our business because it adjusts net income for items we believe do not accurately reflect the nature of our business going forward or that relate to non-cash compensation expense or noncontrolling interests. Such items may vary for different companies for reasons unrelated to overall operating performance. Additionally, we believe Adjusted EBITDA is useful to investors to assist them in getting a more accurate picture of our results from operations. However, Adjusted EBITDA is not a recognized measurement under GAAP and when analyzing our operating performance, readers should use Adjusted EBITDA in addition to, and not as an alternative for, net income as determined in accordance with GAAP. Because not all companies use identical calculations, our presentation of Adjusted EBITDA may not be comparable to similarly titled measures of other companies. Furthermore, Adjusted EBITDA is not intended to be a measure of free cash flow for our management’s discretionary use, as it does not remove all non-cash items (such as acquisition-related gains) or consider certain cash requirements such as tax and debt service payments. The amount shown for Adjusted EBITDA also differs from the amount calculated under
11
similarly titled definitions in our debt instruments, which are further adjusted to reflect certain other cash and non-cash charges and are used to determine compliance with financial covenants and our ability to engage in certain activities, such as incurring additional debt and making certain restricted payments.
· “Adjusted fees’’ refers to Kennedy Wilson’s gross investment management, property services and research fees adjusted to include Kennedy Wilson's share of fees eliminated in consolidation, Kennedy Wilson’s share of fees in unconsolidated service businesses and performance fees included in unconsolidated investments. Effective January 1, 2018, we adopted new GAAP guidance on revenue recognition and implemented a change in accounting principles related to performance allocations, which resulted in us now accounting for performance allocations (commonly referred to as “performance fees” or “carried interest”) under the GAAP guidance for equity method investments and presenting performance allocations as a component of income from unconsolidated investments. Our management uses Adjusted fees to analyze our investment management and real estate services business because the measure removes required eliminations under GAAP for properties in which the Company provides services but also has an ownership interest. These eliminations understate the economic value of the investment management, property services and research fees and makes the Company comparable to other real estate companies that provide investment management and real estate services but do not have an ownership interest in the properties they manage. Our management believes that adjusting GAAP fees to reflect these amounts eliminated in consolidation presents a more holistic measure of the scope of our investment management and real estate services business.
· “Adjusted Net Income” represents net income before depreciation and amortization, our share of depreciation and amortization included in income from unconsolidated investments, share-based compensation and net income attributable to noncontrolling interests, before depreciation and amortization. Please also see the reconciliation to GAAP in the Company’s supplemental financial information included in this release and also available at www.kennedywilson.com.
· “Cap rate” represents the net operating income of an investment for the year preceding its acquisition or disposition, as applicable, divided by the purchase or sale price, as applicable. Cap rates set forth in this presentation only includes data from income-producing properties. We calculate cap rates based on information that is supplied to us during the acquisition diligence process. This information is not audited or reviewed by independent accountants and may be presented in a manner that is different from similar information included in our financial statements prepared in accordance with GAAP. In addition, cap rates represent historical performance and are not a guarantee of future NOI. Properties for which a cap rate is provided may not continue to perform at that cap rate.
· "Consolidated investment account" refers to the sum of Kennedy Wilson’s equity in: cash held by consolidated investments, consolidated real estate and acquired in-place leases gross of accumulated depreciation and amortization, net hedge asset or liability, unconsolidated investments, consolidated loans, and net other assets.
· "Equity partners" refers to non-wholly-owned subsidiaries that we consolidate in our financial statements under U.S. GAAP and third-party equity providers.
· "Estimated annual NOI" is a property-level non-GAAP measure representing the estimated annual net operating income from each property as of the date shown, inclusive of rent abatements (if applicable). The calculation excludes depreciation and amortization expense, and does not capture the changes in the value of our properties that result from use or market conditions, nor the level of capital expenditures, tenant improvements, and leasing commissions necessary to maintain the operating performance of our properties. Any of the enumerated items above could have a material effect on the performance of our properties. Also, where specifically noted, for properties purchased in 2018, the NOI represents estimated Year 1 NOI from our original underwriting. Estimated year 1 NOI for properties purchased in 2018 may not be indicative of the actual results for those properties. Estimated annual NOI is not an indicator of the actual annual net operating income that the Company will or expects to realize in any period. Please also see the definition of "Net operating income" below. The Company does not provide a reconciliation for estimated annual NOI to its most directly comparable forward-looking GAAP financial measure, because it is unable to provide a meaningful or accurate estimation of each of the component reconciling items, and the information is not available without unreasonable effort. This is due to the inherent difficulty of forecasting the timing and/or amount of various items that would impact estimated annual NOI, including, for example, gains on sales of depreciable real estate and other items that have not yet occurred and are
12
out of the company’s control. For the same reasons, the Company is unable to meaningfully address the probable significance of the unavailable information and believes that providing a reconciliation for estimated annual NOI would imply a degree of precision as to its forward-looking net operating income that would be confusing or misleading to investors.
· "Estimated Forward Return on Cost” represents the Company’s estimate of future net operating income, assuming it has completed its planned value-add asset management initiatives, divided by the sum of the purchase price and additional capital expenditure costs that are expected to be incurred in accordance with the Company’s original underwriting at the time of acquisition. This information is not audited or reviewed by independent accountants and may be presented in a manner that is different from similar information included in our financial statements prepared in accordance with GAAP. Estimated Forward Return on Cost is based on management’s current expectations and are based on assumptions that may prove to be inaccurate and involve known and unknown risks. For example, Estimated Forward Return on Cost is based in part on data made available to us during the course of our due diligence process in connection with asset acquisitions and assumes the timely and on-budget completion of our value-add initiatives, the timely leasing of all additional capacity and the absence of customer defaults or early lease terminations. Accordingly, the actual return on cost of an investment made by the Company may differ materially and adversely from the Estimated Forward Return on Cost figures set forth in this release, and we caution you not to place undue reliance on such figures.
· "Gross Asset Value” refers to the gross carrying value of assets, before debt, depreciation and amortization, and net of noncontrolling interests.
· "Investment account” refers to the consolidated investment account presented after noncontrolling interest on invested assets gross of accumulated depreciation and amortization.
· | "Investment Management and Real Estate Services Assets under Management" ("IMRES AUM") generally refers to the properties and other assets with respect to which we provide (or participate in) oversight, investment management services and other advice, and which generally consist of real estate properties or loans, and investments in joint ventures. Our IMRES AUM is principally intended to reflect the extent of our presence in the real estate market, not the basis for determining our management fees. Our IMRES AUM consists of the total estimated fair value of the real estate properties and other real estate related assets either owned by third parties, wholly owned by us or held by joint ventures and other entities in which our sponsored funds or investment vehicles and client accounts have invested. Committed (but unfunded) capital from investors in our sponsored funds is not included in our IMRES AUM. The estimated value of development properties is included at estimated completion cost. |
· "Net Gains" represent the Company’s share of gains from the disposition of real estate and real estate related assets, net of any impairment losses. For consolidated assets, amounts are included in the “Sale of Real Estate” and “Cost of Real Estate Sold” or “Gain on sale of asset, net” line item on the Company’s income statement, in accordance with U.S. GAAP. For unconsolidated investments, amounts are included in the “Income from unconsolidated investments, net of depreciation and amortization” line item on the Company’s income statement in accordance with U.S. GAAP.
· "Net operating income" or " NOI” is a non-GAAP measure representing the income produced by a property calculated by deducting operating expenses from operating revenues. Our management uses net operating income to assess and compare the performance of our properties and to estimate their fair value. Net operating income does not include the effects of depreciation or amortization or gains or losses from the sale of properties because the effects of those items do not necessarily represent the actual change in the value of our properties resulting from our value-add initiatives or changing market conditions. Our management believes that net operating income reflects the core revenues and costs of operating our properties and is better suited to evaluate trends in occupancy and lease rates. Please also see the reconciliation to GAAP in the Company’s supplemental financial information included in this release and also available at www.kennedywilson.com.
· "Noncontrolling interests" represents the portion of equity ownership in a consolidated subsidiary not attributable to Kennedy Wilson.
13
· "Pro-Rata" represents Kennedy Wilson's share calculated by using our proportionate economic ownership of each asset in our portfolio, including our approximate 24% ownership in KWE immediately prior to our acquisition of KWE. Please also refer to the pro-rata financial data in our supplemental financial information.
· "Property NOI" or "Property-level NOI" is a non-GAAP measure calculated by deducting the Company's Pro-Rata share of rental and hotel operating expenses from the Company's Pro-Rata rental and hotel revenues. Please also see the reconciliation to GAAP in the Company’s supplemental financial information included in this release and also available at www.kennedywilson.com.
· “Same property” refers to properties in which Kennedy Wilson has an ownership interest during the entire span of both periods being compared. The same property information presented throughout this report is shown on a cash basis and excludes non-recurring expenses. This analysis excludes properties that are either under development or undergoing lease up as part of our asset management strategy.
Note about Non-GAAP and certain other financial information included in this presentation
In addition to the results reported in accordance with U.S. generally accepted accounting principles ("GAAP") included within this presentation, Kennedy Wilson has provided certain information, which includes non-GAAP financial measures (including Adjusted EBITDA, Adjusted Net Income, Net Operating Income, and Adjusted Fees, as defined above). Such information is reconciled to its closest GAAP measure in accordance with the rules of the SEC, and such reconciliations are included within this presentation. These measures may contain cash and non-cash acquisition-related gains and expenses and gains and losses from the sale of real-estate related investments. Consolidated non-GAAP measures discussed throughout this report contain income or losses attributable to non-controlling interests. Management believes that these non-GAAP financial measures are useful to both management and Kennedy Wilson's shareholders in their analysis of the business and operating performance of the Company. Management also uses this information for operational planning and decision-making purposes. Non-GAAP financial measures are not and should not be considered a substitute for any GAAP measures. Additionally, non-GAAP financial measures as presented by Kennedy Wilson may not be comparable to similarly titled measures reported by other companies. Annualized figures used throughout this release and supplemental financial information, and our estimated annual net operating income metrics, are not an indicator of the actual net operating income that the Company will or expects to realize in any period.
KW-IR
14
Supplemental Financial Information | ||
15
Kennedy-Wilson Holdings, Inc.
Capitalization Summary
(Unaudited)
(Dollars in millions, except per share data)
September 30, 2018 | December 31, 2017 | |||||||
Market Data | ||||||||
Common stock price per share | $ | 21.50 | $ | 17.35 | ||||
Common stock shares outstanding | 144,192,075 | 151,561,284 | ||||||
Equity Market Capitalization | $ | 3,100.1 | $ | 2,629.6 | ||||
Kennedy Wilson's Share of Debt | ||||||||
Kennedy Wilson's share of property debt | 3,264.1 | 3,534.0 | ||||||
Senior notes payable | 1,150.0 | 900.0 | ||||||
Kennedy Wilson Europe bonds | 1,290.9 | 1,335.2 | ||||||
Credit Facility | 125.0 | 300.0 | ||||||
Total Kennedy Wilson's share of debt | 5,830.0 | 6,069.2 | ||||||
Total Capitalization | $ | 8,930.1 | $ | 8,698.8 | ||||
Less: Kennedy Wilson's share of cash | (455.6 | ) | (345.7 | ) | ||||
Total Enterprise Value | $ | 8,474.5 | $ | 8,353.1 | ||||
16
Kennedy-Wilson Holdings, Inc.
Components of Value Summary
As of September 30, 2018
(Unaudited, Dollars in millions)
Below are key valuation metrics provided to assist in the calculation of a sum-of-the-parts valuation of the Company as of September 30, 2018. Please note that excluded below is the potential value of the Company's future promoted interest as well as the value of the Company's team and brand. A sum of the parts can be calculated by adding together KW’s share of the value of its investments (#1-#6), the value of KW’s services business (#7-#9) and subtracting KW’s net liabilities (#10-#11).
Kennedy Wilson's Share | ||||||||||||||
Investments | Description | Occupancy | Est. Annual NOI(1)(2) | Common Valuation Approach | Page # | |||||||||
Income Producing Assets | ||||||||||||||
1 | Multifamily | 23,264 units | 94.3% | $ | 176.4 | Cap rate | ||||||||
2 | Commercial | 15.8 million square feet | 94.7% | 207.8 | Cap rate | |||||||||
3 | Hotels | 11 Hotels / 1,717 Hotel Rooms | N/A | 31.4 | Cap rate | |||||||||
Total Estimated Annual NOI | $ | 415.6 | ||||||||||||
Unstabilized, Development, and Non-income Producing Assets | KW Gross Asset Value | |||||||||||||
4 | Unstabilized(5) | 474 multifamily units 1.9 million commercial sq. ft. | 37.6% | $ | 460.4 | Multiple of gross asset value | ||||||||
5 | Development(5) | 3,155 multifamily units 0.9 million commercial sq. ft. One five-star resort | N/A | 486.1 | Multiple of gross asset value | |||||||||
6 | Loans, residential, and other(5) | 20 investments, 6 unresolved loans | N/A | 274.0 | Multiple of gross asset value | |||||||||
Total Gross Asset Value | $ | 1,220.5 | ||||||||||||
Investment Management and Real Estate Services | TTM Adj. Fees(3) | TTM Adj. EBITDA(3) | ||||||||||||
7 | Investment management | Management and promote fees | $ | 53.1 | $ | 36.3 | Adj. EBITDA or Adj. Fees Multiple | |||||||
8 | Property services | Fees and commissions | 15.9 | (0.3 | ) | Adj. EBITDA or Adj. Fees Multiple | ||||||||
9 | Meyers Research | Subscription revenue and consulting fees | 15.7 | (2.4 | ) | Adj. Fees Multiple | ||||||||
Total | $ | 84.7 | $ | 33.6 | ||||||||||
Net Debt | Total | |||||||||||||
10 | KW Share of Debt(4) | Secured and Unsecured Debt | $ | 6,085.6 | Face Value | |||||||||
11 | KW Share of Cash | Cash | (455.6 | ) | Book Value | |||||||||
Total Net Debt | $ | 5,630.0 | ||||||||||||
(1) Please see “common definitions” for a definition of estimated annual NOI and a description of its limitations. The Company does not provide a reconciliation for estimated annual NOI to its most directly comparable forward looking GAAP financial measure, because it is unable to provide a meaningful or accurate estimation of each of the component reconciling items, and the information is not available without unreasonable effort. This is due to the inherent difficulty of forecasting the timing and/or amount of various items that would impact estimated annual NOI, including, for example, gains on sales of depreciable real estate and other items that have not yet occurred and are out of the Company’s control. For the same reasons, the Company is unable to meaningfully address the probable significance of the unavailable information and believes that providing a reconciliation for estimated annual NOI would imply a degree of precision as to its forward-looking net operating income that would be confusing or misleading to investors.
(2) Based on weighted-average ownership figures held by KW.
17
(3) TTM figures are representative of the trailing 12 months (excluding fees for the management of KWE) and are not indicators of the actual results that the Company will or expects to realize in any period.
(4) Includes Kennedy Wilson's share of debt at Vintage Housing Holdings of $255.6 million, based on economic ownership
(5) See additional detail related to Unstabilized, Development, and Non-income Producing Assets, as of September 30, 2018. KW Share of Debt below is included in the Net Debt amounts within the Components of Value Summary above.
KW Gross Asset Value | KW Share of Debt | Investment Account | ||||||||||
Unstabilized - Multifamily and Commercial | $ | 460.4 | $ | 128.4 | $ | 332.0 | ||||||
Development - Multifamily, Commercial, and Hotel | 486.1 | 104.6 | 381.5 | |||||||||
Loans, residential, and other | 274 | 4.7 | 269.3 | |||||||||
Unstabilized, Development, and Non-income Producing Assets | $ | 1,220.5 | $ | 237.7 | $ | 982.8 | ||||||
18
Kennedy-Wilson Holdings, Inc.
Incoming-Producing Properties
As of September 30, 2018
(Unaudited, Dollars in millions)
The pie charts below reflect Kennedy Wilson's Pro-rata share of Estimated Annual NOI (from income-producing properties) by country and property type, as of September 30, 2018, of which 80% is derived from wholly-owned assets.
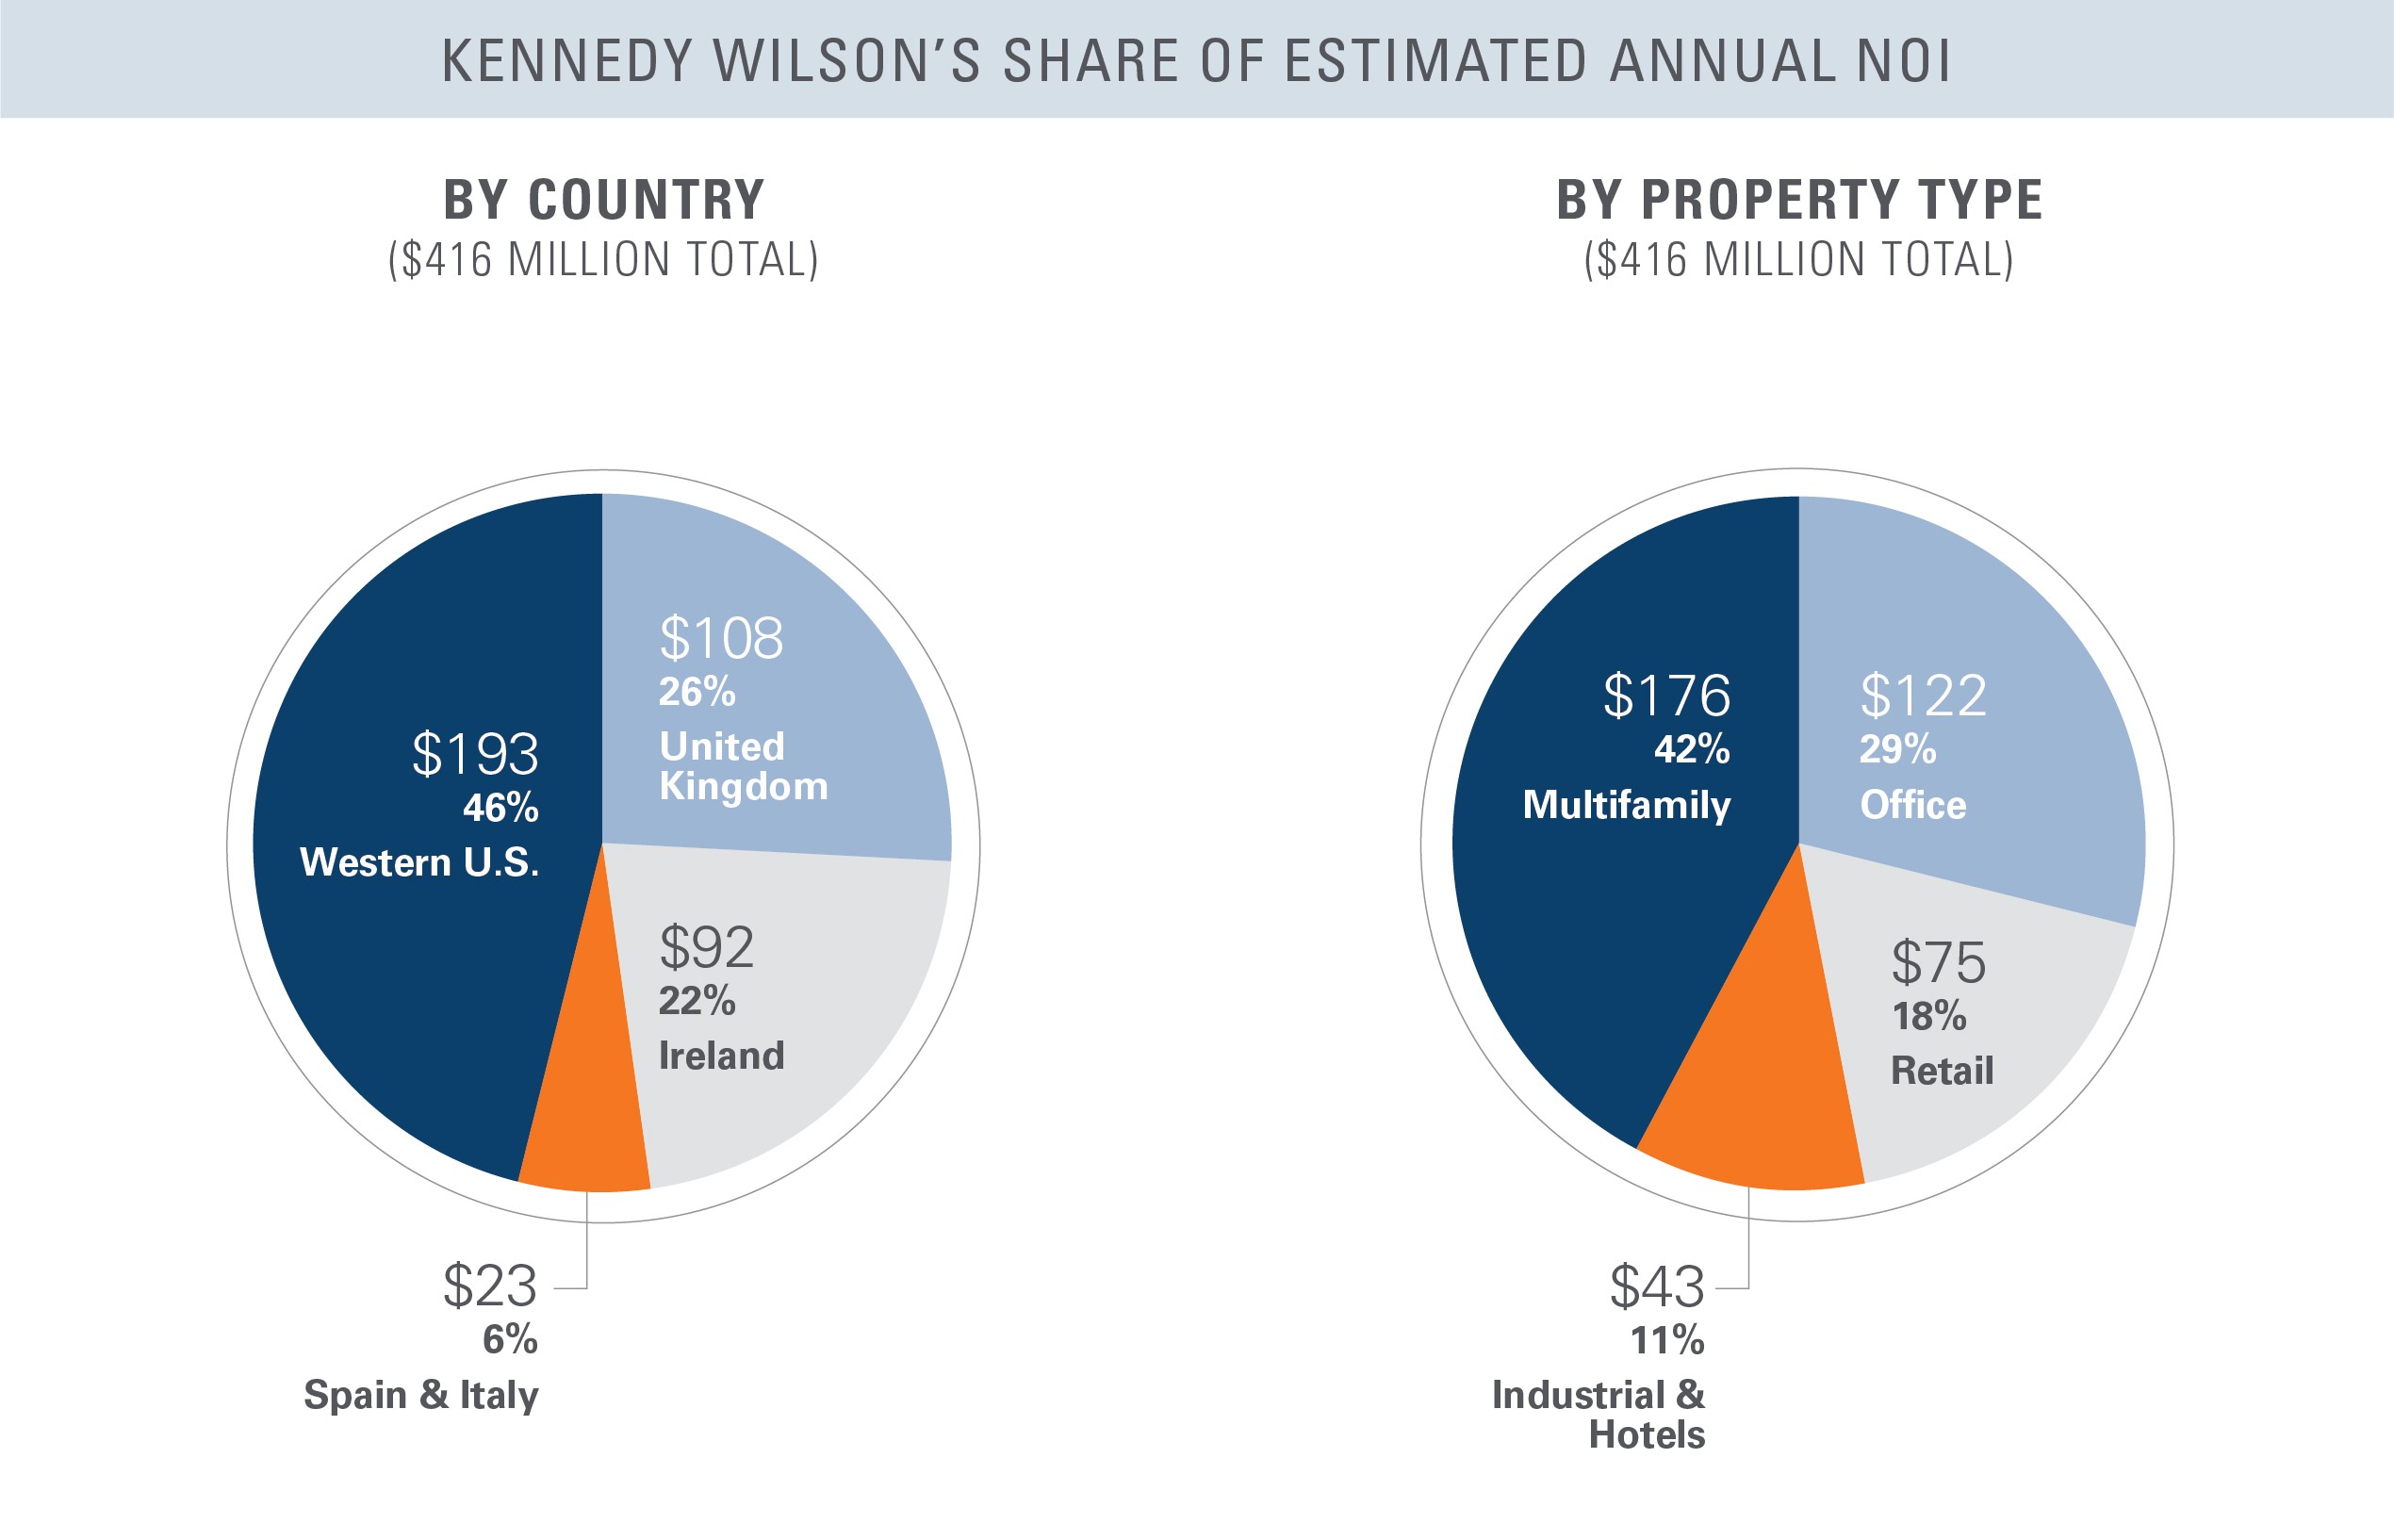
The following summarizes Kennedy Wilson's pro-rata share of estimated annual NOI from its income-producing portfolio by property type and geography.
Pacific Northwest | Southern California | Northern California | Mountain States | Hawaii | U.K. | Ireland | Italy | Spain | Total | |||||||||||||||||||||
Multifamily - Market Rate | $ | 52.0 | $ | 21.8 | $ | 28.2 | $ | 25.8 | $ | — | $ | 4.3 | $ | 24.4 | $ | — | $ | — | $ | 156.5 | ||||||||||
Multifamily - Affordable | 14.5 | 1.6 | 2.0 | 1.8 | — | — | — | — | — | 19.9 | ||||||||||||||||||||
Office | 16.1 | 10.9 | — | 0.7 | — | 47.6 | 35.8 | 10.4 | — | 121.5 | ||||||||||||||||||||
Retail | 0.9 | 2.4 | 1.0 | 9.8 | — | 37.6 | 10.9 | — | 12.0 | 74.6 | ||||||||||||||||||||
Industrial | — | — | — | — | — | 11.7 | — | — | — | 11.7 | ||||||||||||||||||||
Hotel | — | — | 3.4 | — | 0.2 | 6.8 | 21.0 | — | — | 31.4 | ||||||||||||||||||||
Total Estimated Annual NOI | $ | 83.5 | $ | 36.7 | $ | 34.6 | $ | 38.1 | $ | 0.2 | $ | 108.0 | $ | 92.1 | $ | 10.4 | $ | 12.0 | $ | 415.6 | ||||||||||
19
Kennedy-Wilson Holdings, Inc.
All-Property Investment Summary by Ownership
As of September 30, 2018
(Unaudited)
(Dollars in millions)
The following summarizes Kennedy Wilson's income-producing multifamily and commercial portfolio by ownership category. Excluded below are unstabilized, development, loans, and residential and other investments.
Total Portfolio | ||||||||||||
September 30, 2018 | December 31, 2017 | |||||||||||
KW Ownership Category | Multifamily Units | Commercial Rentable Sq. Ft. | Hotel Rooms | KW Share of Est. Annual NOI(1) | Ownership(2) | Estimated Annual NOI Change | Multifamily Units | Commercial Rentable Sq. Ft. | Hotel Rooms | KW Share of Est. Annual NOI(1) | Ownership(2) | |
~100% Owned | 9,994 | 9.9 | 1,475 | $333.4 | 99.4% | (7.9 | )% | 9,841 | 12.3 | 611 | $362.0 | 99.5% |
~50% owned | 10,242 | 0.9 | 170 | 66.8 | 45.8% | 11.1 | % | 9,452 | 0.9 | 363 | 60.1 | 48.2% |
Minority-owned | 3,028 | 5.0 | 72 | 15.4 | 13.7% | (7.8 | )% | 4,572 | 3.9 | N/A | 16.7 | 14.5% |
Total | 23,264 | 15.8 | 1,717 | $415.6 | 70.2% | (5.3 | )% | 23,865 | 17.1 | 974 | $438.8 | 72.6% |
(1) | Please see “common definitions” for a definition of estimated annual NOI and a description of its limitations. The Company does not provide a reconciliation for estimated annual NOI to its most directly comparable forward-looking GAAP financial measure, because it is unable to provide a meaningful or accurate estimation of reconciling items and the information is not available without unreasonable effort. This is due to the inherent difficulty of forecasting the timing and/or amount of various items that would impact estimated annual NOI, including, for example, gains on sales of depreciable real estate and other items that have not yet occurred and are out of the Company’s control. For the same reasons, the Company is unable to address the probable significance of the unavailable information and believes that providing a reconciliation for estimated annual NOI would imply a degree of precision as to its forward-looking net operating income that would be confusing or misleading to investors. |
(2) | Weighted average ownership figures based on the Company’s share of NOI and are presented on a pre-promote basis. |
20
Kennedy-Wilson Holdings, Inc.
Multifamily Investment Summary
As of September 30, 2018
(Unaudited)
(Dollars in millions, except average rents per unit)
Multifamily | # of Assets | # of Units | Occupancy | Average Monthly Rents Per Market Rate Unit(2)(3) | Kennedy Wilson's Share of Estimated Annual NOI(1) | |||||||||||
Pacific Northwest | 43 | 10,333 | 94.7 | % | $ | 1,597 | $ | 66.5 | ||||||||
Southern California | 9 | 2,968 | 94.1 | 1,898 | 23.4 | |||||||||||
Northern California | 9 | 3,057 | 93.3 | 1,846 | 30.2 | |||||||||||
Mountain States | 17 | 4,819 | 93.9 | 1,120 | 27.6 | |||||||||||
Total Western US | 78 | 21,177 | 94.2 | % | $ | 1,556 | $ | 147.7 | ||||||||
Ireland(4) | 8 | 1,793 | 96.9 | 2,325 | 24.4 | |||||||||||
United Kingdom(4) | 1 | 294 | 91.6 | 2,155 | 4.3 | |||||||||||
Total Europe | 9 | 2,087 | 96.2 | % | $ | 2,292 | $ | 28.7 | ||||||||
Total Stabilized | 87 | 23,264 | 94.3 | % | $ | 1,639 | $ | 176.4 | ||||||||
Unstabilized/Development | 14 | 3,629 | See Page 24 for more information | |||||||||||||
Total Multifamily | 101 | 26,893 | ||||||||||||||
(1) Please see “common definitions” for a definition of estimated annual NOI and a description of its limitations. The Company does not provide a reconciliation for estimated annual NOI to its most directly comparable forward-looking GAAP financial measure, because it is unable to provide a meaningful or accurate estimation of each of the component reconciling items, and the information is not available without unreasonable effort. This is due to the inherent difficulty of forecasting the timing and/or amount of various items that would impact estimated annual NOI, including, for example, gains on sales of depreciable real estate and other items that have not yet occurred and are out of the Company’s control. For the same reasons, the Company is unable to meaningfully address the probable significance of the unavailable information and believes that providing a reconciliation for estimated annual NOI would imply a degree of precision as to its forward-looking net operating income that would be confusing or misleading to investors. Amounts are based on weighted-average ownership figures held by KW.
(2) Average Monthly Rents Per Unit is defined as the total potential monthly rental revenue (actual rent for occupied units plus market rent for vacant units) divided by the number of units, and are weighted-averages based on the Company's ownership percentage in the underlying properties.
(3) Average Monthly Rents Per Market Rate Unit for the market rate portfolio based on Kennedy Wilson's share of units. Average Monthly Rents Per Unit for the affordable portfolio are $829, $846, $848, and $749 for Pacific Northwest, Southern California, Northern California, and Mountain States, respectively.
(4) Estimated foreign exchange rates are €0.86 = $1 USD, and and £0.77 = $1 USD related to NOI.
21
Kennedy-Wilson Holdings, Inc.
Commercial Investment Summary
As of September 30, 2018
(Unaudited)
(Dollars and Square Feet in millions, except average rent per sq. ft.)
Commercial | # of Assets | Rentable Sq. Ft. | Occupancy | Average Annual Rent per Sq. Ft.(2) | Kennedy Wilson's Share of Estimated Annual NOI(1) | |||||||||||
Pacific Northwest | 7 | 2.2 | 92.6 | % | $ | 21.2 | $ | 17.0 | ||||||||
Southern California(3) | 7 | 0.8 | 92.0 | 44.8 | 13.3 | |||||||||||
Northern California | 1 | 0.1 | 88.5 | 10.1 | 1.0 | |||||||||||
Mountain States | 13 | 2.2 | 89.3 | 13.1 | 10.5 | |||||||||||
Total Western US | 28 | 5.3 | 91.1 | % | $ | 21.8 | $ | 41.8 | ||||||||
United Kingdom(4) | 114 | 7.4 | 96.0 | 17.7 | 96.9 | |||||||||||
Ireland(4) | 14 | 1.4 | 98.7 | 37.6 | 46.7 | |||||||||||
Spain(4) | 15 | 0.9 | 94.2 | 16.3 | 12.0 | |||||||||||
Italy(4) | 8 | 0.8 | 100.0 | 14.9 | 10.4 | |||||||||||
Total Europe(4) | 151 | 10.5 | 96.6 | % | $ | 20.2 | $ | 166.0 | ||||||||
Total Stabilized | 179 | 15.8 | 94.7 | % | $ | 20.5 | $ | 207.8 | ||||||||
Unstabilized/Development | 26 | 2.8 | See page 24 for more information | |||||||||||||
Total Commercial | 205 | 18.6 | ||||||||||||||
(1) Please see “common definitions” for a definition of estimated annual NOI and a description of its limitations. The Company does not provide a reconciliation for estimated annual NOI to its most directly comparable forward-looking GAAP financial measure, because it is unable to provide a meaningful or accurate estimation of each of the component reconciling items, and the information is not available without unreasonable effort. This is due to the inherent difficulty of forecasting the timing and/or amount of various items that would impact estimated annual NOI, including, for example, gains on sales of depreciable real estate and other items that have not yet occurred and are out of the Company’s control. For the same reasons, the Company is unable to meaningfully address the probable significance of the unavailable information and believes that providing a reconciliation for estimated annual NOI would imply a degree of precision as to its forward-looking net operating income that would be confusing or misleading to investors. Amounts are based on weighted-average ownership figures held by KW.
(2) Average Annual Rent per Sq. Ft. represents contractual rents as in-place as of September 30, 2018 and are weighted-averages based on the Company's ownership percentage in the underlying properties.
(3) The information presented in this row for Southern California commercial assets includes our corporate headquarters wholly owned by KW comprising 58,000 sq. ft., $35 million of debt, 100% occupancy, $3.0 million in annual NOI and KW Gross Asset Value of $67.9 million as of September 30, 2018.
(4) Estimated foreign exchange rates are €0.86 = $1 USD, and £0.76 = $1 USD, related to NOI.
22
Kennedy-Wilson Holdings, Inc.
Hotel, Loans, Residential and Other Investment Summary
As of September 30, 2018
(Unaudited)
(Dollars in millions, except for Average Daily Rate)
Hotel | # of Assets | Hotel Rooms | Average Daily Rate(2) | Kennedy Wilson's Share of Estimated Annual NOI(1) | |||||||||
Northern California | 1 | 170 | $ | 556.5 | $ | 3.4 | |||||||
Hawaii | 1 | 72 | 154.9 | 0.2 | |||||||||
Total Western US | 2 | 242 | $ | 544.5 | $ | 3.6 | |||||||
United Kingdom(3) | 7 | 1,075 | 97.5 | 6.8 | |||||||||
Ireland(3) | 2 | 400 | 295.7 | 21.0 | |||||||||
Total Europe | 9 | 1,475 | $ | 162.0 | $ | 27.8 | |||||||
Total Hotel | 11 | 1,717 | $ | 171.9 | $ | 31.4 | |||||||
Development | 1 | 150 | See page 24 for more information | ||||||||||
Total Hotel | 12 | 1,867 | |||||||||||
(1) Please see “common definitions” for a definition of estimated annual NOI and a description of its limitations. The Company does not provide a reconciliation for estimated annual NOI to its most directly comparable forward-looking GAAP financial measure, because it is unable to provide a meaningful or accurate estimation of each of the component reconciling items, and the information is not available without unreasonable effort. This is due to the inherent difficulty of forecasting the timing and/or amount of various items that would impact estimated annual NOI, including, for example, gains on sales of depreciable real estate and other items that have not yet occurred and are out of the Company’s control. For the same reasons, the Company is unable to meaningfully address the probable significance of the unavailable information and believes that providing a reconciliation for estimated annual NOI would imply a degree of precision as to its forward-looking net operating income that would be confusing or misleading to investors. Amounts are based on weighted-average ownership figures held by KW.
(2) Average Daily Rate data is based on the most recent 12 months and is weighted based on the Company's ownership percentage in the underlying properties.
(3) Estimated foreign exchange rates are €0.86 = $1 USD, and £0.76 = $1 USD, related to NOI.
Residential, Loans and Other | # of Investments | Residential Units/Lots | Total Acres | # of Unresolved Loans | KW Gross Asset Value | ||||||||||
Southern California | 7 | 109 | 758 | 1 | $ | 73.5 | |||||||||
Northern California | 1 | — | 4 | — | 3.5 | ||||||||||
Hawaii | 4 | 250 | 3,242 | — | 148.0 | ||||||||||
Total Western US | 12 | 359 | 4,004 | 1 | $ | 225.0 | |||||||||
Ireland(1) | 1 | — | — | 5 | 27.3 | ||||||||||
Total Residential and Loans | 13 | 359 | 4,004 | 6 | $ | 252.3 | |||||||||
Other Investments | 7 | — | — | — | $ | 21.7 | |||||||||
Total Residential, Loans and Other | 20 | 359 | 4,004 | 6 | $ | 274.0 | |||||||||
(1) Estimated foreign exchange rate is €0.86 = $1 USD, related to Gross Asset Value.
23
Kennedy-Wilson Holdings, Inc.
Unstabilized and Development Detail
As of September 30, 2018
(Unaudited)
(Dollars in millions)
Unstabilized Assets
This section includes the Company's unstabilized assets that are undergoing lease-up. There is no certainty that these assets will reach stabilization in the time periods shown. In addition, the cost to complete unstabilized assets is subject to many uncertainties that are beyond our control, and the actual costs may be significantly higher than the estimates shown below. All dollar amounts are Kennedy Wilson's share.
Property(1) | Location | Type | KW Ownership % | # of Assets | Commercial Sq. Ft. | MF Units | Est. Stabilization Date | KW Share Est Stabilized NOI | KW Est. Costs to Complete(3) | KW Gross Asset Value(1) | |||||||||
2018-2019 | |||||||||||||||||||
Vintage - Crossings at Virginia | Mountain States | Multifamily | 39% | 1 | — | 197 | 2018 | $ | 0.5 | $ | — | $ | 12.7 | ||||||
Leavesden Park | United Kingdom(2) | Office | 100% | 1 | 198,000 | — | 2019 | 7.1 | 18.3 | 68.3 | |||||||||
Old School | United Kingdom(2) | Office | 100% | 1 | 24,000 | — | 2019 | 0.6 | 1.2 | 6.5 | |||||||||
Malibu Sands | Southern California | Retail | 50% | 1 | 16,000 | — | 2019 | 0.6 | 0.3 | 11.1 | |||||||||
Colossus | United Kingdom(2) | Industrial | 100% | 1 | 188,000 | — | 2019 | 1.2 | — | 12.9 | |||||||||
Merlin Park | United Kingdom(2) | Industrial | 100% | 1 | 63,000 | 2019 | 0.5 | — | 5.5 | ||||||||||
2018-2019 Subtotal | 6 | 489,000 | 197 | $ | 10.5 | $ | 19.8 | $ | 117.0 | ||||||||||
2020-2023 | |||||||||||||||||||
Various | Mountain States | Retail | 87%-97% | 3 | 415,000 | — | 2020 | $ | 2.8 | $ | 4.0 | $ | 34.4 | ||||||
The Oaks | Southern California | Office | 100% | 1 | 355,000 | 2022 | 6.6 | 20.1 | 114.8 | ||||||||||
Various | United Kingdom(2) | Office | 100% | 3 | 346,000 | — | 2020-2023 | 10.6 | 24.4 | 166.2 | |||||||||
2020-2023 Subtotal | 7 | 1,116,000 | — | $ | 20.0 | $ | 48.5 | $ | 315.4 | ||||||||||
Total Unstabilized | 13 | 1,605,000 | 197 | $ | 30.5 | $ | 68.3 | $ | 432.4 | ||||||||||
Note: The table above excludes three fund assets totaling 277 units, 0.3 million commercial sq. ft., and KW Gross Asset Value of $10.3 million.
(1) Excludes two office development sites totaling 56,000 commercial sq. ft. and KW Gross Asset Value of $17.7 million that are expected to sell before the end of 2018. There is no certainty that these assets will sell before the end of 2018.
(2) Estimated foreign exchange rates are €0.86 = $1 USD and £0.76 = $1 USD, related to NOI.
(3) | Figures shown in this column are an estimate of KW's remaining costs to develop to completion or to complete the entitlement process, as applicable, as of September 30, 2018. Total remaining costs may be financed with third-party cash contributions, proceeds from projected sales, and/or debt financing. These figures are budgeted costs and are subject to change. There is no guarantee that the Company will be able to secure the project-level debt financing that is assumed in the figures above. If the Company is unable to secure such financing, the amount of capital that the Company will have to invest to complete the projects above may significantly increase. |
24
Kennedy-Wilson Holdings, Inc.
Unstabilized and Development Detail (continued)
As of September 30, 2018
(Unaudited)
(Dollars in millions)
Development Projects
This section includes the development or redevelopment projects that the Company is undergoing or considering, and excludes residential investments. The scope of these projects may change. There is no certainty that the Company will develop or redevelop any or all of these potential projects. In addition, the cost to complete development projects is subject to many uncertainties that are beyond our control, and the actual costs may be significantly higher than the estimates shown below. All dollar amounts are Kennedy Wilson's share.
If Completed | Current | ||||||||||||||||||||||||||
Property | Location | Type | Status | KW Ownership % | Est. Completion Date(1) | Est. Stabilization Date | Commercial Sq. Ft. | MF Units / Hotel Rooms | KW Share Est. Stabilized NOI | KW Share Total Capitalization | KW Gross Asset Value | KW Est. Costs to Complete(2) | KW Est. Cash to Complete | ||||||||||||||
2018-2019 | |||||||||||||||||||||||||||
Capital Dock | Ireland(3) | Mixed-Use | Under Construction | 43% | 2018 | 2019-2020 | 142,000 | 190 | $ | 7.0 | $ | 97.4 | $ | 87.3 | $ | 10.1 | $ | 6.7 | (4) | ||||||||
Vintage Housing Holdings | WA and NV | Multifamily - Affordable | 3 Under Construction | 39% | 2018-2019 | 2018-2019 | — | 874 | 2.6 | 47.0 | (7) | 36.2 | 10.8 | — | (5) | ||||||||||||
Puerta del Sol | Spain(3) | Retail | In Planning | 100% | 2019 | 2019 | 37,000 | — | 3.7 | 64.5 | 59.9 | 4.6 | 4.6 | ||||||||||||||
Santa Rosa | Nor Cal | Multifamily | In Design | 80% | 2019 | 2019 | — | 120 | 1.9 | 30.0 | 1.3 | 28.7 | 13.3 | ||||||||||||||
2018-2019 Subtotal | 179,000 | 1,184 | $ | 15.2 | $ | 238.9 | $ | 184.7 | $ | 54.2 | $ | 24.6 | |||||||||||||||
2020-2021 | |||||||||||||||||||||||||||
Vintage Housing Holdings | WA and NV | Multifamily - Affordable | 2 Under Construction | 39% | 2020 | 2020 | — | 458 | $ | 1.5 | 26.7 | (8) | $ | 6.7 | $ | 20.0 | $ | — | (5) | ||||||||
Vintage Housing Holdings | WA and NV | Multifamily - Affordable | 2 In Design | 39% | 2020 | 2021 | — | 622 | 3.0 | 54.7 | (9) | 6.0 | 48.7 | — | (5) | ||||||||||||
Clancy Quay - Phase 3 | Ireland(3) | Multifamily | Under Construction | 50% | 2020 | 2021 | 6,000 | 259 | 3.2 | 57.1 | 15.4 | 41.7 | 7.8 | ||||||||||||||
Hanover Quay | Ireland(3) | Office | Received Planning | 60% | 2020 | 2021 | 68,000 | — | 2.5 | 38.7 | 8.9 | 29.8 | 14.9 | (6) | |||||||||||||
Kildare | Ireland(3) | Office | In Planning | 100% | 2021 | 2021 | 64,000 | — | 4.0 | 54.7 | 10.4 | 44.3 | 22.2 | (6) | |||||||||||||
2020-2021 Subtotal | 138,000 | 1,339 | $ | 14.2 | $ | 231.9 | $ | 47.4 | $ | 184.5 | $ | 44.9 | |||||||||||||||
2022-2023 | |||||||||||||||||||||||||||
400/430 California | Nor Cal | Office | Under Construction | 10% | 2020 | 2022 | 247,000 | — | 1.3 | 24.9 | 17.6 | 7.3 | 7.3 | ||||||||||||||
Leisureplex | Ireland(3) | Mixed-Use | In Design | 100% | 2022 | 2022 | 19,000 | 180 | 5.8 | 104.7 | 18.6 | 86.1 | 43.0 | (6) | |||||||||||||
City Block 3 | Ireland(3) | Mixed-Use | In Design | 50% | 2022 | 2023 | 300,000 | 452 | 15-18 | 263.4 | 74.1 | 189.3 | 94.7 | (6) | |||||||||||||
Kona Village Resort | Hawaii | Hotel | Under Construction | 50% | 2021 | 2023 | — | 150 | 16-19 | 289.2 | 64.2 | 225.0 | 100.0 | (6) | |||||||||||||
Other | Various | Various | In Design | 100% | TBD | TBD | TBD | — | NA | TBD | 80.6 | TBD | TBD | ||||||||||||||
2022-2023 Subtotal | 566,000 | 782 | $ 38-44 | $ | 682.2 | $ | 255.1 | $ | 507.7 | $ | 245.0 | ||||||||||||||||
Total Development | 883,000 | 3,305 | $ 68-74 | $ | 1,153.0 | $ | 487.2 | $ | 746.4 | $ | 314.5 | ||||||||||||||||
Note: 200 Capital Dock, which was sold in May 2017 in a forward-funding sale agreement with JPMorgan and has a KW Gross Asset Value of $17.5 million, is excluded from the table above.
(1) The actual completion date for projects is subject to several factors, many of which are not within our control. Accordingly, the projects identified may not be completed when expected, or at all.
25
(2) | Figures shown in this column are an estimate of KW's remaining costs to develop to completion or to complete the entitlement process, as applicable, as of September 30, 2018. Total remaining costs may be financed with third-party cash contributions, proceeds from projected sales, and/or debt financing. These figures are budgeted costs and are subject to change. There is no guarantee that the Company will be able to secure the project-level debt financing that is assumed in the figures above. If the Company is unable to secure such financing, the amount of capital that the Company will have to invest to complete the projects above may significantly increase. KW cost to complete differs from KW share total capitalization as the latter includes costs that have already been incurred to date while the former relates to future estimated costs. |
(3) Estimated foreign exchange rates are €0.86 = $1 USD and £0.76 = $1 USD, related to NOI.
(4) Will be partially financed with the proceeds from the forward-funding sale agreement of 200 Capital Dock, which was executed with JPMorgan during 2Q-2017. We still have $23.2 million available under the project's $145.1 million construction loan as of September 30, 2018.
(5) We anticipate these development projects to be financed with tax-exempt bonds and tax-credit equity.
(6) We anticipate being able to secure construction financing at a 50% leverage of KW Estimated Costs to Complete. These figures reflect this leverage assumption and are budgeted costs and are subject to change.
(7) Excludes $69.3 million of tax-credit equity.
(8) Excludes $38.1 million of tax-credit equity.
(9) Excludes $51.0 million of tax-credit equity.
26
Kennedy-Wilson Holdings, Inc.
Debt and Liquidity Schedule
As of September 30, 2018
(Unaudited)
(Dollars in millions)
Maturity | Consolidated Secured(1) | Kennedy Wilson Europe Unsecured Bonds(2) | Unconsolidated Secured | KW Unsecured Debt | KW Share(3) | ||||||||||||||
2018 | $ | 10.4 | $ | — | $ | 195.5 | $ | — | $ | 69.0 | |||||||||
2019 | 287.0 | — | 276.0 | — | 235.1 | ||||||||||||||
2020 | 146.0 | — | 156.9 | — | 188.4 | ||||||||||||||
2021 | 170.9 | — | 139.2 | 125.0 | (4) | 303.3 | |||||||||||||
2022 | 365.1 | 651.6 | 251.4 | — | 1,071.9 | ||||||||||||||
2023 | 380.4 | — | 283.5 | — | 404.3 | ||||||||||||||
2024 | 195.8 | — | 190.0 | 1,150.0 | (5) | 1,354.3 | |||||||||||||
2025 | 404.6 | 639.3 | 347.7 | — | 1,168.3 | ||||||||||||||
2026 | 356.4 | — | 170.2 | — | 397.0 | ||||||||||||||
2027 | 250.2 | — | 146.6 | — | 318.3 | ||||||||||||||
Thereafter | 320.7 | — | 522.2 | — | 320.1 | ||||||||||||||
Total | $ | 2,887.5 | $ | 1,290.9 | $ | 2,679.2 | $ | 1,275.0 | $ | 5,830.0 | |||||||||
Cash | (220.2 | ) | (70.3 | ) | (102.4 | ) | (156.6 | ) | (455.6 | ) | |||||||||
Net Debt | $ | 2,667.3 | $ | 1,220.6 | $ | 2,576.8 | $ | 1,118.4 | $ | 5,374.4 | |||||||||
(1) Excludes $17.3 million of unamortized loan fees and unamortized net premium of $2.0 million, as of September 30, 2018.
(2) Excludes $4.6 million of unamortized loan fees and unamortized net discount of $3.8 million, as of September 30, 2018.
(3) Includes Kennedy Wilson's share of debt at Vintage Housing Holdings based on contractual ownership.
(4) Represents principal balance of credit facility.
(5) Represents principal balance of senior notes.
Weighted average interest rate (KW Share): 4.0% per annum
Weighted average remaining maturity in years (KW Share): 5.6 years
27
Kennedy-Wilson Holdings, Inc.
Debt and Liquidity Schedule (continued)
As of September 30, 2018
(Unaudited)
(Dollars in millions)
Kennedy Wilson has exposure to fixed and floating rate debt through its corporate debt along with debt encumbering its consolidated properties and its joint venture investments. The table below details Kennedy Wilson's total consolidated and unconsolidated debt by interest rate type.
KW Share of Debt(1) | |||||||||||||||
Fixed Rate Debt | Floating with Interest Rate Caps | Floating without Interest Rate Caps | Total KW Share of Debt | ||||||||||||
Secured Investment Level Debt | $ | 2,073.8 | $ | 781.2 | $ | 409.1 | $ | 3,264.1 | |||||||
Kennedy Wilson Europe Unsecured Bonds | 1,290.9 | — | — | 1,290.9 | |||||||||||
KW Unsecured Debt | 1,150.0 | — | 125.0 | 1,275.0 | |||||||||||
Total | $ | 4,514.7 | $ | 781.2 | $ | 534.1 | $ | 5,830.0 | |||||||
% of Total Debt | 77 | % | 14 | % | 9 | % | 100 | % | |||||||
(1) Includes Kennedy Wilson's share of debt at Vintage Housing Holdings of $6.3 million, based on contractual ownership.
KW Share of Secured Investment Debt(1) | ||||||||||||||||||||||
Multifamily | Commercial | Hotels | Residential, Loans and Other | Total | % of KW Share | |||||||||||||||||
Pacific Northwest | $ | 607.8 | $ | 109.1 | $ | — | $ | — | $ | 716.9 | 23 | % | ||||||||||
Southern California | 251.4 | 212.7 | — | 2.3 | 466.4 | 14 | % | |||||||||||||||
Northern California | 318.2 | 6.4 | 19.1 | — | 343.7 | 11 | % | |||||||||||||||
Mountain States | 297.1 | 118.5 | — | — | 415.6 | 13 | % | |||||||||||||||
Hawaii | — | — | 1.5 | 2.4 | 3.9 | — | % | |||||||||||||||
Total Western US | $ | 1,474.5 | $ | 446.7 | $ | 20.6 | $ | 4.7 | $ | 1,946.5 | 61 | % | ||||||||||
United Kingdom | $ | — | $ | 529.9 | $ | — | $ | — | $ | 529.9 | 16 | % | ||||||||||
Ireland | 220.6 | 392.8 | 83.5 | — | 696.9 | 21 | % | |||||||||||||||
Spain | — | 91.6 | — | — | 91.6 | 3 | % | |||||||||||||||
Italy | — | — | — | — | — | — | % | |||||||||||||||
Total Europe | $ | 220.6 | $ | 1,014.3 | $ | 83.5 | $ | — | $ | 1,318.4 | 40 | % | ||||||||||
Total | $ | 1,695.1 | $ | 1,461.0 | $ | 104.1 | $ | 4.7 | $ | 3,264.9 | 100 | % | ||||||||||
% of Total Debt | 52 | % | 45 | % | 3 | % | — | % | 100 | % | ||||||||||||
(1) Includes Kennedy Wilson's share of debt at Vintage Housing Holdings of $6.3 million, based on contractual ownership.
28
Kennedy-Wilson Holdings, Inc.
Investment Management and Real Estate Services Platform
(Unaudited, Dollars in millions)
Kennedy Wilson's investment management and real estate services platform offers a comprehensive line of real estate services for the full lifecycle of real estate ownership. Kennedy Wilson has approximately $16 billion in IMRES AUM(1) and 51 million square feet under management as of September 30, 2018.
Adjusted Fees - Detail | ||||||||||||||||
3Q | YTD | |||||||||||||||
Fee Description | 2018 | 2017 | 2018 | 2017 | ||||||||||||
Investment Management - Base | $ | 4.3 | $ | 10.1 | $ | 10.3 | $ | 29.4 | ||||||||
Investment Management - Performance | 7.5 | 4.7 | 34.3 | 8.5 | ||||||||||||
Investment Management - Acquisition/ Disposition | 0.9 | 0.1 | 3.2 | 0.6 | ||||||||||||
Property Services | 3.2 | 8.5 | 12.2 | 24.8 | ||||||||||||
Research | 4.1 | 3.3 | 12.2 | 9.0 | ||||||||||||
Total Adjusted Fees(2) | $ | 20.0 | $ | 26.7 | $ | 72.2 | $ | 72.3 | ||||||||
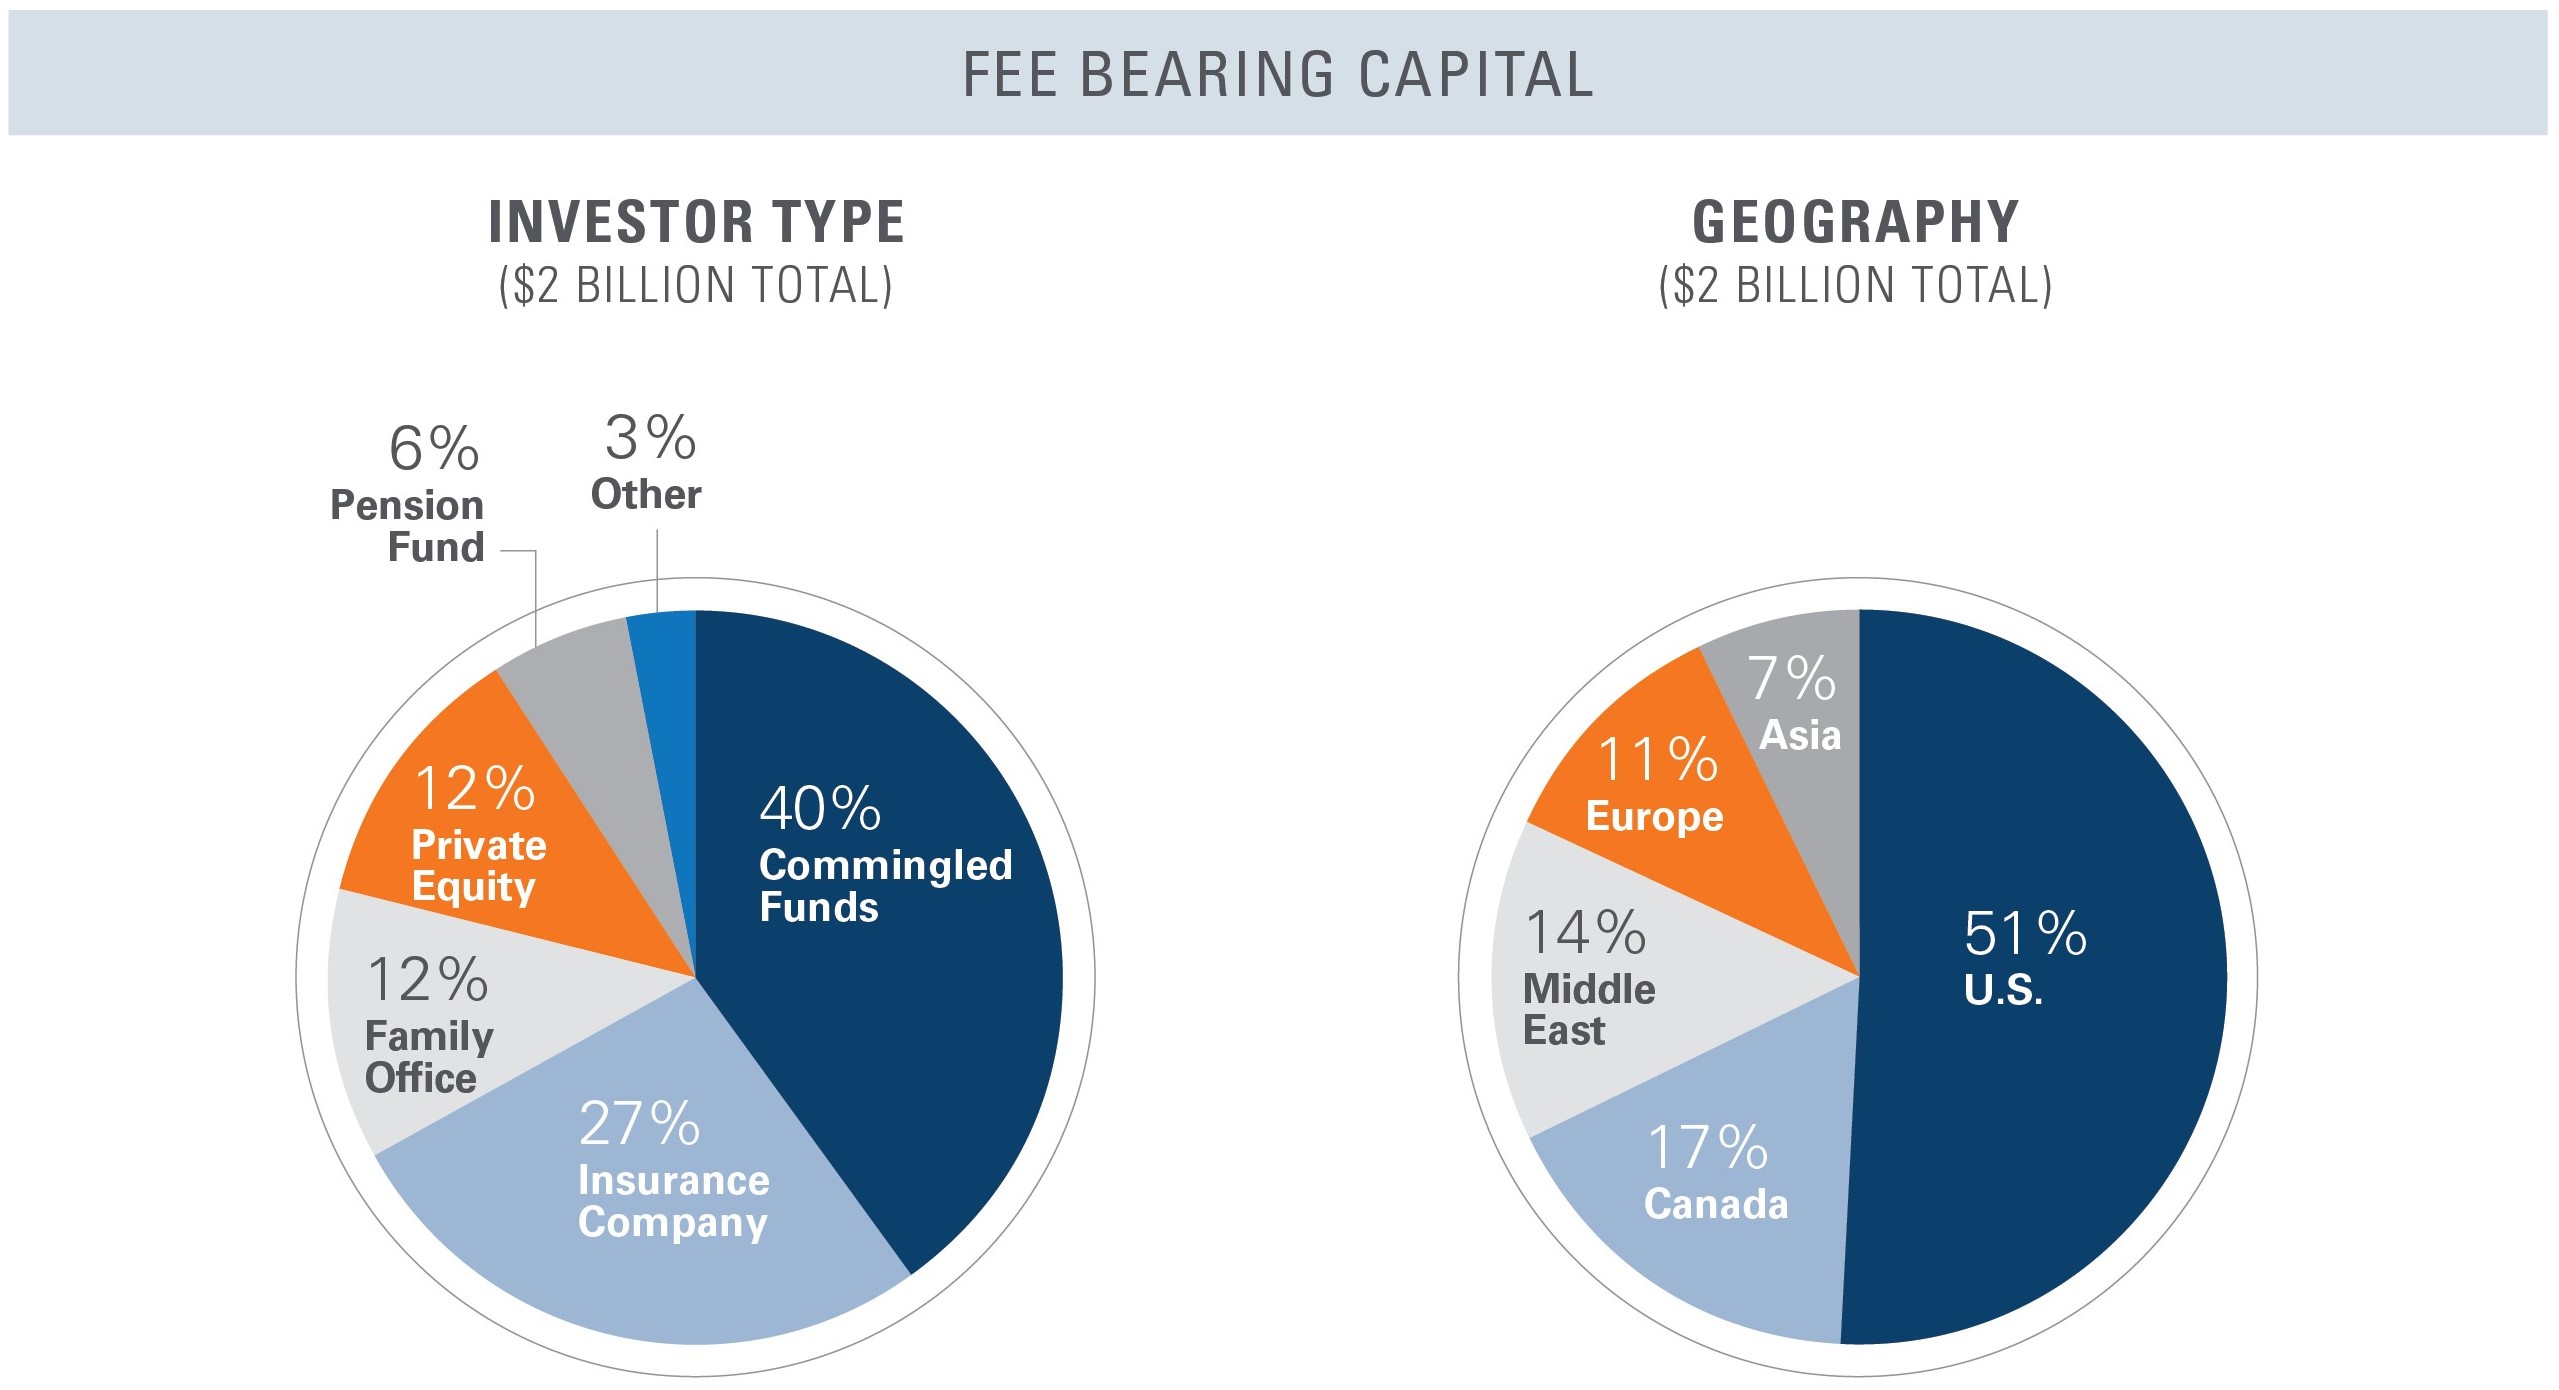
Note: "Fee Bearing Capital" represents total investment level equity, development costs, and/or equity commitments on which we earn fee income.
(1) As defined in "Common Definitions" section of the earnings release.
(2) Please see the appendix for a reconciliation of Adjusted Fees to its closest GAAP measure.
29
Kennedy-Wilson Holdings, Inc.
Multifamily Same Property Analysis
(Unaudited)
(Dollars in millions)
Same Property Analysis By Region - Kennedy Wilson's Pro-Rata Share
The Same Property analysis below reflects Kennedy Wilson's ownership in each underlying property and is shown to provide greater clarity of the impact of the Same Property(1) changes to Kennedy Wilson.
Three Months Ended September 30, | Same Property Units | Average % Leased | Total Revenues(2) | Net Operating Income(2) | ||||||||||||||||||||||||||||||
2018 vs. 2017 | 2018 | 2018 | 2017 | % Change | 2018 | 2017 | % Change | 2018 | 2017 | % Change | ||||||||||||||||||||||||
Market Rate Portfolio | ||||||||||||||||||||||||||||||||||
Region: | ||||||||||||||||||||||||||||||||||
Pacific Northwest | 4,806 | 93.5 | % | 93.4 | % | 0.1 | % | $ | 15.3 | $ | 14.7 | 4.0 | % | $ | 10.0 | $ | 9.7 | 3.2 | % | |||||||||||||||
Southern California | 2,500 | 94.4 | 93.4 | 1.0 | 9.2 | 8.7 | 5.9 | 6.2 | 5.6 | 9.6 | ||||||||||||||||||||||||
Northern California | 2,381 | 92.7 | 93.6 | (0.9 | ) | 11.2 | 10.9 | 2.7 | 7.4 | 7.2 | 3.0 | |||||||||||||||||||||||
Mountain States | 2,252 | 94.2 | 94.1 | 0.2 | 6.2 | 5.7 | 8.5 | 4.1 | 3.8 | 8.5 | ||||||||||||||||||||||||
Western US | 11,939 | 93.6 | % | 93.6 | % | — | % | $ | 41.9 | $ | 40.0 | 4.7 | % | $ | 27.7 | $ | 26.3 | 5.3 | % | |||||||||||||||
Ireland | 1,300 | 97.2 | 95.1 | 2.2 | 5.9 | 5.6 | 5.0 | 4.6 | 4.5 | 3.0 | ||||||||||||||||||||||||
Total | 13,239 | 94.0 | % | 93.7 | % | 0.3 | % | $ | 47.8 | $ | 45.6 | 4.7 | % | $ | 32.3 | $ | 30.8 | 4.9 | % | |||||||||||||||
Affordable Portfolio | ||||||||||||||||||||||||||||||||||
Region: | ||||||||||||||||||||||||||||||||||
Pacific Northwest | 4,099 | 96.0 | % | 96.5 | % | (0.5 | )% | $ | 4.8 | $ | 4.6 | 5.5 | % | $ | 3.4 | $ | 3.2 | 6.6 | % | |||||||||||||||
Southern California | 264 | 98.5 | 100.0 | (1.5 | ) | 0.3 | 0.3 | 5.9 | 0.2 | 0.2 | 7.9 | |||||||||||||||||||||||
Northern California | 303 | 96.3 | 98.3 | (2.0 | ) | 0.4 | 0.4 | 4.0 | 0.3 | 0.2 | 10.7 | |||||||||||||||||||||||
Mountain States | 714 | 96.4 | 96.1 | 0.3 | 0.7 | 0.7 | 3.1 | 0.5 | 0.5 | 5.0 | ||||||||||||||||||||||||
Western US | 5,380 | 96.2 | % | 96.7 | % | (0.5 | )% | $ | 6.2 | $ | 6.0 | 5.1 | % | $ | 4.4 | $ | 4.1 | 6.7 | % | |||||||||||||||
Note: Percentage changes are based on whole numbers while revenues and net operating income are shown in millions.
(1) As defined in "Common definitions" section of the earnings release.
(2) Please see the appendix for a reconciliation of same property revenues and NOI to its closest GAAP measure.
30
Kennedy-Wilson Holdings, Inc.
Multifamily Same Property Analysis (continued)
(Unaudited)
(Dollars in millions)
Nine Months Ended September 30, | Same Property Units | Average % Leased | Total Revenues(2) | Net Operating Income(2) | ||||||||||||||||||||||||||||||
2018 vs. 2017 | 2018 | 2018 | 2017 | % Change | 2018 | 2017 | % Change | 2018 | 2017 | % Change | ||||||||||||||||||||||||
Market Rate Portfolio | ||||||||||||||||||||||||||||||||||
Region: | ||||||||||||||||||||||||||||||||||
Pacific Northwest | 4,524 | 93.8 | % | 93.6 | % | 0.2 | % | $ | 42.2 | $ | 40.0 | 5.6 | % | $ | 28.1 | $ | 26.7 | 5.4 | % | |||||||||||||||
Southern California | 2,500 | 94.6 | 94.5 | 0.1 | 27.1 | 25.8 | 5.0 | 18.1 | 16.8 | 7.8 | ||||||||||||||||||||||||
Northern California | 2,381 | 92.4 | 93.7 | (1.5 | ) | 33.2 | 32.3 | 2.8 | 22.0 | 21.3 | 3.5 | |||||||||||||||||||||||
Mountain States | 1,512 | 94.8 | 94.5 | 0.3 | 17.2 | 15.9 | 7.9 | 11.6 | 10.6 | 8.7 | ||||||||||||||||||||||||
Western US | 10,917 | 93.8 | % | 94.0 | % | (0.2 | )% | $ | 119.7 | $ | 114.0 | 5.0 | % | $ | 79.8 | $ | 75.4 | 5.9 | % | |||||||||||||||
Ireland | 1,300 | 97.1 | 94.5 | 2.8 | 17.6 | 16.6 | 6.1 | 13.8 | 13.0 | 6.1 | ||||||||||||||||||||||||
Total | 12,217 | 94.1 | % | 94.0 | % | 0.1 | % | $ | 137.3 | $ | 130.6 | 5.1 | % | $ | 93.6 | $ | 88.4 | 5.9 | % | |||||||||||||||
Affordable Portfolio | ||||||||||||||||||||||||||||||||||
Region: | ||||||||||||||||||||||||||||||||||
Pacific Northwest | 4,099 | 96.4 | % | 96.8 | % | (0.4 | )% | $ | 14.2 | $ | 13.4 | 6.2 | % | $ | 9.8 | $ | 9.1 | 7.8 | % | |||||||||||||||
Southern California | 264 | 98.3 | 98.6 | (0.3 | ) | 1.0 | 0.9 | 4.7 | 0.7 | 0.6 | 5.1 | |||||||||||||||||||||||
Northern California | 303 | 98.1 | 98.4 | (0.3 | ) | 1.1 | 1.1 | 3.4 | 0.7 | 0.7 | 7.6 | |||||||||||||||||||||||
Mountain States | 714 | 96.3 | 96.2 | 0.1 | 2.1 | 2.0 | 3.0 | 1.4 | 1.3 | 2.1 | ||||||||||||||||||||||||
Western US | 5,380 | 96.6 | % | 96.9 | % | (0.4 | )% | $ | 18.4 | $ | 17.4 | 5.6 | % | $ | 12.6 | $ | 11.7 | 7.0 | % | |||||||||||||||
Note: Percentage changes are based on whole numbers while revenues and net operating income are shown in millions.
(1) As defined in "Common definitions" section of the earnings release.
(2) Please see the appendix for a reconciliation of same property revenues and NOI to its closest GAAP measure.
31
Kennedy-Wilson Holdings, Inc.
Commercial Same Property Analysis
(Unaudited)
(Dollars and Square Feet in millions)
Same Property Analysis By Region - Kennedy Wilson's Pro-Rata Share
The Same Property analysis below reflects Kennedy Wilson's ownership in each underlying property and is shown to provide greater clarity of the impact of the Same Property(1) changes to Kennedy Wilson. The analysis below excludes the effects of straight-line rent.
Three Months Ended September 30, | Same Property Square Feet | Average % Occupancy | Total Revenues(2) | Net Operating Income(2) | ||||||||||||||||||||||||||||||
2018 vs. 2017 | 2018 | 2018 | 2017 | % Change | 2018 | 2017 | % Change | 2018 | 2017 | % Change | ||||||||||||||||||||||||
Region: | ||||||||||||||||||||||||||||||||||
Pacific Northwest(3) | 1.2 | 99.3 | % | 99.5 | % | (0.2 | )% | $ | 3.7 | $ | 4.4 | (14.6 | )% | $ | 3.0 | $ | 3.6 | (18.8 | )% | |||||||||||||||
Southern California(4) | 0.8 | 93.4 | 90.9 | 2.7 | 3.5 | 3.0 | 17.2 | 2.4 | 2.0 | 23.4 | ||||||||||||||||||||||||
Northern California | 0.1 | 88.5 | 84.4 | 4.8 | 0.3 | 0.2 | 12.4 | 0.2 | 0.2 | 4.5 | ||||||||||||||||||||||||
Mountain States | 1.2 | 93.5 | 93.2 | 0.3 | 1.9 | 1.7 | 9.3 | 1.6 | 1.6 | 4.5 | ||||||||||||||||||||||||
Western US | 3.3 | 95.5 | % | 94.7 | % | 0.8 | % | 9.4 | 9.3 | 0.7 | % | 7.2 | 7.4 | (2.0 | )% | |||||||||||||||||||
United Kingdom(5) | 6.5 | 97.6 | 97.2 | 0.5 | 23.1 | 22.3 | 3.6 | 20.8 | 20.3 | 2.8 | 2.8 | |||||||||||||||||||||||
Ireland(6) | 1.1 | 98.6 | 98.3 | 0.3 | 10.1 | 9.7 | 4.6 | 9.7 | 9.5 | 2.3 | ||||||||||||||||||||||||
Spain | 0.8 | 94.5 | 92.8 | 1.8 | 3.0 | 3.1 | (3.2 | ) | 2.6 | 2.5 | 1.6 | |||||||||||||||||||||||
Italy | 0.8 | 100.0 | 100.0 | — | 2.9 | 2.9 | 1.6 | 2.7 | 2.6 | 3.4 | ||||||||||||||||||||||||
Europe | 9.2 | 97.7 | % | 97.1 | % | 0.5 | % | 39.1 | 38.0 | 3.1 | % | 35.8 | 34.9 | 3.0 | % | |||||||||||||||||||
Total | 12.5 | 97.3 | % | 96.7 | % | 0.6 | % | $ | 48.5 | $ | 47.3 | 2.7 | % | $ | 43.0 | $ | 42.3 | 1.8 | % | |||||||||||||||
Note: Percentage changes are based on whole numbers while revenues and net operating income are shown in millions.
(1) As defined in "Common definitions" section of the earnings release.
(2) Please see the appendix for a reconciliation of same property revenues and NOI to its closest GAAP measure.
(3) Including the effects of straight-lining of rents during the period, Pacific Northwest Same Property portfolio experienced revenue and NOI growth of 4.6% and 4.6%, respectively.
(4) Including the effects of straight-lining of rents during the period, Southern California Same Property portfolio experienced revenue and NOI growth of 7.2% and 8.0%, respectively.
(5) Including the effects of straight-lining of rents during the period, United Kingdom Same Property portfolio experienced revenue growth of 0.3% and NOI decline of (0.7)%, respectively.
(6) Including the effects of straight-lining of rents during the period, Ireland Same Property portfolio experienced revenue and NOI growth of 4.9% and 2.5%, respectively.
32
Kennedy-Wilson Holdings, Inc.
Commercial Same Property Analysis (continued)
(Unaudited)
(Dollars and Square Feet in millions)
Nine Months Ended September 30, | Same Property Square Feet | Average % Occupancy | Total Revenues(2) | Net Operating Income(2) | ||||||||||||||||||||||||||||||
2018 vs. 2017 | 2018 | 2018 | 2017 | % Change | 2018 | 2017 | % Change | 2018 | 2017 | % Change | ||||||||||||||||||||||||
Region: | ||||||||||||||||||||||||||||||||||
Pacific Northwest(3) | 0.4 | 94.3 | % | 97.4 | % | (3.2 | )% | $ | 1.2 | $ | 1.1 | 9.0 | % | $ | 0.8 | $ | 0.8 | 7.5 | % | |||||||||||||||
Southern California(4) | 0.3 | 91.4 | 87.8 | 4.2 | 5.5 | 4.7 | 16.6 | 4.0 | 3.4 | 18.2 | ||||||||||||||||||||||||
Northern California | 0.1 | 88.5 | 84.4 | 4.8 | 0.8 | 0.7 | 10.7 | 0.7 | 0.7 | 4.6 | ||||||||||||||||||||||||
Mountain States | 1.2 | 92.5 | 93.9 | (1.5 | ) | 5.4 | 5.3 | 1.9 | 4.7 | 4.9 | (3.4 | ) | ||||||||||||||||||||||
Western US | 2.0 | 91.8 | % | 91.4 | % | 0.4 | % | 12.9 | 11.8 | 9.0 | % | 10.2 | 9.8 | 5.5 | % | |||||||||||||||||||
United Kingdom(5) | 6.5 | 97.6 | 97.6 | — | 69.0 | 68.2 | 1.2 | 62.6 | 62.9 | (0.5 | ) | |||||||||||||||||||||||
Ireland(6) | 1.1 | 98.6 | 99.2 | (0.6 | ) | 30.0 | 27.1 | 10.8 | 28.8 | 26.2 | 10.1 | |||||||||||||||||||||||
Spain | 0.5 | 93.1 | 93.2 | (0.1 | ) | 4.8 | 4.8 | 1.1 | 4.8 | 4.7 | 1.0 | |||||||||||||||||||||||
Italy | 0.8 | 100.0 | 100.0 | — | 8.8 | 8.7 | 1.1 | 7.8 | 7.7 | 1.2 | ||||||||||||||||||||||||
Europe | 8.9 | 97.6 | % | 97.7 | % | (0.1 | )% | 112.6 | 108.8 | 3.5 | % | 104.0 | 101.5 | 2.4 | % | |||||||||||||||||||
Total | 10.9 | 97.0 | % | 97.0 | % | — | % | $ | 125.5 | $ | 120.6 | 4.1 | % | $ | 114.2 | $ | 111.3 | 2.7 | % | |||||||||||||||
Note: Percentage changes are based on whole numbers while revenues and net operating income are shown in millions.
(1) As defined in "Common definitions" section of the earnings release.
(2) Please see the appendix for a reconciliation of same property revenues and NOI to its closest GAAP measure.
(3) Including the effects of straight-lining of rents during the period, Pacific Northwest Same Property portfolio experienced revenue and NOI growth of 5.5% and 4.0%, respectively.
(4) Including the effects of straight-lining of rents during the period, Southern California Same Property portfolio experienced revenue and NOI growth of 11.7% and 11.4%, respectively.
(5) Including the effects of straight-lining of rents during the period, United Kingdom Same Property portfolio experienced revenue and NOI decline of (0.2)% and (1.9)%, respectively.
(6) Including the effects of straight-lining of rents during the period, Ireland Same Property portfolio experienced revenue and NOI growth of 3.6% and 2.8%, respectively.
33
Kennedy-Wilson Holdings, Inc.
Investment Transactions
(Unaudited)
(Dollars in millions)
Listed below is additional detailed information about the acquisitions and dispositions completed during the three and nine months ended September 30, 2018 by Kennedy Wilson and its equity partners:
100% | Kennedy Wilson's Share | |||||||||||
Acquisitions | Aggregate Purchase Price | Cap Rate(1) | Pro-Rata Purchase Price | Cap Rate(2) | Est. Forward Return on Cost | KW Ownership(3) | ||||||
Three Months Ended September 30, 2018 | ||||||||||||
Western US | $ | 177.8 | 6.1% | $ | 98.8 | 5.5% | 6.9% | 55.6% | ||||
Europe | 130.8 | — | 65.4 | — | — | 50.0% | ||||||
Total | $ | 308.6 | 6.1% | $ | 164.2 | 5.5% | 6.9% | 53.2% | ||||
Nine Months Ended September 30, 2018 | ||||||||||||
Western US | $ | 577.8 | 6.1% | $ | 260.4 | 5.5% | 6.3% | 45.1% | ||||
Europe | 241.1 | 4.1% | 175.7 | 4.1% | 6.2% | 72.9% | ||||||
Total | $ | 818.9 | 5.7% | $ | 436.1 | 5.0% | 6.3% | 53.3% | ||||
100% | Kennedy Wilson's Share | ||||||||||
Dispositions | Aggregate Sale Price | Cap Rate(1) | Pro-Rata Sale Price | Cap Rate(2) | KW Ownership(3) | ||||||
Three Months Ended September 30, 2018 | |||||||||||
Western US | $ | 77.7 | 3.6% | $ | 10.8 | 3.6% | 13.8% | ||||
Europe | 242.9 | 4.8% | 239.2 | 4.8% | 98.5% | ||||||
Total | $ | 320.6 | 4.5% | $ | 250.0 | 4.7% | 77.9% | ||||
Nine Months Ended September 30, 2018 | |||||||||||
Western US | $ | 591.6 | 5.3% | $ | 251.2 | 5.7% | 42.5% | ||||
Europe | 469.2 | 5.2% | 454.8 | 5.2% | 96.9% | ||||||
Japan | 4.7 | 5.2% | 0.2 | 5.2% | 5.0% | ||||||
Total | $ | 1,065.5 | 5.3% | $ | 706.2 | 5.4% | 66.3% | ||||
(1) For acquisitions and dispositions, the Cap Rate includes only income-producing properties. For the three months ended September 30, 2018, there were $191.4 million of acquisitions and $37.8 million of dispositions of non-income producing assets. For the nine months ended September 30, 2018, there were $231.9 million of acquisitions and $116.2 million of dispositions of non-income producing assets. Please see "common definitions" for a definition of Cap Rate and a description of its limitations.
(2) For acquisitions and dispositions, the Cap Rate include only income-producing properties at Kennedy Wilson's share. For the three months ended September 30, 2018, there were $119.2 million of acquisitions and $28.1 million of dispositions of non-income producing assets. For the nine months ended September 30, 2018, there were $158.4 million of acquisitions and $71.4 million of dispositions of non-income producing assets. Please see "common definitions" for a definition of Cap Rate and a description of its limitations.
(3) Kennedy Wilson's ownership is shown on a weighted-average basis based upon the aggregate purchase/sale price of each investment and Kennedy Wilson's ownership in each investment at the time of acquisition/disposition.
34
Kennedy-Wilson Holdings, Inc.
Segment Detail
(Unaudited)
(Dollars in millions)
Three Months Ended September 30, 2018 | ||||||||||||||||||||||||||||
Investments | Services | Corporate | Consolidated | |||||||||||||||||||||||||
Inv. Mgmt | Prop. Serv | Research | Subtotal | Total | ||||||||||||||||||||||||
Revenue | ||||||||||||||||||||||||||||
Rental | $ | 123.4 | $ | — | $ | — | $ | — | $ | — | $ | — | $ | 123.4 | ||||||||||||||
Hotel | 43.5 | — | — | — | — | — | 43.5 | |||||||||||||||||||||
Sale of real estate | 6.5 | — | — | — | — | — | 6.5 | |||||||||||||||||||||
Investment management, property services and research fees | — | 5.1 | 3.1 | 4.2 | 12.4 | — | 12.4 | |||||||||||||||||||||
Loan purchases, loan originations and other | — | — | — | — | — | — | — | |||||||||||||||||||||
Total revenue | 173.4 | 5.1 | 3.1 | 4.2 | 12.4 | — | 185.8 | |||||||||||||||||||||
Operating expenses | ||||||||||||||||||||||||||||
Rental operating | 38.2 | — | — | — | — | — | 38.2 | |||||||||||||||||||||
Hotel operating | 30.6 | — | — | — | — | — | 30.6 | |||||||||||||||||||||
Cost of real estate sold | 5.8 | — | — | — | — | — | 5.8 | |||||||||||||||||||||
Commission and marketing | — | — | 0.6 | 0.5 | 1.1 | — | 1.1 | |||||||||||||||||||||
Compensation and related | 15.8 | 3.3 | 2.4 | 2.7 | 8.4 | 14.1 | 38.3 | |||||||||||||||||||||
General and administrative | 7.0 | 1.2 | 1.0 | 1.0 | 3.2 | 1.5 | 11.7 | |||||||||||||||||||||
Depreciation and amortization | 51.4 | — | — | 0.1 | 0.1 | — | 51.5 | |||||||||||||||||||||
Total operating expenses | 148.8 | 4.5 | 4.0 | 4.3 | 12.8 | 15.6 | 177.2 | |||||||||||||||||||||
Income from unconsolidated investments, net of depreciation and amortization | 16.3 | 7.7 | — | — | 7.7 | — | 24.0 | |||||||||||||||||||||
Operating income (loss) | 40.9 | 8.3 | (0.9 | ) | (0.1 | ) | 7.3 | (15.6 | ) | 32.6 | ||||||||||||||||||
Non-operating income (expense) | ||||||||||||||||||||||||||||
Gain on sale of real estate, net | 39.4 | — | — | — | — | — | 39.4 | |||||||||||||||||||||
Acquisition-related expenses | (0.4 | ) | — | — | — | — | — | (0.4 | ) | |||||||||||||||||||
Interest expense | (36.6 | ) | — | — | — | — | (18.6 | ) | (55.2 | ) | ||||||||||||||||||
Other income | 0.1 | — | — | — | — | 3.3 | 3.4 | |||||||||||||||||||||
Income (loss) before (provision for) benefit from income taxes | 43.4 | 8.3 | (0.9 | ) | (0.1 | ) | 7.3 | (30.9 | ) | 19.8 | ||||||||||||||||||
(Provision for) benefit from income taxes | (10.6 | ) | — | — | — | — | 3.7 | (6.9 | ) | |||||||||||||||||||
Net income (loss) | 32.8 | 8.3 | (0.9 | ) | (0.1 | ) | 7.3 | (27.2 | ) | 12.9 | ||||||||||||||||||
Net income attributable to noncontrolling interests | (0.8 | ) | — | — | — | — | — | (0.8 | ) | |||||||||||||||||||
Net income (loss) attributable to Kennedy-Wilson Holdings, Inc. common shareholders | $ | 32.0 | $ | 8.3 | $ | (0.9 | ) | $ | (0.1 | ) | $ | 7.3 | $ | (27.2 | ) | $ | 12.1 | |||||||||||
Add back (less) (Kennedy Wilson's Share): | ||||||||||||||||||||||||||||
Interest expense | $ | 42.3 | $ | — | $ | — | $ | — | $ | — | $ | 18.6 | $ | 60.9 | ||||||||||||||
Depreciation and amortization | 52.7 | — | — | 0.1 | 0.1 | — | 52.8 | |||||||||||||||||||||
Provision for (benefit from) income taxes | 10.6 | — | — | — | — | (3.7 | ) | 6.9 | ||||||||||||||||||||
Share-based compensation | — | — | — | — | — | 9.2 | 9.2 | |||||||||||||||||||||
Fees eliminated in consolidation | (0.1 | ) | (0.1 | ) | 0.2 | — | 0.1 | — | — | |||||||||||||||||||
Adjusted EBITDA | $ | 137.5 | $ | 8.2 | $ | (0.7 | ) | $ | — | $ | 7.5 | $ | (3.1 | ) | $ | 141.9 | ||||||||||||
35
Kennedy-Wilson Holdings, Inc.
Segment Detail (continued)
(Unaudited)
(Dollars in millions)
Nine Months Ended September 30, 2018 | ||||||||||||||||||||||||||||
Investments | Services | Corporate | Consolidated | |||||||||||||||||||||||||
Inv. Mgmt | Prop. Serv | Research | Subtotal | Total | ||||||||||||||||||||||||
Revenue | ||||||||||||||||||||||||||||
Rental | $ | 392.6 | $ | — | $ | — | $ | — | $ | — | $ | — | $ | 392.6 | ||||||||||||||
Hotel | 117.6 | — | — | — | — | — | 117.6 | |||||||||||||||||||||
Sale of real estate | 48.7 | — | — | — | — | — | 48.7 | |||||||||||||||||||||
Investment management, property services and research fees | — | 11.1 | 11.4 | 12.3 | 34.8 | — | 34.8 | |||||||||||||||||||||
Loan purchases, loan originations and other | 1.1 | — | — | — | — | — | 1.1 | |||||||||||||||||||||
Total revenue | 560.0 | 11.1 | 11.4 | 12.3 | 34.8 | — | 594.8 | |||||||||||||||||||||
Operating expenses | ||||||||||||||||||||||||||||
Rental operating | 119.5 | — | — | — | — | — | 119.5 | |||||||||||||||||||||
Hotel operating | 90.8 | — | — | — | — | — | 90.8 | |||||||||||||||||||||
Cost of real estate sold | 45.6 | — | — | — | — | — | 45.6 | |||||||||||||||||||||
Commission and marketing | — | — | 2.7 | 1.9 | 4.6 | — | 4.6 | |||||||||||||||||||||
Compensation and related | 52.2 | 10.5 | 7.1 | 8.5 | 26.1 | 44.5 | 122.8 | |||||||||||||||||||||
General and administrative | 22.6 | 3.6 | 2.4 | 3.3 | 9.3 | 4.7 | 36.6 | |||||||||||||||||||||
Depreciation and amortization | 158.5 | — | — | 0.2 | 0.2 | — | 158.7 | |||||||||||||||||||||
Total operating expenses | 489.2 | 14.1 | 12.2 | 13.9 | 40.2 | 49.2 | 578.6 | |||||||||||||||||||||
Income from unconsolidated investments, net of depreciation and amortization | 36.1 | 24.8 | — | — | 24.8 | — | 60.9 | |||||||||||||||||||||
Operating income (loss) | 106.9 | 21.8 | (0.8 | ) | (1.6 | ) | 19.4 | (49.2 | ) | 77.1 | ||||||||||||||||||
Non-operating income (expense) | ||||||||||||||||||||||||||||
Gain on sale of real estate, net | 304.2 | — | — | — | — | — | 304.2 | |||||||||||||||||||||
Acquisition-related expenses | (0.6 | ) | — | — | — | — | — | (0.6 | ) | |||||||||||||||||||
Interest expense | (123.4 | ) | — | — | — | — | (57.9 | ) | (181.3 | ) | ||||||||||||||||||
Other income | 0.4 | — | — | — | — | 13.1 | 13.5 | |||||||||||||||||||||
Income (loss) before provision for income taxes | 287.5 | 21.8 | (0.8 | ) | (1.6 | ) | 19.4 | (94.0 | ) | 212.9 | ||||||||||||||||||
Provision for income taxes | (10.6 | ) | — | — | — | — | (23.1 | ) | (33.7 | ) | ||||||||||||||||||
Net income (loss) | 276.9 | 21.8 | (0.8 | ) | (1.6 | ) | 19.4 | (117.1 | ) | 179.2 | ||||||||||||||||||
Net income attributable to noncontrolling interests | (59.9 | ) | — | — | — | — | — | (59.9 | ) | |||||||||||||||||||
Net income (loss) attributable to Kennedy-Wilson Holdings, Inc. common shareholders | $ | 217.0 | $ | 21.8 | $ | (0.8 | ) | $ | (1.6 | ) | $ | 19.4 | $ | (117.1 | ) | $ | 119.3 | |||||||||||
Add back (less) (Kennedy Wilson's Share): | ||||||||||||||||||||||||||||
Interest expense | $ | 135.2 | $ | — | $ | — | $ | — | $ | — | $ | 57.9 | $ | 193.1 | ||||||||||||||
Depreciation and amortization | 160.8 | — | — | 0.2 | 0.2 | — | 161.0 | |||||||||||||||||||||
Provision for income taxes | 10.6 | — | — | — | — | 23.1 | 33.7 | |||||||||||||||||||||
Share-based compensation | — | — | — | — | — | 27.9 | 27.9 | |||||||||||||||||||||
Fees eliminated in consolidation | (12.7 | ) | 11.9 | 0.8 | — | 12.7 | — | — | ||||||||||||||||||||
Adjusted EBITDA | $ | 510.9 | $ | 33.7 | $ | — | $ | (1.4 | ) | $ | 32.3 | $ | (8.2 | ) | $ | 535.0 | ||||||||||||
36
Kennedy-Wilson Holdings, Inc.
Segment Detail (continued)
(Unaudited)
(Dollars in millions)
Three Months Ended September 30, 2017 | ||||||||||||||||||||||||||||
Investments | Services | Corporate | Consolidated | |||||||||||||||||||||||||
Inv. Mgmt | Prop. Serv | Research | Subtotal | Total | ||||||||||||||||||||||||
Revenue | ||||||||||||||||||||||||||||
Rental | $ | 125.5 | $ | — | $ | — | $ | — | $ | — | $ | — | $ | 125.5 | ||||||||||||||
Hotel | 37.3 | — | — | — | — | — | 37.3 | |||||||||||||||||||||
Sale of real estate | 89.8 | — | — | — | — | — | 89.8 | |||||||||||||||||||||
Investment management, property services and research fees | — | 2.4 | 5.6 | 3.4 | 11.4 | — | 11.4 | |||||||||||||||||||||
Loan purchases, loan originations and other | 8.5 | — | — | — | — | — | 8.5 | |||||||||||||||||||||
Total revenue | 261.1 | 2.4 | 5.6 | 3.4 | 11.4 | — | 272.5 | |||||||||||||||||||||
Operating expenses | ||||||||||||||||||||||||||||
Rental operating | 38.0 | — | — | — | — | — | 38.0 | |||||||||||||||||||||
Hotel operating | 26.1 | — | — | — | — | — | 26.1 | |||||||||||||||||||||
Cost of real estate sold | 63.4 | — | — | — | — | — | 63.4 | |||||||||||||||||||||
Commission and marketing | — | — | 1.4 | 0.7 | 2.1 | — | 2.1 | |||||||||||||||||||||
Compensation and related | 12.8 | 3.5 | 2.7 | 2.8 | 9.0 | 13.6 | 35.4 | |||||||||||||||||||||
General and administrative | 6.6 | 1.3 | 0.8 | 0.9 | 3.0 | 1.2 | 10.8 | |||||||||||||||||||||
Depreciation and amortization | 55.4 | — | — | — | — | — | 55.4 | |||||||||||||||||||||
Total operating expenses | 202.3 | 4.8 | 4.9 | 4.4 | 14.1 | 14.8 | 231.2 | |||||||||||||||||||||
Income from unconsolidated investments, net of depreciation and amortization | 12.7 | 4.8 | 0.1 | — | 4.9 | — | 17.6 | |||||||||||||||||||||
Operating income (loss) | 71.5 | 2.4 | 0.8 | (1.0 | ) | 2.2 | (14.8 | ) | 58.9 | |||||||||||||||||||
Non-operating income (expense) | ||||||||||||||||||||||||||||
Gain on sale of real estate, net | 5.3 | — | — | — | — | — | 5.3 | |||||||||||||||||||||
Acquisition-related expenses | (1.0 | ) | — | — | — | — | — | (1.0 | ) | |||||||||||||||||||
Interest expense | (37.9 | ) | — | — | — | — | (18.9 | ) | (56.8 | ) | ||||||||||||||||||
Other (expense) income | (2.9 | ) | — | — | — | — | 2.6 | (0.3 | ) | |||||||||||||||||||
Income (loss) before (provision for) benefit from income taxes | 35.0 | 2.4 | 0.8 | (1.0 | ) | 2.2 | (31.1 | ) | 6.1 | |||||||||||||||||||
(Provision for) benefit from income taxes | (1.4 | ) | — | — | — | — | 5.1 | 3.7 | ||||||||||||||||||||
Net income (loss) | 33.6 | 2.4 | 0.8 | (1.0 | ) | 2.2 | (26.0 | ) | 9.8 | |||||||||||||||||||
Net income attributable to noncontrolling interests | (18.7 | ) | — | — | — | — | — | (18.7 | ) | |||||||||||||||||||
Net income (loss) attributable to Kennedy-Wilson Holdings, Inc. common shareholders | $ | 14.9 | $ | 2.4 | $ | 0.8 | $ | (1.0 | ) | $ | 2.2 | $ | (26.0 | ) | $ | (8.9 | ) | |||||||||||
Add back (less) (Kennedy Wilson's Share): | ||||||||||||||||||||||||||||
Interest expense | $ | 27.0 | $ | — | $ | 0.2 | $ | — | $ | 0.2 | $ | 18.9 | $ | 46.1 | ||||||||||||||
Depreciation and amortization | 33.5 | — | 0.9 | — | 0.9 | — | 34.4 | |||||||||||||||||||||
Benefit from income taxes | (0.3 | ) | — | — | — | — | (5.1 | ) | (5.4 | ) | ||||||||||||||||||
Share-based compensation | — | — | — | — | — | 9.3 | 9.3 | |||||||||||||||||||||
Fees eliminated in consolidation | (7.9 | ) | 7.5 | 0.4 | — | 7.9 | — | — | ||||||||||||||||||||
Adjusted EBITDA | $ | 67.2 | $ | 9.9 | $ | 2.3 | $ | (1.0 | ) | $ | 11.2 | $ | (2.9 | ) | $ | 75.5 | ||||||||||||
37
Kennedy-Wilson Holdings, Inc.
Segment Detail (continued)
(Unaudited)
(Dollars in millions)
Nine Months Ended September 30, 2017 | ||||||||||||||||||||||||||||
Investments | Services | Corporate | Consolidated | |||||||||||||||||||||||||
Inv. Mgmt | Prop. Serv | Research | Subtotal | Total | ||||||||||||||||||||||||
Revenue | ||||||||||||||||||||||||||||
Rental | $ | 373.6 | $ | — | $ | — | $ | — | $ | — | $ | — | $ | 373.6 | ||||||||||||||
Hotel | 95.8 | — | — | — | — | — | 95.8 | |||||||||||||||||||||
Sale of real estate | 103.4 | — | — | — | — | — | 103.4 | |||||||||||||||||||||
Investment management, property services and research fees | — | 8.3 | 15.4 | 9.0 | 32.7 | — | 32.7 | |||||||||||||||||||||
Loan purchases, loan originations and other | 15.0 | — | — | — | — | — | 15.0 | |||||||||||||||||||||
Total revenue | 587.8 | 8.3 | 15.4 | 9.0 | 32.7 | — | 620.5 | |||||||||||||||||||||
Operating expenses | ||||||||||||||||||||||||||||
Rental operating | 110.5 | — | — | — | — | — | 110.5 | |||||||||||||||||||||
Hotel operating | 73.3 | — | — | — | — | — | 73.3 | |||||||||||||||||||||
Cost of real estate sold | 73.7 | — | — | — | — | — | 73.7 | |||||||||||||||||||||
Commission and marketing | — | — | 3.7 | 2.2 | 5.9 | — | 5.9 | |||||||||||||||||||||
Compensation and related | 42.9 | 10.3 | 8.9 | 8.3 | 27.5 | 43.1 | 113.5 | |||||||||||||||||||||
General and administrative | 18.4 | 3.8 | 2.5 | 2.5 | 8.8 | 3.5 | 30.7 | |||||||||||||||||||||
Depreciation and amortization | 157.2 | — | — | — | — | — | 157.2 | |||||||||||||||||||||
Total operating expenses | 476.0 | 14.1 | 15.1 | 13.0 | 42.2 | 46.6 | 564.8 | |||||||||||||||||||||
Income from unconsolidated investments, net of depreciation and amortization | 46.9 | 9.1 | 1.4 | — | 10.5 | — | 57.4 | |||||||||||||||||||||
Operating income (loss) | 158.7 | 3.3 | 1.7 | (4.0 | ) | 1.0 | (46.6 | ) | 113.1 | |||||||||||||||||||
Non-operating income (expense) | ||||||||||||||||||||||||||||
Gain on sale of real estate, net | 77.0 | — | — | — | — | — | 77.0 | |||||||||||||||||||||
Acquisition-related expenses | (2.3 | ) | — | — | — | — | — | (2.3 | ) | |||||||||||||||||||
Interest expense | (107.8 | ) | — | — | — | — | (51.1 | ) | (158.9 | ) | ||||||||||||||||||
Other (expense) income | (2.4 | ) | — | — | — | — | 7.0 | 4.6 | ||||||||||||||||||||
Income (loss) before (provision for) benefit from income taxes | 123.2 | 3.3 | 1.7 | (4.0 | ) | 1.0 | (90.7 | ) | 33.5 | |||||||||||||||||||
(Provision for) benefit from income taxes | (3.7 | ) | — | — | — | — | 2.8 | (0.9 | ) | |||||||||||||||||||
Net income (loss) | 119.5 | 3.3 | 1.7 | (4.0 | ) | 1.0 | (87.9 | ) | 32.6 | |||||||||||||||||||
Net income attributable to noncontrolling interests | (31.3 | ) | — | — | — | — | — | (31.3 | ) | |||||||||||||||||||
Net income (less) attributable to Kennedy-Wilson Holdings, Inc. common shareholders | $ | 88.2 | $ | 3.3 | $ | 1.7 | $ | (4.0 | ) | $ | 1.0 | $ | (87.9 | ) | $ | 1.3 | ||||||||||||
Add back (less) (Kennedy Wilson's Share): | ||||||||||||||||||||||||||||
Interest expense | $ | 78.1 | $ | — | $ | 0.5 | $ | — | $ | 0.5 | $ | 51.1 | $ | 129.7 | ||||||||||||||
Depreciation and amortization | 95.1 | — | 2.7 | — | 2.7 | — | 97.8 | |||||||||||||||||||||
(Benefit from) provision for income taxes | (0.4 | ) | — | — | — | — | (2.8 | ) | (3.2 | ) | ||||||||||||||||||
Share-based compensation | — | — | — | — | — | 29.4 | 29.4 | |||||||||||||||||||||
Fees eliminated in consolidation | (22.5 | ) | 21.5 | 1.0 | — | 22.5 | — | — | ||||||||||||||||||||
Adjusted EBITDA | $ | 238.5 | $ | 24.8 | $ | 5.9 | $ | (4.0 | ) | $ | 26.7 | $ | (10.2 | ) | $ | 255.0 | ||||||||||||
38
NON-GAAP PRO RATA FINANCIAL INFORMATION
The following non-GAAP Pro-rata information is not intended to be a presentation in accordance with GAAP. The Pro-rata financial information reflects our proportionate economic ownership of each asset in our portfolio that we do not wholly own. The amounts in the column labeled “KW Share of Unconsolidated Investments” were derived on a property-by-property basis by applying to each financial statement line item the ownership percentage interest used to arrive at our share of net income or loss during the period when applying the equity method of accounting to each of our unconsolidated joint ventures. A similar calculation was performed for the amounts in the column labeled “Noncontrolling Interests,” which represents the share of consolidated assets attributable to noncontrolling interests.
We do not control the unconsolidated investments and the presentations of the assets and liabilities and revenues and expenses do not represent our legal claim to such items. The operating agreements of the unconsolidated investments generally provide that partners may receive cash distributions (1) to the extent there is available cash from operations, (2) upon a capital event, such as a refinancing or sale or (3) upon liquidation of the venture. The amount of cash each partner receives is based upon specific provisions of each operating agreement and varies depending on factors including the amount of capital contributed by each partner and whether any contributions are entitled to priority distributions. Upon liquidation of the unconsolidated investments and after all liabilities, priority distributions and initial equity contributions have been repaid, the partners generally would be entitled to any residual cash remaining based on their respective legal ownership percentages. We provide this information because we believe it assists investors and analysts in estimating our economic interest in our unconsolidated investments when read in conjunction with the Company’s reported results under GAAP.
The presentation of Pro-rata financial information has limitations as an analytical tool. Some of these limitations include:
• The amounts shown on the individual line items were derived by applying our overall economic ownership interest percentage determined when applying the equity method of accounting and do not necessarily represent our legal claim to the assets and liabilities, or the revenues and expenses; and
• Other companies in our industry may calculate their pro rata interest differently than we do, which limits the usefulness of the amount in our pro rata financial statements as a comparative measure.
Because of these limitations, the pro rata financial information should not be considered in isolation or as a substitute for our financial statements as reported under U.S. GAAP. We compensate for these limitations by relying primarily on our U.S. GAAP results and using the Pro-rata financial information only supplementally.
39
Kennedy-Wilson Holdings, Inc.
Non-GAAP Pro-rata Financial Information
(Unaudited)
(Dollars in millions)
September 30, 2018 | December 31, 2017 | |||||||||||||||
Non-GAAP | Non-GAAP | Non-GAAP | Non-GAAP | |||||||||||||
Noncontrolling Interests (2) | KW Share of Unconsolidated Investments (3) | Noncontrolling Interests (2) | KW Share of Unconsolidated Investments (3) | |||||||||||||
Assets | ||||||||||||||||
Cash and cash equivalents | $ | (23.4 | ) | $ | 31.8 | $ | (21.4 | ) | $ | 23.6 | ||||||
Accounts receivable | (14.1 | ) | 2.2 | (2.8 | ) | 3.5 | ||||||||||
Real estate and acquired in place lease values, net of accumulated depreciation and amortization (1) | (383.2 | ) | 1,497.7 | (484.4 | ) | 970.6 | ||||||||||
Loan purchases and originations | — | 1.8 | — | — | ||||||||||||
Unconsolidated investments | — | (789.7 | ) | — | (519.3 | ) | ||||||||||
Other assets | (33.5 | ) | 110.1 | (42.0 | ) | 148.9 | ||||||||||
Total assets | $ | (454.2 | ) | $ | 853.9 | $ | (550.6 | ) | $ | 627.3 | ||||||
Liabilities | ||||||||||||||||
Accounts payable | $ | (4.1 | ) | $ | — | $ | (3.4 | ) | $ | — | ||||||
Accrued expenses and other liabilities | (46.4 | ) | 33.0 | (37.4 | ) | 14.0 | ||||||||||
Mortgage debt | (214.9 | ) | 820.9 | (297.9 | ) | 613.3 | ||||||||||
KW unsecured debt | — | — | — | — | ||||||||||||
KWE unsecured bonds | — | — | — | — | ||||||||||||
Total liabilities | (265.4 | ) | 853.9 | (338.7 | ) | 627.3 | ||||||||||
Equity | ||||||||||||||||
Total Kennedy-Wilson Holdings, Inc. shareholders’ equity | — | — | — | — | ||||||||||||
Noncontrolling interests | (188.8 | ) | — | (211.9 | ) | — | ||||||||||
Total equity | (188.8 | ) | — | (211.9 | ) | — | ||||||||||
Total liabilities and equity | $ | (454.2 | ) | $ | 853.9 | $ | (550.6 | ) | $ | 627.3 | ||||||
(1) Includes Kennedy Wilson's total share of accumulated depreciation and amortization of $31.6 million and $78.8 million relating to noncontrolling interests and unconsolidated investments, and $41.6 million and $81.5 million relating to noncontrolling interests and unconsolidated investments, as of September 30, 2018 and December 31, 2017, respectively.
(2) Represents the portion of equity ownership in a consolidated subsidiary not attributable to Kennedy Wilson.
(3) Represents Kennedy Wilson's pro-rata share of unconsolidated joint-ventures.
40
Kennedy-Wilson Holdings, Inc.
Non-GAAP Pro-rata Financial Information
(Unaudited)
(Dollars in millions)
3Q - 2018 | 3Q - 2017 | |||||||||||||||
Non-GAAP | Non-GAAP | Non-GAAP | Non-GAAP | |||||||||||||
Noncontrolling Interests(1) | KW Share of Unconsolidated Investments(2) | Noncontrolling Interests(1) | KW Share of Unconsolidated Investments(2) | |||||||||||||
Revenue | ||||||||||||||||
Rental | $ | (5.0 | ) | $ | 27.6 | $ | (52.0 | ) | $ | 21.9 | ||||||
Hotel | (6.2 | ) | — | (14.6 | ) | — | ||||||||||
Sale of real estate | (3.7 | ) | 4.7 | (53.3 | ) | 24.1 | ||||||||||
Investment management, property services and research fees | 0.1 | 7.6 | 7.9 | 7.4 | ||||||||||||
Loan purchases, loan originations and other | — | — | (6.5 | ) | — | |||||||||||
Total revenue | (14.8 | ) | 39.9 | (118.5 | ) | 53.4 | ||||||||||
Operating expenses | ||||||||||||||||
Rental operating | (2.5 | ) | 11.7 | (14.1 | ) | 9.4 | ||||||||||
Hotel operating | (5.1 | ) | — | (10.4 | ) | — | ||||||||||
Cost of real estate sold | (3.3 | ) | 4.5 | (37.9 | ) | 15.6 | ||||||||||
Commission and marketing | — | — | — | — | ||||||||||||
Compensation and related | — | — | (0.1 | ) | 0.3 | |||||||||||
General and administrative | — | — | (1.8 | ) | 0.7 | |||||||||||
Depreciation and amortization | (2.2 | ) | 3.5 | (25.3 | ) | 4.2 | ||||||||||
Total operating expenses | (13.1 | ) | 19.7 | (89.6 | ) | 30.2 | ||||||||||
Income from unconsolidated investments, net of depreciation and amortization | (0.7 | ) | (23.3 | ) | (0.5 | ) | (17.1 | ) | ||||||||
Operating income | (2.4 | ) | (3.1 | ) | (29.4 | ) | 6.1 | |||||||||
Non-operating income (expense) | ||||||||||||||||
Gain on sale of real estate, net | — | 0.4 | (3.9 | ) | 0.9 | |||||||||||
Acquisition-related expenses | — | — | 0.1 | — | ||||||||||||
Interest expense | 1.4 | (7.2 | ) | 16.2 | (5.6 | ) | ||||||||||
Other income (expense) | 0.2 | (0.2 | ) | (3.4 | ) | (1.2 | ) | |||||||||
Fair Value/Other Adjustments (3) | — | 10.1 | — | (0.2 | ) | |||||||||||
Loss before benefit from income taxes | (0.8 | ) | — | (20.4 | ) | — | ||||||||||
Benefit from income taxes | — | — | 1.7 | — | ||||||||||||
Net loss | (0.8 | ) | — | (18.7 | ) | — | ||||||||||
Net loss attributable to noncontrolling interests | 0.8 | — | 18.7 | — | ||||||||||||
Net income attributable to Kennedy-Wilson Holdings, Inc. common shareholders | $ | — | $ | — | $ | — | $ | — | ||||||||
(1) Represents the portion of equity ownership in a consolidated subsidiary not attributable to Kennedy Wilson.
(2) Represents Kennedy Wilson's pro-rata share of unconsolidated joint-ventures.
(3) Includes the reclassification of cumulative unrealized fair value gains/losses on unconsolidated investments, as realized.
41
Kennedy-Wilson Holdings, Inc.
Non-GAAP Pro-rata Financial Information
(Unaudited)
(Dollars in millions)
Nine Months Ended September 30, 2018 | Nine Months Ended September 30, 2017 | |||||||||||||||
Non-GAAP | Non-GAAP | Non-GAAP | Non-GAAP | |||||||||||||
Noncontrolling Interests(1) | KW Share of Unconsolidated Investments(2) | Noncontrolling Interests(1) | KW Share of Unconsolidated Investments(2) | |||||||||||||
Revenue | ||||||||||||||||
Rental | $ | (19.8 | ) | $ | 72.6 | $ | (157.9 | ) | $ | 64.5 | ||||||
Hotel | (16.9 | ) | — | (36.4 | ) | — | ||||||||||
Sale of real estate | (26.1 | ) | 10.9 | (61.4 | ) | 96.8 | ||||||||||
Investment management, property services and research fees | 12.6 | 24.8 | 22.6 | 17.1 | ||||||||||||
Loan purchases, loan originations and other | — | — | (11.2 | ) | — | |||||||||||
Total revenue | (50.2 | ) | 108.3 | (244.3 | ) | 178.4 | ||||||||||
Operating expenses | ||||||||||||||||
Rental operating | (6.5 | ) | 29.9 | (40.7 | ) | 28.2 | ||||||||||
Hotel operating | (14.2 | ) | — | (29.2 | ) | — | ||||||||||
Cost of real estate sold | (24.4 | ) | 10.3 | (44.1 | ) | 66.9 | ||||||||||
Commission and marketing | — | — | — | — | ||||||||||||
Compensation and related | — | — | (0.5 | ) | 0.9 | |||||||||||
General and administrative | (0.1 | ) | — | (5.4 | ) | 2.6 | ||||||||||
Depreciation and amortization | (7.9 | ) | 10.2 | (72.3 | ) | 12.9 | ||||||||||
Total operating expenses | (53.1 | ) | 50.4 | (192.2 | ) | 111.5 | ||||||||||
Income from unconsolidated investments, net of depreciation and amortization | (1.6 | ) | (59.3 | ) | (1.5 | ) | (55.9 | ) | ||||||||
Operating income (loss) | 1.3 | (1.4 | ) | (53.6 | ) | 11.0 | ||||||||||
Non-operating income (expense) | ||||||||||||||||
Gain on sale of real estate, net | (68.4 | ) | 2.4 | (17.7 | ) | 10.0 | ||||||||||
Acquisition-related expenses | — | — | 0.1 | — | ||||||||||||
Interest expense | 6.6 | (18.6 | ) | 46.3 | (17.2 | ) | ||||||||||
Other income (expense) | 0.6 | (2.9 | ) | (10.5 | ) | (4.2 | ) | |||||||||
Fair Value/Other Adjustments (3) | — | 20.5 | — | 0.4 | ||||||||||||
Loss before benefit from income taxes | (59.9 | ) | — | (35.4 | ) | — | ||||||||||
Benefit from income taxes | — | — | 4.1 | — | ||||||||||||
Net loss | (59.9 | ) | — | (31.3 | ) | — | ||||||||||
Net loss attributable to noncontrolling interests | 59.9 | — | 31.3 | — | ||||||||||||
Net income attributable to Kennedy-Wilson Holdings, Inc. common shareholders | $ | — | $ | — | $ | — | $ | — | ||||||||
(1) Represents the portion of equity ownership in a consolidated subsidiary not attributable to Kennedy Wilson.
(2) Represents Kennedy Wilson's pro-rata share of unconsolidated joint-ventures.
(3) Includes the reclassification of cumulative unrealized fair value gains/losses on unconsolidated investments, as realized.
42
APPENDIX
43
Kennedy-Wilson Holdings, Inc.
Reconciliation of Kennedy Wilson's Share Amounts
(Unaudited)
(Dollars in millions)
Three Months Ended | Nine Months Ended | |||||||||||||||
September 30, | September 30, | |||||||||||||||
2018 | 2017 | 2018 | 2017 | |||||||||||||
Interest expense - investment (Kennedy Wilson's Share) | ||||||||||||||||
Interest expense - investment | $ | 36.6 | $ | 37.9 | $ | 123.4 | $ | 107.8 | ||||||||
Interest expense (attributable to noncontrolling interests) | (1.4 | ) | (16.2 | ) | (6.5 | ) | (46.2 | ) | ||||||||
Kennedy Wilson's share of interest expense included in unconsolidated investments | 7.1 | 5.5 | 18.3 | 17.0 | ||||||||||||
Interest expense - investment (Kennedy Wilson's Share) | $ | 42.3 | $ | 27.2 | $ | 135.2 | $ | 78.6 | ||||||||
Interest expense - corporate (Kennedy Wilson's Share) | ||||||||||||||||
Interest expense - corporate | $ | 18.6 | $ | 18.9 | $ | 57.9 | $ | 51.1 | ||||||||
Interest expense - corporate (Kennedy Wilson's Share) | $ | 18.6 | $ | 18.9 | $ | 57.9 | $ | 51.1 | ||||||||
Depreciation and amortization (Kennedy Wilson's Share) | ||||||||||||||||
Depreciation and amortization | $ | 51.5 | $ | 55.4 | $ | 158.7 | $ | 157.2 | ||||||||
Depreciation and amortization (attributable to noncontrolling interests) | (2.1 | ) | (25.3 | ) | (7.7 | ) | (72.4 | ) | ||||||||
Kennedy Wilson's share of depreciation and amortization included in unconsolidated investments | 3.4 | 4.3 | 10.0 | 13.0 | ||||||||||||
Depreciation and amortization (Kennedy Wilson's Share) | $ | 52.8 | $ | 34.4 | $ | 161.0 | $ | 97.8 | ||||||||
Provision for (benefit from) income taxes (Kennedy Wilson's Share) | ||||||||||||||||
Provision for income taxes | $ | 6.9 | $ | (3.7 | ) | $ | 33.7 | $ | 0.9 | |||||||
Provision income taxes (attributable to noncontrolling interests) | — | (1.7 | ) | — | (4.1 | ) | ||||||||||
Provision for income taxes (Kennedy Wilson's Share) | $ | 6.9 | $ | (5.4 | ) | $ | 33.7 | $ | (3.2 | ) | ||||||
44
Kennedy-Wilson Holdings, Inc.
Same Property Reconciliation
(Unaudited)
(Dollars in millions)
3Q - 2018 | 3Q - 2017 | |||||||||||||||
Same Property | Same Property | |||||||||||||||
Revenue | NOI | Revenue | NOI | |||||||||||||
Operating Income | $ | 32.6 | $ | 32.6 | $ | 58.9 | $ | 58.9 | ||||||||
Less: Sale of real estate | (6.5 | ) | (6.5 | ) | (89.8 | ) | (89.8 | ) | ||||||||
Less: Investment management, property services and research fees | (12.4 | ) | (12.4 | ) | (11.4 | ) | (11.4 | ) | ||||||||
Less: Loans and other income | — | — | (8.5 | ) | (8.5 | ) | ||||||||||
Add: Rental operating | 38.2 | — | 38.0 | — | ||||||||||||
Add: Hotel operating | 30.6 | — | 26.1 | — | ||||||||||||
Add: Cost of real estate sold | 5.8 | 5.8 | 63.4 | 63.4 | ||||||||||||
Add: Commission and marketing | 1.1 | 1.1 | 2.1 | 2.1 | ||||||||||||
Add: Compensation and related | 38.3 | 38.3 | 35.4 | 35.4 | ||||||||||||
Add: General and administrative | 11.7 | 11.7 | 10.8 | 10.8 | ||||||||||||
Add: Depreciation and amortization | 51.5 | 51.5 | 55.4 | 55.4 | ||||||||||||
Less: Income from unconsolidated investments | (24.0 | ) | (24.0 | ) | (17.6 | ) | (17.6 | ) | ||||||||
Property-Level (Consolidated) | $ | 166.9 | $ | 98.1 | $ | 162.8 | $ | 98.7 | ||||||||
Less: NCI adjustments (1) | (9.9 | ) | (3.2 | ) | (13.1 | ) | (6.5 | ) | ||||||||
Add: Unconsolidated investment adjustments (2) | 19.9 | 16.1 | 18.8 | 13.2 | ||||||||||||
Add: Straight-line and above/below market rents | (4.2 | ) | (4.2 | ) | (2.2 | ) | (2.2 | ) | ||||||||
Less: Reimbursement of recoverable operating expenses | (7.4 | ) | — | (7.2 | ) | — | ||||||||||
Less: Properties bought and sold (3) | (22.8 | ) | (10.5 | ) | (24.8 | ) | (14.2 | ) | ||||||||
Less: Other properties excluded (4) | (14.2 | ) | (8.3 | ) | (8.1 | ) | (3.8 | ) | ||||||||
Other Reconciling Items (5) | 5.6 | 2.6 | 2.4 | 1.8 | ||||||||||||
Same Property | $ | 133.9 | $ | 90.6 | $ | 128.6 | $ | 87.0 | ||||||||
3Q - 2018 | 3Q - 2017 | |||||||||||||||
Same Property | Same Property | |||||||||||||||
Same Property (Reported) | Revenue | NOI | Revenue | NOI | ||||||||||||
Commercial - Same Property | $ | 48.5 | $ | 43.0 | $ | 47.3 | $ | 42.3 | ||||||||
Multifamily Market Rate Portfolio - Same Property | 47.8 | 32.3 | 45.6 | 30.8 | ||||||||||||
Multifamily Affordable Portfolio - Same Property | 6.2 | 4.4 | 6.0 | 4.1 | ||||||||||||
Hotel - Same Property | 31.4 | 10.9 | 29.7 | 9.8 | ||||||||||||
Same Property | $ | 133.9 | $ | 90.6 | $ | 128.6 | $ | 87.0 | ||||||||
(1) Represents rental revenue and operating expenses and hotel revenue and operating expenses attributable to non-controlling interests.
(2) Represents the Company’s share of unconsolidated investment rental revenues and net operating income, as applicable, which are within the applicable same property population.
(3) Represents properties excluded from the same property population that were purchased or sold during the applicable period.
(4) Represents properties excluded from the same property population that were not stabilized during the applicable periods.
(5) Represents other properties excluded from the same property population that were not classified as either a commercial or multifamily property within the Company’s portfolio. Also includes immaterial adjustments for foreign exchange rates, changes in ownership percentages, and certain non-recurring income and expenses.
45
Kennedy-Wilson Holdings, Inc.
Same Property Reconciliation (continued)
(Unaudited)
(Dollars in millions)
Nine Months Ended September 30, 2018 | Nine Months Ended September 30, 2017 | |||||||||||||||
Same Property | Same Property | |||||||||||||||
Revenue | NOI | Revenue | NOI | |||||||||||||
Operating Income | $ | 77.1 | $ | 77.1 | $ | 113.1 | $ | 113.1 | ||||||||
Less: Sale of real estate | (48.7 | ) | (48.7 | ) | (103.4 | ) | (103.4 | ) | ||||||||
Less: Investment management, property services and research fees | (34.8 | ) | (34.8 | ) | (32.7 | ) | (32.7 | ) | ||||||||
Less: Loans and other income | (1.1 | ) | (1.1 | ) | (15.0 | ) | (15.0 | ) | ||||||||
Add: Rental operating | 119.5 | — | 110.5 | — | ||||||||||||
Add: Hotel operating | 90.8 | — | 73.3 | — | ||||||||||||
Add: Cost of real estate sold | 45.6 | 45.6 | 73.7 | 73.7 | ||||||||||||
Add: Commission and marketing | 4.6 | 4.6 | 5.9 | 5.9 | ||||||||||||
Add: Compensation and related | 122.8 | 122.8 | 113.5 | 113.5 | ||||||||||||
Add: General and administrative | 36.6 | 36.6 | 30.7 | 30.7 | ||||||||||||
Add: Depreciation and amortization | 158.7 | 158.7 | 157.2 | 157.2 | ||||||||||||
Less: Income from unconsolidated investments | (60.9 | ) | (60.9 | ) | (57.4 | ) | (57.4 | ) | ||||||||
Property-Level (Consolidated) | $ | 510.2 | $ | 299.9 | $ | 469.4 | $ | 285.6 | ||||||||
Less: NCI adjustments (1) | (36.0 | ) | (15.5 | ) | (40.7 | ) | (17.4 | ) | ||||||||
Add: Unconsolidated investment adjustments (2) | 52.9 | 36.9 | 50.4 | 32.6 | ||||||||||||
Add: Straight-line and above/below market rents | (11.7 | ) | (11.7 | ) | (7.9 | ) | (7.9 | ) | ||||||||
Less: Reimbursement of recoverable operating expenses | (24.3 | ) | — | (23.0 | ) | — | ||||||||||
Less: Properties bought and sold (3) | (78.5 | ) | (41.3 | ) | (65.7 | ) | (45.5 | ) | ||||||||
Less: Other properties excluded (4) | (40.3 | ) | (22.7 | ) | (36.7 | ) | (20.3 | ) | ||||||||
Other Reconciling Items (5) | (11.5 | ) | (3.4 | ) | (1.1 | ) | 3.7 | |||||||||
Same Property | $ | 360.8 | $ | 242.2 | $ | 344.7 | $ | 230.8 | ||||||||
Nine Months Ended September 30, 2018 | Nine Months Ended September 30, 2017 | |||||||||||||||
Same Property | Same Property | |||||||||||||||
Same Property (Reported) | Revenue | NOI | Revenue | NOI | ||||||||||||
Commercial - Same Property | $ | 125.5 | $ | 114.2 | $ | 120.6 | $ | 111.3 | ||||||||
Multifamily Market Rate Portfolio - Same Property | 137.3 | 93.6 | 130.6 | 88.4 | ||||||||||||
Multifamily Affordable Portfolio - Same Property | 18.4 | 12.6 | 17.4 | 11.7 | ||||||||||||
Hotel - Same Property | 79.6 | 21.8 | 76.1 | 19.4 | ||||||||||||
Same Property | $ | 360.8 | $ | 242.2 | $ | 344.7 | $ | 230.8 | ||||||||
(1) Represents rental revenue and operating expenses and hotel revenue and operating expenses attributable to non-controlling interests.
(2) Represents the Company’s share of unconsolidated investment rental revenues and net operating income, as applicable, which are within the applicable same property population.
(3) Represents properties excluded from the same property population that were purchased or sold during the applicable period.
(4) Represents properties excluded from the same property population that were not stabilized during the applicable periods.
(5) Represents other properties excluded from the same property population that were not classified as either a commercial or multifamily property within the Company’s portfolio. Also includes immaterial adjustments for foreign exchange rates, changes in ownership percentages, and certain non-recurring income and expenses.
46
Kennedy-Wilson Holdings, Inc
Property-Level NOI Reconciliation
(Unaudited, Dollars in millions)
Property-Level NOI | ||||||||||||||||
Three Months Ended September 30, 2018 | Nine Months Ended September 30, 2017 | |||||||||||||||
2018 | 2017 | 2018 | 2017 | |||||||||||||
Operating Income | $ | 32.6 | $ | 58.9 | $ | 77.1 | $ | 113.1 | ||||||||
Less: Sale of real estate | (6.5 | ) | (89.8 | ) | (48.7 | ) | (103.4 | ) | ||||||||
Less: Investment management, property services and research fees | (12.4 | ) | (11.4 | ) | (34.8 | ) | (32.7 | ) | ||||||||
Less: Loans and other income | — | (8.5 | ) | (1.1 | ) | (15.0 | ) | |||||||||
Add: Cost of real estate sold | 5.8 | 63.4 | 45.6 | 73.7 | ||||||||||||
Add: Commission and marketing | 1.1 | 2.1 | 4.6 | 5.9 | ||||||||||||
Add: Compensation and related | 38.3 | 35.4 | 122.8 | 113.5 | ||||||||||||
Add: General and administrative | 11.7 | 10.8 | 36.6 | 30.7 | ||||||||||||
Add: Depreciation and amortization | 51.5 | 55.4 | 158.7 | 157.2 | ||||||||||||
Less: Income from unconsolidated investments | (24.0 | ) | (17.6 | ) | (60.9 | ) | (57.4 | ) | ||||||||
Property-Level NOI (Consolidated) | $ | 98.1 | $ | 98.7 | $ | 299.9 | $ | 285.6 | ||||||||
Less: NCI adjustments (1) | (3.6 | ) | (42.1 | ) | (16.0 | ) | (124.4 | ) | ||||||||
Add: Unconsolidated investment adjustments (2) | 15.9 | 12.5 | 42.7 | 36.3 | ||||||||||||
Property-Level NOI (KW Share) | $ | 110.4 | $ | 69.1 | $ | 326.6 | $ | 197.5 | ||||||||
(1) Rental revenues and operating expenses and hotel revenues and operating expenses attributable to non-controlling interests.
(2) The Company’s share of unconsolidated investment net operating income.
47
Kennedy-Wilson Holdings, Inc.
Total Debt Exposure
As of September 30, 2018
(Unaudited)
(Dollars in millions)
Kennedy Wilson has exposure to fixed and floating rate debt through its corporate debt along with debt encumbering its consolidated properties and its joint venture
investments. The table below details Kennedy Wilson's total consolidated and unconsolidated debt by interest rate type.
(Dollars in millions) | Fixed Rate Debt | Floating with Interest Rate Caps | Floating without Interest Rate Caps | Total Debt | |||||||||||
Secured Investment Level Debt(1) | $ | 2,892.3 | $ | 1,420.0 | $ | 1,254.4 | $ | 5,566.7 | |||||||
Kennedy Wilson Europe Unsecured Bonds | 1,290.9 | — | — | 1,290.9 | |||||||||||
KW Unsecured Debt | 1,150.0 | — | 125.0 | 1,275.0 | |||||||||||
Total | $ | 5,333.2 | $ | 1,420.0 | $ | 1,379.4 | $ | 8,132.6 | |||||||
% of Total Debt | 66 | % | 17 | % | 17 | % | 100 | % | |||||||
(1) Represents $2,887.5 million of consolidated investment debt and $2,679.2 million of unconsolidated investment level debt. Approximately 99% of such investment level debt is non-recourse to the Company.
48
Kennedy-Wilson Holdings, Inc.
Reconciliation of Adjusted Fees
(Unaudited)
(Dollars in millions)
Adjusted Fees | ||||||||||||||||
3Q | YTD | |||||||||||||||
2018 | 2017 | 2018 | 2017 | |||||||||||||
Investment management, property services and research fees | $ | 12.4 | $ | 11.4 | $ | 34.8 | $ | 32.7 | ||||||||
Non-GAAP adjustments: | ||||||||||||||||
Add back: | ||||||||||||||||
KW share of fees eliminated in consolidation(1)(2) | 0.1 | 7.9 | 12.7 | 22.5 | ||||||||||||
Performance fees included in unconsolidated investments | 7.5 | 4.7 | 24.7 | 8.6 | ||||||||||||
KW share of fees in unconsolidated service businesses(3) | — | 2.7 | — | 8.5 | ||||||||||||
Adjusted Fees | $ | 20.0 | $ | 26.7 | $ | 72.2 | $ | 72.3 | ||||||||
(1) The three months ended September 30, 2018 and 2017 includes $0.9 million and $5.0 million, respectively, and the nine months ended September 30, 2018 and 2017 includes $13.2 million and $14.2 million , respectively, of fees recognized in net (income) loss attributable to noncontrolling interests relating to portion of fees paid by noncontrolling interest holders in KWE and equity partner investments.
(2) The three months and nine months ended September 30, 2017 include $5.2 million and $14.9 million, respectively, of fees earned from KWE.
(3) Included in income from unconsolidated investments relating to the Company's investment in a servicing platform in Spain. This investment was sold in 4Q-2017.
Investment Management and Real Estate Services | |||||||
Investment Management | Property Services | Research | Total | ||||
YTD 2018 Adjusted Fees(1) | $47.8 million | $12.2 million | $12.2 million | $72.2 million | |||
YTD 2018 Adjusted EBITDA(1)(2) | $33.7 million | $— | $(1.4) million | $32.3 million | |||
Fee-Bearing Capital | $2.0 billion in total fee-bearing capital(3) | ||||||
(1) As defined in "Common Definitions" section of the earnings release.
(2) See reconciliation of Adjusted EBITDA in Adjusted EBTDA by Segment section.
(3) Represents total investment level equity, development costs, and/or equity commitments on which we earn fee income.
49
Kennedy-Wilson Holdings, Inc.
Investment Account - September 30, 2018
(Unaudited)
(Dollars in millions)
The investment account represents the total carrying value of our equity, before depreciation and amortization. Below is a summary of our investment account by product type and geography:
September 30, 2018 | ||||
Real estate and acquired in-place lease values, gross of accumulated depreciation and amortization of $602.5 | $ | 6,422.8 | ||
Loan purchases and originations | 29.4 | |||
Investment debt | (2,872.2 | ) | ||
KWE unsecured debt | (1,282.5 | ) | ||
Cash held by consolidated investments | 290.5 | |||
Unconsolidated investments, gross of accumulated depreciation and amortization of $68.1(1) | 825.4 | |||
Net hedge liability | (56.2 | ) | ||
Other | (12.7 | ) | ||
Consolidated investment account | 3,344.5 | |||
Add back: | ||||
Noncontrolling interests on investments, gross of depreciation and amortization of $31.6 | (220.4 | ) | ||
Investment account | $ | 3,124.1 | ||
(1) Excludes $32.4 million relating to accrued performance fees relating to carried interest in unconsolidated investments.
Investment Account Detail at September 30, 2018 | Multifamily | Commercial | Residential and Other | Hotel | Total | |||||||||||||||
Western U.S. | $ | 770.2 | $ | 409.7 | $ | 227.5 | $ | 92.0 | $ | 1,499.4 | ||||||||||
United Kingdom | 109.9 | 1,144.6 | 4.2 | 91.8 | 1,350.5 | |||||||||||||||
Ireland | 349.1 | 539.8 | 27.3 | 138.7 | 1,054.9 | |||||||||||||||
Italy | — | 165.6 | — | — | 165.6 | |||||||||||||||
Spain | — | 105.9 | — | — | 105.9 | |||||||||||||||
Non-Real Estate Investments | 18.1 | |||||||||||||||||||
Cash and net hedge liability | 211.0 | |||||||||||||||||||
KWE unsecured debt | (1,281.3 | ) | ||||||||||||||||||
Total | $ | 1,229.2 | $ | 2,365.6 | $ | 259.0 | $ | 322.5 | $ | 3,124.1 | ||||||||||
50