Attached files
UNITED STATES
SECURITIES AND EXCHANGE COMMISSION
Washington, D.C. 20549
FORM 10-K
☒ ANNUAL REPORT PURSUANT TO SECTION 13 OR 15(d) OF THE SECURITIES
EXCHANGE ACT OF 1934
For the fiscal year ended July 31, 2018
Commission File Number: 000-53848
RISE GOLD CORP.
(Exact name of registrant as specified in its charter)
| Nevada | 30-0692325 |
| (State or other jurisdiction of incorporation) | (IRS Employer Identification Number) |
650 – 669 Howe Street
Vancouver, British Columbia, Canada V6C 0B4
(Address of principal executive offices)
(604) 260-4577
(Registrant’s telephone number, including area code)
Securities registered pursuant to Section 12(b) of the Act:
None
Securities registered pursuant to Section 12(g) of the Act:
Common Stock, Par Value $0.001 per share
(Title of Class)
Indicate by check mark if the registrant is a well-known seasoned issuer, as defined in Rule 405 of the Securities Act. ☐ Yes ☒ No
Indicate by check mark if the registrant is not required to file reports pursuant to Section 13 or 15(d) of the Securities Exchange Act of 1934: ☐ Yes ☒ No
Indicate by check mark whether the registrant(1) has filed all reports required by Section 13 or 15(d) of the Exchange Act during the preceding 12 months (or for such shorter period that the registrant was required to file such reports), and (2) has been subject to such filing requirements for the past 90 days. ☒ Yes ☐ No
Indicate by check mark whether the registrant has submitted electronically every Interactive Data File required to be submitted pursuant to Rule 405 of Regulation S-T during the preceding 12 months (or for such shorter period that the registrant was required to submit such files). ☒ Yes ☐ No
- 1 -
Indicate by check mark if disclosure of delinquent filers pursuant to Item 405 of Regulations S-K is not contained herein, and will not be contained, to the best of registrant’s knowledge, in definitive proxy or information statements incorporated by reference in Part III of this Form 10-K or any amendment to this Form 10-K. ☐
Indicate by check mark whether the registrant is a large accelerated filer, an accelerated filer, a non-accelerated filer, a smaller reporting company, or an emerging growth company. See the definitions of “large accelerated filer,” “accelerated filer,” “smaller reporting company” and “emerging growth company” in Rule 12b-2 of the Exchange Act.
| Large accelerated filer ☐ | Smaller reporting company ☒ |
| Non-accelerated filer ☐ | Emerging growth company ☒ |
| Accelerated filer ☐ |
If an emerging growth company, indicate by check mark if the registrant has elected not to use the extended transition period for complying with any new or revised financial accounting standards provided pursuant to Section 13(a) of the Exchange Act. ☐
Indicate by check mark whether the registrant is a shell company (as defined in Rule 12b-2 of the Exchange Act).
☐ Yes ☒ No
State the aggregate market value of the voting and non-voting common equity held by non-affiliates computed by reference to the price at which the common equity was sold, or the average bid and asked price of such common equity, as of the last business day of the registrant’s most recently completed second fiscal quarter: US$9,029,303
Indicate the number of shares outstanding of each of the registrant’s classes of common stock, as of the latest practicable date: As of October 25, 2018, the registrant had 138,490,357 shares of common stock issued and outstanding.
- 2 -
| Table of Contents | ||
| Item | Page | |
| PART I | ||
| Item 1. | Business | 4 |
| Item 1A. | Risk Factors | 9 |
| Item 1B. | Unresolved Staff Comments | 9 |
| Item 2. | Properties | 9 |
| Item 3. | Legal Proceedings | 35 |
| Item 4. | Mine Safety Disclosures | 35 |
| PART II | ||
| Item 5. | Market for Registrant’s Common Equity, Related Stockholder Matters and Issuer Purchases of Equity Securities | 35 |
| Item 6. | Selected Financial Data | 37 |
| Item 7. | Management’s Discussion and Analysis of Financial Condition and Results of Operations | 38 |
| Item 7A. | Quantitative and Qualitative Disclosures About Market Risk | 39 |
| Item 8. | Financial Statements and Supplementary Data | 39 |
| Item 9. | Changes in and Disagreements With Accountants on Accounting and Financial Disclosure | 63 |
| Item 9A. | Controls and Procedures | 63 |
| Item 9B. | Other Information | 64 |
| PART III | ||
| Item 10. | Directors, Executive Officers and Corporate Governance | 64 |
| Item 11. | Executive Compensation | 67 |
| Item 12. | Security Ownership of Certain Beneficial Owners and Management and Related Stockholder Matters | 70 |
| Item 13. | Certain Relationships and Related Transactions and Director Independence | 72 |
| Item 14. | Principal Accounting Fees and Services | 73 |
| PART IV | ||
| Item 15. | Exhibits, Financial Statement Schedules | 74 |
| SIGNATURES | 76 | |
- 3 -
FORWARD-LOOKING STATEMENTS
This annual report on Form 10-K (this “Report”) contains “forward-looking statements” relating to Rise Gold Corp. (the “Company”) which represent our current expectations or beliefs, including statements concerning its operations, performance, financial condition and growth. For this purpose, any statements contained in this Report that are not statements of historical fact are forward-looking statements. Without limiting the generality of the foregoing, words such as “may”, “anticipate”, “intend”, “could”, “estimate”, or “continue” or the negative or other comparable terminology are intended to identify forward-looking statements. These statements by their nature involve substantial risks and uncertainties, such as credit losses, dependence on management and key personnel, our ability to continue our growth strategy and competition, certain of which are beyond our control. Should one or more of these risks or uncertainties materialize or should the underlying assumptions prove incorrect, actual outcomes and results could differ materially from those indicated in the forward-looking statements.
CURRENCY
In this Report, unless otherwise indicated, all dollar amounts are expressed in Canadian dollars and references to $ are to Canadian dollars.
PART I
| Item 1. | Business |
DESCRIPTION OF BUSINESS
General Corporate Information
Our company was incorporated on February 9, 2007 as Atlantic Resources Inc. in the state of Nevada pursuant to the Nevada Revised Statutes. On April 11, 2012, we changed our name to Patriot Minefinders Inc. On January 14, 2015, we changed our name to Rise Resources Inc. On March 29, 2017, we changed our name to Rise Gold Corp.
On January 14, 2015, we completed a merger with our wholly owned subsidiary, Rise Resources Inc., and formally assumed the subsidiary’s name by filing Articles of Merger with the Nevada Secretary of State. The subsidiary was incorporated entirely for the purpose of effecting the name change and the merger did not affect our Articles of Incorporation or corporate structure in any other way.
On January 22, 2015, we completed a 1 for 80 reverse split of our common stock and effected a corresponding decrease in our authorized capital by filing a Certificate of Change with the Nevada Secretary of State (the “Reverse Split”). As a result of the Reverse Split, our authorized capital decreased from 1,680,000,000 shares to 21,000,000 and our issued and outstanding common stock decreased from 63,400,000 shares to 792,518, with each fractional share being rounded up to the nearest whole share.
Both the name change and Reverse Split became effective in the market at the open of business on February 9, 2015.
On April 9, 2015, we increased our authorized capital from 21,000,000 to 400,000,000 shares of common stock.
- 4 -
On March 29, 2017, we completed another merger with our wholly owned subsidiary, Rise Gold Corp., and formally assumed the subsidiary’s name by filing Articles of Merger with the Nevada Secretary of State. The subsidiary was incorporated entirely for the purpose of effecting the name change and the merger did not affect our Articles of Incorporation or corporate structure in any other way.
We currently have one wholly owned subsidiary, Rise Grass Valley, Inc., which holds certain of our interests and assets located in the United States, and in particular, our interest in the I-M Mine Property. Rise Grass Valley, Inc. was incorporated in the state of Nevada pursuant to the Nevada Revised Statutes.
Our common stock is currently listed in Canada on the CSE under the symbol “RISE”. We are a reporting issuer in British Columbia, Alberta, and Ontario in Canada. Our common stock is also currently traded in the United States on the OTCQB Market under the symbol “RYES”. We are an SEC reporting company by virtue of our class of common stock being registered under Section 12(g) of the Securities Exchange Act of 1934, as amended (the “Exchange Act”).
Description of Business
We are a mineral exploration company and our primary asset is a major past producing high grade property near Grass Valley, California, United States, which we own outright. In the past, we have held several other potential mineral properties in British Columbia, Canada, which have been written off based on the strength of the I-M Mine Project.
Business Development
Developments in our Company’s business during the July 31, 2018 fiscal year covered by this report include the following:
On August 8, 2017, we entered into a shares for debt settlement transaction with one of our creditors, providing for the settlement of approximately of approximately $95,952 of indebtedness through the issuance of 417,184 units of our securities at a deemed issue price of $0.23 per unit. Each unit was comprised of one share of common stock and one common stock purchase warrant. Each warrant entitles the holder to acquire one additional share of common stock at a price of $0.40 until May 5, 2019.
On September 25, 2017, we completed the first tranche of a non-brokered private placement, issuing an aggregate of 7,077,140 units at a price of $0.15 per unit for gross proceeds of $1,061,571. Each unit consists of one share of common stock and one transferable share purchase warrant exercisable into one share of common stock at a price of $0.25 for a period of two years from the date of issuance. In connection with the private placement, we paid or accrued finder’s fees of $540 and issued a total of 3,600 finder warrants exercisable into one share of common stock at a price of $0.25 for a period of two years from the date of issuance.
On November 28, 2017, our common stock began trading on the OTCQB Market.
On December 11, 2017 the U.S. Securities and Exchange Commission declared effective our registration statement on Form S-1 relating to the resale of up to 52,560,780 shares of our common stock held by certain stockholders named in the registration statement.
On December 27, 2017, we completed the second tranche of a non-brokered private placement, issuing an aggregate of 6,417,000 units at a price of $0.15 per unit for gross proceeds of $962,550. Each unit
- 5 -
consisted of one share of common stock and one non-transferable share purchase warrant exercisable into one share of common stock at a price of $0.25 for a period of two years from the date of issuance. In connection with the private placement, we paid finders fees of $55,779 and issued a total of 371,860 finders’ warrants exercisable into one share of common stock at a price of $0.25 for a period of two years from the date of issuance.
On January 3, 2018, we completed the third and final tranche of a non-brokered private placement, issuing an aggregate of 133,333 units at a price of $0.15 per unit for gross proceeds of $20,000. Each unit consisted of one share of common stock and one non-transferable share purchase warrant exercisable into one share of common stock at a price of $0.25 for a period of two years from the date of issuance.
On April 18, 2018, we completed a non-brokered private placement, issuing an aggregate of 35,161,000 units at a price of $0.10 per unit for gross proceeds of $3,516,100. Each unit consisted of one share of common stock and one non-transferable share purchase warrant exercisable into one share of common stock at a price of $0.15 for a period of three years from the date of issuance. In connection with the private placement, we paid finders fees of $2,100 and issued a total of 21,000 finders’ warrants exercisable into one share of common stock at a price of $0.15 for a period of two years from the date of issuance.
On April 18, 2018, Cale Thomas resigned from our Board of Directors and was replaced by John G. Proust. Our Board of Directors also granted a total of 6,381,000 stock options to certain of our employees, consultants and directors pursuant to the terms of our stock option plan. These options are exercisable at $0.12 per share until April 19, 2023.
On April 18, 2018, we entered into a consulting services agreement (the “JPA Agreement”) with J. Proust & Associates (the “Consultant”) pursuant to which the Consultant agreed to provide business advisory, finance, accounting, corporate administrative services and an office to our company to maintain continuous disclosure obligations and comply with public listing requirements on the Canadian Securities Exchange (the “CSE”) in Canada. Pursuant to the terms of the JPA Agreement, the Consultant provides such business advisory, finance, accounting and corporate administrative services as we may request from time to time. The Consultant has provided us with personnel for the positions of Chief Financial Officer, treasurer, controller and corporate secretary.
On May 1, 2018, Cale Thomas resigned as our Chief Financial Officer, Treasurer and Secretary. He was replaced on the same date by the appointment of Vince Boon as Chief Financial Officer and Eileen Au as Corporate Secretary and Treasurer. On May 16, 2018, Ms. Au resigned as Treasurer and Mr. Boon was appointed Treasurer in her stead. We also engaged certain technical advisers to assist with the advancement of our I-M Mine Project.
Plan of Operations
As at July 31, 2018, we had a cash balance of $69,616, compared to a cash balance of $337,099 as of July 31, 2017.
Our plan of operations for the next 12 months is to continue our current diamond drilling exploration activities at the I-M Mine Property. We plan to continue the recommended work program as outlined in the Report on the I-M Mine Property, which was issued on June 1, 2017.
The I-M Mine Property hosts numerous exploration targets that warrant drilling. While a significant drill program is required to test these targets, our initial plans are to complete the limited exploratory work program described in the Report. Contingent upon available financing, we plan to drill additional targets.
- 6 -
The Report recommended a single 6,000 ft (1,830 m) surface diamond drill hole to provide geological samples from most of the major lithological units on the I-M Mine Property geology. The single hole has been designed to pierce the #1 Vein projection approximately 400 ft (122 m) below the elevation of the I2400 Level and then carry on through the potential western extensions of the Idaho 3 Vein System. The objectives of this drill hole were as follows:
| 1) | Provide a long drill intercept of the Brunswick Block from surface to the Serpentinite contact |
| 2) | Test the up-dip area and below the 52 Vein (60 Winze) mineralized area in the Brunswick Block |
| 3) | Test the #1 Vein below the I2400 Level |
| 4) | Test the serpentinite footwall for potential 3 Vein/Rose Garden analogies |
| 5) | Test and obtain samples of ankerite alteration in the serpentinite unit |
| 6) | Test for the location of the major Idaho faults |
| 7) | Drill through the serpentinite unit to provide further insight on the thickness and geometry of this unit at depth |
| 8) | Determine drill hole deviation, drilling productivity, and drilling costs to allow refinement of the design of a major drill program at the I-M Mine Property |
In addition, Amec Foster Wheeler has recommended that the digital geological model created by the Rise management team be expanded to include model channel samples, the lithological contacts and structures such as the diabase dikes, ankerite alteration envelopes, minor quartz veins, and all faults mapped by the historic mine operators. This work may provide additional insight into the mineralization controls at the I-M Mine Property.
The cost of the work program was estimated in the Report to be approximately $595,000 as shown in the following table:
| Estimated Cost of Recommended Work Program | ||||||
| Hole Length (m) | 1829 | m | ||||
| Duration | 38 | days | ||||
| Drilling Cost | $ | 390,000 | ||||
| Mobilization | $ | 7,000 | ||||
| Standby charges | $ | 40,000 | ||||
| Centrifuge System | $ | 36,000 | ||||
| Living Allowance | $ | 29,000 | ||||
| Geology & Assaying | $ | 38,000 | ||||
| Supplies | $ | 15,000 | ||||
| Total Drilling Cost | $ | 555,000 | =$303/m | |||
| Geological Modelling | $ | 40,000 | ||||
| Total Work Program | $ | 595,000 | ||||
- 7 -
On January 3, 2018, we announced the assay results from drill hole B-17-01, the first drill hole of the exploration drilling program at the I-M Gold Project. Diamond drill hole B-17-01 (the “Drillhole”) was completed in November 2017. The Drillhole had a total length of 1419 m (4654 ft) and reached a depth of ~1157 m (3794 ft) below surface. The starting azimuth of the Drillhole was 310 degrees and the ending azimuth was 278 degrees with an average inclination of ~55 degrees. An intercept of 62.7 gpt gold over 2.7 m was intersected in the center vein of the Brunswick #1 Vein Set, approximately 50 m below the B1600 level at a depth of ~540 m below surface. The true width of the intercept is estimated at 1.4 m. The Drillhole intersected three sub-parallel veins at the Brunswick #1 Vein. The B1 Vein Set, including the Center Vein and two sections of internal waste, averaged 12.2 gpt gold over 14.9 m with an estimated true width of 7.8 m.
The Drillhole azimuth deviated significantly from the planned azimuth and, therefore, did not intersect the Idaho #1 Vein at depth as contemplated in the recommended Work Program. The target described in the Report remains untested and will be tested with future drilling.
On April 25. 2018, we announced the recommencement of exploration core drilling at the I-M Gold Project. We plan to drill additional holes in the B1 Vein to follow-up on Drillhole B-17-01. These holes will target an area between the B1600 level and the B2300 level. Historical records report both levels on the B1 Vein to be mineralized. We will also test several other Brunswick veins which are parallel to the B1 Vein. We expect to be drilling the Brunswick targets until approximately mid-June and then we will move the drill to test the Idaho #1 Vein target as recommended in the Technical Report.
We have implemented a quality control program for our drill program to ensure best practices in the sampling and analysis of the drill core. This includes the insertion of blind blanks, duplicates and certified standards. HQ and NQ sized drill core is saw cut with half of the drill core sampled at intervals based on geological criteria including lithology, visual mineralization, and alteration. The remaining half of the core is stored on-site at our warehouse in Grass Valley, California. Drill core samples are transported in sealed bags to ALS Minerals analytical assay lab in Reno, Nevada.
All gold assays were obtained using a method of screen fire assaying. The Historic I-M Mine Project is known to contain ‘coarse’ gold, for which a screen fire assay is the best way to obtain a definitive result. This procedure involves screening a large pulverized sample of up to 1 kg at 100 microns. The entire oversize (including the disposable screen) is fire assayed as this contains the ‘coarse’ gold and a duplicate determination is made on the ‘minus’ 100 micron fraction. A calculation can then be made to determine the total weight of gold in the sample. Any +100 micron material remaining on the screen is retained and analyzed in its entirety by fire assay with gravimetric finish and reported as the Au (+) fraction result. The –100 micron fraction is homogenized and two sub-samples of 50 grams are analyzed by fire assay with
- 8 -
AAS finish. If the grade of the material exceeds 10 gpt the sample is re-assayed using a gravimetric finish. The average of the two results is taken and reported as the Au (-) fraction result. All three values are used in calculating the combined gold content of the plus and minus fractions.
We have not attained profitable operations and are dependent upon obtaining financing to pursue our proposed exploration activities. For these reasons, our auditors believe that there is substantial doubt that we will be able to continue as a going concern.
Employees
We currently have eight full-time employees, which include our Chief Executive Officer. Our other officers and directors provide services to us on an as-needed basis, and we plan to rely on their efforts, as well as those of a number of independent consultants, to manage our operations for the foreseeable future.
Government Regulations
We plan to engage in mineral exploration and development activities and will accordingly be exposed to environmental risks associated with mineral exploration activity. We are the operator of the I-M Mine Property.
Our exploration and development activities will be subject to extensive federal, state and local laws, regulations and permits governing protection of the environment. Among other things, its operations must comply with the provisions of the Federal Mine Safety and Health Act of 1977 as administered by the United States Department of Labor.
Our plan is to conduct our operations in a way that safeguards public health and the environment. It believes that its operations comply with applicable environmental laws and regulations in all material respects.
The costs associated with implementing and complying with environmental requirements can be substantial and possible future legislation and regulations could cause us to incur additional operating expenses, capital expenditures, restrictions and delays in developing or conducting operations on its properties, including the I-M Mine Property, the extent of which cannot be predicted with any certainty.
To the best of our knowledge, there are no existing environmental liabilities on the I-M Mine Property.
| Item 1A. | Risk Factors |
Not required.
| Item 1B. | Unresolved Staff Comments |
None.
| Item 2. | Properties |
Selective Glossary of Technical Terms
accretion – Process by which material is added to a tectonic plate or landmass. This material may be sediment, volcanic arcs, seamounts or other igneous features.
- 9 -
albite – A kind of plagioclase mineral within the feldspar group with formula NaAlSi3O8. Its colour is white to grey.
amphibolite – A gneiss or schist largely made up of amphibole and plagioclase minerals.
ankerite – A calcium, iron, magnesium, manganese carbonate mineral of the group of rhombohedral carbonates.
arsenic – Chemical element with the symbol As and occurs in many minerals, usually in combination with sulfur and metals, but also as a pure elemental crystal.
carbonate – Class of sedimentary rocks composed primarily of carbonate minerals; the two major types are limestone and dolomite.
chalcopyrite – A sulphide mineral of copper common in the zone of secondary enrichment.
chlorite – Group name for about 10 related minerals and a member of the mica group of minerals. Chlorite is very common, and is often an uninteresting green mineral coating the surface of more important minerals.
en-echelon – Roughly parallel but staggered structures.
epizonal – Depth of formation of an orogenic deposit (<6 km / <3.7 mi).
facies – The characteristics of a rock unit that reflect its environment of deposition and allow it to be distinguished from rock deposited in an adjacent environment.
foliation – Repetitive layering in metamorphic rocks; the thickness of the layers can vary.
footwall – The rock on the underside of a vein or mineralized structure.
free gold – Gold, uncombined with other minerals, found in a pure state.
free milling – Mineralized material of gold from which the precious metals can be recovered by concentrating methods without resorting to pressure leaching or other chemical treatment.
gabbro – A dark, coarse-grained igneous rock.
galena – Lead sulphide, the most common form of lead.
gangue – The worthless minerals in an mineralized deposit.
greenschist – Metamorphic rocks that formed under the lowest temperatures and pressures usually produced by regional metamorphism, typically 300–450 °C (570–840 °F) and 2–10 kilobars (14,500–58,000 psi).
hangingwall – The rock on the upper side of a vein or mineralized deposit.
hydrothermal – Relating to hot fluids circulating in the earth’s crust.
hydrothermal gold deposit – During the reaction between mineral-bearing hydrothermal fluids and wall-rocks, some elements are concentrated in specific locations to form hydrothermal gold deposits. They are usually controlled by faults or shear structures, occurring as veins and stockworks, or by strata.
hypozonal – Depth of Formation of an orogenic deposit (>12 km / >7.5 mi).
intrusive – A body of igneous rock formed by the consolidation of magma intruded into other rocks, in contrast to lavas, which are extruded upon the surface.
- 10 -
jura-triassic arc belt – One of the geologic packages of the Sierra Nevada Foothills belt which consists of a Paleozoic basement of disrupted ophiolite, serpentinite mélange, and ultra-mafic rocks overlain by uppermost Triassic-Early Jurassic arc volcanics and coeval 200 Ma intrusive rocks.
lithology – Description of its physical characteristics of a rock unit at outcrop, in hard or core samples or with microscopy, such as colour, texture, grain size, or composition.
low-sulphide au-quartz vein – Gold-bearing quartz veins and veinlets with minor sulphides crosscutting a wide variety of host rocks and are localized along major regional faults and related splays. The wallrock is typically altered to silica, pyrite and muscovite within a broader carbonate alteration halo.
mafic – Igneous rocks composed mostly of dark, iron- and magnesium-rich minerals.
mariposite – A mineral which is a chromium-rich variety of mica, which imparts an attractive green colour to the generally white dolomitic marble in which it is commonly found.
mélange – A large-scale breccia, a mappable body of rock characterized by a lack of continuous bedding and the inclusion of fragments of rock of all sizes, contained in a fine-grained deformed matrix.
matrix – Finer-grained mass of material wherein larger grains, crystals or clasts are embedded.
meta-volcanic rocks – A type of metamorphic rock that was first produced by a volcano, either as lava or tephra and then buried underneath subsequent rock and subjected to high pressure and temperatures, causing the rock to recrystallize.
mesothermal quartz vein – Also known as and are type-examples of low-sulfide Au-quartz vein deposits.
mesozonal – Depth of formation of an orogenic deposit (6–12 km / 3.7-7.5 mi).
metamorphosed – Rocks which have undergone a change in texture or composition as the result of heat and/or pressure.
mill head grade – The grade of the mineralized material which is fed into the processing plant to be concentrated into gold bullion. The mill head grade includes mining dilution from un-mineralized rock adjacent to the veins. The mill head grade does not account for metallurgical recovery of gold during the processing of the mineralized material.
ophiolitic rock – An assemblage of the Earth’s oceanic crust and the underlying upper mantle that has been uplifted and exposed above sea level and often emplaced onto continental crustal rocks.
orogeny – An episode of intense deformation of the rocks in a region, generally accompanied by metamorphism and plutonic activity.
orogenic gold deposit – Dominantly form in metamorphic rocks in the mid- to shallow crust (5-15 km depth), at or above the brittle-ductile transition, in compressional settings that facilitate transfer of hot gold bearing fluids from deeper levels. The term “orogenic” is used because these deposits likely form in accretionary and collisional orogens.
paleozoic – Geological era that followed the Precambrian and during which began with the appearance of complex life, as indicated by fossils (from 245 to 570 mil. of years ago).
pyrite – A yellow iron sulphide mineral, normally of little value. It is sometimes referred to as “fool’s gold”.
quartz – Common rock-forming mineral consisting of silicon and oxygen.
sedimentary rock – Secondary rocks formed from material derived from other rocks and laid down under water. Examples are limestone, shale, and sandstone.
- 11 -
serpentinite – Type of metamorphic rock composed mostly of mineral serpentine. It is usually dark green to green-black in colour, massive and macroscopically dense.
schistosity – Geological foliation (metamorphic arrangement in layers) with medium to large grained flakes in a preferred sheetlike orientation.
scheelite – A variously colored mineral, CaWO4, found in igneous rocks and a common form of tungsten.
sericite – A fine grained mica and a common alteration mineral of orthoclase or plagioclase feldspars in areas that have been subjected to hydrothermal alteration typically associated with hydrothermal deposits.
splay – A series of branching faults near the termination of a major fault which spread the displacement over a large area.
stope – An excavation in a mine from which mineralized material is, or has been extracted.
tectonism – Geological term used to describe major structural features and the processes that create them, including compressional or tensional movements on a planetary surface that produce faults, mountains, ridges, or scarps.
terrane – A crustal block or fragment that is typically bounded by faults and that has a geologic genesis distinct from those of surrounding areas.
tertiary – Former term for the geologic period from 65 million to 2.6 million years ago, a timespan that occurs between the superseded Secondary period and the Quaternary.
thermal gradient – Rate of increasing temperature with respect to increasing depth in the Earth’s interior.
ultra-mafic – Igneous and meta-igneous rocks with a very low silica content, composed entirely or almost entirely of ferromagnesian minerals, and are composed of usually greater than 90% mafic minerals.
Abbreviations
| Imperial | Metric | ||
| AC | acres | m | meter |
| SF | square foot | km | kilometer |
| lb | pound | ha | hectare |
| oz | ounce | g | grams |
| mi | mile | kg | kilogram |
| ft | foot | gpt | grams per tonne |
Conversions
| Imperial to Metric | Metric to Imperial | |||
| Imperial Measure | Metric Unit | Metric Measure | Imperial Unit | |
| 2.47 acres | 1 hectare | 0.4047 hectare | 1 acre | |
| 3.28 feet | 1 metre | 0.3048 metre | 1 foot | |
| 0.62 mile | 1 kilometre | 1.609 kilometres | 1 mile | |
| 0.03215 troy ounce | 1 gram | 31.1035 grams | 1 troy ounce | |
| 0.02917 troy ounce per ton | 1 gpt | 34.2857 gpt | 1 troy ounce per ton | |
| 1.102 short ton | 1 tonne | 0.907 tonne | 1 short ton | |
| 2.2046 pounds | 1 kilogram | 0.4536 kilogram | 1 pound | |
- 12 -
I-M Mine Property, California
Our principal mineral property is the I-M Mine Property.
I-M Mine Project
The information in this Report with respect to the I-M Mine Property is derived from a technical report prepared in compliance with National Instrument 43-101 (Standards of Disclosure for Mineral Projects) (“NI 43-101”) mandated by Canadian Securities Regulatory authorities. Entitled “Technical Report on the Idaho-Maryland Project, Grass Valley, California, USA” (the “Technical Report”) and dated June 1, 2017, the Technical Report was prepared by Greg Kulla, P.Geo. (the “Author”) of Amec Foster Wheeler Americas Limited. The Author is an independent Qualified Person for purposes of NI 43-101. The full text of the Technical Report is available for review at our corporate offices located at Suite 650 – 669 Howe Street, Vancouver, BC V6C 0B4, and may also be accessed online, under our company’s profile, on the SEDAR website: www.sedar.com. Readers are encouraged to review the Technical Report in its entirety.
Project Location, Description and Access
Property Location
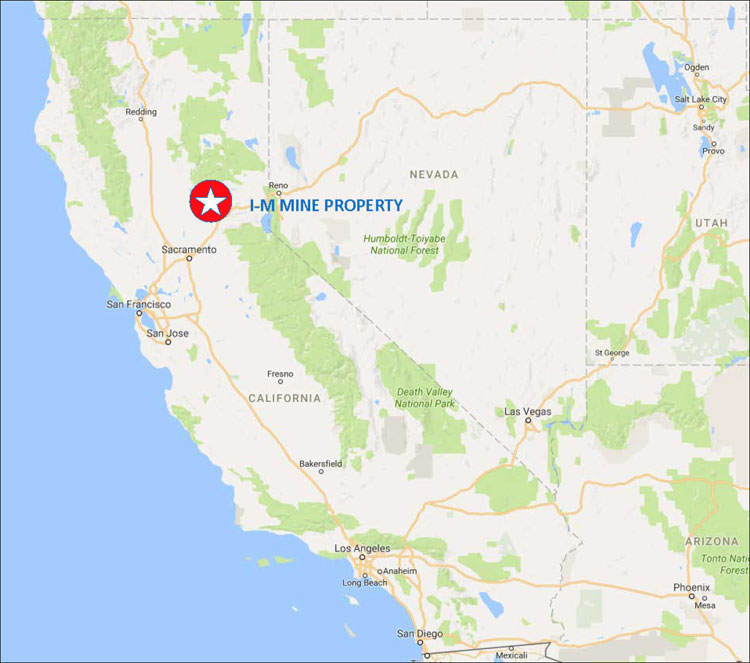
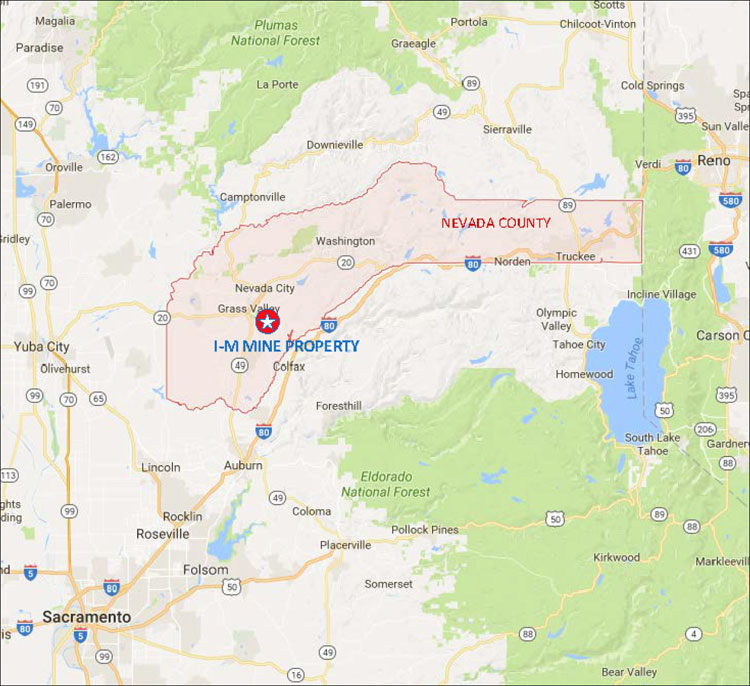
The I-M Mine Property comprises approximately 93 acres (38 hectares) surface land and approximately 2,800 acres (1,133 hectares) of mineral rights located near Grass Valley of Nevada County in northern California, USA. The I-M Mine Property is situated in the Grass Valley-Nevada City District along the western slope of the Sierra Nevada, as shown on the overview map and regional map in Figure 1 and Figure 2, respectively and is located approximately 60 miles northeast of Sacramento, CA and 90 miles west of Reno, NV.
- 13 -
Figure 1: Idaho-Maryland Mine Property Location Overview
- 14 -
Figure 2: Idaho-Maryland Mine Property, Regional Map
- 15 -
Property Description
The recorded owner of the surface land and mineral rights associated with the I-M Mine Property, as documented by a Quitclaim Deed recorded by the Nevada County Recorder on the 26th of January 2017 (Document #: 20170001985), is Rise Grass Valley Inc., a Nevada Corporation and subsidiary of Rise Gold Corp. Rise Grass Valley Inc. purchased the I-M Mine Property, inclusive of its mineral rights from the Grantors of the BET Group Estate, as described in the Quitclaim Deed (Document #: 20170001985), on the 25th of January 2017.
Surface Rights
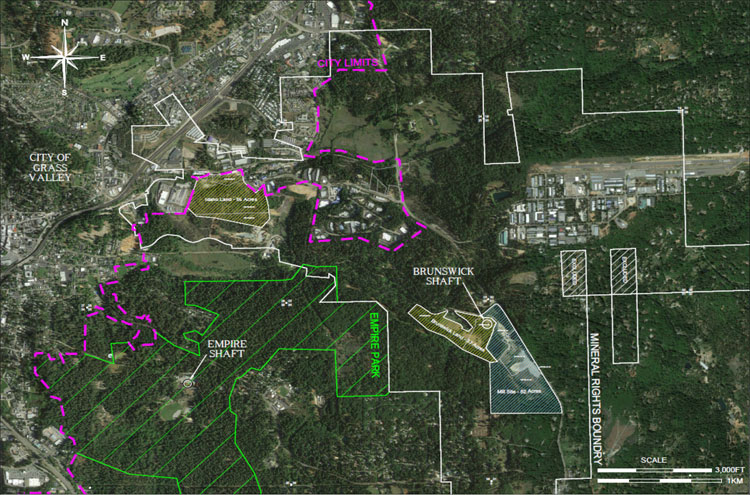
The I–M Mine Property surface rights include two parts of fee simple land, (1) Idaho land representing 56 acres (23 hectares) and (2) Brunswick land representing 37 acres (15 hectares) as displayed in Figure 3.
The I-M Mine Property consists of parcels of surface land located in portions of Section 26 and 36, Township 16 North – Range 8 East Mount Diablo Base and Meridian (MDM) and Section 31, Township 16 North – Range 9 East MDM as detailed in Table 1 and displayed in Figure 3.
| Table 1: | Idaho-Maryland Mine Property – Surface Land Legal Description |
| Parcel Number |
Description | Lot Size |
| 09-550-32 | SEC 26, TWN 16N, RNG 8E, MDM, PTN N 1/2 26-16-8 | 20,908
SF (0.48 AC) |
| 09-550-37 | SEC 26, TWN 16N, RNG 8E, MDM, PTN NE 1/4 26-16-8 | 4.47 AC |
| 09-550-38 | SEC 26, TWN 16N, RNG 8E, MDM, PTN NE 1/4 26-16-8 | 40.1 AC |
| 09-550-39 | SEC 26, TWN 16N, RNG 8E, MDM, PTN NE 1/4 26-16-8 | 42,668 SF |
| 344 CENTENNIAL DRIVE GRASS VALLEY, CA 95945 | (0.98 AC) | |
| 09-550-40 | SEC 26, TWN 16N, RNG 8E, MDM, PTN NE 1/4 26-16-8 | 5,662
SF (0.13 AC) |
| 09-560-36 | SEC 26, TWN 16N, RNG 8E, MDM, PTN N 1/2 SE 1/4 26-16-8 | 10.25 AC |
| 09-630-37 | SEC 36, TWN 16N, RNG 8E, MDM, LOT 6 BET ACRES | 21.8 AC |
| 09-630-39 | SEC
36, TWN 16N, RNG 8E, MDM & SEC 31, TWN 16N, RNG 9E, MDM, LOT 7 BET ACRES |
15.07 AC |
- 16 -
| Figure 3: | Idaho-Maryland Mine Property, Surface and Mineral Land Holdings |
- 17 -
Surface Land Obligations
Fee simple ownership entitles the owner to all rights of a property, which are only restricted by law or private restrictions, such as zone ordinances or covenants. Fee simple owners retain possession of their property permanently, assuming all obligations to the land are met.
The surface land is subject to a tax lien imposed by and payable to Nevada County. The parcels comprising the Idaho land and Brunswick land have a combined annual property tax of $16,126.78 for the fiscal year ending June 30th, 2018. The total amount includes County taxes and Agency taxes. The I-M Mine Property remains in good standing with property taxes paid in full through January 31th, 2019.
The Nevada Irrigation District supplies treated water to the I-M Mine Property. Water to the Brunswick land is delivered from the Loma Rica System, while water to the Idaho land is delivered from the E. George System. A nominal service fee is charged.
There are no further interests registered against the title of the surface rights.
Land Designation
The Brunswick land is located approximately 1 to 2 miles southeast of the city limits of the City of Grass Valley in Nevada County. The Idaho land is located on Idaho-Maryland Rd adjacent to the city limits of the City of Grass Valley in Nevada County. The I-M Mine Property in relation to city limits is shown on Figure 3. Due to its proximity, the I-M Mine Property is located within the City of Grass Valley’s planning area boundary, with Brunswick land located in the “Long-term Annexation” and Idaho land located in the “Near-term Annexation” Sphere of Influence. Based on the City of Grass Valley 2020 General Plan, the planned land use designation for the Brunswick land remains “M-1” Manufacturing/Industrial, while the planned land use designation for the Idaho land is “BP” Business Park (CoGV-CDD, 2009).
Each of the parcels of Brunswick land and Idaho land are positioned within the County’s “M1” Light Industrial Zone. Within the “M1” District, surface access to subsurface mining (e.g., vent and escape shafts) is allowed with a Use Permit (Nevada County Code § L-II 3.21.). Mineral exploration, however, is distinct from the definitions of “subsurface mining” and “surface mining.” Exploration involves the search for economic minerals through the use of geological surveys, geophysical or geochemical prospecting, bore holes and trial pits, and surface or underground headings, drifts, or tunnels (NCC § L-II 3.22(B)(5).). Exploration diamond drilling on M1-Industrial Land is an allowed use and does not require a discretionary permit provided that no water is discharged offsite and disturbance per site is less than 1 acre and 1,000 yd3 material (NCC, 2017).
The Project area is private land and no permits or consultations with the US Bureau of Land Management (BLM) or the US Forest Service (USFS) are required.
Mineral Rights
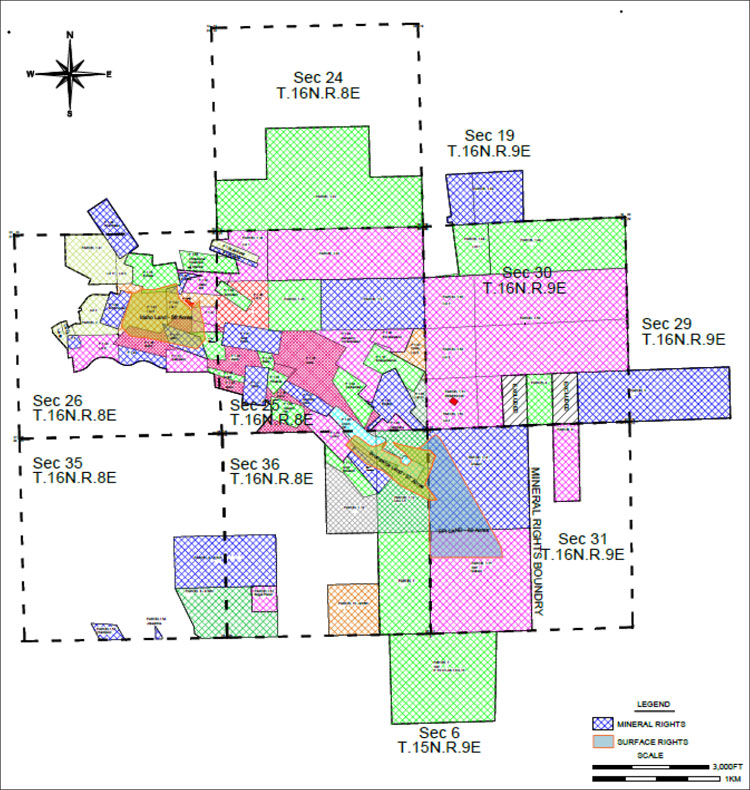
The I-M Mine Property consists of mineral rights on 10 parcels, including 55 subparcels, totaling 2,800 acres (1,133 hectares), of full or partial interest, as detailed in Table 2 and displayed in Figure 4. The mineral rights encompass the past producing I-M Mine Property which includes the Idaho and Brunswick underground gold mines.
- 18 -
The original mineral rights were granted at various times since 1851. Through various patents and agreements since the original grants, there has been a succession of ownership of the mineral rights.
The Quitclaim Deed describes the mineral rights as follows:
The I-M Mine Property consists of all rights to minerals within, on, and under the land shown upon the Subdivision Map of BET ACRES, No. 85-7, filed in the Office of the County Records, Nevada County, California, on February 24, 1987, in Book 7 of Subdivisions, at Page 75 et seq.
The I-M Mine Property consists of all rights to minerals within, on, and under the land located in portions of Sections 23, 24, 25, 26, 35, and 36 in Township 16 North – Range 8 East MDM, Sections 19, 29, 30, and 31 in Township 16 North – Range 9 East MDM, and Section 6 in Township 15 North – Range 9 East MDM and all other mineral rights associated with the Idaho-Maryland Mine.
The mineral rights are defined as parcels and subparcels in a Quitclaim Deed (Document #: 20170001985). All property is described in that Quitclaim Deed by Idaho Maryland Industries Inc. in favor of William Ghidotti and Marian Ghidotti, his wife as tenants in common, dated June 10, 1963. The Quitclaim deed is located at vol. 337, pp. 175-196 in the official records of Nevada County, as recorded on June 12, 1963.
Mineral rights pertain to all minerals, gas, oil and mineral deposits of every kind and nature beneath the surface of all such real property, together with all necessary and convenient rights to explore for, develop, produce, extract and take the same, subject to the express limitation that the fore-going exception and reservation shall not include any right of entry upon the surface of said land without the consent of the owner of such surface of said land, as excepted in the Quitclaim Deed recorded the 26th of January 2017 (Document #: 20170001985). Mineral rights are severed from surface rights at a depth of 200 ft (61 m) below surface, with all mineral rights being contiguous below 200 ft (61 m) of surface.
There are no interests registered against or obligations required of the mineral rights of the I-M Mine Property.
- 19 -
| Figure 4: | Idaho-Maryland Mine Property, Surface and Mineral Rights |
Property Access
The I-M Mine Property is situated east of the City of Grass Valley and south of Nevada City, in western Nevada County. State Route 49, State Route 20, and State Route 174 (state highways) connect the Grass Valley area regionally. The Brunswick land and the adjacent Mill Site are situated on the south western quadrant of the intersection of the East Bennett Road, a two-lane artery, and Brunswick Road, a major two-lane artery connecting Grass Valley with State Highway 174. Access to the Brunswick land is on Millsite Road via the East Bennet Road, approximately 2.8 miles east of Grass Valley Center. The Idaho land is situated along the Idaho Maryland
- 20 -
Road to the south, centered between Railroad Avenue and Brunswick Road. The Idaho land can be accessed by Idaho Maryland Road or Centennial Drive and multiple trails are present across the property.
Agreements
Rise owns a 100% interest in the I-M Mine Property and there are no known royalties on future gold production. There are no other known agreements or encumbrances to which the I-M Mine Property is subject.
Environmental Liabilities
Environmental studies have been completed on all the surface holdings owned by Rise. The environmental studies were completed prior to Rise purchasing the Idaho land and Brunswick land.
Idaho Land
In 2016, a Draft Preliminary Endangerment Report on the Idaho Land was prepared for the City of Grass Valley by Geocon Consultants Inc. This report provided conclusions and recommendations to support redevelopment of this site for commercial and industrial use. Geocon noted the metal of greatest concern with respect to potential health risks for future site occupants is arsenic which is present in mine tailings and waste berms located on the site. Geocon noted that the presence of arsenic in mine waste on the site does not currently appear to pose a significant risk to public health or the environment in its current state and that an expedited response action does not appear warranted at this time (Geocon, 2016).
Brunswick Land
In 2007, a Phase I Environmental Site Assessment for the Round-Hole and New Brunswick Mine Sites was prepared by Engineering/Remediation Resources Group, Inc. (“ERRG”) for Idaho-Maryland Mining Corporation. The report concluded that there were no current recognized environmental conditions on the I-M Mine Property at the time, although there are suspect environmental concerns regarding spills of hydrocarbons from vandalism at the New Brunswick Shaft, roofing asphalt on the property, debris from illegal dumping on the property boundaries, and the potential for naturally occurring asbestos in serpentinite rocks on the property. ERRG did not complete an analysis to determine if contamination from historic mining and mineral processing was present, although ERRG has recommended further sampling and studies to determine this (ERRG, 2007).
Permits
All parcels included in the I-M Mine Property are within the “M1” Light Industrial Zoning District of Nevada County. Mineral exploration is allowed in M1 Districts subject to zoning compliance and building permit issuance, if required. A Use Permit is only required for mineral exploration if one of the following conditions are triggered, as per NCC § L-II 3.22(D)(2):
| (a) | Overburden or mineral deposits in excess of 1,000 cubic yards are disturbed, or |
| (b) | The operation in any one location exceeds one acre in size, or |
| (c) | Dewatering will occur or water will be discharged from the site as a result of the operation. |
Additionally, all exploratory operations shall require a reclamation plan and secure adequate financial assurances to ensure site reclamation unless:
| (a) | Less than 1,000 cubic yards of overburden are disturbed, and |
| (b) | The size of the operation in any one location is one acre or less. |
- 21 -
In those instances where a reclamation plan is not required, an erosion control plan as per NCC § L-V 13.14., approved by the Nevada County Planning Department, and a grading permit shall be required for those operations in which 50 cubic yards or more of overburden are disturbed as per NCC § L-II 3.22(D)(2) (NCC, 2017).
A building permit, issued by the County, may be required for construction or installation of drilling facilities. A building permit is a ministerial approval. Ministerial approval is a non-discretionary approval.
Surface exploration drilling will be subject to Nevada County Noise Regulations. The Noise Element of the Nevada County General Plan (2014) establishes maximum allowable exterior noise levels for various land use categories (NC-BOS, 2014).
Other significant risks
No significant factors or risks are currently known to exist which would affect access, title, or the right or ability to perform exploration work on the I-M Mine Property.
History
The Idaho-Maryland Mine (the “I-M Mine”), located in the Grass Valley mining district of northern California was one of the most productive and best known gold mines in the Unites States, with gold production from the I-M Mine Property dating back to 1863.
The I-M Mine, as it now exists, represents a consolidation of a number of important early day producing mines including Eureka, Idaho, Maryland, Brunswick, and Union Hill Mines. Based on historic production records, the I-M Mine produced a total of 2.4 Moz gold at an average mill head grade of approximately 0.5 oz/ton (17.1 gpt). The I-M Mine was reportedly the second largest gold mine in the United States in 1941 (Clark, 2005), producing up to 129,000 oz gold per year before being forced to shut down by the US government in 1942 (Shore, 1943). Due to lack of development, a decline in gold production was experienced and recovery from war-time shutdown never occurred.
Historic Exploration & Mine Development
The I-M Mine has a rich history of mining work completed between 1863 and 1956 by various operators. Extensive exploration and underground mine development was completed during that time on the I-M Mine Property. The I-M Mine Property and its comprehensive collection of original documents was rediscovered in 1990 by Consolidated Del Norte Ventures Inc., the predecessor company of Emgold Mining Corporation (“Emgold”), and efforts were made to reopen the historic mine.
Exploration & Mine Development 1851-1956
Exploration by historic operators from 1851 through to 1956 was mainly completed by lateral exploration (drift development) and raise or winze development. Levels were driven along the strike of the veins to determine their extent. Raises were developed upwards following the dip of the vein and winzes were sunk down along the dip of the vein. Chip samples were assayed for mineralization of the quartz vein. In 1923, the first prospect drill was purchased. Following that, exploration holes were completed ahead of mine development to confirm vein locations and to locate vein extensions.
The I-M Mine encompasses a system of underground tunnels, many raises, numerous winzes, four inclined shafts, and two vertical shafts. An estimated equivalent of 72.8 miles (117 km) of underground tunnel occur at the I-M Mine, assuming typical drift dimensions of 7.5 ft x 8.5 ft (W x H).
- 22 -
Based on available historic records, 883 exploratory holes totalling approximately 234,100 ft (71,354 m) were diamond drilled at a diameter of 7/8” (EX-size). Historic drill logs were not available for review and no historic drill core was preserved from past mining operations at the I-M Mine.
Exploration & Mine Development 2003-2004
Emgold and its former entities leased the I-M Mine Property from 1990 to 2013. Development work during this period included completion of a preliminary investigation of the mine records, publishing various technical reports on the I-M Mine Property, leasing or purchasing adjacent properties, various permit applications and associated environmental studies, development of a ceramics technology process, and completion of an exploration program. Emgold was unsuccessful in reopening the historic mine due to inability to raise necessary funding in the midst of unfavourable market conditions.
Emgold completed an exploration program on the I-M Mine Property in 2003 and 2004. Gold exploration consisted of 31 diamond drill holes totalling 21,335 ft (6,502 m) and 7 drill holes totalling 3,537 ft (1,078 m) were completed for geotechnical and ceramics feedstock work.
The surface exploration drill program focused on the westernmost portion of what Emgold termed the Idaho Deformation Corridor, along the Idaho Fault Zone. Exploration drilling was mainly conducted from two sites; 1) west of the Eureka shaft and 2) west of the Idaho shaft, both targeting near surface mineralization around historic workings.
The Emgold diamond drill hole database was acquired by Rise in the purchase of the I-M Mine Property. As per the purchase agreement with the BET Group, ownership transfer of the I-M Mine Property included all historical documents to which the BET Group held rights, inclusive of Emgold data.
Production History
Rise has completed a compilation of the mine production data of the I-M Mine during historic operation from 1866 through 1955, the final year of production from the mine. Rise estimates that the I-M Mine produced a total of 2,414,000 oz of gold from 5,298,000 tons of mill feed and that the life of mine average mill head-grade averaged approximately 0.50 oz/ton (17.1 gpt). Total production for the I-M Mine is detailed in Table 3.
| Table 3: | Total Idaho-Maryland Mine Production from 1866-1955* |
| Mined & Milled | Mill Head Grade | Metallurgical Recovery |
Yield | Gold Produced | |||
| tons | tonnes | oz/ton | gpt | % | oz/ton | oz | |
| Idaho Mine | |||||||
| #1 Vein | 978,000 | 887,000 | 1.12 | 38.6 | 85% | 0.96 | 935,000 |
| 3 Vein system | 1,215,000 | 1,102,000 | 0.60 | 20.4 | 95% | 0.56 | 686,000 |
| Total | 2,193,000 | 1,989,000 | 0.83 | 28.4 | 89% | 0.74 | 1,621,000 |
| Brunswick Mine | |||||||
| Old Brunswick | 41,000 | 37,000 | 0.56 | 19.3 | 85% | 0.49 | 20,000 |
| Union Hill | 35,000 | 32,000 | 1.21 | 41.5 | 85% | 1.03 | 36,000 |
| New Brunswick | 3,029,000 | 2,748,000 | 0.26 | 8.8 | 95% | 0.24 | 737,000 |
| Total | 3,105,000 | 2,817,000 | 0.27 | 9.3 | 94% | 0.26 | 793,000 |
| Total I-M Mine | 5,298,000 | 4,806,000 | 0.50 | 17.1 | 91% | 0.46 | 2,414,000 |
| * | Details regarding data verification are presented under the heading “Data Verification” below. |
- 23 -
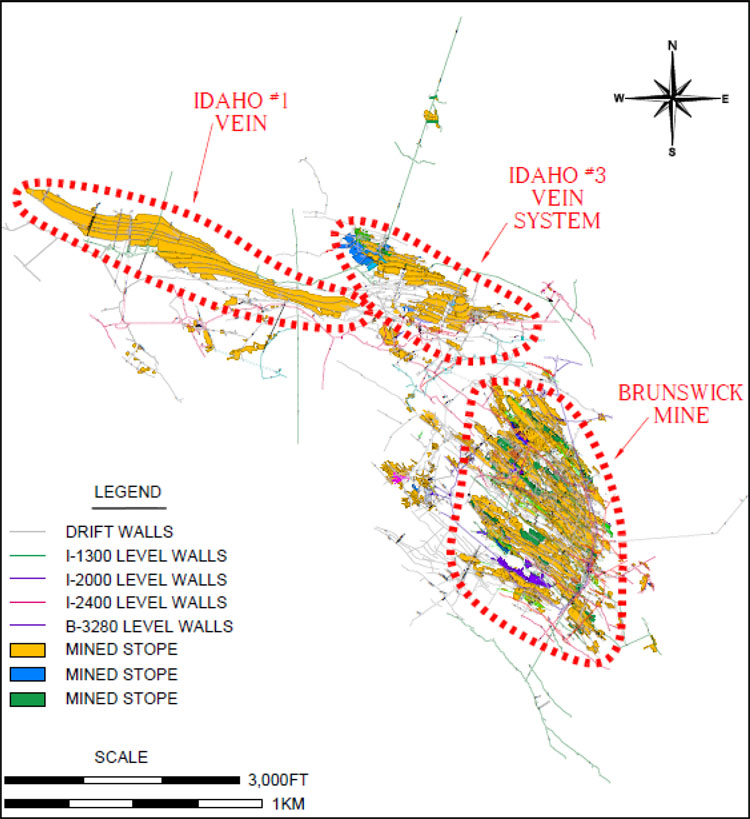
In 1926, Errol MacBoyle took over management of the I-M Mine and, as President and General Manager, led the mine into its most successful period of production. A graph of production from the Idaho and Brunswick Mines from 1926 to 1955 is displayed in Figure 5. The historic mine workings of the I-M Mine are displayed in Figure 6.
| Figure 5: | I-M Mine Gold Production from 1926-1955* |
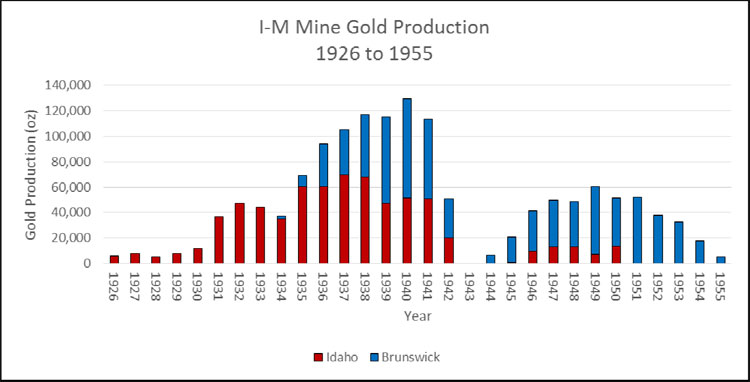
| * | Details regarding data verification are presented on page 31 of the Application. |
- 24 -
| Figure 6: | Idaho-Maryland Mine Workings, Plan View |
- 25 -
Mill Head Grade
The mill head grade is the grade of the mineralized material which is fed into the processing plant to be concentrated into gold bullion. The mill head grade includes mining dilution from un-mineralized rock adjacent to the veins. The mill head grade does not account for metallurgical recovery of gold during the processing of the mineralized material.
Data Verification
Detailed production information from the internal records of the I-M Mine is available for the period from 1926 through 1955. Whenever possible, mill reports were reconciled against financial statements and submissions by Rise to the US Bureau of Mines. Where reconciliation between documents was possible, only minor variations in production reporting were noted. The entire library of documents is no longer fully complete but there is sufficient material to make an accurate estimate of historic production during this period. The following materials were used to prepare an estimate during the period from 1926-1955:
| ● | Idaho Maryland Mines Co. Financial Statements (1926-1932, 1934-1942) |
| ● | Idaho Maryland Mines Co. Mill Reports (1933-1942, 1946-1950) |
| ● | Idaho Maryland Mines Co. Final Distributions Sheets (1944, 1945) |
| ● | Idaho Maryland Mines Co. Breakdown of Income and Expenses (1946-1949) |
| ● | Idaho Maryland Mines Co. Cost Data & Cost Sheets from (1946-1949) |
| ● | Idaho Maryland Mines Corp. Lode Mine Production Report to US Bureau of Mines (1944-1945, 1947-1948, 1950, 1952, 1953, 1955) |
For the period prior to 1926 there are no internal corporate records regarding historic production. The Author believes this information is reliable but the source documents used by the authors of these documents are not available for reconciliation. The following documents were used to prepare an estimate during the period from 1866-1925:
| ● | Lindgren, Waldemar. The Gold Quartz Veins of Nevada City and Grass Valley Districts, California (1896) |
| ● | Hamilton, Fletcher. Mines and Mineral Resources of Nevada County (1918) |
| ● | Clark, Jack. Gold in Quartz: The Legendary Idaho Maryland Mine (2005) |
Detailed records of metallurgical recoveries from the I-M Mine prior to 1924 are also not available. From 1924-1930 gold recoveries ranged from 72% to 89% using a similar process to that used in the years prior to 1924. Lindgren (1896) estimated that gold mills in the Grass Valley mines averaged 75% metallurgical gold recovery but noted that the I-M Mine was unique in that it treated the tailings from its concentrates by secondary processes. Rise has assumed a metallurgical recovery of 85% for the pre-1924 processing at the I-M Mine which it believes is the best estimate possible given the information available.
- 26 -
Geological Setting, Mineralization and Deposit Types
Geology
The I-M Mine Property is located in the Grass Valley area of the Western Sierra Nevada Foothills of Northern California. This belt of rocks consists of late Paleozoic marine sedimentary and ophiolitic rocks, and early and late Mesozoic submarine volcanic-arc and basinal terranes.
The Jura-Triassic arc belt has yielded the majority of gold production in the Western Sierra Nevada Foothills. Gold deposits in Jura-Triassic arc belt are associated with second, third, and fourth–order faults related to the regionally significant Wolf Creek/Bear Mountain and Melones faults.
The Grass Valley area is dominated by blocks of variably metamorphosed volcanic, mafic plutonic, and minor sedimentary rocks hosted in a serpentinite matrix. The whole package of rocks exhibits a region foliation and is interpreted as a serpentinite-matrix tectonic mélange. These rocks were variably metamorphosed from lower greenschist to amphibolite facies during and after accretion to the continental margin. Two distinct gold vein groups exist within the Grass Valley district: steeply dipping E-W-trending veins in the northern and generally N-S trending veins with gentler dips averaging 35° in the southern part of the district. The most important E-W veins are associated with the I-M Mine Property. Both vein sets have extraordinary vertical and lateral persistence; individual veins extend for kilometers.
Mineralization
All of the significant gold production from the I-M Mine was localized within and around the Brunswick Block, which consists of variably metamorphosed volcanic and intrusive, and minor sedimentary rocks. The Brunswick Block is surrounded to the west, north, and east by gabbro and serpentinite rocks. Overlying Tertiary volcanic rocks mask rock units along the southern boundary of the Brunswick Block. The contacts between the Brunswick Block and surrounding gabbro and serpentinite are dominated by the 6-3, the Idaho, and the Morehouse Fault domains. Mineralization is closely associated with these significant second or third order structures close to the contact between the Brunswick block and serpentinite contact. Gold in the quartz veins occurs as native gold, ranging from very fine grains to large nuggets within the quartz. Sulfide minerals, primarily pyrite with lesser galena, chalcopyrite, from 1% to 4% are commonly associated with gold mineralization. Scheelite is common in the Union Hill area near the Brunswick mine. Gangue minerals include quartz, carbonate, sericite, chlorite, mariposite, and albite. Ankerite is a common alteration mineral and may occur in the mafic and ultra-mafic rocks and the meta-volcanic rocks. The mineralized wallrock is strongly carbonate altered.
Gold mineralization on the I-M Mine Property can be divided into three significant vein systems: the Idaho, the Brunswick, and the Morehouse systems.
Idaho System
The #1 Vein, #2 Vein, and 3 Vein System comprise the Idaho Vein System.
The Eureka discovery showing outcropped at the western end of the #1 Vein system but had only minor gold concentration and could not be traced on surface east or west. High grade mineralization plunging to the south east was intersected starting at approximately 100 ft (30 m) below surface at this showing. Follow-up exploration and mining led to the development of the prolific Eureka-Idaho ore shoot which plunges at approximately 30° to the south east and has a pitch length of almost 1 mile (1.6 km) and a breadth of 500 ft to 1,000 ft (152 m to 305 m). The width of the vein within the ore shoot averaged approximately 3 ft (~1 m) and in places ranged up to 8 ft (~2.4 m). The average insitu grade of the #1 Vein would likely have been slightly higher than the estimated mill head grade of 1.12 oz/ton (39 gpt). The trend of the shoot is approximately parallel to an expected trend of the intersection of the Idaho and Morehouse faults suggesting the interaction of
- 27 -
the Idaho and Morehouse faults may have played a role on the formation of the rich mineralization encountered in the Eureka-Idaho stope. Alternatively, the shape of the Brunswick Block may have influenced this trend.
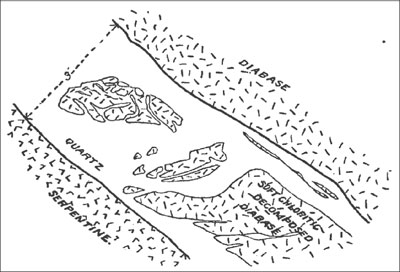
The Idaho #1 Vein occurs coincident with a diabase dike hosted in serpentinite, in close proximity to the serpentinite-Brunswick Block contact. Just west of the Idaho shaft, at the western end of the Idaho #1 Vein, the diabase dike bends in an arc to the south mimicking a fold around the nose of the Brunswick Block. The Eureka-Idaho ore shoot pinches out at the I1500 Level but significant gold grades coincident with a diabase dike hosted in serpentinite in close proximity to the serpentinite-Brunswick contact were exposed in workings on the I2400 Level suggesting the vein may open up again or a second vein is present. To the east, the Eureka-Idaho ore shoot pinches out near the #2 Vein. All rocks are highly altered and contain much ankerite. The cross section in Figure 7 shows the general form and relationship of the #1 Vein with the serpentinite and diabase dike.
| Figure 7: | #1 Vein Cross Section, Section looking East (Lindgren, 1896) |
The #2 Vein is a disrupted zone of quartz veins trending northeast and dipping steeply to the south east. This vein system is hosted in the serpentinite approximately coincident with where the serpentinite-Brunswick Block contact bends abruptly to the north before turning east again. #2 Vein trends northeast into the 3 Vein System.
The 3 Vein System, like the #1 Vein system, hosts a prolific ore shoot. The 3 Vein System comprises an Idaho fault split into four main branches. Connecting diagonal structures between the four fault branches were also mineralized. As with the #1 Vein, gold mineralization is associated with a diabase dike sub parallel to the serpentine-Brunswick Block contact. The main 3 Vein was mined continuously over a vertical distance of approximately 1,500 ft (457 m) and an average horizontal strike length of approximately 700 ft (213 m). There were several important veins which splayed from the main 3 Vein, forming the larger 3 Vein System. The most important of which were named the 5 Vein, 13 Vein, and 22 Vein. Minor splays from the main 3 Vein included 19 Vein, 4 Vein, and 6 Vein. The 3 Vein ranged in dip from 45° to 70°, with an average dip of approximately 55°. An average vein width of approximately 5 ft (1.5 m) was typical but in places reached widths of over 20 ft (6 m).
In the 3 Vein System, the best mineralization was typically found in quartz veins where the Idaho structures intersected areas where diabase dikes or Brunswick Block rocks are in contact with the serpentinite unit. Veins hosted solely in serpentinite were rarely of economic importance due to the yielding nature of the serpentinite which typically does not allow wide or continuous open structures to form from faulting. The 23 Vein is an exception. Also known as the Rose Garden, it was intersected by exploration drifting 2,000 ft (610 m) east of the main 3 Vein System on I2000 Level. The mine operator was following the Idaho #5 Vein towards the 6-3 Fault and located the 23 Vein by diamond drilling. The 23 Vein dips to the northwest as opposed to the
- 28 -
southwest and is hosted entirely in serpentinite. It is quite narrow but was noted to contain abundant visible gold. The 23 Vein was followed along strike to the south east directly to its intersection with the 6-3 Fault.
Brunswick System
The Brunswick vein system constitutes a distinct vein system within meta-volcanic rocks of the Brunswick Block. The veins strike northwesterly and have a southwesterly dip. These parallel, vertically dipping mineralized veins were mined above 1600L along continuous strike lengths ranging from 430 ft (131 m) to 1,000 ft (305 m) with continuous vertical heights reaching up to 1,000 ft (305 m). These veins generally range from several inches up to 8 ft (2.4 m) in width. A few veins with opposite strike and dip occur. The veins are most numerous and have the highest grades near the 6-3 Fault. The veins nearest to the fault turn to the north on the footwall side, suggesting a northward component of movement of the hanging wall. A quartz-carbonate stockwork develops near the fault. The quartz stringers dip from the veins toward the fault and many have connecting diagonals extending from an upper to a lower stringer toward the fault. The Brunswick veins generally pinch out before rarely coming in contact with the fault footwall. No significant mineralization is present in the fault. Only a few unimportant veins are known beyond its hanging wall.
In the area of the Brunswick veins there are layers of meta-sedimentary rocks within the meta-volcanic rocks that exhibit the regional N-W schistosity dipping very steeply to the north. Where the Brunswick veins cross these meta-sedimentary rocks vein splitting and en-echelon crossings occur forming what is known in the historical records as “Zebra Rock.” The “Zebra Rock” produced “fair” to “good” grades of large tonnage and the presence of free gold was reported. A large “Zebra Rock” zone was intersected and mined along the western extents of 16 Vein from levels 1300L to 1000L. Mining in this zone occurred over strike lengths from 360 ft to 525 ft (110 m to 160 m) and reached widths of up to 110 ft (34 m) on 1100 level.
Morehouse System
The Morehouse vein system is not as well understood as the Idaho #1, #2, 3 Vein System, and Brunswick vein systems. It is defined by fault and quartz-vein and quartz stockwork intersections in workings and drill holes in only a few areas such as the Morehouse, 16 Vein, 52 Vein, and 60 Winze. There is little historic production from the Morehouse Vein system.
The Morehouse vein is associated with the serpentinite-hosted diabase dike wrapping around the western end of the Brunswick Block. Underground working show the Morehouse connects directly to the Idaho #1 Vein. The extension of the Idaho shaft in 1923 to I1500 Level intersected the Morehouse splay and the shaft station on I1500 Level is right above the #1 Vein.
The best Morehouse mineralization intersected to date, and the only significant production, occurs within the Brunswick Block at the 52 Vein and 60 Winze areas. There is very little other exploration of this vein in the Brunswick Block.
Mineral Deposit Type
The Author describes the Idaho System deposits on the I-M Mine Property as an orogenic gold deposit. Orogenic gold deposits encompass a broad range of depth of formation and different host lithologies; however, common to orogenic gold deposits is a spatial association with compressional to transpressional deformation processes at convergent plate margins in accretionary and collisional orogens. Most ores are post-orogenic with respect to tectonism of their immediate host rocks but are simultaneously syn-orogenic with respect to ongoing deep-crustal, subduction-related thermal gradient. Depth of formation of orogenic deposits are best subdivided into epizonal (<6 km / <3.7 mi), mesozonal (6–12 km / 3.7-7.5 mi), and hypozonal (>12 km / >7.5 mi).
The gold deposits on the I-M Mine Property have been classified as Mesothermal Quartz Veins (Lindgren, 1894), are also known as and are type-examples of low-sulfide Au-quartz vein deposits (Berger, 1986), and gold quartz vein deposits (Ash, 2001). These classifications are sub-groups of orogenic gold deposit type.
- 29 -
Exploration
Rise has initiated but not yet completed the recommended exploration work program on the I-M Mine Property. Prior to initiating this work, it had completed a comprehensive exploration desktop study which involved the compilation of the extensive historical dataset into digital format and used this data to identify several promising exploration targets. Data compilation and processing completed by Rise is summarized as follows:
| ● | Scanned historical documents into a digital library |
| ● | Reviewed available historical exploration and development data of the I-M Mine |
| ● | Reviewed reports on the I-M Property and local geology, written by geologists and engineers employed at the Mine, hired as Consultants, or external professionals |
| ● | Prepared a detailed 3D mine model of the mine workings (drifts, raises, and winzes) and stopes |
| ● | Prepared a 3D geological model of vein locations, faults, rock types, and contact locations |
| ● | Developed a historical diamond drill hole database |
| ● | Tabulated historical production at the I-M Mine |
Compilation of the historic data led to the identification of several significant unexplored exploration targets below the current workings within the I-M Mine Property which include:
#1 Vein Target
| ● | This is a possible down-plunge extension of the prolific Eureka-Idaho stope. The #1 Vein target covers an area 2,150 ft (655 m) between the I2400 Level west and east drifts and 500 ft to 1,000 ft (152 m to 305 m) down-dip from the I2400 level. Within this area gold mineralization may occur within a quartz vein adjacent to the diabase dike similar to that encountered in the prolific Eureka-Idaho stope above or may be hosted within the adjacent diabase dike. The projected down-dip extension of the #1 Vein target is defined in relation to the deepest mineralization encountered at the nearby Empire Mine. This does not preclude deeper mineralization. |
Crackle Zone Target
| ● | This is a wedge-shaped area 2,000 ft (610 m) wide and 500 ft to 1,000 ft (152 m to 305 m) thick at the I2700 Level, plunging as much as 5,000 ft (1,524 m) to the south east where it pinches out against the intersection of the Idaho, Morehouse, and 6-3 Faults. Within this zone, gold mineralization may occur in shallow dipping quartz veins and irregular quartz stockworks in metavolcanic rocks that may be highly fractured due to the interaction of the Idaho, Morehouse, and 6-3 Faults. |
Brunswick Target
| ● | The Brunswick area offers many areas with potential for discovery of mineralization, particularly the area below the existing stoping and in the untested area in the immediate footwall of the 6-3 Fault south east of the Brunswick shaft. In Brunswick Mine, the richest mineralization was typically found near the 6-3 Fault. Below 1600 Level, development in the southern region of the Brunswick Mine deviated to the west, away from the 6-3 Fault leaving a region of unexplored ground in the footwall adjacent to the fault approximately 500 ft to 1,000 ft (152 m to 305 m) thick, 1,000 ft to 2,000 ft (305 m to 610 m) wide, and 1,000 ft to 3,000 ft (305 m to 914 m) deep. |
- 30 -
3 Vein – Rose Garden Target
| ● | Rose Garden-style mineralization is hosted solely in serpentinite with no apparent association with the brittle rocks common in all other mine and target areas of the Idaho-Maryland Project. Serpentinite within the Idaho fault zone, east towards the 6-3 Fault and west of the 3 Vein area may host mineralization similar to the Rose Garden. |
All exploration targets are below current extents of drilling and development and warrant exploration through drilling. Through its life, the I-M Mine faced several shut downs related to fires and war measures that resulted in loss of access to some promising areas due to collapsed workings or early termination of planned developments. Exploration potential may remain in some of these areas.
Drilling
Rise has initiated but not yet completed an exploration drilling program on the I-M Mine Property to date.
Up to July 31th 2018, Rise has completed five drillholes, B-17-01, B-18-02 - B18-05, for total drilling of ~5,760 meters.
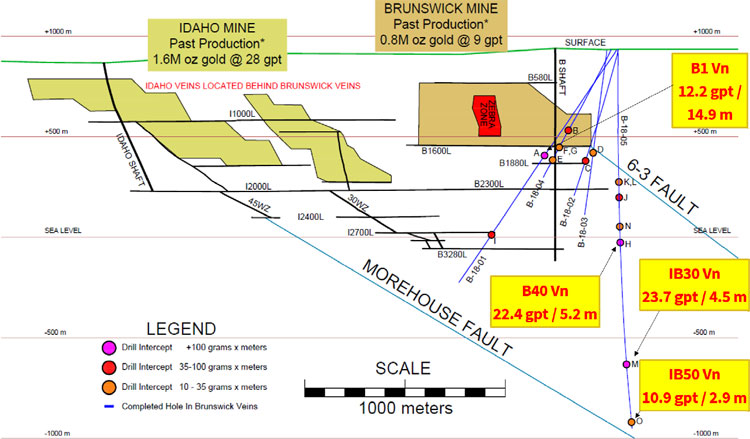
Exploration drilling at the Brunswick portion of the Idaho-Maryland Gold project has been successful with numerous gold bearing veins intersected and previously released in 2018 on January 3rd, June 28th, July 23rd, and August 7th. A summary of drill highlights for the program released to date is displayed in Table 1 and Figure 1 below.
TABLE 1 – Previously Released Drill Intercept Highlights from B-17-02 to B-18-05*
| BRUNSWICK CONFIRMATION HOLES (B1600L-B2300L) | ||||||||||||||
| Hole | From (m) | To (m) | Gold (gpt) | Intercept Length (m) | Estimated True Width (m) | Vein | Map Ref | |||||||
| B-18-01 | 638.9 | 653.8 | 12.2 | 14.9 | 7.8 | B1 | A | |||||||
| Including | 643.7 | 646.5 | 62.7 | 2.7 | B1 Center | |||||||||
| Including | 645.0 | 645.6 | 266.0 | 1.6 | ||||||||||
| B-18-04 | 516.9 | 521.0 | 8.0 | 4.1 | 3.0 | B32 | C | |||||||
| Including | 516.9 | 518.0 | 23.0 | 1.1 | ||||||||||
| B-18-02 | 578.4 | 582.8 | 7.9 | 4.4 | 1.0 - 3.4 | B116 or B1 | C | |||||||
| B-18-03 | 516.6 | 518.6 | 6.0 | 2 | 1.7 | B1 East | D | |||||||
| B-18-04 | 711.9 | 715.2 | 5.1 | 2.3 | 1.8 | B18 | E | |||||||
| B-18-04 | 625.2 | 628.0 | 4.0 | 2.8 | 2.1 | B10 | F | |||||||
| B-18-04 | 637.0 | 640.0 | 4.4 | 3 | 2.3 | B10 | G | |||||||
| BRUNSWICK EXTENSION HOLES (B2300L-B3280L) | ||||||||||||||
| Hole | From (m) | To (m) | Gold (gpt) | Intercept Length (m) | Estimated True Width (m) | Vein | Map Ref | |||||||
| B-18-05 | 978.1 | 983.3 | 22.4 | 5.2 | 2.6 | B40 | H | |||||||
| Including | 978.1 | 979.3 | 93.2 | 1.2 | ||||||||||
| B-18-01 | 1111.6 | 1126.8 | 4.5 | 15.2 | ? | ? | I | |||||||
| Including | 1112.1 | 1113.6 | 40.6 | 1.5 | ||||||||||
| B-18-05 | 748.3 | 763.6 | 2.6 | 15.3 | 11.0 | B41 | J | |||||||
| B-18-05 | 667.9 | 671.4 | 5.9 | 3.5 | 2.0 | B6 | K | |||||||
| Including | 670.3 | 671.4 | 13.0 | 1.1 | ||||||||||
| B-18-05 | 682.9 | 690.4 | 2.4 | 7.5 | 4.1 | B6 | L | |||||||
| B-18-05 | 899.6 | 905.5 | 2.5 | 5.9 | 3.4 | B39 | N | |||||||
| IDAHO DEEP DRILLING (~1km BELOW MINE) | ||||||||||||||
| Hole | From (m) | To (m) | Gold (gpt) | Intercept Length (m) | Estimated True Width (m) | Vein | Map Ref | |||||||
| B-18-05 | 1590.1 | 1594.6 | 23.7 | 4.5 | 3.2 | IB30 | M | |||||||
| Including | 1593.6 | 1594.0 | 230.0 | 0.4 | ||||||||||
| B-18-05 | 1887.5 | 1890.4 | 10.9 | 2.9 | 2.0 | IB50 | O | |||||||
| Including | 1889.4 | 1889.9 | 61.0 | 0.5 | ||||||||||
| * | Details of drill intercepts in previous Rise Gold news releases previously released in 2018 on January 3rd, June 28th, July 23rd, and August 7th. |
- 31 -
FIGURE 1 – Longsection Showing Drill Results Previously Released
Rise has prepared a drill hole database derived from information contained in the collection of historic documents and records acquired through the purchase of the I-M Mine Property. The drill hole database is
- 32 -
divided into I-M Mine drilling completed before the mine shut down in 1956 and Emgold drilling completed in 2004.
Sampling, Analysis and Data Verification
Sample Preparation and Analysis
Rise has implemented a quality control program for its drill program to ensure best practice in the sampling and analysis of the drill core. This includes the insertion of blind blanks, duplicates and certified standards. HQ- and NQ-sized drill core is saw cut with half of the drill core sampled at intervals based on geological criteria including lithology, visual mineralization, and alteration. The remaining half of the core is stored on-site at our warehouse in Grass Valley, California. Drill core samples are transported in sealed bags to ALS Minerals analytical assay lab in Reno, Nevada.
All gold assays were obtained using a method of screen fire assaying. This procedure involves screening a large pulverized sample of up to 1 kg at 100 microns. Any +100 micron material remaining on the screen is retained and analyzed in its entirety by fire assay with gravimetric finish and reported as the Au (+) fraction result. The –100 micron fraction is homogenized and two sub-samples of 30-50 grams are analyzed by fire assay with AAS finish. If the grade of the material exceeds 10 gpt the sample is re-assayed using a gravimetric finish. The average of the two results is taken and reported as the Au (-) fraction result. All three values are used in calculating the combined gold content of the plus and minus fractions.
There is no detailed information describing sample preparation, analysis and security procedures applied by mine operators prior to 2002. The historical samples are reportedly fire-assayed at former mine site laboratories. No records exist of any QA/QC program.
Emgold sample preparation, analysis and security procedures for core collected by Emgold are described in a 2009 Technical Report prepared by Robert Pease, P.G., for Emgold titled “Idaho-Maryland Mine Project, Grass Valley CA”. Three-foot core samples were cut in half by a wet saw. The half core samples were put in a sample bag, tagged, and shipped to a laboratory. All samples were crushed to 80% passing -10 mesh, rotary split to a 500 g subsample which was pulverized to 95% passing -150 mesh. All samples were analyzed using screened metallics fire assay methods. The QAQC program used Standard Reference Materials, blank samples, coarse reject and pulp duplicate samples, and third party laboratory check assays. Insertion rate of SRMs and duplicates was approximately 1 in 20 samples. Blanks were only inserted immediately following mineralized intervals. The control samples were reportedly used to successfully control the assay quality process.
Historical Data Verification
The Author inspected Rise’s 3D model on screen, reviewed several historical reports, and reviewed many historical documents including cross sections and level plans used to prepare the model. The drill hole database developed by Rise was not verified; however, drilling is not used extensively to support the reported exploration targets.
The Author did not assess previous I-M Mine operators or Emgold drilling sampling and assay quality. The Emgold drilling focused on shallow mineralization not considered part of the exploration targets described in the Report.
Although Rise has carefully digitized and checked the locations and values of drill hole results from level plans and other documents, the absence of drill hole related documentation, such as drill logs, drill hole deviation, core recovery and density measurements, assay certificates, and possible channel sample grade biases, could materially impact the accuracy and reliability of the reported results. The database that has been created, however, is suitable for exploration targeting.
- 33 -
Mineral Processing and Metallurgical Testing
Rise has conducted no mineral processing or metallurgical testing analyses on the I-M Mine Property.
A significant amount of production has occurred on the I-M Mine Property which confirms that gold can be recovered, mainly by gravity and flotation methods. Nearly all gold at the I-M Mine is free milling, as demonstrated by cyanide leaching of concentrates and tailings by the I-M Mine during past production.
Mineral Resource and Mineral Reserve Estimates
We have not obtained a technical s report that includes an estimate of mineral resources for the I-M Mine Property. We are not treating the historical mineral resource estimate as a current mineral resource estimate. In addition, there are no mineral reserves estimates for the I-M Mine Project.
References
American Society for Testing Materials (ASTM). (2013). ASTM E1527-13, Standard Practice for Environmental Site Assessments: Phase 1 Environmental Site Assessment Process. ASTM International, West Conshohocken, PA. Retrieved at http://www.astm.org/cgi-bin/resolver.cgi?E1527-13
Ash, Chris. (June 2001). Bulletin 108: Relationship Between Ophiolites and Gold-Quartz Veins in the North American Cordillera. Chapter 8. Geological Survey Branch. Victoria, BC. Retrieved at http://www.empr.gov.bc.ca/Mining/Geoscience/PublicationsCatalogue/BulletinInformation/BulletinsAfter1940/Pages/Bulletin108.aspx
California Department of Conservation (CDC). (April 2017). SMARA Mines – AB 3098 List, Listing as of April 7, 2017). Retrieved at http://www.conservation.ca.gov/dmr/SMARA%20Mines/ab_3098_list/Pages/Index.aspx
Cal. Pub. Res. Code (CPRC). California Public Resources Code. Chapter 9 – Surface Mining and Reclamation Act of 1975. 1975.
Cal. Pub. Res. Code (CPRC). California Public Resources Code. Division 13 – Environmental Quality. 1979.
California Environmental Quality Act (CEQA). (February 1992). City of Sacramento v. State Water Resources Control Board. Retrieved at http://resources.ca.gov/ceqa/cases/1992/sac_swrcb.html
City of Grass Valley Community Development Dept. (CoGV-CDD). City of Grass Valley 2020 General Plan Map. Grass Valley, CA. November 2009.
Clark, Jack. Gold In Quartz – The Legendary Idaho Maryland Mine. Grass Valley, CA. 2005.
Engineering/Remediation Resources Group, Inc. (ERRG). Phase 1 Environmental Site Assessment Round-Hole and New Brunswick Mine Sites. Concord, CA. March 2007.
Geocon Consultants, Inc. (Geocon). Draft Preliminary Endangerment Assessment Report. Rancho Cordova, CA. August 2016.
Geomatrix Consultants Inc. (Geomatrix). Summary – Phase II Investigation: Data Collection and Analysis, Brunswick Lumber Mill Site Nevada County, CA. September 2006.
Groves, D.I., Goldfarb, R.J., Gebre-Mariam, M., Hagemann, S.G., Robert, F. Orogenic gold deposits: A proposed classification in the context of their crustal distribution and relationship to other gold deposit types. Ore Geol. Rev. Special Issue, 13, 7-27. 1998.
- 34 -
Kleinschmidt. City of Grass Valley Sphere of Influence Plan. Prepared for Nevada Local Agency Formation Commission (LAFCo). April 2011.
Lindgren, W. US Geological Survey Grass Valley Special Map. 1894.
Lindgren, Waldemar. The Gold Quartz Veins of Nevada City and Grass Valley Districts, California (1896).
Nevada County Code (NCC). (March 2017). Article 3 Specific Land Uses. Retrieved from http://qcode.us/codes/nevadacounty/?view=desktop&topic=3-ii-2-l__2
Pease, Robert C. Idaho-Maryland Mine Project, Grass Valley CA Technical Report. December 2009.
Shore, F.M for United States Bureau of Mines. Mineral Yearbook 1941. Pg. 252. Washington, D.C. 1943. Retrieved at http://digital.library.wisc.edu/1711.dl/EcoNatRes.MinYB1941
| Item 3. | Legal Proceedings |
On September 17, 2014, we learned that our company, along with a number of additional defendants, was the subject of a notice of civil claim (the “Claim”) filed in the Supreme Court of British Columbia by Wundr Software Inc. (“Wundr”), an eBook software developer. Wundr and our company were formerly parties to a binding letter of intent that was announced on November 12, 2013 (the “Wundr LOI”), pursuant to which we proposed to acquire 100% of the outstanding shares of Wundr. On January 10, 2014, we reported that the Wundr LOI had expired.
Among other things, the Claim alleges that we committed the tort of intentional interference with economic or contractual relations by virtue of our role in an alleged scheme to establish a competing business to Wundr, and that we, through our agents, breached the terms of the Wundr LOI by appropriating certain confidential information and intellectual property of Wundr for the purpose of establishing a competing business. The Claim also alleges that we are vicariously liable for the actions of our agents.
Wundr is seeking general damages from our company as well as damages for conspiracy to cause economic harm. None of the allegations contained in the Claim have been proven in court, which we believe are without merit, and we therefore intend to vigorously defend our position against Wundr.
Other than as described above, we are not aware of any material pending legal proceedings to which it is a party or of which the Property is the subject. We also know of no proceedings to which any of our directors, officers or affiliates, or any registered or beneficial holders of more than 5% of any class of our securities, or any associate of any such director, officer, affiliate or security holder are an adverse party or have a material interest adverse to our company.
| Item 4. | Mine Safety Disclosures |
None.
PART II
| Item 5. | Market for Registrant’s Common Equity, Related Stockholder Matters and Issuer Purchases of Equity Securities |
Market Information
- 35 -
During our last two fiscal years, our common stock was quoted under the symbol “RYES” on the OTC Pink Market until November 27, 2017. Effective November 28, 2017 we commenced trading on the OTCQB Market under the symbol “RYES”. The following table sets forth the high and low sales prices of our common stock as reported by OTC Markets Group for trading on the OTC Pink Market or OTCQB Market for the periods indicated.
| OTCQB Market / OTC Pink Market | ||
| Quarter Ended | High (US$) | Low (US$) |
| July 31, 2018 | 0.105 | 0.06 |
| April 30, 2018 | 0.1218 | 0.0699 |
| January 31, 2018 | 0.165 | 0.0915 |
| October 31, 2017 | 0.16 | 0.1051 |
| July 31, 2017 | 0.25 | 0.1001 |
| April 30, 2017 | 0.29 | 0.145 |
| January 31, 2017 | 0.34 | 0.1087 |
| October 31, 2016 | 0.40 | 0.12 |
Our common stock is listed on the CSE under the symbol “RISE”, and the following table reflects the high and low sales price information for our common stock on that exchange for the periods indicated.
| CSE | ||
| Quarter Ended | High ($) | Low ($) |
| July 31, 2018 | 0.15 | 0.07 |
| April 30, 2018 | 0.15 | 0.085 |
| January 31, 2018 | 0.21 | 0.115 |
| October 31, 2017 | 0.195 | 0.09 |
| July 31, 2017 | 0.315 | 0.135 |
| April 30, 2017 | 0.36 | 0.20 |
| January 31, 2017 | 0.40 | 0.17 |
| October 31, 2016 | 0.29 | 0.15 |
Holders
As of the date of this Report, there are approximately 129 registered holders of our common stock.
- 36 -
Dividends
We have not paid dividends since our inception. While there are no restrictions in our Articles of Incorporation or Bylaws or pursuant to any agreement or understanding which could prevent us from paying dividends or distributions, we have limited cash flow and anticipate using all available cash resources to fund working capital and explore the I-M Mine Property. As such, there are no plans to pay dividends for the foreseeable future. Any decisions to pay dividends in cash or otherwise in the future will be made by the Board of Directors on the basis of our earnings, financial requirements and other conditions existing at the time a determination is made.
Recent Sales of Unregistered Securities
Other than as disclosed in previous quarterly reports on Form 10-Q or current reports on Form 8-K, we have not offered and sold any equity securities that were not registered under the Securities Act during the fiscal year ended July 31, 2018, except as follows:
On January 3, 2018, we completed the sale of an aggregate of 133,333 units at a price of $0.15 per unit for gross proceeds of $20,000 comprising the third and final tranche of an offering of up to 24,000,000 units. Each unit consisted of one share of our common stock and one non-transferable share purchase warrant exercisable into one additional share of common stock at a price of $0.25 until January 3, 2020. We issued the shares and warrants underlying the units sold in reliance on the exclusion from registration provided by Rule 903 of Regulation S. Our reliance on Rule 903 was based on the fact that the securities were sold in offshore transactions. We did not engage in any directed selling efforts in the United States in connection with the sale of the securities, and none of the purchasers of those securities was a U.S. person or acquired the securities for the account or benefit of any U.S. person.
Description of Registrant’s Securities to be Registered
Our authorized capital consists of 400,000,000 shares of common stock, US$0.001 par value.
Common Stock
As of October 25, 2018, we have 138,490,357 shares of common stock issued and outstanding.
Holders of the our common stock have no preemptive rights to purchase additional shares of common stock or other subscription rights. The common stock carries no conversion rights and is not subject to redemption or to any sinking fund provisions. All shares of our common stock are entitled to share equally in dividends from sources legally available, when, as and if declared by its Board of Directors, and upon our liquidation or dissolution, whether voluntary or involuntary, to share equally in its assets available for distribution to security holders.
The Board of Directors is authorized to issue additional shares of common stock not to exceed the amount authorized by our Articles of Incorporation, on such terms and conditions and for such consideration as the Board may deem appropriate without further security holder action.
Voting Rights
Each holder of our common stock is entitled to one vote per share on all matters on which such stockholders are entitled to vote. Since the shares of common stock do not have cumulative voting rights, the holders of more than 50% of the shares voting for the election of directors can elect all the directors if they choose to do so and, in such event, the holders of the remaining shares will not be able to elect any person to the Board of Directors.
| Item 6. | Selected Financial Data. |
Not required.
- 37 -
| Item 7. | Management’s Discussion and Analysis of Financial Condition and Results of Operations. |
The following discussion provides information regarding the results of operations for the years ended July 31, 2018 and 2017 and our financial condition, liquidity and capital resources as of July 31, 2018 and July 31, 2017.
The following discussion and analysis should be read in conjunction with the information set forth in our audited financial statements and the notes thereto as of and for the years ended July 31, 2018 and July 31, 2017.
Results of Operations
For the Years Ended July 31, 2018 and 2017
Our operating results for the years ended July 31, 2018 and 2017 are summarized as follows:
| For the year ended July 31, 2018 | For the year ended July 31, 2017 | |||||||
| Bad debt expenses | $ | - | $ | - | ||||
| Consulting | 78,500 | 505,842 | ||||||
| Depreciation | 2,306 | - | ||||||
| Directors fees | 99,571 | 17,288 | ||||||
| Filing and regulatory | 87,395 | 53,661 | ||||||
| Foreign exchange | (14,749 | ) | 6,931 | |||||
| Gain on settlement of payables | (37,068 | ) | (12,355 | ) | ||||
| General and administrative | 287,052 | 152,920 | ||||||
| Mineral exploration | 2,057,877 | 375,980 | ||||||
| Interest expense | 2,602 | - | ||||||
| Professional fees | 562,694 | 273,738 | ||||||
| Promotion and shareholder communication | 443,696 | 983,851 | ||||||
| Property investigation costs | - | 55,253 | ||||||
| Salaries | 350,627 | 104,751 | ||||||
| Share-based payments | 673,360 | 1,010,064 | ||||||
| Settlement payment | - | 100,000 | ||||||
| Write-off of mineral properties | - | 563,031 | ||||||
| Net loss | 4,593,863 | 4,190,955 | ||||||
Our operating expenses increased during the year ended July 31, 2018 compared to the prior year primarily as a result of increased costs for as a result of increased activities by our company. These include salaries, filing and regulatory, general and administrative, professional fees, driven by the need for expenses related to planning and researching our mineral properties, and activity involved in raising funds in the recent private placements.
As a result of the increased activity, significant expenses during the year ended July 31, 2018 include:
| ● | Increase in mineral exploration costs to $2,057,877 (2017 - $375,980) related to exploration work on the I-M Mine Property during the year; |
| ● | Decrease in share-based payments to $673,360 (2017 - $1,010,064) for the grant of options pursuant to our stock option plan to incentivize management and certain consultants; |
| ● | Increase in professional fees to $562,694 (2017 - $273,738) related to various legal and regulatory items pertaining to operating in Canada and the United States; and |
| ● | Decrease in promotion and shareholder communication to $443,696 (2017 - $983,851) as there were fewer activities compared to the previous year. |
| ● | No write-off on mineral properties for the year ended 2018 (2017 - $563,031). |
- 38 -
Liquidity and Capital Resources
As of July 31, 2018, we had $69,616 in cash, $619,064 in current assets, $6,778,104 in total assets, $521,056 in current liabilities and $1,120,721 in total liabilities, working capital deficiency of $98,008 and an accumulated deficit of $10,572,635.
During the year ended July 31, 2018, we used $3,892,922 in net cash on operating activities, whereas it used $2,704,241 in net cash on operating activities during the prior year. The difference in net cash used in operating activities during the year was largely due to the increase in our net loss for the most recent year, as we incurred expenses relating to mineral exploration within the I-M Mine Project.
During the year ended July 31, 2018, we used net cash of $1,747,033 (2017 - $3,605,854) in investing activities for the acquisition of the I-M Mine Property, related transaction costs, and the recent option agreement to increase the holdings of the I-M Mine Property.
We received net cash of $5,372,472 (2017 - $6,508,173) from financing activities during the year ended July 31, 2018. There were warrants exercised during the year for the total proceeds of $19,267. In the current year, we received gross proceeds of $5,560,220 (2017 - $6,662,907) from private placements. In the prior year, we received $27,208 from the exercise of warrants, and $60,000 from the exercise of options, offset by $241,942 in share issuance costs.
We expect to operate at a loss for at least the next 12 months. We have received additional financing since the end of the July 31, 2018 fiscal year through private placements for a total of $2,140,750 in gross proceeds, but we cannot provide any assurance that additional funding will be available to finance our operations on acceptable terms in order to enable us to carry out our business plan. There are no assurances that we will be able to complete further sales of our common stock or any other form of additional financing. If we are unable to achieve the financing necessary to continue our plan of operations, then we will not be able to carry out any further exploration work on the I-M Mine Property or the other properties in which we own an interest and our business may fail.
Off-Balance Sheet Arrangements
We have no off-balance sheet arrangements that have or are reasonably likely to have a current or future effect on its financial condition, changes in financial condition, revenues or expenses, results of operations, liquidity, capital expenditures or capital resources that are material to investors.
| Item 7A. | Quantitative and Qualitative Disclosures About Market Risk. |
Not required.
| Item 8. | Financial Statements and Supplementary Data. |
- 39 -
(formerly Rise Resources Inc.)
CONSOLIDATED FINANCIAL STATEMENTS
(Expressed in Canadian Dollars)
FOR THE YEAR ENDED JULY 31, 2018
- 40 -

Report of Independent Registered Public Accounting Firm
To the Shareholders and Directors of
Rise Gold Corp.
Opinion on the Consolidated Financial Statements
We have audited the accompanying consolidated balance sheets of Rise Gold Corp. (the “Company”), as of July 31, 2018 and 2017, and the related consolidated statements of operations and comprehensive loss, stockholders’ equity, and cash flows for the years ended July 31, 2018 and 2017, and the related notes (collectively referred to as the “financial statements”). In our opinion, the consolidated financial statements present fairly, in all material respects, the financial position of Rise Gold Corp. as of July 31, 2018 and 2017, and the results of its operations and its cash flows for the years ended July 31, 2018 and 2017 in conformity with accounting principles generally accepted in the United States of America.
Going Concern
The accompanying consolidated financial statements have been prepared assuming that the Company will continue as a going concern. As discussed in Note 1 to the consolidated financial statements, the Company has suffered recurring losses from operations and has a net capital deficiency that raise substantial doubt about its ability to continue as a going concern. Management’s plans in regard to these matters are also described in Note 1 The consolidated financial statements do not include any adjustments that might result from the outcome of this uncertainty.
Basis for Opinion
These consolidated financial statements are the responsibility of the Company’s management. Our responsibility is to express an opinion on the Company’s consolidated financial statements based on our audits. We are a public accounting firm registered with the Public Company Accounting Oversight Board (United States) (“PCAOB”) and are required to be independent with respect to the Company in accordance with the U.S. federal securities laws and the applicable rules and regulations of the Securities and Exchange Commission and the PCAOB.
We conducted our audits in accordance with the standards of the PCAOB. Those standards require that we plan and perform the audit to obtain reasonable assurance about whether the consolidated financial statements are free of material misstatement, whether due to error or fraud. The Company is not required to have, nor were we engaged to perform, an audit of its internal control over financial reporting. As part of our audits we are required to obtain an understanding of internal control over financial reporting but not for the purpose of expressing an opinion on the effectiveness of the Company’s internal control over financial reporting. Accordingly, we express no such opinion.
Our audits included performing procedures to assess the risks of material misstatements of the financial statements, whether due to error or fraud, and performing procedures that respond to those risks. Such procedures included examining, on a test basis, evidence regarding the amounts and disclosures in the consolidated financial statements. Our audits also included evaluating the accounting principles used and significant estimates made by management, as well as evaluating the overall presentation of the consolidated financial statements. We believe that our audits provide a reasonable basis for our opinion.
We have served as the Company’s auditor since 2013.
“DAVIDSON & COMPANY LLP”
| Vancouver, Canada | Chartered Professional Accountants |
October 25, 2018
- 41 -
RISE GOLD CORP. (FORMERLY RISE RESOURCES INC.)
(An Exploration Stage Company)
CONSOLIDATED BALANCE SHEETS
(Expressed in Canadian Dollars)
| AS AT | July 31, | July 31, | ||||||
| 2018 | 2017 | |||||||
| ASSETS | ||||||||
| Current | ||||||||
| Cash | $ | 69,616 | $ | 337,099 | ||||
| Receivables | 17,059 | 18,083 | ||||||
| Prepaid expenses (Note 4) | 532,389 | 165,118 | ||||||
| 619,064 | 520,300 | |||||||
| Mineral property interests (Note 5) | 5,447,674 | 3,789,854 | ||||||
| Equipment (Note 6) | 711,366 | - | ||||||
| $ | 6,778,104 | $ | 4,310,154 | |||||
| LIABILITIES AND SHAREHOLDERS’ EQUITY | ||||||||
| Current | ||||||||
| Accounts payable and accrued liabilities | $ | 521,058 | $ | 296,792 | ||||
| Loan from related parties (Note 9) | 49,150 | 38,079 | ||||||
| Current portion of equipment loan (Note 6) | 305,710 | - | ||||||
| 875,918 | 334,871 | |||||||
| Equipment loan (Note 6) | 293,955 | - | ||||||
| 1,169,873 | 334,871 | |||||||
| Stockholders’ equity | ||||||||
| Capital stock, $0.001 par value, 400,000,000 shares authorized; 116,105,982 (July 31, 2017 – 66,707,655) shares issued and outstanding (Note 10) | 116,106 | 66,708 | ||||||
| Additional paid-in capital (Note 10) | 16,280,575 | 10,103,162 | ||||||
| Cumulative translation adjustment | (166,663 | ) | (166,663 | ) | ||||
| Deficit | (10,621,787 | ) | (6,027,924 | ) | ||||
| 5,608,231 | 3,975,283 | |||||||
| $ | 6,778,104 | $ | 4,310,154 | |||||
Nature and continuance of operations (Note 1)
Subsequent events (Note 15)
Approved and authorized by the Board on October 25, 2018.
| “Benjamin Mossman” | Director | “John Anderson” | Director |
| Benjamin Mossman | John Anderson |
The accompanying notes are an integral part of these consolidated financial statements.
- 42 -
RISE GOLD CORP. (FORMERLY RISE RESOURCES INC.)
(An Exploration Stage Company)
CONSOLIDATED STATEMENT OF OPERATIONS AND COMPREHENSIVE LOSS
(Expressed in Canadian Dollars)
| FOR THE YEAR ENDED JULY 31, | 2018 | 2017 | ||||||
| EXPENSES | ||||||||
| Consulting | $ | 78,500 | $ | 505,842 | ||||
| Depreciation (Note 6) | 2,306 | - | ||||||
| Directors’ fees | 99,571 | 17,288 | ||||||
| Filing and regulatory | 87,395 | 53,661 | ||||||
| Foreign exchange | (14,749 | ) | 6,931 | |||||
| Gain on settlement of debt (Note 10) | (37,068 | ) | (12,355 | ) | ||||
| General and administrative | 287,052 | 152,920 | ||||||
| Geological, mineral, and prospect costs (Note 5) | 2,057,877 | 375,980 | ||||||
| Interest expense (Note 6) | 2,602 | - | ||||||
| Professional fees | 562,694 | 273,738 | ||||||
| Promotion and shareholder communication | 443,696 | 983,851 | ||||||
| Property investigation costs | - | 55,253 | ||||||
| Salaries | 350,627 | 104,751 | ||||||
| Share-based payments (Note 10) | 673,360 | 1,010,064 | ||||||
| Settlement payment (Note 5) | - | 100,000 | ||||||
| Write off mineral property costs (Note 5) | - | 563,031 | ||||||
| Net loss and comprehensive loss for the year | $ | 4,593,863 | $ | 4,190,955 | ||||
| Basic and diluted loss per common share | $ | (0.05 | ) | $ | (0.08 | ) | ||
| Weighted average number of common shares outstanding (basic and diluted) | 87,171,446 | 49,516,659 | ||||||
The accompanying notes are an integral part of these consolidated financial statements.
- 43 -
RISE GOLD CORP. (FORMERLY RISE RESOURCES INC.)
(An Exploration Stage Company)
CONSOLIDATED STATEMENT OF CASH FLOWS
(Expressed in Canadian Dollars)
| FOR THE YEAR ENDED JULY 31, | 2018 | 2017 | ||||||
| CASH FLOWS FROM OPERATING ACTIVITIES | ||||||||
| Loss for the year | $ | (4,593,863 | ) | $ | (4,190,955 | ) | ||
| Items not involving cash | ||||||||
| Depreciation | 2,306 | - | ||||||
| Gain on settlement of debt | (37,068 | ) | (12,355 | ) | ||||
| Shares issued for compensation | - | 60,000 | ||||||
| Share-based payments | 673,360 | 1,010,064 | ||||||
| Unrealized loss (gain) on foreign exchange | 6,117 | (5,004 | ) | |||||
| Write off of mineral property costs | - | 563,031 | ||||||
| Non-cash working capital item changes: | ||||||||
| Receivables | 1,024 | 1,938 | ||||||
| Prepaid expenses | (367,271 | ) | (155,552 | ) | ||||
| Accounts payables and accrued liabilities | 419,871 | 24,592 | ||||||
| Net cash used in operating activities | (3,895,524 | ) | (2,704,241 | ) | ||||
| CASH FLOWS FROM INVESTING ACTIVITIES | ||||||||
| Purchase of equipment | (89,213 | ) | - | |||||
| Mineral property | (1,657,820 | ) | (3,605,854 | ) | ||||
| Net cash used in investing activities | (1,747,033 | ) | (3,605,854 | ) | ||||
| CASH FLOWS FROM FINANCING ACTIVITIES | ||||||||
| Private placement | 5,560,220 | 6,662,907 | ||||||
| Warrants exercised | 19,267 | 27,208 | ||||||
| Options exercised | - | 60,000 | ||||||
| Share issuance costs | (189,619 | ) | (241,942 | ) | ||||
| Repayment of equipment loan | (24,794 | ) | - | |||||
| Loan from related parties | 10,000 | - | ||||||
| Net cash provided by financing activities | 5,375,074 | 6,508,173 | ||||||
| Change in cash for the year | (267,483 | ) | 198,078 | |||||
| Cash, beginning of year | 337,099 | 139,021 | ||||||
| Cash, end of year | $ | 69,616 | $ | 337,099 | ||||
Supplemental disclosure with respect to cash flows (Note 12)
The accompanying notes are an integral part of these consolidated financial statements.
- 44 -
RISE GOLD CORP. (FORMERLY RISE RESOURCES INC.)
(An Exploration Stage Company)
CONSOLIDATED STATEMENT OF STOCKHOLDERS’ EQUITY
(Expressed in Canadian Dollars)
| Capital Stock | ||||||||||||||||||||||||
| Cumulative | ||||||||||||||||||||||||
| Additional Paid- | Translation | |||||||||||||||||||||||
| Number | Amount | in Capital | Adjustment | Equity | Total | |||||||||||||||||||
| Balance as at July 31, 2016 | 32,866,261 | $ | 32,867 | $ | 2,475,194 | $ | (166,663 | ) | $ | (1,836,969 | ) | $ | 504,429 | |||||||||||
| Shares issued for cash | 31,849,314 | 31,849 | 6,631,058 | - | - | 6,662,907 | ||||||||||||||||||
| Shares issued for mineral property | 920,000 | 920 | 183,080 | - | - | 184,000 | ||||||||||||||||||
| Shares issued for compensation | 400,000 | 400 | 59,600 | - | - | 60,000 | ||||||||||||||||||
| Warrants exercised | 272,080 | 272 | 26,936 | - | - | 27,208 | ||||||||||||||||||
| Options exercised | 400,000 | 400 | 59,600 | - | - | 60,000 | ||||||||||||||||||
| Share issuance costs | - | - | (342,370 | ) | - | - | (342,370 | ) | ||||||||||||||||
| Share-based payments | - | - | 1,010,064 | - | - | 1,010,064 | ||||||||||||||||||
| Loss for the year | - | - | - | - | (4,190,955 | ) | (4,190,955 | ) | ||||||||||||||||
| Balance as at July 31, 2017 | 66,707,655 | $ | 66,708 | $ | 10,103,162 | $ | (166,663 | ) | $ | (6,027,924 | ) | $ | 3,975,283 | |||||||||||
| Shares issued for cash | 48,788,473 | 48,788 | 5,511,432 | - | - | 5,560,220 | ||||||||||||||||||
| Shares issued for debt | 417,184 | 417 | 60,074 | - | - | 60,491 | ||||||||||||||||||
| Warrants exercised | 192,670 | 193 | 19,074 | - | - | 19,267 | ||||||||||||||||||
| Share issuance costs | - | - | (86,527 | ) | - | - | (86,527 | ) | ||||||||||||||||
| Share-based payments | - | - | 673,360 | - | - | 673,360 | ||||||||||||||||||
| Loss for the year | - | - | - | - | (4,593,863 | ) | (4,593,863 | ) | ||||||||||||||||
| Balance as at July 31, 2018 | 116,105,982 | $ | 116,106 | $ | 16,280,575 | $ | (166,663 | ) | $ | (10,621,787 | ) | $ | 5,608,231 | |||||||||||
The accompanying notes are an integral part of these consolidated financial statements.
- 45 -
RISE GOLD CORP. (FORMERLY RISE RESOURCES INC.)
(An Exploration Stage Company)
NOTES TO THE CONSOLIDATED FINANCIAL STATEMENTS
FOR THE YEAR ENDED JULY 31, 2018
(Expressed in Canadian Dollars)
| 1. | NATURE AND CONTINUANCE OF OPERATIONS |
Rise Gold Corp. (the “Company”) was originally incorporated as Atlantic Resources Inc. in the State of Nevada on February 9, 2007 and is in the exploration stage. On April 11, 2012, the Company merged its wholly-owned subsidiary, Patriot Minefinders Inc., a Nevada corporation, in and to the Company to effect a name change to Patriot Minefinders Inc. On January 14, 2015, the Company completed a name change to Rise Resources Inc. in the same manner. On April 7, 2017, the Company changed its name to Rise Gold Corp. These mergers were carried out solely for the purpose of effecting these changes of names.
On February 16, 2015, the Company increased its authorized capital from 21,000,000 shares to 400,000,000 shares.
On January 29, 2016, the Company completed an initial public offering in Canada and began trading on the Canadian Securities Exchange (“CSE”) on February 1, 2016.
The Company is in the early stages of exploration and as is common with any exploration company, it raises financing for its acquisition activities. The accompanying consolidated financial statements have been prepared on the going concern basis, which presumes that the Company will continue operations for the foreseeable future and will be able to realize its assets and discharge its liabilities in the normal course of business. The Company has incurred a loss of $4,593,863 for the year ended July 31, 2018 and has accumulated a deficit of $10,621,787. This raises substantial doubt about the Company’s ability to continue as a going concern. The ability of the Company to continue as a going concern is dependent on the Company’s ability to maintain continued support from its shareholders and creditors and to raise additional capital and implement its business plan. The consolidated financial statements do not include any adjustments that might be necessary if the Company is unable to continue as a going concern.
At July 31, 2018, the Company had working capital deficiency of $256,854.
| 2. | BASIS OF PREPARATION |
Generally accepted accounting principles
These consolidated financial statements have been prepared in conformity with generally accepted accounting principles of the United States of America (“US GAAP”) for financial information with the instructions to Form 10-K and Regulation S-K.
These consolidated financial statements include the accounts of the Company and its wholly-owned subsidiary Rise Grass Valley Inc. All significant intercompany accounts and transactions have been eliminated on consolidation.
Use of Estimates
The preparation of these financial statements in conformity with US GAAP requires management to make estimates and assumptions that affect the reported amounts of assets and liabilities and disclosure of contingent assets and liabilities at the date of the financial statements and the reported amounts of revenue and expenses during the reporting period. Actual results could differ from those estimates. Significant areas requiring the use of estimates include the carrying value and recoverability of mineral properties and the recognition of deferred tax assets based on the change in unrecognized deductible temporary tax differences. Actual results could differ from those estimates, and would impact future results of operations and cash flows.
- 46 -
RISE GOLD CORP. (FORMERLY RISE RESOURCES INC.)
(An Exploration Stage Company)
NOTES TO THE CONSOLIDATED FINANCIAL STATEMENTS
FOR THE YEAR ENDED JULY 31, 2018
(Expressed in Canadian Dollars)
| 3. | SIGNIFICANT ACCOUNTING POLICIES |
Receivables
The Company reviews all receivables that exceed terms and establishes an allowance for doubtful accounts based on management’s assessment of the collectability of trade and other receivables.
Mineral property
The costs of acquiring mineral rights are capitalized at the date of acquisition. After acquisition, various factors can affect the recoverability of the capitalized costs. If, after review, management concludes that the carrying amount of a mineral property is impaired, it will be written down to estimated fair value. Exploration costs incurred on mineral properties are expensed as incurred. Development costs incurred on proven and probable reserves will be capitalized. Upon commencement of production, capitalized costs will be amortized using the unit-of-production method over the estimated life of the ore body based on proven and probable reserves (which exclude non-recoverable reserves and anticipated processing losses). When the Company receives an option payment related to a property, the proceeds of the payment are applied to reduce the carrying value of the exploration asset.
Long-lived assets
Long-lived assets, consisting of equipment held and used by the Company are reviewed for impairment whenever events or changes in circumstances indicate that the carrying amount of an asset may not be recoverable. For purposes of evaluating the recoverability of long-lived assets, the recoverability test is performed using undiscounted net cash flows related to the long-lived assets. If such assets are considered to be impaired, the impairment recognized is measured by the amount by which the carrying amount of the assets exceeds the fair value of the assets. Assets to be disposed of are reported at the lower of the carrying amount or fair value less costs to sell.
Equipment
Equipment is recorded at the lower of cost less accumulated depreciation. Depreciation is provided over the assets’ useful lives on a straight-line basis. Equipment purchased by the Company is depreciated over 15 years.
Asset retirement obligations
The Company records the fair value of an asset retirement obligation as a liability in the period in which it incurs a legal obligation associated with the retirement of tangible long-lived assets that result from the acquisition, construction, development, and/or normal use of the long-lived assets. The Company also records a corresponding asset which is amortized over the life of the asset. Subsequent to the initial measurement of the asset retirement obligation, the obligation is adjusted at the end of each period to reflect the passage of time (accretion expense) and changes in the estimated future cash flows underlying the obligation (asset retirement cost).
Loss per share
Basic loss per common share is computed using the weighted average number of common shares outstanding during the year. To calculate diluted loss per share, the Company adjusts net income (loss) attributable to common shareholders and the weighted average number of common shares outstanding for the effects of all dilutive potential common shares such as stock options and warrants. As at July 31, 2018, 11,610,142 outstanding options and 83,948,819 outstanding warrants were excluded from the diluted calculation.
- 47 -
RISE GOLD CORP. (FORMERLY RISE RESOURCES INC.)
(An Exploration Stage Company)
NOTES TO THE CONSOLIDATED FINANCIAL STATEMENTS
FOR THE YEAR ENDED JULY 31, 2018
(Expressed in Canadian Dollars)
| 3. | SIGNIFICANT ACCOUNTING POLICIES (cont’d…) |
Financial instruments
The Company’s financial instruments consist of cash, receivables, accounts payable and accrued liabilities, and loan from related parties and equipment loan. It is management’s opinion that the Company is not exposed to significant interest, currency or credit risks arising from its financial instruments. The fair values of these financial instruments approximate their carrying values unless otherwise noted.
Fair value of financial assets and liabilities
The Company measures the fair value of financial assets and liabilities based on US GAAP guidance which defines fair value, establishes a framework for measuring fair value, and expands disclosures about fair value measurements.
The Company classifies financial assets and liabilities as held-for-trading, available-for-sale, held-to-maturity, loans and receivables or other financial liabilities depending on their nature. Financial assets and financial liabilities are recognized at fair value on their initial recognition, except for those arising from certain related party transactions which are accounted for at the transferor’s carrying amount or exchange amount.
Financial assets and liabilities classified as held-for-trading are measured at fair value, with gains and losses recognized in net income. Financial assets classified as held-to-maturity, loans and receivables, and financial liabilities other than those classified as held-for-trading are measured at amortized cost, using the effective interest rate method of amortization. Financial assets classified as available-for-sale are measured at fair value, with unrealized gains and losses being recognized as other comprehensive income until realized, or if an unrealized loss is considered other than temporary, the unrealized loss is recorded in income.
The following indicates the fair value hierarchy of the valuation techniques the Company utilizes to determine the fair value of financial assets that are measured at fair value on a recurring basis.
Level 1 – Unadjusted quoted prices in active markets for identical assets and liabilities;
Level 2 – Inputs other than quoted prices that are observable for the asset or liability either directly or indirectly; and
Level 3 – Inputs that are not based on observable market data.
Cash is considered level 1 and classified as cash on hand and held at banks.
Financial instruments, including loan from related parties, accounts payable and accrued liabilities and equipment loan are classified as other financial liabilities and are carried at cost, which management believes approximates fair value due to the short term nature of these instruments.
Concentration of credit risk
The financial instrument which potentially subjects the Company to concentration of credit risk is cash. The Company maintains cash in bank accounts that, at times, may exceed federally insured limits. As of July 31, 2018 and 2017, the Company has not exceeded the federally insured limit. The Company has not experienced any losses in such accounts and believes it is not exposed to any significant risks on its cash in bank accounts.
- 48 -
RISE GOLD CORP. (FORMERLY RISE RESOURCES INC.)
(An Exploration Stage Company)
NOTES TO THE CONSOLIDATED FINANCIAL STATEMENTS
FOR THE YEAR ENDED JULY 31, 2018
(Expressed in Canadian Dollars)
| 3. | SIGNIFICANT ACCOUNTING POLICIES (cont’d…) |
Stock-based compensation
The Company accounts for share-based compensation under the provisions of ASC 718, “Compensation-Stock Compensation”. Under the fair value recognition provisions, stock-based compensation expense is measured at the fair value of the consideration received, or the fair value of the equity instruments issued, or liabilities incurred, whichever is more reliably measured. Share-based compensation for all stock-based awards to employees and directors is recognized as an expense over the requisite service period, which is generally the vesting period. The Black-Scholes option valuation model is used to calculate fair value.
The Company accounts for stock compensation arrangements with non-employees in accordance with ASC 718 which requires that such equity instruments are recorded at the value of the goods and services received on the measurement date. The measurement of stock-based compensation is subject to periodic adjustment as the underlying equity instruments vest. Non-employee stock-based compensation charges are amortized over the vesting period on a straight-line basis. For stock options granted to employees, directors, and non-employees, the fair value of the stock options is estimated using a Black-Scholes valuation model.
Income taxes
The Company accounts for income taxes under the asset and liability method, whereby deferred tax assets and liabilities are recognized for the future tax consequences attributable to differences between the financial statement carrying amounts of existing assets and liabilities and their respective tax bases. Current income taxes are recognized for the estimated income taxes payable or receivable on taxable income or loss from the current year and any adjustment to income taxes payable related to previous years. Current income taxes are determined using tax rates and tax laws that have been enacted or subsequently enacted by the year-end date.
Deferred tax assets and liabilities are measured using enacted tax rates expected to apply to taxable income in the years in which those temporary differences are expected to be recovered or settled. Under the asset and liability method the effect on deferred tax assets and liabilities of a change in tax rates is recognized in income in the period that includes the enactment date. A valuation allowance is recognized if it is more likely than not that some portion or all of the deferred tax asset will not be recognized.
Foreign exchange
The functional currency of the Company and its subsidiary is the Canadian dollar. Any monetary assets and liabilities that are in a currency other than the Canadian dollar are translated at the rate prevailing at year end. Revenue and expenses in a foreign currency are translated at rates that approximate those in effect at the time of translation. Gains and losses from translation of foreign currency transactions into Canadian dollars are included in current results of operations.
- 49 -
RISE GOLD CORP. (FORMERLY RISE RESOURCES INC.)
(An Exploration Stage Company)
NOTES TO THE CONSOLIDATED FINANCIAL STATEMENTS
FOR THE YEAR ENDED JULY 31, 2018
(Expressed in Canadian Dollars)
| 3. | SIGNIFICANT ACCOUNTING POLICIES (cont’d…) |
Recently adopted and recently issued accounting standards
In January 2016, the FASB issued ASU No. 2016-01, “Financial Instruments – Overall (Subtopic 825-10): Recognition and Measurement of Financial Assets and Liabilities”. This ASU amendment addresses aspects of recognition, measurement, presentation and disclosure of financial instruments. It affects investments in equity securities and the presentation of certain fair value changes for financial liabilities measured at fair value, and simplifies the impairment assessment of equity investments without a readily determinable fair value by requiring a qualitative assessment. The ASU applies to all entities and is effective for annual periods beginning after December 15, 2017, and interim periods thereafter, with early adoption permitted. The Company is currently evaluating the impact of the adoption of this standard.
On February 25, 2016, the FASB issued ASU No. 2016-02, “Leases”. This ASU applies to public companies beginning January 1, 2019 and affects the requirement that lessees account for all leases – both operating and finance – on the balance sheet while recognizing both an asset for the right to use the leased asset and an obligation to make lease payments over the lease term. The Company is currently evaluating the impact of the adoption of this standard.
Other than the above, the Company has determined that other significant newly issued accounting pronouncements are either not applicable to the Company’s business or that no material effect is expected on the financial statements as a result of future adoption.
| 4. | PREPAID EXPENSES |
| July 31, 2018 | July 31, 2017 | |||||||
| Promotion and shareholder communication | $ | 429,166 | $ | 76,393 | ||||
| Rent | - | 32,937 | ||||||
| Insurance | 102,723 | 41,250 | ||||||
| Other | 500 | 14,538 | ||||||
| $ | 532,389 | $ | 165,118 | |||||
- 50 -
RISE GOLD CORP. (FORMERLY RISE RESOURCES INC.)
(An Exploration Stage Company)
NOTES TO THE CONSOLIDATED FINANCIAL STATEMENTS
FOR THE YEAR ENDED JULY 31, 2018
(Expressed in Canadian Dollars)
| 5. | MINERAL PROPERTY INTERESTS |
The Company’s mineral properties balance consists of:
| Idaho-Maryland, California | ||||
| Opening balance, June 1, 2016 | $ | - | ||
| Additions | 3,789,854 | |||
| Ending balance, July 31, 2017 | 3,789,854 | |||
| Additions | 1,657,820 | |||
| Ending balance, July 31, 2018 | $ | 5,447,674 | ||
Title to mineral properties
Title to mineral properties involves certain inherent risks due to the difficulties of determining the validity of certain mineral titles as well as the potential for problems arising from the frequently ambiguous conveying history characteristic of many mineral properties. As at July 31, 2018, the Company holds title to the Idaho-Maryland Gold Mine Property.
As of July 31, 2018, based on management’s review of the carrying value of mineral rights, management determined that there is no evidence that the cost of these acquired mineral rights will not be fully recovered and accordingly, the Company determined that no adjustment to the carrying value of mineral rights was required. As of the date of these consolidated financial statements, the Company has not established any proven or probable reserves on its mineral properties and has incurred only acquisition and exploration costs.
Indata, British Columbia
On May 18, 2015, the Company entered into an option agreement with Eastfield Resources Ltd., (“Eastfield”), pursuant to which Eastfield granted the Company the exclusive and irrevocable right to acquire up to a 75% interest in and to certain claims in the Indata property located in the Omineca Mining Division in British Columbia, Canada. In order to earn the initial 60% interest, the Company is required to pay Eastfield an aggregate of $350,000 ($50,000 paid to date) in cash and incur a minimum of $2,000,000 in aggregate exploration expenditures on the property by April 3, 2019. In order to earn the additional 15% interest, the Company is required to pay Eastfield $100,000 cash within 90 days of earning the 60% interest and incur a further $500,000 in aggregate annual exploration expenditures on the property until such time as the Company is able to complete a feasibility study on the property. As at July 31, 2017, the Company has incurred cumulative exploration expenditures of $4,035 on the Indata property. During the year ended July 31, 2017, the Company terminated its option agreement with Eastfield; accordingly, the Company has written off $50,000 in acquisition costs in relation to the Indata property as at July 31, 2017.
- 51 -
RISE GOLD CORP. (FORMERLY RISE RESOURCES INC.)
(An Exploration Stage Company)
NOTES TO THE CONSOLIDATED FINANCIAL STATEMENTS
FOR THE YEAR ENDED JULY 31, 2018
(Expressed in Canadian Dollars)
| 5. | MINERAL PROPERTY INTERESTS (cont’d…) |
Klondike, British Columbia
On May 26, 2016, the Company entered into an agreement with Klondike Gold Corp. (“Klondike”) regarding the purchase of a portfolio of seven gold and base metal properties in southeast British Columbia. Under the agreement, within 60 days of signing, the Company paid Klondike $50,000 in cash, issued 1,500,000 shares of the Company’s common stock valued at $240,000, and issued 1,500,000 warrants valued at $223,031 (discount rate – 0.49%, volatility – 200.64%, expected life – 2 years, dividend yield – 0%), exercisable at $0.227 per share until July 13, 2018. On the one year anniversary of the first closing, the Company will pay Klondike $150,000 in cash, issue 2,000,000 shares of the Company’s common stock, and issue 1,000,000 warrants. Klondike will retain a 2% net smelter return royalty (“NSR”) and the Company will have the right to purchase 50% of the NSR for $1,000,000 at any time after the first closing. Each of the warrants is exercisable for a period of two years into one share of the Company’s common stock at a price that is a 20% premium to the 10-day volume-weighted average price of the stock on the CSE immediately prior to the date of issuance. As at July 31, 2017, the Company has incurred cumulative exploration expenditures of $10,408 on the Klondike properties. During the year ended July 31, 2017, the Company terminated the purchase agreement with Klondike and paid a settlement of $100,000 to Klondike; accordingly the Company has written off $513,031 in acquisition costs in relation to the Klondike properties as at July 31, 2017.
Idaho-Maryland Gold Mine Property, California
On August 30, 2016, the Company entered into an option agreement with three parties to purchase a 100% interest in and to the Idaho-Maryland Gold Mine property located near Grass Valley, California, United States; pursuant to the option agreement, in order to exercise the option, the Company must pay US$2,000,000 by November 30, 2016. Upon execution of the option agreement, the Company paid the vendors a non-refundable cash deposit in the amount of $32,758 (US$25,000), which will be credited against the purchase price of US$2,000,000 upon exercise of the option. On November 30, 2016, the Company negotiated an extension of the closing date of the option agreement to December 26, 2016, in return for a cash payment of $32,758 (US$25,000), which will be credited against the purchase price of US$2,000,000 upon exercise of the option. On December 28, 2016, the Company negotiated a further no-cost extension of the closing date of the option agreement to April 30, 2017. On January 25, 2017, the Company exercised the option by paying $2,588,625 (US$1,950,000), and acquired a 100% interest in the Idaho-Maryland Gold Mine property. In connection with the option agreement, the Company agreed to pay a cash commission of $184,000 (US$140,000) equal to 7 per cent of the purchase price of US$2,000,000; the commission was settled on January 25, 2017 through the issuance of 920,000 units valued at $0.20 per unit (Note 10). The Company also incurred additional transaction costs of $144,391, which have been included the carrying value of the Idaho-Maryland Gold Mine.
On January 6, 2017, the Company entered into an option agreement with Sierra Pacific Industries Inc. (“Sierra”) to purchase a 100% interest in and to certain surface rights totalling approximately 82 acres located near Grass Valley, California, United States, contiguous to the Idaho-Maryland Gold Mine property acquired by the Company on January 25, 2017. Pursuant to the option agreement, in order to exercise the option, the Company must pay US$1,900,000 by March 31, 2017. Upon execution of the option agreement, the Company paid the vendors a non-refundable cash deposit in the amount of $132,732 (US$100,000), which will be credited against the purchase price of US$1,900,000 upon exercise of the option. On April 3, 2017, the Company negotiated an extension of the closing date of the option agreement to June 30, 2017, in return for a cash payment of $268,000 (US$200,000), at which time a payment of US$1,600,000 is due in order to exercise the option. On June 7, 2017, the Company negotiated an extension of the closing date of the option agreement to September 30, 2017, in return for a cash payment of $406,590 (US$300,000), at which time a payment of US$1,300,000 is due in order to exercise the option.
- 52 -
RISE GOLD CORP. (FORMERLY RISE RESOURCES INC.)
(An Exploration Stage Company)
NOTES TO THE CONSOLIDATED FINANCIAL STATEMENTS
FOR THE YEAR ENDED JULY 31, 2018
(Expressed in Canadian Dollars)
| 5. | MINERAL PROPERTY INTERESTS (cont’d…) |
On May 14, 2018, the Company completed the purchase of the surface rights totalling approximately 82 acres by making final payments totalling $1,657,820 (US$1,300,000).
As at July 31, 2018, the Company has incurred cumulative property investigation costs of $55,253 and cumulative exploration expenditures of $2,433,857 on the Idaho-Maryland Gold Mine property as follows:
| Year ended July 31, 2018 | Year ended July 31, 2017 | |||||||
| Idaho-Maryland Gold Mine expenditures: | ||||||||
| Opening balance | $ | 375,980 | $ | - | ||||
| Consulting | 352,988 | 287,411 | ||||||
| Exploration | 1,030,710 | 54,753 | ||||||
| Rent | 32,380 | 10,968 | ||||||
| Supplies | 246,656 | 4,020 | ||||||
| Sampling | 278,344 | 8,623 | ||||||
| Travel | 116,799 | 10,205 | ||||||
| Total expenditures for the year | $ | 2,057,877 | $ | 375,980 | ||||
| Closing balance | $ | 2,433,857 | $ | 375,980 | ||||
| 6. | EQUIPMENT AND EQUIPMENT LOAN |
On June 7, 2018, the Company purchased two diamond core drilling rigs for exploration at the Idaho-Maryland Gold Project for a total purchase price of $624,459. The purchase is financed and will be paid in equal monthly instalments of $27,396 per month over a 24-month period with an interest rate of 5% per annum. Interest expense incurred for the equipment purchase for the year ended July 31, 2018 is $2,602. During the year ended July 31, 2018, the company recorded depreciation of $2,306 on this equipment.
During the year ended July 31, 2018, the Company also purchased additional drilling equipment for a total of $89,213. There was no depreciation recorded on the additional equipment purchased.
| Cost | Drilling equipment | |||
| At July 31, 2017 | $ | - | ||
| Purchases | 713,672 | |||
| At July 31, 2018 | $ | 713,672 | ||
| Accumulated depreciation | ||||
| At July 31, 2017 | $ | - | ||
| Depreciation | 2,306 | |||
| At July 31, 2018 | $ | 2,306 | ||
| Total carrying value, July 31, 2017 | $ | - | ||
| Total carrying value, July 31, 2018 | $ | 711,366 | ||
- 53 -
RISE GOLD CORP. (FORMERLY RISE RESOURCES INC.)
(An Exploration Stage Company)
NOTES TO THE CONSOLIDATED FINANCIAL STATEMENTS
FOR THE YEAR ENDED JULY 31, 2018
(Expressed in Canadian Dollars)
| 6. | EQUIPMENT AND EQUIPMENT LOAN (cont’d…) |
During the year ended July 31, 2018, the Company recorded an equipment loan of $624,459 in connection with the two diamond core drilling rigs purchased. The Company paid $27,396 including $2,602 of interest towards this loan during the year ended July 31, 2018. As at July 31, 2018, the outstanding balance on this loan was $599,665, out of which $305,710 has been classified as the current portion.
| 7. | CONTINGENCY |
During the year ended July 31, 2014, the Company entered into a binding letter of intent (“LOI”) with Wundr Software Inc. (“Wundr”). Under the terms of the LOI, the Company would acquire 100% of the issued and outstanding common shares of Wundr. Due to unforeseen circumstances, the Company did not complete the transactions contemplated in the LOI, which the Company announced had expired on January 10, 2014.
On September 17, 2014, the Company learned that it was the subject, along with a number of additional defendants, of a notice of civil claim (the “Claim”) filed in the Supreme Court of British Columbia by Wundr, under which Wundr is seeking general damages from the Company as well as damages for conspiracy to cause economic harm. None of the allegations contained in the Claim have been proven in court. Management has determined that the probability of the Claim resulting in an unfavourable outcome and financial loss to the Company is unlikely.
| 8. | PROMISSORY NOTES PAYABLE |
During the year ended July 31, 2017, the Company issued promissory notes totalling $220,000, accruing interest in advance at 10% every three months, maturing on June 29, 2017. Subsequently, the Company and one promissory note holder agreed to reduce the interest rate to 7.2% and make an early repayment of principal of $100,000 and accrued interest of $7,200. The remaining principal of $120,000 and accrued interest of $12,000 was also repaid during the year ended July 31, 2017.
| 9. | RELATED PARTY TRANSACTIONS |
Key management personnel consist of the Chief Executive Officer, Chief Financial Officer, and the directors of the Company. The remuneration of the key management personnel is as follows:
| a) | Salaries of $180,000 (2017 - $135,000) and Nil (2017 – 400,000) shares of common stock valued at $Nil (2017 - $60,000), recognized in consulting expense, were paid or accrued to the CEO of the Company. |
- 54 -
RISE GOLD CORP. (FORMERLY RISE RESOURCES INC.)
(An Exploration Stage Company)
NOTES TO THE CONSOLIDATED FINANCIAL STATEMENTS
FOR THE YEAR ENDED JULY 31, 2018
(Expressed in Canadian Dollars)
| 9. | RELATED PARTY TRANSACTIONS (cont’d…) |
| b) | Consulting fees of $Nil (2017 - $32,119) were paid or accrued to the former CEO of the Company. |
| c) | Consulting fees of $51,000 (2017 - $52,429) were paid or accrued to the former CFO of the Company. |
| d) | Consulting fees of $Nil (2017 - $149,333) were paid or accrued to a company controlled by a former director of the Company. |
| e) | Consulting fees of $27,500 (2017 - $22,952) and rental fees of $10,800 (2017 - $6,750) were paid to a company in which the former CFO and a former director holds a 50% interest. |
| f) | Directors fees of $99,571 (2017 - $17,288) were paid or accrued to directors of the Company. |
| g) | Share-based payments of $631,150 (2017 - $885,375) were paid to the CEO and directors of the Company. |
As at July 31, 2018, the Company has recorded loans from related parties of $10,000 and $39,150 (US$30,500) (July 31, 2017 - $38,079 (US$30,500)) representing advances made by a company controlled by a former director of the Company and another former director, respectively. The advances are due on demand without interest.
As at July 31, 2018, included in accounts payable and accrued liabilities is $68,521 (July 31, 2017 - $20,385) in accounts and advances payable and accrued liabilities to current and former directors, officers and companies controlled by directors and officers of the Company.
| 10. | CAPITAL STOCK AND ADDITIONAL PAID-IN CAPITAL |
Issued Capital Stock
On August 1, 2016, the Company issued 400,000 shares of common stock at a price of $0.15 per share to the Company’s CEO as compensation. The shares were valued at $60,000 (Note 9) on issuance and were recognized as consulting expense.
On November 1, 2016 and November 7, 2016, the Company issued a total of 272,080 shares of common stock upon the exercise of finders’ warrants at a price of $0.10 per share for total proceeds of $27,208.
On January 25, 2017, the Company issued 920,000 units valued at $0.20 per unit to an individual pursuant to settlement of $184,000 (US$140,000), representing a cash commission equal to seven per cent of the US$2,000,000 purchase price of the Idaho-Maryland property (Note 5). Each unit consists of one share of common stock and one transferable share purchase warrant exercisable into one share of common stock at a price of $0.40 for a period of two years from the date of issuance.
On August 9, 2017, the Company issued 417,184 units to a third party pursuant to a settlement of debt in the amount of $95,952, representing finders’ fees payable on the private placement which closed May 5, 2017. Each unit consists of one share of common stock and one transferable share purchase warrant exercisable into one share of common stock at a price of $0.40 for a period of two years from the date of issuance. At the time of issuance, the units had a fair value of $60,491 ($0.145 per unit); accordingly, the Company recognized a gain on settlement of debt of $35,461.
On January 29, 2018, the Company issued a total of 192,670 shares of common stock upon the exercise of finders’ warrants at a price of $0.10 per share for total proceeds of $19,267.
- 55 -
RISE GOLD CORP. (FORMERLY RISE RESOURCES INC.)
(An Exploration Stage Company)
NOTES TO THE CONSOLIDATED FINANCIAL STATEMENTS
FOR THE YEAR ENDED JULY 31, 2018
(Expressed in Canadian Dollars)
| 10. | CAPITAL STOCK AND ADDITIONAL PAID-IN CAPITAL (cont’d…) |
Private Placements
On December 23, 2016, the Company completed a non-brokered private placement, issuing an aggregate of 21,044,500 units at a price of $0.20 per unit for gross proceeds of $4,208,900. Each unit consists of one share of common stock and one non-transferable share purchase warrant exercisable into one share of common stock at a price of $0.40 for a period of two years from the date of issuance. In connection with the private placement, the Company paid finders’ fees of $218,410, other share issuance costs of $15,723, and issued a total of 1,104,300 finders’ warrants valued at $191,724 (discount rate – 0.76%, volatility – 179.53%, expected life – 2 years, dividend yield – 0%), exercisable into one share of common stock at a price of $0.40 for a period of two years from the date of issuance.
On January 24, 2017, the Company completed a non-brokered private placement, issuing an aggregate of 1,340,000 units at a price of $0.20 per unit for gross proceeds of $268,000. Each unit consists of one share of common stock and one non-transferable share purchase warrant exercisable into one share of common stock at a price of $0.40 for a period of two years from the date of issuance. In connection with the private placement, the Company paid finders’ fees of $5,220 and issued a total of 26,100 finders’ warrants valued at $5,919 (discount rate – 0.76%, volatility – 175.85%, expected life – 2 years, dividend yield – 0%), exercisable into one share of common stock at a price of $0.40 for a period of two years from the date of issuance.
On February 6, 2017, the Company completed a non-brokered private placement, issuing an aggregate of 455,000 units at a price of $0.25 per unit for gross proceeds of $113,750. Each unit consists of one share of common stock and one non-transferable share purchase warrant exercisable into one share of common stock at a price of $0.40 for a period of two years from the date of issuance. In connection with the private placement, the Company paid finders’ fees of $2,625 and issued a total of 10,500 finders’ warrants valued at $2,657 (discount rate – 0.70%, volatility – 175.86%, expected life – 2 years, dividend yield – 0%), exercisable into one share of common stock at a price of $0.40 for a period of two years from the date of issuance.
On May 5, 2017, the Company completed a non-brokered private placement, issuing an aggregate of 9,009,814 units at a price of $0.23 per unit for gross proceeds of $2,072,257. Each unit consists of one share of common stock and one non-transferable share purchase warrant exercisable into one share of common stock at a price of $0.40 for a period of two years from the date of issuance. In connection with the private placement, the Company paid finders’ fees of $100,392 and issued a total of 436,488 finders’ warrants valued at $92,991 (discount rate – 0.67%, volatility – 170.28%, expected life – 2 years, dividend yield – 0%), exercisable into one share of common stock at a price of $0.40 for a period of two years from the date of issuance.
On September 26, 2017, the Company completed the first tranche of a non-brokered private placement, issuing an aggregate of 7,077,140 units at a price of $0.15 per unit for gross proceeds of $1,061,570. Each unit consisted of one share of common stock and one non-transferable share purchase warrant exercisable into one share of common stock at a price of $0.25 for a period of two years from the date of issuance. In connection with the private placement, the Company paid finders’ fees and share issuance costs of $18,248 and issued a total of 3,600 finders’ warrants valued at $346 (discount rate – 1.59%, volatility – 150.97%, expected life – 2 years, dividend yield – 0%), exercisable into one share of common stock at a price of $0.25 for a period of two years from the date of issuance.
- 56 -
RISE GOLD CORP. (FORMERLY RISE RESOURCES INC.)
(An Exploration Stage Company)
NOTES TO THE CONSOLIDATED FINANCIAL STATEMENTS
FOR THE YEAR ENDED JULY 31, 2018
(Expressed in Canadian Dollars)
| 10. | CAPITAL STOCK AND ADDITIONAL PAID-IN CAPITAL (cont’d…) |
On December 27, 2017, the Company completed the second tranche of a non-brokered private placement, issuing an aggregate of 6,417,000 units at a price of $0.15 per unit for gross proceeds of $962,550. Each unit consisted of one share of common stock and one non-transferable share purchase warrant exercisable into one share of common stock at a price of $0.25 for a period of two years from the date of issuance. In connection with the private placement, the Company paid finders’ fees and share issuance costs of $60,279 and issued a total of 371,860 finders’ warrants valued at $28,997 (discount rate – 1.64%, volatility – 139.85%, expected life – 2 years, dividend yield – 0%), exercisable into one share of common stock at a price of $0.25 for a period of two years from the date of issuance.
On January 3, 2018, the Company completed the third and final tranche of a non-brokered private placement, issuing an aggregate of 133,333 units at a price of $0.15 per unit for gross proceeds of $20,000. Each unit consisted of one share of common stock and one non-transferable share purchase warrant exercisable into one share of common stock at a price of $0.25 for a period of two years from the date of issuance.
On April 18, 2018, the Company completed a non-brokered private placement, issuing an aggregate of 35,161,000 units at a price of $0.10 per unit for gross proceeds of $3,516,100. Each unit consisted of one share of common stock and one non-transferable share purchase warrant exercisable into one share of common stock at a price of $0.15 for a period of three years from the date of issuance. In connection with the private placement, the Company paid finders’ fees and share issuance costs of $8,000 and issued a total of 21,000 finders’ warrants valued at $1,467 (discount rate – 1.88%, volatility – 123.60%, expected life – 2 years, dividend yield – 0%), exercisable into one share of common stock at a price of $0.15 for a period of two years from the date of issuance.
Stock Options
During the year ended July 31, 2018, the Company granted a total of 6,381,000 stock options to employees, officers, directors, and consultants of the Company, exercisable at a weighted average price of $0.12 per share for a period of five years;
During the year ended July 31, 2017, the Company granted:
| a) | a total of 2,729,142 stock options to the Company’s CEO, exercisable at a weighted average price of $0.23 per share for a period of five years; |
| b) | 500,000 incentive stock options to an investor relations consultant, each option exercisable into one share of common stock at a price of $0.33 until February 7, 2020; |
| c) | 500,000 stock options to a director of the Company, exercisable at a price of $0.27 per share until April 3, 2022; and |
| d) | 900,000 stock options to two directors of the Company, exercisable at a price of $0.28 per share until April 20, 2020. |
- 57 -
RISE GOLD CORP. (FORMERLY RISE RESOURCES INC.)
(An Exploration Stage Company)
NOTES TO THE CONSOLIDATED FINANCIAL STATEMENTS
FOR THE YEAR ENDED JULY 31, 2018
(Expressed in Canadian Dollars)
| 10. | CAPITAL STOCK AND ADDITIONAL PAID-IN CAPITAL (cont’d…) |
The following incentive stock options were outstanding at July 31, 2018:
| Number of Options | Exercise Price | Expiry Date | |||||||
| 1,100,000 | $ | 0.15 | March 22, 2021 | ||||||
| 586,600 | 0.20 | August 8, 2021 | |||||||
| 2,142,542 | 0.24 | December 27, 2021 | |||||||
| 500,000 | 0.27 | April 3, 2022 | |||||||
| 900,000 | 0.28 | April 20, 2020 | |||||||
| 6,381,000 | 0.12 | April 19, 2023 | |||||||
| 11,610,142 | $ | 0.17 | |||||||
Stock option transactions are summarized as follows:
| Number of Options | Weighted Average Exercise Price | Aggregate Intrinsic Value | ||||||||||
| Balance, July 31, 2016 | 2,700,000 | $ | 0.15 | Nil | ||||||||
| Options granted | 4,629,142 | 0.26 | Nil | |||||||||
| Options exercised | (400,000 | ) | (0.15 | ) | Nil | |||||||
| Options expired/forfeited | (1,200,000 | ) | (0.15 | ) | Nil | |||||||
| Balance, July 31, 2017 | 5,729,142 | $ | 0.24 | Nil | ||||||||
| Options granted | 6,381,000 | 0.12 | Nil | |||||||||
| Options expired/forfeited | (500,000 | ) | (0.33 | ) | Nil | |||||||
| Balance outstanding and exercisable, July 31, 2018 | 11,610,142 | $ | 0.17 |
Nil | ||||||||
Warrants
The following warrants were outstanding at July 31, 2018:
| Number of Warrants | Exercise Price | Expiry Date | |||||||
| 22,148,800 | $ | 0.40 | December 23, 2018 | ||||||
| 2,286,100 | 0.40 | January 24, 2019 | |||||||
| 465,500 | 0.40 | February 6, 2019 | |||||||
| 9,863,486 | 0.40 | May 5, 2019 | |||||||
| 7,080,740 | 0.25 | September 25, 2019 | |||||||
| 6,788,860 | 0.25 | December 27, 2019 | |||||||
| 133,333 | 0.25 | January 3, 2020 | |||||||
| 21,000 | 0.15 | April 18, 2020 | |||||||
| 35,161,000 | 0.15 | April 18, 2021 | |||||||
| 83,948,819 | $ | 0.27 | |||||||
- 58 -
RISE GOLD CORP. (FORMERLY RISE RESOURCES INC.)
(An Exploration Stage Company)
NOTES TO THE CONSOLIDATED FINANCIAL STATEMENTS
FOR THE YEAR ENDED JULY 31, 2018
(Expressed in Canadian Dollars)
| 10. | CAPITAL STOCK AND ADDITIONAL PAID-IN CAPITAL (cont’d…) |
Warrants
Warrant transactions are summarized as follows:
| Number of Warrants | Weighted Average Exercise Price | |||||||
| Balance, July 31, 2016 | 1,964,750 | $ | 0.20 | |||||
| Warrants issued | 34,346,702 | 0.40 | ||||||
| Warrants exercised | (272,080 | ) | (0.10 | ) | ||||
| Balance, July 31, 2017 | 36,039,372 | $ | 0.39 | |||||
| Warrants issued | 49,602,117 | 0.18 | ||||||
| Warrants exercised | (192,670 | ) | (0.10 | ) | ||||
| Warrants expired | (1,500,000 | ) | (0.23 | ) | ||||
| Balance, July 31, 2018 | 83,948,819 | $ | 0.27 | |||||
During the year ended July 31, 2018, the Company issued a total of 396,460 (2017 – 1,577,388) finders’ warrants with a weighted average fair value of $0.08 (2017 - $0.19) per warrant.
The following weighted average assumptions were used for the Black-Scholes option-pricing model valuation of finders’ warrants issued during the year:
| 2018 | 2017 | |||||||
| Risk-free interest rate | 1.65 | % | 0.73 | % | ||||
| Expected life of warrants | 2.0 years | 2.0 years | ||||||
| Expected annualized volatility | 139.09 | % | 176.89 | % | ||||
| Dividend | Nil | Nil | ||||||
| Forfeiture rate | 0 | % | 0 | % | ||||
Share-Based Payments
The Company has a stock option plan under which it is authorized to grant options to executive officers and directors, employees and consultants enabling them to acquire up to 10% of the issued and outstanding common stock of the Company. Under the plan the exercise price of each option equals the market price of the Company’s stock, less any applicable discount, as calculated on the date of grant. The options can be granted for a maximum term of 5 years with vesting determined by the board of directors.
During the year ended July 31, 2018, the Company granted 6,381,000 (2017 – 4,629,142) stock options with a weighted average fair value of $0.11 (2017 - $0.18) per share, recognizing share-based payments expense of $673,360 (2017 - $1,010,064).
- 59 -
RISE GOLD CORP. (FORMERLY RISE RESOURCES INC.)
(An Exploration Stage Company)
NOTES TO THE CONSOLIDATED FINANCIAL STATEMENTS
FOR THE YEAR ENDED JULY 31, 2018
(Expressed in Canadian Dollars)
| 10. | CAPITAL STOCK AND ADDITIONAL PAID-IN CAPITAL (cont’d…) |
The following weighted average assumptions were used for the Black-Scholes option-pricing model valuation of stock options granted during the year:
| 2018 | 2017 | |||||||
| Risk-free interest rate | 2.12 | % | 0.82 | % | ||||
| Expected life of options | 5.00 years | 3.07 years | ||||||
| Expected annualized volatility | 136.38 | % | 128.23 | % | ||||
| Dividend | Nil | Nil | ||||||
| Forfeiture rate | 0 | % | 0 | % | ||||
| 11. | INCOME TAXES |
The Tax Cuts and Jobs Act (the “Tax Reform”), enacted on December 22, 2017, reduces the U.S. federal corporate tax rate from 35% to 21%, which is administratively effective on August 1, 2017. The Tax Reform requires the Company to use a blended statutory tax rate of 26.45% for the year ended July 31, 2018. The Company has not regenerated any taxable income and have not recorded any current income taxes in Fiscal 2018. Consequently, the tax rate change has had no impact on the Company’s current tax expenses but has impacted the existing deferred tax assets and will impact future deferred tax assets to be recognized. As management cannot determine that it is more likely than not that the Company will realize the benefit of the net deferred tax assets, a valuation allowance equal to the net deferred tax assets has been recorded.
A reconciliation of income taxes (recovery) at statutory rates with the reported taxes is as follows:
| 2018 | 2017 | |||||||
| Loss before income taxes | $ | (4,593,863 | ) | $ | (4,190,955 | ) | ||
| Expected income tax (recovery) at statutory tax rates | $ | (1,366,000 | ) | $ | (1,669,000 | ) | ||
| Change in statutory, foreign tax, foreign exchange rates and other | 798,000 | (181,000 | ) | |||||
| Permanent differences | 180,000 | 496,000 | ||||||
| Adjustment to prior years provision versus statutory tax returns and expiry of non-capital losses | (48,000 | ) | - | |||||
| Change in unrecognized deductible temporary difference | 436,000 | 1,354,000 | ||||||
| Income tax recovery | $ | - | $ | - | ||||
Significant components of deferred tax assets (liabilities) that have not been included on the Company’s consolidated balance sheet are as follows:
- 60 -
RISE GOLD CORP. (FORMERLY RISE RESOURCES INC.)
(An Exploration Stage Company)
NOTES TO THE CONSOLIDATED FINANCIAL STATEMENTS
FOR THE YEAR ENDED JULY 31, 2018
(Expressed in Canadian Dollars)
| 11. | INCOME TAXES (cont’d…) |
| 2018 | 2017 | |||||||
| Deferred tax assets (liabilities): | ||||||||
| Mineral property interest | $ | 525,000 | $ | 58,000 | ||||
| Equipment | (19,000 | ) | - | |||||
| Net operating loss carry-forwards | 1,845,000 | 1,857,000 | ||||||
| Unrecognized deferred tax assets | (2,351,000 | ) | (1,915,000 | ) | ||||
| Net deferred tax assets | $ | - | $ | - | ||||
The Company has approximately $8,136,000 (2017 - $4,610,000) in net operating losses which may be carried forward and applied against taxable income in future years. Net operating loss carry-forwards, if not utilized, start to expire in 2027 (2017- 2027). The benefits of these losses and other tax assets have not been recognized in these consolidated financial statements.
Tax attributes are subject to review and potential adjustments by tax authorities.
| 12. | SUPPLEMENTAL DISCLOSURE WITH RESPECT TO CASH FLOWS |
During the year ended July 31, 2018, the Company:
| a) | Issued 417,184 units, each unit comprised of one share of common stock and one share purchase warrant, valued at $60,491, pursuant to a settlement of debt in relation to $95,952 in finders’ fees payable on the private placement which closed on May 5, 2017 (Note 10); and |
| b) | As at July 31, 2018, $715,672 of equipment costs is included in equipment loan payable (Note 6); and |
| c) | Issued 396,460 finders’ warrants valued at $30,810 (Note 10); |
During the year ended July 31, 2017, the Company:
| d) | Issued 1,577,388 finders’ warrants valued at $293,291 (Note 10); |
| e) | Issued 920,000 units, each unit comprising one share of common stock and one share purchase warrant, valued at $184,000 pursuant to a mineral property acquisition (Note 9); and |
| f) | Accrued $103,092 in share issuance costs through accounts payable and accrued liabilities. |
| 13. | SEGMENTED INFORMATION |
A reporting segment is defined as a component of the Company that:
| - | Engages in business activities from which it may earn revenues and incur expenses; |
| - | Operating results are reviewed regularly by the entity’s chief operating decision maker; and |
| - | Discrete financial information is available |
The Company has determined that it operates its business in one geographical segment located in California, United States, where all of its equipment and mineral property interests are located.
- 61 -
RISE GOLD CORP. (FORMERLY RISE RESOURCES INC.)
(An Exploration Stage Company)
NOTES TO THE CONSOLIDATED FINANCIAL STATEMENTS
FOR THE YEAR ENDED JULY 31, 2018
(Expressed in Canadian Dollars)
| 14. | SUBSEQUENT EVENTS |
Subsequent to July 31, 2018, the Company:
| a) | Received an advance from the CEO of the Company for $38,000, which was subsequently repaid in full. |
| b) | Received an advance from Willian Brinkman for $50,000. This advance was later assigned to the CEO of the Company. As of the date of these statements, this balance remains outstanding. |
| c) | Completed a first tranche of a non-brokered private placement, issuing an aggregate of 2,881,250 units at a price of $0.08 per unit for gross proceeds of $230,500. Each unit consists of one share of common stock and one share purchase warrant exercisable into one share of common stock at a price of $0.12 for a period of three years from the date of issuance until August 31, 2021. |
| d) | Completed a second tranche of a non-brokered private placement, issuing an aggregate of 2,003,125 units at a price of $0.08 per unit for gross proceeds of $160,250. Each unit consists of one share of common stock and one share purchase warrant exercisable into one share of common stock at a price of $0.12 for a period of three years from the date of issuance until September 17, 2021. |
| e) | Completed a strategic initial investment in a financing of $1.75 million by issuing 17,500,000 Units to Meridian Jerritt Canyon Corp., a wholly-owned subsidiary of Yamana Gold Inc. Each unit consists of one common stock at a price of $0.10 per Unit and one-half of one share purchase warrant at a price of $0.13 exercisable until October 16, 2020. As a result of the investment, the investor owns approximately 12.6% of the Company’s issued and outstanding shares on a non-diluted basis. In conjunction with the investment, the Company will issue 875,000 share purchase warrants as a finder’s fee (“Finder’s Warrants”) to Southern Arc Minerals Inc. Each finder’s Warrant entitles the holder to acquire one share at an exercise price of $0.13 until October 16, 2020. |
- 62 -
| Item 9. | Changes in and Disagreements With Accountants on Accounting and Financial Disclosure. |
None.
| Item 9A. | Controls and Procedures |
Evaluation of Disclosure Controls and Procedures
The United States Securities and Exchange Commission (the “SEC”) defines the term “disclosure controls and procedures” to mean controls and other procedures of an issuer that are designed to ensure that information required to be disclosed in the reports that it files or submits under the Exchange Act is recorded, processed, summarized and reported, within the time periods specified in the SEC’s rules and forms. Disclosure controls and procedures include, without limitation, controls and procedures designed to ensure that information required to be disclosed by an issuer in the reports that it files or submits under the Exchange Act is accumulated and communicated to the issuer’s management, including its principal executive and principal financial officers, or persons performing similar functions, as appropriate to allow timely decisions regarding required disclosure.
As of the end of the period covered by this Report, our management carried out an evaluation, with the participation of its Chief Executive Officer and Chief Financial Officer, of the effectiveness of the design and operation of our disclosure controls and procedures. Based on this evaluation, management concluded that our disclosure controls and procedures were not effective as of July 31, 2018 because of a material weakness in internal control over financial reporting that existed as of that date, as more fully described below.
Management’s Annual Report on Internal Control over Financial Reporting
Our management is responsible for establishing and maintaining adequate internal control over financial reporting. Internal control over financial reporting is a process designed to provide reasonable assurance regarding the reliability of financial reporting and the preparation of financial statements for external purposes in accordance with generally accepted accounting principles. A company’s internal control over financial reporting includes those policies and procedures that (i) pertain to the maintenance of records that, in reasonable detail, accurately and fairly reflect the transactions and dispositions of the assets of the company; (ii) provide reasonable assurance that transactions are recorded as necessary to permit preparation of financial statements in accordance with generally accepted accounting principles, and that receipts and expenditures of the company are being made only in accordance with authorizations of management and directors of the company; and (iii) provide reasonable assurance regarding prevention or timely detection of unauthorized acquisition, use or disposition of the company’s assets that could have a material effect on the financial statements.
We carried out an evaluation, with the participation of its Chief Executive Officer and Chief Financial Officer, of the effectiveness of its internal control over financial reporting as of July 31, 2018. In making this assessment, management used the criteria set forth by the Committee of Sponsoring Organizations of the Treadway Commission (“COSO”) in Internal Control-Integrated 2013 Framework. Management concluded that our company’s internal control over financial reporting was not effective as of July 31, 2018 because a material weakness in internal control over financial reporting existed as of that date as a result of a lack of segregation of incompatible duties due to insufficient personnel. A material weakness is a deficiency or a combination of control deficiencies in internal control over financial reporting such that there is a reasonable possibility that a material misstatement of annual or interim financial statements will not be prevented or detected on a timely basis.
- 63 -
This annual report does not include an attestation report of our independent registered public accounting firm regarding internal control over financial reporting. Management’s report was not subject to attestation by our independent registered public accounting firm pursuant to a provision under the Dodd-Frank Wall Street Reform and Consumer Protection Act which grants a permanent exemption for non-accelerated filers from complying with Section 404(b) of the Sarbanes-Oxley Act of 2002.
Changes in Internal Control over Financial Reporting
There were no changes in our company’s internal control over financial reporting during the period ended July 31, 2018 that have materially affected, or are reasonably likely to materially affect, its internal control over financial reporting.
| Item 9B. | Other Information. |
None.
PART III
| Item 10. | Directors, Executive Officers and Corporate Governance. |
The names, ages and titles of the members of our Board of Directors and our executive officers are as follows:
| Name | Age | Position |
| Benjamin W. Mossman | 41 | Chief Executive Officer, President, Director |
| Vince W. Boon | 37 | Chief Financial Officer, Treasurer |
| John D. Anderson | 54 | Director |
| John G. Proust | 59 | Director |
| Thomas I. Vehrs | 71 | Director |
Directors serve as such until our next annual stockholder meeting, or until their successors are elected and qualified. Officers hold their positions at the will of the Board of Directors. As of July 31, 2018, there were no arrangements, agreements or understandings between non-management security holders and management under which non-management security holders may directly or indirectly participate in or influence the management of our company’s affairs other than as disclosed in this Report.
Benjamin W. Mossman, Chief Executive Officer, President, Director
Benjamin W. Mossman, P.Eng, was appointed as our Chief Executive Officer and a director on August 1, 2016 and our President on April 20, 2017. Mr. Mossman is a mining engineer with over 15 years of experience in the mining industry including experience in capital markets, project evaluation, acquisitions, and mine operations and development. He was formerly the President, Chief Executive Officer and a director of Banks Island Gold Ltd., a dormant mining company, formerly listed on the TSX Venture Exchange and currently in receivership. See “Involvement in Certain Legal Proceedings” below.
Vince Boon, Chief Financial Officer, Treasurer
Vince Boon was appointed as our Chief Financial Officer on May 1, 2018 and Treasurer on May 16, 2018. Mr. Boon is a chartered accountant with over ten years of professional accounting experience with private and public companies focusing on financial reporting, regulatory compliance, internal control and corporate finance activities. Mr. Boon’s experience includes financial reporting for both Canadian and U.S. listed companies with international subsidiaries, strategic planning, tax planning, corporate
- 64 -
governance, equity financings and due diligence for acquisitions. Mr. Boon is currently the CFO/Corporate Secretary of Japan Gold Corp., and the CFO of Southern Arc Minerals Inc., Canada Energy Partners Inc., Lincoln Ventures Ltd. and Tethyan Resources plc. Mr. Boon holds a Bachelor of Science degree from the University of British Columbia and is a Chartered Professional Accountant, CPA, CA.
John D. Anderson, Director
John D. Anderson was appointed to our Board of Directors on August 31, 2016. He was the co-founder of Aquastone Capital Advisors LP, a U.S.-based gold investment fund. With over 20 years of experience in the capital markets, Mr. Anderson’s specialty is identifying undervalued opportunities in the resource industry and investing capital into these situations. He has been involved in a number of small-cap companies, providing financing, investor relations and corporate development services. Throughout his career, Mr. Anderson has raised in excess of US$500-million in equity for a number of public and private companies in the United States, Canada and Europe. Mr. Anderson holds a Bachelor of Arts degree from the University of Western Ontario.
John G. Proust, Director
John G. Proust was appointed to our Board of Directors on April 18, 2018. Mr. Proust has founded and managed a number of resource companies over the past 30 years. Mr. Proust has served on several boards and held senior operating positions and has directed and advised public and private companies regarding debt and equity financing, mergers and acquisitions and corporate restructuring since 1986. Mr. Proust is currently Chairman and CEO of Southern Arc Minerals Inc., which is one of our major stockholders; Chairman and CEO of Japan Gold Corp.; Chairman and a director of Canada Energy Partners Inc.; non-executive Chairman and director of Tethyan Resources plc; President and a director of Lincoln Ventures Ltd and a director of Pinedale Energy Limited. Mr. Proust has extensive experience in corporate governance, is a graduate of The Directors College, Michael G. De Groote School of Business at McMaster University and holds the designation of Chartered Director.
Thomas I. Vehrs, Director
Thomas I. Vehrs was appointed to our Board of Directors on April 20, 2017. Dr. Vehrs is a highly regarded and experienced exploration geologist with over 40 years of experience in the Americas. During his career, Dr. Vehrs has conducted and managed numerous exploration programs resulting in the discovery and delineation of major copper, gold and silver deposits, including the Los Pelambres porphyry copper deposit in Chile, the Northumberland sediment-hosted gold deposit in central Nevada, the Rio Blanco porphyry copper deposit in northern Peru and orogenic gold deposits in Central Guatemala. For the past ten years, Dr. Vehrs held the position of Vice President of Exploration for Fortuna Silver Mines and was responsible for the development and execution of exploration programs at the Caylloma Mine in Peru and the San Jose Mine in southern Mexico. During this period, Fortuna Silver Mines was successful in expanding the resources, reserves and production rate at the San Jose Mine resulting in a market capitalization in excess of $1 billion. Dr. Vehrs holds a Ph.D. in geology from Syracuse University and served as an officer in the U.S. Army Corps of Engineers.
None of our directors has been a director of any other company with a class of securities registered pursuant to section 12 of the Exchange Act or subject to the requirements of section 15(d) of the Exchange Act, or any company registered as an investment company under the Investment Company Act of 1940, during the past five years.
Family Relationships
There are no family relationships among any of our directors or executive officers.
- 65 -
Involvement in Certain Legal Proceedings
Except as disclosed below, during the past ten years none of the persons serving as our executive officers and/or directors have been the subject of any of the following legal proceedings that are required to be disclosed pursuant to Item 401(f) of Regulation S-K, including: (a) any bankruptcy petition filed by or against any business of which such person was a general partner or executive officer either at the time of the bankruptcy or within two years prior to that time; (b) any criminal convictions (excluding traffic violations and other minor offenses); (c) any order, judgment, or decree permanently or temporarily enjoining, barring, suspending or otherwise limiting his involvement in any type of business, securities or banking activities; (d) any finding by a court, the SEC or the CFTC to have violated a federal or state securities or commodities law, any law or regulation respecting financial institutions or insurance companies, or any law or regulation prohibiting mail or wire fraud; or (e) any sanction or order of any self-regulatory organization or registered entity or equivalent exchange, association, entity or other organization that has disciplinary authority over its members or persons associated with a member. Further, no such legal proceedings are believed to be contemplated by governmental authorities against any director or executive officer.
Benjamin W. Mossman was a director and officer of Banks Island Gold Ltd. (“Banks”) during the time it assigned itself into bankruptcy on January 7, 2016. Banks appointed D. Manning & Associates as trustee in the bankruptcy proceedings. Subsequent to the bankruptcy, a Receiver, FTI Consulting, was appointed as receiver by a major secured creditor. On April 4, 2018, the Trustee was discharged. To the best of Mr. Mossman’s knowledge, the secured creditor has not taken possession of the property as of this date. To date, Banks remains undischarged from the bankruptcy proceeding.
Benjamin W. Mossman, along with two other former employees of Banks and Banks itself are subject to summary conviction proceedings commenced in August 2016 for alleged violations of the British Columbia provincial Environmental Management Act, the Provincial Water Act, and the federal Fisheries Act. Banks was a company listed on the TSX Venture Exchange at the time of the alleged infractions and traded under the symbol “BOZ”. The charges are related to the active mining operations conducted by Banks at and on Banks Island, BC during the period from 2014 to 2016. The court found Mr. Mossman not guilty, and acquitted of all charges, specifically the charges related to alleged pollution, under the Fisheries and Water Act. He was acquitted of all but two minor offences under the Environmental Management Act. All charges were dropped against one former employee and the court dismissed all charges against the other former employee. Mr. Mossman awaits the results of the sentencing hearing. The Crown sought minor fines. Defense counsel sought even lower fines. Appeals were filed by both the Crown and defense and will be heard in 2019.
Section 16(a) Beneficial Ownership Compliance
Section 16(a) of the Exchange Act requires a company’s directors and officers, and persons who own more than 10% of any class of a company’s equity securities which are registered under Section 12 of the Exchange Act, to file with the SEC initial statements of beneficial ownership, reports of changes in ownership and annual reports concerning their ownership of our common shares and other equity securities, on Forms 3, 4 and 5, respectively. Such officers, directors and 10% stockholders are also required to furnish the company with copies of all Section 16(a) reports they file. Based solely on our review of the copies of such forms received by it, or written representations from the reporting persons as of the date of this Report, it believes that all Section 16(a) filing requirement applicable to its directors, officers and 10% stockholders with respect to the fiscal year ended July 31, 2018 have been fulfilled with the following exceptions:
During the fiscal year ended July 31, 2018, the number of late filings and number of transactions not reported on a timely basis for each named person was as follows: Benjamin Mossman, 3 reports and 3
- 66 -
transactions; John Proust, 1 report and 0 transactions; Alan Edwards, 1 report and 1 transaction; Thomas Vehrs, 1 report and 1 transaction; John Anderson, 2 reports not filed.
Audit Committee Financial Expert
John Anderson is an “audit committee financial expert” within the meaning of Item 401(h)(1) of Regulation S-K. In general, an “audit committee financial expert” is an individual member of the audit committee who (a) understands generally accepted accounting principles and financial statements, (b) is able to assess the general application of such principles in connection with the accounting for estimates, reserves and accruals, (c) has experience preparing, auditing, analyzing or evaluating financial statements comparable to the breadth and complexity of issues that can reasonably be expected to be raised by a company’s financial statements, (d) understands internal controls over financial reporting, and (e) understands audit committee functions. We have determined that Mr. Anderson is an independent director as defined in Nasdaq Listing Rule 5605(a)(2).
Nomination of Directors
The Corporation does not have a formal process or committee for proposing new nominees for election to the Board or for stockholders to make such nominations. Management is in contact with individuals involved in the mineral exploration sector, and in the event that we require any new directors, such individuals will be brought to the attention of the Board. Management will conduct reference and background checks on suitable candidates. New nominees generally must have a track record in business management, areas of strategic interest to our company, the ability to devote the time required to carry out the obligations and responsibilities of a director and a willingness to serve in that capacity.
Code of Ethics
During our fiscal year ended July 31, 2008, the Board of Directors adopted a written Code of Ethics within the meaning of Item 406(b) of Regulation S-K under the Securities Act. The Code of Ethics obligates our directors, officers and employees to disclose potential conflicts of interest and prohibits those persons from engaging in such transactions without the Board’s consent.
| Item 11. | Executive Compensation. |
The following table sets forth information with respect to the compensation awarded or paid to Benjamin W. Mossman, our Chief Executive Officer, President and a director (the “Named Executive Officer”), for all services rendered in all capacities to our company during the past two fiscal years. As of July 31, 2018, we did not have any other executive officers or former executive officers who had received total compensation in excess of US$100,000 during the fiscal year ended July 31, 2018. Pursuant to Item 402(m)(4) of Regulation S-K, we have omitted certain columns from the table since there was no compensation awarded to, earned by or paid to the Named Executive Officer that was required to be reported in such columns in either year.
| Summary Compensation Table | |||||
| Name and Principal Position | Year Ended July 31 | Salary
($) |
Stock Awards ($) | Option
Awards ($) (1) |
Total
($) |
| Benjamin W. Mossman, Chief Executive Officer (2) | 2018 | 180,000 | - | 277,638 | 457,638 |
| 2017 | 135,000 | 60,000 (2) | 570,255 (3) | 765,255 | |
- 67 -
| (1) | See Note 9 of the notes to our audited financial statements included in this Report for a description of the assumptions made in the valuation of option awards. |
| (2) | Benjamin Mossman was appointed as our Chief Executive Officer on August 1, 2016. In connection with the appointment, he was granted 400,000 shares of common stock at $0.15 per share. |
| (3) | Represents share-based payments related to options vesting during the years presented. |
Outstanding Equity Awards at Fiscal Year-End
The following table sets forth information relating to the options held by the Named Executive Officer as of July 31, 2018:
| Outstanding Equity Awards at Fiscal Year-End | |||||
| Name | Number of Securities Underlying Unexercised Options Exercisable | Option
Exercise Price ($) |
Option Expiration Date | Number of Shares That Have Not Vested | Market Value of Shares That Have Not Vested ($) |
| Benjamin W. Mossman | 2,631,000 586,600 2,142,542 |
0.12 0.20 0.24 |
April 23, 2023 August 8, 2021 December 27, 2021 |
Nil | Nil |
- 68 -
Employment Agreements
On July 7, 2016, we entered into an executive employment agreement with Benjamin W. Mossman, our Chief Executive Officer, pursuant to which we engaged Mr. Mossman’s services on an ongoing basis beginning on August 1, 2016. Pursuant to the agreement, we issued 400,000 shares of common stock to Mr. Mossman as a signing bonus on August 1, 2016, granted options to purchase 586,600 shares of common stock to Mr. Mossman at a price of $0.20 per share for a period of five years on the same date, and were required to pay Mr. Mossman an annual salary of $120,000. On April 19, 2017, we entered into a new executive employment agreement with Mr. Mossman, which was amended on April 16, 2018 (the “Executive Employment Agreement”) to replace the original agreement. The Executive Employment Agreement, which commenced on May 1, 2017, provides for an annual salary of $180,000 per year and that Mr. Mossman will, subject to the terms of the stock option plan and exchange policies, be granted options from time to time to maintain his right to purchase 5% of our issued and outstanding common stock. To date, Mr. Mossman has been granted options to acquire 5,360,142 shares of common stock pursuant to the terms of his Executive Employment Agreement.
The Executive Employment Agreement includes compensation provisions for Mr. Mossman if there is a change of control, he is terminated without just cause, he resigns under circumstances contemplated in the Executive Employment Agreement or he dies while in our employment. If there is a change of control and Mr. Mossman is terminated within one (1) year of the date of a change of control or if Mr. Mossman terminates his employment with us upon the occurrence of certain events, including a material adverse and fundamental change in his overall authority and responsibilities, Mr. Mossman will be entitled to a lump sum amount equal to three (3) years of Mr. Mossman’s then applicable annual salary. If Mr. Mossman is otherwise terminated without just cause, Mr. Mossman will be entitled to an amount equal to three (3) months of Mr. Mossman’s then applicable annual salary and will also be entitled to maintain in effect, until the earliest of the expiration of 18 months and the death of Mr. Mossman, participation in certain of our benefit plans and stock option plans. If Mr. Mossman dies while employed with us, Mr. Mossman’s estate, subject to compliance with stock exchange requirements, our stock option plan, and the terms of the Executive Employment Agreement, will be entitled to continue Mr. Mossman’s participation in our stock option plan.
Other than Mr. Mossman, who devotes all of his working time to our business, we expect that our executive officers will allocate approximately 40% of their working time to our business.
Benefit Plans
We do not currently have any pension plan, profit sharing plan or similar plan for the benefit of our officers, directors or employees; however, we may establish such plans in the future.
Director Compensation
Our directors are compensated for serving on the Board of Directors. Management directors are not paid fees for services as a director; however, they may receive compensation for their services as employees or
- 69 -
The following table sets out compensation for the year ended July 31, 2018 of those individuals who served as directors during that year but did not qualify as Named Executive Officers.
| Name | Fees Earned or Paid in Cash ($) |
Option Awards ($) (1) | Total ($) |
| John D. Anderson | 32,358 | 26,381 (5) | 58,739 |
| Thomas I. Vehrs | 25,723 (3) | 26,381 (5) | 52,104 |
| John G. Proust (2) | 6,548 | 126,631 (5) | 133,179 |
Alan R. Edwards (4) (Former Director and Chairman) |
34,941 (3) | 31,658 (5) | 66,599 |
| (1) | See Note 10 of the notes to our audited financial statements included in this Report for a description of the assumptions made in the valuation of option awards. |
| (2) | Mr. Proust was appointed a director on April 17, 2018. |
| (3) | Represents directors’ fees. Dr. Vehrs and Mr. Edwards were paid directors’ fees of US$20,000 and US$30,000 for the year, respectively, both payable in quarterly installments. |
| (4) | Mr. Edwards resigned as a director and as Chairman on September 6, 2018. |
| (5) | Represents share-based payments related to options granted during the year ended July 31, 2018. |
| Item 12. | Security Ownership of Certain Beneficial Owners and Management and Related Stockholder Matters. |
As of October 25, 2018, we had 138,490,357 shares of common stock issued and outstanding. The following table sets forth the beneficial ownership of our common stock as of October 25, 2018 by (a) each person who serves as a director and/or is identified as a “Named Executive Officer” of Rise in Item 11, “Executive Compensation,” above, and by all of our current directors and executive officers as a group, and (b) each person known by us to beneficially own more than 5.0% of any class of our voting securities.
A person is considered to beneficially own any shares over which such person, directly or indirectly, exercises sole or shared voting or investment power, or over which such person has the right to acquire beneficial ownership at any time within 60 days through an exercise of stock options or warrants or otherwise. Unless otherwise indicated, voting and investment power relating to the shares shown in the table for our officers and directors is exercised solely by the beneficial owner thereof.
For the purposes of this table, a person or group of persons is deemed to have “beneficial ownership” of any shares of our common stock that such person or group of persons has the right to acquire within 60 days. For the purposes of computing the percentage of outstanding shares of our common stock held by each person or group of persons named below, any shares that such person or group of persons has the right to acquire within 60 days of October 25, 2018 is deemed to be outstanding, but is not deemed to be outstanding for the purpose of computing the percentage ownership of any other person. The inclusion herein of any shares listed as beneficially owned does not constitute an admission of beneficial ownership.
Name
and Address of |
Amount
and |
Percent
of | ||
| Named Executive Officers and Directors | ||||
| Benjamin W.
Mossman Suite 650 - 669 Howe Street Vancouver, BC Canada V6C 0B4 |
6,074,142 (2) | 4.2% | ||
| John D.
Anderson Suite 650 - 669 Howe Street Vancouver, BC Canada V6C 0B4 |
750,000 (3) | * | ||
| John
G. Proust Suite 650 - 669 Howe Street Vancouver, BC Canada V6C 0B4 |
42,075,000 (4)(7) | 26.2% | ||
| Thomas I.
Vehrs 853 Windflower Drive Longmont, Colorado 80504 |
650,000 (5) | * | ||
| Executive Officers and Directors as a Group (5 persons) | 49,849,142 (2)(3)(4)(5)(6)(7) | 29.7% | ||
| 5% Owners | ||||
| Southern
Arc Minerals Inc. Suite 650, 669 Howe Street Vancouver, BC V6C 0B4 |
40,875,000 (7) | 25.6% | ||
| Yamana Gold Inc. | ||||
| Royal
Bank Plaza, North Tower 200 Bay Street, Suite 2200 Toronto, Ontario M5J 2J3 |
26,250,000 (8) | 17.8% | ||
| Bradley
Scharfe 488 – 1090 West Georgia Street Vancouver, British Columbia V6E 3V7 |
7,879,832 (9) | 5.6% |
| (1) | Based on 138,490,357 shares of common stock issued and outstanding as of October 25, 2018. | |
| (2) | Benjamin W. Mossman, our Chief Executive Officer, President and a director, holds 714,000 shares of common stock and 5,360,142 stock options, 586,600 of which are exercisable into common stock at a price of $0.20 per share until August 8, 2021, 2,142,542 of which are exercisable into common stock at a price of $0.24 per share until December 27, 2021 and 2,631,000 options exercisable at $0.12 per share until April 18, 2023. |
| (3) | John D. Anderson, a director, holds 500,000 stock options, each of which is exercisable into common stock at a price of $0.27 per share until April 3, 2022 and 250,000 stock options, each of which is exercisable into common stock at a price of $0.12 per share until April 18, 2023. |
| (4) | John G. Proust, a director, holds 1,200,000 stock options, each of which is exercisable into common stock at a price of $0.12 per share until April 18, 2023. Mr. Proust is the Chairman and CEO and a director of Southern Arc Minerals Inc. See note (7). |
| (5) | Thomas I. Vehrs, a director, holds 400,000 stock options, each of which is exercisable into common stock at a price of $0.28 per share until April 20, 2020 and 250,000 stock options, each of which is exercisable into common stock at a price of $0.12 per share until April 18, 2023. |
| (6) | Includes 300,000 stock options, each of which is exercisable into common stock at a price of $0.12 per share until April 18, 2023 held by Vince Boon, our Chief Financial Officer and Treasurer. |
- 70 -
| (7) | Southern Arc Minerals Inc. holds 20,000,000 shares of common stock, warrants to purchase 20,000,000 shares of common stock at a price of $0.15 per share until April 18, 2021 and warrants to purchase an additional 875,000 shares of common stock at a price of $0.13 per share until October 15, 2020. John G. Proust, one of our directors, is also the Chairman and CEO and a director of Southern Arc Minerals Inc. | |
| (8) | Beneficially owned through Meridian Jerritt Canyon Corp., a wholly owned subsidiary of Yamana Gold Inc. Includes 17,500,000 shares of common stock and warrants to purchase 8,750,000 shares of common stock at a price of $0.13 per share until October 16, 2020. | |
| (9) | 5,963,379 shares of common stock and warrants to purchase 874,435 shares of common stock are held by Scharfe Holdings Inc., a corporation over which Mr. Scharfe has sole voting and investment power and 8,696 shares of common stock and warrants to purchase 8,696 shares of common stock represent Mr. Scharfe’s share of securities held by Scharfe Investment Group of Companies Inc., a company 50% owned by Mr. Scharfe. Mr. Scharfe also holds 30,500 shares of common stock personally. Mr. Scharfe previously served as a director of Rise. He resigned as a director on April 20, 2017. | |
| (10) | Includes 5,213,166 shares of common stock, warrants to purchase 500,000 shares of common stock at a price of $0.40 per share until December 23, 2018, warrants to purchase 666,666 shares of common stock at a price of $0.25 per share until September 25, 2019 and warrants to purchase 1,500,000 shares of common stock at a price of $0.15 per share until April 18, 2021. |
| * | Less than 1%. |
Changes in Control
We are not aware of any arrangements, including any pledge by any person of its securities, the operation of which may at a subsequent date result in a change in control of our company.
Securities Authorized for Issuance Under Equity Compensation Plans
On March 23, 2016, the Board of Directors approved the adoption of an incentive stock option plan that provides for the granting of options representing up to 10% of our common stock to its directors, officers, employees and consultants (the “Plan”). As of July 31, 2018, options to purchase 11,610,142 shares at prices of between $0.12 and $0.28 per share are outstanding to 14 persons under the Plan.
We do not have any other compensation plans under which our equity securities are authorized for issuance.
- 71 -
Equity Compensation Plan Information
As of July 31, 2018
| Plan Category | Number of of | Weighted- average exercise price of outstanding options, warrants and rights | Number of remaining available for future issuance | |||||||||
| (a) | (b) | (c) | ||||||||||
| Equity compensation plans approved by shareholders | Nil | Nil | Nil | |||||||||
| Equity compensation plans not approved by shareholders | 11,610,142 | $ | 0.17 | 2,238,893 | ||||||||
| Total | 11,610,142 | $ | 0.17 | 2,238,893 | ||||||||
| Item 13. | Certain Relationships and Related Transactions, and Director Independence. |
On October 16, 2018, we entered into an agreement with Meridian Jerritt Canyon Corp. (“Meridian”), a wholly-owned subsidiary of Yamana Gold Inc., pursuant to which Meridian completed a strategic initial investment in our company of $1.75 million through the purchase of 17,500,000 units (the “Agreement”). Under the Agreement, Meridian has the right, for as long as it owns 5% or more of our outstanding shares of common stock, to participate in any of our future equity financings in order to maintain its percentage equity interest or to increase its equity ownership up to 19.9% of our issued and outstanding shares. In addition, Meridian will be permitted to nominate one individual to our Board of Directors and to appoint two members to our advisory committee. The Agreement also granted Meridian an exclusive right of first offer and first refusal for a period of six months following the closing of the financing, in respect of any proposed transfer or sale by us of any interest, including a joint venture interest, in all or any part of the I-M Mine Project, on terms and conditions to be agreed upon by the parties.
Director Independence
Because our common stock is not currently listed on a national securities exchange, we currently use the definition in Nasdaq Listing Rule 5605(a)(2) for determining director independence, which provides that an “independent director” is a person other than an executive officer or employee of the company or any other individual having a relationship which, in the opinion of the company’s Board of Directors, would interfere with the exercise of independent judgment in carrying out the responsibilities of a director. The Nasdaq listing rules provide that a director cannot be considered independent if:
| ● | the director is, or at any time during the past three years was, an employee of the company; |
| ● | the director or a family member of the director accepted any compensation from the company in excess of US$120,000 during any period of 12 consecutive months within the three years |
- 72 -
| preceding the independence determination (subject to certain exclusions, including, among other things, compensation for board or board committee service); |
| ● | a family member of the director is, or at any time during the past three years was, an executive officer of the company; |
| ● | the director or a family member of the director is a partner in, controlling stockholder of, or an executive officer of an entity to which the company made, or from which the company received, payments in the current or any of the past three fiscal years that exceed 5% of the recipient’s consolidated gross revenue for that year or US$200,000, whichever is greater (subject to certain exclusions); |
| ● | the director or a family member of the director is employed as an executive officer of an entity where, at any time during the past three years, any of the executive officers of the company served on the compensation committee of such other entity; or |
| ● | the director or a family member of the director is a current partner of the company’s outside auditor, or at any time during the past three years was a partner or employee of the company’s outside auditor, and who worked on the company’s audit. |
We have determined that John Anderson, John Proust, and Thomas Vehrs meet this definition of independence.
| Item 14. | Principal Accounting Fees and Services. |
The following table shows the fees billed by our company’s auditor, Davidson & Company LLP Chartered Accountants, for the fiscal years ended July 31, 2018 and 2017, and a summary of the services provided under each category follows the table:
July 31, 2018 ($) |
July
31, 2017 | |
| Audit Fees | 28,560 | 18,360 |
| Audit-Related Fees | 17,850 | 14,790 |
| Tax Fees | 32,800 | 17,200 |
| All Other Fees | - | - |
Audit Fees consist of fees billed for professional services rendered for the audit of the consolidated financial statements and review of the quarterly interim consolidated financial statements.
Audit-Related fees consist of the review of SEC comment letters and management responses.
Tax Fees consist of tax compliance fees and other tax planning advisory services.
All Other Fees: There were no fees billed by Davidson & Company for professional services rendered for other compliance purposes for the years ended July 31, 2018 and 2017.
Our Board of Directors has established pre-approval policies and procedures, pursuant to which the Board approved the foregoing audit and audit-related services provided by Davidson & Company in 2017 and 2016 consistent with the Board’s responsibility for engaging our company’s independent auditors. The Board also considered whether the non-audit services rendered by our independent registered public accounting firm are compatible with an auditor maintaining independence. The Board has determined that the rendering of such services is compatible with Davidson & Company maintaining its independence.
- 73 -
PART IV
| Item 15. | Exhibits, Financial Statement Schedules. |
| (a) | The following financial statements are being filed as part of this Report: |
Consolidated Financial Statements of Rise Gold Corp.
Report of Independent Registered Public Accounting Firm
Consolidated Balance Sheets as of July 31, 2018 and 2017
Consolidated Statement of Operations and Comprehensive Loss for the years ended July 31, 2018 and 2017
Consolidated Statement of Cash Flows for the years ended July 31, 2018 and 2017
Consolidated Statement of Stockholders’ Equity (Deficit) for the years ended July 31, 2018 and 2017
Notes to the Consolidated Financial Statements
| (b) | The following exhibits are being filed as part of this Report: |
| Number | Exhibit Description |
| 3.1 | Articles of Incorporation, as amended to date (1) |
| 3.2 | Bylaws (2) |
| 10.1 | Incentive Stock Option Plan dated March 23, 2016 (1) |
| 10.2 | Employment Agreement with Benjamin Mossman dated July 7, 2016 (1) |
| 10.3 | Employment Agreement with Benjamin Mossman dated as of April 19, 2017 (replacing Employment Agreement filed as Exhibit 10.2) (1) |
| 10.4 | April 16, 2018 Amendment to the Employment Agreement with Benjamin Mossman dated as of April 19, 2017 (7) |
| 10.5 | Geological Consulting Services Agreement with Fred Tejada effective as of April 20, 2017 (1) |
| 10.6 | Option Agreement with The Earl C & Erica Erickson Trust, Tangold, LLC, and The Estate of Mary Bouma dated August 30, 2016 (“Idaho-Maryland Option Agreement”) (3) |
| 10.7 | Extension of the Idaho-Maryland Option Agreement dated November 11, 2016 (3) |
| 10.8 | Extension of the Idaho-Maryland Option Agreement dated December 28, 2016 (3) |
| 10.9 | Option Agreement with Sierra Pacific Industries, Inc. dated January 6, 2017 (3) |
| 10.10 | Extension of the Sierra Pacific Industries, Inc. Option Agreement dated March 15, 2017 (4) |
| 10.11 | Extension of the Sierra Pacific Industries, Inc. Option Agreement dated June 7, 2017 (1) |
| 10.12 | Extension of the Sierra Pacific Industries, Inc. Option Agreement dated September 1, 2017 (5) |
| 10.13 | Settlement and Release Agreement with Klondike Gold Corp. dated July 17, 2017 |
- 74 -
| 10.14 | Consulting Services Agreement dated May 1, 2018 with Cale Thomas (7) |
| 10.15 | Consulting Agreement dated April 18, 2018 with J. Proust & Associates Inc. (7) |
| 14.1 | Code of Ethics (6) |
| 14.1 | Subsidiaries of the registrant (1) |
| 31.1 | Certificate of the Chief Executive Officer pursuant to Rule 13a-14(a) or 15d-14(a) under the Securities Exchange Act of 1934, as amended, as adopted pursuant to Section 302 of the Sarbanes-Oxley Act of 2002 |
| 31.2 | Certificate of the Chief Financial Officer pursuant to Rule 13a-14(a) or 15d-14(a) under the Securities Exchange Act of 1934, as amended, as adopted pursuant to Section 302 of the Sarbanes-Oxley Act of 2002 |
| 32.1 | Certificate of the Chief Executive Officer pursuant to 18 U.S.C. Section 1350, as adopted pursuant to Section 906 of the Sarbanes-Oxley Act of 2002 |
| 32.2 | Certificate of the Chief Financial Officer pursuant to 18 U.S.C. Section 1350, as adopted pursuant to Section 906 of the Sarbanes-Oxley Act of 2002 |
| 101.INS | XBRL Instance File |
| 101.SCH | XBRL Taxonomy Schema Linkbase Document |
| 101.CAL | XBRL Taxonomy Extension Calculation Linkbase Document. |
| 101.DEF | XBRL Taxonomy Extension Definition Linkbase Document |
| 101.LAB | XBRL Taxonomy Extension Label Linkbase Document |
| 101.PRE | XBRL Taxonomy Extension Presentation Linkbase Document |
| (1) | Included as an exhibit to our registration statement on Form S-1 filed on September 5, 2017 and incorporated herein by reference. |
| (2) | Included as an exhibit to our registration statement on Form S-1 filed on February 19, 2008 and incorporated herein by reference. |
| (3) | Included as an exhibit to our Form 10-Q report for the quarter ended January 31, 2018 filed on March 16, 2018 and incorporated herein by reference. |
| (4) | Included as an exhibit to our Form 10-Q report for the quarter ended April 30, 2018 filed on June 14, 2018 and incorporated herein by reference. |
| (5) | Included as an exhibit to our current report on Form 8-K filed on September 21, 2017 and incorporated here by reference. |
| (6) | Included as an exhibit to Amendment No. 1 to our annual report on Form 10-K filed on October 30, 2008 and incorporated here by reference. |
| (7) | Included as an exhibit to our registration statement on Form S-1 filed on May 29, 2018 and incorporated herein by reference. |
- 75 -
SIGNATURES
Pursuant to the requirements of Section 13 or 15(d) of the Securities Exchange Act of 1934, the registrant has duly caused this Report to be signed on its behalf by the undersigned, thereunto duly authorized.
Date: October 30, 2018
RISE GOLD CORP.
/s/ Benjamin Mossman
Benjamin Mossman
Chief Executive Officer and Director
Pursuant to the requirements of the Securities Exchange Act of 1934, this Report has been signed below by the following persons on behalf of the registrant and in the capacities and on the dates indicated.
/s/ Benjamin Mossman
Benjamin Mossman
Chief Executive Officer and Director
(Principal Executive Officer)
October 30, 2018
/s/ Vince Boon
Vincent Boon
Chief Financial Officer, Treasurer
(Principal Financial and Accounting Officer)
October 30, 2018
/s/ John Anderson
John Anderson
Director
October 30, 2018
/s/ John Proust
John Proust
Director
October 30, 2018
/s/ Thomas Vehrs
Dr. Thomas Vehrs
Director
October 30, 2018
- 76 -