Attached files
| file | filename |
|---|---|
| EX-99.1 - EXHIBIT 99.1 - RETAIL PROPERTIES OF AMERICA, INC. | ex-9919x30x18.htm |
| 8-K - 8-K - RETAIL PROPERTIES OF AMERICA, INC. | form8-k9x30x18.htm |
Exhibit 99.2


RETAIL PROPERTIES OF AMERICA, INC. REPORTS
THIRD QUARTER AND YEAR TO DATE RESULTS
Oak Brook, IL – October 30, 2018 – Retail Properties of America, Inc. (NYSE: RPAI) (the “Company”) today reported financial and operating results for the quarter and nine months ended September 30, 2018.
FINANCIAL RESULTS
For the quarter ended September 30, 2018, the Company reported:
▪ | Net income attributable to common shareholders of $12.8 million, or $0.06 per diluted share, compared to $33.5 million, or $0.15 per diluted share, for the same period in 2017; |
▪ | Funds from operations (FFO) attributable to common shareholders of $54.3 million, or $0.25 per diluted share, compared to $57.1 million, or $0.25 per diluted share, for the same period in 2017; and |
▪ | Operating funds from operations (Operating FFO) attributable to common shareholders of $58.0 million, or $0.26 per diluted share, compared to $59.3 million, or $0.26 per diluted share, for the same period in 2017. |
For the nine months ended September 30, 2018, the Company reported:
▪ | Net income attributable to common shareholders of $65.5 million, or $0.30 per diluted share, compared to $134.5 million, or $0.57 per diluted share, for the same period in 2017; |
▪ | FFO attributable to common shareholders of $164.3 million, or $0.75 per diluted share, compared to $118.3 million, or $0.51 per diluted share, for the same period in 2017; and |
▪ | Operating FFO attributable to common shareholders of $168.8 million, or $0.77 per diluted share, compared to $189.1 million, or $0.81 per diluted share, for the same period in 2017. |
OPERATING RESULTS
For the quarter ended September 30, 2018, the Company’s portfolio results were as follows:
▪ | 3.8% increase in same store net operating income (NOI) over the comparable period in 2017; |
▪ | Total same store portfolio percent leased, including leases signed but not commenced: 94.1% at September 30, 2018, up 50 basis points from 93.6% at June 30, 2018 and up 20 basis points from 93.9% at September 30, 2017; |
▪ | Retail portfolio percent leased, including leases signed but not commenced: 94.0% at September 30, 2018, up 50 basis points from 93.5% at June 30, 2018 and up 130 basis points from 92.7% at September 30, 2017; |
▪ | Retail portfolio annualized base rent (ABR) per occupied square foot of $19.36 at September 30, 2018, up 4.6% from $18.50 ABR per occupied square foot at September 30, 2017; |
▪ | 999,000 square feet of retail leasing transactions comprised of 140 new and renewal leases; and |
▪ | Positive comparable cash leasing spreads of 8.0% on new leases, containing 220 basis points of annual contractual rent increases, and 5.8% on renewal leases for a blended re-leasing spread of 6.3%. |
n Retail Properties of America, Inc.
T: 855.247.RPAI
www.rpai.com 2021 Spring Road, Suite 200
Oak Brook, IL 60523
For the nine months ended September 30, 2018, the Company’s portfolio results were as follows:
▪ | 2.1% increase in same store NOI over the comparable period in 2017; |
▪ | 2,325,000 square feet of retail leasing transactions comprised of 365 new and renewal leases; and |
▪ | Positive comparable cash leasing spreads of 8.7% on new leases, containing 220 basis points of annual contractual rent increases, and 5.5% on renewal leases for a blended re-leasing spread of 5.9%. |
“The RPAI team delivered yet another strong quarter led by our same store NOI growth of 3.8%,” stated Steve Grimes, chief executive officer. “Our operating portfolio continues to demonstrate its strength and resiliency, solidifying our conviction around our $400 million in expansion and redevelopment starts in 2019. Our balance sheet and liquidity are in check, our team is eager to grow, and we are operating on all fronts to capitalize on our value creation initiatives.”
INVESTMENT ACTIVITY
Acquisitions
The Company is under contract to acquire One Loudoun Uptown, a 58 acre land parcel, of which 32 acres are developable, located adjacent to One Loudoun Downtown, an existing multi-tenant retail asset located in the Washington, D.C. metropolitan statistical area, for a gross purchase price of $25.0 million. This transaction is expected to close during the fourth quarter of 2018, subject to satisfaction of customary closing conditions.
Dispositions
Year to date, the Company has completed property dispositions totaling $193.0 million, the sale of development air rights for $12.0 million and the sale of a land parcel and the rights to develop eight residential units at One Loudoun Downtown for $1.8 million.
The Company is under contract to sell one non-target multi-tenant retail asset for $8.5 million and one single-user retail asset for $25.9 million, both of which are expected to close during the fourth quarter of 2018, subject to satisfaction of customary closing conditions. The Company is also under contract to sell land and the rights to develop 22 residential units at One Loudoun Downtown for $5.0 million. The sale of land and development rights is expected to close in two phases by early 2019, subject to satisfaction of customary closing conditions.
One Loudoun Downtown Expansion – Joint Venture
During the quarter, the Company entered into a development joint venture agreement for the expansion of pads G and H at One Loudoun Downtown. The project encompasses the construction of 378 residential rental units and up to approximately 66,600 square feet of commercial space. The joint venture facilitates the construction and management of the residential units and construction of a portion of the commercial space, which will be delivered to the Company once complete.
BALANCE SHEET AND CAPITAL MARKETS ACTIVITY
As of September 30, 2018, the Company had approximately $1.6 billion of consolidated indebtedness with a weighted average contractual interest rate of 3.82%, a weighted average maturity of 5.1 years and a net debt to adjusted EBITDAre ratio of 5.1x.
During the quarter, the Company repaid $67.2 million of mortgage debt, excluding amortization, with a weighted average interest rate of 6.06% and incurred prepayment penalties of $4.8 million. In addition, the Company entered into two forward-starting interest rate swap agreements to effectively fix the interest rate on the Term Loan Due 2023 at 2.85%, plus the applicable credit spread, effective November 23, 2018, upon maturity of the existing swaps, through November 22, 2023.
ii
Year to date, the Company has repaid $178.0 million of total debt, excluding amortization, with a weighted average interest rate of 4.46% and incurred prepayment penalties of $5.8 million.
Common Stock Repurchases
To date in 2018, the Company has repurchased 4.1 million shares of common stock under its stock repurchase program at an average price per share of $12.12 for $49.7 million. These repurchases consist of (i) 2.6 million shares repurchased during the third quarter at an average price per share of $12.13 for $31.2 million, including 0.9 million shares repurchased in September 2018 for $10.5 million, which settled in October 2018 and (ii) 1.5 million shares repurchased in early October 2018 at an average price per share of $12.11 for $18.5 million.
2018 GUIDANCE
The Company expects to generate net income attributable to common shareholders of $0.36 to $0.38 per diluted share in 2018. The Company is maintaining its 2018 Operating FFO attributable to common shareholders guidance range of $1.00 to $1.02 per diluted share based, in part, on the following assumptions:
▪ | Same store NOI growth of 2.0% to 2.5%, no change from the midpoint of the previous range of 1.75% to 2.75%; |
▪ | Acquisitions of approximately $75 million including repurchases of common stock, an increase of $25 million from the midpoint of the previous range of $25 to $75 million; |
▪ | Property dispositions of approximately $200 million; and |
▪ | General and administrative expenses of $40 to $42 million, excluding the impact on earnings from executive separation. |
DIVIDEND
On October 24, 2018, the Company declared the fourth quarter 2018 quarterly cash dividend of $0.165625 per share on its outstanding Class A common stock, which will be paid on January 10, 2019 to Class A common shareholders of record on December 27, 2018.
WEBCAST AND CONFERENCE CALL INFORMATION
The Company’s management team will hold a webcast on Wednesday, October 31, 2018 at 11:00 AM (ET), to discuss its quarterly financial results and operating performance, as well as business highlights and outlook. In addition, the Company may discuss business and financial developments and trends and other matters affecting the Company, some of which may not have been previously disclosed.
A live webcast will be available online on the Company’s website at www.rpai.com in the INVEST section. A replay of the webcast will be available. To listen to the replay, please go to www.rpai.com in the INVEST section of the website and follow the instructions.
The conference call can be accessed by dialing (877) 705-6003 or (201) 493-6725 for international participants. Please dial in at least ten minutes prior to the start of the call to register. A replay of the call will be available from 2:00 PM (ET) on October 31, 2018 until midnight (ET) on November 14, 2018. The replay can be accessed by dialing (844) 512-2921 or (412) 317-6671 for international callers and entering pin number 13682719.
SUPPLEMENTAL INFORMATION
The Company has posted supplemental financial and operating information and other data in the INVEST section of its website.
ABOUT RPAI
Retail Properties of America, Inc. is a REIT that owns and operates high quality, strategically located open-air shopping centers, including properties with a mixed-use component. As of September 30,
iii
2018, the Company owned 105 retail operating properties in the United States representing 19.5 million square feet. The Company is publicly traded on the New York Stock Exchange under the ticker symbol RPAI. Additional information about the Company is available at www.rpai.com.
SAFE HARBOR LANGUAGE
The statements and certain other information contained in this press release, which can be identified by the use of forward-looking terminology such as “believes,” “expects,” “may,” “should,” “intends,” “plans,” “estimates” or “anticipates” and variations of such words or similar expressions or the negative of such words, constitute “forward-looking statements” within the meaning of Section 27A of the Securities Act of 1933, as amended, and Section 21E of the Securities Exchange Act of 1934, as amended, and are subject to the safe harbors created thereby. These forward-looking statements reflect the Company’s current views about its plans, intentions, expectations, strategies and prospects, which are based on the information currently available to the Company and on assumptions it has made. Although the Company believes that its plans, intentions, expectations, strategies and prospects as reflected in or suggested by those forward-looking statements are reasonable, the Company can give no assurance that such plans, intentions, expectations or strategies will be attained or achieved. Furthermore, these forward-looking statements should be considered as subject to the many risks and uncertainties that exist in the Company’s operations and business environment. Such risks and uncertainties could cause actual results to differ materially from those projected. These uncertainties include, but are not limited to, economic, business and financial conditions, and changes in the Company’s industry and changes in the real estate markets in particular, rental rates and/or vacancy rates, frequency and magnitude of defaults on, early terminations of or non-renewal of leases by tenants, bankruptcy or insolvency of a major tenant or a significant number of smaller tenants, adverse impact of e-commerce developments and shifting consumer retail behavior on tenants, interest rates or operating costs, real estate valuations, the availability, terms and deployment of capital, general volatility of the capital and credit markets and the market price of the Company’s Class A common stock, risks generally associated with real estate acquisitions and dispositions, including the Company’s ability to identify and pursue acquisition and disposition opportunities, risks generally associated with redevelopment, including the impact of construction delays and cost overruns, the Company’s ability to lease redeveloped space and identify and pursue redevelopment opportunities, competitive and cost factors, the Company’s ability to enter into new leases or renew leases on favorable terms, the Company’s ability to create long-term shareholder value, satisfaction of closing conditions to the pending transactions described herein, regulatory changes and other risk factors, including those detailed in the sections of the Company’s most recent Forms 10-K and 10-Q filed with the SEC titled “Risk Factors.” The Company assumes no obligation to update publicly any forward-looking statements, whether as a result of new information, future events or otherwise.
NON-GAAP FINANCIAL MEASURES
As defined by the National Association of Real Estate Investment Trusts (NAREIT), an industry trade group, Funds From Operations (FFO) means net income (loss) computed in accordance with generally accepted accounting principles (GAAP), excluding gains (or losses) from sales of depreciable real estate, plus depreciation and amortization and impairment charges on depreciable real estate. The Company has adopted the NAREIT definition in its computation of FFO attributable to common shareholders. The Company believes that, subject to the following limitations, FFO attributable to common shareholders provides a basis for comparing its performance and operations to those of other real estate investment trusts (REITs). The Company believes that FFO attributable to common shareholders, which is a supplemental non-GAAP financial measure, provides an additional and useful means to assess the operating performance of REITs. FFO attributable to common shareholders does not represent an alternative to (i) “Net income” or “Net income attributable to common shareholders” as an indicator of the Company’s financial performance, or (ii) “Cash flows from operating activities” in accordance with GAAP as a measure of the Company’s capacity to fund cash needs, including the payment of dividends.
The Company also reports Operating FFO attributable to common shareholders, which is defined as FFO attributable to common shareholders excluding the impact of discrete non-operating transactions and other events which the Company does not consider representative of the comparable operating results of its real estate operating portfolio, which is its core business platform. Specific examples of discrete non-operating transactions and other events include, but are not limited to, the impact on earnings from gains or losses associated with the early extinguishment of debt or other liabilities, gain on sale and impairment charges on assets other than depreciable real estate, litigation involving the Company, including actual or anticipated settlement and associated legal costs, the impact on earnings from executive separation and the excess of redemption value over carrying value of preferred stock redemption, which are not otherwise adjusted in the Company’s calculation of FFO attributable to common shareholders. The Company believes that Operating FFO attributable to common shareholders, which is a supplemental non-GAAP financial measure, provides an additional and useful means to assess the operating performance of REITs. Operating FFO attributable to common shareholders does not represent an alternative to (i) “Net income” or “Net income attributable to common shareholders” as an indicator of the Company’s financial performance, or (ii) “Cash flows from operating activities” in accordance with GAAP as a measure of the Company’s capacity to fund cash needs, including the payment of dividends. Comparison of the Company’s presentation of Operating FFO attributable to common shareholders to similarly titled measures for other REITs may not necessarily be meaningful due to possible differences in definition and application by such REITs.
iv
The Company also reports Net Operating Income (NOI), which it defines as all revenues other than straight-line rental income (non-cash), amortization of lease inducements, amortization of acquired above and below market lease intangibles and lease termination fee income, less real estate taxes and all operating expenses other than lease termination fee expense, straight-line ground rent expense (non-cash) and amortization of acquired ground lease intangibles (non-cash). NOI consists of Same Store NOI and NOI from Other Investment Properties. Same Store NOI for the three and nine months ended September 30, 2018 represents NOI from the Company’s same store portfolio consisting of 102 retail operating properties acquired or placed in service and stabilized prior to January 1, 2017. NOI from Other Investment Properties for the three and nine months ended September 30, 2018 represents NOI primarily from (i) properties acquired during 2017, (ii) Reisterstown Road Plaza, which is in active redevelopment, (iii) the redevelopment portion of Circle East, formerly known as Towson Circle, which is in active redevelopment, (iv) Carillon, formerly known as Boulevard at the Capital Centre, where the Company has begun activities in anticipation of future redevelopment, (v) the properties that were sold or held for sale in 2017 and 2018, including Schaumburg Towers, and (vi) the net income from the Company’s wholly-owned captive insurance company. The Company believes that NOI, Same Store NOI and NOI from Other Investment Properties, which are supplemental non-GAAP financial measures, provide an additional and useful operating perspective not immediately apparent from “Operating income” or “Net income attributable to common shareholders” in accordance with GAAP. The Company uses these measures to evaluate its performance on a property-by-property basis because they allow management to evaluate the impact that factors such as lease structure, lease rates and tenant base have on the Company’s operating results. NOI, Same Store NOI and NOI from Other Investment Properties do not represent alternatives to “Net income” or “Net income attributable to common shareholders” in accordance with GAAP as indicators of the Company’s financial performance. Comparison of the Company’s presentation of NOI, Same Store NOI and NOI from Other Investment Properties to similarly titled measures for other REITs may not necessarily be meaningful due to possible differences in definition and application by such REITs.
As defined by NAREIT, EBITDA for real estate (EBITDAre) means net income (loss) computed in accordance with GAAP, plus (i) interest expense, (ii) income tax expense, (iii) depreciation and amortization, (iv) impairment charges on depreciable property and (v) impairment charges on investments in unconsolidated affiliates if caused by a decrease in the value of depreciable property in the affiliate, plus or minus (i) gains (or losses) from sales of depreciable property, including gains (or losses) on change in control, and (ii) adjustments to reflect the entity’s share of EBITDAre of unconsolidated affiliates. The Company reports Adjusted EBITDAre, which excludes the impact of certain discrete non-operating transactions and other events such as (i) the impact on earnings from executive separation, (ii) impairment charges on non-depreciable real estate and (iii) gains on the sale of non-depreciable real estate, if any. The Company believes that Adjusted EBITDAre is useful because it allows investors and management to evaluate and compare the Company’s performance from period to period in a meaningful and consistent manner in addition to standard financial measurements under GAAP. Adjusted EBITDAre is a supplemental non-GAAP financial measure and should not be considered an alternative to “Net income” or “Net income attributable to common shareholders” as an indicator of the Company’s financial performance. Comparison of the Company’s presentation of Adjusted EBITDAre to similarly titled measures for other REITs may not necessarily be meaningful due to possible differences in definition and application by such REITs.
Net Debt to Adjusted EBITDAre is a supplemental non-GAAP financial measure and represents (i) the Company’s total notional debt, excluding unamortized premium, discount and capitalized loan fees, less cash and cash equivalents and disposition proceeds temporarily restricted related to potential Internal Revenue Code Section 1031 tax-deferred exchanges (1031 Exchanges) divided by (ii) Adjusted EBITDAre for the prior three months, annualized (Annualized Adjusted EBITDAre). The Company believes that this ratio is useful because it provides investors with information regarding its total notional debt net of cash and cash equivalents and disposition proceeds temporarily restricted related to potential 1031 Exchanges, which could be used to repay debt, compared to its performance as measured using Annualized Adjusted EBITDAre. Comparison of the Company’s presentation of Net Debt to Adjusted EBITDAre to similarly titled measures for other REITs may not necessarily be meaningful due to possible differences in definition and application by such REITs.
CONTACT INFORMATION
Julie Swinehart
Executive Vice President, Chief Financial Officer and Treasurer
Retail Properties of America, Inc.
(630) 634-4225
v
Retail Properties of America, Inc.
FFO Attributable to Common Shareholders and
Operating FFO Attributable to Common Shareholders Guidance
Per Share Guidance Range Full Year 2018 | ||||||||
Low | High | |||||||
Net income attributable to common shareholders | $ | 0.36 | $ | 0.38 | ||||
Depreciation and amortization of depreciable real estate | 0.79 | 0.79 | ||||||
Provision for impairment of investment properties | 0.01 | 0.01 | ||||||
Gain on sales of depreciable investment properties | (0.18 | ) | (0.18 | ) | ||||
FFO attributable to common shareholders | $ | 0.98 | $ | 1.00 | ||||
Impact on earnings from the early extinguishment of debt | 0.03 | 0.03 | ||||||
Gain on sale of non-depreciable investment property | (0.02 | ) | (0.02 | ) | ||||
Impact on earnings from executive separation | 0.01 | 0.01 | ||||||
Other | — | — | ||||||
Operating FFO attributable to common shareholders | $ | 1.00 | $ | 1.02 | ||||
vi
Retail Properties of America, Inc.
Condensed Consolidated Balance Sheets
(amounts in thousands, except par value amounts)
(unaudited)
September 30, 2018 | December 31, 2017 | |||||||
Assets | ||||||||
Investment properties: | ||||||||
Land | $ | 1,041,251 | $ | 1,066,705 | ||||
Building and other improvements | 3,588,653 | 3,686,200 | ||||||
Developments in progress | 23,106 | 33,022 | ||||||
4,653,010 | 4,785,927 | |||||||
Less accumulated depreciation | (1,281,367 | ) | (1,215,990 | ) | ||||
Net investment properties | 3,371,643 | 3,569,937 | ||||||
Cash and cash equivalents | 29,702 | 25,185 | ||||||
Accounts and notes receivable (net of allowances of $7,723 and $6,567, respectively) | 74,623 | 71,678 | ||||||
Acquired lease intangible assets, net | 103,386 | 122,646 | ||||||
Assets associated with investment properties held for sale | — | 3,647 | ||||||
Other assets, net | 78,102 | 125,171 | ||||||
Total assets | $ | 3,657,456 | $ | 3,918,264 | ||||
Liabilities and Equity | ||||||||
Liabilities: | ||||||||
Mortgages payable, net (includes unamortized premium of $837 and $1,024, respectively, unamortized discount of $(547) and $(579), respectively, and unamortized capitalized loan fees of $(388) and $(615), respectively) | $ | 206,104 | $ | 287,068 | ||||
Unsecured notes payable, net (includes unamortized discount of $(764) and $(853), respectively, and unamortized capitalized loan fees of $(3,027) and $(3,399), respectively) | 696,209 | 695,748 | ||||||
Unsecured term loans, net (includes unamortized capitalized loan fees of $(2,250) and $(2,730), respectively) | 447,750 | 547,270 | ||||||
Unsecured revolving line of credit | 209,000 | 216,000 | ||||||
Accounts payable and accrued expenses | 76,794 | 82,698 | ||||||
Distributions payable | 36,312 | 36,311 | ||||||
Acquired lease intangible liabilities, net | 89,351 | 97,971 | ||||||
Other liabilities | 76,557 | 69,498 | ||||||
Total liabilities | 1,838,077 | 2,032,564 | ||||||
Commitments and contingencies | ||||||||
Equity: | ||||||||
Preferred stock, $0.001 par value, 10,000 shares authorized, none issued or outstanding | — | — | ||||||
Class A common stock, $0.001 par value, 475,000 shares authorized, 217,852 and 219,237 shares issued and outstanding as of September 30, 2018 and December 31, 2017, respectively | 218 | 219 | ||||||
Additional paid-in capital | 4,547,158 | 4,574,428 | ||||||
Accumulated distributions in excess of earnings | (2,733,559 | ) | (2,690,021 | ) | ||||
Accumulated other comprehensive income | 5,562 | 1,074 | ||||||
Total equity | 1,819,379 | 1,885,700 | ||||||
Total liabilities and equity | $ | 3,657,456 | $ | 3,918,264 | ||||
3rd Quarter 2018 Supplemental Information | 1 | |
Retail Properties of America, Inc.
Condensed Consolidated Statements of Operations
(amounts in thousands, except per share amounts)
(unaudited)
Three Months Ended September 30, | Nine Months Ended September 30, | |||||||||||||||
2018 | 2017 | 2018 | 2017 | |||||||||||||
Revenues | ||||||||||||||||
Rental income | $ | 90,975 | $ | 100,977 | $ | 278,076 | $ | 316,968 | ||||||||
Tenant recovery income | 26,817 | 28,024 | 80,090 | 88,334 | ||||||||||||
Other property income | 1,345 | 1,518 | 4,977 | 6,249 | ||||||||||||
Total revenues | 119,137 | 130,519 | 363,143 | 411,551 | ||||||||||||
Expenses | ||||||||||||||||
Operating expenses | 17,596 | 19,572 | 57,235 | (a) | 62,440 | |||||||||||
Real estate taxes | 18,037 | 21,863 | 56,206 | 65,229 | ||||||||||||
Depreciation and amortization | 43,169 | 51,469 | 132,107 | 157,268 | ||||||||||||
Provision for impairment of investment properties | — | 45,822 | 1,316 | 58,856 | ||||||||||||
General and administrative expenses | 9,160 | 7,785 | 31,929 | 29,368 | ||||||||||||
Total expenses | 87,962 | 146,511 | 278,793 | 373,161 | ||||||||||||
Operating income (loss) | 31,175 | (15,992 | ) | 84,350 | 38,390 | |||||||||||
Interest expense | (21,336 | ) | (21,110 | ) | (56,918 | ) | (128,077 | ) | ||||||||
Other income (expense), net | 303 | (76 | ) | 853 | 380 | |||||||||||
Income (loss) from continuing operations | 10,142 | (37,178 | ) | 28,285 | (89,307 | ) | ||||||||||
Gain on sales of investment properties | 2,692 | 73,082 | 37,211 | 230,874 | ||||||||||||
Net income | 12,834 | 35,904 | 65,496 | 141,567 | ||||||||||||
Preferred stock dividends | — | (2,362 | ) | — | (7,087 | ) | ||||||||||
Net income attributable to common shareholders | $ | 12,834 | $ | 33,542 | $ | 65,496 | $ | 134,480 | ||||||||
Earnings per common share – basic | ||||||||||||||||
Net income per common share attributable to common shareholders | $ | 0.06 | $ | 0.15 | $ | 0.30 | $ | 0.58 | ||||||||
Earnings per common share – diluted | ||||||||||||||||
Net income per common share attributable to common shareholders | $ | 0.06 | $ | 0.15 | $ | 0.30 | $ | 0.57 | ||||||||
Weighted average number of common shares outstanding – basic | 218,808 | 229,508 | 218,879 | 233,348 | ||||||||||||
Weighted average number of common shares outstanding – diluted | 219,021 | 230,104 | 219,277 | 233,949 | ||||||||||||
(a) | Includes $1,900 of termination fees recorded during the second quarter of 2018 related to the Toys "R" Us auction process whereby the Company was the winning bidder on two leases. |
3rd Quarter 2018 Supplemental Information | 2 | |
Retail Properties of America, Inc.
Funds From Operations (FFO) Attributable to Common Shareholders,
Operating FFO Attributable to Common Shareholders and Additional Information
(dollar amounts in thousands, except per share amounts)
(unaudited)
FFO attributable to common shareholders and Operating FFO attributable to common shareholders (a) | |||||||||||||||
Three Months Ended September 30, | Nine Months Ended September 30, | ||||||||||||||
2018 | 2017 | 2018 | 2017 | ||||||||||||
Net income attributable to common shareholders | $ | 12,834 | $ | 33,542 | $ | 65,496 | $ | 134,480 | |||||||
Depreciation and amortization of depreciable real estate | 42,861 | 50,867 | 131,226 | 155,857 | |||||||||||
Provision for impairment of investment properties | — | 45,822 | 1,316 | 58,856 | |||||||||||
Gain on sales of depreciable investment properties | (1,407 | ) | (73,082 | ) | (33,747 | ) | (230,874 | ) | |||||||
FFO attributable to common shareholders | $ | 54,288 | $ | 57,149 | $ | 164,291 | $ | 118,319 | |||||||
FFO attributable to common shareholders per common share outstanding – diluted | $ | 0.25 | $ | 0.25 | $ | 0.75 | $ | 0.51 | |||||||
FFO attributable to common shareholders | $ | 54,288 | $ | 57,149 | $ | 164,291 | $ | 118,319 | |||||||
Impact on earnings from the early extinguishment of debt, net | 4,892 | 3,006 | 5,944 | 71,675 | |||||||||||
Provision for hedge ineffectiveness | — | 5 | — | 16 | |||||||||||
Gain on sale of non-depreciable investment property | (1,285 | ) | — | (3,464 | ) | — | |||||||||
Impact on earnings from executive separation (b) | — | (1,086 | ) | 1,737 | (1,086 | ) | |||||||||
Other (c) | 100 | 207 | 323 | 188 | |||||||||||
Operating FFO attributable to common shareholders | $ | 57,995 | $ | 59,281 | $ | 168,831 | $ | 189,112 | |||||||
Operating FFO attributable to common shareholders per common share outstanding – diluted | $ | 0.26 | $ | 0.26 | $ | 0.77 | $ | 0.81 | |||||||
Weighted average number of common shares outstanding – diluted | 219,021 | 230,104 | 219,277 | 233,949 | |||||||||||
Dividends declared per common share | $ | 0.165625 | $ | 0.165625 | $ | 0.496875 | $ | 0.496875 | |||||||
Additional Information (d) | |||||||||||||||
Lease-related expenditures (e) | |||||||||||||||
Same store | $ | 11,031 | $ | 6,002 | $ | 24,018 | $ | 19,704 | |||||||
Other investment properties (f) | $ | 201 | $ | 3,916 | $ | 8,251 | $ | 15,274 | |||||||
Capital expenditures (g) | |||||||||||||||
Same store | $ | 7,480 | $ | 7,681 | $ | 19,573 | $ | 20,184 | |||||||
Other investment properties (f) | $ | 1,998 | $ | 7,120 | $ | 5,481 | $ | 10,943 | |||||||
Straight-line rental income, net | $ | 946 | $ | 1,849 | $ | 4,826 | $ | 3,109 | |||||||
Amortization of above and below market lease intangibles and lease inducements | $ | 281 | $ | 240 | $ | 3,002 | $ | 938 | |||||||
Non-cash ground rent expense (h) | $ | 440 | $ | 534 | $ | 1,405 | $ | 1,617 | |||||||
Adjusted EBITDAre (a) | $ | 74,647 | $ | 80,137 | $ | 220,363 | $ | 253,808 | |||||||
(a) | Refer to pages 20 – 21 for definitions of FFO attributable to common shareholders, Operating FFO attributable to common shareholders and Adjusted EBITDAre. |
(b) | Reflected as a (decrease) increase within "General and administrative expenses" in the condensed consolidated statements of operations. |
(c) | Primarily consists of the impact on earnings from litigation involving the Company, including actual or anticipated settlement and associated legal costs, which are included in "Other income (expense), net" in the condensed consolidated statements of operations. |
(d) | The same store portfolio for the three and nine months ended September 30, 2018 consists of 102 retail operating properties. Refer to pages 20 – 23 for definitions and reconciliations of non-GAAP financial measures. |
(e) | Consists of payments for tenant improvements, lease commissions and lease inducements and excludes developments in progress. |
(f) | Expenditures are primarily associated with Schaumburg Towers prior to its disposition on May 31, 2018. |
(g) | Consists of payments for building, site and other improvements, net of anticipated recoveries, and excludes developments in progress. |
(h) | Includes amortization of acquired ground lease intangibles and straight-line ground rent expense. |
3rd Quarter 2018 Supplemental Information | 3 | |
Retail Properties of America, Inc.
Supplemental Financial Statement Detail
(amounts in thousands)
(unaudited)
Supplemental Balance Sheet Detail | September 30, 2018 | December 31, 2017 | ||||||
Accounts and Notes Receivable | ||||||||
Accounts and notes receivable (net of allowances of $6,146 and $5,618, respectively) | $ | 27,624 | $ | 25,605 | ||||
Straight-line receivables (net of allowances of $1,577 and $949, respectively) | 46,999 | 46,073 | ||||||
Total | $ | 74,623 | $ | 71,678 | ||||
Other Assets, Net | ||||||||
Deferred costs, net | $ | 33,824 | $ | 32,146 | ||||
Restricted cash – 1031 Exchanges (a) | — | 54,087 | ||||||
Restricted cash – other (b) | 7,734 | 7,063 | ||||||
Fair value of derivatives | 5,562 | 1,086 | ||||||
Other assets, net | 30,982 | 30,789 | ||||||
Total | $ | 78,102 | $ | 125,171 | ||||
Other Liabilities | ||||||||
Unearned income | $ | 13,352 | $ | 14,976 | ||||
Straight-line ground rent liability | 30,451 | 32,513 | ||||||
Other liabilities | 32,754 | 22,009 | ||||||
Total | $ | 76,557 | $ | 69,498 | ||||
Developments in Progress | ||||||||
Active developments/redevelopments (c) | $ | 23,106 | $ | 33,022 | ||||
Supplemental Statements of Operations Detail | |||||||||||||||
Three Months Ended September 30, | Nine Months Ended September 30, | ||||||||||||||
2018 | 2017 | 2018 | 2017 | ||||||||||||
Rental Income | |||||||||||||||
Base rent | $ | 88,762 | $ | 97,836 | $ | 267,047 | $ | 308,696 | |||||||
Percentage and specialty rent | 986 | 1,052 | 3,201 | 4,225 | |||||||||||
Straight-line rent | 946 | 1,849 | 4,826 | 3,109 | |||||||||||
Amortization of above and below market lease intangibles and lease inducements | 281 | 240 | 3,002 | 938 | |||||||||||
Total | $ | 90,975 | $ | 100,977 | $ | 278,076 | $ | 316,968 | |||||||
Other Property Income | |||||||||||||||
Lease termination income | $ | 196 | $ | 188 | $ | 1,423 | $ | 2,310 | |||||||
Other property income | 1,149 | 1,330 | 3,554 | 3,939 | |||||||||||
Total | $ | 1,345 | $ | 1,518 | $ | 4,977 | $ | 6,249 | |||||||
Operating Expense Supplemental Information | |||||||||||||||
Bad debt expense, net | $ | 598 | $ | 105 | $ | 1,448 | $ | 927 | |||||||
Non-cash ground rent expense (d) | $ | 440 | $ | 534 | $ | 1,405 | $ | 1,617 | |||||||
Lease termination fee expense (e) | $ | — | $ | — | $ | 1,900 | (e) | $ | — | ||||||
General and Administrative Expense Supplemental Information | |||||||||||||||
Non-cash amortization of stock-based compensation | $ | 1,599 | $ | 934 | $ | 5,328 | $ | 4,483 | |||||||
Additional Supplemental Information | |||||||||||||||
Capitalized compensation costs – development and capital projects | $ | 790 | $ | 376 | $ | 1,960 | $ | 1,254 | |||||||
Capitalized internal leasing incentives | $ | 71 | $ | 98 | $ | 241 | $ | 287 | |||||||
Capitalized interest | $ | 98 | $ | 150 | $ | 348 | $ | 316 | |||||||
(a) | Represents disposition proceeds temporarily restricted related to potential Internal Revenue Code Section 1031 tax-deferred exchanges (1031 Exchanges). |
(b) | Consists of lenders' escrows and funds restricted through lender or other agreements. |
(c) | Represents the active redevelopments at Reisterstown Road Plaza and the redevelopment portion of Circle East, formerly known as Towson Circle. See page 10 for further details. |
(d) | Includes amortization of acquired ground lease intangibles and straight-line ground rent expense. |
(e) | Represents termination fee recorded during the second quarter of 2018 within "Operating expenses" in the condensed consolidated statements of operations related to the Toys "R" Us auction process whereby the Company was the winning bidder on two leases. |
3rd Quarter 2018 Supplemental Information | 4 | |
Retail Properties of America, Inc.
Same Store Net Operating Income (NOI)
(dollar amounts in thousands)
(unaudited)
Same store portfolio (a) | |||||||||
Based on Same store portfolio as of September 30, 2018 | |||||||||
2018 | 2017 | Change | |||||||
Number of retail operating properties in same store portfolio | 102 | 102 | — | ||||||
Occupancy | 92.1 | % | 92.8 | % | (0.7 | )% | |||
Percent leased (b) | 94.1 | % | 93.9 | % | 0.2 | % | |||
Same Store NOI (c) | |||||||||||||||||||||
Three Months Ended September 30, | Nine Months Ended September 30, | ||||||||||||||||||||
2018 | 2017 | Change | 2018 | 2017 | Change | ||||||||||||||||
Base rent | $ | 82,776 | $ | 81,503 | $ | 247,315 | $ | 244,414 | |||||||||||||
Percentage and specialty rent | 856 | 717 | 2,676 | 2,682 | |||||||||||||||||
Tenant recovery income | 25,326 | 24,388 | 75,421 | 72,478 | |||||||||||||||||
Other property operating income (d) | 1,107 | 1,053 | 3,337 | 2,949 | |||||||||||||||||
110,065 | 107,661 | 328,749 | 322,523 | ||||||||||||||||||
Property operating expenses (e) | 14,876 | 15,158 | 44,950 | 45,269 | |||||||||||||||||
Bad debt expense, net | 474 | 213 | 1,230 | 729 | |||||||||||||||||
Real estate taxes | 17,221 | 17,616 | 52,104 | 50,866 | |||||||||||||||||
32,571 | 32,987 | 98,284 | 96,864 | ||||||||||||||||||
Same Store NOI (c) | $ | 77,494 | $ | 74,674 | 3.8 | % | $ | 230,465 | $ | 225,659 | 2.1 | % | |||||||||
(a) | For the three and nine months ended September 30, 2018, the Company's same store portfolio consists of 102 retail operating properties and excludes (i) properties acquired or placed in service and stabilized during 2017 and 2018, (ii) Reisterstown Road Plaza, which is in active redevelopment, (iii) the redevelopment portion of Circle East, formerly known as Towson Circle, which is in active redevelopment, (iv) Carillon, formerly known as Boulevard at the Capital Centre, where the Company has begun activities in anticipation of future redevelopment, and (v) investment properties sold or classified as held for sale during 2017 and 2018, including Schaumburg Towers. |
(b) | Includes leases signed but not commenced. |
(c) | Refer to pages 20 – 23 for definitions and reconciliations of non-GAAP financial measures. Comparison of the Company's presentation of Same Store NOI to similarly titled measures for other REITs may not necessarily be meaningful due to possible differences in definition and application by such REITs. |
(d) | Consists of all operating items included in "Other property income" in the condensed consolidated statements of operations, which include all items other than lease termination fee income. |
(e) | Consists of all property operating items included in "Operating expenses" in the condensed consolidated statements of operations, which include all items other than lease termination fee expense, straight-line ground rent expense (non-cash) and amortization of acquired ground lease intangibles (non-cash). |
3rd Quarter 2018 Supplemental Information | 5 | |
Retail Properties of America, Inc.
Capitalization
(dollar amounts in thousands, except share price and ratio)
Capitalization Data | ||||||||
September 30, 2018 | December 31, 2017 | |||||||
Equity Capitalization | ||||||||
Common stock shares outstanding (a) | 217,852 | 219,237 | ||||||
Common stock share price | $ | 12.19 | $ | 13.44 | ||||
Total equity capitalization | $ | 2,655,616 | $ | 2,946,545 | ||||
Debt Capitalization | ||||||||
Mortgages payable (b) | $ | 206,202 | $ | 287,238 | ||||
Unsecured notes payable (c) | 700,000 | 700,000 | ||||||
Unsecured term loans (d) | 450,000 | 550,000 | ||||||
Unsecured revolving line of credit | 209,000 | 216,000 | ||||||
Total debt capitalization | $ | 1,565,202 | $ | 1,753,238 | ||||
Total capitalization at end of period | $ | 4,220,818 | $ | 4,699,783 | ||||
Calculation of Net Debt to Adjusted EBITDAre Ratio (e)
September 30, 2018 | December 31, 2017 | |||||||
Total notional debt | $ | 1,565,202 | $ | 1,753,238 | ||||
Less: consolidated cash and cash equivalents | (29,702 | ) | (25,185 | ) | ||||
Less: disposition proceeds temporarily restricted related to potential 1031 Exchanges | — | (54,087 | ) | |||||
Total net debt | $ | 1,535,500 | $ | 1,673,966 | ||||
Annualized Adjusted EBITDAre | $ | 298,588 | $ | 302,332 | ||||
Net Debt to Adjusted EBITDAre (f) | 5.1x | 5.5x | ||||||
(a) | Excludes performance restricted stock units and options outstanding, which could potentially convert into common stock in the future. |
(b) | Mortgages payable excludes mortgage premium of $837 and $1,024, discount of $(547) and $(579), and capitalized loan fees of $(388) and $(615), net of accumulated amortization, as of September 30, 2018 and December 31, 2017, respectively. |
(c) | Unsecured notes payable excludes discount of $(764) and $(853) and capitalized loan fees of $(3,027) and $(3,399), net of accumulated amortization, as of September 30, 2018 and December 31, 2017, respectively. |
(d) | Unsecured term loans exclude capitalized loan fees of $(2,250) and $(2,730), net of accumulated amortization, as of September 30, 2018 and December 31, 2017, respectively. |
(e) | Refer to pages 20 – 23 for definitions and reconciliations of non-GAAP financial measures. |
(f) | For purposes of this ratio calculation, annualized three months ended figures were used. |
3rd Quarter 2018 Supplemental Information | 6 | |
Retail Properties of America, Inc.
Covenants
Unsecured Credit Facility, Term Loan Due 2023 and Notes Due 2021, 2024, 2026 and 2028 (a) | |||||
Covenant | September 30, 2018 | ||||
Leverage ratio (b) | < 60.0% | (b) | 31.2 | % | |
Secured leverage ratio (b) | Unsecured Credit Facility and Term Loan Due 2023: Notes Due 2021, 2024, 2026 and 2028: | < 45.0% < 40.0% | (b) | 4.1 | % |
Fixed charge coverage ratio (c) | > 1.50x | 3.6x | |||
Interest coverage ratio (d) | > 1.50x | 4.1x | |||
Unencumbered leverage ratio (b) | < 60.0% | (b) | 30.0 | % | |
Unencumbered interest coverage ratio | > 1.75x | 5.6x | |||
Notes Due 2025 (e) | ||||
Covenant | September 30, 2018 | |||
Leverage ratio (f) | < 60.0% | 32.2 | % | |
Secured leverage ratio (f) | < 40.0% | 4.2 | % | |
Debt service coverage ratio (g) | > 1.50x | 4.5x | ||
Unencumbered assets to unsecured debt ratio | > 150% | 326 | % | |
(a) | For a complete listing of all covenants related to the Company's Unsecured Credit Facility (comprised of the unsecured term loan due 2021 and the unsecured revolving line of credit) as well as covenant definitions, refer to the Fifth Amended and Restated Credit Agreement filed as Exhibit 10.2 to the Company's Quarterly Report on Form 10-Q for the quarter ended March 31, 2018, filed on May 2, 2018. For a complete listing of all covenants as well as covenant definitions related to the Company's Term Loan Due 2023, refer to the credit agreement filed as Exhibit 10.1 to the Company's Current Report on Form 8-K, dated November 29, 2016 and the First Amendment to the Term Loan Agreement filed as Exhibit 10.4 to the Company's Quarterly Report on Form 10-Q for the quarter ended June 30, 2018, filed on August 1, 2018. For a complete listing of all covenants related to the Company's 4.12% senior unsecured notes due 2021 and 4.58% senior unsecured notes due 2024 (Notes Due 2021 and 2024) as well as covenant definitions, refer to the Note Purchase Agreement filed as Exhibit 10.1 to the Company's Current Report on Form 8-K, dated May 22, 2014. For a complete listing of all covenants related to the Company's 4.08% senior unsecured notes due 2026 and 4.24% senior unsecured notes due 2028 (Notes Due 2026 and 2028) as well as covenant definitions, refer to the Note Purchase Agreement filed as Exhibit 10.1 to the Company's Current Report on Form 8-K, dated October 5, 2016. |
(b) | Based upon a capitalization rate of 6.50%. |
(c) | Applies only to the Company's Unsecured Credit Facility, Term Loan Due 2023 and Notes Due 2026 and 2028. This ratio is based upon consolidated debt service, including interest expense and principal amortization, excluding interest expense related to defeasance costs and prepayment premiums. |
(d) | Applies only to the Company's Notes Due 2021, 2024, 2026 and 2028. |
(e) | For a complete listing of all covenants related to the Company's 4.00% senior unsecured notes due 2025 (Notes Due 2025) as well as covenant definitions, refer to the First Supplemental Indenture filed as Exhibit 4.2 to the Company's Current Report on Form 8-K, dated March 12, 2015. |
(f) | Based upon the book value of Total Assets as defined in the First Supplemental Indenture referenced in footnote (e) above. |
(g) | Based upon interest expense and excludes principal amortization. This ratio is calculated on a pro forma basis with the assumption that debt and property transactions occurred on the first day of the preceding four-quarter period. |
3rd Quarter 2018 Supplemental Information | 7 | |
Retail Properties of America, Inc.
Consolidated Debt Summary as of September 30, 2018
(dollar amounts in thousands)
Balance | Weighted Average (WA) Interest Rate (a) | WA Years to Maturity | |||||||
Fixed rate mortgages payable (b) | $ | 206,202 | 4.65 | % | 4.8 years | ||||
Unsecured notes payable: | |||||||||
Senior notes – 4.12% due 2021 | 100,000 | 4.12 | % | 2.8 years | |||||
Senior notes – 4.58% due 2024 | 150,000 | 4.58 | % | 5.8 years | |||||
Senior notes – 4.00% due 2025 | 250,000 | 4.00 | % | 6.5 years | |||||
Senior notes – 4.08% due 2026 | 100,000 | 4.08 | % | 8.0 years | |||||
Senior notes – 4.24% due 2028 | 100,000 | 4.24 | % | 10.3 years | |||||
Total unsecured notes payable (b) | 700,000 | 4.19 | % | 6.5 years | |||||
Unsecured credit facility: | |||||||||
Term loan due 2021 – fixed rate (c) | 250,000 | 3.20 | % | 2.3 years | |||||
Revolving line of credit – variable rate | 209,000 | 3.29 | % | 3.6 years | |||||
Total unsecured credit facility (b) | 459,000 | 3.24 | % | 2.9 years | |||||
Term Loan Due 2023 – fixed rate (b) (d) | 200,000 | 2.96 | % | 5.1 years | |||||
Total consolidated indebtedness | $ | 1,565,202 | 3.82 | % | 5.1 years | ||||
Consolidated Debt Maturity Schedule as of September 30, 2018 | ||||||||||||||||||||||||
Year | Fixed Rate (b) | WA Rates on Fixed Debt | Variable Rate (b) | WA Rates on Variable Debt (e) | Total | % of Total | WA Rates on Total Debt (a) | |||||||||||||||||
2018 | $ | 752 | 4.47 | % | $ | — | — | $ | 752 | 0.0 | % | 4.47 | % | |||||||||||
2019 | 3,090 | 4.47 | % | — | — | 3,090 | 0.2 | % | 4.47 | % | ||||||||||||||
2020 | 3,228 | 4.48 | % | — | — | 3,228 | 0.2 | % | 4.48 | % | ||||||||||||||
2021 | 372,080 | 3.56 | % | — | — | 372,080 | 23.8 | % | 3.56 | % | ||||||||||||||
2022 | 113,946 | 4.90 | % | 209,000 | 3.29 | % | 322,946 | 20.6 | % | 3.86 | % | |||||||||||||
2023 | 231,758 | 3.12 | % | — | — | 231,758 | 14.8 | % | 3.12 | % | ||||||||||||||
2024 | 151,737 | 4.57 | % | — | — | 151,737 | 9.7 | % | 4.57 | % | ||||||||||||||
2025 | 251,809 | 4.00 | % | — | — | 251,809 | 16.1 | % | 4.00 | % | ||||||||||||||
2026 | 101,884 | 4.08 | % | — | — | 101,884 | 6.5 | % | 4.08 | % | ||||||||||||||
2027 | 21,409 | 4.46 | % | — | — | 21,409 | 1.4 | % | 4.46 | % | ||||||||||||||
Thereafter | 104,509 | 4.22 | % | — | — | 104,509 | 6.7 | % | 4.22 | % | ||||||||||||||
Total | $ | 1,356,202 | 3.90 | % | $ | 209,000 | 3.29 | % | $ | 1,565,202 | 100.0 | % | 3.82 | % | ||||||||||
(a) | Interest rates presented exclude the impact of premium, discount and capitalized loan fee amortization. As of September 30, 2018, the Company's overall weighted average interest rate for consolidated debt including the impact of premium, discount and capitalized loan fee amortization was 4.02%. |
(b) | Fixed rate mortgages payable excludes mortgage premium of $837, discount of $(547) and capitalized loan fees of $(388), net of accumulated amortization, as of September 30, 2018. Unsecured notes payable excludes discount of $(764) and capitalized loan fees of $(3,027), net of accumulated amortization, as of September 30, 2018. Term loans exclude capitalized loan fees of $(2,250), net of accumulated amortization, as of September 30, 2018. In the consolidated debt maturity schedule, maturity amounts for each year include scheduled principal amortization payments. |
(c) | Reflects $250,000 of LIBOR-based variable rate debt that has been swapped to a fixed rate of 2.00% plus a credit spread based on a leverage grid ranging from 1.20% to 1.70% through January 5, 2021. The applicable credit spread was 1.20% as of September 30, 2018. |
(d) | Reflects $200,000 of LIBOR-based variable rate debt that has been swapped to a fixed rate of 1.26% through November 22, 2018, and a fixed rate of 2.85% effective November 23, 2018 through November 22, 2023, plus a credit spread based on a leverage grid ranging from 1.70% to 2.55%. The applicable credit spread was 1.70% as of September 30, 2018. |
(e) | Represents interest rates as of September 30, 2018. |
3rd Quarter 2018 Supplemental Information | 8 | |
Retail Properties of America, Inc.
Summary of Indebtedness as of September 30, 2018
(dollar amounts in thousands)
Description | Maturity Date | Interest Rate (a) | Interest Rate Type | Secured or Unsecured | Balance as of 9/30/2018 | |||||||
Consolidated Indebtedness | ||||||||||||
Sawyer Heights Village | 07/01/21 | 5.00% | Fixed | Secured | $ | 18,700 | ||||||
Ashland & Roosevelt (bank pad) | 02/25/22 | 7.48% | Fixed | Secured | 687 | |||||||
Gardiner Manor Mall | 03/01/22 | 4.95% | Fixed | Secured | 33,643 | |||||||
Peoria Crossings | 04/01/22 | 4.82% | Fixed | Secured | 24,131 | |||||||
Southlake Corners | 04/01/22 | 4.89% | Fixed | Secured | 20,945 | |||||||
Tollgate Marketplace | 04/01/22 | 4.84% | Fixed | Secured | 35,000 | |||||||
Gateway Village | 01/01/23 | 4.14% | Fixed | Secured | 33,692 | |||||||
Northgate North | 06/01/27 | 4.50% | Fixed | Secured | 25,469 | |||||||
The Shoppes at Union Hill | 06/01/31 | 3.75% | Fixed | Secured | 13,935 | |||||||
Mortgages payable (b) | 206,202 | |||||||||||
Senior notes – 4.12% due 2021 | 06/30/21 | 4.12% | Fixed | Unsecured | 100,000 | |||||||
Senior notes – 4.58% due 2024 | 06/30/24 | 4.58% | Fixed | Unsecured | 150,000 | |||||||
Senior notes – 4.00% due 2025 | 03/15/25 | 4.00% | Fixed | Unsecured | 250,000 | |||||||
Senior notes – 4.08% due 2026 | 09/30/26 | 4.08% | Fixed | Unsecured | 100,000 | |||||||
Senior notes – 4.24% due 2028 | 12/28/28 | 4.24% | Fixed | Unsecured | 100,000 | |||||||
Unsecured notes payable (b) | 700,000 | |||||||||||
Term loan due 2021 | 01/05/21 | 3.20% | (c) | Fixed | Unsecured | 250,000 | ||||||
Revolving line of credit | 04/22/22 | 3.29% | Variable | Unsecured | 209,000 | |||||||
Unsecured credit facility (b) | 459,000 | |||||||||||
Term Loan Due 2023 (b) | 11/22/23 | 2.96% | (d) | Fixed | Unsecured | 200,000 | ||||||
Total consolidated indebtedness | 10/18/23 | 3.82% | $ | 1,565,202 | ||||||||
(a) | Interest rates presented exclude the impact of the premium, discount and capitalized loan fee amortization. As of September 30, 2018, the Company's overall weighted average interest rate for consolidated debt including the impact of premium, discount and capitalized loan fee amortization was 4.02%. |
(b) | Mortgages payable excludes mortgage premium of $837, discount of $(547) and capitalized loan fees of $(388), net of accumulated amortization, as of September 30, 2018. Unsecured notes payable excludes discount of $(764) and capitalized loan fees of $(3,027), net of accumulated amortization, as of September 30, 2018. Term loans exclude capitalized loan fees of $(2,250), net of accumulated amortization, as of September 30, 2018. |
(c) | Reflects $250,000 of LIBOR-based variable rate debt that has been swapped to a fixed rate of 2.00% plus a credit spread based on a leverage grid ranging from 1.20% to 1.70% through January 5, 2021. The applicable credit spread was 1.20% as of September 30, 2018. |
(d) | Reflects $200,000 of LIBOR-based variable rate debt that has been swapped to a fixed rate of 1.26% through November 22, 2018, and a fixed rate of 2.85% effective November 23, 2018 through November 22, 2023, plus a credit spread based on a leverage grid ranging from 1.70% to 2.55%. The applicable credit spread was 1.70% as of September 30, 2018. |
3rd Quarter 2018 Supplemental Information | 9 | |
Retail Properties of America, Inc.
Development Projects as of September 30, 2018
(dollar amounts in thousands)
Property and Metropolitan Statistical Area (MSA) | Estimated Project Commercial GLA | Estimated Project Multi-Family Rental Units (MFR) | JV / Air Rights | Projected Net RPAI Investment (a) | Net Costs Inception to Date | Projected Incremental Return on Cost (b) | Anticipated Commencement | Targeted Stabilization (c) | Property Included in Same Store Portfolio (d) | Project Description | ||||||||||||
Active Projects | ||||||||||||||||||||||
Reisterstown Road Plaza (Baltimore MSA) | 40,500 | — | n/a | $10,500 | $ | 8,817 | 10.5%–11.0% | n/a | Q4 2018 | No | Reconfigured existing space and facade renovation; redevelopment GLA is 100% leased and 75% occupied | |||||||||||
Circle East (e) (Baltimore MSA) | 79,000 | 370 | MFR: Air rights sale | $33,000–$35,000 | $ | 9,054 | (f) | 8.0%–10.0% | n/a | Q4 2020 | No (e) | Mixed-use redevelopment that will include double-sided street level retail with approximately 370 third-party-owned multi-family rental units above | ||||||||||
Near-Term Projects | ||||||||||||||||||||||
Plaza del Lago – MFR (Chicago MSA) | — | 18 | n/a | $700–$850 | n/a | 8.0%–11.0% | Q4 2018 | Q3 2019 | No (g) | Reconfiguration of existing 15 multi-family rental units | ||||||||||||
Downtown Crown (Washington, D.C. MSA) | 36,000 | — | n/a | $13,000–$15,000 | n/a | 6.0%–7.0% | Q2–Q3 2019 | Q2–Q3 2021 | Yes | Vacant pad development | ||||||||||||
Main Street Promenade (h) (Chicago MSA) | 18,900 | 74 | TBD | $25,000–$30,000 | n/a | 6.5%–8.0% | Q2–Q3 2019 | Q2–Q3 2021 | No (g) | Vacant pad development | ||||||||||||
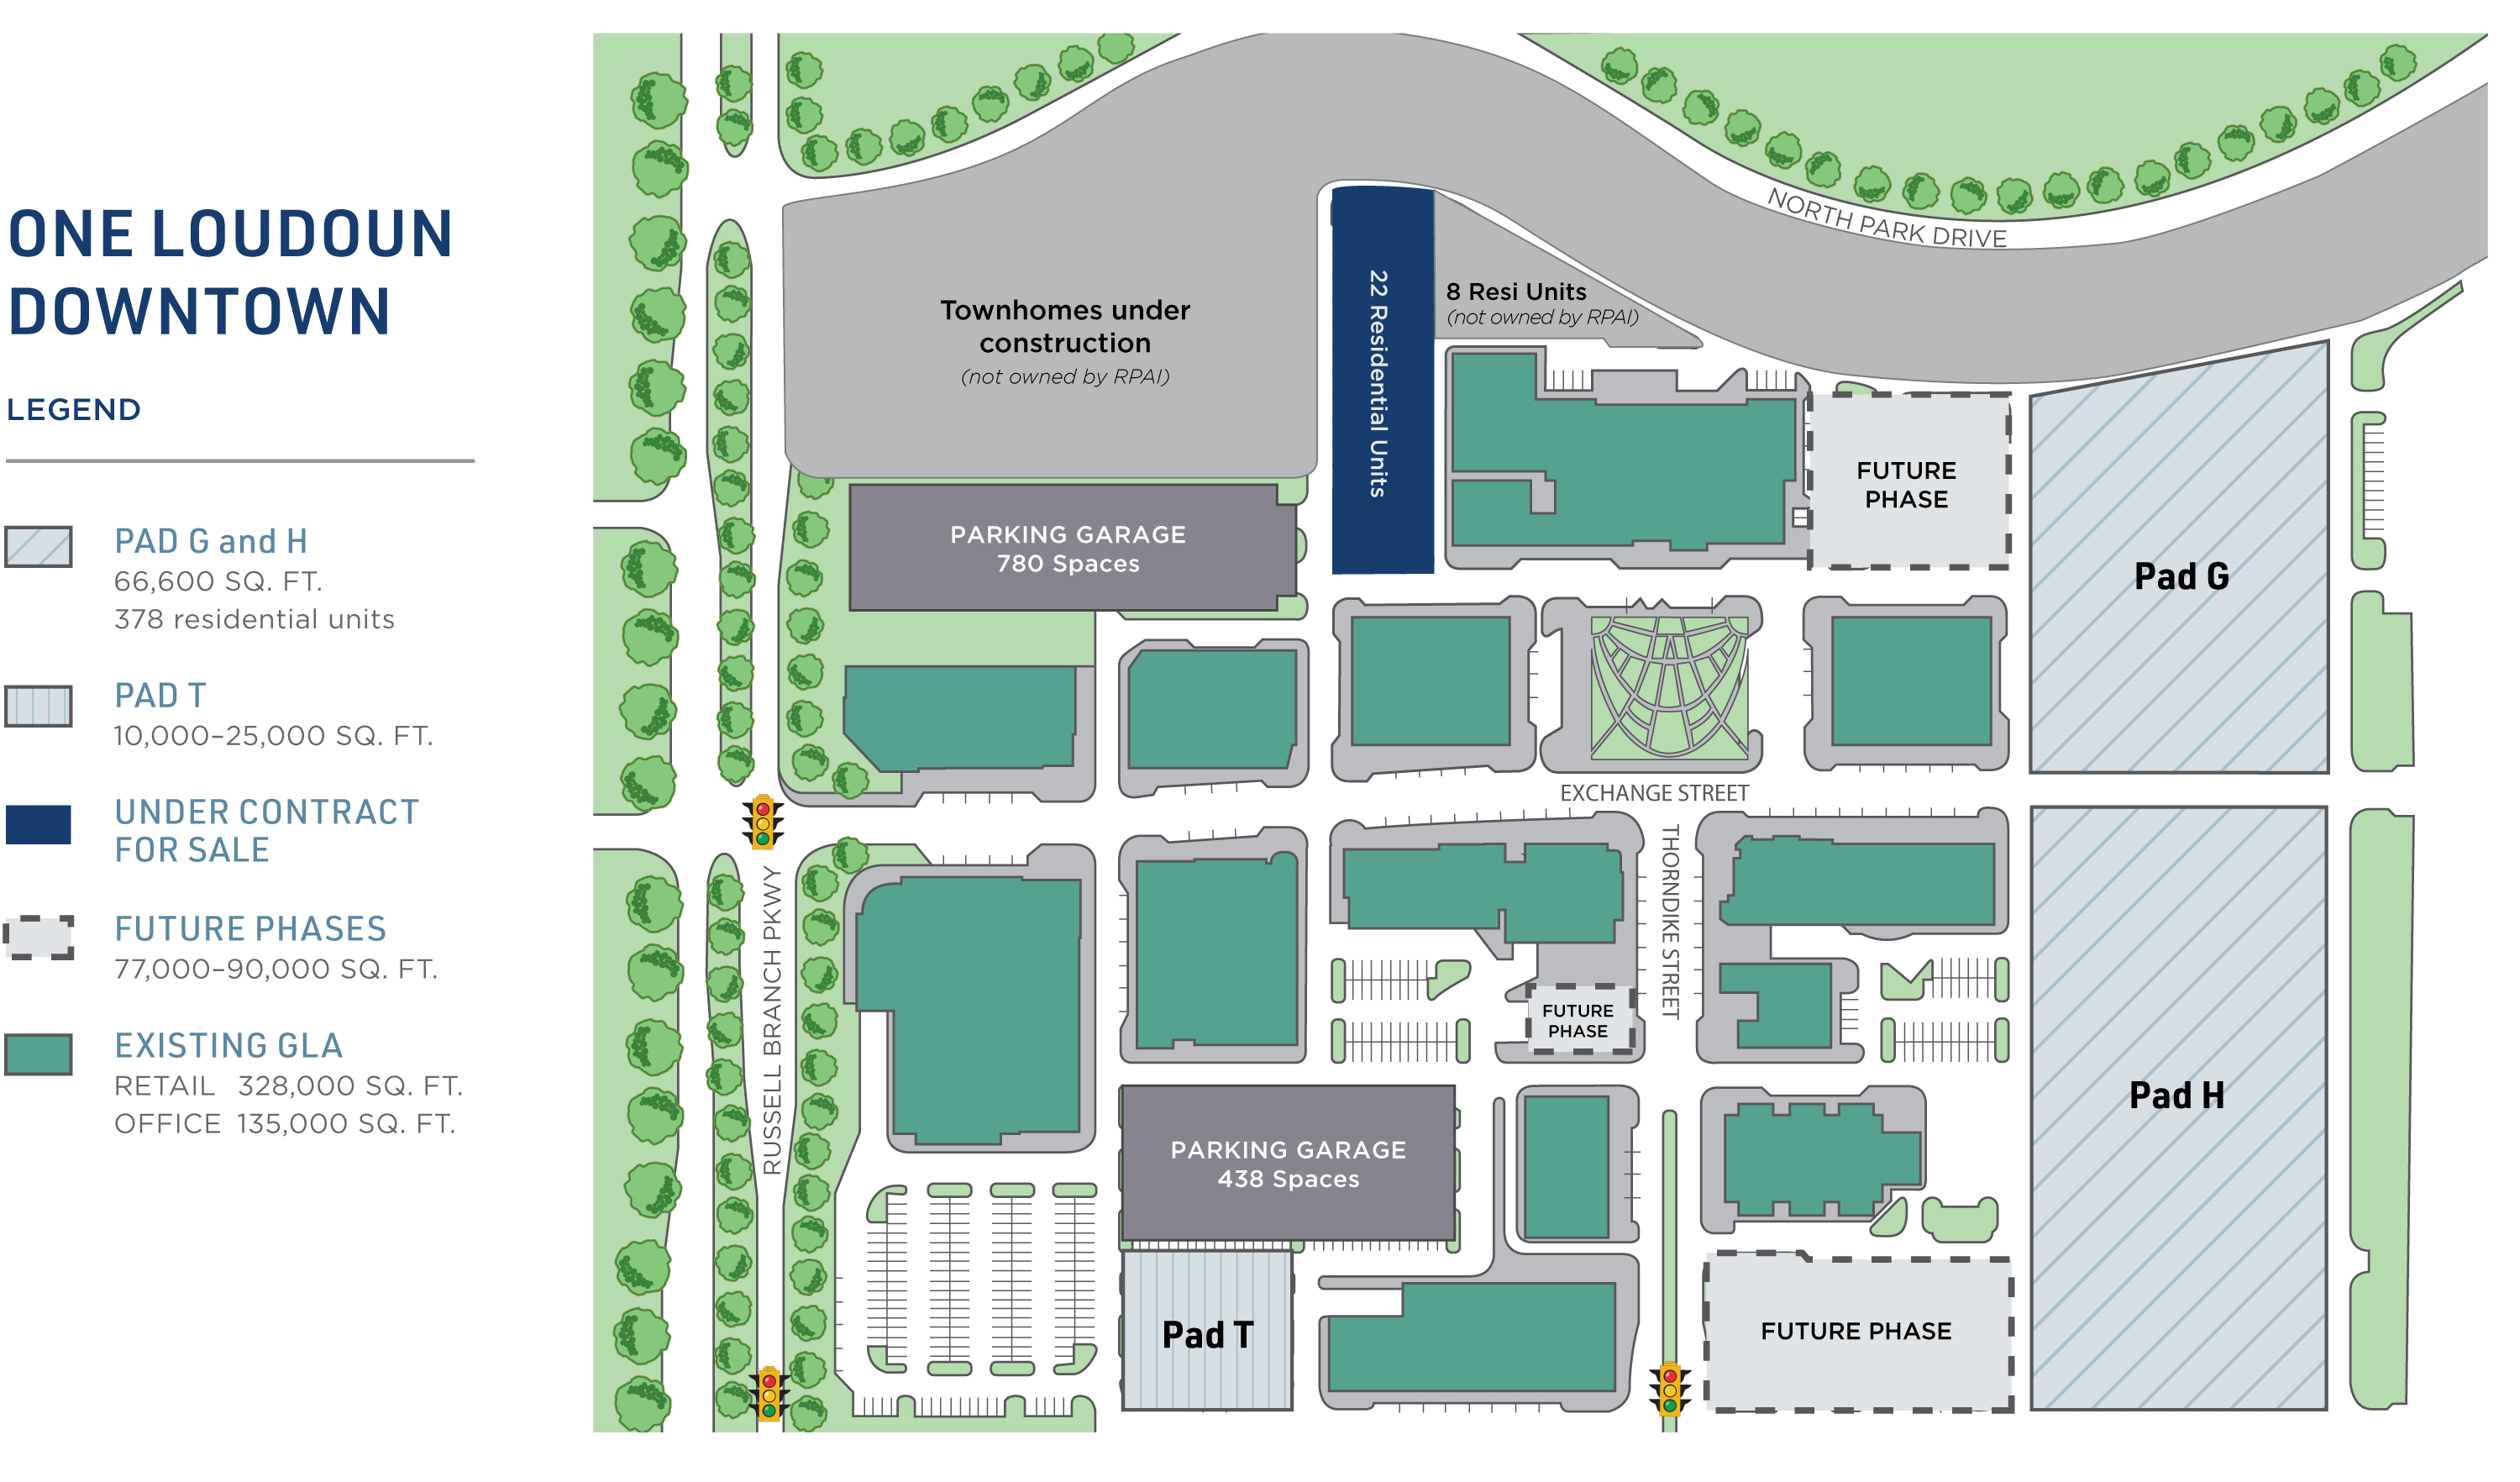
One Loudoun Downtown – Pads G & H (Washington, D.C. MSA) | 66,600 | 378 | MFR: 90%/10% JV | $120,000–$131,000 | n/a | 6.0%–7.0% | Q1–Q2 2019 | Q2–Q3 2022 | Yes | Vacant pad development. See site plan on page 12 | ||||||||||||
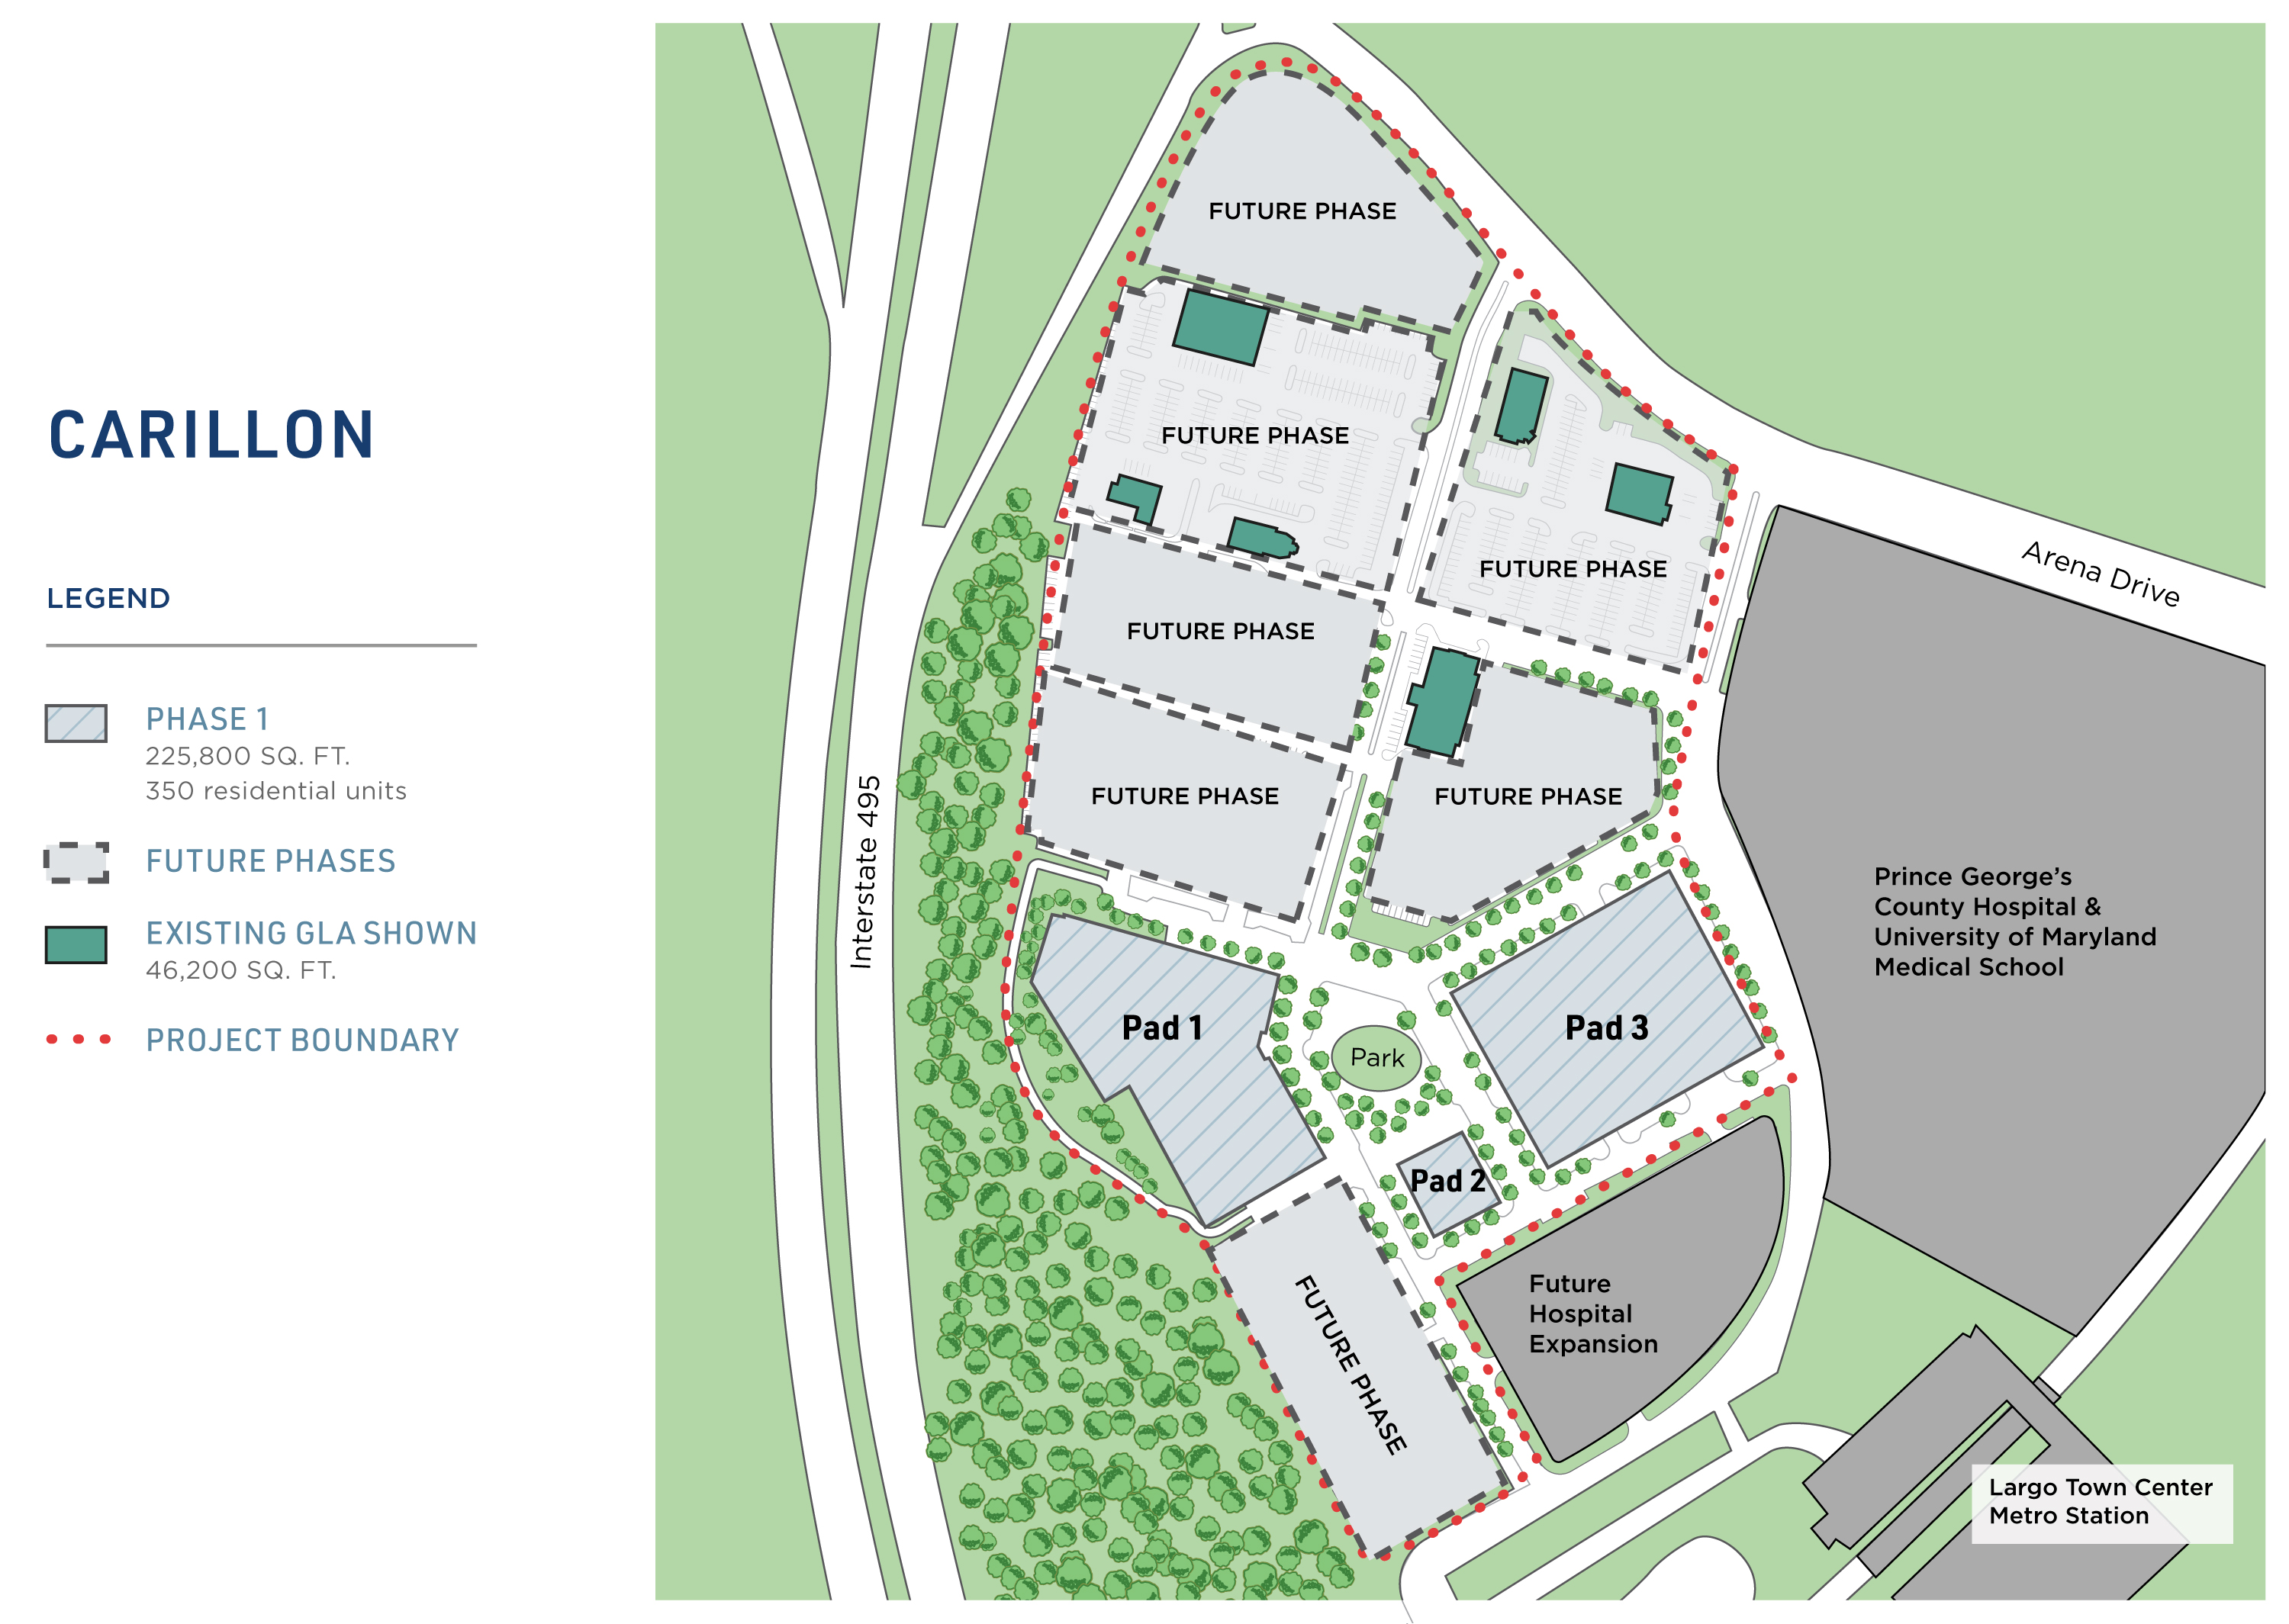
Carillon – Phase One (h) (Washington, D.C. MSA) | 225,800 | 350 | MFR: 95%/5% JV (i) MOB: 95%/5% JV (i) | $194,000–$215,000 | n/a | 6.0%–7.0% | Q2–Q3 2019 | Q3–Q4 2022 | No | Phased project that will include retail, multi-family rental and medical office use. See site plan on page 13 | ||||||||||||
(a) | Net costs represent the Company's estimated share of the project costs, net of proceeds from land sales, sales of air rights, reimbursement from third parties and excludes contributions from project partners, as applicable. |
(b) | Projected Incremental Return on Cost (ROC) generally reflects only the unleveraged incremental NOI generated by the project upon stabilization and is calculated as incremental NOI divided by incremental cost. Incremental NOI is the difference between NOI expected to be generated by the stabilized project and the NOI generated prior to the commencement of active redevelopment, development or expansion of the space. ROC does not include peripheral impacts, such as the impact on future lease rollover at the property or the impact on the long-term value of the property. |
(c) | Targeted stabilization represents the projected date of the redevelopment reaching 90% occupancy, but generally no later than one year from the completion of major construction activity. |
(d) | The Company's same store portfolio consists of retail operating properties acquired or placed in service and stabilized prior to January 1, 2017. A property is removed from the Company's same store portfolio if the project is considered to significantly impact the existing property's NOI and activities have begun in anticipation of the project. Expansions and pad developments are generally not considered to significantly impact the existing property's NOI, and therefore, the existing properties have not been removed from the Company's same store portfolio if they otherwise met the criteria to be included in the Company's same store portfolio as of September 30, 2018. |
(e) | Circle East is the rebranded combined retail and entertainment destination of the Company's existing operating property Towson Square (which is included in the Company's same store portfolio) and the redevelopment at Towson Circle (which has been excluded from the Company's same store portfolio due to the ongoing redevelopment). |
(f) | Net costs inception to date are net of proceeds of $11,820 received in the first quarter of 2018 from the sale of air rights to a third party to develop the multi-family rental units. |
(g) | Property was acquired subsequent to December 31, 2016, and as such, does not meet the criteria to be included in the Company's same store portfolio as of September 30, 2018. |
(h) | Project remains subject to the approval of the Company's Investment Committee and/or Board of Directors. |
(i) | Carillon – Phase One anticipates two separate joint venture (JV) arrangements based on negotiated terms: (i) a 95% owned JV related to the MFR and (ii) a 95% owned JV related to the medical office building (MOB). The joint venture agreements have not been executed as of September 30, 2018. |
The Company cannot guarantee that (i) ROC will be generated at the percentage listed or at all, (ii) total net costs associated with these projects will be equal to the total estimated net costs, (iii) project commencement or stabilization will occur when anticipated or (iv) that the Company will ultimately complete any or all of these projects. The ROC and total estimated net costs reflect the Company's best estimate based upon current information, may change over time and are subject to certain conditions which are beyond the Company's control, including, without limitation, general economic conditions, market conditions and other business factors.
3rd Quarter 2018 Supplemental Information | 10 | |
Retail Properties of America, Inc.
Development Projects as of September 30, 2018 (continued)
(dollar amounts in thousands)
The Company has identified the following potential redevelopment, expansion and pad development opportunities to redevelop significant portions of the property, add stand-alone buildings, convert previously under-utilized space or develop additional commercial GLA at existing properties. Executing on these opportunities may be subject to certain conditions which are beyond the Company's control, including, without limitation, government approvals, tenant consents as well as general economic, market and other conditions and, therefore, the Company can provide no assurances that any of the redevelopment, expansion and pad development opportunities (i) will be executed on, (ii) will commence when anticipated or (iii) will ultimately be realized.
Property Name | MSA | Included in Same store portfolio (a) | Estimated Project Commercial GLA | Estimated Project MFR | Residential Unit Rights Under Contract for Sale | |||||
Redevelopment, Expansion and Pad Development Opportunities | ||||||||||
Carillon – Future Phases (b) | Washington, D.C. | No | 975,000 | 2,650 | ||||||
Southlake Town Square | Dallas | Yes | 275,000 | |||||||
One Loudoun Downtown – Pad T and Future Phases (c) | Washington, D.C. | Yes | 87,000 – 115,000 | 22 | ||||||
Merrifield Town Center II (b) | Washington, D.C. | Yes | 80,000 – 100,000 | 350 – 400 | ||||||
Tysons Corner (b) | Washington, D.C. | Yes | 50,000 – 75,000 | 350 – 450 | ||||||
Plaza del Lago – Future Phase | Chicago | No (d) | 20,600 | |||||||
Reisterstown Road Plaza | Baltimore | No (e) | 8,000 – 12,000 | |||||||
Lakewood Towne Center | Seattle | Yes | 10,500 | |||||||
Gateway Plaza | Dallas | Yes | 8,000 | |||||||
Humblewood Shopping Center | Houston | Yes | 5,000 | |||||||
Watauga Pavilion | Dallas | Yes | 5,000 | |||||||
Edwards Multiplex – Ontario, CA | Riverside-San Bernadino | Yes | 3,000 | |||||||
Property Name | MSA | Included in Same store portfolio (a) | Projected Net RPAI Investment (a) | Net Costs Inception to Date | Project Commercial GLA | Completion | Projected Incremental Return on Cost (a) | Project Description | |||||||||||||
Completed Expansions and Pad Developments | |||||||||||||||||||||
Lake Worth Towne Crossing – Parcel | Dallas | Yes | $ | 2,872 | $ | 2,872 | 15,030 | Q4 2015 | 11.3% | 15,030 sq. ft. multi-tenant retail | |||||||||||
Parkway Towne Crossing | Dallas | Yes | $ | 3,468 | $ | 3,468 | 21,000 | Q3 2016 | 9.9% | 21,000 sq. ft. multi-tenant retail | |||||||||||
Heritage Square | Seattle | Yes | $ | 1,507 | $ | 1,507 | 4,200 | Q3 2016 | 11.2% | 4,200 sq. ft. redevelopment of outparcel for new tenant, Corner Bakery | |||||||||||
Pavilion at King's Grant | Charlotte | Yes | $ | 2,470 | $ | 2,470 | 32,500 | Q2 2017 | 14.7% | 32,500 sq. ft. multi-tenant retail | |||||||||||
Shops at Park Place | Dallas | Yes | $ | 3,956 | $ | 3,956 | 25,040 | Q2 2017 | 9.1% | 25,040 sq. ft. pad development | |||||||||||
Lakewood Towne Center | Seattle | Yes | $ | 1,900 | $ | 1,900 | 4,500 | Q3 2017 | 7.3% | 4,500 sq. ft. pad development | |||||||||||
(a) | See footnote (d), (a) and (b) on page 10 regarding the Company's same store portfolio, projected net RPAI investment and projected incremental return on cost, respectively. |
(b) | Project may require demolition of a portion of the property's existing GLA. |
(c) | One Loudoun Downtown – Future Phases includes three vacant parcels that have been identified as future pad development opportunities of up to 136,000 sq. ft. of commercial GLA. In addition, as of September 30, 2018, the property is under contract for the phased sale of a land parcel with rights to develop 22 residential units. The first phase of the land parcel sale and rights to develop eight residential units closed on July 9, 2018. See site plan on page 12. |
(d) | Property was acquired subsequent to December 31, 2016, and as such, does not meet the criteria to be included in the Company's same store portfolio as of September 30, 2018. |
(e) | Property is an active redevelopment, and as such, does not meet the criteria to be included in the Company's same store portfolio as of September 30, 2018. |
3rd Quarter 2018 Supplemental Information | 11 | |
Retail Properties of America, Inc.
Development Projects as of September 30, 2018 (continued)
One Loudoun Downtown Site Plan
3rd Quarter 2018 Supplemental Information | 12 | |
Retail Properties of America, Inc.
Development Projects as of September 30, 2018 (continued)
Carillon Site Plan
3rd Quarter 2018 Supplemental Information | 13 | |
Retail Properties of America, Inc.
Acquisitions and Dispositions for the Nine Months Ended September 30, 2018
(amounts in thousands, except square footage amounts)
Acquisitions
The Company did not acquire any properties during the nine months ended September 30, 2018.
Property Dispositions
Property Name | Disposition Date | Property Type | GLA | Consideration | Debt Repaid | Prepayment Premium | |||||||||||||
Crown Theater | January 19, 2018 | Single-user retail | 74,200 | $ | 6,900 | $ | — | $ | — | ||||||||||
Cranberry Square | February 15, 2018 | Multi-tenant retail | 195,200 | 23,500 | — | — | |||||||||||||
Rite Aid Store (Eckerd) – Crossville, TN | March 7, 2018 | Single-user retail | 13,800 | 1,800 | — | — | |||||||||||||
Home Depot Plaza | March 20, 2018 | Multi-tenant retail | 135,600 | 16,250 | 10,750 | 974 | |||||||||||||
Governor's Marketplace | March 21, 2018 | Multi-tenant retail | 243,100 | 23,500 | — | — | |||||||||||||
Stony Creek I & Stony Creek II (a) | March 28, 2018 | Multi-tenant retail | 204,800 | 32,800 | — | — | |||||||||||||
CVS Pharmacy – Lawton, OK | April 19, 2018 | Single-user retail | 10,900 | 1,600 | — | — | |||||||||||||
Schaumburg Towers | May 31, 2018 | Office | 895,400 | 86,600 | — | — | |||||||||||||
Total 2018 property dispositions (through September 30, 2018) | 1,773,000 | $ | 192,950 | $ | 10,750 | $ | 974 | ||||||||||||
(a) | The terms of the disposition of Stony Creek I and Stony Creek II were negotiated as a single transaction. |
Development Transactions
Property Name | Transaction Date | Transaction | Consideration | |||||
Circle East – redevelopment portion | March 7, 2018 | Sale of air rights | $ | 11,970 | ||||
One Loudoun Downtown | July 9, 2018 | Sale of land parcel and development rights (b) | 1,800 | |||||
Total 2018 development transactions (through September 30, 2018) | $ | 13,770 | ||||||
(b) | During the nine months ended September 30, 2018, the Company disposed of the first phase of a land parcel and the rights to develop eight residential units. The Company is under contract to sell the remaining two phases consisting of land and the rights to develop 22 residential units, which are expected to close by early 2019. |
There have been no acquisitions or dispositions subsequent to September 30, 2018.
3rd Quarter 2018 Supplemental Information | 14 | |
Retail Properties of America, Inc.
Retail Market Summary as of September 30, 2018
(dollar amounts and square footage in thousands)
Property Type/Market | Number of Properties | Annualized Base Rent (ABR) (a) | % of Total Multi-Tenant Retail ABR (a) | ABR per Occupied Sq. Ft. | GLA (a) | % of Total Multi-Tenant Retail GLA (a) | Occupancy | % Leased Including Signed | ||||||||||||||||||
Multi-Tenant Retail: | ||||||||||||||||||||||||||
Top 25 MSAs | ||||||||||||||||||||||||||
Dallas | 19 | $ | 81,402 | 24.1 | % | $ | 22.35 | 3,938 | 20.6 | % | 92.5 | % | 93.2 | % | ||||||||||||
Washington, D.C. | 8 | 36,189 | 10.7 | % | 27.81 | 1,388 | 7.3 | % | 93.8 | % | 97.6 | % | ||||||||||||||
New York | 9 | 35,504 | 10.5 | % | 28.61 | 1,292 | 6.7 | % | 96.0 | % | 97.5 | % | ||||||||||||||
Chicago | 8 | 28,842 | 8.5 | % | 23.30 | 1,358 | 7.1 | % | 91.2 | % | 94.1 | % | ||||||||||||||
Seattle | 8 | 21,326 | 6.3 | % | 15.67 | 1,477 | 7.7 | % | 92.1 | % | 93.5 | % | ||||||||||||||
Atlanta | 9 | 18,661 | 5.5 | % | 13.79 | 1,513 | 7.9 | % | 89.4 | % | 94.2 | % | ||||||||||||||
Houston | 9 | 15,286 | 4.5 | % | 14.75 | 1,141 | 6.0 | % | 90.9 | % | 93.3 | % | ||||||||||||||
Baltimore | 4 | 13,465 | 4.0 | % | 17.41 | 865 | 4.5 | % | 89.4 | % | 90.1 | % | ||||||||||||||
San Antonio | 3 | 12,716 | 3.8 | % | 17.65 | 721 | 3.8 | % | 99.8 | % | 100.0 | % | ||||||||||||||
Phoenix | 3 | 10,188 | 3.0 | % | 17.60 | 632 | 3.3 | % | 91.6 | % | 94.2 | % | ||||||||||||||
Los Angeles | 1 | 5,286 | 1.5 | % | 28.25 | 255 | 1.3 | % | 73.4 | % | 73.4 | % | ||||||||||||||
Riverside | 1 | 4,607 | 1.4 | % | 15.76 | 292 | 1.5 | % | 100.0 | % | 100.0 | % | ||||||||||||||
St. Louis | 1 | 4,110 | 1.2 | % | 9.62 | 453 | 2.4 | % | 94.3 | % | 94.3 | % | ||||||||||||||
Charlotte | 1 | 2,555 | 0.8 | % | 12.19 | 320 | 1.7 | % | 65.6 | % | 75.3 | % | ||||||||||||||
Tampa | 1 | 2,379 | 0.7 | % | 19.52 | 126 | 0.7 | % | 97.0 | % | 97.0 | % | ||||||||||||||
Subtotal | 85 | 292,516 | 86.5 | % | 20.20 | 15,771 | 82.5 | % | 91.8 | % | 93.8 | % | ||||||||||||||
Non-Top 25 MSAs by State | ||||||||||||||||||||||||||
Texas | 7 | 13,653 | 4.0 | % | 14.38 | 1,002 | 5.2 | % | 94.8 | % | 95.2 | % | ||||||||||||||
Michigan | 1 | 6,934 | 2.1 | % | 23.71 | 332 | 1.8 | % | 88.1 | % | 91.9 | % | ||||||||||||||
Massachusetts | 2 | 6,866 | 2.0 | % | 11.58 | 643 | 3.4 | % | 92.2 | % | 92.2 | % | ||||||||||||||
Virginia | 1 | 4,966 | 1.5 | % | 18.00 | 308 | 1.6 | % | 89.7 | % | 89.7 | % | ||||||||||||||
Washington | 1 | 4,157 | 1.2 | % | 12.97 | 378 | 2.0 | % | 84.8 | % | 96.9 | % | ||||||||||||||
Tennessee | 2 | 4,009 | 1.2 | % | 11.45 | 364 | 1.9 | % | 96.2 | % | 96.2 | % | ||||||||||||||
Maryland | 1 | 2,191 | 0.7 | % | 20.62 | 113 | 0.6 | % | 94.1 | % | 94.1 | % | ||||||||||||||
South Carolina | 1 | 1,782 | 0.5 | % | 13.19 | 141 | 0.7 | % | 95.5 | % | 95.5 | % | ||||||||||||||
Connecticut | 1 | 954 | 0.3 | % | 16.39 | 58 | 0.3 | % | 100.0 | % | 100.0 | % | ||||||||||||||
Subtotal | 17 | 45,512 | 13.5 | % | 14.77 | 3,339 | 17.5 | % | 92.3 | % | 94.1 | % | ||||||||||||||
Total Multi-Tenant Retail | 102 | 338,028 | 100.0 | % | 19.24 | 19,110 | 100.0 | % | 91.9 | % | 93.9 | % | ||||||||||||||
Single-User Retail | 3 | 8,950 | 25.19 | 356 | 100.0 | % | 100.0 | % | ||||||||||||||||||
Total Retail Operating Portfolio (b) | 105 | $ | 346,978 | $ | 19.36 | 19,466 | 92.1 | % | 94.0 | % | ||||||||||||||||
(a) | Excludes $11,282 of multi-tenant retail ABR and 1,123 square feet of multi-tenant retail GLA attributable to (i) Reisterstown Road Plaza, which is in active redevelopment, (ii) the redevelopment portion of Circle East, formerly known as Towson Circle, which is in active redevelopment and (iii) Carillon, formerly known as Boulevard at the Capital Centre, where the Company has begun activities in anticipation of future redevelopment, which are located in the Washington, D.C. and Baltimore MSAs. Including these amounts, 87.0% of the Company's multi-tenant retail ABR and 83.5% of the Company's multi-tenant retail GLA is located in the top 25 MSAs. |
(b) | Excludes 15 residential units. |
3rd Quarter 2018 Supplemental Information | 15 | |
Retail Properties of America, Inc.
Retail Operating Portfolio Occupancy Breakdown as of September 30, 2018
(square footage in thousands)
Total Retail Operating Portfolio: | ||||||||||||||||||||||||||||||||
Top 25 MSAs | Non-Top 25 MSAs | Total Multi-Tenant Retail | Single-User Retail | Total Retail | ||||||||||||||||||||||||||||
Number of Properties | 85 | 17 | 102 | 3 | 105 | |||||||||||||||||||||||||||
GLA | Occupancy | GLA | Occupancy | GLA | Occupancy | GLA | Occupancy | GLA | Occupancy | % Leased Including Signed | ||||||||||||||||||||||
25,000+ sq ft | 7,213 | 93.8 | % | 1,642 | 95.0 | % | 8,855 | 94.0 | % | 356 | 100.0 | % | 9,211 | 94.2 | % | 95.8 | % | |||||||||||||||
10,000-24,999 sq ft | 3,093 | 90.6 | % | 611 | 96.0 | % | 3,704 | 91.5 | % | — | — | % | 3,704 | 91.5 | % | 95.5 | % | |||||||||||||||
Anchor | 10,306 | 92.8 | % | 2,253 | 95.2 | % | 12,559 | 93.3 | % | 356 | 100.0 | % | 12,915 | 93.4 | % | 95.7 | % | |||||||||||||||
5,000-9,999 sq ft | 2,193 | 92.2 | % | 382 | 92.6 | % | 2,575 | 92.3 | % | — | — | 2,575 | 92.3 | % | 93.2 | % | ||||||||||||||||
0-4,999 sq ft | 3,272 | 88.5 | % | 704 | 82.6 | % | 3,976 | 87.5 | % | — | — | 3,976 | 87.5 | % | 88.9 | % | ||||||||||||||||
Non-Anchor | 5,465 | 90.0 | % | 1,086 | 86.1 | % | 6,551 | 89.4 | % | — | — | 6,551 | 89.4 | % | 90.6 | % | ||||||||||||||||
Total | 15,771 | 91.8 | % | 3,339 | 92.3 | % | 19,110 | 91.9 | % | 356 | 100.0 | % | 19,466 | 92.1 | % | 94.0 | % | |||||||||||||||
3rd Quarter 2018 Supplemental Information | 16 | |
Retail Properties of America, Inc.
Top Retail Tenants as of September 30, 2018
(dollar amounts and square footage in thousands)
The following table sets forth information regarding the 20 largest tenants in the Company's retail operating portfolio based on ABR as of September 30, 2018. Dollars (other than per square foot information) and square feet of GLA are presented in thousands.
Tenant | Primary DBA | Number of Stores | ABR | % of Total ABR | ABR per Occupied Sq. Ft. | Occupied GLA | % of Occupied GLA | |||||||||||||||
Best Buy Co., Inc. | Best Buy, Pacific Sales | 13 | $ | 9,162 | 2.7 | % | $ | 17.06 | 537 | 3.0 | % | |||||||||||
Regal Entertainment Group | Edwards Cinema | 2 | 6,968 | 2.0 | % | 31.82 | 219 | 1.2 | % | |||||||||||||
Bed Bath & Beyond Inc. | Bed Bath & Beyond, Buy Buy Baby, Cost Plus World Market | 18 | 6,780 | 2.0 | % | 14.13 | 480 | 2.7 | % | |||||||||||||
The TJX Companies, Inc. | HomeGoods, Marshalls, T.J. Maxx | 22 | 6,671 | 1.9 | % | 10.62 | 628 | 3.5 | % | |||||||||||||
AB Acquisition LLC | Safeway, Jewel-Osco, Tom Thumb | 9 | 6,649 | 1.9 | % | 13.68 | 486 | 2.7 | % | |||||||||||||
Ross Stores, Inc. | Ross Dress for Less | 20 | 6,566 | 1.9 | % | 11.24 | 584 | 3.3 | % | |||||||||||||
PetSmart, Inc. | 18 | 5,861 | 1.7 | % | 16.33 | 359 | 2.0 | % | ||||||||||||||
Michaels Stores, Inc. | Michaels, Aaron Brothers Art & Frame | 17 | 4,969 | 1.4 | % | 12.97 | 383 | 2.1 | % | |||||||||||||
Ascena Retail Group, Inc. | Dress Barn, Lane Bryant, Justice, Catherine's, Ann Taylor, Maurices, LOFT | 40 | 4,727 | 1.4 | % | 22.62 | 209 | 1.2 | % | |||||||||||||
Gap Inc. | Old Navy, Banana Republic, The Gap, Gap Factory Store, Athleta | 22 | 4,676 | 1.4 | % | 18.41 | 254 | 1.4 | % | |||||||||||||
BJ's Wholesale Club, Inc. | 2 | 4,659 | 1.3 | % | 19.02 | 245 | 1.4 | % | ||||||||||||||
Ahold U.S.A. Inc. | Stop & Shop | 3 | 4,326 | 1.2 | % | 23.64 | 183 | 1.0 | % | |||||||||||||
Lowe's Companies, Inc. | 4 | 3,944 | 1.1 | % | 6.47 | 610 | 3.4 | % | ||||||||||||||
The Kroger Co. | Kroger, Harris Teeter, QFC | 7 | 3,638 | 1.0 | % | 10.42 | 349 | 1.9 | % | |||||||||||||
Party City Holdings Inc. | 17 | 3,495 | 1.0 | % | 14.09 | 248 | 1.4 | % | ||||||||||||||
Mattress Firm Holding Corp. | Mattress Firm, Sleep Experts | 24 | 3,427 | 1.0 | % | 28.80 | 119 | 0.7 | % | |||||||||||||
Office Depot, Inc. | Office Depot, OfficeMax | 11 | 3,417 | 1.0 | % | 13.83 | 247 | 1.4 | % | |||||||||||||
Barnes & Noble, Inc. | 7 | 3,415 | 1.0 | % | 19.85 | 172 | 0.9 | % | ||||||||||||||
Pier 1 Imports, Inc. | 16 | 3,172 | 0.9 | % | 19.70 | 161 | 0.9 | % | ||||||||||||||
Petco Animal Supplies, Inc. | 13 | 3,051 | 0.9 | % | 16.95 | 180 | 1.0 | % | ||||||||||||||
Total Top Retail Tenants | 285 | $ | 99,573 | 28.7 | % | $ | 14.97 | 6,653 | 37.1 | % | ||||||||||||
3rd Quarter 2018 Supplemental Information | 17 | |
Retail Properties of America, Inc.
Retail Leasing Activity Summary
(square footage amounts in thousands)
The following table summarizes the leasing activity in the Company's retail operating portfolio as of September 30, 2018 and for the preceding four quarters. Leases of less than 12 months have been excluded.
Total Leases | ||||||||||||||||||||||||
Number of Leases Signed | GLA Signed | New Contractual Rent per Square Foot (PSF) (a) | Prior Contractual Rent PSF (a) | % Change over Prior ABR (a) | WA Lease Term | Tenant Allowances PSF | ||||||||||||||||||
Q3 2018 | 140 | 999 | $ | 22.13 | $ | 20.81 | 6.3 | % | 6.0 | $ | 12.74 | |||||||||||||
Q2 2018 | 128 | 689 | $ | 21.43 | $ | 20.41 | 5.0 | % | 5.4 | $ | 8.46 | |||||||||||||
Q1 2018 | 97 | 637 | $ | 22.22 | $ | 20.88 | 6.4 | % | 4.7 | $ | 11.82 | |||||||||||||
Q4 2017 | 126 | 665 | $ | 24.15 | $ | 20.77 | 16.3 | % | 7.0 | $ | 29.78 | |||||||||||||
Total – 12 months | 491 | 2,990 | $ | 22.38 | $ | 20.72 | 8.0 | % | 5.8 | $ | 15.35 | |||||||||||||
Comparable Renewal Leases | ||||||||||||||||||||||||
Number of Leases Signed | GLA Signed | New Contractual Rent PSF | Prior Contractual Rent PSF | % Change over Prior ABR | WA Lease Term | Tenant Allowances PSF | ||||||||||||||||||
Q3 2018 | 86 | 671 | $ | 20.27 | $ | 19.15 | 5.8 | % | 5.2 | $ | 1.27 | |||||||||||||
Q2 2018 | 91 | 527 | $ | 21.69 | $ | 20.64 | 5.1 | % | 4.6 | $ | 0.60 | |||||||||||||
Q1 2018 | 80 | 523 | $ | 21.86 | $ | 20.71 | 5.6 | % | 4.2 | $ | 2.41 | |||||||||||||
Q4 2017 | 73 | 311 | $ | 22.38 | $ | 21.30 | 5.1 | % | 4.7 | $ | 1.39 | |||||||||||||
Total – 12 months | 330 | 2,032 | $ | 21.37 | $ | 20.27 | 5.4 | % | 4.7 | $ | 1.41 | |||||||||||||
Comparable New Leases | ||||||||||||||||||||||||
Number of Leases Signed | GLA Signed | New Contractual Rent PSF | Prior Contractual Rent PSF | % Change over Prior ABR | WA Lease Term | Tenant Allowances PSF | ||||||||||||||||||
Q3 2018 | 19 | 110 | $ | 33.40 | $ | 30.92 | 8.0 | % | 10.8 | $ | 65.83 | |||||||||||||
Q2 2018 | 13 | 74 | $ | 19.60 | $ | 18.77 | 4.4 | % | 7.3 | $ | 27.83 | |||||||||||||
Q1 2018 | 5 | 14 | $ | 35.28 | $ | 26.90 | 31.2 | % | 8.8 | $ | 58.08 | |||||||||||||
Q4 2017 | 25 | 176 | $ | 27.26 | $ | 19.84 | 37.4 | % | 9.4 | $ | 62.09 | |||||||||||||
Total – 12 months | 62 | 374 | $ | 27.86 | $ | 23.16 | 20.3 | % | 9.6 | $ | 56.30 | |||||||||||||
Non-Comparable New and Renewal Leases (b) | ||||||||||||||||||||||||
Number of Leases Signed | GLA Signed | New Contractual Rent PSF | Prior Contractual Rent PSF | % Change over Prior ABR | WA Lease Term | Tenant Allowances PSF | ||||||||||||||||||
Q3 2018 | 35 | 218 | $ | 23.60 | n/a | n/a | 4.8 | $ | 21.10 | |||||||||||||||
Q2 2018 | 24 | 88 | $ | 23.07 | n/a | n/a | 8.1 | $ | 39.36 | |||||||||||||||
Q1 2018 | 12 | 100 | $ | 15.10 | n/a | n/a | 6.9 | $ | 54.54 | |||||||||||||||
Q4 2017 | 28 | 178 | $ | 22.05 | n/a | n/a | 8.0 | $ | 47.28 | |||||||||||||||
Total – 12 months | 99 | 584 | $ | 21.60 | n/a | n/a | 6.6 | $ | 37.55 | |||||||||||||||
(a) | Excludes the impact of Non-Comparable New and Renewal Leases. |
(b) | Includes (i) leases signed on units that were vacant for over 12 months, (ii) leases signed without fixed rental payments and (iii) leases signed where the previous and the current lease do not have a consistent lease structure. |
3rd Quarter 2018 Supplemental Information | 18 | |
Retail Properties of America, Inc.
Retail Lease Expirations as of September 30, 2018
(dollar amounts and square footage in thousands)
The following tables set forth a summary, as of September 30, 2018, of lease expirations scheduled to occur during the remainder of 2018 and each of the nine calendar years from 2019 to 2027 and thereafter, assuming no exercise of renewal options or early termination rights for all leases in the Company's retail operating portfolio. The following tables are based on leases commenced as of September 30, 2018. Dollars (other than per square foot information) and square feet of GLA are presented in thousands in the table.
Lease Expiration Year | Lease Count | ABR | % of Total ABR | ABR per Occupied Sq. Ft. | ABR at Exp. (a) | ABR per Occupied Sq. Ft. at Exp. | GLA | % of Occupied GLA | % of Total GLA | ||||||||||||||||||||||
2018 | 72 | $ | 6,465 | 1.9 | % | $ | 25.16 | $ | 6,465 | $ | 25.16 | 257 | 1.4 | % | 1.3 | % | |||||||||||||||
2019 | 350 | 41,959 | 12.1 | % | 21.56 | 42,044 | 21.61 | 1,946 | 10.9 | % | 10.0 | % | |||||||||||||||||||
2020 | 330 | 37,631 | 10.8 | % | 20.10 | 38,336 | 20.48 | 1,872 | 10.4 | % | 9.6 | % | |||||||||||||||||||
2021 | 292 | 43,242 | 12.5 | % | 20.08 | 44,212 | 20.54 | 2,153 | 12.0 | % | 11.1 | % | |||||||||||||||||||
2022 | 306 | 48,490 | 14.0 | % | 16.66 | 50,017 | 17.19 | 2,910 | 16.2 | % | 15.0 | % | |||||||||||||||||||
2023 | 314 | 46,980 | 13.6 | % | 19.10 | 49,057 | 19.94 | 2,460 | 13.7 | % | 12.7 | % | |||||||||||||||||||
2024 | 226 | 35,599 | 10.2 | % | 18.15 | 38,945 | 19.86 | 1,961 | 11.0 | % | 10.0 | % | |||||||||||||||||||
2025 | 105 | 20,456 | 5.9 | % | 17.15 | 22,360 | 18.74 | 1,193 | 6.7 | % | 6.1 | % | |||||||||||||||||||
2026 | 78 | 15,701 | 4.5 | % | 21.75 | 18,106 | 25.08 | 722 | 4.0 | % | 3.7 | % | |||||||||||||||||||
2027 | 79 | 12,923 | 3.7 | % | 15.88 | 14,659 | 18.01 | 814 | 4.6 | % | 4.2 | % | |||||||||||||||||||
Thereafter | 115 | 36,186 | 10.4 | % | 22.93 | 43,144 | 27.34 | 1,578 | 8.8 | % | 8.1 | % | |||||||||||||||||||
Month to month | 18 | 1,346 | 0.4 | % | 24.47 | 1,346 | 24.47 | 55 | 0.3 | % | 0.3 | % | |||||||||||||||||||
Leased Total | 2,285 | $ | 346,978 | 100.0 | % | $ | 19.36 | $ | 368,691 | $ | 20.57 | 17,921 | 100.0 | % | 92.1 | % | |||||||||||||||
Leases signed but not commenced | 39 | $ | 7,578 | — | $ | 20.21 | $ | 8,702 | $ | 23.21 | 375 | — | 1.9 | % | |||||||||||||||||
Available | 1,170 | — | 6.0 | % | |||||||||||||||||||||||||||
The following tables break down the above information into anchor (10,000 sf and above) and non-anchor (under 10,000 sf) details for the Company's retail operating portfolio. Dollars (other than per square foot information) and square feet of GLA are presented in thousands in the tables. | |||||||||||||||||||||||||||||||
Anchor | |||||||||||||||||||||||||||||||
Lease Expiration Year | Lease Count | ABR | % of Total ABR | ABR per Occupied Sq. Ft. | ABR at Exp. (a) | ABR per Occupied Sq. Ft. at Exp. | GLA | % of Occupied GLA | % of Total GLA | ||||||||||||||||||||||
2018 | 4 | $ | 1,934 | 0.6 | % | $ | 23.88 | $ | 1,934 | $ | 23.88 | 81 | 0.4 | % | 0.4 | % | |||||||||||||||
2019 | 35 | 17,557 | 5.1 | % | 16.59 | 17,564 | 16.60 | 1,058 | 5.9 | % | 5.4 | % | |||||||||||||||||||
2020 | 42 | 15,385 | 4.4 | % | 14.74 | 15,572 | 14.92 | 1,044 | 5.8 | % | 5.4 | % | |||||||||||||||||||
2021 | 51 | 22,821 | 6.6 | % | 15.90 | 22,960 | 16.00 | 1,435 | 8.0 | % | 7.4 | % | |||||||||||||||||||
2022 | 60 | 27,208 | 7.9 | % | 12.54 | 27,541 | 12.69 | 2,170 | 12.1 | % | 11.2 | % | |||||||||||||||||||
2023 | 58 | 23,268 | 6.7 | % | 14.11 | 23,535 | 14.27 | 1,649 | 9.2 | % | 8.5 | % | |||||||||||||||||||
2024 | 50 | 17,454 | 5.0 | % | 12.56 | 18,561 | 13.35 | 1,390 | 7.8 | % | 7.1 | % | |||||||||||||||||||
2025 | 26 | 10,901 | 3.1 | % | 12.37 | 11,622 | 13.19 | 881 | 4.9 | % | 4.5 | % | |||||||||||||||||||
2026 | 23 | 8,464 | 2.4 | % | 17.31 | 9,324 | 19.07 | 489 | 2.7 | % | 2.5 | % | |||||||||||||||||||
2027 | 15 | 6,029 | 1.7 | % | 10.29 | 6,557 | 11.19 | 586 | 3.3 | % | 3.0 | % | |||||||||||||||||||
Thereafter | 37 | 25,728 | 7.4 | % | 20.04 | 30,229 | 23.54 | 1,284 | 7.2 | % | 6.6 | % | |||||||||||||||||||
Month to month | — | — | — | % | — | — | — | — | — | % | — | % | |||||||||||||||||||
Leased Total | 401 | $ | 176,749 | 50.9 | % | $ | 14.65 | $ | 185,399 | $ | 15.36 | 12,067 | 67.3 | % | 62.0 | % | |||||||||||||||
Leases signed but not commenced | 14 | $ | 5,273 | — | $ | 17.94 | $ | 6,074 | $ | 20.66 | 294 | — | 1.5 | % | |||||||||||||||||
Available | 554 | — | 2.8 | % | |||||||||||||||||||||||||||
Non-Anchor | |||||||||||||||||||||||||||||||
Lease Expiration Year | Lease Count | ABR | % of Total ABR | ABR per Occupied Sq. Ft. | ABR at Exp. (a) | ABR per Occupied Sq. Ft. at Exp. | GLA | % of Occupied GLA | % of Total GLA | ||||||||||||||||||||||
2018 | 68 | $ | 4,531 | 1.3 | % | $ | 25.74 | $ | 4,531 | $ | 25.74 | 176 | 1.0 | % | 0.9 | % | |||||||||||||||
2019 | 315 | 24,402 | 7.0 | % | 27.48 | 24,480 | 27.57 | 888 | 5.0 | % | 4.6 | % | |||||||||||||||||||
2020 | 288 | 22,246 | 6.4 | % | 26.87 | 22,764 | 27.49 | 828 | 4.6 | % | 4.2 | % | |||||||||||||||||||
2021 | 241 | 20,421 | 5.9 | % | 28.44 | 21,252 | 29.60 | 718 | 4.0 | % | 3.7 | % | |||||||||||||||||||
2022 | 246 | 21,282 | 6.1 | % | 28.76 | 22,476 | 30.37 | 740 | 4.1 | % | 3.8 | % | |||||||||||||||||||
2023 | 256 | 23,712 | 6.9 | % | 29.24 | 25,522 | 31.47 | 811 | 4.5 | % | 4.2 | % | |||||||||||||||||||
2024 | 176 | 18,145 | 5.2 | % | 31.78 | 20,384 | 35.70 | 571 | 3.2 | % | 2.9 | % | |||||||||||||||||||
2025 | 79 | 9,555 | 2.8 | % | 30.63 | 10,738 | 34.42 | 312 | 1.8 | % | 1.6 | % | |||||||||||||||||||
2026 | 55 | 7,237 | 2.1 | % | 31.06 | 8,782 | 37.69 | 233 | 1.3 | % | 1.2 | % | |||||||||||||||||||
2027 | 64 | 6,894 | 2.0 | % | 30.24 | 8,102 | 35.54 | 228 | 1.3 | % | 1.2 | % | |||||||||||||||||||
Thereafter | 78 | 10,458 | 3.0 | % | 35.57 | 12,915 | 43.93 | 294 | 1.6 | % | 1.5 | % | |||||||||||||||||||
Month to month | 18 | 1,346 | 0.4 | % | 24.47 | 1,346 | 24.47 | 55 | 0.3 | % | 0.3 | % | |||||||||||||||||||
Leased Total | 1,884 | $ | 170,229 | 49.1 | % | $ | 29.08 | $ | 183,292 | $ | 31.31 | 5,854 | 32.7 | % | 30.1 | % | |||||||||||||||
Leases signed but not commenced | 25 | $ | 2,305 | — | $ | 28.46 | $ | 2,628 | $ | 32.44 | 81 | — | 0.4 | % | |||||||||||||||||
Available | 616 | — | 3.2 | % | |||||||||||||||||||||||||||
(a) | Represents annualized base rent at the scheduled expiration of the lease giving effect to fixed contractual increases in base rent. |
3rd Quarter 2018 Supplemental Information | 19 | |
Retail Properties of America, Inc.
Non-GAAP Financial Measures and Other Definitions
Gross Leasable Area (GLA)
Gross Leasable Area (GLA) is defined as the aggregate number of square feet available for lease. GLA excludes square footage attributable to third-party managed storage units and residential units, of which the Company owned 62,000 square feet of managed storage space and 15 residential units as of September 30, 2018.
Occupancy
Occupancy is defined, for a property or group of properties, as the ratio, expressed as a percentage, of (a) the number of square feet of such property economically occupied by tenants under leases with an initial term of greater than one year, to (b) the aggregate number of square feet for such property.
Percent Leased Including Signed
Percent Leased Including Signed is defined, for a property or group of properties, as the ratio, expressed as a percentage, of (a) the sum of occupied square feet (pursuant to the definition above) of such property and vacant square feet for which a lease with an initial term of greater than one year has been signed, but rent has not yet commenced, to (b) the aggregate number of square feet for such property.
Metropolitan Statistical Area (MSA)
Metropolitan Statistical Area (MSA) information is sourced from the United States Census Bureau and rank is determined based on the most recently available population estimates.
Funds From Operations (FFO) Attributable to Common Shareholders
As defined by the National Association of Real Estate Investment Trusts (NAREIT), an industry trade group, Funds From Operations (FFO) means net income (loss) computed in accordance with generally accepted accounting principles (GAAP), excluding gains (or losses) from sales of depreciable real estate, plus depreciation and amortization and impairment charges on depreciable real estate. The Company has adopted the NAREIT definition in its computation of FFO attributable to common shareholders. The Company believes that, subject to the following limitations, FFO attributable to common shareholders provides a basis for comparing its performance and operations to those of other real estate investment trusts (REITs). The Company believes that FFO attributable to common shareholders, which is a supplemental non-GAAP financial measure, provides an additional and useful means to assess the operating performance of REITs. FFO attributable to common shareholders does not represent an alternative to (i) "Net income" or "Net income attributable to common shareholders" as an indicator of the Company's financial performance, or (ii) "Cash flows from operating activities" in accordance with GAAP as a measure of the Company's capacity to fund cash needs, including the payment of dividends.
Operating FFO Attributable to Common Shareholders
Operating FFO attributable to common shareholders is defined as FFO attributable to common shareholders excluding the impact of discrete non-operating transactions and other events which the Company does not consider representative of the comparable operating results of its real estate operating portfolio, which is its core business platform. Specific examples of discrete non-operating transactions and other events include, but are not limited to, the impact on earnings from gains or losses associated with the early extinguishment of debt or other liabilities, gain on sale and impairment charges on assets other than depreciable real estate, litigation involving the Company, including actual or anticipated settlement and associated legal costs, the impact on earnings from executive separation and the excess of redemption value over carrying value of preferred stock redemption, which are not otherwise adjusted in the Company's calculation of FFO attributable to common shareholders. The Company believes that Operating FFO attributable to common shareholders, which is a supplemental non-GAAP financial measure, provides an additional and useful means to assess the operating performance of REITs. Operating FFO attributable to common shareholders does not represent an alternative to (i) "Net income" or "Net income attributable to common shareholders" as an indicator of the Company's financial performance, or (ii) "Cash flows from operating activities" in accordance with GAAP as a measure of the Company's capacity to fund cash needs, including the payment of dividends. Comparison of the Company's presentation of Operating FFO attributable to common shareholders to similarly titled measures for other REITs may not necessarily be meaningful due to possible differences in definition and application by such REITs.
Net Operating Income (NOI)
The Company defines Net Operating Income (NOI) as all revenues other than straight-line rental income (non-cash), amortization of lease inducements, amortization of acquired above and below market lease intangibles and lease termination fee income, less real estate taxes and all operating expenses other than lease termination fee expense, straight-line ground rent expense (non-cash) and amortization of acquired ground lease intangibles (non-cash). NOI consists of Same Store NOI and NOI from Other Investment Properties. The Company believes that NOI, which is a supplemental non-GAAP financial measure, provides an additional and useful operating perspective not immediately apparent from "Operating income" or "Net income attributable to common shareholders" in accordance with GAAP. The Company uses NOI to evaluate its performance on a property-by-property basis because this measure allows management to evaluate the impact that factors such as lease structure, lease rates and tenant base have on the Company's operating results. NOI does not represent an alternative to "Net income" or "Net income attributable to common shareholders" in accordance with GAAP as an indicator of the Company's financial performance. Comparison of the Company's presentation of NOI to similarly titled measures for other REITs may not necessarily be meaningful due to possible differences in definition and application by such REITs.
3rd Quarter 2018 Supplemental Information | 20 | |
Retail Properties of America, Inc.
Non-GAAP Financial Measures and Other Definitions (continued)
Same Store NOI and NOI from Other Investment Properties
Same Store NOI for the three and nine months ended September 30, 2018 represents NOI from the Company's same store portfolio consisting of 102 retail operating properties acquired or placed in service and stabilized prior to January 1, 2017. NOI from Other Investment Properties for the three and nine months ended September 30, 2018 represents NOI primarily from (i) properties acquired during 2017, (ii) Reisterstown Road Plaza, which is in active redevelopment, (iii) the redevelopment portion of Circle East, formerly known as Towson Circle, which is in active redevelopment, (iv) Carillon, formerly known as Boulevard at the Capital Centre, where the Company has begun activities in anticipation of future redevelopment, (v) the properties that were sold or held for sale in 2017 and 2018, including Schaumburg Towers, and (vi) the net income from the Company's wholly-owned captive insurance company.
The Company believes that Same Store NOI and NOI from Other Investment Properties, which are supplemental non-GAAP financial measures, provide an additional and useful operating perspective not immediately apparent from "Operating income" or "Net income attributable to common shareholders" in accordance with GAAP. The Company uses these measures to evaluate its performance on a property-by-property basis because they allow management to evaluate the impact that factors such as lease structure, lease rates and tenant base have on the Company's operating results. Same Store NOI and NOI from Other Investment Properties do not represent alternatives to "Net income" or "Net income attributable to common shareholders" in accordance with GAAP as indicators of the Company's financial performance. Comparison of the Company's presentation of Same Store NOI and NOI from Other Investment Properties to similarly titled measures for other REITs may not necessarily be meaningful due to possible differences in definition and application by such REITs.
EBITDAre and Adjusted EBITDAre
As defined by NAREIT, EBITDA for real estate (EBITDAre) means net income (loss) computed in accordance with GAAP, plus (i) interest expense, (ii) income tax expense, (iii) depreciation and amortization, (iv) impairment charges on depreciable property and (v) impairment charges on investments in unconsolidated affiliates if caused by a decrease in the value of depreciable property in the affiliate, plus or minus (i) gains (or losses) from sales of depreciable property, including gains (or losses) on change in control, and (ii) adjustments to reflect the entity's share of EBITDAre of unconsolidated affiliates. The Company has adopted the NAREIT definition in its computation of EBITDAre as it believes it provides a basis for comparing the Company's performance to that of other REITs. The Company also reports Adjusted EBITDAre, which excludes the impact of certain discrete non-operating transactions and other events such as (i) the impact on earnings from executive separation, (ii) impairment charges on non-depreciable real estate and (iii) gains on the sale of non-depreciable real estate, if any. The Company believes that Adjusted EBITDAre is useful because it allows investors and management to evaluate and compare the Company's performance from period to period in a meaningful and consistent manner in addition to standard financial measurements under GAAP. EBITDAre and Adjusted EBITDAre are supplemental non-GAAP financial measures and should not be considered alternatives to "Net income" or "Net income attributable to common shareholders" as indicators of the Company's financial performance. Comparison of the Company's presentation of Adjusted EBITDAre to similarly titled measures for other REITs may not necessarily be meaningful due to possible differences in definition and application by such REITs.
Net Debt to Adjusted EBITDAre
Net Debt to Adjusted EBITDAre is a supplemental non-GAAP financial measure and represents (i) the Company's total notional debt, excluding unamortized premium, discount and capitalized loan fees, less cash and cash equivalents and disposition proceeds temporarily restricted related to potential 1031 Exchanges divided by (ii) Adjusted EBITDAre for the prior three months, annualized (Annualized Adjusted EBITDAre). The Company believes that this ratio is useful because it provides investors with information regarding its total notional debt net of cash and cash equivalents and disposition proceeds temporarily restricted related to potential 1031 Exchanges, which could be used to repay debt, compared to its performance as measured using Annualized Adjusted EBITDAre. Comparison of the Company's presentation of Net Debt to Adjusted EBITDAre to similarly titled measures for other REITs may not necessarily be meaningful due to possible differences in definition and application by such REITs.
3rd Quarter 2018 Supplemental Information | 21 | |
Retail Properties of America, Inc.
Reconciliation of Non-GAAP Financial Measures
(amounts in thousands)
(unaudited)
Reconciliation of Net Income Attributable to Common Shareholders to Same Store NOI
Three Months Ended September 30, | Nine Months Ended September 30, | ||||||||||||||
2018 | 2017 | 2018 | 2017 | ||||||||||||
Net income attributable to common shareholders | $ | 12,834 | $ | 33,542 | $ | 65,496 | $ | 134,480 | |||||||
Adjustments to reconcile to Same Store NOI: | |||||||||||||||
Preferred stock dividends | — | 2,362 | — | 7,087 | |||||||||||
Gain on sales of investment properties | (2,692 | ) | (73,082 | ) | (37,211 | ) | (230,874 | ) | |||||||
Depreciation and amortization | 43,169 | 51,469 | 132,107 | 157,268 | |||||||||||
Provision for impairment of investment properties | — | 45,822 | 1,316 | 58,856 | |||||||||||
General and administrative expenses | 9,160 | 7,785 | 31,929 | 29,368 | |||||||||||
Interest expense | 21,336 | 21,110 | 56,918 | 128,077 | |||||||||||
Straight-line rental income, net | (946 | ) | (1,849 | ) | (4,826 | ) | (3,109 | ) | |||||||
Amortization of acquired above and below market lease intangibles, net | (540 | ) | (482 | ) | (3,748 | ) | (1,762 | ) | |||||||
Amortization of lease inducements | 259 | 242 | 746 | 824 | |||||||||||
Lease termination fees, net | (196 | ) | (188 | ) | 477 | (2,310 | ) | ||||||||
Straight-line ground rent expense | 580 | 674 | 1,825 | 2,037 | |||||||||||
Amortization of acquired ground lease intangibles | (140 | ) | (140 | ) | (420 | ) | (420 | ) | |||||||
Other (income) expense, net | (303 | ) | 76 | (853 | ) | (380 | ) | ||||||||
NOI | 82,521 | 87,341 | 243,756 | 279,142 | |||||||||||
NOI from Other Investment Properties | (5,027 | ) | (12,667 | ) | (13,291 | ) | (53,483 | ) | |||||||
Same Store NOI | $ | 77,494 | $ | 74,674 | $ | 230,465 | $ | 225,659 | |||||||
3rd Quarter 2018 Supplemental Information | 22 | |
Retail Properties of America, Inc.
Reconciliation of Non-GAAP Financial Measures (continued)
(amounts in thousands)
(unaudited)
Reconciliation of Mortgages Payable, Net, Unsecured Notes Payable, Net,
Unsecured Term Loans, Net and Unsecured Revolving Line of Credit to Total Net Debt
September 30, 2018 | December 31, 2017 | |||||||
Mortgages payable, net | $ | 206,104 | $ | 287,068 | ||||
Unsecured notes payable, net | 696,209 | 695,748 | ||||||
Unsecured term loans, net | 447,750 | 547,270 | ||||||
Unsecured revolving line of credit | 209,000 | 216,000 | ||||||
Total | 1,559,063 | 1,746,086 | ||||||
Mortgage premium, net of accumulated amortization | (837 | ) | (1,024 | ) | ||||
Mortgage discount, net of accumulated amortization | 547 | 579 | ||||||
Unsecured notes payable discount, net of accumulated amortization | 764 | 853 | ||||||
Capitalized loan fees, net of accumulated amortization | 5,665 | 6,744 | ||||||
Total notional debt | 1,565,202 | 1,753,238 | ||||||
Less: consolidated cash and cash equivalents | (29,702 | ) | (25,185 | ) | ||||
Less: disposition proceeds temporarily restricted related to potential 1031 Exchanges | — | (54,087 | ) | |||||
Total net debt | $ | 1,535,500 | $ | 1,673,966 | ||||
Reconciliation of Net Income to Adjusted EBITDAre
Three Months Ended | ||||||||
September 30, 2018 | December 31, 2017 | |||||||
Net income | $ | 12,834 | $ | 109,924 | ||||
Interest expense | 21,336 | 18,015 | ||||||
Depreciation and amortization | 43,169 | 46,598 | ||||||
Gain on sales of depreciable investment properties | (1,407 | ) | (107,101 | ) | ||||
Provision for impairment of depreciable investment properties | — | 8,147 | ||||||
EBITDAre | $ | 75,932 | $ | 75,583 | ||||
Gain on sale of non-depreciable investment property | (1,285 | ) | — | |||||
Adjusted EBITDAre | $ | 74,647 | $ | 75,583 | ||||
Annualized Adjusted EBITDAre | $ | 298,588 | $ | 302,332 | ||||
Three Months Ended September 30, | Nine Months Ended September 30, | |||||||||||||||
2018 | 2017 | 2018 | 2017 | |||||||||||||
Net income | $ | 12,834 | $ | 35,904 | $ | 65,496 | $ | 141,567 | ||||||||
Interest expense | 21,336 | 21,110 | 56,918 | 128,077 | ||||||||||||
Depreciation and amortization | 43,169 | 51,469 | 132,107 | 157,268 | ||||||||||||
Gain on sales of depreciable investment properties | (1,407 | ) | (73,082 | ) | (33,747 | ) | (230,874 | ) | ||||||||
Provision for impairment of depreciable investment properties | — | 45,822 | 1,316 | 58,856 | ||||||||||||
EBITDAre | 75,932 | 81,223 | 222,090 | 254,894 | ||||||||||||
Gain on sale of non-depreciable investment property | (1,285 | ) | — | (3,464 | ) | — | ||||||||||
Impact on earnings from executive separation | — | (1,086 | ) | 1,737 | (1,086 | ) | ||||||||||
Adjusted EBITDAre | $ | 74,647 | $ | 80,137 | $ | 220,363 | $ | 253,808 | ||||||||
3rd Quarter 2018 Supplemental Information | 23 | |