Attached files
| file | filename |
|---|---|
| 8-K - 8-K - PTC INC. | form8-kq42018earnings.htm |
| EX-99.1 - EXHIBIT 99.1 - PTC INC. | q418pressrelease.htm |
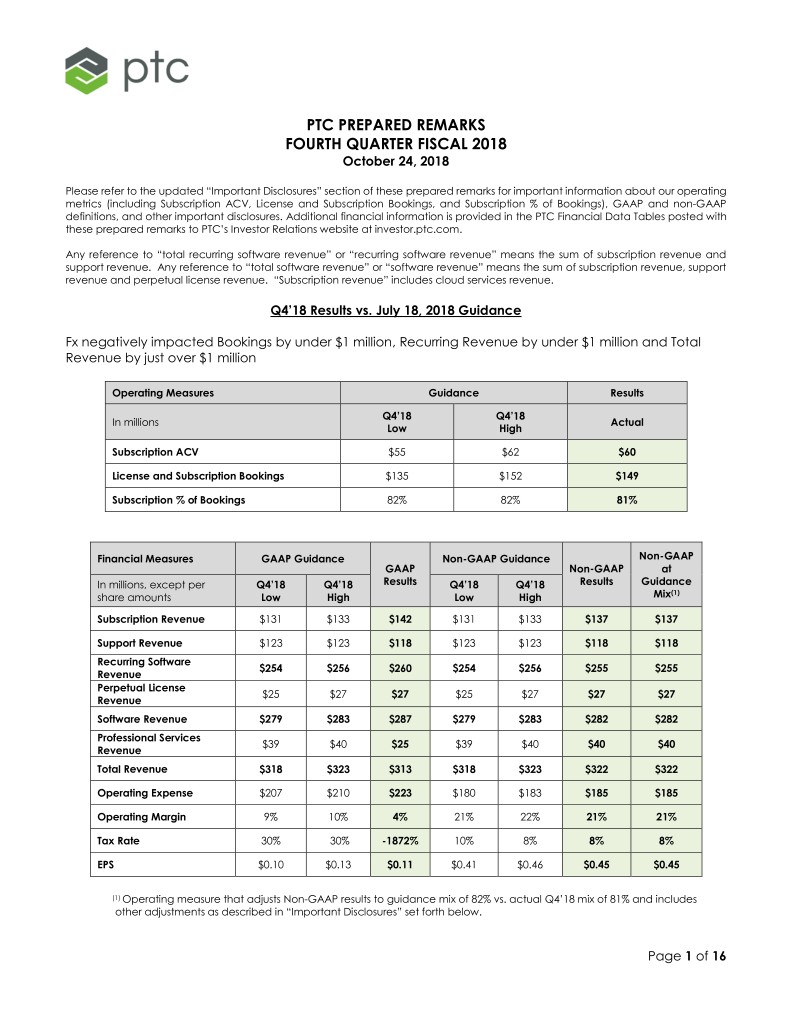
PTC PREPARED REMARKS FOURTH QUARTER FISCAL 2018 October 24, 2018 Please refer to the updated “Important Disclosures” section of these prepared remarks for important information about our operating metrics (including Subscription ACV, License and Subscription Bookings, and Subscription % of Bookings), GAAP and non-GAAP definitions, and other important disclosures. Additional financial information is provided in the PTC Financial Data Tables posted with these prepared remarks to PTC’s Investor Relations website at investor.ptc.com. Any reference to “total recurring software revenue” or “recurring software revenue” means the sum of subscription revenue and support revenue. Any reference to “total software revenue” or “software revenue” means the sum of subscription revenue, support revenue and perpetual license revenue. “Subscription revenue” includes cloud services revenue. Q4’18 Results vs. July 18, 2018 Guidance Fx negatively impacted Bookings by under $1 million, Recurring Revenue by under $1 million and Total Revenue by just over $1 million Operating Measures Guidance Results Q4’18 Q4’18 In millions Actual Low High Subscription ACV $55 $62 $60 License and Subscription Bookings $135 $152 $149 Subscription % of Bookings 82% 82% 81% Financial Measures GAAP Guidance Non-GAAP Guidance Non-GAAP GAAP Non-GAAP at In millions, except per Q4’18 Q4’18 Results Q4’18 Q4’18 Results Guidance share amounts Low High Low High Mix(1) Subscription Revenue $131 $133 $142 $131 $133 $137 $137 Support Revenue $123 $123 $118 $123 $123 $118 $118 Recurring Software $254 $256 $260 $254 $256 $255 $255 Revenue Perpetual License $25 $27 $27 $25 $27 $27 $27 Revenue Software Revenue $279 $283 $287 $279 $283 $282 $282 Professional Services $39 $40 $25 $39 $40 $40 $40 Revenue Total Revenue $318 $323 $313 $318 $323 $322 $322 Operating Expense $207 $210 $223 $180 $183 $185 $185 Operating Margin 9% 10% 4% 21% 22% 21% 21% Tax Rate 30% 30% -1872% 10% 8% 8% 8% EPS $0.10 $0.13 $0.11 $0.41 $0.46 $0.45 $0.45 (1) Operating measure that adjusts Non-GAAP results to guidance mix of 82% vs. actual Q4’18 mix of 81% and includes other adjustments as described in “Important Disclosures” set forth below. Page 1 of 16
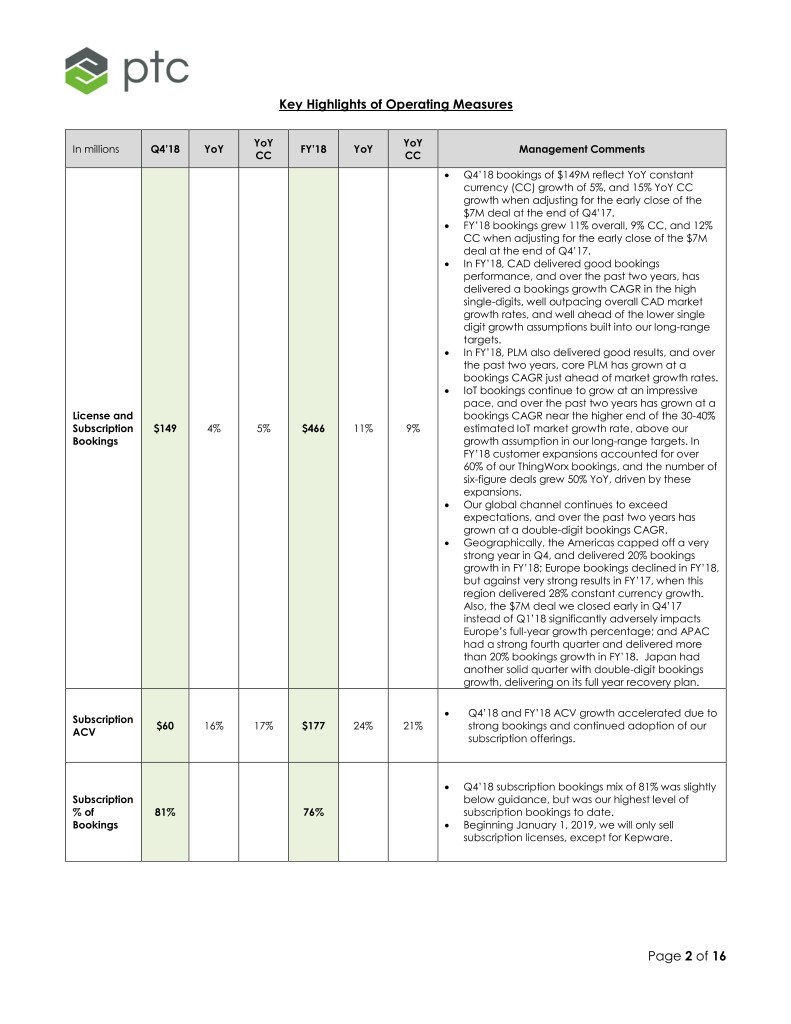
Key Highlights of Operating Measures YoY YoY In millions Q4’18 YoY FY’18 YoY Management Comments CC CC • Q4’18 bookings of $149M reflect YoY constant currency (CC) growth of 5%, and 15% YoY CC growth when adjusting for the early close of the $7M deal at the end of Q4’17. • FY’18 bookings grew 11% overall, 9% CC, and 12% CC when adjusting for the early close of the $7M deal at the end of Q4’17. • In FY’18, CAD delivered good bookings performance, and over the past two years, has delivered a bookings growth CAGR in the high single-digits, well outpacing overall CAD market growth rates, and well ahead of the lower single digit growth assumptions built into our long-range targets. • In FY’18, PLM also delivered good results, and over the past two years, core PLM has grown at a bookings CAGR just ahead of market growth rates. • IoT bookings continue to grow at an impressive pace, and over the past two years has grown at a License and bookings CAGR near the higher end of the 30-40% Subscription $149 4% 5% $466 11% 9% estimated IoT market growth rate, above our Bookings growth assumption in our long-range targets. In FY’18 customer expansions accounted for over 60% of our ThingWorx bookings, and the number of six-figure deals grew 50% YoY, driven by these expansions. • Our global channel continues to exceed expectations, and over the past two years has grown at a double-digit bookings CAGR. • Geographically, the Americas capped off a very strong year in Q4, and delivered 20% bookings growth in FY’18; Europe bookings declined in FY’18, but against very strong results in FY’17, when this region delivered 28% constant currency growth. Also, the $7M deal we closed early in Q4’17 instead of Q1’18 significantly adversely impacts Europe’s full-year growth percentage; and APAC had a strong fourth quarter and delivered more than 20% bookings growth in FY’18. Japan had another solid quarter with double-digit bookings growth, delivering on its full year recovery plan. • Q4’18 and FY’18 ACV growth accelerated due to Subscription $60 16% 17% $177 24% 21% strong bookings and continued adoption of our ACV subscription offerings. • Q4’18 subscription bookings mix of 81% was slightly Subscription below guidance, but was our highest level of % of 81% 76% subscription bookings to date. Bookings • Beginning January 1, 2019, we will only sell subscription licenses, except for Kepware. Page 2 of 16
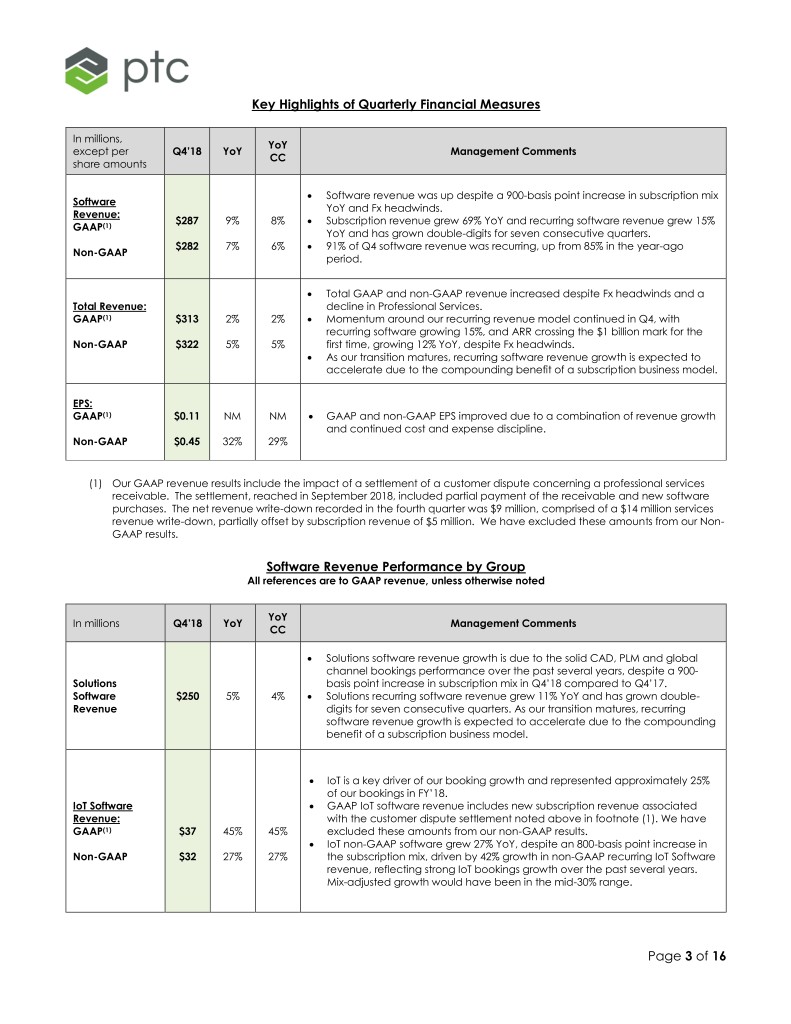
Key Highlights of Quarterly Financial Measures In millions, YoY except per Q4’18 YoY Management Comments CC share amounts • Software revenue was up despite a 900-basis point increase in subscription mix Software YoY and Fx headwinds. Revenue: $287 9% 8% • Subscription revenue grew 69% YoY and recurring software revenue grew 15% GAAP(1) YoY and has grown double-digits for seven consecutive quarters. $282 7% 6% • 91% of Q4 software revenue was recurring, up from 85% in the year-ago Non-GAAP period. • Total GAAP and non-GAAP revenue increased despite Fx headwinds and a Total Revenue: decline in Professional Services. GAAP(1) $313 2% 2% • Momentum around our recurring revenue model continued in Q4, with recurring software growing 15%, and ARR crossing the $1 billion mark for the Non-GAAP $322 5% 5% first time, growing 12% YoY, despite Fx headwinds. • As our transition matures, recurring software revenue growth is expected to accelerate due to the compounding benefit of a subscription business model. EPS: GAAP(1) $0.11 NM NM • GAAP and non-GAAP EPS improved due to a combination of revenue growth and continued cost and expense discipline. Non-GAAP $0.45 32% 29% (1) Our GAAP revenue results include the impact of a settlement of a customer dispute concerning a professional services receivable. The settlement, reached in September 2018, included partial payment of the receivable and new software purchases. The net revenue write-down recorded in the fourth quarter was $9 million, comprised of a $14 million services revenue write-down, partially offset by subscription revenue of $5 million. We have excluded these amounts from our Non- GAAP results. Software Revenue Performance by Group All references are to GAAP revenue, unless otherwise noted YoY In millions Q4’18 YoY Management Comments CC • Solutions software revenue growth is due to the solid CAD, PLM and global channel bookings performance over the past several years, despite a 900- Solutions basis point increase in subscription mix in Q4’18 compared to Q4’17. Software $250 5% 4% • Solutions recurring software revenue grew 11% YoY and has grown double- Revenue digits for seven consecutive quarters. As our transition matures, recurring software revenue growth is expected to accelerate due to the compounding benefit of a subscription business model. • IoT is a key driver of our booking growth and represented approximately 25% of our bookings in FY’18. IoT Software • GAAP IoT software revenue includes new subscription revenue associated Revenue: with the customer dispute settlement noted above in footnote (1). We have GAAP(1) $37 45% 45% excluded these amounts from our non-GAAP results. • IoT non-GAAP software grew 27% YoY, despite an 800-basis point increase in Non-GAAP $32 27% 27% the subscription mix, driven by 42% growth in non-GAAP recurring IoT Software revenue, reflecting strong IoT bookings growth over the past several years. Mix-adjusted growth would have been in the mid-30% range. Page 3 of 16
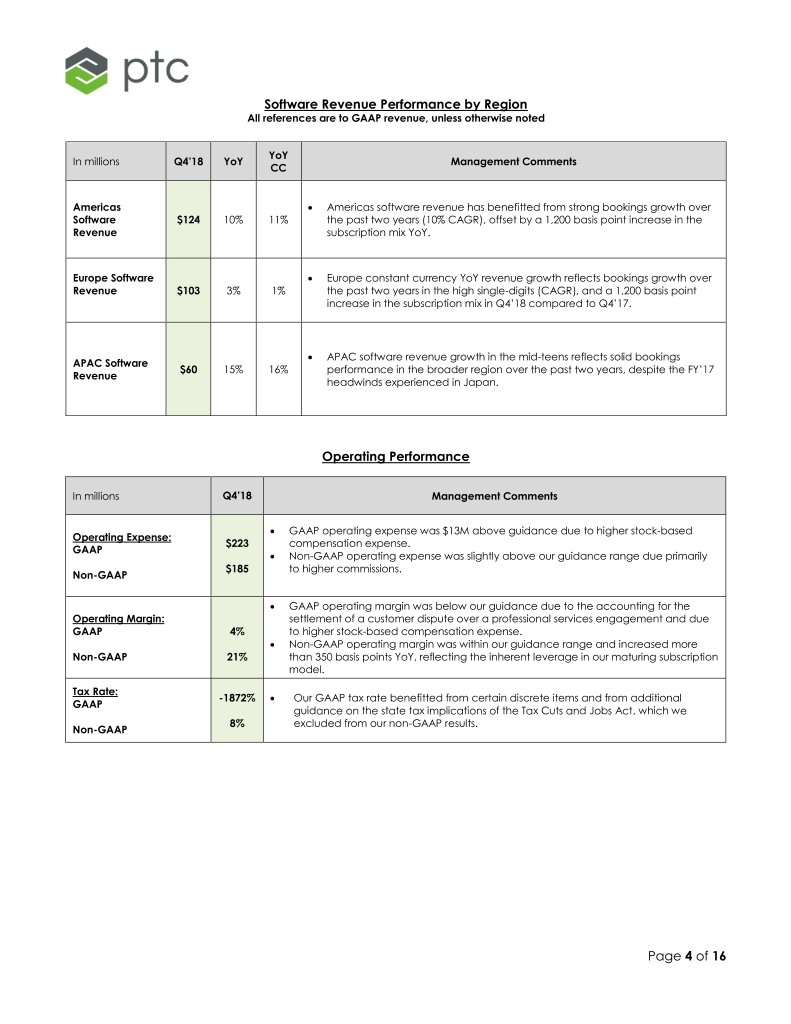
Software Revenue Performance by Region All references are to GAAP revenue, unless otherwise noted YoY In millions Q4’18 YoY Management Comments CC Americas • Americas software revenue has benefitted from strong bookings growth over Software $124 10% 11% the past two years (10% CAGR), offset by a 1,200 basis point increase in the Revenue subscription mix YoY. Europe Software • Europe constant currency YoY revenue growth reflects bookings growth over Revenue $103 3% 1% the past two years in the high single-digits (CAGR), and a 1,200 basis point increase in the subscription mix in Q4’18 compared to Q4’17. • APAC software revenue growth in the mid-teens reflects solid bookings APAC Software $60 15% 16% performance in the broader region over the past two years, despite the FY’17 Revenue headwinds experienced in Japan. Operating Performance In millions Q4’18 Management Comments • GAAP operating expense was $13M above guidance due to higher stock-based Operating Expense: $223 compensation expense. GAAP • Non-GAAP operating expense was slightly above our guidance range due primarily $185 to higher commissions. Non-GAAP • GAAP operating margin was below our guidance due to the accounting for the Operating Margin: settlement of a customer dispute over a professional services engagement and due GAAP 4% to higher stock-based compensation expense. • Non-GAAP operating margin was within our guidance range and increased more Non-GAAP 21% than 350 basis points YoY, reflecting the inherent leverage in our maturing subscription model. Tax Rate: -1872% • Our GAAP tax rate benefitted from certain discrete items and from additional GAAP guidance on the state tax implications of the Tax Cuts and Jobs Act, which we 8% excluded from our non-GAAP results. Non-GAAP Page 4 of 16
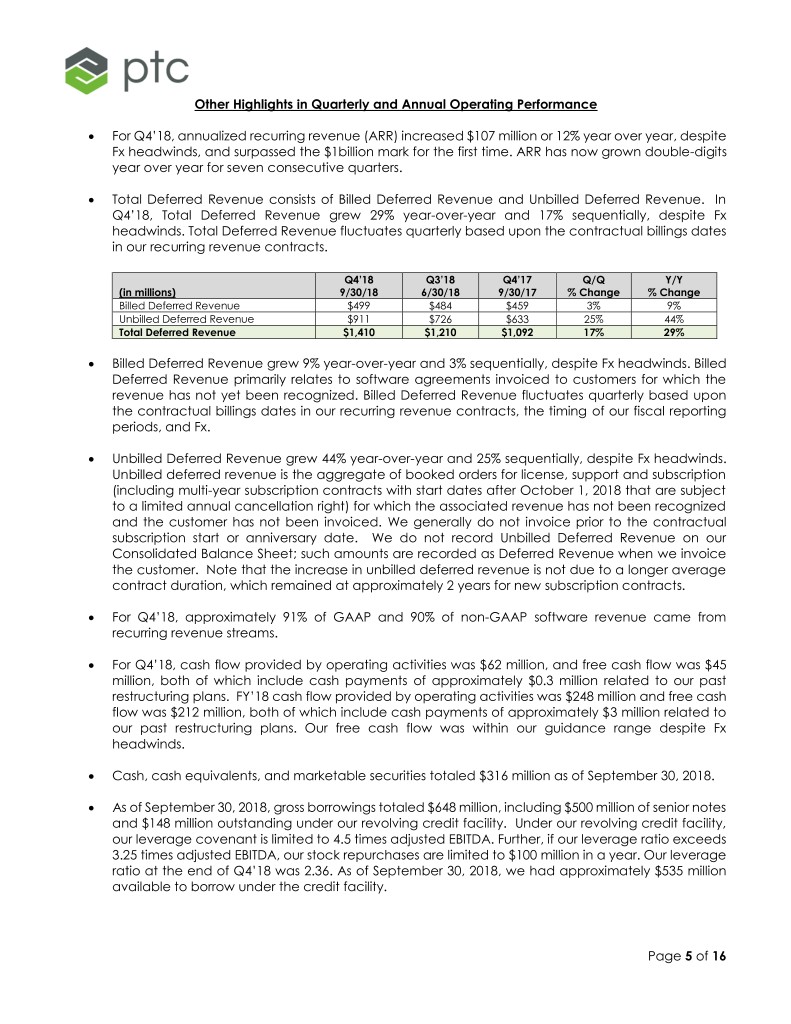
Other Highlights in Quarterly and Annual Operating Performance • For Q4’18, annualized recurring revenue (ARR) increased $107 million or 12% year over year, despite Fx headwinds, and surpassed the $1billion mark for the first time. ARR has now grown double-digits year over year for seven consecutive quarters. • Total Deferred Revenue consists of Billed Deferred Revenue and Unbilled Deferred Revenue. In Q4’18, Total Deferred Revenue grew 29% year-over-year and 17% sequentially, despite Fx headwinds. Total Deferred Revenue fluctuates quarterly based upon the contractual billings dates in our recurring revenue contracts. Q4’18 Q3’18 Q4’17 Q/Q Y/Y (in millions) 9/30/18 6/30/18 9/30/17 % Change % Change Billed Deferred Revenue $499 $484 $459 3% 9% Unbilled Deferred Revenue $911 $726 $633 25% 44% Total Deferred Revenue $1,410 $1,210 $1,092 17% 29% • Billed Deferred Revenue grew 9% year-over-year and 3% sequentially, despite Fx headwinds. Billed Deferred Revenue primarily relates to software agreements invoiced to customers for which the revenue has not yet been recognized. Billed Deferred Revenue fluctuates quarterly based upon the contractual billings dates in our recurring revenue contracts, the timing of our fiscal reporting periods, and Fx. • Unbilled Deferred Revenue grew 44% year-over-year and 25% sequentially, despite Fx headwinds. Unbilled deferred revenue is the aggregate of booked orders for license, support and subscription (including multi-year subscription contracts with start dates after October 1, 2018 that are subject to a limited annual cancellation right) for which the associated revenue has not been recognized and the customer has not been invoiced. We generally do not invoice prior to the contractual subscription start or anniversary date. We do not record Unbilled Deferred Revenue on our Consolidated Balance Sheet; such amounts are recorded as Deferred Revenue when we invoice the customer. Note that the increase in unbilled deferred revenue is not due to a longer average contract duration, which remained at approximately 2 years for new subscription contracts. • For Q4’18, approximately 91% of GAAP and 90% of non-GAAP software revenue came from recurring revenue streams. • For Q4’18, cash flow provided by operating activities was $62 million, and free cash flow was $45 million, both of which include cash payments of approximately $0.3 million related to our past restructuring plans. FY’18 cash flow provided by operating activities was $248 million and free cash flow was $212 million, both of which include cash payments of approximately $3 million related to our past restructuring plans. Our free cash flow was within our guidance range despite Fx headwinds. • Cash, cash equivalents, and marketable securities totaled $316 million as of September 30, 2018. • As of September 30, 2018, gross borrowings totaled $648 million, including $500 million of senior notes and $148 million outstanding under our revolving credit facility. Under our revolving credit facility, our leverage covenant is limited to 4.5 times adjusted EBITDA. Further, if our leverage ratio exceeds 3.25 times adjusted EBITDA, our stock repurchases are limited to $100 million in a year. Our leverage ratio at the end of Q4’18 was 2.36. As of September 30, 2018, we had approximately $535 million available to borrow under the credit facility. Page 5 of 16
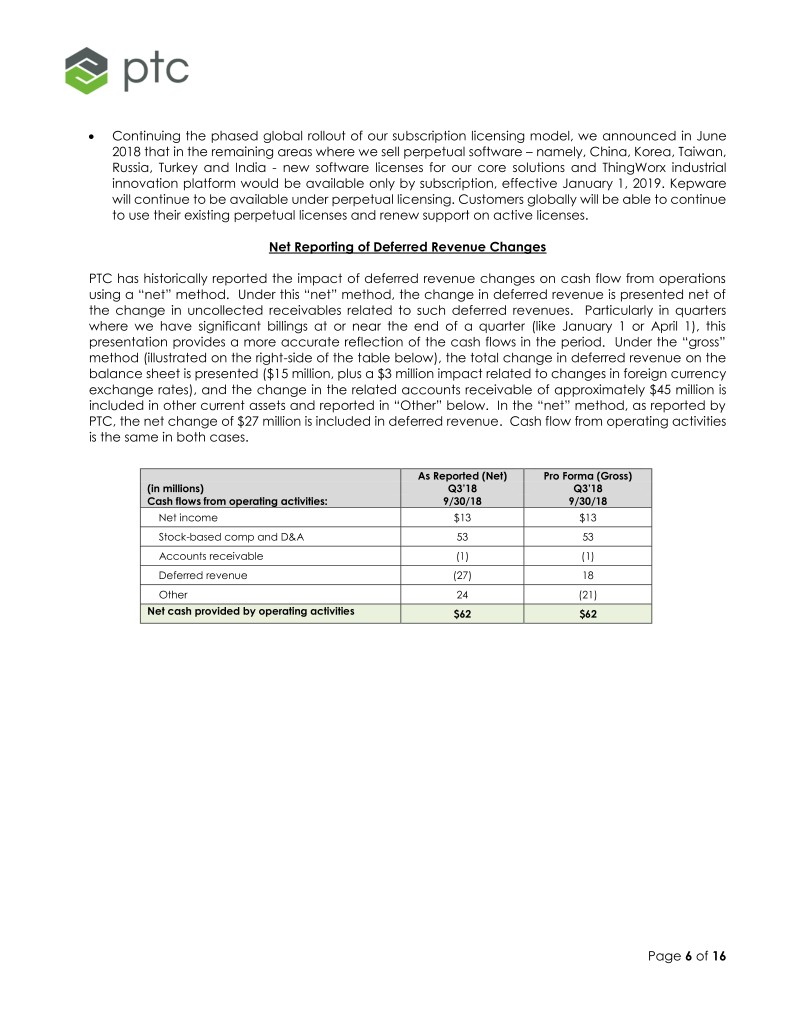
• Continuing the phased global rollout of our subscription licensing model, we announced in June 2018 that in the remaining areas where we sell perpetual software – namely, China, Korea, Taiwan, Russia, Turkey and India - new software licenses for our core solutions and ThingWorx industrial innovation platform would be available only by subscription, effective January 1, 2019. Kepware will continue to be available under perpetual licensing. Customers globally will be able to continue to use their existing perpetual licenses and renew support on active licenses. Net Reporting of Deferred Revenue Changes PTC has historically reported the impact of deferred revenue changes on cash flow from operations using a “net” method. Under this “net” method, the change in deferred revenue is presented net of the change in uncollected receivables related to such deferred revenues. Particularly in quarters where we have significant billings at or near the end of a quarter (like January 1 or April 1), this presentation provides a more accurate reflection of the cash flows in the period. Under the “gross” method (illustrated on the right-side of the table below), the total change in deferred revenue on the balance sheet is presented ($15 million, plus a $3 million impact related to changes in foreign currency exchange rates), and the change in the related accounts receivable of approximately $45 million is included in other current assets and reported in “Other” below. In the “net” method, as reported by PTC, the net change of $27 million is included in deferred revenue. Cash flow from operating activities is the same in both cases. As Reported (Net) Pro Forma (Gross) (in millions) Q3’18 Q3’18 Cash flows from operating activities: 9/30/18 9/30/18 Net income $13 $13 Stock-based comp and D&A 53 53 Accounts receivable (1) (1) Deferred revenue (27) 18 Other 24 (21) Net cash provided by operating activities $62 $62 Page 6 of 16
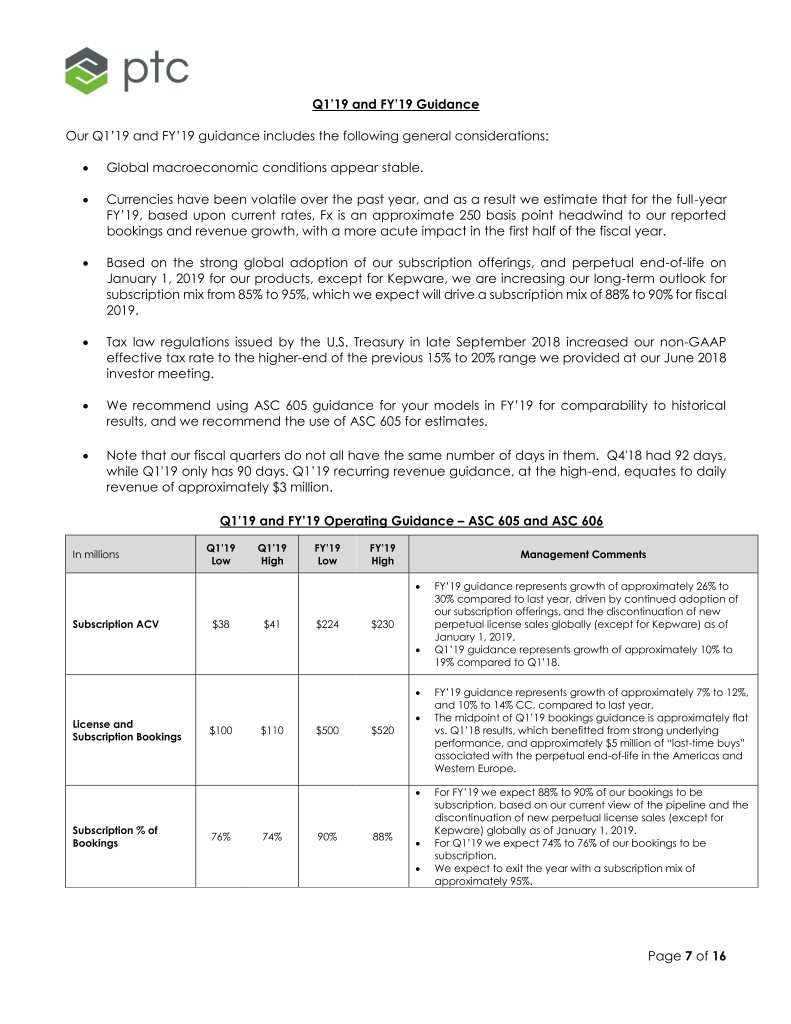
Q1’19 and FY’19 Guidance Our Q1’19 and FY’19 guidance includes the following general considerations: • Global macroeconomic conditions appear stable. • Currencies have been volatile over the past year, and as a result we estimate that for the full-year FY’19, based upon current rates, Fx is an approximate 250 basis point headwind to our reported bookings and revenue growth, with a more acute impact in the first half of the fiscal year. • Based on the strong global adoption of our subscription offerings, and perpetual end-of-life on January 1, 2019 for our products, except for Kepware, we are increasing our long-term outlook for subscription mix from 85% to 95%, which we expect will drive a subscription mix of 88% to 90% for fiscal 2019. • Tax law regulations issued by the U.S. Treasury in late September 2018 increased our non-GAAP effective tax rate to the higher-end of the previous 15% to 20% range we provided at our June 2018 investor meeting. • We recommend using ASC 605 guidance for your models in FY’19 for comparability to historical results, and we recommend the use of ASC 605 for estimates. • Note that our fiscal quarters do not all have the same number of days in them. Q4'18 had 92 days, while Q1'19 only has 90 days. Q1’19 recurring revenue guidance, at the high-end, equates to daily revenue of approximately $3 million. Q1’19 and FY’19 Operating Guidance – ASC 605 and ASC 606 Q1’19 Q1’19 FY’19 FY’19 In millions Management Comments Low High Low High • FY’19 guidance represents growth of approximately 26% to 30% compared to last year, driven by continued adoption of our subscription offerings, and the discontinuation of new Subscription ACV $38 $41 $224 $230 perpetual license sales globally (except for Kepware) as of January 1, 2019. • Q1’19 guidance represents growth of approximately 10% to 19% compared to Q1’18. • FY’19 guidance represents growth of approximately 7% to 12%, and 10% to 14% CC, compared to last year. • The midpoint of Q1’19 bookings guidance is approximately flat License and $100 $110 $500 $520 vs. Q1’18 results, which benefitted from strong underlying Subscription Bookings performance, and approximately $5 million of “last-time buys” associated with the perpetual end-of-life in the Americas and Western Europe. • For FY’19 we expect 88% to 90% of our bookings to be subscription, based on our current view of the pipeline and the discontinuation of new perpetual license sales (except for Subscription % of Kepware) globally as of January 1, 2019. 76% 74% 90% 88% Bookings • For Q1’19 we expect 74% to 76% of our bookings to be subscription. • We expect to exit the year with a subscription mix of approximately 95%. Page 7 of 16
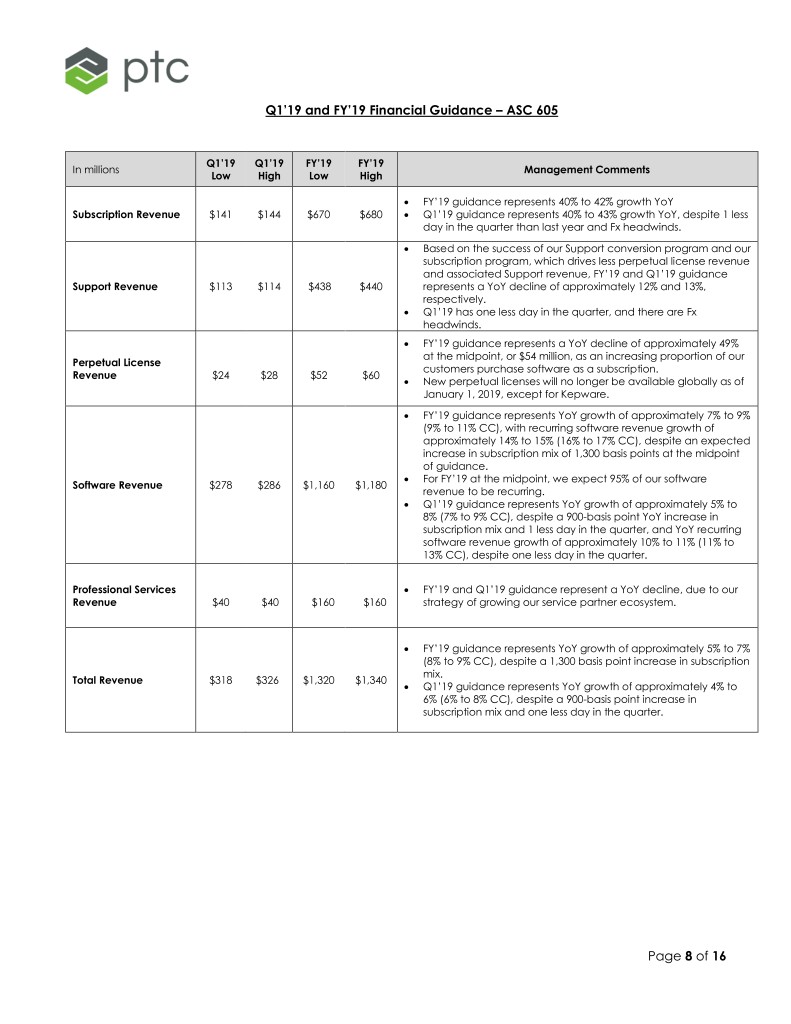
Q1’19 and FY’19 Financial Guidance – ASC 605 Q1’19 Q1’19 FY’19 FY’19 In millions Management Comments Low High Low High • FY’19 guidance represents 40% to 42% growth YoY Subscription Revenue $141 $144 $670 $680 • Q1’19 guidance represents 40% to 43% growth YoY, despite 1 less day in the quarter than last year and Fx headwinds. • Based on the success of our Support conversion program and our subscription program, which drives less perpetual license revenue and associated Support revenue, FY’19 and Q1’19 guidance Support Revenue $113 $114 $438 $440 represents a YoY decline of approximately 12% and 13%, respectively. • Q1’19 has one less day in the quarter, and there are Fx headwinds. • FY’19 guidance represents a YoY decline of approximately 49% at the midpoint, or $54 million, as an increasing proportion of our Perpetual License customers purchase software as a subscription. Revenue $24 $28 $52 $60 • New perpetual licenses will no longer be available globally as of January 1, 2019, except for Kepware. • FY’19 guidance represents YoY growth of approximately 7% to 9% (9% to 11% CC), with recurring software revenue growth of approximately 14% to 15% (16% to 17% CC), despite an expected increase in subscription mix of 1,300 basis points at the midpoint of guidance. • For FY’19 at the midpoint, we expect 95% of our software Software Revenue $278 $286 $1,160 $1,180 revenue to be recurring. • Q1’19 guidance represents YoY growth of approximately 5% to 8% (7% to 9% CC), despite a 900-basis point YoY increase in subscription mix and 1 less day in the quarter, and YoY recurring software revenue growth of approximately 10% to 11% (11% to 13% CC), despite one less day in the quarter. Professional Services • FY’19 and Q1’19 guidance represent a YoY decline, due to our Revenue $40 $40 $160 $160 strategy of growing our service partner ecosystem. • FY’19 guidance represents YoY growth of approximately 5% to 7% (8% to 9% CC), despite a 1,300 basis point increase in subscription mix. Total Revenue $318 $326 $1,320 $1,340 • Q1’19 guidance represents YoY growth of approximately 4% to 6% (6% to 8% CC), despite a 900-basis point increase in subscription mix and one less day in the quarter. Page 8 of 16
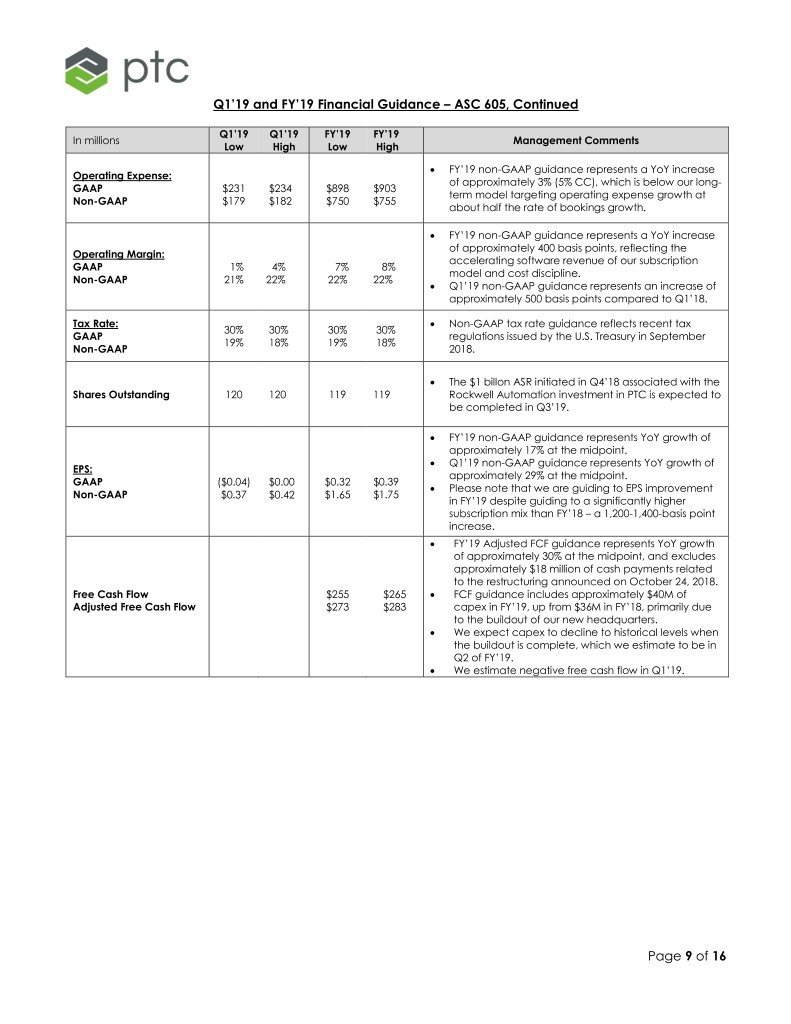
Q1’19 and FY’19 Financial Guidance – ASC 605, Continued Q1’19 Q1’19 FY’19 FY’19 In millions Management Comments Low High Low High • FY’19 non-GAAP guidance represents a YoY increase Operating Expense: of approximately 3% (5% CC), which is below our long- GAAP $231 $234 $898 $903 term model targeting operating expense growth at Non-GAAP $179 $182 $750 $755 about half the rate of bookings growth. • FY’19 non-GAAP guidance represents a YoY increase of approximately 400 basis points, reflecting the Operating Margin: accelerating software revenue of our subscription GAAP 1% 4% 7% 8% model and cost discipline. Non-GAAP 21% 22% 22% 22% • Q1’19 non-GAAP guidance represents an increase of approximately 500 basis points compared to Q1’18. Tax Rate: • Non-GAAP tax rate guidance reflects recent tax 30% 30% 30% 30% GAAP regulations issued by the U.S. Treasury in September 19% 18% 19% 18% Non-GAAP 2018. • The $1 billon ASR initiated in Q4’18 associated with the Shares Outstanding 120 120 119 119 Rockwell Automation investment in PTC is expected to be completed in Q3’19. • FY’19 non-GAAP guidance represents YoY growth of approximately 17% at the midpoint. • Q1’19 non-GAAP guidance represents YoY growth of EPS: approximately 29% at the midpoint. GAAP ($0.04) $0.00 $0.32 $0.39 • Please note that we are guiding to EPS improvement Non-GAAP $0.37 $0.42 $1.65 $1.75 in FY’19 despite guiding to a significantly higher subscription mix than FY’18 – a 1,200-1,400-basis point increase. • FY’19 Adjusted FCF guidance represents YoY growth of approximately 30% at the midpoint, and excludes approximately $18 million of cash payments related to the restructuring announced on October 24, 2018. Free Cash Flow $255 $265 • FCF guidance includes approximately $40M of Adjusted Free Cash Flow $273 $283 capex in FY’19, up from $36M in FY’18, primarily due to the buildout of our new headquarters. • We expect capex to decline to historical levels when the buildout is complete, which we estimate to be in Q2 of FY’19. • We estimate negative free cash flow in Q1’19. Page 9 of 16
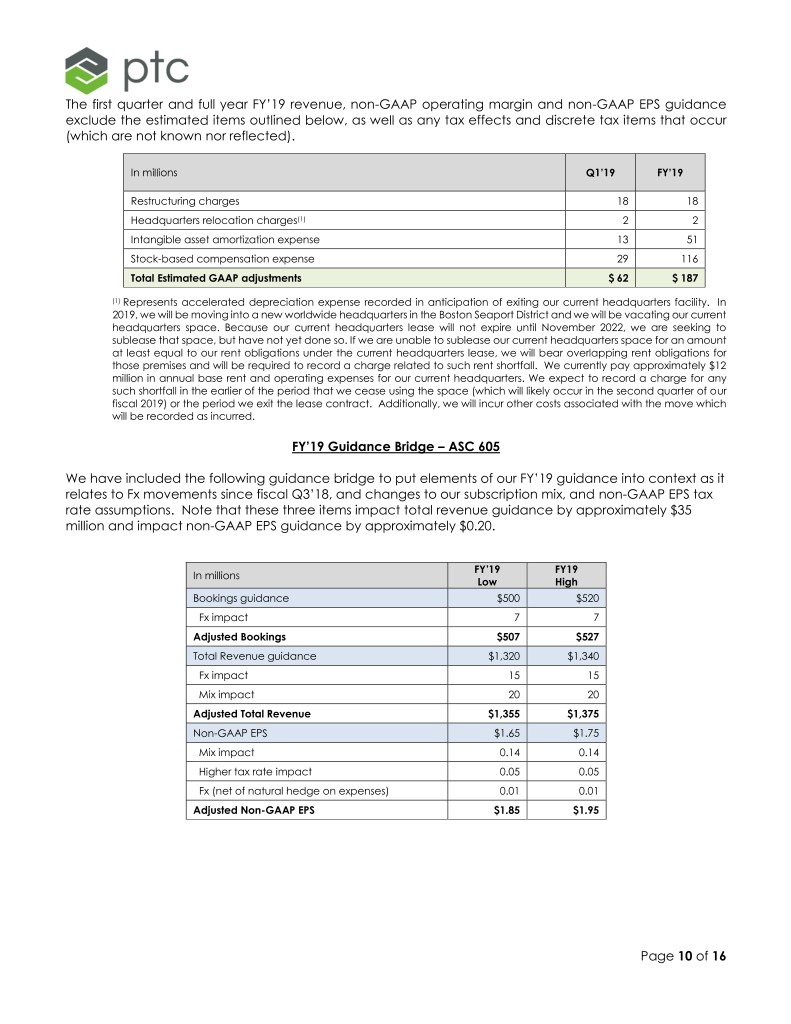
The first quarter and full year FY’19 revenue, non-GAAP operating margin and non-GAAP EPS guidance exclude the estimated items outlined below, as well as any tax effects and discrete tax items that occur (which are not known nor reflected). In millions Q1’19 FY’19 Restructuring charges 18 18 Headquarters relocation charges(1) 2 2 Intangible asset amortization expense 13 51 Stock-based compensation expense 29 116 Total Estimated GAAP adjustments $ 62 $ 187 (1) Represents accelerated depreciation expense recorded in anticipation of exiting our current headquarters facility. In 2019, we will be moving into a new worldwide headquarters in the Boston Seaport District and we will be vacating our current headquarters space. Because our current headquarters lease will not expire until November 2022, we are seeking to sublease that space, but have not yet done so. If we are unable to sublease our current headquarters space for an amount at least equal to our rent obligations under the current headquarters lease, we will bear overlapping rent obligations for those premises and will be required to record a charge related to such rent shortfall. We currently pay approximately $12 million in annual base rent and operating expenses for our current headquarters. We expect to record a charge for any such shortfall in the earlier of the period that we cease using the space (which will likely occur in the second quarter of our fiscal 2019) or the period we exit the lease contract. Additionally, we will incur other costs associated with the move which will be recorded as incurred. FY’19 Guidance Bridge – ASC 605 We have included the following guidance bridge to put elements of our FY’19 guidance into context as it relates to Fx movements since fiscal Q3’18, and changes to our subscription mix, and non-GAAP EPS tax rate assumptions. Note that these three items impact total revenue guidance by approximately $35 million and impact non-GAAP EPS guidance by approximately $0.20. FY’19 FY19 In millions Low High Bookings guidance $500 $520 Fx impact 7 7 Adjusted Bookings $507 $527 Total Revenue guidance $1,320 $1,340 Fx impact 15 15 Mix impact 20 20 Adjusted Total Revenue $1,355 $1,375 Non-GAAP EPS $1.65 $1.75 Mix impact 0.14 0.14 Higher tax rate impact 0.05 0.05 Fx (net of natural hedge on expenses) 0.01 0.01 Adjusted Non-GAAP EPS $1.85 $1.95 Page 10 of 16
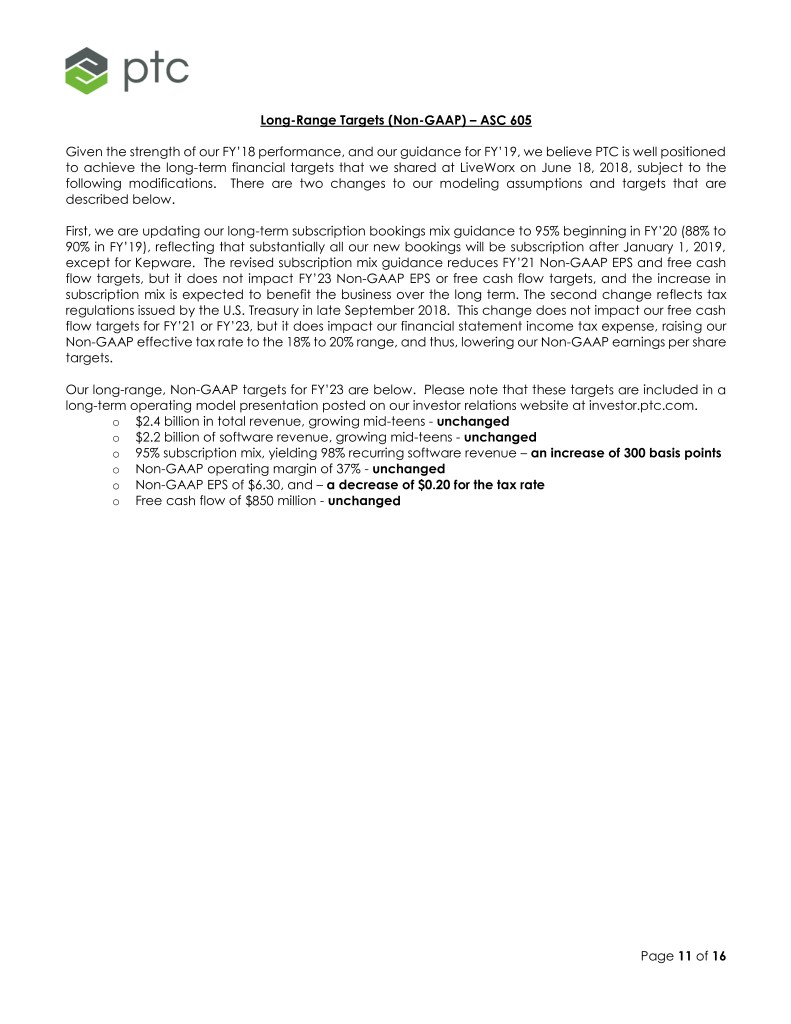
Long-Range Targets (Non-GAAP) – ASC 605 Given the strength of our FY’18 performance, and our guidance for FY’19, we believe PTC is well positioned to achieve the long-term financial targets that we shared at LiveWorx on June 18, 2018, subject to the following modifications. There are two changes to our modeling assumptions and targets that are described below. First, we are updating our long-term subscription bookings mix guidance to 95% beginning in FY’20 (88% to 90% in FY’19), reflecting that substantially all our new bookings will be subscription after January 1, 2019, except for Kepware. The revised subscription mix guidance reduces FY’21 Non-GAAP EPS and free cash flow targets, but it does not impact FY’23 Non-GAAP EPS or free cash flow targets, and the increase in subscription mix is expected to benefit the business over the long term. The second change reflects tax regulations issued by the U.S. Treasury in late September 2018. This change does not impact our free cash flow targets for FY’21 or FY’23, but it does impact our financial statement income tax expense, raising our Non-GAAP effective tax rate to the 18% to 20% range, and thus, lowering our Non-GAAP earnings per share targets. Our long-range, Non-GAAP targets for FY’23 are below. Please note that these targets are included in a long-term operating model presentation posted on our investor relations website at investor.ptc.com. o $2.4 billion in total revenue, growing mid-teens - unchanged o $2.2 billion of software revenue, growing mid-teens - unchanged o 95% subscription mix, yielding 98% recurring software revenue – an increase of 300 basis points o Non-GAAP operating margin of 37% - unchanged o Non-GAAP EPS of $6.30, and – a decrease of $0.20 for the tax rate o Free cash flow of $850 million - unchanged Page 11 of 16
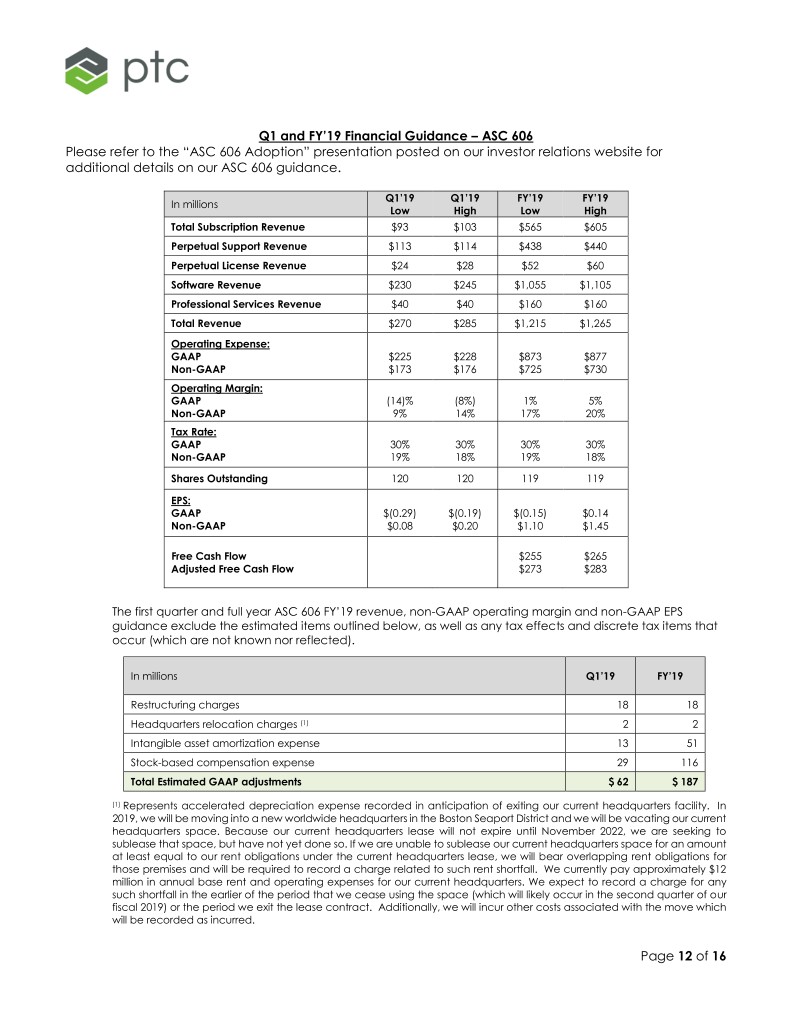
Q1 and FY’19 Financial Guidance – ASC 606 Please refer to the “ASC 606 Adoption” presentation posted on our investor relations website for additional details on our ASC 606 guidance. Q1’19 Q1’19 FY’19 FY’19 In millions Low High Low High Total Subscription Revenue $93 $103 $565 $605 Perpetual Support Revenue $113 $114 $438 $440 Perpetual License Revenue $24 $28 $52 $60 Software Revenue $230 $245 $1,055 $1,105 Professional Services Revenue $40 $40 $160 $160 Total Revenue $270 $285 $1,215 $1,265 Operating Expense: GAAP $225 $228 $873 $877 Non-GAAP $173 $176 $725 $730 Operating Margin: GAAP (14)% (8%) 1% 5% Non-GAAP 9% 14% 17% 20% Tax Rate: GAAP 30% 30% 30% 30% Non-GAAP 19% 18% 19% 18% Shares Outstanding 120 120 119 119 EPS: GAAP $(0.29) $(0.19) $(0.15) $0.14 Non-GAAP $0.08 $0.20 $1.10 $1.45 Free Cash Flow $255 $265 Adjusted Free Cash Flow $273 $283 The first quarter and full year ASC 606 FY’19 revenue, non-GAAP operating margin and non-GAAP EPS guidance exclude the estimated items outlined below, as well as any tax effects and discrete tax items that occur (which are not known nor reflected). In millions Q1’19 FY’19 Restructuring charges 18 18 Headquarters relocation charges (1) 2 2 Intangible asset amortization expense 13 51 Stock-based compensation expense 29 116 Total Estimated GAAP adjustments $ 62 $ 187 (1) Represents accelerated depreciation expense recorded in anticipation of exiting our current headquarters facility. In 2019, we will be moving into a new worldwide headquarters in the Boston Seaport District and we will be vacating our current headquarters space. Because our current headquarters lease will not expire until November 2022, we are seeking to sublease that space, but have not yet done so. If we are unable to sublease our current headquarters space for an amount at least equal to our rent obligations under the current headquarters lease, we will bear overlapping rent obligations for those premises and will be required to record a charge related to such rent shortfall. We currently pay approximately $12 million in annual base rent and operating expenses for our current headquarters. We expect to record a charge for any such shortfall in the earlier of the period that we cease using the space (which will likely occur in the second quarter of our fiscal 2019) or the period we exit the lease contract. Additionally, we will incur other costs associated with the move which will be recorded as incurred. Page 12 of 16
Important Disclosures Reporting metrics and non-GAAP definitions – Management believes certain operating measures and non- GAAP financial measures provide additional meaningful information that should be considered when assessing our performance. These measures should be considered in addition to, not as a substitute for, the reported GAAP results. Software licensing model – The majority of our software sales historically were perpetual licenses, where customers own the software license. Typically, our customers choose to pay for ongoing support, which includes the right to software upgrades and technical support, and attach rates on support are in the high 90% range with retention rates also in the 90% range. For fiscal 2016, fiscal 2017, and fiscal 2018, a majority of our new license bookings have consisted of ratably recognized subscriptions. Under a subscription, customers pay a periodic fee for the continuing right to use our software, including access to technical support. They may also elect to use our cloud services and have us manage the application. We began offering subscription pricing as an option for most PTC products in Q1 FY’15, and as of January of 2018, we no longer offer new perpetual licenses in the Americas and Western Europe, except for Kepware. We believe subscription has proved attractive to customers as it: (1) increases customer flexibility and opportunity to change their mix of licenses; (2) lowers the initial purchase commitment; and (3) allows customers to use operating rather than capital budgets. Over a four to five-year period we believe the value of a subscription is likely to exceed that of a perpetual license, assuming similar seat counts. However, initial revenue, operating margin, and EPS will be lower as revenue is recognized ratably in a subscription, rather than up front. Bookings Metrics We offer both perpetual and subscription licensing options to our customers, as well as monthly software rentals for certain products. Given the difference in revenue recognition between the sale of a perpetual software license (revenue is recognized at the time of sale) and a subscription (revenue is deferred and recognized ratably over the subscription term), we use bookings for internal planning, forecasting and reporting of new license and cloud services transactions. In order to normalize between perpetual and subscription licenses, we define subscription bookings as the subscription annualized contract value (subscription ACV) of new subscription bookings multiplied by a conversion factor of 2. We arrived at the conversion factor of 2 by considering a number of variables including pricing, support, length of term, and renewal rates. We define subscription ACV as the total value of a new subscription booking divided by the term of the contract (in days) multiplied by 365. If the term of the subscription contract is less than a year, and is not associated with an existing contract, the booking is equal to the total contract value. Beginning in Q3’18, minimum ACV commitments under our Strategic Alliance Agreement with Rockwell Automation are included in subscription ACV if the period-to-date minimum ACV commitment exceeds actual ACV sold under the Agreement. License and subscription bookings equal subscription bookings (as described above) plus perpetual license bookings. Because subscription bookings is a metric we use to approximate the value of subscription sales if sold as perpetual licenses, it does not represent the actual revenue that will be recognized with respect to subscription sales or that would be recognized if the sales were perpetual licenses, nor does the annualized value of monthly software rental bookings represent the value of any such booking. Navigate Allocation -- Revenue and bookings for Navigate™, a ThingWorx-based IoT solution for PLM are allocated 50% to Solutions and 50% to IoT. Annualized Recurring Revenue (ARR) - To help investors understand and assess the success of our subscription transition, we provide an Annualized Recurring Revenue operating measure. Annualized Recurring Revenue (ARR) for a given quarter is calculated by dividing the portion of non-GAAP software revenue attributable to subscription and support for the quarter by the number of days in the quarter and multiplying by 365. (A related metric is Subscription ARR, which is calculated by dividing the portion of non- Page 13 of 16

GAAP revenue attributable to subscription for the quarter by the number of days in the quarter and multiplying by 365.) ARR should be viewed independently of revenue and deferred revenue as it is an operating measure and is not intended to be combined with or to replace either of those items. ARR is not a forecast of future revenue, which can be impacted by contract expiration and renewal rates, and does not include revenue reported as perpetual license or professional services revenue in our consolidated statement of income. Subscription and support revenue and ARR disclosed in a quarter can be impacted by multiple factors, including but not limited to (1) the timing of the start of a contract or a renewal, including the impact of on-time renewals, support win-backs, and support conversions, which may vary by quarter, (2) the ramping of committed monthly payments under a subscription agreement over time, and (3) multiple other contractual factors with the customer including other elements sold with the subscription or support contract, and (4) the impact of currency fluctuations. These factors can result in variability in disclosed ARR. Foreign Currency Impacts on our Business – We have a global business, with Europe and Asia historically representing approximately 60% of our revenue, and fluctuation in foreign currency exchange rates can significantly impact our results. We do not forecast currency movements; rather we provide detailed constant currency commentary. We employ a hedging strategy to limit our exposure to currency risk. Constant Currency Change Measure (YoY CC) – Year-over-year changes in revenue on a constant currency basis compare reported results excluding the effect of any hedging converted into U.S. dollars based on the corresponding prior year’s foreign currency exchange rates to reported results for the comparable prior year period. Important Information about Non-GAAP References PTC provides non-GAAP supplemental information to its financial results. We use these non-GAAP measures, and we believe that they assist our investors, to make period-to-period comparisons of our operational performance because they provide a view of our operating results without items that are not, in our view, indicative of our core operating results. We believe that these non-GAAP measures help illustrate underlying trends in our business, and we use the measures to establish budgets and operational goals, communicated internally and externally, for managing our business and evaluating our performance. We believe that providing non-GAAP measures affords investors a view of our operating results that may be more easily compared to the results of peer companies. In addition, compensation of our executives is based in part on the performance of our business based on these non-GAAP measures. However, non- GAAP information should not be construed as an alternative to GAAP information as the items excluded from the non-GAAP measures often have a material impact on our financial results and such items often recur. Management uses, and investors should consider, non-GAAP measures in conjunction with our GAAP results. Non-GAAP revenue, non-GAAP operating expense, non-GAAP operating margin, non-GAAP gross profit, non-GAAP gross margin, non-GAAP net income and non-GAAP EPS exclude the effect of the following items: a revenue write-down and revenue associated with the settlement of a previously disclosed disputed customer receivable, fair value of acquired deferred revenue, fair value adjustment to deferred services cost, stock-based compensation, amortization of acquired intangible assets, acquisition-related and other transactional charges included in general and administrative costs, restructuring charges, headquarters relocation charges, and income tax adjustments. Page 14 of 16
Settlement Revenue Exclusions. In Q4'18, we settled a previously disclosed dispute with respect to a customer receivable. The settlement included partial payment of the receivable and new software purchases. The net revenue write-down recorded in Q4'18 was $9.3 million, comprised of a $14.5 million professional services revenue write-down, partially offset by new subscription revenue of $5.2 million. We excluded the professional services revenue write-down because the write-down related to revenue that was recorded in periods prior to CY17 and is not reflective of current operating performance and excluded the new subscription revenue because it mitigated the impact of the professional services revenue write- down. A reconciliation of non-GAAP measures to GAAP results is provided within these prepared remarks. PTC also provides information on “free cash flow” and “adjusted free cash flow” to enable investors to assess our ability to generate cash without incurring additional external financings and to evaluate our performance against our announced long-term goal of returning approximately 40% of our free cash flow to shareholders via stock repurchases. Free cash flow is net cash provided by (used in) operating activities less capital expenditures; adjusted free cash flow is free cash flow excluding restructuring payments and certain identified non-ordinary course payments. Free cash flow and adjusted free cash flow are not measures of cash available for discretionary expenditures. Forward-Looking Statements Statements in this press release that are not historic facts, including statements about our first quarter and full fiscal 2019 targets, and other future financial and growth expectations and targets and anticipated tax rates, are forward-looking statements that involve risks and uncertainties that could cause actual results to differ materially from those projected. These risks include: the macroeconomic and/or global manufacturing climates may deteriorate; customers may not purchase our solutions or convert existing support contracts to subscription when or at the rates we expect; our businesses, including our Internet of Things (IoT) business, and Augmented Reality businesses, may not expand and/or generate the revenue we expect; foreign currency exchange rates may vary from our expectations and thereby affect our reported revenue and expense; the mix of revenue between license & subscription solutions, support and professional services could be different than we expect, which could impact our EPS results; our transition to subscription-only licensing could adversely affect sales and revenue; sales of our solutions as subscriptions may not have the longer-term effect on revenue and earnings that we expect; bookings associated with minimum ACV commitments under our Strategic Alliance Agreement with Rockwell Automation may not result in subscription contracts sold through to end-user customers; our strategic initiatives and investments may not generate the revenue we expect; we may be unable to expand our partner ecosystem as we expect and our partners may not generate the revenue we expect; we may be unable to generate sufficient operating cash flow to return 40% of free cash flow to shareholders and other uses of cash or our credit facility limits or other matters could preclude share repurchases. In addition, our assumptions concerning our future GAAP and non-GAAP effective income tax rates are based on estimates and other factors that could change, including the geographic mix of our revenue, expenses and profits. Other risks and uncertainties that could cause actual results to differ materially from those projected are detailed from time to time in reports we file with the Securities and Exchange Commission, including our most recent Annual Report on Form 10-K and Quarterly Reports on Form 10-Q. PTC and the PTC logo are trademarks or registered trademarks of PTC Inc. or its subsidiaries in the United States and in other countries. Page 15 of 16
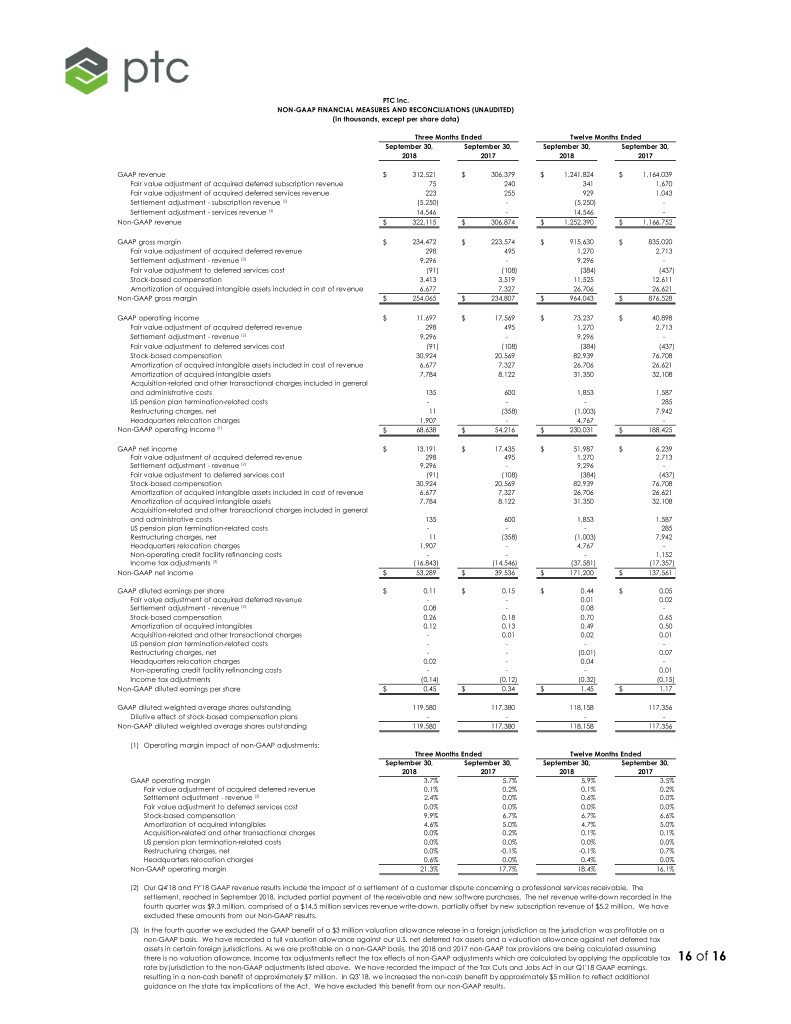
PTC Inc. NON-GAAP FINANCIAL MEASURES AND RECONCILIATIONS (UNAUDITED) (in thousands, except per share data) Three Months Ended Twelve Months Ended September 30, September 30, September 30, September 30, 2018 2017 2018 2017 GAAP revenue $ 312,521 $ 306,379 $ 1,241,824 $ 1,164,039 Fair value adjustment of acquired deferred subscription revenue 75 240 341 1,670 Fair value adjustment of acquired deferred services revenue 223 255 929 1,043 Settlement adjustment - subscription revenue (2) (5,250) - (5,250) - Settlement adjustment - services revenue (2) 14,546 - 14,546 - Non-GAAP revenue $ 322,115 $ 306,874 $ 1,252,390 $ 1,166,752 GAAP gross margin $ 234,472 $ 223,574 $ 915,630 $ 835,020 Fair value adjustment of acquired deferred revenue 298 495 1,270 2,713 Settlement adjustment - revenue (2) 9,296 - 9,296 - Fair value adjustment to deferred services cost (91) (108) (384) (437) Stock-based compensation 3,413 3,519 11,525 12,611 Amortization of acquired intangible assets included in cost of revenue 6,677 7,327 26,706 26,621 Non-GAAP gross margin $ 254,065 $ 234,807 $ 964,043 $ 876,528 GAAP operating income $ 11,697 $ 17,569 $ 73,237 $ 40,898 Fair value adjustment of acquired deferred revenue 298 495 1,270 2,713 Settlement adjustment - revenue (2) 9,296 - 9,296 - Fair value adjustment to deferred services cost (91) (108) (384) (437) Stock-based compensation 30,924 20,569 82,939 76,708 Amortization of acquired intangible assets included in cost of revenue 6,677 7,327 26,706 26,621 Amortization of acquired intangible assets 7,784 8,122 31,350 32,108 Acquisition-related and other transactional charges included in general and administrative costs 135 600 1,853 1,587 US pension plan termination-related costs - - - 285 Restructuring charges, net 11 (358) (1,003) 7,942 Headquarters relocation charges 1,907 - 4,767 - Non-GAAP operating income (1) $ 68,638 $ 54,216 $ 230,031 $ 188,425 GAAP net income $ 13,191 $ 17,435 $ 51,987 $ 6,239 Fair value adjustment of acquired deferred revenue 298 495 1,270 2,713 Settlement adjustment - revenue (2) 9,296 - 9,296 - Fair value adjustment to deferred services cost (91) (108) (384) (437) Stock-based compensation 30,924 20,569 82,939 76,708 Amortization of acquired intangible assets included in cost of revenue 6,677 7,327 26,706 26,621 Amortization of acquired intangible assets 7,784 8,122 31,350 32,108 Acquisition-related and other transactional charges included in general and administrative costs 135 600 1,853 1,587 US pension plan termination-related costs - - - 285 Restructuring charges, net 11 (358) (1,003) 7,942 Headquarters relocation charges 1,907 - 4,767 - Non-operating credit facility refinancing costs - - - 1,152 Income tax adjustments (3) (16,843) (14,546) (37,581) (17,357) Non-GAAP net income $ 53,289 $ 39,536 $ 171,200 $ 137,561 GAAP diluted earnings per share $ 0.11 $ 0.15 $ 0.44 $ 0.05 Fair value adjustment of acquired deferred revenue - - 0.01 0.02 Settlement adjustment - revenue (2) 0.08 - 0.08 - Stock-based compensation 0.26 0.18 0.70 0.65 Amortization of acquired intangibles 0.12 0.13 0.49 0.50 Acquisition-related and other transactional charges - 0.01 0.02 0.01 US pension plan termination-related costs - - - - Restructuring charges, net - - (0.01) 0.07 Headquarters relocation charges 0.02 - 0.04 - Non-operating credit facility refinancing costs - - - 0.01 Income tax adjustments (0.14) (0.12) (0.32) (0.15) Non-GAAP diluted earnings per share $ 0.45 $ 0.34 $ 1.45 $ 1.17 GAAP diluted weighted average shares outstanding 119,580 117,380 118,158 117,356 Dilutive effect of stock-based compensation plans - - - - Non-GAAP diluted weighted average shares outstanding 119,580 117,380 118,158 117,356 (1) Operating margin impact of non-GAAP adjustments: Three Months Ended Twelve Months Ended September 30, September 30, September 30, September 30, 2018 2017 2018 2017 GAAP operating margin 3.7% 5.7% 5.9% 3.5% Fair value adjustment of acquired deferred revenue 0.1% 0.2% 0.1% 0.2% Settlement adjustment - revenue (2) 2.4% 0.0% 0.6% 0.0% Fair value adjustment to deferred services cost 0.0% 0.0% 0.0% 0.0% Stock-based compensation 9.9% 6.7% 6.7% 6.6% Amortization of acquired intangibles 4.6% 5.0% 4.7% 5.0% Acquisition-related and other transactional charges 0.0% 0.2% 0.1% 0.1% US pension plan termination-related costs 0.0% 0.0% 0.0% 0.0% Restructuring charges, net 0.0% -0.1% -0.1% 0.7% Headquarters relocation charges 0.6% 0.0% 0.4% 0.0% Non-GAAP operating margin 21.3% 17.7% 18.4% 16.1% (2) Our Q4'18 and FY'18 GAAP revenue results include the impact of a settlement of a customer dispute concerning a professional services receivable. The settlement, reached in September 2018, included partial payment of the receivable and new software purchases. The net revenue write-down recorded in the fourth quarter was $9.3 million, comprised of a $14.5 million services revenue write-down, partially offset by new subscription revenue of $5.2 million. We have excluded these amounts from our Non-GAAP results. (3) In the fourth quarter we excluded the GAAP benefit of a $3 million valuation allowance release in a foreign jurisdiction as the jurisdiction was profitable on a non-GAAP basis. We have recorded a full valuation allowance against our U.S. net deferred tax assets and a valuation allowance against net deferred tax assets in certain foreign jurisdictions. As we are profitable on a non-GAAP basis, the 2018 and 2017 non-GAAP tax provisions are being calculated assuming there is no valuation allowance. Income tax adjustments reflect the tax effects of non-GAAP adjustments which are calculated by applying the applicablePage tax 16 of 16 rate by jurisdiction to the non-GAAP adjustments listed above. We have recorded the impact of the Tax Cuts and Jobs Act in our Q1'18 GAAP earnings, resulting in a non-cash benefit of approximately $7 million. In Q3’18, we increased the non-cash benefit by approximately $5 million to reflect additional guidance on the state tax implications of the Act. We have excluded this benefit from our non-GAAP results.
