Attached files
| file | filename |
|---|---|
| EX-99.1 - EX-99.1 - LANDSTAR SYSTEM INC | d644154dex991.htm |
| 8-K - FORM 8-K - LANDSTAR SYSTEM INC | d644154d8k.htm |

Exhibit 99.2 DESIGNED TO RESPOND BUILT TO DELIVER Landstar System, Inc. Earnings Conference Call Third Quarter 2018 October 24, 2018 Date Published: 10/24/2018Exhibit 99.2 DESIGNED TO RESPOND BUILT TO DELIVER Landstar System, Inc. Earnings Conference Call Third Quarter 2018 October 24, 2018 Date Published: 10/24/2018

The following is a“safeharbor” statement under the Private Securities Litigation Reform Act of 1995. Statements made during this presentation that are not based on historical facts are“forward looking statements.” During this presentation, I may make certain statements, containing forward-looking statements, such as statements which relate toLandstar’s business objectives, plans, strategies and expectations. Such statements are by nature subject to uncertainties and risks, including but not limited to: the operational, financial and legal risks detailed inLandstar’s Form 10-K for the 2017 fiscal year, described in the section Risk Factors, and other SEC filings from time to time. These risks and uncertainties could cause actual results or events to differ materially from historical results or those anticipated. Investors should not place undue reliance on such forward-looking statements, and Landstar undertakes no obligation to publicly update or revise any forward-looking statements. 2 Date Published: 10/24/2018The following is a“safeharbor” statement under the Private Securities Litigation Reform Act of 1995. Statements made during this presentation that are not based on historical facts are“forward looking statements.” During this presentation, I may make certain statements, containing forward-looking statements, such as statements which relate toLandstar’s business objectives, plans, strategies and expectations. Such statements are by nature subject to uncertainties and risks, including but not limited to: the operational, financial and legal risks detailed inLandstar’s Form 10-K for the 2017 fiscal year, described in the section Risk Factors, and other SEC filings from time to time. These risks and uncertainties could cause actual results or events to differ materially from historical results or those anticipated. Investors should not place undue reliance on such forward-looking statements, and Landstar undertakes no obligation to publicly update or revise any forward-looking statements. 2 Date Published: 10/24/2018

Model Definition Landstar is a worldwide, asset-light provider of integrated transportation management solutions delivering safe, specialized transportation services to a broad range of customers utilizing a network of agents, third party capacity providers and employees. 3 Date Published: 10/24/2018Model Definition Landstar is a worldwide, asset-light provider of integrated transportation management solutions delivering safe, specialized transportation services to a broad range of customers utilizing a network of agents, third party capacity providers and employees. 3 Date Published: 10/24/2018

The Network 2017 Results Agents Approx. $3.6 billion in revenue 1,200 2.0 million loadings 542 million dollar agents 9,696 BCO trucks (2017 year-end) Landstar 49,934 Carriers (2017 year-end) Employees 15,000+ Trailers (2017 year-end) Approx. 1,300 Customers Capacity 25,000+ 59,000+ 4 Date Published: 10/24/2018The Network 2017 Results Agents Approx. $3.6 billion in revenue 1,200 2.0 million loadings 542 million dollar agents 9,696 BCO trucks (2017 year-end) Landstar 49,934 Carriers (2017 year-end) Employees 15,000+ Trailers (2017 year-end) Approx. 1,300 Customers Capacity 25,000+ 59,000+ 4 Date Published: 10/24/2018
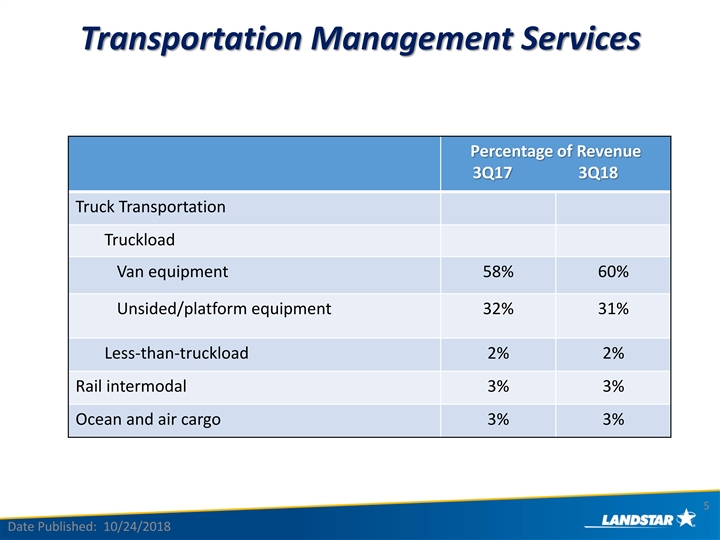
Transportation Management Services Percentage of Revenue 3Q17 3Q18 Truck Transportation Truckload Van equipment 58% 60% Unsided/platform equipment 32% 31% Less-than-truckload 2% 2% Rail intermodal 3% 3% Ocean and air cargo 3% 3% 5 Date Published: 10/24/2018Transportation Management Services Percentage of Revenue 3Q17 3Q18 Truck Transportation Truckload Van equipment 58% 60% Unsided/platform equipment 32% 31% Less-than-truckload 2% 2% Rail intermodal 3% 3% Ocean and air cargo 3% 3% 5 Date Published: 10/24/2018
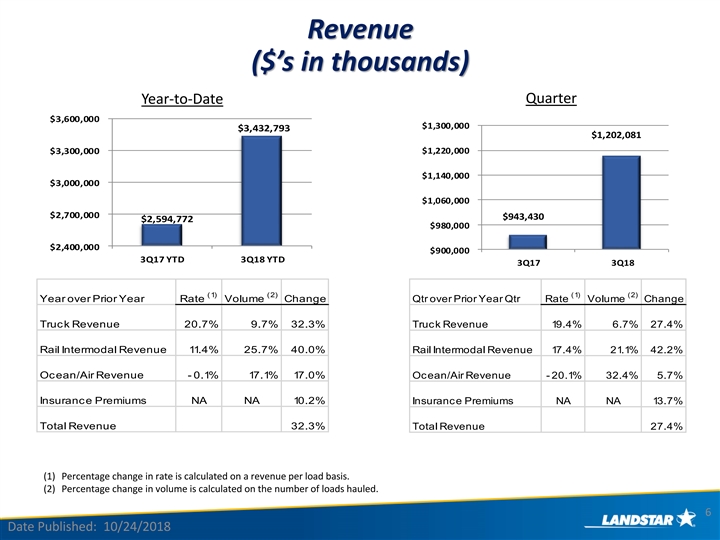
Revenue ($’s in thousands) Quarter Year-to-Date $3,600,000 $1,300,000 $3,432,793 $1,202,081 $3,300,000 $1,220,000 $1,140,000 $3,000,000 $1,060,000 $2,700,000 $943,430 $2,594,772 $980,000 $2,400,000 $900,000 3Q17 YTD 3Q18 YTD 3Q17 3Q18 (1) (2) (1) (2) Year over Prior Year Rate Volume Change Qtr over Prior Year Qtr Rate Volume Change Truck Revenue 20.7% 9.7% 32.3% Truck Revenue 19.4% 6.7% 27.4% Rail Intermodal Revenue 11.4% 25.7% 40.0% Rail Intermodal Revenue 17.4% 21.1% 42.2% Ocean/Air Revenue - 0.1% 17.1% 17.0% Ocean/Air Revenue - 20.1% 32.4% 5.7% Insurance Premiums NA NA 10.2% Insurance Premiums NA NA 13.7% Total Revenue 32.3% Total Revenue 27.4% (1) Percentage change in rate is calculated on a revenue per load basis. (2) Percentage change in volume is calculated on the number of loads hauled. 6 Date Published: 10/24/2018Revenue ($’s in thousands) Quarter Year-to-Date $3,600,000 $1,300,000 $3,432,793 $1,202,081 $3,300,000 $1,220,000 $1,140,000 $3,000,000 $1,060,000 $2,700,000 $943,430 $2,594,772 $980,000 $2,400,000 $900,000 3Q17 YTD 3Q18 YTD 3Q17 3Q18 (1) (2) (1) (2) Year over Prior Year Rate Volume Change Qtr over Prior Year Qtr Rate Volume Change Truck Revenue 20.7% 9.7% 32.3% Truck Revenue 19.4% 6.7% 27.4% Rail Intermodal Revenue 11.4% 25.7% 40.0% Rail Intermodal Revenue 17.4% 21.1% 42.2% Ocean/Air Revenue - 0.1% 17.1% 17.0% Ocean/Air Revenue - 20.1% 32.4% 5.7% Insurance Premiums NA NA 10.2% Insurance Premiums NA NA 13.7% Total Revenue 32.3% Total Revenue 27.4% (1) Percentage change in rate is calculated on a revenue per load basis. (2) Percentage change in volume is calculated on the number of loads hauled. 6 Date Published: 10/24/2018

Truckload Loadings and Revenue per Load (Excludes LTL) Van Equipment Revenue per Load Number of Loads 380,000 $2,100 360,000 $2,000 340,000 $1,900 320,000 $1,800 300,000 $1,700 280,000 $1,600 260,000 $1,500 240,000 Unsided/Platform Revenue per Load Number of Loads Equipment $2,900 140,000 $2,800 130,000 $2,700 $2,600 120,000 $2,500 $2,400 110,000 $2,300 $2,200 100,000 $2,100 $2,000 90,000 7 Date Published: 10/24/2018 3Q15 3Q15 4Q15 4Q15 1Q16 1Q16 2Q16 2Q16 3Q16 3Q16 4Q16 4Q16 1Q17 1Q17 2Q17 2Q17 3Q17 3Q17 4Q17 4Q17 1Q18 1Q18 2Q18 2Q18 3Q18 3Q18 3Q15 3Q15 4Q15 4Q15 1Q16 1Q16 2Q16 2Q16 3Q16 3Q16 4Q16 4Q16 1Q17 1Q17 2Q17 2Q17 3Q17 3Q17 4Q17 4Q17 1Q18 1Q18 2Q18 2Q18 3Q18 3Q18Truckload Loadings and Revenue per Load (Excludes LTL) Van Equipment Revenue per Load Number of Loads 380,000 $2,100 360,000 $2,000 340,000 $1,900 320,000 $1,800 300,000 $1,700 280,000 $1,600 260,000 $1,500 240,000 Unsided/Platform Revenue per Load Number of Loads Equipment $2,900 140,000 $2,800 130,000 $2,700 $2,600 120,000 $2,500 $2,400 110,000 $2,300 $2,200 100,000 $2,100 $2,000 90,000 7 Date Published: 10/24/2018 3Q15 3Q15 4Q15 4Q15 1Q16 1Q16 2Q16 2Q16 3Q16 3Q16 4Q16 4Q16 1Q17 1Q17 2Q17 2Q17 3Q17 3Q17 4Q17 4Q17 1Q18 1Q18 2Q18 2Q18 3Q18 3Q18 3Q15 3Q15 4Q15 4Q15 1Q16 1Q16 2Q16 2Q16 3Q16 3Q16 4Q16 4Q16 1Q17 1Q17 2Q17 2Q17 3Q17 3Q17 4Q17 4Q17 1Q18 1Q18 2Q18 2Q18 3Q18 3Q18

Industries Served As a Percentage of Revenue Quarter over Prior Year Quarter 3Q17 3Q18 Growth Consumer Durables 21.0 23.2 41% Machinery 14.3 14.3 28% Automotive 7.1 8.3 49% Building Products 10.2 8.7 8% Metals 6.6 6.7 30% AA&E, Hazmat 8.6 8.4 25% Foodstuffs 4.7 5.5 49% Energy 3.2 2.8 11% Other 24.3 22.1 16% Transportation Revenue 100.0 100.0 28% 8 Date Published: 10/24/2018Industries Served As a Percentage of Revenue Quarter over Prior Year Quarter 3Q17 3Q18 Growth Consumer Durables 21.0 23.2 41% Machinery 14.3 14.3 28% Automotive 7.1 8.3 49% Building Products 10.2 8.7 8% Metals 6.6 6.7 30% AA&E, Hazmat 8.6 8.4 25% Foodstuffs 4.7 5.5 49% Energy 3.2 2.8 11% Other 24.3 22.1 16% Transportation Revenue 100.0 100.0 28% 8 Date Published: 10/24/2018

(1) (2) Gross Profit and Gross Profit Margin ($’s in thousands) Year-to-Date Quarter $180,000 $498,255 $500,000 $171,304 $170,000 $470,000 $160,000 $440,000 $150,000 $140,005 $394,156 $410,000 14.5% 14.3% $140,000 15.2% 14.8% $380,000 $130,000 3Q17 YTD 3Q18 YTD 3Q17 3Q18 (3) (3) 3rd Qtr 3rd Qtr YTD Changes in gross profit margin % Changes in gross profit margin % 2017 Period 14.8 2017 Period 15.2 Revenue - fixed gp margin -0.2 Revenue - fixed gp margin -0.1 Revenue - variable gp margin 0.1 Revenue - variable gp margin -0.1 Change in mix and other -0.4 Change in mix and other -0.5 2018 Period 14.3 2018 Period 14.5 (1) Gross profit equals revenue less the cost of purchased transportation and commissions to agents. (2) Gross profit margin equals gross profit divided by revenue. (3) Revenue on transactions with a fixed gross profit margin was 54% and 51% of revenue in the 2017 and 2018 year-to-date periods, respectively, and 53% and 50% of revenue in the 2017 and 2018 third quarters, respectively. 9 Date Published: 10/24/2018(1) (2) Gross Profit and Gross Profit Margin ($’s in thousands) Year-to-Date Quarter $180,000 $498,255 $500,000 $171,304 $170,000 $470,000 $160,000 $440,000 $150,000 $140,005 $394,156 $410,000 14.5% 14.3% $140,000 15.2% 14.8% $380,000 $130,000 3Q17 YTD 3Q18 YTD 3Q17 3Q18 (3) (3) 3rd Qtr 3rd Qtr YTD Changes in gross profit margin % Changes in gross profit margin % 2017 Period 14.8 2017 Period 15.2 Revenue - fixed gp margin -0.2 Revenue - fixed gp margin -0.1 Revenue - variable gp margin 0.1 Revenue - variable gp margin -0.1 Change in mix and other -0.4 Change in mix and other -0.5 2018 Period 14.3 2018 Period 14.5 (1) Gross profit equals revenue less the cost of purchased transportation and commissions to agents. (2) Gross profit margin equals gross profit divided by revenue. (3) Revenue on transactions with a fixed gross profit margin was 54% and 51% of revenue in the 2017 and 2018 year-to-date periods, respectively, and 53% and 50% of revenue in the 2017 and 2018 third quarters, respectively. 9 Date Published: 10/24/2018

(1) Operating Income and Operating Margin ($’s in thousands) Year-to-Date Quarter $92,000 $87,068 $245,647 $250,000 $85,000 $235,000 $220,000 $78,000 $205,000 $71,000 50.8% $190,000 $173,919 49.3% $64,000 48.4% $175,000 $60,567 44.1% 4 43.3% $160,000 $57,000 3Q17 YTD 3Q18 YTD 3Q17 3Q18 3rd Qtr YTD 3rd Qtr Changes in operating margin % Changes in operating margin % 2017 Period 2017 Period 44.1 43.3 Other operating costs Other operating costs 0.9 0.5 Insuran 5c 0e .5% and claims Insurance and claims 0.3 1.9 SG&A SG&A 2.9 4.1 Depreciation and amortization Depreciation and amortization 1.1 1.0 2018 Period 2018 Period 49.3 50.8 (1) Operating margin equals operating income divided by gross profit. 10 Date Published: 10/24/2018(1) Operating Income and Operating Margin ($’s in thousands) Year-to-Date Quarter $92,000 $87,068 $245,647 $250,000 $85,000 $235,000 $220,000 $78,000 $205,000 $71,000 50.8% $190,000 $173,919 49.3% $64,000 48.4% $175,000 $60,567 44.1% 4 43.3% $160,000 $57,000 3Q17 YTD 3Q18 YTD 3Q17 3Q18 3rd Qtr YTD 3rd Qtr Changes in operating margin % Changes in operating margin % 2017 Period 2017 Period 44.1 43.3 Other operating costs Other operating costs 0.9 0.5 Insuran 5c 0e .5% and claims Insurance and claims 0.3 1.9 SG&A SG&A 2.9 4.1 Depreciation and amortization Depreciation and amortization 1.1 1.0 2018 Period 2018 Period 49.3 50.8 (1) Operating margin equals operating income divided by gross profit. 10 Date Published: 10/24/2018
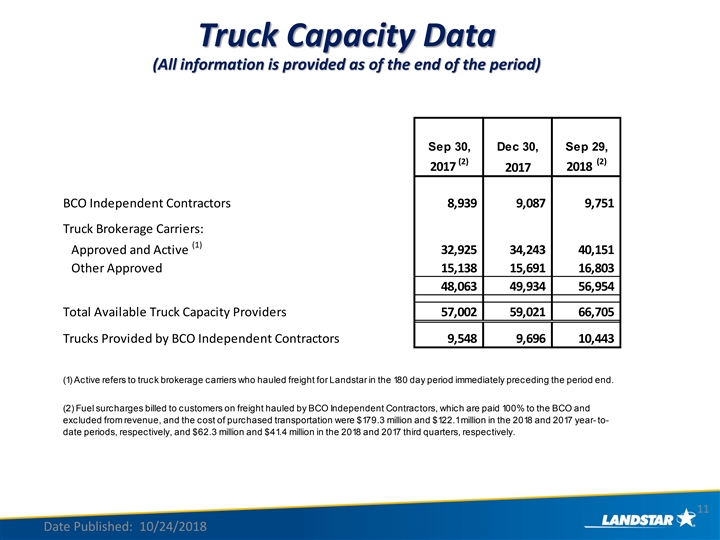
Truck Capacity Data (All information is provided as of the end of the period) Sep 30, Dec 30, Sep 29, (2) (2) 2017 2018 2017 BCO Independent Contractors 8,939 9,087 9,751 Truck Brokerage Carriers: (1) Approved and Active 32,925 3 4,243 40,151 Other Approved 15,138 1 5,691 16,803 4 8,063 4 9,934 56,954 Total Available Truck Capacity Providers 57,002 5 9,021 66,705 Trucks Provided by BCO Independent Contractors 9,548 9,696 1 0,443 (1) Active refers to truck brokerage carriers who hauled freight for Landstar in the 180 day period immediately preceding the period end. (2) Fuel surcharges billed to customers on freight hauled by BCO Independent Contractors, which are paid 100% to the BCO and excluded from revenue, and the cost of purchased transportation were $179.3 million and $122.1 million in the 2018 and 2017 year- to- date periods, respectively, and $62.3 million and $41.4 million in the 2018 and 2017 third quarters, respectively. 11 Date Published: 10/24/2018Truck Capacity Data (All information is provided as of the end of the period) Sep 30, Dec 30, Sep 29, (2) (2) 2017 2018 2017 BCO Independent Contractors 8,939 9,087 9,751 Truck Brokerage Carriers: (1) Approved and Active 32,925 3 4,243 40,151 Other Approved 15,138 1 5,691 16,803 4 8,063 4 9,934 56,954 Total Available Truck Capacity Providers 57,002 5 9,021 66,705 Trucks Provided by BCO Independent Contractors 9,548 9,696 1 0,443 (1) Active refers to truck brokerage carriers who hauled freight for Landstar in the 180 day period immediately preceding the period end. (2) Fuel surcharges billed to customers on freight hauled by BCO Independent Contractors, which are paid 100% to the BCO and excluded from revenue, and the cost of purchased transportation were $179.3 million and $122.1 million in the 2018 and 2017 year- to- date periods, respectively, and $62.3 million and $41.4 million in the 2018 and 2017 third quarters, respectively. 11 Date Published: 10/24/2018

Key Balance Sheet and Cash Flow Statistics ($’s in thousands) YTD YTD Sep 30, Sep 29, 2017 2018 Balance sheet (period end amounts): Debt to Capital 15% 14% Net Cash (1) $ 1 78,026 $ 1 40,330 Cash flow: Cash flow from operations $ 1 32,264 $ 2 04,205 Capital expenditures $ 16,999 $ 7,325 Share repurchases $ - $ 105,488 Dividends paid $ 11,739 $ 82,261 Returns: TTM Return on Equity 26% 37% TTM Return on Invested Capital 22% 32% TTM Return on Assets 13% 19% (1) Net cash is defined as cash and cash equivalents plus short term investments less outstanding debt. 12 Date Published: 10/24/2018Key Balance Sheet and Cash Flow Statistics ($’s in thousands) YTD YTD Sep 30, Sep 29, 2017 2018 Balance sheet (period end amounts): Debt to Capital 15% 14% Net Cash (1) $ 1 78,026 $ 1 40,330 Cash flow: Cash flow from operations $ 1 32,264 $ 2 04,205 Capital expenditures $ 16,999 $ 7,325 Share repurchases $ - $ 105,488 Dividends paid $ 11,739 $ 82,261 Returns: TTM Return on Equity 26% 37% TTM Return on Invested Capital 22% 32% TTM Return on Assets 13% 19% (1) Net cash is defined as cash and cash equivalents plus short term investments less outstanding debt. 12 Date Published: 10/24/2018

(1) Free Cash Flow / Share Purchases (In Thousands) $250,000 50,000 $200,000 48,000 $150,000 46,000 $100,000 44,000 $50,000 42,000 $- 40,000 2013 2014 2015 2016 2017 Free Cash Flow Share Purchases Common Share Count Third quarter 2018 YTD (000's) Free cash flow (1) $ 1 96,880 Share purchases $ 1 05,488 Ending common share count 41,114 (1) Free cash flow is defined as cash flow from operations less capital expenditures, each set forth on the prior slide. 13 Date Published: 10/24/2018(1) Free Cash Flow / Share Purchases (In Thousands) $250,000 50,000 $200,000 48,000 $150,000 46,000 $100,000 44,000 $50,000 42,000 $- 40,000 2013 2014 2015 2016 2017 Free Cash Flow Share Purchases Common Share Count Third quarter 2018 YTD (000's) Free cash flow (1) $ 1 96,880 Share purchases $ 1 05,488 Ending common share count 41,114 (1) Free cash flow is defined as cash flow from operations less capital expenditures, each set forth on the prior slide. 13 Date Published: 10/24/2018
DESIGNED TO RESPOND BUILT TO DELIVER 14 Date Published: 10/24/2018DESIGNED TO RESPOND BUILT TO DELIVER 14 Date Published: 10/24/2018