Attached files
| file | filename |
|---|---|
| EXCEL - IDEA: XBRL DOCUMENT - LANDSTAR SYSTEM INC | Financial_Report.xls |
| EX-21.1 - EX-21.1 - LANDSTAR SYSTEM INC | d836695dex211.htm |
| EX-31.2 - EX-31.2 - LANDSTAR SYSTEM INC | d836695dex312.htm |
| EX-31.1 - EX-31.1 - LANDSTAR SYSTEM INC | d836695dex311.htm |
| EX-24.1 - EX-24.1 - LANDSTAR SYSTEM INC | d836695dex241.htm |
| EX-32.1 - EX-32.1 - LANDSTAR SYSTEM INC | d836695dex321.htm |
| EX-32.2 - EX-32.2 - LANDSTAR SYSTEM INC | d836695dex322.htm |
| EX-10.2 - EX-10.2 - LANDSTAR SYSTEM INC | d836695dex102.htm |
| EX-23.1 - EX-23.1 - LANDSTAR SYSTEM INC | d836695dex231.htm |
Table of Contents
UNITED STATES SECURITIES AND EXCHANGE COMMISSION
Washington, D.C. 20549
Form 10-K
(Mark One)
| þ | ANNUAL REPORT PURSUANT TO SECTION 13 OR 15(d) OF THE SECURITIES EXCHANGE ACT OF 1934 |
For the Fiscal Year Ended December 27, 2014
Or
| ¨ | TRANSITION REPORT PURSUANT TO SECTION 13 OR 15(d) OF THE SECURITIES EXCHANGE ACT OF 1934 |
For the transition period from to
Commission File Number: 0-21238

Landstar System, Inc.
(Exact name of registrant as specified in its charter)
| Delaware | 06-1313069 | |
| (State or other jurisdiction of incorporation or organization) |
(I.R.S. Employer Identification No.) | |
| 13410 Sutton Park Drive South | 32224 | |
| Jacksonville, Florida | (Zip Code) | |
| (Address of principal executive offices) |
(904) 398-9400
(Registrant’s telephone number, including area code)
Securities registered pursuant to Section 12(b) of the Act:
| Title of Each Class |
Name of Exchange on Which Registered | |
| Common Stock, $0.01 Par Value | The NASDAQ Stock Market, Inc. |
Securities Registered Pursuant to Section 12(g) of the Act:
None
Indicate by check mark if the registrant is a well-known seasoned issuer, as defined in Rule 405 of the Securities Act. Yes þ No ¨
Indicate by check mark if the registrant is not required to file reports pursuant to Section 13 or Section 15(d) of the Act. Yes ¨ No þ
Indicate by check mark whether the registrant (1) has filed all reports required to be filed by Section 13 or 15(d) of the Securities Exchange Act of 1934 during the preceding 12 months (or for such shorter period that the registrant was required to file such reports), and (2) has been subject to such filing requirements for the past 90 days. Yes þ No ¨
Indicate by check mark whether the registrant has submitted electronically and posted on its corporate website, if any, every Interactive Data File required to be submitted and posted pursuant to Rule 405 of Regulation S-T during the preceding 12 months (or for such shorter period that the registrant was required to submit and post such files): Yes þ No ¨
Indicate by check mark if disclosure of delinquent filers pursuant to Item 405 of Regulation S-K is not contained herein, and will not be contained, to the best of registrant’s knowledge, in definitive proxy or information statements incorporated by reference in Part III of this Form 10-K or any amendment to this Form 10-K. ¨
Indicate by check mark whether the registrant is a large accelerated filer, an accelerated filer, a non-accelerated filer or a smaller reporting company. See definitions of “large accelerated filer,” “accelerated filer” and “smaller reporting company” in Rule 12b-2 of the Exchange Act. (Check one):
| Large accelerated filer þ | Accelerated filer ¨ | Non-accelerated filer ¨ | Smaller reporting company ¨ |
Indicate by check mark whether the registrant is a shell company (as defined in Rule 12b-2 of the Act). Yes ¨ No þ
The aggregate market value of the voting stock held by non-affiliates of the registrant was $2,819,920,000 (based on the per share closing price on June 28, 2014, the last business day of the Company’s second fiscal quarter, as reported on the NASDAQ Global Select Market). In making this calculation, the registrant has assumed, without admitting for any purpose, that all directors and executive officers of the registrant, and no other persons, are affiliates.
The number of shares of the registrant’s common stock, par value $0.01 per share (the “Common Stock”), outstanding as of the close of business on January 23, 2015 was 44,794,486.
DOCUMENTS INCORPORATED BY REFERENCE
Portions of the following document are incorporated by reference in this Form 10-K as indicated herein:
| Document |
Part of 10-K Into Which |
|||
| Proxy Statement relating to Landstar System, Inc.’s Annual Meeting of Stockholders scheduled to be held on May 19, 2015 |
Part III | |||
Table of Contents
LANDSTAR SYSTEM, INC.
2014 ANNUAL REPORT ON FORM 10-K
| Page | ||||||
| PART I | ||||||
| Item 1. | 3 | |||||
| Item 1A. | 10 | |||||
| Item 1B. | 15 | |||||
| Item 2. | 15 | |||||
| Item 3. | 15 | |||||
| Item 4. | 15 | |||||
| PART II | ||||||
| Item 5. | Market for Registrant’s Common Equity, Related Stockholder Matters and Issuer Purchases of Equity Securities | 16 | ||||
| Item 6. | 19 | |||||
| Item 7. | Management’s Discussion and Analysis of Financial Condition and Results of Operations |
20 | ||||
| Item 7A. | 33 | |||||
| Item 8. | 34 | |||||
| Item 9. | Changes in and Disagreements with Accountants on Accounting and Financial Disclosure |
60 | ||||
| Item 9A. | 60 | |||||
| Item 9B. | 63 | |||||
| PART III | ||||||
| Item 10. | 64 | |||||
| Item 11. | 64 | |||||
| Item 12. | Security Ownership of Certain Beneficial Owners and Management and Related Stockholder Matters | 64 | ||||
| Item 13. | Certain Relationships and Related Transactions, and Director Independence |
64 | ||||
| Item 14. | 64 | |||||
| PART IV | ||||||
| Item 15. | 65 | |||||
| 68 | ||||||
| EX – 31.1 Section 302 CEO Certification |
| EX – 31.2 Section 302 CFO Certification |
| EX – 32.1 Section 906 CEO Certification |
| EX – 32.2 Section 906 CFO Certification |
2
Table of Contents
PART I
| Item 1. | Business |
General
Landstar System, Inc. was incorporated in January 1991 under the laws of the State of Delaware. It acquired all of the capital stock of its predecessor, Landstar System Holdings, Inc. (“LSHI”) on March 28, 1991. Landstar System, Inc. has been a publicly held company since its initial public offering in March 1993. LSHI owns directly or indirectly all of the common stock of Landstar Ranger, Inc. (“Landstar Ranger”), Landstar Inway, Inc. (“Landstar Inway”), Landstar Ligon, Inc. (“Landstar Ligon”), Landstar Gemini, Inc. (“Landstar Gemini”), Landstar Transportation Logistics, Inc. (“Landstar Transportation Logistics”), Landstar Global Logistics, Inc. (“Landstar Global Logistics”), Landstar Express America, Inc. (“Landstar Express America”), Landstar Canada Holdings, Inc. (“LCHI”), Landstar Canada, Inc. (“Landstar Canada”), Landstar Contractor Financing, Inc. (“LCFI”), Risk Management Claim Services, Inc. (“RMCS”) and Signature Insurance Company (“Signature”). Landstar Ranger, Landstar Inway, Landstar Ligon, Landstar Gemini, Landstar Transportation Logistics, Landstar Global Logistics, Landstar Express America and Landstar Canada are collectively herein referred to as Landstar’s “Operating Subsidiaries.” Landstar System, Inc., LSHI, LCFI, RMCS, LCHI, Signature and the Operating Subsidiaries are collectively referred to herein as “Landstar” or the “Company,” unless the context otherwise requires. The Company’s principal executive offices are located at 13410 Sutton Park Drive South, Jacksonville, Florida 32224 and its telephone number is (904) 398-9400. The Company makes available free of charge through its website its annual report on Form 10-K, quarterly reports on Form 10-Q, proxy and current reports on Form 8-K as soon as reasonably practicable after such material is electronically filed with the Securities and Exchange Commission (“SEC”). The Company’s website is www.landstar.com. You may read and copy any materials that we file with the SEC at the SEC’s Public Reference Room at 100 E. Street, NE, Washington, DC 20549. You may obtain information on the operation of the Public Reading Room by calling the SEC at 1-800-SEC-0330. The SEC maintains a website at http://www.sec.gov that contains the Company’s current and periodic reports, proxy and information statements and other information filed electronically with the SEC.
On December 28, 2013, the Company completed the sale of Landstar Supply Chain Solutions, Inc., a Delaware corporation, including its wholly owned subsidiary, Landstar Supply Chain Solutions LLC (collectively, “LSCS”), to XPO Logistics, Inc. (“XPO”). The gain on the sale of LSCS and the operating results of LSCS for fiscal year 2013 and prior periods have been reclassified in the consolidated financial statements to discontinued operations.
Description of Business
Landstar is an asset-light provider of integrated transportation management solutions. The Company offers services to its customers across multiple transportation modes, with the ability to arrange for individual shipments of freight to enterprise-wide solutions to manage all of a customer’s transportation needs. Landstar provides services principally throughout the United States and to a lesser extent in Canada and between the United States and Canada, Mexico and other countries around the world. The Company’s services emphasize safety, information coordination and customer service and are delivered through a network of independent commission sales agents and third party capacity providers linked together by a series of technological applications which are provided and coordinated by the Company. The nature of the Company’s business is such that a significant portion of its operating costs varies directly with revenue.
Landstar markets its integrated transportation management solutions primarily through independent commission sales agents and exclusively utilizes third party capacity providers to transport customers’ freight. Landstar’s independent commission sales agents enter into contractual arrangements with the Company and are responsible for locating freight, making that freight available to Landstar’s capacity providers and coordinating the transportation of the freight with customers and capacity providers. The Company’s third party capacity
3
Table of Contents
providers consist of independent contractors who provide truck capacity to the Company under exclusive lease arrangements (the “BCO Independent Contractors”), unrelated trucking companies who provide truck capacity to the Company under non-exclusive contractual arrangements (the “Truck Brokerage Carriers”), air cargo carriers, ocean cargo carriers and railroads. Through this network of agents and capacity providers linked together by Landstar’s information technology systems, Landstar operates an integrated transportation management solutions business primarily throughout North America with revenue of $3.2 billion during the most recently completed fiscal year. The Company reports the results of two operating segments: the transportation logistics segment and the insurance segment.
Transportation Logistics Segment
The transportation logistics segment provides a wide range of integrated transportation management solutions. Transportation services offered by the Company include truckload and less-than-truckload transportation, rail intermodal, air cargo, ocean cargo, expedited ground and air delivery of time-critical freight, heavy-haul/specialized, U.S.-Canada and U.S.-Mexico cross-border, project cargo and customs brokerage. Industries serviced by the transportation logistics segment include automotive products, building products, metals, chemicals, foodstuffs, heavy machinery, retail, electronics, ammunition and explosives and military equipment. In addition, the transportation logistics segment provides transportation services to other transportation companies, including logistics and less-than-truckload service providers. Each of the independent commission sales agents has the opportunity to market all of the services provided by the transportation logistics segment. Billings for freight transportation services are typically charged to customers on a per shipment basis for the physical transportation of freight and are referred to as transportation revenue. See “Notes to Consolidated Financial Statements” for the amount of revenue from external customers, measure of profit and total assets attributable to the transportation logistics segment for the last three fiscal years.
Truck Services. The transportation logistics segment’s truck transportation services include a full array of truckload transportation for a wide range of commodities, much of which are transported over irregular or non-repetitive routes, and, to a lesser degree, less-than-truckload transportation services. The Company utilizes a broad assortment of equipment, including dry and specialty vans of various sizes, unsided/platform trailers (including flatbeds, drop decks and light specialty trailers), temperature-controlled vans and containers. Available truck transportation services also include short-to-long haul movement of containers by truck and expedited ground and dedicated power-only truck capacity. During fiscal year 2014, revenue hauled by BCO Independent Contractors and Truck Brokerage Carriers was 48% and 46%, respectively, of consolidated revenue. Also, during fiscal year 2014, truck transportation revenue hauled via van equipment and unsided/platform trailing equipment was 60% and 37%, respectively, of truck transportation revenue and less-than-truckload revenue was 3% of truck transportation revenue. The Company’s truck services contributed 94% of consolidated revenue in 2014 and 93% of consolidated revenue in both fiscal years 2013 and 2012.
Rail Intermodal Services. The transportation logistics segment has contracts with Class 1 domestic and Canadian railroads, certain short-line railroads and most major asset-based intermodal equipment providers, including agreements with stacktrain operators and container and trailing equipment companies. In addition, the transportation logistics segment has contracts with a vast network of local trucking companies that handle pick-up and delivery of rail freight. These contracts provide the transportation logistics segment the ability to transport freight via rail throughout the United States, Canada and Mexico. The transportation logistics segment’s rail intermodal service capabilities include trailer on flat car, container on flat car, box car and railcar. The transportation logistics segment’s rail intermodal services contributed 3% of consolidated revenue in each of fiscal years 2014, 2013 and 2012.
Air and Ocean Services. The transportation logistics segment provides domestic and international air services and ocean services to its customers. The Company executes international freight transportation as an International Air Transport Association (IATA) certified Indirect Air Carrier (IAC), a Federal Maritime Commission (FMC) licensed non-vessel operating common carrier (NVOCC) and as a licensed freight
4
Table of Contents
forwarder. Through its network of independent commission sales agents, relationships within a global network of foreign freight forwarders and contracts with a number of airlines and ocean lines, the transportation logistics segment provides efficient and cost effective door-to-door transportation to most points in the world for a vast array of cargo types such as over-sized break bulk, consolidations, full container loads and refrigerated freight. The transportation logistics segment’s air and ocean services contributed 2% of consolidated revenue in 2014 and 3% of consolidated revenue in both fiscal years 2013 and 2012.
Insurance Segment
The insurance segment is comprised of Signature, a wholly owned offshore insurance subsidiary, and RMCS. This segment provides risk and claims management services to certain of Landstar’s Operating Subsidiaries. In addition, it reinsures certain risks of the Company’s BCO Independent Contractors and provides certain property and casualty insurance directly to certain of Landstar’s Operating Subsidiaries. Revenue at the insurance segment represents reinsurance premiums from third party insurance companies that provide insurance programs to BCO Independent Contractors where all or a portion of the risk of loss is ultimately borne by Signature. Revenue at the insurance segment represented approximately 1% of the Company’s consolidated revenue in each of fiscal years 2014, 2013 and 2012. See “Notes to Consolidated Financial Statements” for the amount of revenue from external customers, measure of profit and total assets attributable to the insurance segment for the last three fiscal years.
Factors Significant to the Company’s Operations
Management believes the following factors are particularly significant to the Company’s operations:
Agent Network
The Company’s primary day-to-day contact with its customers is through its network of independent commission sales agents and, to a lesser extent, through employees of the Company. The typical Landstar independent commission sales agent maintains a relationship with a number of shippers and services these shippers utilizing the Company’s information technology systems and the various modes of transportation made available through the Company’s network of third party capacity providers. The Company provides assistance to the agents in developing additional relationships with shippers and enhancing agent and Company relationships with larger shippers through the Company’s field employees, located throughout the United States and Canada. The Operating Subsidiaries provide programs to support the agents’ operations and provide guidance on establishing pricing parameters for freight hauled by the various modes of transportation available to the agents. It is important to note that the Operating Subsidiaries, and not the Company’s agents, contract directly with customers and generally assume the related credit risk and potential liability for freight losses or damages when the Company is providing transportation services as a motor carrier.
Management believes the Company has more independent commission sales agents than any other asset-light integrated transportation management solutions company. Landstar’s vast network of independent commission sales agent locations provides the Company regular contact with shippers at the local level and the capability to be highly responsive to shippers’ changing needs. The Company’s large fleet of available capacity provides the agent network the resources needed to service both large and small shippers. Through its agent network, the Company offers smaller shippers a level of service comparable to that typically enjoyed only by larger customers. Examples include the ability to provide transportation services on short notice, multiple pick-up and delivery points, electronic data interchange capability and access to specialized equipment. In addition, a number of the Company’s agents specialize in certain types of freight and transportation services (such as oversized or heavy loads and/or rail, air and international freight transportation). Each independent commission sales agent has the opportunity to market all of the services provided by the transportation logistics segment.
The independent commission sales agents use a variety of proprietary and third party information technology applications provided by the Company to service the requirements of shippers. For truckload services, the Company’s independent commission sales agents use Landstar proprietary software which enables
5
Table of Contents
agents to enter available freight, dispatch capacity and process most administrative procedures and then communicate that information to Landstar and its capacity providers via the internet. The Company’s web-based available truck information system provides a listing of available truck capacity to the Company’s independent commission sales agents. For modes of transportation other than truckload, the independent commission sales agents utilize both proprietary and third party information technology applications provided by the Company.
Commissions to agents are based on contractually agreed-upon percentages of revenue or net revenue, defined as revenue less the cost of purchased transportation, or net revenue less a contractually agreed upon percentage of revenue retained by Landstar. Commissions to agents as a percentage of consolidated revenue will vary directly with fluctuations in the percentage of consolidated revenue generated by the various modes of transportation and reinsurance premiums and with changes in net revenue margin, defined as net revenue divided by revenue, on services provided by Truck Brokerage Carriers, railroads, air cargo carriers and ocean cargo carriers. Commissions to agents are recognized upon the completion of freight delivery.
The Company had 525 and 478 agents who each generated at least $1 million in Landstar revenue during 2014 and 2013, respectively, (the “Million Dollar Agents”). Landstar revenue from the Million Dollar Agents in the aggregate represented 92% of consolidated revenue in 2014 and 91% of consolidated revenue in 2013. Annually, the Company has experienced very few terminations of its Million Dollar Agents, whether such terminations are initiated by the agent or the Company. Annual terminations of Million Dollar Agents are typically 3% or less of the total number of Million Dollar Agents. Management believes that the majority of the Million Dollar Agents choose to represent the Company exclusively.
Third Party Capacity
The Company relies exclusively on independent third parties for its hauling capacity other than for trailing equipment owned or leased by the Company and utilized primarily by the BCO Independent Contractors. These third party transportation capacity providers consist of BCO Independent Contractors, Truck Brokerage Carriers, air and ocean cargo carriers and railroads. Landstar’s use of capacity provided by third parties allows it to maintain a lower level of capital investment, resulting in lower fixed costs. During 2014, revenue hauled by BCO Independent Contractors, Truck Brokerage Carriers and railroads represented approximately 48%, 46% and 3%, respectively, of the Company’s consolidated revenue. Collectively, revenue hauled by air and ocean cargo carriers represented approximately 2% of the Company’s consolidated revenue during 2014. Historically, the gross profit margin (defined as gross profit, which is defined as revenue less the cost of purchased transportation and commissions to agents, divided by revenue) generated from freight hauled by BCO Independent Contractors has been greater than that from freight hauled by other third party capacity providers. However, the Company’s insurance and claims costs and other operating costs are incurred primarily in support of BCO Independent Contractor capacity. In addition, as further described in the “Corporate Services” section that follows, the Company incurs significantly higher selling, general and administrative costs in support of BCO Independent Contractor capacity as compared to the other modes of transportation. Purchased transportation costs are recognized upon the completion of freight delivery.
BCO Independent Contractors. Management believes the Company has the largest fleet of truckload BCO Independent Contractors in the United States. BCO Independent Contractors provide truck capacity to the Company under exclusive lease arrangements. Each BCO Independent Contractor operates under the motor carrier operating authority issued by the U.S. Department of Transportation (“DOT”) to Landstar’s Operating Subsidiary to which such BCO Independent Contractor provides services and has leased his or her equipment. The Company’s network of BCO Independent Contractors provides marketing, operating, safety, recruiting, retention and financial advantages to the Company.
The Company’s BCO Independent Contractors are compensated primarily based on a contractually agreed-upon percentage of revenue generated by delivered loads they haul. This percentage generally ranges from 62% to 73% where the BCO Independent Contractor provides only a tractor and 72% to 77% where the BCO
6
Table of Contents
Independent Contractor provides both a tractor and trailing equipment. The BCO Independent Contractor must pay substantially all of the expenses of operating his/her equipment, including driver wages and benefits, fuel, physical damage insurance, maintenance, highway use taxes and debt service, if applicable. The Company passes 100% of fuel surcharges billed to customers for freight hauled by BCO Independent Contractors to its BCO Independent Contractors. During 2014, the Company billed customers $279.3 million in fuel surcharges and passed 100% of such fuel surcharges to the BCO Independent Contractors. These fuel surcharges are excluded from revenue.
The Company maintains internet-based applications for mobile and desktop devices through which BCO Independent Contractors can view a comprehensive listing of the Company’s available freight, allowing them to consider rate, size, origin and destination when planning trips. The Landstar Contractors’ Advantage Purchasing Program (LCAPP) leverages Landstar’s purchasing power to provide discounts to eligible BCO Independent Contractors when they purchase equipment, fuel, tires and other items. In addition, LCFI provides a source of funds at competitive interest rates to the BCO Independent Contractors to purchase primarily trailing equipment.
The number of trucks provided to the Company by BCO Independent Contractors was 8,932 at December 27, 2014, compared to 8,432 at December 28, 2013. At December 27, 2014, 98% of the trucks provided by BCO Independent Contractors were provided by BCO Independent Contractors who provided five or fewer trucks to the Company. The number of trucks provided by BCO Independent Contractors fluctuates daily as a result of truck recruiting and truck terminations. More trucks were recruited in fiscal year 2014 than in fiscal year 2013 and trucks terminated were lower in fiscal year 2014 than in fiscal year 2013, resulting in a net gain of 500 trucks during fiscal year 2014. Landstar’s BCO Independent Contractor truck turnover was approximately 22% in fiscal year 2014 compared to 27% in fiscal year 2013. Approximately 37% of 2014 turnover was attributable to BCO Independent Contractors who had been with the Company for less than one year. Management believes that factors that have historically favorably impacted turnover include the Company’s extensive agent network, available freight, the Company’s programs to reduce the operating costs of its BCO Independent Contractors and Landstar’s reputation for quality, service, reliability and financial strength.
Truck Brokerage Carriers. At December 27, 2014, the Company maintained a database of over 38,000 approved Truck Brokerage Carriers who provide truck capacity to the Company. Truck Brokerage Carriers provide truck capacity to the Company under non-exclusive contractual arrangements and each operates under its own DOT-issued motor carrier operating authority. Truck Brokerage Carriers are paid either a negotiated rate for each load hauled or, to a lesser extent, a contractually agreed-upon fixed rate per load. The Company recruits, approves, establishes contracts with and tracks safety ratings and service records of these third party trucking companies. In addition to providing additional capacity to the Company, the use of Truck Brokerage Carriers enables the Company to pursue different types and quality of freight such as temperature-controlled, short-haul traffic and less-than-truckload and, in certain instances, lower-priced freight that generally would not be handled by the Company’s BCO Independent Contractors.
The Company maintains an internet site through which Truck Brokerage Carriers can view a listing of the Company’s freight that is available to them to be hauled. The Landstar Savings Plus Program leverages Landstar’s purchasing power to provide discounts to eligible Truck Brokerage Carriers when they purchase fuel and equipment and provides the Truck Brokerage Carriers with an electronic payment option.
Railroads and Air and Ocean Cargo Carriers. The Company has contracts with Class 1 domestic and Canadian railroads, certain short-line railroads and domestic and international airlines and ocean lines. These relationships allow the Company to pursue the freight best serviced by these forms of transportation capacity. Railroads are paid either a negotiated rate for each load hauled or a contractually agreed-upon fixed rate per load. Air cargo carriers are generally paid a negotiated rate for each load hauled. Ocean cargo carriers are generally paid contractually agreed-upon fixed rates per load. The Company also contracts with other third party capacity providers, such as air charter service providers, when required by specific customer needs.
7
Table of Contents
Trailing Equipment
The Company offers its customers a large and diverse fleet of trailing equipment. The following table illustrates the mix of the trailing equipment as of December 27, 2014, either provided by the BCO Independent Contractors or owned or leased by the Company and made available primarily to BCO Independent Contractors. In general, Truck Brokerage Carriers utilize their own trailing equipment when providing transportation services on behalf of Landstar. Truck Brokerage Carrier trailing equipment is not included in the following table:
| Trailers by Type |
||||
| Vans |
10,393 | |||
| Unsided/platform, including flatbeds, step decks, drop decks and low boys |
3,242 | |||
| Temperature-controlled |
97 | |||
|
|
|
|||
| Total |
13,732 | |||
|
|
|
|||
Specialized services offered by the Company include those provided by a large fleet of flatbed trailers and multi-axle trailers capable of hauling extremely heavy or oversized loads. Management believes the Company, along with its network of capacity providers, offers the largest fleet of heavy/specialized trailing equipment in the United States.
At December 27, 2014, 8,953 of the trailers available to the BCO Independent Contractors were owned by the Company and 852 were leased. In addition, at December 27, 2014, 3,927 trailers were provided by the BCO Independent Contractors.
Customers
The Company’s customer base is highly diversified and dispersed across many industries, commodities and geographic regions. The Company’s top 100 customers accounted for approximately 42% and 41%, respectively, of consolidated revenue during fiscal years 2014 and 2013. Management believes that the Company’s overall size, technological applications, geographic coverage, access to equipment and diverse service capability offer the Company significant competitive marketing and operating advantages. These advantages allow the Company to meet the needs of even the largest shippers. Larger shippers often consider reducing the number of authorized carriers they use in favor of a small number of “core carriers,” such as the Company, whose size and diverse service capabilities enable these core carriers to satisfy most of the shippers’ transportation needs. The Company’s national account customers include the United States Department of Defense and many of the companies included in the Fortune 500. Large shippers are also using third party logistics providers (“3PLs”) to outsource the management and coordination of their transportation needs. 3PLs and other transportation companies also utilize the Company’s available transportation capacity to satisfy their obligations to their shippers. There were 10 transportation service providers, including 3PLs, included in the Company’s top 25 customers for the fiscal year 2014. Management believes the Company’s network of agents and third party capacity providers allows it to efficiently attract and service smaller shippers which may not be as desirable to other large transportation providers (see above under “Agent Network”). No customer accounted for more than 3% of the Company’s 2014 revenue.
Technology
Management believes leadership in the development and application of information technology systems is an ongoing part of providing high quality service. Landstar focuses on providing integrated transportation management solutions which emphasize customer service and information coordination among its independent commission sales agents, customers and capacity providers. The Company continues to focus on identifying, purchasing or developing and implementing software applications which are designed to improve its operational and administrative efficiency, assist its independent commission sales agents in sourcing capacity and pricing
8
Table of Contents
transportation services, assist customers in meeting their transportation needs and assist its third party capacity providers in identifying desirable freight. Landstar intends to continue to improve its systems and technologies to meet the total needs of its agents, customers and third party capacity providers.
The Company’s information technology systems used in connection with its operations are located in Jacksonville, Florida and, to a lesser extent, in Rockford, Illinois. In addition, the Company utilizes several third party data centers throughout the U.S. Landstar relies, in the regular course of its business, on the proper operation of its information technology systems.
Corporate Services
The Company provides many administrative support services to its network of independent commission sales agents, third party capacity providers and customers. Management believes that the technological applications purchased or developed and maintained by the Company and its administrative support services provide operational and financial advantages to its independent commission sales agents, third party capacity providers and customers. These, in turn, enhance the operational and financial efficiency of all aspects of the network.
Administrative support services that provide operational and financial advantages to the network include customer contract administration, customer credit review and approvals, sales administration and pricing, customer billing, accounts receivable collections, third party capacity payment, safety and operator and equipment compliance management, insurance claims handling, coordination of vendor discount programs and third party capacity quality programs. Marketing and advertising strategies are also provided by the Company. The Company’s practices of accepting customer credit risk and paying its agents and carriers promptly provides a significant competitive advantage to the Company.
Competition
Landstar competes primarily in the transportation and logistics services industry with truckload carriers, third party logistics companies, intermodal transportation and logistics service providers, railroads, less-than-truckload carriers and other asset-light transportation and logistics service providers. The transportation and logistics services industry is extremely competitive and fragmented.
Management believes that competition for freight transported by the Company is based on service, efficiency and freight rates, which are influenced significantly by the economic environment, particularly the amount of available transportation capacity and freight demand. Management believes that Landstar’s overall size and availability of a wide range of equipment, together with its geographically dispersed local independent agent network and wide range of service offerings, present the Company with significant competitive advantages over many transportation and logistics service providers.
Self-Insured Claims
Potential liability associated with accidents in the trucking industry is severe and occurrences are unpredictable. For commercial trucking claims, Landstar retains liability up to $5,000,000 per occurrence. The Company also retains liability of up to $1,000,000 for each general liability claim, $250,000 for each workers’ compensation claim and up to $250,000 for each cargo claim. The Company’s exposure to liability associated with accidents incurred by Truck Brokerage Carriers, railroads and air and ocean cargo carriers who transport freight on behalf of the Company is reduced by various factors including the extent to which such carriers maintain their own insurance coverage. A material increase in the frequency or severity of accidents, cargo claims or workers’ compensation claims or the material unfavorable development of existing claims could have a material adverse effect on Landstar’s cost of insurance and claims and its results of operations.
9
Table of Contents
Regulation
Certain of the Operating Subsidiaries are considered motor carriers and/or brokers authorized to arrange for transportation services by motor carriers which are regulated by the Federal Motor Carrier Safety Administration (the “FMCSA”) and by various state agencies. The FMCSA has broad regulatory powers with respect to activities such as motor carrier operations, practices, periodic financial reporting and insurance. Subject to federal and state regulatory authorities or regulation, the Company’s capacity providers may transport most types of freight to and from any point in the United States over any route selected.
Interstate motor carrier operations are subject to safety requirements prescribed by the FMCSA. Each driver, whether a BCO Independent Contractor or Truck Brokerage Carrier, is required to have a commercial driver’s license and may be subject to mandatory drug and alcohol testing. The FMCSA’s commercial driver’s license and drug and alcohol testing requirements have not adversely affected the Company’s ability to source the capacity necessary to meet its customers’ transportation needs.
In addition, certain of the Operating Subsidiaries are licensed as ocean transportation intermediaries by the U.S. Federal Maritime Commission as non-vessel-operating common carriers and/or as ocean freight forwarders. The Company’s air transportation activities in the United States are subject to regulation by the U.S. Department of Transportation as an indirect air carrier. One of the Operating Subsidiaries is licensed by the U.S. Department of Homeland Security through the Bureau of U.S. Customs and Border Protection (“U.S. Customs”) as a customs broker. The Company is also subject to regulations and requirements relating to safety and security promulgated by, among others, the U.S. Department of Homeland Security through U.S. Customs and the Transportation Security Administration, the Canada Border Services Agency and various state and local agencies and port authorities.
The transportation industry is subject to possible other regulatory and legislative changes (such as the possibility of more stringent environmental, climate change and/or safety/security regulations or limits on vehicle weight and size) that may affect the economics of the industry by requiring changes in operating practices or by changing the demand for motor carrier services or the cost of providing truckload or other transportation or logistics services.
In addition, because the U.S. government is one of the Company’s customers, the Company must comply with and is affected by laws and regulations relating to doing business with the federal government.
Seasonality
Landstar’s operations are subject to seasonal trends common to the trucking industry. Results of operations for the quarter ending in March are typically lower than for the quarters ending in June, September and December.
Employees
As of December 27, 2014, the Company and its subsidiaries employed 1,211 individuals. Approximately 7 Landstar Ranger drivers (out of a Company total of 8,932 drivers for BCO Independent Contractors) are members of the International Brotherhood of Teamsters. The Company considers relations with its employees to be good.
| Item 1A. | Risk Factors |
Increased severity or frequency of accidents and other claims. As noted above in Item 1, “Business — Factors Significant to the Company’s Operations — Self-Insured Claims,” potential liability associated with accidents in the trucking industry is severe and occurrences are unpredictable. For commercial trucking claims, Landstar retains liability up to $5,000,000 per occurrence. The Company also retains liability of up to $1,000,000 for each general liability claim, $250,000 for each workers’ compensation claim and up to $250,000 for each cargo claim. The Company’s exposure to liability associated with accidents incurred by Truck Brokerage Carriers, railroads and air and ocean cargo carriers who transport freight on behalf of the Company is reduced by various factors including the extent to which such carriers maintain their own insurance coverage. A material
10
Table of Contents
increase in the frequency or severity of accidents, cargo claims or workers’ compensation claims or the material unfavorable development of existing claims could have a material adverse effect on Landstar’s cost of insurance and claims and its results of operations.
Dependence on third party insurance companies. The Company is dependent on a limited number of third party insurance companies to provide insurance coverage in excess of its self-insured retention amounts. Historically, the Company has maintained insurance coverage for commercial trucking claims in excess of specific per occurrence limits, up to various maximum amounts, with a limited number of third party insurance companies. In an attempt to manage the cost of insurance and claims, the Company has historically increased or decreased the level of its financial exposure to commercial trucking claims on a per occurrence basis by increasing or decreasing its level of self-insured retention based on the estimated cost differential between proposed premiums from third party insurance companies and historical losses experienced by the Company at various levels of self-insured retention. To the extent that the third party insurance companies propose increases to their premiums for coverage of commercial trucking claims, the Company may pay such increased premiums or increase its financial exposure on an aggregate or per occurrence basis, including by increasing the amount of its self-insured retention. However, to the extent the third party insurance companies propose reduced premiums for coverage of commercial trucking claims, the Company may reduce its financial exposure on an aggregate or per occurrence basis, including by decreasing the amount of its self-insured retention. In addition, no assurance can be given that insurance coverage from third party insurers for claims in excess of its current $5 million self-insured retention will continue to be available on commercially reasonable terms.
Dependence on independent commission sales agents. As noted above in Item 1, “Business — Factors Significant to the Company’s Operations — Agent Network,” the Company markets its services primarily through independent commission sales agents. During 2014, 525 agents generated revenue for Landstar of at least $1 million each (the “Million Dollar Agents”), or approximately 92% of Landstar’s consolidated revenue. Landstar competes with motor carriers and other third parties for the services of these independent commission sales agents. Landstar has historically experienced very limited agent turnover in the number of its Million Dollar Agents. There can be no assurances, however, that Landstar will continue to experience very limited turnover of its Million Dollar Agents in the future. Landstar’s contracts with its agents, including its Million Dollar Agents, are typically terminable without cause upon 10 to 30 days’ notice by either party and generally contain significant but not unqualified non-compete provisions limiting the ability of a former agent to compete with Landstar for a specified period of time post- termination, and other restrictive covenants. The loss of some of the Company’s Million Dollar Agents and/or a significant decrease in revenue generated by Million Dollar Agents could have a material adverse effect on Landstar, including its results of operations and revenue.
Dependence on third party capacity providers. As noted above in Item 1, “Business — Factors Significant to the Company’s Operations — Transportation Capacity,” Landstar does not own trucks or other transportation equipment (other than trailing equipment) and relies on third party capacity providers, including BCO Independent Contractors, Truck Brokerage Carriers, railroads and air and ocean cargo carriers, to transport freight for its customers. The Company competes with motor carriers and other third parties for the services of BCO Independent Contractors and other third party capacity providers. The market for qualified truck owner-operators and other third party truck capacity providers is very competitive among motor carriers and no assurances can be given that the Company will be able to maintain or expand the number of BCO Independent Contractors or other third party truck capacity providers. Additionally, the Company’s third party capacity providers other than BCO Independent Contractors can be expected, under certain circumstances, to charge higher prices to cover increased operating expenses, such as any increases in the cost of fuel, and the Company’s operating income may decline without a corresponding increase in price to the customer. A significant decrease in available capacity provided by either the Company’s BCO Independent Contractors or other third party capacity providers, or increased rates charged by other third party capacity providers that cannot be passed through to the customers, could have a material adverse effect on Landstar, including its results of operations and revenue.
Decreased demand for transportation services. The transportation industry historically has experienced cyclical financial results as a result of slowdowns in economic activity, the business cycles of customers, and
11
Table of Contents
other economic factors beyond Landstar’s control. If a slowdown in economic activity or a downturn in the Company’s customers’ business cycles cause a reduction in the volume of freight shipped by those customers, the Company’s operating results could be materially adversely affected.
Substantial industry competition. As noted above in Item 1, “Business — Factors Significant to the Company’s Operations — Competition,” Landstar competes primarily in the transportation and logistics services industry. This industry is extremely competitive and fragmented. Landstar competes primarily with truckload carriers, intermodal transportation service providers, railroads, less-than-truckload carriers, third party logistics companies and other asset-light transportation and logistics service providers. Management believes that competition for the freight transported by the Company is based on service, efficiency and freight rates, which are influenced significantly by the economic environment, particularly the amount of available transportation capacity and freight demand. Historically, competition has created downward pressure on freight rates. In addition, many large shippers are using third party logistics providers (“3PLs”) other than the Company to outsource the management and coordination of their transportation needs rather than directly arranging for transportation services with carriers. As noted above, there were 10 transportation service providers, including 3PLs, included in the Company’s top 25 customers for the fiscal year ended December 27, 2014. Usage by large shippers of 3PLs often provides carriers, such as the Company, with a less direct relationship with the shipper and, as a result, may increase pressure on freight rates while making it more difficult for the Company to compete primarily based on service and efficiency. A decrease in freight rates could have a material adverse effect on Landstar, including its revenue and operating income.
Status of independent contractors. From time to time, various legislative or regulatory proposals are introduced at the federal or state levels to change the status of independent contractors’ classification to employees for either employment tax purposes (withholding, social security, Medicare and unemployment taxes) or other benefits available to employees. Currently, most individuals are classified as employees or independent contractors for employment tax purposes based on a multi-factor “common-law” analysis rather than any definition found in the Internal Revenue Code or Internal Revenue Service regulations. In addition, under Section 530 of the Revenue Act of 1978, a taxpayer that meets certain criteria may treat an individual as an independent contractor for employment tax purposes if the taxpayer has been audited without being told to treat similarly situated workers as employees, if the taxpayer has received a ruling from the Internal Revenue Service or a court decision affirming the taxpayer’s treatment of the individual as an independent contractor, or if the taxpayer is following a long-standing recognized practice.
The Company classifies its BCO Independent Contractors and independent commission sales agents as independent contractors for all purposes, including employment tax and employee benefits. There can be no assurance that legislative, judicial, or regulatory (including tax) authorities will not introduce proposals or assert interpretations of existing rules and regulations that would change the employee/independent contractor classification of BCO Independent Contractors or independent commission sales agents doing business with the Company. Although management believes that there are no proposals currently pending that would significantly change the employee/independent contractor classification of BCO Independent Contractors or independent commission sales agents currently doing business with the Company, potential changes, if any, with respect to these BCO Independent Contractor and independent commission sales agent classifications could have a material adverse effect on Landstar’s operating model. Moreover, the costs associated with any such potential changes could have a material adverse effect on the Company’s results of operations and financial condition if Landstar were unable to pass through to its customers an increase in price corresponding to such increased costs.
Regulatory and legislative changes. As noted above in Item 1, “Business — Factors Significant to the Company’s Operations — Regulation,” certain of the Operating Subsidiaries are motor carriers and/or property brokers authorized to arrange for transportation services by motor carriers which are regulated by the Federal Motor Carrier Safety Administration (FMCSA), an agency of the U.S. Department of Transportation, and by various state agencies. Certain of the Operating Subsidiaries are licensed as ocean transportation intermediaries by the U.S. Federal Maritime Commission as non-vessel-operating common carriers and/or as ocean freight
12
Table of Contents
forwarders. The Company’s air transportation activities in the United States are subject to regulation by the U.S. Department of Transportation as an indirect air carrier. One of the Company’s subsidiaries is licensed by the U.S. Department of Homeland Security through the Bureau of U.S. Customs and Border Protection (“U.S. Customs”) as a customs broker. The Company is also subject to regulations and requirements relating to safety and security promulgated by, among others, the U.S. Department of Homeland Security through U.S. Customs and the Transportation Security Administration, the Canada Border Services Agency and various state and local agencies and port authorities. The transportation industry is subject to possible regulatory and legislative changes (such as increasingly stringent environmental, climate change and/or safety/security regulations or limits on vehicle weight and size) that may affect the economics of the industry by requiring changes in operating practices or by changing the demand for common or contract carrier services or the cost of providing truckload or other transportation or logistics services.
In particular, the FMCSA is consistently proposing regulatory changes that affect the operation of commercial motor carriers across the United States. The FMSCA has established the Compliance Safety Accountability (CSA) motor carrier oversight program. The Company believes the intent of this program is to improve regulatory oversight of motor carriers and commercial drivers using a safety measurement system methodology that is fundamentally different from the methodology that the FMCSA has historically relied upon. Under CSA, the FMCSA monitors seven Behavior Analysis and Safety Improvement Categories, or BASICs, under which a motor carrier may be evaluated. Since the introduction of CSA in December 2010, the FMCSA has considered and implemented changes to the methodologies used to determine carrier scores within a BASIC as well as to the BASICs, themselves. The FMCSA has also established threshold scores for each BASIC. In the event a motor carrier has one or more BASIC scores that exceeds the applicable threshold, the motor carrier has an increased risk of audit by FMSCA. BASIC scores in excess of applicable thresholds may also adversely affect a motor carrier’s overall safety rating and its relationships with shippers. The FMSCA has also recently implemented changes to the hours of service regulations which govern the work hours of commercial drivers and has a number of other proposals that it has announced are in process, including a rule which may mandate the use of electronic logging devices in over-the-road commercial motor vehicles. It is difficult to predict which and in what form CSA or any other FMCSA regulations may be implemented, modified or enforced and what impact any such regulation may have on motor carrier operations or the aggregate number of trucks that provide hauling capacity to the Company.
In addition, recent focus on climate change and related environmental matters has led to efforts by federal, state and local governmental agencies to support legislation and regulations to limit the amount of carbon emissions, including emissions created by diesel engines utilized in tractors operated by the Company’s BCO Independent Contractors and Truck Brokerage Carriers. Moreover, federal, state and local governmental agencies may also focus on regulation in relation to trailing equipment specifications in an effort to achieve, among other things, lower carbon emissions. For example, the California Air Resources Board (“CARB”) has implemented regulations that restrict the ability of certain tractors and trailers from operating in California. The Company currently is in a multi-year process of replacing its entire fleet of van trailing equipment to remain CARB-compliant. Further, CARB has established regulations that impose emission standards on nearly all diesel-fueled trucks with gross vehicle weight ratings in excess of 14,000 lbs. that operate in California. No assurances can be given with respect to the extent BCO Independent Contractors will choose to become CARB-compliant by purchasing a new or used CARB-compliant tractor, replacing the engine in their existing tractor with a CARB-compliant engine or performing an exhaust retrofit of their existing tractor by installing a particulate matter filter. Accordingly, many of the Company’s BCO Independent Contractors may choose not to haul loads that would require travel within California, which could affect the ability of the Company to service customer freight needs for freight originating from, delivering to or traveling through California. Moreover, increased regulation on tractor or trailing equipment specifications, including emissions created by diesel engines, could create substantial costs on the Company and the Company’s third party capacity providers and, in turn, increase the cost of purchased transportation to the Company. An increase in the costs to purchase, lease or maintain tractor or trailing equipment or in purchased transportation cost caused by new regulations without a corresponding increase in price to the customer could adversely affect Landstar, including its results of operations and financial condition.
13
Table of Contents
Disruptions or failures in the Company’s computer systems. As noted above in Item 1, “Business — Factors Significant to the Company’s Operations — Technology,” the Company’s information technology systems used in connection with its operations are located in Jacksonville, Florida and to a lesser extent in Rockford, Illinois. In addition, the Company utilizes several third party data centers throughout the U.S. Landstar relies in the regular course of its business on the proper operation of its information technology systems to link its extensive network of customers, agents and third party capacity providers, including its BCO Independent Contractors. Although the Company has redundant systems for its critical operations, any significant disruption or failure of its technology systems or those of third party data centers on which it relies could significantly disrupt the Company’s operations and impose significant costs on the Company.
Dependence on key vendors. As described above under “Dependence on third party insurance companies” and “Disruptions or failures in the Company’s computer systems,” the Company is dependent on certain vendors, including third party insurance companies, third party data center providers, third party information technology application providers and third party payment disbursement providers. Any inability to negotiate satisfactory terms with one of these key vendors or any other significant disruption to or termination of a relationship with one of these key vendors could disrupt the Company’s operations and impose significant costs on the Company.
Potential changes in fuel taxes. From time to time, various legislative proposals are introduced to increase federal, state, or local taxes, including taxes on motor fuels. The Company cannot predict whether, or in what form, any increase in such taxes applicable to the transportation services provided by the Company will be enacted and, if enacted, whether or not the Company’s Truck Brokerage Carriers would attempt to pass the increase on to the Company or if the Company will be able to reflect this potential increased cost of capacity, if any, in prices to customers. Any such increase in fuel taxes, without a corresponding increase in price to the customer, could have a material adverse effect on Landstar, including its results of operations and financial condition. Moreover, competition from other transportation service companies including those that provide non-trucking modes of transportation and intermodal transportation would likely increase if state or federal taxes on fuel were to increase without a corresponding increase in taxes imposed upon other modes of transportation.
Catastrophic loss of a Company facility. The Company faces the risk of a catastrophic loss of the use of all or a portion of its facilities located in Jacksonville, Florida and Rockford, Illinois due to hurricanes, flooding, tornados, other weather conditions, natural disasters, terrorist attacks or otherwise. The Company’s corporate headquarters and approximately two-thirds of the Company’s employees are located in its Jacksonville, Florida facility. In particular, a significant hurricane or similar catastrophic event that impacts the Jacksonville, Florida metropolitan area could significantly disrupt the Company’s operations and impose significant costs on the Company.
Although the Company maintains insurance covering its facilities, including business interruption insurance, the Company’s insurance may not be adequate to cover all losses that may be incurred in the event of a catastrophic loss of one of the Company’s facilities. In addition, such insurance, including business interruption insurance, could in the future become more expensive and difficult to maintain and may not be available on commercially reasonable terms or at all.
Intellectual property. The Company uses both internally developed and purchased technology in conducting its business. Whether internally developed or purchased, it is possible that the use of these technologies could be claimed to infringe upon or violate the intellectual property rights of third parties. In the event that a claim is made against the Company by a third party for the infringement of intellectual property rights, any settlement or adverse judgment against the Company either in the form of increased costs of licensing or a cease and desist order in using the technology could have an adverse effect on the Company’s business and its results of operations.
Unclaimed property. The Company is subject to federal and state laws relating to abandoned and unclaimed property. States routinely audit the records of companies to assess compliance with such laws. The
14
Table of Contents
Company is currently undergoing a multi-state unclaimed property audit, the timing and outcome of which cannot be predicted. The Company may incur significant professional fees in connection with the audit. If the Company is found to be in noncompliance with applicable unclaimed property laws or the manner in which such laws are interpreted or applied, states may determine that they are entitled to the remittance by the Company of significant amounts of unclaimed or abandoned property and further may seek to impose other significant costs on the Company, including penalties and interest.
| Item 1B. | Unresolved Staff Comments |
None.
| Item 2. | Properties |
The Company owns or leases various properties in the U.S. for the Company’s operations and administrative staff that support its independent commission sales agents, BCO Independent Contractors and other third party capacity providers. The transportation logistics segment’s primary facilities are located in Jacksonville, Florida and Rockford, Illinois. In addition, the Company’s corporate headquarters are located in Jacksonville, Florida. The Jacksonville, Florida and Rockford, Illinois facilities are owned by the Company. Management believes that Landstar’s owned and leased properties are adequate for its current needs and that leased properties can be retained or replaced at an acceptable cost.
| Item 3. | Legal Proceedings |
The Company is involved in certain claims and pending litigation arising from the normal conduct of business. Many of these claims are covered in whole or in part by insurance. Based on knowledge of the facts and, in certain cases, opinions of outside counsel, management believes that adequate provisions have been made for probable losses with respect to the resolution of all such claims and pending litigation and that the ultimate outcome, after provisions therefor, will not have a material adverse effect on the financial condition of the Company, but could have a material effect on the results of operations in a given quarter or year.
| Item 4. | Mine Safety Disclosures |
Not applicable.
15
Table of Contents
PART II
| Item 5. | Market for Registrant’s Common Equity, Related Stockholder Matters and Issuer Purchases of Equity Securities |
The Common Stock of the Company is listed and traded on the NASDAQ Global Select Market under the symbol “LSTR.” The following table sets forth the high and low reported sale prices for the Common Stock on the NASDAQ Global Select Market and the per share value of dividends declared for the periods indicated.
| 2014 Market Price | 2013 Market Price | Dividends Declared | ||||||||||||||||||||||||||
| Fiscal Period |
High | Low | High | Low | 2014 | 2013 | 2012 | |||||||||||||||||||||
| First Quarter |
$ | 61.92 | $ | 56.00 | $ | 59.97 | $ | 51.45 | $ | 0.060 | $ | — | $ | 0.055 | ||||||||||||||
| Second Quarter |
65.79 | 58.29 | 57.45 | 50.39 | 0.060 | — | 0.055 | |||||||||||||||||||||
| Third Quarter |
73.95 | 63.32 | 57.94 | 51.47 | 0.070 | — | 0.060 | |||||||||||||||||||||
| Fourth Quarter |
81.80 | 67.93 | 58.84 | 53.56 | 1.070 | 0.350 | 0.560 | |||||||||||||||||||||
The reported last sale price per share of the Common Stock as reported on the NASDAQ Global Select Market on January 23, 2015 was $66.23 per share. As of such date, Landstar had 44,794,486 shares of Common Stock outstanding and had 71 stockholders of record of its Common Stock. However, the Company estimates that it has a significantly greater number of stockholders because a substantial number of the Company’s shares are held by brokers or dealers for their customers in street name.
Purchases of Equity Securities by the Company
The Company did not purchase any shares of its Common Stock during the period from September 28, 2014 to December 27, 2014, the Company’s fourth fiscal quarter. On December 11, 2013, Landstar System, Inc. announced that it had been authorized by its Board of Directors to increase the number of shares of the Company’s Common Stock that the Company is authorized to purchase from time to time in the open market and in privately negotiated transactions under a previously announced purchase program to 3,000,000 shares. As of December 27, 2014, the Company has authorization to purchase 1,827,782 shares of its Common Stock under this program. No specific expiration date has been assigned to the December 11, 2013 authorization.
Dividends
During 2014, Landstar paid dividends as follows:
| Dividend Amount per Share |
Declaration Date | Record Date | Payment Date | |||||||||
| $0.35 |
December 10, 2013 | December 27, 2013 | January 16, 2014 | |||||||||
| $0.06 |
January 29, 2014 | February 18, 2014 | March 14, 2014 | |||||||||
| $0.06 |
April 23, 2014 | May 8, 2014 | May 30, 2014 | |||||||||
| $0.07 |
July 22, 2014 | August 11, 2014 | August 29, 2014 | |||||||||
| $0.07 |
October 2, 2014 | November 11, 2014 | December 5, 2014 | |||||||||
The Company did not pay cash dividends during fiscal year 2013. Dividends payable of $0.35 per share, or of $15,921,000 in the aggregate, was included in current liabilities in the consolidated balance sheet at December 28, 2013. On December 4, 2014, the Company announced that its Board of Directors declared a special dividend of $1.00 per share payable on January 26, 2015, to stockholders of record of its Common Stock
as of January 12, 2015. Dividends payable of $44,794,000 in the aggregate related to this special dividend are included in current liabilities in the consolidated balance sheet at December 27, 2014. On January 29, 2015, the Company announced the declaration of a quarterly dividend of $0.07 per share payable on March 13, 2015, to stockholders of record on February 16, 2015. It is currently the intention of the Board of Directors to pay a quarterly dividend going forward.
16
Table of Contents
On June 29, 2012, Landstar entered into a credit agreement with a syndicate of banks and JPMorgan Chase Bank, N.A., as administrative agent (the “Credit Agreement”). The Credit Agreement provides for a restriction on cash dividends and other distributions to stockholders on the Company’s capital stock in the event there is a default under the Credit Agreement. In addition, the Credit Agreement, under certain circumstances, limits the amount of such cash dividends and other distributions to stockholders to the extent that, after giving effect to any payment made to effect such cash dividend or other distribution, the Leverage Ratio, as defined in the Credit Agreement, would exceed 2.5 to 1 on a pro forma basis as of the end of the Company’s most recently completed fiscal quarter.
Equity Compensation Plan Information
The Company maintains two stock compensation plans for members of its Board of Directors and two employee equity incentive plans. The following table presents information related to securities authorized for issuance under these plans at December 27, 2014:
| Plan Category |
Number of Securities to be Issued Upon Exercise of Outstanding Options |
Weighted-average Exercise Price of Outstanding Options |
Number of Securities Remaining Available for Future Issuance Under Equity Compensation Plans |
|||||||||
| Equity Compensation Plans Approved by Security Holders |
773,839 | $ | 46.92 | 4,821,563 | ||||||||
| Equity Compensation Plans Not Approved by Security Holders |
0 | 0 | 0 | |||||||||
Under the 2011 Equity Incentive Plan (the “2011 EIP”), the issuance of (i) a non-vested share of Landstar Common Stock issued in the form of restricted stock and (ii) a share of Landstar Common Stock issued upon the vesting of a previously granted restricted stock unit each counts as the issuance of two securities against the number of securities available for future issuance. Included in the number of securities remaining available for future issuance under equity compensation plans were 95,531 shares of Common Stock reserved for issuance under the 2013 Directors’ Stock Compensation Plan.
17
Table of Contents
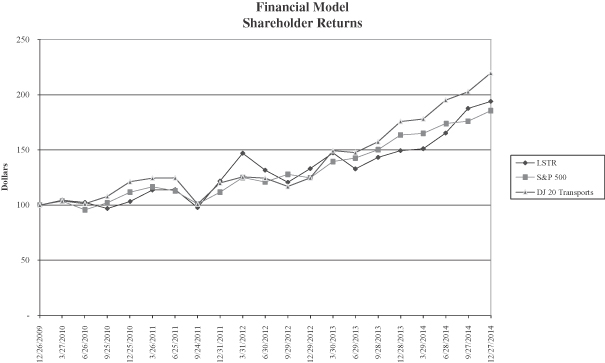
Financial Model Shareholder Returns
The following graph illustrates the return that would have been realized, assuming reinvestment of dividends, by an investor who invested $100 in each of the Company’s Common Stock, the Standard and Poor’s 500 Stock Index and the Dow Jones Transportation Stock Index for the period commencing December 26, 2009 through December 27, 2014.
18
Table of Contents
| Item 6. | Selected Financial Data |
LANDSTAR SYSTEM, INC. AND SUBSIDIARY
SELECTED CONSOLIDATED FINANCIAL DATA
(Dollars in thousands, except per share amounts)
| Fiscal Years | ||||||||||||||||||||
| Income Statement Data: |
2014 | 2013 | 2012 | 2011 | 2010 | |||||||||||||||
| Revenue |
$ | 3,184,790 | $ | 2,664,780 | $ | 2,770,799 | $ | 2,628,374 | $ | 2,380,112 | ||||||||||
| Investment income |
1,381 | 1,475 | 1,563 | 1,705 | 1,558 | |||||||||||||||
| Costs and expenses: |
||||||||||||||||||||
| Purchased transportation |
2,461,143 | 2,046,927 | 2,130,323 | 2,007,666 | 1,824,308 | |||||||||||||||
| Commissions to agents |
250,780 | 211,355 | 218,122 | 209,917 | 181,354 | |||||||||||||||
| Other operating costs, net of gains/losses on asset dispositions |
25,771 | 21,568 | 22,582 | 28,285 | 26,744 | |||||||||||||||
| Insurance and claims |
46,280 | 50,438 | 37,289 | 42,638 | 49,156 | |||||||||||||||
| Selling, general and administrative |
150,250 | 131,710 | 138,094 | 136,841 | 132,839 | |||||||||||||||
| Depreciation and amortization |
27,575 | 27,667 | 25,213 | 23,905 | 23,165 | |||||||||||||||
|
|
|
|
|
|
|
|
|
|
|
|||||||||||
| Total costs and expenses |
2,961,799 | 2,489,665 | 2,571,623 | 2,449,252 | 2,237,566 | |||||||||||||||
|
|
|
|
|
|
|
|
|
|
|
|||||||||||
| Operating income |
224,372 | 176,590 | 200,739 | 180,827 | 144,104 | |||||||||||||||
| Interest and debt expense |
3,177 | 3,211 | 3,110 | 3,109 | 3,624 | |||||||||||||||
|
|
|
|
|
|
|
|
|
|
|
|||||||||||
| Income from continuing operations before income taxes |
221,195 | 173,379 | 197,629 | 177,718 | 140,480 | |||||||||||||||
| Income taxes |
82,386 | 64,457 | 71,063 | 66,175 | 51,223 | |||||||||||||||
|
|
|
|
|
|
|
|
|
|
|
|||||||||||
| Income from continuing operations |
138,809 | 108,922 | 126,566 | 111,543 | 89,257 | |||||||||||||||
| Discontinued operations: |
||||||||||||||||||||
| Income (loss) from discontinued operations, net of income taxes |
— | 4,058 | 3,215 | 1,464 | (1,743 | ) | ||||||||||||||
| Gain on sale of discontinued operations, net of income taxes |
— | 33,029 | — | — | — | |||||||||||||||
|
|
|
|
|
|
|
|
|
|
|
|||||||||||
| Income (loss) from discontinued operations, net of income taxes |
— | 37,087 | 3,215 | 1,464 | (1,743 | ) | ||||||||||||||
|
|
|
|
|
|
|
|
|
|
|
|||||||||||
| Net income |
$ | 138,809 | $ | 146,009 | $ | 129,781 | $ | 113,007 | $ | 87,514 | ||||||||||
|
|
|
|
|
|
|
|
|
|
|
|||||||||||
| Earnings per common share: |
||||||||||||||||||||
| Income from continuing operations |
$ | 3.09 | $ | 2.37 | $ | 2.71 | $ | 2.35 | $ | 1.80 | ||||||||||
| Income (loss) from discontinued operations |
$ | — | $ | 0.81 | $ | 0.07 | $ | 0.03 | $ | (0.03 | ) | |||||||||
| Earnings per common share |
$ | 3.09 | $ | 3.17 | $ | 2.78 | $ | 2.38 | $ | 1.77 | ||||||||||
| Diluted earnings per share: |
||||||||||||||||||||
| Income from continuing operations |
$ | 3.07 | $ | 2.36 | $ | 2.70 | $ | 2.35 | $ | 1.80 | ||||||||||
| Income (loss) from discontinued operations |
$ | — | $ | 0.80 | $ | 0.07 | $ | 0.03 | $ | (0.03 | ) | |||||||||
| Diluted earnings per share |
$ | 3.07 | $ | 3.16 | $ | 2.77 | $ | 2.38 | $ | 1.77 | ||||||||||
| Dividends per common share |
$ | 1.26 | $ | 0.35 | $ | 0.73 | $ | 0.21 | $ | 0.19 | ||||||||||
19
Table of Contents
| Balance Sheet Data: |
Dec. 27, 2014 |
Dec. 28, 2013 |
Dec. 29, 2012 |
Dec. 31, 2011 |
Dec. 25, 2010 |
|||||||||||||||
| Total assets |
$ | 1,044,212 | $ | 970,696 | $ | 879,421 | $ | 808,449 | $ | 683,882 | ||||||||||
| Long-term debt, including current maturities |
111,321 | 101,505 | 114,141 | 132,342 | 121,611 | |||||||||||||||
| Shareholders’ equity |
488,261 | 454,481 | 379,454 | 300,577 | 250,967 | |||||||||||||||
The information above for fiscal years 2010, 2011, 2012 and 2013 has been adjusted for the completion of the sale of Landstar Supply Chain Solutions, Inc., including its wholly owned subsidiary, Landstar Supply Chain Solutions LLC (collectively, “LSCS”), to XPO Logistics, Inc. and the treatment of LSCS as a discontinued operation effective December 28, 2013.
| Item 7. | Management’s Discussion and Analysis of Financial Condition and Results of Operations |
Forward-Looking Statements
The following is a “safe harbor” statement under the Private Securities Litigation Reform Act of 1995. Statements contained in this document that are not based on historical facts are “forward-looking statements.” This Management’s Discussion and Analysis of Financial Condition and Results of Operations and other sections of this Form 10-K contain forward-looking statements, such as statements which relate to Landstar’s business objectives, plans, strategies and expectations. Terms such as “anticipates,” “believes,” “estimates,” “intention,” “expects,” “plans,” “predicts,” “may,” “should,” “could,” “will,” the negative thereof and similar expressions are intended to identify forward-looking statements. Such statements are by nature subject to uncertainties and risks, including but not limited to: an increase in the frequency or severity of accidents or other claims; unfavorable development of existing accident claims; dependence on third party insurance companies; dependence on independent commission sales agents; dependence on third party capacity providers; decreased demand for transportation services; substantial industry competition; disruptions or failures in the Company’s computer systems; dependence on key vendors; changes in fuel taxes; status of independent contractors; regulatory and legislative changes; catastrophic loss of a Company facility; intellectual property; unclaimed property; and other operational, financial or legal risks or uncertainties detailed in this and Landstar’s other SEC filings from time to time and described in Item 1A of this Form 10-K under the heading “Risk Factors.” These risks and uncertainties could cause actual results or events to differ materially from historical results or those anticipated. Investors should not place undue reliance on such forward-looking statements and the Company undertakes no obligation to publicly update or revise any forward-looking statements.
Introduction
Landstar System, Inc. and its subsidiary, Landstar System Holdings, Inc. (together, referred to herein as “Landstar” or the “Company”), is an asset-light provider of integrated transportation management solutions. The Company offers services to its customers across multiple transportation modes, with the ability to arrange for individual shipments of freight to enterprise-wide solutions to manage all of a customer’s transportation needs. Landstar provides services principally throughout the United States and to a lesser extent in Canada, and between the United States and Canada, Mexico and other countries around the world. The Company’s services emphasize safety, information coordination and customer service and are delivered through a network of independent commission sales agents and third party capacity providers linked together by a series of technological applications which are provided and coordinated by the Company. The nature of the Company’s business is such that a significant portion of its operating costs varies directly with revenue.
Landstar markets its integrated transportation management solutions primarily through independent commission sales agents and exclusively utilizes third party capacity providers to transport customers’ freight. Landstar’s independent commission sales agents enter into contractual arrangements with the Company and are responsible for locating freight, making that freight available to Landstar’s capacity providers and coordinating the transportation of the freight with customers and capacity providers. The Company’s third party capacity providers consist of independent contractors who provide truck capacity to the Company under exclusive lease
20
Table of Contents
arrangements (the “BCO Independent Contractors”), unrelated trucking companies who provide truck capacity to the Company under non-exclusive contractual arrangements (the “Truck Brokerage Carriers”), air cargo carriers, ocean cargo carriers and railroads. Through this network of agents and capacity providers linked together by Landstar’s information technology systems, Landstar operates an integrated transportation management solutions business primarily throughout North America with revenue of $3.2 billion during the most recently completed fiscal year. The Company reports the results of two operating segments: the transportation logistics segment and the insurance segment.
The transportation logistics segment provides a wide range of integrated transportation management solutions. Transportation services offered by the Company include truckload and less-than-truckload transportation, rail intermodal, air cargo, ocean cargo, expedited ground and air delivery of time-critical freight, heavy-haul/specialized, U.S.-Canada and U.S.-Mexico cross-border, project cargo and customs brokerage. Industries serviced by the transportation logistics segment include automotive products, building products, metals, chemicals, foodstuffs, heavy machinery, retail, electronics, ammunition and explosives and military equipment. In addition, the transportation logistics segment provides transportation services to other transportation companies, including logistics and less-than-truckload service providers. Each of the independent commission sales agents has the opportunity to market all of the services provided by the transportation logistics segment. Billings for freight transportation services are typically charged to customers on a per shipment basis for the physical transportation of freight and are referred to as transportation revenue. During 2014, revenue hauled by BCO Independent Contractors, Truck Brokerage Carriers and railroads represented approximately 48%, 46% and 3%, respectively, of the Company’s consolidated revenue. Collectively, revenue hauled by air and ocean cargo carriers represented approximately 2% of the Company’s consolidated revenue during 2014.
The insurance segment is comprised of Signature Insurance Company, a wholly owned offshore insurance subsidiary (“Signature”), and Risk Management Claim Services, Inc. This segment provides risk and claims management services to certain of Landstar’s Operating Subsidiaries. In addition, it reinsures certain risks of the Company’s BCO Independent Contractors and provides certain property and casualty insurance directly to certain of Landstar’s Operating Subsidiaries. Revenue at the insurance segment represents reinsurance premiums from third party insurance companies that provide insurance programs to BCO Independent Contractors where all or a portion of the risk is ultimately borne by Signature. Revenue at the insurance segment represented approximately 1% of the Company’s consolidated revenue for 2014.
On December 28, 2013, the Company completed the sale of Landstar Supply Chain Solutions, Inc., a Delaware corporation, including its wholly owned subsidiary, Landstar Supply Chain Solutions LLC (collectively, “LSCS”), to XPO Logistics, Inc. LSCS was previously reported as a unit of the transportation logistics segment. The gain on the sale of LSCS and the operating results of LSCS for the fiscal year 2013 and prior periods have been reclassified in the consolidated financial statements to discontinued operations.
Changes in Financial Condition and Results of Operations
Management believes the Company’s success principally depends on its ability to generate freight through its network of independent commission sales agents and to safely and efficiently deliver that freight utilizing third party capacity providers. Management believes the most significant factors to the Company’s success include increasing revenue, sourcing capacity and controlling costs, including insurance and claims.
While customer demand, which is subject to overall economic conditions, ultimately drives increases or decreases in revenue, the Company primarily relies on its independent commission sales agents to establish customer relationships and generate revenue opportunities. Management’s emphasis with respect to revenue growth is on revenue generated by independent commission sales agents who on an annual basis generate $1 million or more of Landstar revenue (“Million Dollar Agents”). Management believes future revenue growth is primarily dependent on its ability to increase both the revenue generated by Million Dollar Agents and the number of Million Dollar Agents through a combination of recruiting new agents and increasing the revenue
21
Table of Contents
opportunities generated by existing independent commission sales agents. The following table shows the number of Million Dollar Agents, the average revenue generated by these agents and the percent of consolidated revenue generated by these agents during the past three fiscal years:
| Fiscal Year | ||||||||||||
| 2014 | 2013 | 2012 | ||||||||||
| Number of Million Dollar Agents |
525 | 478 | 504 | |||||||||
|
|
|
|
|
|
|
|||||||
| Average revenue generated per Million Dollar Agent |
$ | 5,609,000 | $ | 5,081,000 | $ | 4,999,000 | ||||||
|
|
|
|
|
|
|
|||||||
| Percent of consolidated revenue from continuing operations generated by Million Dollar Agents |
92 | % | 91 | % | 91 | % | ||||||
|
|
|
|
|
|
|
|||||||
The change in the number of Million Dollar Agents on a year-over-year basis is influenced by many factors and is not solely the result of terminations of contractual relationships between agents and the Company, whether such terminations are initiated by the agent or the Company. Such other factors include consolidations among agencies or retirement or similar transition actions. The change in the number of Million Dollar Agents on a year-over-year basis may also be affected by agents that remain with the Company yet experienced lower year-over-year revenue that resulted in such agent moving below the Million Dollar Agent category. In general, the number of agents in the million dollar category who terminate in a given year has been 3% or less of the total number of Million Dollar Agents. In addition, revenue from accounts formerly handled by terminated Million Dollar Agents is often retained by the Company as the customer may choose to transfer its account to an existing Landstar agent.
Management monitors business activity by tracking the number of loads (volume) and revenue per load by mode of transportation. Revenue per load can be influenced by many factors other than a change in price. Those factors include the average length of haul, freight type, special handling and equipment requirements, fuel costs and delivery time requirements. For shipments involving two or more modes of transportation, revenue is generally classified by the mode of transportation having the highest cost for the load. The following table summarizes this information by trailer type for truck transportation and by mode for all others for the past three fiscal years:
| Fiscal Year | ||||||||||||
| 2014 | 2013 | 2012 | ||||||||||
| Revenue from continuing operations generated through (in thousands): |
||||||||||||
| Truck transportation |
||||||||||||
| Truckload: |
||||||||||||
| Van equipment |
$ | 1,814,195 | $ | 1,464,558 | $ | 1,463,671 | ||||||
| Unsided/platform equipment |
1,093,999 | 932,176 | 1,047,262 | |||||||||
| Less-than-truckload |
80,384 | 71,769 | 71,989 | |||||||||
|
|
|
|
|
|
|
|||||||
| Total truck transportation |
2,988,578 | 2,468,503 | 2,582,922 | |||||||||
| Rail intermodal |
81,220 | 73,820 | 73,932 | |||||||||
| Ocean and air cargo carriers |
74,952 | 85,681 | 77,898 | |||||||||
| Other(1) |
40,040 | 36,776 | 36,047 | |||||||||
|
|
|
|
|
|
|
|||||||
| $ | 3,184,790 | $ | 2,664,780 | $ | 2,770,799 | |||||||
|
|
|
|
|
|
|
|||||||
| Number of loads: |
||||||||||||
| Truck transportation |
||||||||||||
| Truckload: |
||||||||||||
| Van equipment |
1,038,517 | 935,530 | 938,159 | |||||||||
| Unsided/platform equipment |
444,852 | 418,982 | 442,327 | |||||||||
| Less-than-truckload |
96,541 | 101,498 | 106,834 | |||||||||
|
|
|
|
|
|
|
|||||||
| Total truck transportation |
1,579,910 | 1,456,010 | 1,487,320 | |||||||||
| Rail intermodal |
31,640 | 29,450 | 29,810 | |||||||||
| Ocean and air cargo carriers |
16,260 | 16,660 | 15,390 | |||||||||
|
|
|
|
|
|
|
|||||||
| 1,627,810 | 1,502,120 | 1,532,520 | ||||||||||
|
|
|
|
|
|
|
|||||||
22
Table of Contents
| Fiscal Year | ||||||||||||
| 2014 | 2013 | 2012 | ||||||||||
| Revenue per load: |
||||||||||||
| Truck transportation |
||||||||||||
| Truckload: |
||||||||||||
| Van equipment |
$ | 1,747 | $ | 1,565 | $ | 1,560 | ||||||
| Unsided/platform equipment |
2,459 | 2,225 | 2,368 | |||||||||
| Less-than-truckload |
833 | 707 | 674 | |||||||||
| Total truck transportation |
1,892 | 1,695 | 1,737 | |||||||||
| Rail intermodal |
2,567 | 2,507 | 2,480 | |||||||||
| Ocean and air cargo carriers |
4,610 | 5,143 | 5,062 | |||||||||
| Revenue by capacity type (as a % of total revenue): |
||||||||||||
| Truck capacity providers |
||||||||||||
| BCO independent contractors |
48 | % | 50 | % | 50 | % | ||||||
| Truck brokerage carriers |
46 | % | 43 | % | 43 | % | ||||||
| Rail intermodal |
3 | % | 3 | % | 3 | % | ||||||
| Ocean and air cargo carriers |
2 | % | 3 | % | 3 | % | ||||||
| Other |
1 | % | 1 | % | 1 | % | ||||||
| (1) | Includes primarily premium revenue generated by the insurance segment. |
Also critical to the Company’s success is its ability to secure capacity, particularly truck capacity, at rates that allow the Company to profitably transport customers’ freight. The following table summarizes available truck capacity providers as of the end of the three most recent fiscal years:
| Dec. 27, 2014 |
Dec. 28, 2013 |
Dec. 29, 2012 |
||||||||||
| BCO Independent Contractors |
8,372 | 7,927 | 8,010 | |||||||||
| Truck Brokerage Carriers: |
||||||||||||
| Approved and active(1) |
26,222 | 21,183 | 20,922 | |||||||||
| Other approved |
12,135 | 10,933 | 10,623 | |||||||||
|
|
|
|
|
|
|
|||||||
| 38,357 | 32,116 | 31,545 | ||||||||||
|
|
|
|
|
|
|
|||||||
| Total available truck capacity providers |
46,729 | 40,043 | 39,555 | |||||||||
|
|
|
|
|
|
|
|||||||
| Number of trucks provided by BCO Independent Contractors |
8,932 | 8,432 | 8,523 | |||||||||
|
|
|
|
|
|
|
|||||||
| (1) | Active refers to Truck Brokerage Carriers who moved at least one load in the 180 days immediately preceding the fiscal year end. |
The Company incurs costs that are directly related to the transportation of freight that include purchased transportation and commissions to agents. The Company incurs indirect costs associated with the transportation of freight that include other operating costs and insurance and claims. In addition, the Company incurs selling, general and administrative costs essential to administering its business operations. Management continually monitors all components of the costs incurred by the Company and establishes annual cost budgets which, in general, are used to benchmark costs incurred on a monthly basis.
Purchased transportation represents the amount a BCO Independent Contractor or other third party capacity provider is paid to haul freight. The amount of purchased transportation paid to a BCO Independent Contractor is primarily based on a contractually agreed-upon percentage of revenue generated by delivered loads the BCO Independent Contractor hauled. Purchased transportation paid to a Truck Brokerage Carrier is based on either a negotiated rate for each load hauled or, to a lesser extent, a contractually agreed-upon fixed rate per load. Purchased transportation paid to railroads is based on either a negotiated rate for each load hauled or a contractually agreed-upon fixed rate. Purchased transportation paid to air cargo carriers is generally based on a
23
Table of Contents
negotiated rate for each load hauled and purchased transportation paid to ocean cargo carriers is generally based on contractually agreed-upon fixed rates. Purchased transportation as a percentage of revenue for truck brokerage, rail intermodal and ocean cargo services is normally higher than that of BCO Independent Contractor and air cargo services. Purchased transportation is the largest component of costs and expenses and, on a consolidated basis, increases or decreases as a percentage of consolidated revenue in proportion to changes in the percentage of consolidated revenue generated through BCO Independent Contractors and other third party capacity providers and reinsurance premiums. Purchased transportation as a percent of revenue also increases or decreases in relation to the availability of truck brokerage capacity and with changes in the price of fuel on revenue hauled by Truck Brokerage Carriers. Purchased transportation costs are recognized upon the completion of freight delivery.
Commissions to agents are based on contractually agreed-upon percentages of revenue or net revenue, defined as revenue less the cost of purchased transportation, or net revenue less a contractually agreed upon percentage of revenue retained by Landstar. Commissions to agents as a percentage of consolidated revenue will vary directly with fluctuations in the percentage of consolidated revenue generated by the various modes of transportation and reinsurance premiums and with changes in net revenue margin, defined as net revenue divided by revenue, on services provided by Truck Brokerage Carriers, railroads, air cargo carriers and ocean cargo carriers. Commissions to agents are recognized upon the completion of freight delivery.
The Company defines gross profit as revenue less the cost of purchased transportation and commissions to agents. Gross profit divided by revenue is referred to as gross profit margin. The Company’s operating margin is defined as operating income divided by gross profit.
In general, gross profit margin on revenue hauled by BCO Independent Contractors represents a fixed percentage of revenue due to the nature of the contracts that pay a fixed percentage of revenue to both the BCO Independent Contractors and independent commission sales agents. For revenue hauled by Truck Brokerage Carriers, gross profit margin is either fixed or variable as a percent of revenue, depending on the contract with each individual independent commission sales agent. Under certain contracts with independent commission sales agents, the Company retains a fixed percentage of revenue and the agent retains the amount remaining less the cost of purchased transportation (the “retention contracts”). Gross profit margin on revenue hauled by railroads, air cargo carriers, ocean cargo carriers and Truck Brokerage Carriers, other than those under retention contracts, is variable in nature as the Company’s contracts with independent commission sales agents provide commissions to agents at a contractually agreed upon percentage of net revenue for these types of loads. Approximately 56% of the Company’s consolidated revenue in 2014 was generated under contracts that have a fixed gross profit margin while 44% was under contracts that have a variable gross profit margin.
Maintenance costs for Company-provided trailing equipment and BCO Independent Contractor recruiting costs are the largest components of other operating costs. Also included in other operating costs are the provision for uncollectible advances and other receivables due from BCO Independent Contractors and independent commission sales agents and gains/losses, if any, on sales of Company-owned trailing equipment.
With respect to insurance and claims cost, potential liability associated with accidents in the trucking industry is severe and occurrences are unpredictable. For commercial trucking claims, Landstar retains liability up to $5,000,000 per occurrence. The Company also retains liability of up to $1,000,000 for each general liability claim, $250,000 for each workers’ compensation claim and up to $250,000 for each cargo claim. The Company’s exposure to liability associated with accidents incurred by Truck Brokerage Carriers, railroads and air and ocean cargo carriers who transport freight on behalf of the Company is reduced by various factors including the extent to which such carriers maintain their own insurance coverage. A material increase in the frequency or severity of accidents, cargo claims or workers’ compensation claims or the material unfavorable development of existing claims could have a material adverse effect on Landstar’s cost of insurance and claims and its results of operations.
24
Table of Contents
During the 2014 fiscal year, employee compensation and benefits accounted for over seventy percent of the Company’s selling, general and administrative costs.
Depreciation and amortization primarily relate to depreciation of trailing equipment and information technology hardware and software.
The following table sets forth the percentage relationship of purchased transportation and commissions to agents, both being direct costs, to revenue and indirect costs as a percentage of gross profit for the periods indicated:
| Fiscal Year | ||||||||||||
| 2014 | 2013 | 2012 | ||||||||||
| Revenue |
100.0 | % | 100.0 | % | 100.0 | % | ||||||
| Purchased transportation |
77.3 | 76.8 | 76.9 | |||||||||
| Commissions to agents |
7.9 | 7.9 | 7.9 | |||||||||
|
|
|
|
|
|
|
|||||||
| Gross profit margin |
14.8 | % | 15.3 | % | 15.2 | % | ||||||
|
|
|
|
|
|
|
|||||||
| Gross profit |
100.0 | % | 100.0 | % | 100.0 | % | ||||||
| Investment income |
0.3 | 0.4 | 0.4 | |||||||||
| Indirect costs and expenses: |
||||||||||||
| Other operating costs, net of gains on asset dispositions |
5.4 | 5.3 | 5.3 | |||||||||
| Insurance and claims |
9.8 | 12.4 | 8.8 | |||||||||
| Selling, general and administrative |
31.8 | 32.4 | 32.7 | |||||||||
| Depreciation and amortization |
5.8 | 6.8 | 6.0 | |||||||||
|
|
|
|
|
|
|
|||||||
| Total costs and expenses |
52.8 | 56.9 | 52.8 | |||||||||
|
|
|
|
|
|
|
|||||||
| Operating margin |
47.4 | % | 43.4 | % | 47.5 | % | ||||||
|
|
|
|
|
|
|
|||||||
Management believes that a discussion of indirect costs as a percentage of gross profit is useful and meaningful to potential investors for the following principal reasons: (1) disclosure of these relative measures (i.e., each indirect operating cost line item as a percentage of gross profit) allows investors to better understand the underlying trends in Landstar’s results of operations; (2) due to the generally fixed nature of these indirect costs (other than insurance and claims costs), these relative measures are meaningful to investors’ evaluations of the Company’s management of its indirect costs attributable to operations; (3) management considers this financial information in its decision-making, such as budgeting for infrastructure, trailing equipment and selling, general and administrative costs; and (4) this information facilitates comparisons by investors of Landstar’s results to the results of other non-asset or asset-light companies in the transportation and logistics services industry who report “net revenue” in Management Discussion and Analysis, which represents revenue less the cost of purchased transportation. The difference between Landstar’s use of the term “gross profit” and the use of the term “net revenue” by other companies in the transportation and logistics services industry is due to the direct cost of commissions to agents under the Landstar business model, whereas other companies in this industry generally have no commissions to agents.
Also, as previously mentioned, the Company reports two operating segments: the transportation logistics segment and the insurance segment. External revenue at the insurance segment, representing reinsurance premiums, has historically been relatively consistent on a year-over-year basis at less than 2% of consolidated revenue and generally corresponds directly with the number of trucks provided by BCO Independent Contractors. The discussion of indirect cost line items in Management’s Discussion and Analysis of Financial Condition and Results of Operations considers the Company’s costs on a consolidated basis rather than on a segment basis. Management believes this presentation format is the most appropriate to assist users of the financial statements in understanding the Company’s business for the following reasons: (1) the insurance segment has no other operating costs; (2) discussion of insurance and claims at either segment without reference to the other may
25
Table of Contents
create confusion amongst investors and potential investors due to intercompany arrangements and specific deductible programs that affect comparability of financial results by segment between various fiscal periods but that have no effect on the Company from a consolidated reporting perspective; (3) selling, general and administrative costs of the insurance segment comprise less than 10% of consolidated selling, general and administrative costs and have historically been relatively consistent on a year-over-year basis; and (4) the insurance segment has no depreciation and amortization.
Fiscal Year Ended December 27, 2014 Compared to Fiscal Year Ended December 28, 2013
Revenue for fiscal year 2014 was $3,184,790,000, an increase of $520,010,000, or 20%, compared to fiscal year 2013. Transportation revenue increased $517,188,000, or 20%. The increase in transportation revenue was primarily attributable to approximately an 8% increase in the number of loads hauled and increased revenue per load of approximately 10%. Reinsurance premiums from third party insurance companies that provide insurance programs to BCO Independent Contractors where all or a portion of the risk of loss is ultimately borne by Signature, were $39,377,000 and $36,555,000 for fiscal years 2014 and 2013, respectively. The increase in revenue from reinsurance premiums was primarily attributable to the net increase in the number of BCO Independent Contractors in 2014.
Truck transportation revenue hauled by BCO Independent Contractors and Truck Brokerage Carriers (together, the “third party truck capacity providers”) for fiscal year 2014, was $2,988,578,000, or 94% of total revenue, an increase of $520,075,000, or 21%, compared to fiscal year 2013. The number of loads hauled by third party truck capacity providers in fiscal year 2014 increased approximately 9% compared to fiscal year 2013, and revenue per load increased approximately 12% compared to fiscal year 2013. The increase in the number of loads hauled via third party truck capacity providers compared to fiscal year 2013 was due to a broad-based increase in underlying demand for truck transportation services and increased market share from new agents. The increase in revenue per load on loads hauled via truck was primarily attributable to increased demand and a tight truck capacity environment. The increase in the number of loads hauled by van equipment of 11% and the increase in the number of loads hauled by unsided/platform equipment of 6% compared to fiscal year 2013 were primarily due to a broad based increase in demand for transportation services in the domestic marketplace and increased market share from new agents. The increase in revenue per load for loads hauled by van equipment of 12% and the increase in revenue per load hauled by unsided/platform equipment of 11% compared to fiscal year 2013 was due to increased demand and tightened capacity. The decrease in the number of LTL loads of 5% compared to fiscal year 2013 was primarily due to the loss of one specific customer. The increase in LTL revenue per load of 18% compared to fiscal year 2013 was primarily due to the loss of one specific customer. Fuel surcharges on Truck Brokerage Carrier revenue identified separately in billings to customers and included as a component of Truck Brokerage Carrier revenue were $121,656,000 and $110,722,000 in fiscal years 2014 and 2013, respectively. Fuel surcharges billed to customers on revenue hauled by BCO Independent Contractors are excluded from revenue.
Transportation revenue hauled by rail intermodal, air cargo and ocean cargo carriers (collectively, the “multimode capacity providers”) for fiscal year 2014, was $156,172,000, or 5% of total revenue, a decrease of $3,329,000, or 2%, compared to fiscal year 2013. The number of loads hauled by multimode capacity providers in fiscal year 2014 increased approximately 4% compared to fiscal year 2013, while revenue per load on revenue hauled by multimode capacity providers decreased approximately 6% over the same period. The increase in loads hauled by multimode capacity providers was primarily due to increased rail intermodal loads. The decrease in revenue per load on revenue hauled by multimode capacity providers was primarily due to decreased project cargo loads hauled by ocean cargo carriers, which typically have a higher revenue per load amount compared to other types of multimode shipments. Also, revenue per load on revenue hauled by multimode capacity providers is influenced by many factors, including revenue mix among the various modes of transportation used, length of haul, complexity of freight, density of freight lanes, fuel costs and availability of capacity.
Purchased transportation was 77.3% and 76.8% of revenue in fiscal years 2014 and 2013, respectively. The increase in purchased transportation as a percentage of revenue was primarily attributable to an increased rate of
26
Table of Contents
purchased transportation paid to Truck Brokerage Carriers as the availability of truck capacity tightened in fiscal year 2014, and an increase in the percentage of revenue hauled by Truck Brokerage Carriers, which typically has a higher rate of purchased transportation than revenue hauled by BCO Independent Contractors. Commissions to agents were 7.9% of revenue in both fiscal years 2014 and 2013.
Investment income was $1,381,000 and $1,475,000 in fiscal years 2014 and 2013, respectively. The decrease in investment income was primarily due to lower average rates of return on investments held by the Company during fiscal year 2014.
Other operating costs increased $4,203,000 in fiscal year 2014 compared to fiscal year 2013 and represented 5.4% of gross profit in fiscal year 2014 compared to 5.3% in fiscal year 2013. The increase in other operating costs compared to the prior year was primarily due to increased trailing equipment costs, an increased provision for contractor bad debt and lower gains on sales of used trailing equipment. The increase in other operating costs as a percent of gross profit was caused by the increase in operating costs, partially offset by the effect of increased gross profit in fiscal year 2014.
Insurance and claims decreased $4,158,000 in fiscal year 2014 compared to fiscal year 2013 and represented 9.8% of gross profit in fiscal year 2014 compared to 12.4% of gross profit in fiscal year 2013. The decrease in insurance and claims compared to prior year was due to net unfavorable development of prior years’ claims estimates of $6,664,000 in fiscal year 2014 compared to $10,909,000 in fiscal year 2013. The decrease in insurance and claims as a percentage of gross profit was also due to the effect of increased gross profit in fiscal year 2014.
Selling, general and administrative costs increased $18,540,000 in fiscal year 2014 compared to fiscal year 2013 and represented 31.8% of gross profit in fiscal year 2014 compared to 32.4% of gross profit in fiscal year 2013. The increase in selling, general and administrative costs compared to prior year was due to a $17,793,000 provision for incentive compensation in fiscal year 2014 compared to a $6,145,000 provision in fiscal year 2013, increased stock-based compensation expense and an increased provision for customer bad debt in fiscal year 2014. The decrease in selling, general and administrative costs as a percentage of gross profit, however, was primarily due to the effect of increased gross profit in fiscal year 2014, which more than offset the effect of the increase in selling, general and administrative costs.
Depreciation and amortization decreased $92,000 in fiscal year 2014 compared to fiscal year 2013 and represented 5.8% of gross profit in fiscal year 2014 compared to 6.8% of gross profit in fiscal year 2013. The decrease in depreciation and amortization as a percentage of gross profit was primarily due to the effect of increased gross profit in fiscal year 2014.
Interest and debt expense in fiscal year 2014 was $34,000 lower than fiscal year 2013.
The provisions for income taxes for both fiscal years 2014 and 2013 were based on estimated effective income tax rates of approximately 38.2%, adjusted for discrete events, such as benefits resulting from disqualifying dispositions of the Company’s Common Stock by employees who obtained the stock through exercises of incentive stock options. The effective income tax rate on income from continuing operations for both fiscal years 2014 and 2013 was 37.2%, which was higher than the statutory federal income tax rate primarily as a result of state taxes, the meals and entertainment exclusion and non-deductible stock-based compensation, partially offset by recognition of benefits related to certain tax matters.
Net income was $138,809,000, or $3.09 per common share ($3.07 per diluted share), in fiscal year 2014. Income from continuing operations was $108,922,000, or $2.37 per common share ($2.36 per diluted share), in fiscal year 2013. Net income was $146,009,000, or $3.17 per common share ($3.16 per diluted share), in fiscal year 2013.
27
Table of Contents
Fiscal Year Ended December 28, 2013 Compared to Fiscal Year Ended December 29, 2012
Revenue for fiscal year 2013 was $2,664,780,000, a decrease of $106,019,000, or 4%, compared to fiscal year 2012. Transportation revenue decreased $106,713,000, or 4%. The decrease in transportation revenue was primarily attributable to a 2% decrease in each of the number of loads hauled and revenue per load. Reinsurance premiums from third party insurance companies that provide insurance programs to BCO Independent Contractors where all or a portion of the risk of loss is ultimately borne by Signature, were $36,555,000 and $35,861,000 for fiscal years 2013 and 2012, respectively.
Truck transportation revenue hauled by BCO Independent Contractors and Truck Brokerage Carriers for fiscal year 2013, was $2,468,503,000, or 93% of total revenue, a decrease of $114,419,000, or 4%, compared to fiscal year 2012. The number of loads hauled and revenue per load from loads hauled by third party truck capacity providers in fiscal year 2013 each decreased approximately 2% compared to fiscal year 2012. The decrease in the number of loads hauled by third party truck capacity providers compared to fiscal 2012 was primarily due to general softness in demand for transportation services provided via unsided/platform equipment and, to a lesser extent, transportation services provided via van equipment. The decrease in revenue per load on revenue hauled by third party truck capacity providers was due to a decrease in the number of loads hauled on unsided/platform equipment, which typically has a higher revenue per load, and a decrease in revenue per load on loads hauled on unsided/platform equipment. Fuel surcharges on Truck Brokerage Carrier revenue identified separately in billings to customers and included as a component of Truck Brokerage Carrier revenue were $110,722,000 and $114,426,000 in fiscal years 2013 and 2012, respectively. Fuel surcharges billed to customers on revenue hauled by BCO Independent Contractors are excluded from revenue.
Transportation revenue hauled by rail intermodal, air cargo and ocean cargo carriers for fiscal year 2013, was $159,501,000, or 6% of total revenue, an increase of $7,671,000, or 5%, compared to fiscal year 2012. The number of loads hauled by multimode capacity providers in fiscal year 2013 increased approximately 2% compared to fiscal year 2012, and revenue per load on revenue hauled by multimode capacity providers increased approximately 3% over the same period. Revenue per load on revenue hauled by multimode capacity providers is influenced by many factors, including revenue mix among the various modes of transportation used, length of haul, complexity of freight, density of freight lanes, fuel costs and availability of capacity.
Purchased transportation was 76.8% and 76.9% of revenue in fiscal years 2013 and 2012, respectively. The decrease in purchased transportation as a percentage of revenue was primarily attributable to an increase in the percentage of revenue contributed by the insurance segment, which has no transportation costs. Commissions to agents were 7.9% of revenue in both fiscal years 2013 and 2012.
Investment income was $1,475,000 and $1,563,000 in fiscal years 2013 and 2012, respectively. The decrease in investment income was primarily due to lower average rates of return on investments held by the Company during fiscal year 2013.
Other operating costs decreased $1,014,000 in fiscal year 2013 compared to fiscal year 2012 and represented 5.3% of gross profit in both fiscal years 2013 and 2012. The decrease in other operating costs compared to prior year was primarily due to decreased trailing equipment maintenance costs, partially offset by an increased provision for contractor bad debt.
Insurance and claims costs increased $13,149,000 in fiscal year 2013 compared to fiscal year 2012 and represented 12.4% of gross profit in fiscal year 2013 compared to 8.8% of gross profit in fiscal year 2012. The increase in insurance and claims costs compared to prior year was due to net unfavorable development of prior years’ claims estimates of $10,909,000, which primarily related to three claims, in fiscal year 2013 compared to $11,000 of net unfavorable development of prior years’ claims in fiscal year 2012. The increase in insurance and claims as a percentage of gross profit compared to prior year was due to increased net unfavorable development of prior years’ claims estimates in fiscal year 2013 compared to fiscal year 2012.
28
Table of Contents
Selling, general and administrative costs decreased $6,384,000 in fiscal year 2013 compared to fiscal year 2012 and represented 32.4% of gross profit in fiscal year 2013 and 32.7% of gross profit in fiscal year 2012. The decrease in selling, general and administrative costs was primarily attributable to a decreased provision for bonuses under the Company’s incentive compensation plan, a decrease in the provision for customer bad debt, and decreased stock-based compensation expense. The decrease in selling, general and administrative costs as a percentage of gross profit was caused by the decrease in selling, general and administrative costs, partially offset by the effect of decreased gross profit in fiscal year 2013.
Depreciation and amortization increased $2,454,000 in fiscal year 2013 compared to fiscal year 2012 and represented 6.8% of gross profit in fiscal year 2013 and 6.0% of gross profit in fiscal year 2012. The increase in depreciation and amortization was primarily due to depreciation on new trailing equipment that replaced older, fully depreciated trailing equipment in fiscal year 2013. The increase in depreciation and amortization as a percentage of gross profit was also due to the effect of decreased gross profit in fiscal year 2013.
Interest and debt expense in fiscal year 2013 was $101,000 higher than fiscal year 2012. The increase in interest and debt expense was primarily attributable to higher average capital lease obligations related to financing the purchase of trailing equipment during 2013, partially offset by decreased average borrowings on the Company’s revolving credit facility.
The provisions for income taxes for both fiscal years 2013 and 2012 were based on estimated combined effective income tax rates of 38.2%, adjusted for discrete events, such as benefits resulting from disqualifying dispositions of the Company’s Common Stock by employees who obtained the stock through exercises of incentive stock options and benefits relating to uncertain tax positions for which the applicable statute of limitations expired. The effective income tax rates on income from continuing operations for fiscal years 2013 and 2012 were 37.2% and 36.0%, respectively, which were higher than the statutory federal income tax rate primarily as a result of state taxes, the meals and entertainment exclusion and non-deductible stock-based compensation, partially offset by recognition of benefits related to certain tax matters. The increase in the effective income tax rate in fiscal year 2013 compared to fiscal year 2012 was primarily due to decreased benefits relating to uncertain tax positions recognized in fiscal year 2013 compared to fiscal year 2012.
Income from continuing operations was $108,922,000, or $2.37 per common share ($2.36 per diluted share), in fiscal year 2013. Income from continuing operations was $126,566,000, or $2.71 per common share ($2.70 per diluted share), in fiscal year 2012.
Income from discontinued operations of $37,087,000, or $0.81 per common share ($0.80 per diluted share) in fiscal year 2013 included a gain on sale of $33,029,000, or $0.72 per common share ($0.71 per diluted share), net of income taxes of $19,145,000, and income from operations of $4,058,000, or $0.09 per common share ($0.09 per diluted share), net of income taxes of $2,615,000. Income from discontinued operations was $3,215,000, or $0.07 per common share ($0.07 per diluted share), net of income taxes of $1,905,000, in fiscal year 2012.
Net income was $146,009,000, or $3.17 per common share ($3.16 per diluted share), in fiscal year 2013. Net income was $129,781,000, or $2.78 per common share ($2.77 per diluted share), in fiscal year 2012.
Capital Resources and Liquidity
Working capital and the ratio of current assets to current liabilities were $321,877,000 and 1.8 to 1, respectively, at December 27, 2014, compared with $306,808,000 and 1.8 to 1, respectively, at December 28, 2013, and $247,605,000 and 1.7 to 1, respectively, at December 29, 2012. Landstar has historically operated with current ratios within the range of 1.5 to 1 to 2.0 to 1. Cash provided by operating activities of continuing operations was $101,869,000, $152,645,000, and $120,331,000 in 2014, 2013 and 2012, respectively. The decrease in cash flow provided by operating activities of continuing operations for 2014 compared to 2013 was
29
Table of Contents
primarily attributable to the increase in trade receivables since the beginning of the fiscal year 2014 generally driven by the significant growth in revenue in 2014. The increase in cash flow provided by operating activities of continuing operations for 2013 compared to 2012 was primarily attributable to the timing of payments.
The Company declared and paid $0.26 per share, or $11,685,000 in the aggregate, in cash dividends during 2014 and, during such period, also paid $15,921,000 of dividends payable which were declared during fiscal year 2013 and included in current liabilities in the consolidated balance sheet at December 28, 2013. In addition, on December 4, 2014, the Company announced that its Board of Directors declared a special cash dividend of $1.00 per share, or $44,794,000 in the aggregate, payable on January 26, 2015, to stockholders of record as of January 12, 2015. Dividends payable of $44,794,000 related to this special dividend was included in current liabilities in the consolidated balance sheet at December 27, 2014. The Company did not pay any cash dividends during 2013. The Company paid $0.73 per share, or $33,981,000 in the aggregate, in cash dividends during 2012. During 2014, the Company purchased 939,872 shares of its Common Stock at a total cost of $56,393,000. During 2013 and 2012, the Company purchased 1,116,673 and 524,674 shares of its Common Stock at a total cost of $59,496,000 and $25,826,000, respectively. The Company has used cash provided by operating activities and borrowings on the Company’s revolving credit facilities to fund the purchases. Since January 1997, the Company has purchased approximately $1,167,000,000 of its Common Stock under programs authorized by the Board of Directors of the Company in open market and private block transactions. As of December 27, 2014, the Company may purchase up to an additional 1,827,782 shares of its Common Stock under its authorized stock purchase program. Long-term debt, including current maturities, was $111,321,000 at December 27, 2014, compared to $101,505,000 at December 28, 2013 and $114,141,000 at December 29, 2012.
Shareholders’ equity was $488,261,000, or 81% of total capitalization (defined as long-term debt including current maturities plus equity), at December 27, 2014, compared to $454,481,000, or 82% of total capitalization, at December 28, 2013 and $379,454,000, or 77% of total capitalization, at December 29, 2012. The increase in equity in 2014 over 2013 was primarily a result of net income, partially offset by purchases of shares of the Company’s Common Stock and dividends declared by the Company. The increase in equity in 2013 over 2012 was primarily a result of net income, including the gain on the sale of discontinued operations, partially offset by purchases of shares of the Company’s Common Stock and dividends declared by the Company.
On June 29, 2012, Landstar entered into a credit agreement with a syndicate of banks and JPMorgan Chase Bank, N.A., as administrative agent (the “Credit Agreement”). The Credit Agreement, which matures on June 29, 2017, provides $225,000,000 of borrowing capacity in the form of a revolving credit facility, $75,000,000 of which may be utilized in the form of letter of credit guarantees.
The Credit Agreement contains a number of covenants that limit, among other things, the incurrence of additional indebtedness. The Company is required to, among other things, maintain a minimum Fixed Charge Coverage Ratio, as defined in the Credit Agreement, and maintain a Leverage Ratio, as defined in the Credit Agreement, below a specified maximum. The Credit Agreement provides for a restriction on cash dividends and other distributions to stockholders on the Company’s capital stock to the extent there is a default under the Credit Agreement. In addition, the Credit Agreement under certain circumstances limits the amount of such cash dividends and other distributions to stockholders to the extent that, after giving effect to any payment made to effect such cash dividend or other distribution, the Leverage Ratio would exceed 2.5 to 1 on a pro forma basis as of the end of the Company’s most recently completed fiscal quarter. The Credit Agreement provides for an event of default in the event that, among other things, a person or group acquires 25% or more of the outstanding capital stock of the Company or obtains power to elect a majority of the Company’s directors. None of these covenants are presently considered by management to be materially restrictive to the Company’s operations, capital resources or liquidity. The Company is currently in compliance with all of the debt covenants under the Credit Agreement.
At December 27, 2014, the Company had no borrowings outstanding and $33,042,000 of letters of credit outstanding under the Credit Agreement. At December 27, 2014, there was $191,958,000 available for future borrowings under the Credit Agreement. In addition, the Company has $63,761,000 in letters of credit
30
Table of Contents
outstanding as collateral for insurance claims that are secured by investments totaling $70,846,000 at December 27, 2014. Investments, all of which are carried at fair value, include primarily investment-grade bonds and U.S. Treasury obligations having maturities of up to five years. Fair value of investments is based primarily on quoted market prices. See Notes to Consolidated Financial Statements for further discussion on measurement of fair value of investments.
Historically, the Company has generated sufficient operating cash flow to meet its debt service requirements, fund continued growth, both internal and through acquisitions, complete or execute share purchases of its Common Stock under authorized share purchase programs, pay dividends and meet working capital needs. As an asset-light provider of integrated transportation management solutions, the Company’s annual capital requirements for operating property are generally for trailing equipment and information technology hardware and software. In addition, a significant portion of the trailing equipment used by the Company is provided by third party capacity providers, thereby reducing the Company’s capital requirements. During 2014, 2013 and 2012, the Company’s continuing operations purchased $10,539,000, $6,373,000 and $5,388,000, respectively, of operating property and acquired $47,232,000, $49,138,000 and $43,077,000, respectively, of trailing equipment by entering into capital leases. Landstar anticipates acquiring approximately $73,000,000 in operating property, primarily new trailing equipment to replace older trailing equipment and information technology equipment, during fiscal year 2015 either by purchase or lease financing. The Company does not currently anticipate any other significant capital requirements in 2015.
Management believes that cash flow from operations combined with the Company’s borrowing capacity under the Credit Agreement will be adequate to meet Landstar’s debt service requirements, fund continued growth, both internal and through acquisitions, pay dividends, complete the authorized share purchase program and meet working capital needs.
Contractual Obligations and Commitments
At December 27, 2014, the Company’s obligations and commitments to make future payments under contracts, such as debt and lease agreements, were as follows (in thousands):
| Payments Due By Period | ||||||||||||||||||||
| Contractual Obligation |
Total | Less Than 1 Year |
1-3 Years |
3-5 Years |
More Than 5 Years |
|||||||||||||||
| Capital lease obligations |
$ | 115,897 | $ | 37,234 | $ | 58,709 | $ | 19,954 | — | |||||||||||
| Operating lease obligations |
1,815 | 916 | 730 | 169 | — | |||||||||||||||
| Purchase obligations |
9,161 | 3,000 | 5,027 | 866 | 268 | |||||||||||||||
|
|
|
|
|
|
|
|
|
|
|
|||||||||||
| $ | 126,873 | $ | 41,150 | $ | 64,466 | $ | 20,989 | $ | 268 | |||||||||||
|
|
|
|
|
|
|
|
|
|
|
|||||||||||
Capital lease obligations above include $4,576,000 of imputed interest. At December 27, 2014, the Company has gross unrecognized tax benefits of $2,620,000. This amount is excluded from the table above as the Company cannot reasonably estimate the period of cash settlement with the respective taxing authorities. At December 27, 2014, the Company has insurance claims liabilities of $46,002,000. This amount is excluded from the table above as the Company cannot reasonably estimate the period of cash settlement on these liabilities. The short-term portion of the insurance claims liability is reported on the consolidated balance sheets primarily on an actuarially determined basis.
Off-Balance Sheet Arrangements
As of December 27, 2014, the Company had no off-balance sheet arrangements, other than operating leases as disclosed in the table of Contractual Obligations and Commitments above, that have or are reasonably likely to
31
Table of Contents
have a current or future material effect on the Company’s financial condition, changes in financial condition, revenue or expenses, results of operations, liquidity, capital expenditures or capital resources.
Legal Matters
The Company is involved in certain claims and pending litigation arising from the normal conduct of business. Many of these claims are covered in whole or in part by insurance. Based on knowledge of the facts and, in certain cases, opinions of outside counsel, management believes that adequate provisions have been made for probable losses with respect to the resolution of all such claims and pending litigation and that the ultimate outcome, after provisions therefor, will not have a material adverse effect on the financial condition of the Company, but could have a material effect on the results of operations in a given quarter or year.
Critical Accounting Policies and Estimates
The allowance for doubtful accounts for both trade and other receivables represents management’s estimate of the amount of outstanding receivables that will not be collected. Historically, management’s estimates for uncollectible receivables have been materially correct. Although management believes the amount of the allowance for both trade and other receivables at December 27, 2014 is appropriate, a prolonged period of low or no economic growth may adversely affect the collection of these receivables. In addition, liquidity concerns and/or unanticipated bankruptcy proceedings at any of the Company’s larger customers in which the Company is carrying a significant receivable could result in an increase in the provision for uncollectible receivables and have a significant impact on the Company’s results of operations in a given quarter or year. However, it is not expected that an uncollectible accounts receivable resulting from an individual customer would have a significant impact on the Company’s financial condition. Conversely, a more robust economic environment or the recovery of a previously provided for uncollectible receivable from an individual customer may result in the realization of some portion of the estimated uncollectible receivables.
Landstar provides for the estimated costs of self-insured claims primarily on an actuarial basis. The amount recorded for the estimated liability for claims incurred is based upon the facts and circumstances known on the applicable balance sheet date. The ultimate resolution of these claims may be for an amount greater or less than the amount estimated by management. The Company continually revises its existing claim estimates as new or revised information becomes available on the status of each claim. Historically, the Company has experienced both favorable and unfavorable development of prior years’ claims estimates. During fiscal year 2014, insurance and claims costs included $6,664,000 of net unfavorable adjustments to prior years’ claims estimates. During fiscal years 2013 and 2012, insurance and claims costs included $10,909,000 and $11,000 of net unfavorable adjustments to prior years’ claims estimates, respectively. The majority of the unfavorable development of prior years’ claims in the 2013 and 2014 fiscal years related to four claims. It is reasonably likely that the ultimate outcome of settling all outstanding claims will be more or less than the estimated claims reserve at December 27, 2014.
The Company utilizes certain income tax planning strategies to reduce its overall cost of income taxes. If the Company were to be subject to an audit, it is possible that certain strategies might be disallowed resulting in an increased liability for income taxes. Certain of these tax planning strategies result in a level of uncertainty as to whether the related tax positions taken by the Company would result in a recognizable benefit. The Company has provided for its estimated exposure attributable to such tax positions due to the corresponding level of uncertainty with respect to the amount of income tax benefit that may ultimately be realized. Management believes that the provision for liabilities resulting from the uncertainty in certain income tax positions is appropriate. To date, the Company has not experienced an examination by governmental revenue authorities that would lead management to believe that the Company’s past provisions for exposures related to the uncertainty of such income tax positions are not appropriate.
Significant variances from management’s estimates for the amount of uncollectible receivables, the ultimate resolution of self-insured claims and the provision for uncertainty in income tax positions could each be expected
32
Table of Contents
to positively or negatively affect Landstar’s earnings in a given quarter or year. However, management believes that the ultimate resolution of these items, given a range of reasonably likely outcomes, will not significantly affect the long-term financial condition of Landstar or its ability to fund its continuing operations.
Effects of Inflation
Management does not believe inflation has had a material impact on the results of operations or financial condition of Landstar in the past five years. However, inflation in excess of historical trends might have an adverse effect on the Company’s results of operations in the future.
Seasonality
Landstar’s operations are subject to seasonal trends common to the trucking industry. Results of operations for the quarter ending in March are typically lower than for the quarters ending June, September and December.
| Item 7a. | Quantitative and Qualitative Disclosures about Market Risk |
The Company is exposed to changes in interest rates as a result of its financing activities, primarily its borrowings on its revolving credit facility, and investing activities with respect to investments held by the insurance segment.
On June 29, 2012, Landstar entered into a credit agreement with a syndicate of banks and JPMorgan Chase Bank, N.A., as administrative agent (the “Credit Agreement”). The Credit Agreement, which matures on June 29, 2017, provides $225,000,000 of borrowing capacity in the form of a revolving credit facility, $75,000,000 of which may be utilized in the form of letter of credit guarantees.
Depending upon the specific type of borrowing, borrowings under the Credit Agreement bear interest based on either (a) the prime rate, (b) the federal funds effective rate, (c) the rate at the time offered to JPMorgan Chase Bank, N.A. in the Eurodollar market or (d) the London Interbank Offered Rate, plus a margin that is determined based on the level of the Company’s Leverage Ratio, as defined in the Credit Agreement. As of December 27, 2014 and during all of the fourth quarter of 2014, the Company had no borrowings outstanding under the Credit Agreement. As of December 28, 2013, the weighted average interest rate on borrowings outstanding was 1.42%. During the fourth quarter of 2013, the average outstanding balance under the Credit Agreement was approximately $10,824,000. The Credit Agreement maturity date is June 29, 2017.
Long-term investments, all of which are available-for-sale and are carried at fair value, include primarily investment-grade bonds and U.S. Treasury obligations having maturities of up to five years. Assuming that the long-term portion of investments remains at $66,462,000, the balance at December 27, 2014, a hypothetical increase or decrease in interest rates of 100 basis points would not have a material impact on future earnings on an annualized basis. Short-term investments consist of short-term investment-grade instruments and the current maturities of investment-grade corporate bonds and U.S. Treasury obligations. Accordingly, any future interest rate risk on these short-term investments would not be material to the Company’s operating results.
Assets and liabilities of the Company’s Canadian operation are translated from their functional currency to U.S. dollars using exchange rates in effect at the balance sheet date and revenue and expense accounts are translated at average monthly exchange rates during the period. Adjustments resulting from the translation process are included in accumulated other comprehensive income. Transactional gains and losses arising from receivable and payable balances, including intercompany balances, in the normal course of business that are denominated in a currency other than the functional currency of the operation are recorded in the statements of income when they occur. The assets held at the Company’s Canadian subsidiary at December 27, 2014 were, as translated to U.S. dollars, approximately 1.5% of total consolidated assets. Accordingly, any translation gain or loss related to the Canadian operation would not be material.
33
Table of Contents
| Item 8. | Financial Statements and Supplementary Data |
LANDSTAR SYSTEM, INC. AND SUBSIDIARY
(Dollars in thousands, except per share amounts)
| Dec. 27, 2014 |
Dec. 28, 2013 |
|||||||
| ASSETS | ||||||||
| Current Assets |
||||||||
| Cash and cash equivalents |
$ | 163,944 | $ | 180,302 | ||||
| Short-term investments |
37,007 | 34,939 | ||||||
| Trade accounts receivable, less allowance of $4,338 and $3,773 |
492,642 | 378,732 | ||||||
| Other receivables, including advances to independent contractors, less allowance of $4,189 and $4,253 |
15,132 | 73,903 | ||||||
| Deferred income taxes and other current assets |
23,603 | 14,592 | ||||||
|
|
|
|
|
|||||
| Total current assets |
732,328 | 682,468 | ||||||
|
|
|
|
|
|||||
| Operating property, less accumulated depreciation and amortization of $160,681 and $157,985 |
202,203 | 177,329 | ||||||
| Goodwill |
31,134 | 31,134 | ||||||
| Other assets |
78,547 | 79,765 | ||||||
|
|
|
|
|
|||||
| Total assets |
$ | 1,044,212 | $ | 970,696 | ||||
|
|
|
|
|
|||||
| LIABILITIES AND SHAREHOLDERS’ EQUITY | ||||||||
| Current Liabilities |
||||||||
| Cash overdraft |
$ | 34,629 | $ | 27,780 | ||||
| Accounts payable |
220,077 | 157,796 | ||||||
| Current maturities of long-term debt |
35,064 | 27,567 | ||||||
| Insurance claims |
24,233 | 92,280 | ||||||
| Dividends payable |
44,794 | 15,921 | ||||||
| Other current liabilities |
51,654 | 54,316 | ||||||
|
|
|
|
|
|||||
| Total current liabilities |
410,451 | 375,660 | ||||||
|
|
|
|
|
|||||
| Long-term debt, excluding current maturities |
76,257 | 73,938 | ||||||
| Insurance claims |
21,769 | 24,171 | ||||||
| Deferred income taxes and other noncurrent liabilities |
47,474 | 42,446 | ||||||
| Shareholders’ Equity |
||||||||
| Common stock, $0.01 par value, authorized 160,000,000 shares, issued 67,268,817 and 67,017,858 shares |
673 | 670 | ||||||
| Additional paid-in capital |
189,012 | 179,807 | ||||||
| Retained earnings |
1,255,374 | 1,173,044 | ||||||
| Cost of 22,474,331 and 21,528,693 shares of common stock in treasury |
(955,613 | ) | (899,028 | ) | ||||
| Accumulated other comprehensive loss |
(1,185 | ) | (12 | ) | ||||
|
|
|
|
|
|||||
| Total shareholders’ equity |
488,261 | 454,481 | ||||||
|
|
|
|
|
|||||
| Total liabilities and shareholders’ equity |
$ | 1,044,212 | $ | 970,696 | ||||
|
|
|
|
|
|||||
See accompanying notes to consolidated financial statements.
34
Table of Contents
LANDSTAR SYSTEM, INC. AND SUBSIDIARY
CONSOLIDATED STATEMENTS OF INCOME
(Dollars in thousands, except per share amounts)
| Fiscal Years Ended | ||||||||||||
| Dec. 27, 2014 |
Dec. 28, 2013 |
Dec. 29, 2012 |
||||||||||
| Revenue |
$ | 3,184,790 | $ | 2,664,780 | $ | 2,770,799 | ||||||
| Investment income |
1,381 | 1,475 | 1,563 | |||||||||
| Costs and expenses: |
||||||||||||
| Purchased transportation |
2,461,143 | 2,046,927 | 2,130,323 | |||||||||
| Commissions to agents |
250,780 | 211,355 | 218,122 | |||||||||
| Other operating costs, net of gains on asset dispositions |
25,771 | 21,568 | 22,582 | |||||||||
| Insurance and claims |
46,280 | 50,438 | 37,289 | |||||||||
| Selling, general and administrative |
150,250 | 131,710 | 138,094 | |||||||||
| Depreciation and amortization |
27,575 | 27,667 | 25,213 | |||||||||
|
|
|
|
|
|
|
|||||||
| Total costs and expenses |
2,961,799 | 2,489,665 | 2,571,623 | |||||||||
|
|
|
|
|
|
|
|||||||
| Operating income |
224,372 | 176,590 | 200,739 | |||||||||
| Interest and debt expense |
3,177 | 3,211 | 3,110 | |||||||||
|
|
|
|
|
|
|
|||||||
| Income from continuing operations before income taxes |
221,195 | 173,379 | 197,629 | |||||||||
| Income taxes |
82,386 | 64,457 | 71,063 | |||||||||
|
|
|
|
|
|
|
|||||||
| Income from continuing operations |
138,809 | 108,922 | 126,566 | |||||||||
| Discontinued operations: |
||||||||||||
| Income from discontinued operations, net of income taxes |
— | 4,058 | 3,215 | |||||||||
| Gain on sale of discontinued operations, net of income taxes |
— | 33,029 | — | |||||||||
|
|
|
|
|
|
|
|||||||
| Income from discontinued operations, net of income taxes |
— | 37,087 | 3,215 | |||||||||
|
|
|
|
|
|
|
|||||||
| Net income |
$ | 138,809 | $ | 146,009 | $ | 129,781 | ||||||
|
|
|
|
|
|
|
|||||||
| Earnings per common share: |
||||||||||||
| Income from continuing operations |
$ | 3.09 | $ | 2.37 | $ | 2.71 | ||||||
| Income from discontinued operations |
— | 0.81 | 0.07 | |||||||||
| Earnings per common share |
3.09 | 3.17 | 2.78 | |||||||||
| Diluted earnings per share: |
||||||||||||
| Income from continuing operations |
$ | 3.07 | $ | 2.36 | $ | 2.70 | ||||||
| Income from discontinued operations |
— | 0.80 | 0.07 | |||||||||
| Diluted earnings per share |
3.07 | 3.16 | 2.77 | |||||||||
| Average number of shares outstanding: |
||||||||||||
| Earnings per common share |
44,956,000 | 46,039,000 | 46,698,000 | |||||||||
|
|
|
|
|
|
|
|||||||
| Diluted earnings per share |
45,169,000 | 46,210,000 | 46,877,000 | |||||||||
|
|
|
|
|
|
|
|||||||
| Dividends per common share |
$ | 1.26 | $ | 0.35 | $ | 0.73 | ||||||
|
|
|
|
|
|
|
|||||||
See accompanying notes to consolidated financial statements.
35
Table of Contents
LANDSTAR SYSTEM, INC. AND SUBSIDIARY
CONSOLIDATED STATEMENTS OF COMPREHENSIVE INCOME
(Dollars in thousands)
| Fiscal Years Ended | ||||||||||||
| Dec. 27, 2014 |
Dec. 28, 2013 |
Dec. 29, 2012 |
||||||||||
| Net income |
$ | 138,809 | $ | 146,009 | $ | 129,781 | ||||||
| Other comprehensive (loss) income: |
||||||||||||
| Unrealized holding (losses) gains on available-for-sale investments, net of tax benefit (expense) of $76, $365 and ($221) |
(139 | ) | (664 | ) | 400 | |||||||
| Foreign currency translation (losses) gains |
(1,034 | ) | (718 | ) | 243 | |||||||
|
|
|
|
|
|
|
|||||||
| Other comprehensive (loss) income |
(1,173 | ) | (1,382 | ) | 643 | |||||||
|
|
|
|
|
|
|
|||||||
| Comprehensive income |
$ | 137,636 | $ | 144,627 | $ | 130,424 | ||||||
|
|
|
|
|
|
|
|||||||
See accompanying notes to consolidated financial statements.
36
Table of Contents
LANDSTAR SYSTEM, INC. AND SUBSIDIARY
CONSOLIDATED STATEMENTS OF CASH FLOWS
(Dollars in thousands)
| Fiscal Years Ended | ||||||||||||
| Dec. 27, 2014 |
Dec. 28, 2013 |
Dec. 29, 2012 |
||||||||||
| OPERATING ACTIVITIES OF CONTINUING OPERATIONS |
||||||||||||
| Net income |
$ | 138,809 | $ | 146,009 | $ | 129,781 | ||||||
| Adjustments to reconcile net income to net cash provided by operating activities of continuing operations: |
||||||||||||
| Discontinued operations |
— | (37,087 | ) | (3,215 | ) | |||||||
| Depreciation and amortization of operating property |
27,575 | 27,667 | 25,213 | |||||||||
| Non-cash interest charges |
218 | 219 | 218 | |||||||||
| Provisions for losses on trade and other accounts receivable |
5,315 | 3,755 | 4,886 | |||||||||
| Gains on sales/disposals of operating property |
(2,143 | ) | (3,352 | ) | (2,815 | ) | ||||||
| Deferred income taxes, net |
5,434 | 4,700 | 4,261 | |||||||||
| Stock-based compensation |
6,797 | 4,911 | 6,149 | |||||||||
| Changes in operating assets and liabilities, net of discontinued operations: |
||||||||||||
| Increase in trade and other accounts receivable |
(60,454 | ) | (28,584 | ) | (35,140 | ) | ||||||
| (Increase) decrease in other assets |
(9,046 | ) | (1,214 | ) | 2,547 | |||||||
| Increase in accounts payable |
62,281 | 8,881 | 13,018 | |||||||||
| Decrease in other liabilities |
(2,468 | ) | (3,308 | ) | (6,857 | ) | ||||||
| (Decrease) increase in insurance claims |
(70,449 | ) | 30,048 | (17,715 | ) | |||||||
|
|
|
|
|
|
|
|||||||
| NET CASH PROVIDED BY OPERATING ACTIVITIES OF CONTINUING OPERATIONS |
101,869 | 152,645 | 120,331 | |||||||||
|
|
|
|
|
|
|
|||||||
| INVESTING ACTIVITIES OF CONTINUING OPERATIONS |
||||||||||||
| Sales and maturities of investments |
34,701 | 38,777 | 33,028 | |||||||||
| Purchases of investments |
(36,473 | ) | (50,613 | ) | (56,897 | ) | ||||||
| Purchases of operating property |
(10,539 | ) | (6,373 | ) | (5,388 | ) | ||||||
| Proceeds from sales of operating property |
7,465 | 9,711 | 9,730 | |||||||||
| Proceeds from sale of discontinued operations |
— | 74,505 | — | |||||||||
|
|
|
|
|
|
|
|||||||
| NET CASH (USED) PROVIDED BY INVESTING ACTIVITIES OF CONTINUING OPERATIONS |
(4,846 | ) | 66,007 | (19,527 | ) | |||||||
|
|
|
|
|
|
|
|||||||
| FINANCING ACTIVITIES OF CONTINUING OPERATIONS |
||||||||||||
| Increase (decrease) in cash overdraft |
6,849 | 2,617 | (339 | ) | ||||||||
| Dividends paid |
(27,606 | ) | — | (33,981 | ) | |||||||
| Proceeds from exercises of stock options |
3,760 | 2,323 | 4,383 | |||||||||
| Taxes paid in lieu of shares issued related to stock-based compensation plans |
(4,041 | ) | (1,766 | ) | (3,023 | ) | ||||||
| Excess tax effect on stock option exercises |
2,500 | 349 | 751 | |||||||||
| Borrowings on revolving credit facility |
— | — | 60,000 | |||||||||
| Purchases of common stock |
(56,393 | ) | (59,496 | ) | (25,826 | ) | ||||||
| Principal payments on long-term debt and capital lease obligations |
(37,416 | ) | (61,774 | ) | (121,278 | ) | ||||||
|
|
|
|
|
|
|
|||||||
| NET CASH USED BY FINANCING ACTIVITIES OF CONTINUING OPERATIONS |
(112,347 | ) | (117,747 | ) | (119,313 | ) | ||||||
|
|
|
|
|
|
|
|||||||
| Cash flows from discontinued operations: |
||||||||||||
| Operating activities of discontinued operations |
— | 9,368 | 5,253 | |||||||||
| Investing activities of discontinued operations |
— | (168 | ) | (1,684 | ) | |||||||
| Financing activities of discontinued operations |
— | (3,369 | ) | 8,081 | ||||||||
|
|
|
|
|
|
|
|||||||
| Net cash provided by discontinued operations |
— | 5,831 | 11,650 | |||||||||
|
|
|
|
|
|
|
|||||||
| Effect of exchange rate changes on cash and cash equivalents |
(1,034 | ) | (718 | ) | 243 | |||||||
|
|
|
|
|
|
|
|||||||
| (Decrease) increase in cash and cash equivalents |
(16,358 | ) | 106,018 | (6,616 | ) | |||||||
| Cash and cash equivalents at beginning of period |
180,302 | 74,284 | 80,900 | |||||||||
|
|
|
|
|
|
|
|||||||
| Cash and cash equivalents at end of period |
$ | 163,944 | $ | 180,302 | $ | 74,284 | ||||||
|
|
|
|
|
|
|
|||||||
See accompanying notes to consolidated financial statements.
37
Table of Contents
LANDSTAR SYSTEM, INC. AND SUBSIDIARY
CONSOLIDATED STATEMENTS OF CHANGES IN SHAREHOLDERS’ EQUITY
For the Fiscal Years Ended December 27, 2014,
December 28, 2013 and December 29, 2012
(Dollars in thousands)
| Common Stock | Additional Paid-In Capital |
Retained Earnings |
Treasury Stock at Cost |
Accumulated Other Comprehensive Income (Loss) |
Total | |||||||||||||||||||||||||||
| Shares | Amount | Shares | Amount | |||||||||||||||||||||||||||||
| Balance December 31, 2011 |
66,602,486 | $ | 666 | $ | 165,712 | $ | 947,156 | 19,882,289 | $ | (813,684 | ) | $ | 727 | $ | 300,577 | |||||||||||||||||
| Net income |
129,781 | 129,781 | ||||||||||||||||||||||||||||||
| Dividends paid ($0.73 per share) |
(33,981 | ) | (33,981 | ) | ||||||||||||||||||||||||||||
| Purchases of common stock |
524,674 | (25,826 | ) | (25,826 | ) | |||||||||||||||||||||||||||
| Issuance of stock related to stock-based compensation plans, including excess tax effect |
257,378 | 3 | 2,115 | 4,773 | (7 | ) | 2,111 | |||||||||||||||||||||||||
| Stock-based compensation |
6,149 | 6,149 | ||||||||||||||||||||||||||||||
| Other comprehensive income |
643 | 643 | ||||||||||||||||||||||||||||||
|
|
|
|
|
|
|
|
|
|
|
|
|
|
|
|
|
|||||||||||||||||
| Balance December 29, 2012 |
66,859,864 | $ | 669 | $ | 173,976 | $ | 1,042,956 | 20,411,736 | $ | (839,517 | ) | $ | 1,370 | $ | 379,454 | |||||||||||||||||
| Net income |
146,009 | 146,009 | ||||||||||||||||||||||||||||||
| Dividends ($0.35 per share) |
(15,921 | ) | (15,921 | ) | ||||||||||||||||||||||||||||
| Purchases of common stock |
1,116,673 | (59,496 | ) | (59,496 | ) | |||||||||||||||||||||||||||
| Issuance of stock related to stock-based compensation plans, including excess tax effect |
157,994 | 1 | 920 | 284 | (15 | ) | 906 | |||||||||||||||||||||||||
| Stock-based compensation |
4,911 | 4,911 | ||||||||||||||||||||||||||||||
| Other comprehensive loss |
(1,382 | ) | (1,382 | ) | ||||||||||||||||||||||||||||
|
|
|
|
|
|
|
|
|
|
|
|
|
|
|
|
|
|||||||||||||||||
| Balance December 28, 2013 |
67,017,858 | $ | 670 | $ | 179,807 | $ | 1,173,044 | 21,528,693 | $ | (899,028 | ) | $ | (12 | ) | $ | 454,481 | ||||||||||||||||
| Net income |
138,809 | 138,809 | ||||||||||||||||||||||||||||||
| Dividends ($1.26 per share) |
(56,479 | ) | (56,479 | ) | ||||||||||||||||||||||||||||
| Purchases of common stock |
939,872 | (56,393 | ) | (56,393 | ) | |||||||||||||||||||||||||||
| Issuance of stock related to stock-based compensation plans, including excess tax effect |
250,959 | 3 | 2,408 | 5,766 | (192 | ) | 2,219 | |||||||||||||||||||||||||
| Stock-based compensation |
6,797 | 6,797 | ||||||||||||||||||||||||||||||
| Other comprehensive loss |
(1,173 | ) | (1,173 | ) | ||||||||||||||||||||||||||||
|
|
|
|
|
|
|
|
|
|
|
|
|
|
|
|
|
|||||||||||||||||
| Balance December 27, 2014 |
67,268,817 | $ | 673 | $ | 189,012 | $ | 1,255,374 | 22,474,331 | $ | (955,613 | ) | $ | (1,185 | ) | $ | 488,261 | ||||||||||||||||
|
|
|
|
|
|
|
|
|
|
|
|
|
|
|
|
|
|||||||||||||||||
See accompanying notes to consolidated financial statements.
38
Table of Contents
LANDSTAR SYSTEM, INC. AND SUBSIDIARY
NOTES TO CONSOLIDATED FINANCIAL STATEMENTS
(1) Significant Accounting Policies
Consolidation
The consolidated financial statements include the accounts of Landstar System, Inc. and its subsidiary, Landstar System Holdings, Inc. (“LSHI”). Landstar System, Inc. and its subsidiary are herein referred to as “Landstar” or the “Company.” Significant inter-company accounts have been eliminated in consolidation.
On December 28, 2013, the Company completed the sale of Landstar Supply Chain Solutions, Inc., a Delaware corporation, including its wholly owned subsidiary, Landstar Supply Chain Solutions LLC (collectively, “LSCS”), which was part of the Company’s transportation logistics segment, to XPO Logistics, Inc. (“XPO”). The gain on the sale of LSCS and the operating results of LSCS for fiscal year 2013 and prior periods have been reclassified in the consolidated financial statements to discontinued operations.
Estimates
The preparation of the consolidated financial statements requires the use of management’s estimates. Actual results could differ from those estimates.
Fiscal Year
Landstar’s fiscal year is the 52 or 53 week period ending the last Saturday in December.
Revenue Recognition
When providing the physical transportation of freight, the Company is the primary obligor with respect to freight delivery and assumes the related credit risk. Accordingly, transportation revenue billed to customers for the physical transportation of freight and the related direct freight expenses are recognized on a gross basis upon completion of freight delivery. Reinsurance premiums of the insurance segment are recognized over the period earned, which is usually on a monthly basis. Fuel surcharges billed to customers for freight hauled by independent contractors who provide truck capacity to the Company under exclusive lease arrangements (the “BCO Independent Contractors”) are excluded from revenue and paid in entirety to the BCO Independent Contractors.
Insurance Claim Costs
Landstar provides, primarily on an actuarially determined basis, for the estimated costs of cargo, property, casualty, general liability and workers’ compensation claims both reported and for claims incurred but not reported. Landstar retains liability for individual commercial trucking claims up to $5,000,000 per occurrence. The Company also retains liability of up to $1,000,000 for each general liability claim, $250,000 for each workers’ compensation claim and up to $250,000 for each cargo claim.
Tires
Tires purchased as part of trailing equipment are capitalized as part of the cost of the equipment. Replacement tires are charged to expense when placed in service.
Cash and Cash Equivalents
Included in cash and cash equivalents are all investments, except those provided for collateral, with an original maturity of 3 months or less.
39
Table of Contents
LANDSTAR SYSTEM, INC. AND SUBSIDIARY
NOTES TO CONSOLIDATED FINANCIAL STATEMENTS — (Continued)
Financial Instruments
The Company’s financial instruments include cash equivalents, short and long-term investments, trade and other accounts receivable, accounts payable, other accrued liabilities, current and non-current insurance claims and long-term debt plus current maturities (“Debt”). The carrying value of cash equivalents, trade and other accounts receivable, accounts payable, current insurance claims and other accrued liabilities approximate fair value as the assets and liabilities are short term in nature. Short and long-term investments are carried at fair value as further described in the “Investments” footnote below. The carrying value of non-current insurance claims approximate fair value as the Company generally has the ability to, but is not required to, settle claims in a short term. The Company’s Debt includes borrowings under the Company’s revolving credit facility, to the extent there are any, plus borrowings relating to capital lease obligations used to finance trailing equipment. The interest rates on borrowings under the revolving credit facility are typically tied to short-term LIBOR rates that adjust monthly and, as such, carrying value approximates fair value. Interest rates on borrowings under capital leases approximate the interest rates that would currently be available to the Company under similar terms and, as such, carrying value approximates fair value.
Trade and Other Receivables
The allowance for doubtful accounts for both trade and other receivables represents management’s estimate of the amount of outstanding receivables that will not be collected. Estimates are used to determine the allowance for doubtful accounts for both trade and other receivables and are generally based on specific identification, historical collection results, current economic trends and changes in payment trends. Following is a summary of the activity in the allowance for doubtful accounts for fiscal years ending December 27, 2014, December 28, 2013 and December 29, 2012 (in thousands):
| Balance at Beginning of Period |
Charged to Costs and Expenses |
Write-offs, Net of Recoveries |
Balance at End of Period |
|||||||||||||
| For the Fiscal Year Ended December 27, 2014 |
||||||||||||||||
| Trade receivables |
$ | 3,773 | $ | 2,893 | $ | (2,328 | ) | $ | 4,338 | |||||||
| Other receivables |
4,994 | 2,414 | (2,305 | ) | 5,103 | |||||||||||
| Other non-current receivables |
222 | 8 | — | 230 | ||||||||||||
|
|
|
|
|
|
|
|
|
|||||||||
| $ | 8,989 | $ | 5,315 | $ | (4,633 | ) | $ | 9,671 | ||||||||
|
|
|
|
|
|
|
|
|
|||||||||
| For the Fiscal Year Ended December 28, 2013 |
||||||||||||||||
| Trade receivables |
$ | 8,650 | $ | 1,801 | $ | (6,678 | ) | $ | 3,773 | |||||||
| Other receivables |
5,612 | 1,929 | (2,547 | ) | 4,994 | |||||||||||
| Other non-current receivables |
239 | 6 | (23 | ) | 222 | |||||||||||
|
|
|
|
|
|
|
|
|
|||||||||
| $ | 14,501 | $ | 3,736 | $ | (9,248 | ) | $ | 8,989 | ||||||||
|
|
|
|
|
|
|
|
|
|||||||||
| For the Fiscal Year Ended December 29, 2012 |
||||||||||||||||
| Trade receivables |
$ | 6,591 | $ | 4,368 | $ | (2,309 | ) | $ | 8,650 | |||||||
| Other receivables |
7,768 | 610 | (2,766 | ) | 5,612 | |||||||||||
| Other non-current receivables |
274 | 6 | (41 | ) | 239 | |||||||||||
|
|
|
|
|
|
|
|
|
|||||||||
| $ | 14,633 | $ | 4,984 | $ | (5,116 | ) | $ | 14,501 | ||||||||
|
|
|
|
|
|
|
|
|
|||||||||
40
Table of Contents
LANDSTAR SYSTEM, INC. AND SUBSIDIARY
NOTES TO CONSOLIDATED FINANCIAL STATEMENTS — (Continued)
Operating Property
Operating property is recorded at cost. Depreciation is provided on a straight-line basis over the estimated useful lives of the related assets. Buildings and improvements are being depreciated over 30 years. Trailing equipment is being depreciated over 7 to 10 years. Information technology hardware and software included in other equipment is generally being depreciated over 3 to 7 years.
Goodwill
Goodwill represents the excess of the purchase price paid over the fair value of the net assets of acquired businesses. The Company has one reporting unit within the transportation logistics segment that reports goodwill. The Company reviews its goodwill balance annually for impairment as a single reporting unit, unless circumstances dictate more frequent assessments, and in accordance with Accounting Standards Update (“ASU”) 2011-08, Testing Goodwill for Impairment. ASU 2011-08 permits an initial assessment, commonly referred to as “step zero”, of qualitative factors to determine whether it is more likely than not that the fair value of a reporting unit is less than its carrying amount and also provides a basis for determining whether it is necessary to perform the two-step goodwill impairment test required by ASC Topic 350. In the fourth quarter of 2014, the Company performed the qualitative assessment of goodwill and determined it was more likely than not that the fair value of its reporting unit would be greater than its carrying amount. Therefore, the Company determined it was not necessary to perform the two-step goodwill impairment test. Furthermore, there has been no historical impairment of the Company’s goodwill.
Income Taxes
Income tax expense is equal to the current year’s liability for income taxes and a provision for deferred income taxes. Deferred tax assets and liabilities are recorded for the future tax effects attributable to temporary differences between the financial statement carrying amounts of existing assets and liabilities and their respective tax bases. Deferred tax assets and liabilities are measured using the enacted tax rates expected to be applied to taxable income in the years in which those temporary differences are expected to be recovered or settled.
Share-Based Payments
The Company’s share-based payment arrangements include restricted stock units (“RSU”), non-vested restricted stock and stock options. The Company estimates the fair value of stock option awards on the date of grant using the Black-Scholes pricing model and recognizes compensation cost for stock option awards expected to vest on a straight-line basis over the requisite service period for the entire award. Forfeitures are estimated at grant date based on historical experience and anticipated employee turnover. The fair value of each share of non-vested restricted stock is based on the fair value of such share on the date of grant and compensation costs for non-vested restricted stock are recognized on a straight-line basis over the requisite service period for the award. The fair value of each RSU is based on the market value of the Company’s Common Stock on the date of grant, discounted for lack of marketability for a minimum post-vesting holding requirement. The compensation costs for RSUs are recognized over the life of the award based on an estimated number of shares that will vest over the life of the award, multiplied by the fair value of an RSU.
Earnings Per Share
Earnings per common share are based on the weighted average number of shares outstanding, including outstanding non-vested restricted stock. Diluted earnings per share are based on the weighted average number of common shares outstanding plus the incremental shares that would have been outstanding upon the assumed exercise of all dilutive stock options.
41
Table of Contents
LANDSTAR SYSTEM, INC. AND SUBSIDIARY
NOTES TO CONSOLIDATED FINANCIAL STATEMENTS — (Continued)
The following table provides a reconciliation of the average number of common shares outstanding used to calculate earnings per common share to the average number of common shares and common share equivalents outstanding used to calculate diluted earnings per share (in thousands):
| Fiscal Year | ||||||||||||
| 2014 | 2013 | 2012 | ||||||||||
| Average number of common shares outstanding |
44,956 | 46,039 | 46,698 | |||||||||
| Incremental shares from assumed exercises of stock options |
213 | 171 | 179 | |||||||||
|
|
|
|
|
|
|
|||||||
| Average number of common shares and common share equivalents outstanding |
45,169 | 46,210 | 46,877 | |||||||||
|
|
|
|
|
|
|
|||||||
For the fiscal year ended December 27, 2014, no options outstanding to purchase shares of common stock were antidilutive. For the fiscal years ended December 28, 2013 and December 29, 2012, there were 143,000 and 321,000 options outstanding, respectively, to purchase shares of Common Stock excluded from the calculation of diluted earnings per share because they were antidilutive. Outstanding RSUs were excluded from the calculation of diluted earnings per share for all periods because the performance metric requirements for vesting had not been satisfied.
Dividends Payable
On December 4, 2014, the Company announced that its Board of Directors declared a special cash dividend of $1.00 per share payable on January 26, 2015, to stockholders of record of its Common Stock as of January 12, 2015. Dividends payable of $44,794,000 related to this special dividend are included in current liabilities in the consolidated balance sheet at December 27, 2014. On December 11, 2013, in connection with the sale of LSCS, the Company announced that its Board of Directors declared a special cash dividend of $0.35 per share payable on January 16, 2014, to stockholders of record of its Common Stock as of December 27, 2013. Dividends payable of $15,921,000 related to this special dividend were included in current liabilities in the consolidated balance sheet at December 28, 2013.
Foreign Currency Translation
Assets and liabilities of the Company’s Canadian operation are translated from their functional currency to U.S. dollars using exchange rates in effect at the balance sheet date and revenue and expense accounts are translated at average monthly exchange rates during the period. Adjustments resulting from the translation process are included in accumulated other comprehensive income. Transactional gains and losses arising from receivable and payable balances, including intercompany balances, in the normal course of business that are denominated in a currency other than the functional currency of the operation are recorded in the statements of income when they occur.
(2) Discontinued Operations
On December 28, 2013, the Company completed the sale of Landstar Supply Chain Solutions, Inc., a Delaware corporation, including its wholly owned subsidiary, Landstar Supply Chain Solutions LLC (collectively, “LSCS”), which was part of the Company’s transportation logistics segment, to XPO Logistics, Inc. (“XPO”). XPO paid a purchase price of $87.0 million in cash as consideration for LSCS. The net assets of LSCS acquired by XPO were $32.5 million. Direct transaction costs related to the transaction, primarily legal and other professional fees and payments made to certain executives of LSCS in connection with the transaction, were approximately $2.4 million. Net of income taxes of $19.1 million, the sale resulted in a gain on the sale of
42
Table of Contents
LANDSTAR SYSTEM, INC. AND SUBSIDIARY
NOTES TO CONSOLIDATED FINANCIAL STATEMENTS — (Continued)
discontinued operations of $33.0 million, or $0.71 per diluted share in fiscal year 2013. There were no interest costs or corporate overhead expenses allocated in the gain calculation. The gain on the sale of LSCS and the operating results of LSCS for fiscal year 2013 and prior periods have been reclassified in the consolidated financial statements to discontinued operations.
The following table summarizes specific financial components of discontinued operations presented in the consolidated statements of income for the fiscal years ended December 28, 2013 and December 29, 2012 (in thousands):
| Fiscal Year | ||||||||
| 2013 | 2012 | |||||||
| Revenue |
$ | 21,173 | $ | 22,621 | ||||
| Income from discontinued operations before income taxes |
$ | 6,673 | $ | 5,120 | ||||
| Gain on sale of discontinued operations before income taxes |
52,174 | — | ||||||
|
|
|
|
|
|||||
| Income from discontinued operations before income taxes |
58,847 | 5,120 | ||||||
| Income taxes on income from discontinued operations |
(2,615 | ) | (1,905 | ) | ||||
| Income taxes on gain on sale of discontinued operations |
(19,145 | ) | — | |||||
|
|
|
|
|
|||||
| Income from discontinued operations, net of income taxes |
$ | 37,087 | $ | 3,215 | ||||
|
|
|
|
|
|||||
(3) Other Comprehensive Income
The following table presents the components of and changes in accumulated other comprehensive income, net of related income taxes, as of and for the fiscal years ended December 27, 2014, December 28, 2013 and December 29, 2012 (in thousands):
| Unrealized Gains (Losses) on Available-for-Sale Securities |
Foreign Currency Translation |
Total | ||||||||||
| Balance as of December 31, 2011 |
$ | 508 | $ | 219 | $ | 727 | ||||||
| Other comprehensive income |
400 | 243 | 643 | |||||||||
|
|
|
|
|
|
|
|||||||
| Balance as of December 29, 2012 |
908 | 462 | 1,370 | |||||||||
| Other comprehensive loss |
(664 | ) | (718 | ) | (1,382 | ) | ||||||
|
|
|
|
|
|
|
|||||||
| Balance as of December 28, 2013 |
244 | (256 | ) | (12 | ) | |||||||
| Other comprehensive loss |
(139 | ) | (1,034 | ) | (1,173 | ) | ||||||
|
|
|
|
|
|
|
|||||||
| Balance as of December 27, 2014 |
$ | 105 | $ | (1,290 | ) | $ | (1,185 | ) | ||||
|
|
|
|
|
|
|
|||||||
Amounts reclassified from accumulated other comprehensive income to investment income due to the realization of previously unrealized gains and losses in the accompanying consolidated statements of income were not significant for the fiscal years ended December 27, 2014, December 28, 2013 and December 29, 2012.
(4) Investments
Investments include primarily investment-grade corporate bonds and U.S. Treasury obligations having maturities of up to five years (the “bond portfolio”). Investments in the bond portfolio are reported as available-
43
Table of Contents
LANDSTAR SYSTEM, INC. AND SUBSIDIARY
NOTES TO CONSOLIDATED FINANCIAL STATEMENTS — (Continued)
for-sale and are carried at fair value. Investments maturing less than one year from the balance sheet date are included in short-term investments and investments maturing more than one year from the balance sheet date are included in other assets in the consolidated balance sheets. Management performs an analysis of the nature of the unrealized losses on available-for-sale investments to determine whether such losses are other-than-temporary. Unrealized losses, representing the excess of the purchase price of an investment over its fair value as of the end of a period, considered to be other-than-temporary, are to be included as a charge in the statement of income, while unrealized losses considered to be temporary are to be included as a component of shareholders’ equity. Investments whose values are based on quoted market prices in active markets are classified within Level 1. Investments that trade in markets that are not considered to be active, but are valued based on quoted market prices, are classified within Level 2. As Level 2 investments include positions that are not traded in active markets, valuations may be adjusted to reflect illiquidity and/or non-transferability, which are generally based on available market information. Any transfers between levels are recognized as of the beginning of any reporting period. Fair value of the bond portfolio was determined using Level 1 inputs related to U.S. Treasury obligations and money market investments and Level 2 inputs related to investment-grade corporate bonds, asset-backed securities and direct obligations of government agencies. Unrealized gains, net of unrealized losses, on the investments in the bond portfolio were $163,000 and $378,000 at December 27, 2014 and December 28, 2013, respectively.
The amortized cost and fair values of available-for-sale investments are as follows at December 27, 2014 and December 28, 2013 (in thousands):
| Amortized Cost |
Gross Unrealized Gains |
Gross Unrealized Losses |
Fair Value |
|||||||||||||
| December 27, 2014 |
||||||||||||||||
| Money market investments |
$ | 1,729 | $ | — | $ | — | $ | 1,729 | ||||||||
| Asset-backed securities |
5,106 | 1 | 50 | 5,057 | ||||||||||||
| Corporate bonds and direct obligations of government agencies |
76,964 | 491 | 284 | 77,171 | ||||||||||||
| U.S. Treasury obligations |
19,507 | 14 | 9 | 19,512 | ||||||||||||
|
|
|
|
|
|
|
|
|
|||||||||
| Total |
$ | 103,306 | $ | 506 | $ | 343 | $ | 103,469 | ||||||||
|
|
|
|
|
|
|
|
|
|||||||||
| December 28, 2013 |
||||||||||||||||
| Money market investments |
$ | 2,499 | $ | — | $ | — | $ | 2,499 | ||||||||
| Asset-backed securities |
4,350 | 19 | 72 | 4,297 | ||||||||||||
| Corporate bonds and direct obligations of government agencies |
76,786 | 783 | 370 | 77,199 | ||||||||||||
| U.S. Treasury obligations |
18,524 | 31 | 13 | 18,542 | ||||||||||||
|
|
|
|
|
|
|
|
|
|||||||||
| Total |
$ | 102,159 | $ | 833 | $ | 455 | $ | 102,537 | ||||||||
|
|
|
|
|
|
|
|
|
|||||||||
44
Table of Contents
LANDSTAR SYSTEM, INC. AND SUBSIDIARY
NOTES TO CONSOLIDATED FINANCIAL STATEMENTS — (Continued)
For those available-for-sale investments with unrealized losses at December 27, 2014 and December 28, 2013, the following table summarizes the duration of the unrealized loss (in thousands):
| Less than 12 months | 12 months or longer | Total | ||||||||||||||||||||||
| Fair Value |
Unrealized Loss |
Fair Value |
Unrealized Loss |
Fair Value |
Unrealized Loss |
|||||||||||||||||||
| December 27, 2014 |
||||||||||||||||||||||||
| Asset-backed securities |
$ | 2,006 | $ | 13 | $ | 2,447 | $ | 37 | $ | 4,453 | $ | 50 | ||||||||||||
| Corporate bonds and direct obligations of government agencies |
19,354 | 135 | 11,373 | 149 | 30,727 | 284 | ||||||||||||||||||
| U.S. Treasury obligations |
6,992 | 1 | 760 | 8 | 7,752 | 9 | ||||||||||||||||||
|
|
|
|
|
|
|
|
|
|
|
|
|
|||||||||||||
| Total |
$ | 28,352 | $ | 149 | $ | 14,580 | $ | 194 | $ | 42,932 | $ | 343 | ||||||||||||
|
|
|
|
|
|
|
|
|
|
|
|
|
|||||||||||||
| December 28, 2013 |
||||||||||||||||||||||||
| Asset-backed securities |
$ | 3,429 | $ | 72 | $ | — | $ | — | $ | 3,429 | $ | 72 | ||||||||||||
| Corporate bonds and direct obligations of government agencies |
22,169 | 370 | — | — | 22,169 | 370 | ||||||||||||||||||
| U.S. Treasury obligations |
757 | 13 | — | — | 757 | 13 | ||||||||||||||||||
|
|
|
|
|
|
|
|
|
|
|
|
|
|||||||||||||
| Total |
$ | 26,355 | $ | 455 | $ | — | $ | — | $ | 26,355 | $ | 455 | ||||||||||||
|
|
|
|
|
|
|
|
|
|
|
|
|
|||||||||||||
The Company believes that unrealized losses on investments were primarily caused by rising interest rates rather than changes in credit quality. The Company expects to recover the amortized cost basis of these securities as it does not intend to sell, and does not anticipate being required to sell, these securities before recovery of the cost basis. For these reasons, the Company does not consider the unrealized losses on these securities to be other-than-temporary at December 27, 2014.
Short-term investments include $37,007,000 in current maturities of investments held by the Company at December 27, 2014. The non-current portion of the bond portfolio of $66,462,000 is included in other assets. The short-term investments, together with $33,839,000 of non-current investments, provide collateral for the $63,761,000 of letters of credit issued to guarantee payment of insurance claims.
Investment income represents the earnings on the insurance segment’s assets. Investment income earned from the assets of the insurance segment are included as a component of operating income as the investment of these assets is critical to providing collateral, liquidity and earnings with respect to the operation of the Company’s insurance programs.
45
Table of Contents
LANDSTAR SYSTEM, INC. AND SUBSIDIARY
NOTES TO CONSOLIDATED FINANCIAL STATEMENTS — (Continued)
(5) Income Taxes
The provisions for income taxes consisted of the following (in thousands):
| Fiscal Year | ||||||||||||
| 2014 | 2013 | 2012 | ||||||||||
| Current: |
||||||||||||
| Federal |
$ | 68,722 | $ | 53,089 | $ | 64,148 | ||||||
| State |
7,031 | 4,643 | 2,305 | |||||||||
| Canadian |
1,199 | 683 | 1,013 | |||||||||
|
|
|
|
|
|
|
|||||||
| Total current |
$ | 76,952 | $ | 58,415 | $ | 67,466 | ||||||
|
|
|
|
|
|
|
|||||||
| Deferred: |
||||||||||||
| Federal |
$ | 5,234 | $ | 5,758 | $ | 3,462 | ||||||
| State |
200 | 284 | 135 | |||||||||
|
|
|
|
|
|
|
|||||||
| Total deferred |
$ | 5,434 | $ | 6,042 | $ | 3,597 | ||||||
|
|
|
|
|
|
|
|||||||
| Income taxes |
$ | 82,386 | $ | 64,457 | $ | 71,063 | ||||||
|
|
|
|
|
|
|
|||||||
Temporary differences and carryforwards which gave rise to deferred tax assets and liabilities consisted of the following (in thousands):
| Dec. 27, 2014 |
Dec. 28, 2013 |
|||||||
| Deferred tax assets: |
||||||||
| Receivable valuations |
$ | 3,623 | $ | 3,354 | ||||
| Share-based payments |
2,939 | 3,458 | ||||||
| Self-insured claims |
5,353 | 5,180 | ||||||
| Other |
3,616 | 3,863 | ||||||
|
|
|
|
|
|||||
| Total deferred tax assets |
$ | 15,531 | $ | 15,855 | ||||
|
|
|
|
|
|||||
| Deferred tax liabilities: |
||||||||
| Operating property |
$ | 46,745 | $ | 41,933 | ||||
| Goodwill |
5,619 | 5,553 | ||||||
| Other |
2,192 | 1,960 | ||||||
|
|
|
|
|
|||||
| Total deferred tax liabilities |
$ | 54,556 | $ | 49,446 | ||||
|
|
|
|
|
|||||
| Net deferred tax liability |
$ | 39,025 | $ | 33,591 | ||||
|
|
|
|
|
|||||
Income from discontinued operations included a deferred tax benefit of $1,342,000 in 2013 and a deferred tax expense of $664,000 in 2012.
46
Table of Contents
LANDSTAR SYSTEM, INC. AND SUBSIDIARY
NOTES TO CONSOLIDATED FINANCIAL STATEMENTS — (Continued)
The following table summarizes the differences between income taxes calculated at the federal income tax rate of 35% on income from continuing operations before income taxes and the provisions for income taxes (in thousands):
| Fiscal Year | ||||||||||||
| 2014 | 2013 | 2012 | ||||||||||
| Income taxes at federal income tax rate |
$ | 77,418 | $ | 60,683 | $ | 69,170 | ||||||
| State income taxes, net of federal income tax benefit |
4,532 | 3,260 | 1,486 | |||||||||
| Meals and entertainment exclusion |
777 | 919 | 919 | |||||||||
| Share-based payments |
(239 | ) | 184 | (122 | ) | |||||||
| Other, net |
(102 | ) | (589 | ) | (390 | ) | ||||||
|
|
|
|
|
|
|
|||||||
| Income taxes |
$ | 82,386 | $ | 64,457 | $ | 71,063 | ||||||
|
|
|
|
|
|
|
|||||||
The Company files a consolidated U.S. federal income tax return. The Company or its subsidiaries file state tax returns in the majority of the U.S. state tax jurisdictions. With few exceptions, the Company and its subsidiaries are no longer subject to U.S. federal or state income tax examinations by tax authorities for 2010 and prior years. The Company’s wholly owned Canadian subsidiary, Landstar Canada, Inc., is subject to Canadian income and other taxes.
As of December 27, 2014 and December 28, 2013, the Company had $1,836,000 and $1,583,000, respectively, of net unrecognized tax benefits representing the provision for the uncertainty of certain tax positions plus a component of interest and penalties. Estimated interest and penalties on the provision for the uncertainty of certain tax positions is included in income tax expense. At December 27, 2014 and December 28, 2013 there was $744,000 and $628,000, respectively, accrued for estimated interest and penalties related to the uncertainty of certain tax positions. The Company does not currently anticipate any significant increase or decrease to the unrecognized tax benefit during 2015.
The following table summarizes the rollforward of the total amounts of gross unrecognized tax benefits for fiscal years 2014 and 2013 (in thousands):
| Fiscal Year | ||||||||
| 2014 | 2013 | |||||||
| Gross unrecognized tax benefits — beginning of the year |
$ | 2,261 | $ | 2,329 | ||||
| Gross increases related to current year tax positions |
373 | 303 | ||||||
| Gross increases related to prior year tax positions |
310 | 111 | ||||||
| Gross decreases related to prior year tax positions |
(109 | ) | (104 | ) | ||||
| Settlements |
(34 | ) | (72 | ) | ||||
| Lapse of statute of limitations |
(181 | ) | (306 | ) | ||||
|
|
|
|
|
|||||
| Gross unrecognized tax benefits — end of the year |
$ | 2,620 | $ | 2,261 | ||||
|
|
|
|
|
|||||
Landstar paid income taxes of $98,506,000 in 2014, $64,255,000 in 2013 and $71,033,000 in 2012.
47
Table of Contents
LANDSTAR SYSTEM, INC. AND SUBSIDIARY
NOTES TO CONSOLIDATED FINANCIAL STATEMENTS — (Continued)
(6) Operating Property
Operating property is summarized as follows (in thousands):
| Dec. 27, 2014 |
Dec. 28, 2013 |
|||||||
| Land |
$ | 9,148 | $ | 9,148 | ||||
| Buildings and improvements |
38,790 | 33,160 | ||||||
| Trailing equipment |
267,685 | 245,430 | ||||||
| Other equipment |
47,261 | 47,576 | ||||||
|
|
|
|
|
|||||
| Total operating property, gross |
362,884 | 335,314 | ||||||
| Less accumulated depreciation and amortization |
160,681 | 157,985 | ||||||
|
|
|
|
|
|||||
| Total operating property, net |
$ | 202,203 | $ | 177,329 | ||||
|
|
|
|
|
|||||
Included above is $188,311,000 in 2014 and $144,503,000 in 2013 of operating property under capital leases, $143,311,000 and $116,379,000, respectively, net of accumulated amortization. Landstar acquired operating property by entering into capital leases in the amount of $47,232,000 in 2014, $49,138,000 in 2013 and $43,077,000 in 2012.
(7) Retirement Plan
Landstar sponsors an Internal Revenue Code section 401(k) defined contribution plan for the benefit of full-time employees who have completed one year of service. Eligible employees make voluntary contributions up to 75% of their base salary, subject to certain limitations. Landstar contributes an amount equal to 100% of the first 3% and 50% of the next 2% of such contributions, subject to certain limitations.
The expense from continuing operations for the Company-sponsored defined contribution plan included in selling, general and administrative expense was $1,718,000 in 2014, $1,693,000 in 2013 and $1,660,000 in 2012.
(8) Debt
Long-term debt is summarized as follows (in thousands):
| Dec. 27, 2014 |
Dec. 28, 2013 |
|||||||
| Capital leases |
$ | 111,321 | $ | 96,505 | ||||
| Revolving credit facility |
— | 5,000 | ||||||
|
|
|
|
|
|||||
| 111,321 | 101,505 | |||||||
| Less current maturities |
35,064 | 27,567 | ||||||
|
|
|
|
|
|||||
| Total long-term debt |
$ | 76,257 | $ | 73,938 | ||||
|
|
|
|
|
|||||
On June 29, 2012, Landstar entered into a credit agreement with a syndicate of banks and JPMorgan Chase Bank, N.A., as administrative agent (the “Credit Agreement”). The Credit Agreement, which matures on June 29, 2017, provides $225,000,000 of borrowing capacity in the form of a revolving credit facility, $75,000,000 of which may be utilized in the form of letter of credit guarantees. Borrowings under the Credit Agreement are unsecured, however, all but two of the Company’s subsidiaries guarantee the obligations under the Credit Agreement. Any future amounts that may become outstanding under the Credit Agreement are payable on June 29, 2017, the maturity date of the Credit Agreement.
48
Table of Contents
LANDSTAR SYSTEM, INC. AND SUBSIDIARY
NOTES TO CONSOLIDATED FINANCIAL STATEMENTS — (Continued)
Depending upon the specific type of borrowing, borrowings under the Credit Agreement bear interest based on either (a) the prime rate, (b) the federal funds effective rate, (c) the rate at the time offered to JPMorgan Chase Bank, N.A. in the Eurodollar market or (d) the London Interbank Offered Rate, plus a margin that is determined based on the level of the Company’s Leverage Ratio, as defined in the Credit Agreement. The unused portion of the revolving credit facility under the Credit Agreement carries a commitment fee determined based on the level of the Leverage Ratio. The commitment fee for the unused portion of the revolving credit facility under the Credit Agreement ranges from .15% to .35%, based on achieving certain levels of the Leverage Ratio. As of December 27, 2014, the Company had no borrowings outstanding under the Credit Agreement. As of December 28, 2013, the weighted average interest rate on borrowings outstanding was 1.42%.
The Credit Agreement contains a number of covenants that limit, among other things, the incurrence of additional indebtedness. The Company is required to, among other things, maintain a minimum Fixed Charge Coverage Ratio, as defined in the Credit Agreement, and maintain a Leverage Ratio, as defined in the Credit Agreement, below a specified maximum. The Credit Agreement provides for a restriction on cash dividends and other distributions to stockholders on the Company’s capital stock to the extent there is a default under the Credit Agreement. In addition, the Credit Agreement under certain circumstances limits the amount of such cash dividends and other distributions to stockholders to the extent that, after giving effect to any payment made to effect such cash dividend or other distribution, the Leverage Ratio would exceed 2.5 to 1 on a pro forma basis as of the end of the Company’s most recently completed fiscal quarter. The Credit Agreement provides for an event of default in the event that, among other things, a person or group acquires 25% or more of the outstanding capital stock of the Company or obtains power to elect a majority of the Company’s directors. None of these covenants are presently considered by management to be materially restrictive to the Company’s operations, capital resources or liquidity. The Company is currently in compliance with all of the debt covenants under the Credit Agreement.
The interest rates on borrowings under the revolving credit facility are typically tied to short-term LIBOR rates that adjust monthly and, as such, carrying value approximates fair value. Interest rates on borrowings under capital leases approximate the interest rates that would currently be available to the Company under similar terms and, as such, carrying value approximates fair value.
Landstar paid interest of $3,229,000 in 2014, $3,175,000 in 2013 and $3,156,000 in 2012.
(9) Leases
The future minimum lease payments under all noncancelable leases at December 27, 2014, principally for trailing equipment, are shown in the following table (in thousands):
| Capital Leases |
Operating Leases |
|||||||
| 2015 |
$ | 37,234 | $ | 916 | ||||
| 2016 |
34,453 | 532 | ||||||
| 2017 |
24,256 | 198 | ||||||
| 2018 |
14,111 | 115 | ||||||
| 2019 |
5,843 | 54 | ||||||
|
|
|
|
|
|||||
| 115,897 | $ | 1,815 | ||||||
|
|
|
|||||||
| Less amount representing interest (2.0% to 3.9%) |
4,576 | |||||||
|
|
|
|||||||
| Present value of minimum lease payments |
$ | 111,321 | ||||||
|
|
|
|||||||
49
Table of Contents
LANDSTAR SYSTEM, INC. AND SUBSIDIARY
NOTES TO CONSOLIDATED FINANCIAL STATEMENTS — (Continued)
Total rent expense/income from continuing operations, net of sublease income, was $587,000 income in 2014, $1,238,000 income in 2013 and $497,000 expense in 2012.
(10) Share-Based Payment Arrangements
As of December 27, 2014, the Company had two employee equity incentive plans, the 2002 employee stock option and stock incentive plan (the “ESOSIP”) and the 2011 equity incentive plan (the “2011 EIP”). No further grants can be made under the ESOSIP. The Company also has two stock compensation plans for members of its Board of Directors, the 2003 Directors Stock Compensation Plan (the “2003 DSCP”) and the 2013 Directors Stock Compensation Plan (the “2013 DSCP”). The provisions of the 2013 DSCP are substantially similar to the provisions of the 2003 DSCP. 115,000 shares of the Company’s Common Stock were authorized for issuance under the 2013 DSCP. No further grants can be made under the 2003 DSCP. The ESOSIP, 2011 EIP, 2003 DSCP and 2013 DSCP are each referred to herein as a “Plan,” and, collectively, as the “Plans.” Amounts recognized in the financial statements with respect to these Plans are as follows (in thousands):
| Fiscal Years | ||||||||||||
| 2014 | 2013 | 2012 | ||||||||||
| Total cost of the Plans during the period |
$ | 6,797 | $ | 4,911 | $ | 6,149 | ||||||
| Amount of related income tax benefit recognized during the period |
(3,171 | ) | (1,305 | ) | (2,398 | ) | ||||||
|
|
|
|
|
|
|
|||||||
| Net cost of the Plans during the period |
$ | 3,626 | $ | 3,606 | $ | 3,751 | ||||||
|
|
|
|
|
|
|
|||||||
Included in income tax benefits recognized in the fiscal years ended December 27, 2014 and December 28, 2013 were income tax benefits of $659,000 and $502,000, respectively, recognized on disqualifying dispositions of the Company’s Common Stock by employees who obtained shares of Common Stock through exercises of incentive stock options.
As of December 27, 2014, there were 95,531 shares of the Company’s Common Stock reserved for issuance under the 2013 DSCP and 5,925,501 shares of the Company’s Common Stock reserved for issuance in the aggregate under the ESOSIP and 2011 EIP.
Stock Options
Options granted under the Plans generally become exercisable in either five equal annual installments commencing on the first anniversary of the date of grant or 100% on the fifth anniversary from the date of grant, subject to acceleration in certain circumstances. All options granted under the Plans expire on the tenth anniversary of the date of grant. Under the Plans, the exercise price of each option equals the fair market value of the Company’s Common Stock on the date of grant.
The fair value of each option grant on its grant date was calculated using the Black-Scholes option pricing model with the following weighted average assumptions for grants made in 2014, 2013 and 2012:
| 2014 | 2013 | 2012 | ||||||||||
| Expected volatility |
26.0 | % | 32.0 | % | 34.0 | % | ||||||
| Expected dividend yield |
0.43 | % | 0.41 | % | 0.42 | % | ||||||
| Risk-free interest rate |
1.50 | % | 0.75 | % | 0.90 | % | ||||||
| Expected lives (in years) |
4.0 | 4.0 | 4.0 | |||||||||
50
Table of Contents
LANDSTAR SYSTEM, INC. AND SUBSIDIARY
NOTES TO CONSOLIDATED FINANCIAL STATEMENTS — (Continued)
The Company utilizes historical data, including exercise patterns and employee departure behavior, in estimating the term that options will be outstanding. Expected volatility was based on historical volatility and other factors, such as expected changes in volatility arising from planned changes to the Company’s business, if any. The risk-free interest rate was based on the yield of zero coupon U.S. Treasury bonds for terms that approximated the terms of the options granted. The weighted average grant date fair value of stock options granted during 2014, 2013 and 2012 was $12.70 per share, $14.21 per share and $13.99 per share, respectively.
The following table summarizes information regarding the Company’s outstanding stock options under the Plans:
| Options Outstanding | Options Exercisable | |||||||||||||||
| Number of Options |
Weighted Average Exercise Price per Share |
Number of Options |
Weighted Average Exercise Price per Share |
|||||||||||||
| Options at December 31, 2011 |
2,326,776 | $ | 40.11 | 1,110,743 | $ | 39.74 | ||||||||||
| Granted |
329,500 | $ | 52.03 | |||||||||||||
| Exercised |
(846,294 | ) | $ | 39.47 | ||||||||||||
| Forfeited |
(28,800 | ) | $ | 43.23 | ||||||||||||
|
|
|
|||||||||||||||
| Options at December 29, 2012 |
1,781,182 | $ | 42.56 | 661,865 | $ | 40.64 | ||||||||||
| Granted |
152,500 | $ | 56.40 | |||||||||||||
| Exercised |
(421,066 | ) | $ | 40.52 | ||||||||||||
| Forfeited |
(57,800 | ) | $ | 43.90 | ||||||||||||
|
|
|
|||||||||||||||
| Options at December 28, 2013 |
1,454,816 | $ | 44.55 | 693,516 | $ | 42.29 | ||||||||||
| Granted |
1,000 | $ | 58.06 | |||||||||||||
| Exercised |
(615,077 | ) | $ | 41.27 | ||||||||||||
| Forfeited |
(66,900 | ) | $ | 47.51 | ||||||||||||
|
|
|
|||||||||||||||
| Options at December 27, 2014 |
773,839 | $ | 46.92 | 379,389 | $ | 44.61 | ||||||||||
|
|
|
|||||||||||||||
The following tables summarize stock options outstanding and exercisable at December 27, 2014:
| Options Outstanding | ||||||||||||
| Range of Exercise Prices Per Share |
Number Outstanding |
Weighted Average Remaining Contractual Term (years) |
Weighted Average Exercise Price per Share |
|||||||||
| $35.64 - $ 40.00 |
110,312 | 4.7 | $ | 37.13 | ||||||||
| $40.01 - $ 45.00 |
275,921 | 4.4 | $ | 42.29 | ||||||||
| $45.01 - $ 58.06 |
387,606 | 7.1 | $ | 53.00 | ||||||||
|
|
|
|||||||||||
| 773,839 | 5.8 | $ | 46.92 | |||||||||
|
|
|
|||||||||||
| Options Exercisable | ||||||||||||
| Range of Exercise Prices Per Share |
Number Exercisable |
Weighted Average Remaining Contractual Term (years) |
Weighted Average Exercise Price per Share |
|||||||||
| $35.64 - $ 40.00 |
67,362 | 4.4 | $ | 36.85 | ||||||||
| $40.01 - $ 45.00 |
184,121 | 3.6 | $ | 42.56 | ||||||||
| $45.01 - $ 56.40 |
127,906 | 6.2 | $ | 51.64 | ||||||||
|
|
|
|||||||||||
| 379,389 | 4.6 | $ | 44.61 | |||||||||
|
|
|
|||||||||||
51
Table of Contents
LANDSTAR SYSTEM, INC. AND SUBSIDIARY
NOTES TO CONSOLIDATED FINANCIAL STATEMENTS — (Continued)
At December 27, 2014, the total intrinsic value of options outstanding was $21,264,000. At December 27, 2014, the total intrinsic value of options outstanding and exercisable was $11,303,000. The total intrinsic value of stock options exercised during 2014, 2013 and 2012 was $14,573,000, $6,095,000 and $12,476,000, respectively.
As of December 27, 2014, there was $2,916,000 of total unrecognized compensation cost related to non-vested stock options granted under the Plans. The unrecognized compensation cost related to these non-vested options is expected to be recognized over a weighted average period of 2.2 years.
Non-vested Restricted Stock
The 2011 EIP provides the Compensation Committee of the Board of Directors with the authority to issue shares of Common Stock of the Company, subject to certain vesting and other restrictions on transfer (“restricted stock”). Shares of restricted stock generally are granted under the 2011 EIP subject to vesting in three equal annual installments or 100% on the fifth anniversary of the date of grant and the shares of restricted stock remain subject to forfeiture unless the grantee remains continuously employed with the Company or a subsidiary thereof through the applicable vesting date. The fair value of each share of non-vested restricted stock issued under the Plans is based on the fair value of a share of the Company’s Common Stock on the date of grant.
The following table summarizes information regarding the Company’s outstanding non-vested restricted stock under the Plans:
| Number of Shares |
Weighted Average Grant Date Fair Value |
|||||||
| Outstanding at December 31, 2011 |
40,993 | $ | 42.03 | |||||
| Granted |
4,151 | $ | 54.20 | |||||
| Vested |
(8,732 | ) | $ | 44.35 | ||||
| Forfeited |
(1,693 | ) | $ | 45.21 | ||||
|
|
|
|||||||
| Outstanding at December 29, 2012 |
34,719 | $ | 42.75 | |||||
| Granted |
15,449 | $ | 54.85 | |||||
| Vested |
(11,975 | ) | $ | 45.61 | ||||
|
|
|
|||||||
| Outstanding at December 28, 2013 |
38,193 | $ | 46.75 | |||||
| Granted |
7,124 | $ | 63.17 | |||||
| Vested |
(19,196 | ) | $ | 41.85 | ||||
| Forfeited |
(2,768 | ) | $ | 54.20 | ||||
|
|
|
|||||||
| Outstanding at December 27, 2014 |
23,353 | $ | 54.90 | |||||
|
|
|
|||||||
As of December 27, 2014, there was $827,000 of total unrecognized compensation cost related to non-vested shares of restricted stock granted under the Plans. The unrecognized compensation cost related to these non-vested shares of restricted stock is expected to be recognized over a weighted average period of 1.9 years.
Restricted Stock Units
A restricted stock unit (“RSU”) award issued under the 2011 EIP represents a contractual right to receive one share of the Company’s Common Stock upon achievement of certain performance objectives. RSU awards have contractual lives of three or five years from the date of grant and requirements for continuous employment. The fair value of an RSU is determined based on the market value of the Company’s Common Stock on the date of grant, discounted for lack of marketability for a minimum post-vesting holding requirement. The discount rate due to lack of marketability used for RSU award grants for all periods was 7%. In addition, no dividends are paid on RSUs and RSUs have no voting rights.
52
Table of Contents
LANDSTAR SYSTEM, INC. AND SUBSIDIARY
NOTES TO CONSOLIDATED FINANCIAL STATEMENTS — (Continued)
The following table summarizes information regarding the Company’s outstanding RSU awards under the Plans:
| Number of Units |
Weighted Average Grant Date Fair Value |
|||||||
| Outstanding at December 31, 2011 |
— | $ | — | |||||
| Granted |
113,000 | $ | 44.78 | |||||
|
|
|
|||||||
| Outstanding at December 29, 2012 |
113,000 | $ | 44.78 | |||||
| Granted |
244,500 | $ | 51.19 | |||||
| Vested |
(21,901 | ) | $ | 44.78 | ||||
| Forfeited |
(27,592 | ) | $ | 47.45 | ||||
|
|
|
|||||||
| Outstanding at December 28, 2013 |
308,007 | $ | 49.63 | |||||
| Granted |
146,000 | $ | 53.11 | |||||
| Vested |
(24,641 | ) | $ | 51.47 | ||||
| Forfeited |
(3,736 | ) | $ | 49.53 | ||||
|
|
|
|||||||
| Outstanding at December 27, 2014 |
425,630 | $ | 50.72 | |||||
|
|
|
|||||||
RSU awards have contractual lives of three or five years from the date of grant. In general, for RSUs with five-year contractual lives, the number of RSUs that vest is determined annually, for each year in the five-year period from date of grant, by multiplying the number of RSUs granted by the sum of (a) the average of the percentage change (positive or negative) in operating income and diluted earnings per share in each of the five years as compared to operating income and diluted earnings per share reported in the base year (base year being the year immediately preceding the year in which the RSUs were granted), plus (b) 5%, rounded to the nearest whole number, less (c) the number of RSUs from that grant that have previously vested. For RSUs granted in 2014, the number of RSUs that vest will be determined annually, for each year in the five-year period from date of grant, by multiplying the number of RSUs granted by the sum of (a) the average of the percentage change (positive or negative) in operating income and diluted earnings per share in each of the five years as compared to the results from continuing operations in the 2013 fiscal year (that is the average of the change in operating income and diluted earnings per share for the year ended as compared to the 2013 fiscal year results from continuing operations, which reflects the treatment of Landstar Supply Chain Solutions, Inc. and its wholly owned subsidiary, Landstar Supply Chain Solutions LLC as a discontinued operation effective December 28, 2013) plus (b) 5%, rounded to the nearest whole number, less (c) the number of RSUs from that grant that have previously vested. On January 23, 2013, the Company granted 100,000 RSUs to the Company’s then Chairman and Chief Executive Officer. These 100,000 RSUs have three-year contractual lives with vesting dates of January 31 of 2014, 2015, and 2016, with the number of RSUs that vest on each vesting date determined by multiplying 100,000 by the sum of (1) the percentage increase in operating income in the most recently completed fiscal year as compared to the results from the immediately preceding fiscal year, plus (2) the percentage increase in diluted earnings per share in the most recently completed fiscal year as compared to the results from the preceding fiscal year. The Company reports compensation expense over the life of the award based on an estimated number of shares that will vest over the life of the award, multiplied by the fair value of an RSU. The Company recognized approximately $4,443,000, $1,276,000 and $964,000 of share-based compensation expense related to RSU awards in 2014, 2013 and 2012, respectively. As of December 27, 2014, there was a maximum of $17.1 million of total unrecognized compensation cost related to RSU awards granted under the Plans with an expected average remaining life of approximately 2.7 years. The amount of future compensation expense to be recognized will be determined based on future operating results.
53
Table of Contents
LANDSTAR SYSTEM, INC. AND SUBSIDIARY
NOTES TO CONSOLIDATED FINANCIAL STATEMENTS — (Continued)
Directors’ Stock Compensation Plan
Upon election or re-election to the Board of Directors for a three year term, outside members of the Board of Directors may receive a grant of such number of restricted shares of the Company’s Common Stock equal to the quotient of $225,000 divided by the fair market value of a share of Common Stock on the date immediately following the date of such Director’s re-election or election to the Board. In 2014, 2013 and 2012, 7,124, 13,449 and 4,151 restricted shares, respectively, were granted to outside Directors upon their re-election or election to the Board. Restricted shares generally vest in three equal annual installments on the first three annual anniversary dates of the date of grant. During 2014, 2013 and 2012, $331,000, $442,000 and $292,000, respectively, of compensation cost was recorded for the grant of these restricted shares.
(11) Equity
On December 11, 2013, Landstar System, Inc. announced that it had been authorized by its Board of Directors to increase the number of shares of the Company’s Common Stock that the Company is authorized to purchase from time to time in the open market and in privately negotiated transactions under a previously announced purchase program to 3,000,000 shares. As of December 27, 2014, the Company has authorization to purchase 1,827,782 shares of its Common Stock under this program. No specific expiration date has been assigned to the December 11, 2013 authorization. During 2014, Landstar purchased a total of 939,872 shares of its Common Stock at a total cost of $56,393,000 pursuant to its previously announced stock purchase program.
The Company has 2,000,000 shares of preferred stock authorized and unissued.
(12) Commitments and Contingencies
At December 27, 2014, in addition to the $63,761,000 letters of credit secured by investments, Landstar had $33,042,000 of letters of credit outstanding under the Credit Agreement.
The Company is involved in certain claims and pending litigation arising from the normal conduct of business. Many of these claims are covered in whole or in part by insurance. Based on knowledge of the facts and, in certain cases, opinions of outside counsel, management believes that adequate provisions have been made for probable losses with respect to the resolution of all such claims and pending litigation and that the ultimate outcome, after provisions therefor, will not have a material adverse effect on the financial condition of the Company, but could have a material effect on the results of operations in a given quarter or year.
(13) Segment Information
Landstar markets its integrated transportation management solutions primarily through independent commission sales agents and exclusively utilizes third party capacity providers to transport and store customers’ freight. Landstar’s independent commission sales agents enter into contractual arrangements with the Company and are responsible for locating freight, making that freight available to Landstar’s capacity providers and coordinating the transportation of the freight with customers and capacity providers. The Company’s third party capacity providers consist of independent contractors who provide truck capacity to the Company under exclusive lease arrangements (the “BCO Independent Contractors”), unrelated trucking companies who provide truck capacity to the Company under non-exclusive contractual arrangements (the “Truck Brokerage Carriers”), air cargo carriers, ocean cargo carriers and railroads. Through this network of agents and capacity providers linked together by Landstar’s information technology systems, Landstar operates an integrated transportation management solutions business primarily throughout North America with revenue of $3.2 billion during the most recently completed fiscal year. The Company reports the results of two operating segments: the transportation logistics segment and the insurance segment.
54
Table of Contents
LANDSTAR SYSTEM, INC. AND SUBSIDIARY
NOTES TO CONSOLIDATED FINANCIAL STATEMENTS — (Continued)
The transportation logistics segment provides a wide range of integrated transportation management solutions. Transportation services offered by the Company include truckload and less-than-truckload transportation, rail intermodal, air cargo, ocean cargo, expedited ground and air delivery of time-critical freight, heavy-haul/specialized, U.S.-Canada and U.S.-Mexico cross-border, project cargo and customs brokerage. Industries serviced by the transportation logistics segment include automotive products, building products, metals, chemicals, foodstuffs, heavy machinery, retail, electronics, ammunition and explosives and military equipment. In addition, the transportation logistics segment provides transportation services to other transportation companies, including logistics and less-than-truckload service providers. Each of the independent commission sales agents has the opportunity to market all of the services provided by the transportation logistics segment. Billings for freight transportation services are typically charged to customers on a per shipment basis for the physical transportation of freight.
The insurance segment is comprised of Signature Insurance Company (“Signature”), a wholly owned offshore insurance subsidiary, and Risk Management Claim Services, Inc. The insurance segment provides risk and claims management services to certain of Landstar’s operating subsidiaries. In addition, it reinsures certain risks of the Company’s BCO Independent Contractors and provides certain property and casualty insurance directly to certain of Landstar’s operating subsidiaries. Revenue at the insurance segment represents reinsurance premiums from third party insurance companies that provide insurance programs to BCO Independent Contractors where all or a portion of the risk is ultimately borne by Signature. Internal revenue for premiums billed by the insurance segment to the transportation logistics segment is calculated each fiscal period based primarily on an actuarial calculation of historical loss experience and is believed to approximate the cost that would have been incurred by the transportation logistics segment had similar insurance been obtained from an unrelated third party.
The accounting policies of the segments are the same as those described in the summary of significant accounting policies. The Company evaluates a segment’s performance based on operating income.
No single customer accounted for more than 10% of the Company’s consolidated revenue in 2014, 2013 or 2012. Substantially all of the Company’s revenue is generated in North America, primarily through customers located in the United States.
55
Table of Contents
LANDSTAR SYSTEM, INC. AND SUBSIDIARY
NOTES TO CONSOLIDATED FINANCIAL STATEMENTS — (Continued)
The following tables summarize information about the Company’s reportable business segments as of and for the fiscal years ending December 27, 2014, December 28, 2013 and December 29, 2012 (in thousands):
| Transportation Logistics |
Insurance | Total | ||||||||||
| 2014 |
||||||||||||
| External revenue |
$ | 3,145,413 | $ | 39,377 | $ | 3,184,790 | ||||||
| Internal revenue |
28,164 | 28,164 | ||||||||||
| Investment income |
1,381 | 1,381 | ||||||||||
| Interest and debt expense |
3,177 | 3,177 | ||||||||||
| Depreciation and amortization |
27,575 | 27,575 | ||||||||||
| Operating income |
193,914 | 30,458 | 224,372 | |||||||||
| Expenditures on long-lived assets |
10,539 | 10,539 | ||||||||||
| Goodwill |
31,134 | 31,134 | ||||||||||
| Capital lease additions |
47,232 | 47,232 | ||||||||||
| Total assets |
917,789 | 126,423 | 1,044,212 | |||||||||
| 2013 |
||||||||||||
| External revenue from continuing operations |
$ | 2,628,225 | $ | 36,555 | $ | 2,664,780 | ||||||
| Internal revenue |
28,811 | 28,811 | ||||||||||
| Investment income |
1,475 | 1,475 | ||||||||||
| Interest and debt expense from continuing operations |
3,211 | 3,211 | ||||||||||
| Depreciation and amortization from continuing operations |
27,667 | 27,667 | ||||||||||
| Operating income from continuing operations |
151,188 | 25,402 | 176,590 | |||||||||
| Expenditures on long-lived assets from continuing operations |
6,373 | 6,373 | ||||||||||
| Goodwill |
31,134 | 31,134 | ||||||||||
| Capital lease additions |
49,138 | 49,138 | ||||||||||
| Total assets |
754,904 | 215,792 | 970,696 | |||||||||
| 2012 |
||||||||||||
| External revenue from continuing operations |
$ | 2,734,938 | $ | 35,861 | $ | 2,770,799 | ||||||
| Internal revenue |
28,446 | 28,446 | ||||||||||
| Investment income |
1,563 | 1,563 | ||||||||||
| Interest and debt expense from continuing operations |
3,110 | 3,110 | ||||||||||
| Depreciation and amortization from continuing operations |
25,213 | 25,213 | ||||||||||
| Operating income from continuing operations |
167,626 | 33,113 | 200,739 | |||||||||
| Expenditures on long-lived assets from continuing operations |
5,388 | 5,388 | ||||||||||
| Goodwill |
57,470 | 57,470 | ||||||||||
| Capital lease additions |
43,077 | 43,077 | ||||||||||
| Total assets |
708,233 | 171,188 | 879,421 | |||||||||
Included in total assets in the Transportation Logistics segment at December 29, 2012 are assets of $100,972,000, including goodwill of $26,336,000, from the LSCS discontinued operations.
56
Table of Contents
LANDSTAR SYSTEM, INC. AND SUBSIDIARY
NOTES TO CONSOLIDATED FINANCIAL STATEMENTS — (Continued)
(14) Change in Accounting Estimate for Self-Insured Claims
Landstar provides for the estimated costs of self-insured claims primarily on an actuarial basis. The amount recorded for the estimated liability for claims incurred is based upon the facts and circumstances known on the applicable balance sheet date. The ultimate resolution of these claims may be for an amount greater or less than the amount estimated by management. The Company continually revises its existing claim estimates as new or revised information becomes available on the status of each claim. Historically, the Company has experienced both favorable and unfavorable development of prior years’ claims estimates.
The following table summarizes the effect of the increase in the cost of insurance claims resulting from unfavorable development of prior year self-insured claims estimates on operating income, income from continuing operations and earnings per share from continuing operations amounts in the consolidated statements of income for the fiscal years ended December 27, 2014, December 28, 2013 and December 29, 2012 (in thousands, except per share amounts):
| Fiscal Years Ended | ||||||||||||
| December 27, 2014 |
December 28, 2013 |
December 29, 2012 |
||||||||||
| Operating income |
$ | 6,664 | $ | 10,909 | $ | 11 | ||||||
| Income from continuing operations |
4,118 | 6,742 | 7 | |||||||||
| Earnings per share from continuing operations |
$ | 0.09 | $ | 0.15 | $ | — | ||||||
| Diluted earnings per share from continuing operations |
$ | 0.09 | $ | 0.15 | $ | — | ||||||
(15) Recent Accounting Pronouncements
In May 2014, the Financial Accounting Standards Board issued Accounting Standards Update 2014-09—Revenue from Contracts with Customers (“ASU 2014-09”). ASU 2014-09 is a comprehensive revenue recognition model requiring a company to recognize revenue to depict the transfer of goods or services to a customer at an amount reflecting the consideration it expects to receive in exchange for those goods or services. In adopting ASU 2014-09, companies may use either a full retrospective or a modified retrospective approach. ASU 2014-09 is effective for the first interim period within annual reporting periods beginning after December 15, 2016, and early adoption is not permitted. ASU 2014-09 is not expected to have a material impact on the Company’s financial statements.
57
Table of Contents
REPORT OF INDEPENDENT REGISTERED PUBLIC ACCOUNTING FIRM
The Board of Directors and Shareholders
Landstar System, Inc.:
We have audited the accompanying consolidated balance sheets of Landstar System, Inc. and subsidiary (the Company) as of December 27, 2014 and December 28, 2013, and the related consolidated statements of income, comprehensive income, changes in shareholders’ equity and cash flows for each of the fiscal years ended December 27, 2014, December 28, 2013 and December 29, 2012. These consolidated financial statements are the responsibility of the Company’s management. Our responsibility is to express an opinion on these consolidated financial statements based on our audits.
We conducted our audits in accordance with the standards of the Public Company Accounting Oversight Board (United States). Those standards require that we plan and perform the audit to obtain reasonable assurance about whether the financial statements are free of material misstatement. An audit includes examining, on a test basis, evidence supporting the amounts and disclosures in the financial statements. An audit also includes assessing the accounting principles used and significant estimates made by management, as well as evaluating the overall financial statement presentation. We believe that our audits provide a reasonable basis for our opinion.
In our opinion, the consolidated financial statements referred to above present fairly, in all material respects, the financial position of Landstar System, Inc. and subsidiary as of December 27, 2014 and December 28, 2013, and the results of their operations and their cash flows for each of the fiscal years ended December 27, 2014 and December 28, 2013 and December 29, 2012, in conformity with U.S. generally accepted accounting principles.
We also have audited, in accordance with the standards of the Public Company Accounting Oversight Board (United States), Landstar System, Inc.’s internal control over financial reporting as of December 27, 2014, based on criteria established in Internal Control-Integrated Framework (2013) issued by the Committee of Sponsoring Organizations of the Treadway Commission (COSO), and our report dated February 20, 2015, expressed an unqualified opinion on the effectiveness of the Company’s internal control over financial reporting.
| /S/ KPMG LLP |
February 20, 2015
Jacksonville, Florida
Certified Public Accountants
58
Table of Contents
LANDSTAR SYSTEM, INC. AND SUBSIDIARY
QUARTERLY FINANCIAL DATA
(Dollars in thousands, except per share amounts)
(Unaudited)
| Fourth Quarter 2014 |
Third Quarter 2014 |
Second Quarter 2014 |
First Quarter 2014 |
|||||||||||||
| Revenue |
$ | 862,830 | $ | 819,320 | $ | 814,443 | $ | 688,197 | ||||||||
|
|
|
|
|
|
|
|
|
|||||||||
| Operating income |
$ | 61,209 | $ | 59,577 | $ | 58,572 | $ | 45,014 | ||||||||
|
|
|
|
|
|
|
|
|
|||||||||
| Income before income taxes |
$ | 60,292 | $ | 58,803 | $ | 57,854 | $ | 44,246 | ||||||||
| Income taxes |
21,801 | 22,048 | 21,929 | 16,608 | ||||||||||||
|
|
|
|
|
|
|
|
|
|||||||||
| Net income |
$ | 38,491 | $ | 36,755 | $ | 35,925 | $ | 27,638 | ||||||||
|
|
|
|
|
|
|
|
|
|||||||||
| Earnings per common share(1) |
$ | 0.86 | $ | 0.82 | $ | 0.80 | $ | 0.61 | ||||||||
|
|
|
|
|
|
|
|
|
|||||||||
| Diluted earnings per share(1) |
$ | 0.86 | $ | 0.82 | $ | 0.80 | $ | 0.61 | ||||||||
|
|
|
|
|
|
|
|
|
|||||||||
| Dividends per common share |
$ | 1.07 | $ | 0.07 | $ | 0.06 | $ | 0.06 | ||||||||
|
|
|
|
|
|
|
|
|
|||||||||
| Fourth Quarter 2013 |
Third Quarter 2013 |
Second Quarter 2013 |
First Quarter 2013 |
|||||||||||||
| Revenue |
$ | 691,975 | $ | 675,535 | $ | 674,390 | $ | 622,880 | ||||||||
|
|
|
|
|
|
|
|
|
|||||||||
| Operating income |
$ | 39,741 | $ | 46,614 | $ | 48,427 | $ | 41,808 | ||||||||
|
|
|
|
|
|
|
|
|
|||||||||
| Income from continuing operations before income taxes |
$ | 38,897 | $ | 45,758 | $ | 47,656 | $ | 41,068 | ||||||||
| Income taxes |
13,721 | 17,255 | 18,164 | 15,317 | ||||||||||||
|
|
|
|
|
|
|
|
|
|||||||||
| Income from continuing operations |
25,176 | 28,503 | 29,492 | 25,751 | ||||||||||||
| Income from discontinued operations, net of income taxes |
34,381 | 743 | 934 | 1,029 | ||||||||||||
|
|
|
|
|
|
|
|
|
|||||||||
| Net income |
$ | 59,557 | $ | 29,246 | $ | 30,426 | $ | 26,780 | ||||||||
|
|
|
|
|
|
|
|
|
|||||||||
| Earnings per common share(1): |
||||||||||||||||
| Income from continuing operations |
$ | 0.55 | $ | 0.62 | $ | 0.64 | $ | 0.55 | ||||||||
| Income from discontinued operations |
0.75 | 0.02 | 0.02 | 0.02 | ||||||||||||
| Earnings per common share |
1.30 | 0.64 | 0.66 | 0.58 | ||||||||||||
| Diluted earnings per share(1): |
||||||||||||||||
| Income from continuing operations |
$ | 0.55 | $ | 0.62 | $ | 0.64 | 0.55 | |||||||||
| Income from discontinued operations |
0.75 | 0.02 | 0.02 | 0.02 | ||||||||||||
| Diluted earnings per share |
1.30 | 0.64 | 0.66 | 0.57 | ||||||||||||
| Dividends per common share |
$ | 0.35 | $ | — | $ | — | $ | — | ||||||||
| (1) | Due to the changes in the number of average common shares and common stock equivalents outstanding during the year, the sum of earnings per share amounts for each quarter do not necessarily sum in the aggregate to the earnings per share amounts for the full year. |
59
Table of Contents
| Item 9. | Changes in and Disagreements with Accountants on Accounting and Financial Disclosure |
None.
| Item 9A. | Controls and Procedures |
Disclosure Controls and Procedures
As of the end of the period covered by this Annual Report on Form 10-K, an evaluation was carried out, under the supervision and with the participation of the Company’s management, including the Chief Executive Officer (“CEO”) and Chief Financial Officer (“CFO”), of the effectiveness of the Company’s disclosure controls and procedures (as defined in Rule 13a-15(e) promulgated under the Securities Exchange Act of 1934, as amended). Based on that evaluation, the CEO and CFO concluded that the Company’s disclosure controls and procedures were effective as of December 27, 2014 to provide reasonable assurance that information required to be disclosed by the Company in reports that it filed or submitted under the Securities Exchange Act of 1934, as amended, is recorded, processed, summarized and reported within the time periods specified in Securities and Exchange Commission rules and forms.
In designing and evaluating disclosure controls and procedures, Company management recognizes that any disclosure controls and procedures, no matter how well designed and operated, can provide only reasonable assurance of achieving the desired control objectives, and management necessarily was required to apply its judgment in evaluating the cost-benefit relationship of possible controls and procedures. Because of the inherent limitation in any control system, no evaluation or implementation of a control system can provide complete assurance that all control issues and all possible instances of fraud have been or will be detected.
Internal Control Over Financial Reporting
(a) Management’s Report on Internal Control over Financial Reporting
Management of Landstar System, Inc. (the “Company”) is responsible for establishing and maintaining effective internal control over financial reporting, as such term is defined in Rules 13a-15(f) and 15d-15(f) under the Securities Exchange Act, as amended.
Internal control over financial reporting is a process designed to provide reasonable assurance regarding the reliability of financial reporting and the preparation of financial statements for external purposes in accordance with generally accepted accounting principles. The Company’s internal control over financial reporting includes those policies and procedures that (1) pertain to the maintenance of records that, in reasonable detail, accurately and fairly reflect the transactions and dispositions of the assets of the Company; (2) provide reasonable assurance that transactions are recorded as necessary to permit preparation of financial statements in accordance with generally accepted accounting principles, and that receipts and expenditures of the Company are being made only in accordance with authorizations of management and directors of the Company; and (3) provide reasonable assurance regarding prevention or timely detection of unauthorized acquisition, use, or disposition of the Company’s assets that could have a material effect on the Company’s financial statements.
Management, with the participation of the Company’s principal executive and principal financial officers, assessed the effectiveness of the Company’s internal control over financial reporting as of December 27, 2014. This assessment was performed using the criteria established under the Internal Control-Integrated Framework (2013) established by the Committee of Sponsoring Organizations of the Treadway Commission (COSO).
Internal control over financial reporting cannot provide absolute assurance of achieving financial reporting objectives because of its inherent limitations, including the possibility of human error or circumvention or overriding of internal control. Accordingly, even effective internal control over financial reporting can provide only reasonable assurance with respect to financial statement preparation and reporting and may not prevent or detect misstatements. Also, projections of any evaluation of effectiveness to future periods are subject to the risk that controls may become inadequate because of changes in conditions, or that the degree of compliance with the policies or procedures may deteriorate.
60
Table of Contents
Based on the assessment performed using the criteria established by COSO, management has concluded that the Company maintained effective internal control over financial reporting as of December 27, 2014.
KPMG LLP, the independent registered public accounting firm that audited the financial statements included in this Annual Report on Form 10-K for the fiscal year ended December 27, 2014, has issued an audit report on the effectiveness of the Company’s internal control over financial reporting. Such report appears immediately below.
(b) Attestation Report of the Registered Public Accounting Firm
61
Table of Contents
REPORT OF INDEPENDENT REGISTERED PUBLIC ACCOUNTING FIRM
The Board of Directors and Shareholders
Landstar System, Inc.:
We have audited Landstar System, Inc.’s internal control over financial reporting as of December 27, 2014, based on criteria established in Internal Control — Integrated Framework (2013) issued by the Committee of Sponsoring Organizations of the Treadway Commission (COSO). Landstar System, Inc.’s management is responsible for maintaining effective internal control over financial reporting and for its assessment of the effectiveness of internal control over financial reporting included in the accompanying Management’s Report on Internal Control over Financial Reporting. Our responsibility is to express an opinion on the Company’s internal control over financial reporting based on our audit.
We conducted our audit in accordance with the standards of the Public Company Accounting Oversight Board (United States). Those standards require that we plan and perform the audit to obtain reasonable assurance about whether effective internal control over financial reporting was maintained in all material respects. Our audit included obtaining an understanding of internal control over financial reporting, assessing the risk that a material weakness exists, and testing and evaluating the design and operating effectiveness of internal control based on the assessed risk. Our audit also included performing such other procedures as we considered necessary in the circumstances. We believe that our audit provides a reasonable basis for our opinion.
A company’s internal control over financial reporting is a process designed to provide reasonable assurance regarding the reliability of financial reporting and the preparation of financial statements for external purposes in accordance with generally accepted accounting principles. A company’s internal control over financial reporting includes those policies and procedures that (1) pertain to the maintenance of records that, in reasonable detail, accurately and fairly reflect the transactions and dispositions of the assets of the company; (2) provide reasonable assurance that transactions are recorded as necessary to permit preparation of financial statements in accordance with generally accepted accounting principles, and that receipts and expenditures of the company are being made only in accordance with authorizations of management and directors of the company; and (3) provide reasonable assurance regarding prevention or timely detection of unauthorized acquisition, use, or disposition of the company’s assets that could have a material effect on the financial statements.
Because of its inherent limitations, internal control over financial reporting may not prevent or detect misstatements. Also, projections of any evaluation of effectiveness to future periods are subject to the risk that controls may become inadequate because of changes in conditions, or that the degree of compliance with the policies or procedures may deteriorate.
In our opinion, Landstar System, Inc. maintained, in all material respects, effective internal control over financial reporting as of December 27, 2014, based on criteria established in Internal Control — Integrated Framework (2013) issued by COSO.
We also have audited, in accordance with the standards of the Public Company Accounting Oversight Board (United States), the consolidated balance sheets of Landstar System, Inc. and subsidiary as of December 27, 2014 and December 28, 2013, and the related consolidated statements of income, comprehensive income, changes in shareholders’ equity, and cash flows for each of the fiscal years ended December 27, 2014, December 28, 2013 and December 29, 2012, and our report dated February 20, 2015, expressed an unqualified opinion on those consolidated financial statements.
/S/ KPMG LLP
February 20, 2015
Jacksonville, Florida
Certified Public Accountants
62
Table of Contents
(c) Changes in Internal Control Over Financial Reporting
There were no significant changes in the Company’s internal control over financial reporting during the Company’s fourth fiscal quarter that have materially affected, or are reasonably likely to materially affect, the Company’s internal control over financial reporting.
| Item 9B. | Other Information |
None
63
Table of Contents
PART III
| Item 10. | Directors, Executive Officers and Corporate Governance |
The information required by this Item concerning the Directors (and nominees for Directors) and Executive Officers of the Company will be set forth under the captions “Election of Directors,” “Directors of the Company,” “Information Regarding Board of Directors and Committees,” and “Executive Officers of the Company” and “Section 16(a) Beneficial Ownership Reporting Compliance” in the Company’s definitive Proxy Statement for its annual meeting of stockholders to be filed with the Securities and Exchange Commission pursuant to Regulation 14A, and is incorporated herein by reference. The information required by this Item concerning the Company’s Audit Committee and the Audit Committee’s Financial Expert will be set forth under the caption “Information Regarding Board of Directors and Committees” and “Report of the Audit Committee” in the Company’s definitive Proxy Statement for its annual meeting of stockholders to be filed with the Securities and Exchange Commission pursuant to Regulation 14A, and is incorporated herein by reference.
The Company has adopted a Code of Ethics and Business Conduct that applies to each of its directors and employees, including its principal executive officer, principal financial officer, controller and all other employees performing similar functions. The Code of Ethics and Business Conduct is available on the Company’s website at www.landstar.com under “Investor Relations — Corporate Governance.” The Company intends to satisfy the disclosure requirement under Item 5.05 of Form 8-K regarding amendments to, or waivers from, a provision or provisions of the Code of Ethics and Business Conduct by posting such information on its website at the web address indicated above.
| Item 11. | Executive Compensation |
The information required by this Item will be set forth under the captions “Compensation of Directors,” “Compensation of Executive Officers,” “Compensation Discussion and Analysis,” “Summary Compensation Table,” “Grants of Plan-Based Awards,” “Option Exercises and Stock Vested,” “Outstanding Equity Awards at Fiscal Year End,” “Nonqualified Deferred Compensation,” “Report of the Compensation Committee on Executive Compensation” and “Key Executive Employment Protection Agreements” in the Company’s definitive Proxy Statement for its annual meeting of stockholders to be filed with the Securities and Exchange Commission pursuant to Regulation 14A, and is incorporated herein by reference.
| Item 12. | Security Ownership of Certain Beneficial Owners and Management and Related Stockholder Matters |
The information required by this Item pursuant to Item 201(d) of Regulation S-K is set forth under the caption “Market for Registrants Common Equity, Related Stockholder Matters and Issuer Purchases of Equity Securities” in Part II, Item 5 of this report, and is incorporated by reference herein.
The information required by this Item pursuant to Item 403 of Regulation S-K will be set forth under the caption “Security Ownership by Management and Others” in the Company’s definitive Proxy Statement for its annual meeting of stockholders to be filed with the Securities and Exchange Commission pursuant to Regulation 14A, and is incorporated herein by reference.
| Item 13. | Certain Relationships and Related Transactions, and Director Independence |
None, other than information required to be disclosed under this item in regard to Director Independence, which will be set forth under the caption “Independent Directors” in the Company’s definitive Proxy Statement for its annual meeting of stockholders to be filed with the Securities and Exchange Commission pursuant to Regulation 14A and incorporated herein by reference.
| Item 14. | Principal Accounting Fees and Services |
The information required by this item will be set forth under the caption “Report of the Audit Committee” and “Ratification of Appointment of Independent Registered Public Accounting Firm” in the Company’s definitive Proxy Statement for its annual meeting of stockholders to be filed with the Securities and Exchange Commission pursuant to Regulation 14A, and is incorporated herein by reference.
64
Table of Contents
PART IV
| Item 15. | Exhibits and Financial Statement Schedules |
(a)(1) Financial Statements and Supplementary Data
| Page | ||||
| 34 | ||||
| 35 | ||||
| 36 | ||||
| 37 | ||||
| 38 | ||||
| 39 | ||||
| 58 | ||||
(2) Financial Statement Schedules
Financial statement schedules have been omitted because the required information is included in the consolidated financial statements or the notes thereto, or is not applicable or required.
(3) Exhibits
| Exhibit |
Description | |
| (3) | Articles of Incorporation and By-Laws: | |
| 3.1 | Restated Certificate of Incorporation of the Company dated March 6, 2006, including Certificate of Designation of Junior Participating Preferred Stock dated February 10, 1993. (Incorporated by reference to Exhibit 3.1 to the Registrant’s Annual Report on Form 10-K for the fiscal year ended December 31, 2005 (Commission File No. 0-21238)) | |
| 3.2 | The Company’s Bylaws, as amended and restated on February 21, 2011. (Incorporated by reference to Exhibit 3.2 to the Registrant’s Annual Report on Form 10-K for fiscal year ended December 25, 2010 (Commission File No. 0-21238)) | |
| (4) | Instruments defining the rights of security holders, including indentures: | |
| 4.1 | Specimen of Common Stock Certificate. (Incorporated by reference to Exhibit 4.1 to the Registrant’s Registration Statement on Form S-1 (Registration No. 33-57174)) | |
| 4.2 | Amended and Restated Credit Agreement, dated as of June 29, 2012, among Landstar System Holding, Inc., the Company, the lenders named therein, and JPMorgan Chase Bank, N.A. as Administrative Agent (including exhibits and schedules thereto). (Incorporated by reference to Exhibit 99.1 to the Registrant’s Form 8-K filed on July 5, 2012 (Commission File No. 0-21238)) | |
| 4.3 | First Amendment to Amended and Restated Credit Agreement, dated as of November 1, 2013, by and among Landstar System Holdings, Inc., Landstar System, Inc. and the other parties thereto. (Incorporated by reference to Exhibit 4.3 to the Registrant’s Annual Report on Form 10-K for fiscal year ended December 28, 2013 (Commission File No. 0-21238)) | |
| (10) | Material contracts: | |
| 10.1+ | Landstar System, Inc. Executive Incentive Compensation Plan (Incorporated by reference to Exhibit A to the Registrant’s Definitive Proxy Statement filed on April 12, 2012 (Commission File No. 0-21238)) | |
| 10.2+* | Landstar System, Inc. Supplemental Executive Retirement Plan, as amended and restated as of January 1, 2015 | |
| 10.3+ | Amended and Restated Landstar System, Inc. 2002 Employee Stock Option and Stock Incentive Plan (Incorporated by reference to Exhibit A to the Registrant’s Definitive Proxy Statement filed on March 23, 2009 (Commission File No. 0-21238)) |
65
Table of Contents
| Exhibit |
Description | |
| 10.4+ | Landstar System, Inc. 2011 Equity Incentive Plan, as amended through November 29, 2011 (Incorporated by reference to Exhibit 10.5 to the Registrant’s Annual Report on Form 10-K for the fiscal year ended December 31, 2011 (Commission File No. 0-21238)) | |
| 10.5+ | Directors Stock Compensation Plan, as amended and restated as of February 22, 2010 (Incorporated by reference to Exhibit 10.7 to the Registrant’s Annual Report on Form 10-K for the fiscal year ended December 26, 2009 (Commission File No. 0-21238)) | |
| 10.6+ | Landstar System, Inc. 2013 Directors Stock Compensation Plan (Incorporated by reference to Exhibit A to the Registrant’s Definitive Proxy Statement filed on April 11, 2013 (Commission File No. 0-21238)) | |
| 10.7+ | Form of Indemnification Agreement between the Company and each of the directors and Executive Officers of the Company (Incorporated by reference to Exhibit 10.2 to the Registrant’s Annual Report on Form 10-K for the fiscal year ended December 27, 2003 (Commission File No. 0-21238)) | |
| 10.8+ | Form of Key Executive Employment Protection Agreement between Landstar System, Inc. and each of the Executive Officers of the Company (Incorporated by reference to Exhibit 10.13 to the Registrant’s Annual Report on Form 10-K for the fiscal year ended December 30, 2006 (Commission File No. 0-21238)) | |
| 10.9+ | Form of Amendment to Key Executive Employment Protection Agreement between Landstar System, Inc. and each of the Executive Officers of the Company (Incorporated by reference to Exhibit 10.12 to the Registrant’s Annual Report on Form 10-K for fiscal year ended December 27, 2008 (Commission File No. 0-21238)) | |
| 10.10+ | Form of Amendment to Key Executive Employment Protection Agreement between Landstar System, Inc. and each of the Executive Officers of the Company (Incorporated by reference to Exhibit 10.10 to the Registrant’s Annual Report on Form 10-K for the fiscal year ended December 29, 2012 (Commission File No. 0-21238)) | |
| 10.11+ | Letter Agreement, dated January 3, 2012, between Landstar System, Inc. and Henry H. Gerkens (Incorporated by reference to Exhibit 99.1 to the Registrant’s Current Report on Form 8-K filed on January 3, 2012 (Commission File No. 0-21238)) | |
| 10.12+ | Amendment, dated January 23, 2013, to the Letter Agreement dated January 3, 2012, between Landstar System, Inc. and Henry H. Gerkens (Incorporated by reference to Exhibit 99.1 to the Registrant’s Current Report on Form 8-K filed on January 25, 2013 (Commission File No. 0-21238)) | |
| 10.13+ | Performance Related Stock Award Agreement, dated January 23, 2013, between Landstar System, Inc. and Henry H. Gerkens (Incorporated by reference to Exhibit 99.1 to the Registrant’s Current Report on Form 8-K filed on January 25, 2013 (Commission File No. 0-21238)) | |
| 10.14+ | Stock Purchase Agreement, dated as of December 10, 2013, by and among XPO Logistics, Inc., Landstar Supply Chain Solutions, Inc. and Landstar System Holdings, Inc. (Incorporated by reference to Exhibit 2.1 to the Registrant’s Current Report on Form 8-K filed on December 12, 2013 (Commission File No. 0-21238)) | |
| 10.15+ | Letter Agreement, dated December 27, 2013, by and among Landstar System Holdings, Inc., Landstar Supply Chain Solutions, Inc. and XPO Logistics, Inc., (Incorporated by reference to Exhibit 99.1 to the Registrant’s Current Report on Form 8-K filed on January 3, 2014 (Commission File No. 0-21238)) | |
| (21) | Subsidiaries of the Registrant: | |
| 21.1* | List of Subsidiaries of the Registrant | |
| (23) | Consents of experts and counsel: | |
| 23.1* | Consent of KPMG LLP as Independent Registered Public Accounting Firm | |
| (24) | Power of attorney: | |
| 24.1* | Powers of Attorney | |
| (31) | Certifications pursuant to Section 302 of the Sarbanes-Oxley Act of 2002: | |
| 31.1* | Chief Executive Officer certification, as adopted pursuant to Section 302 of the Sarbanes-Oxley Act of 2002 |
66
Table of Contents
| Exhibit |
Description | |
| 31.2* | Chief Financial Officer certification, as adopted pursuant to Section 302 of the Sarbanes-Oxley Act of 2002 | |
| (32) | Certifications pursuant to Section 906 of the Sarbanes-Oxley Act of 2002: | |
| 32.1** | Chief Executive Officer certification pursuant to 18 U.S.C. Section 1350, as adopted pursuant to Section 906 of the Sarbanes-Oxley Act of 2002 | |
| 32.2** | Chief Financial Officer certification pursuant to 18 U.S.C. Section 1350, as adopted pursuant to Section 906 of the Sarbanes-Oxley Act of 2002 | |
| 101 * | The following materials from the Company’s Annual Report on Form 10-K for the fiscal year ended December 27, 2014, formatted in Extensible Business Reporting Language (XBRL): (i) Consolidated Balance Sheets, (ii) Consolidated Statements of Income, (iii) Consolidated Statements of Comprehensive Income, (iv) Consolidated Statements of Cash Flows, (v) Consolidated Statements of Changes in Shareholders’ Equity and (vi) Notes to Consolidated Financial Statements |
| + | management contract or compensatory plan or arrangement |
| * | Filed herewith. |
| ** | Furnished herewith. |
THE COMPANY WILL FURNISH, WITHOUT CHARGE, TO ANY SHAREHOLDER OF THE COMPANY WHO SO REQUESTS IN WRITING, A COPY OF ANY EXHIBITS, AS FILED WITH THE SECURITIES AND EXCHANGE COMMISSION. ANY SUCH REQUEST SHOULD BE DIRECTED TO LANDSTAR SYSTEM, INC., ATTENTION: INVESTOR RELATIONS, 13410 SUTTON PARK DRIVE SOUTH, JACKSONVILLE, FLORIDA 32224.
67
Table of Contents
Pursuant to the requirements of Section 13 or 15(d) of the Securities Exchange Act of 1934, the Registrant has duly caused this Report to be signed on its behalf by the undersigned, thereunto duly authorized.
| Date: February 20, 2015 | LANDSTAR SYSTEM, INC. | |||||
| By: | /S/ JAMES B. GATTONI | |||||
| James B. Gattoni | ||||||
| President and Chief Executive Officer | ||||||
| By: | /S/ L. KEVIN STOUT | |||||
| L. Kevin Stout | ||||||
| Vice President and Chief Financial Officer | ||||||
Pursuant to the requirements of the Securities Exchange Act of 1934, this Report has been signed below by the following persons on behalf of the Registrant and in the capacities and on the dates indicated.
| Signature |
Title |
Date | ||
| /S/ JAMES B. GATTONI James B. Gattoni |
President and Chief Executive Officer; Principal Executive Officer |
February 20, 2015 | ||
| /S/ L. KEVIN STOUT L. Kevin Stout |
Vice President and Chief Financial Officer; Principal Accounting Officer |
February 20, 2015 | ||
| * Homaira Akbari |
Director |
February 20, 2015 | ||
| * David G. Bannister |
Director |
February 20, 2015 | ||
| * Henry H. Gerkens |
Executive Chairman |
February 20, 2015 | ||
| * Michael A. Henning |
Director |
February 20, 2015 | ||
| * Diana M. Murphy |
Director |
February 20, 2015 | ||
| * Larry J. Thoele |
Director |
February 20, 2015 | ||
| By: | /S/ MICHAEL K. KNELLER | |
| Michael K. Kneller | ||
| Attorney In Fact* | ||
68