Attached files
| file | filename |
|---|---|
| EX-99.1 - EXHIBIT 99.1 - VARIAN MEDICAL SYSTEMS INC | tv505346_ex99-1.htm |
| 8-K - FORM 8-K - VARIAN MEDICAL SYSTEMS INC | tv505346_8k.htm |
Exhibit 99.2

J. Michael Bruff Senior Vice President, Investor Relations investors@varian.com October 23, 2018 Fourth Quarter Fiscal Year 2018

This presentation is intended exclusively for investors. It is not intended for use in Sales or Marketing. Forward - Looking Statements Except for historical information, this presentation contains forward - looking statements within the meaning of the Private Securities Litigation Reform Act of 1995 . Statements concerning industry outlook, including growth drivers, future trends in cancer incidence and trends in cancer treatment needs, demand, innovation and growth opportunities ; Varian Medical System, Inc . ’s (“Varian” or the “company”) future orders, revenues, operating expenses, tax rate, cash flows, backlog or earnings growth ; future financial results ; potential impact of tariffs or a global trade war, market acceptance of or transition to new products or technology such as our Edge® radiosurgery system, TrueBeam®, HyperArc TM , 360 Oncology TM , HALCYON TM , image - guided radiation therapy, stereotactic radiosurgery and proton therapy, and any statements using the terms “could”, “believe”, “expect”, “outlook”, “anticipate”, ”vision”, “estimate”, “future”, “horizon”, “aiming”, “driving”, “target” or similar statements are forward - looking statements that involve risks and uncertainties that could cause the company’s actual results to differ materially from those anticipated . Such risks and uncertainties include global economic conditions and changes to trends for cancer treatment regionally ; new and potential future tariffs or a global trade war ; the impact of changes to the Affordable Health Care for America Act (including excise taxes on medical devices) and any further healthcare reforms (including changes to Medicare and Medicaid), and/or changes to third - party reimbursement levels ; currency exchange rates and tax rates ; the impact of the Tax Cuts and Jobs Act ; demand for the company’s products ; the company’s ability to develop, commercialize, and deploy new products ; the company’s ability to meet Food and Drug Administration (FDA) and other regulatory requirements for product clearances or to comply with FDA and other regulatory regulations or procedures, changes in the regulatory environment, including with respect to FDA requirements ; the company’s assessment of the goodwill associated with its proton business, challenges associated with the successful commercialization of the company’s proton business ; the risks associated with providing financing for the construction and start - up operations of proton therapy centers ; the effect of adverse publicity ; the company’s reliance on sole or limited - source suppliers ; the company’s ability to maintain or increase margins ; the impact of competitive products and pricing ; the potential loss of key distributors or key personnel ; challenges to public tender awards and the loss of such awards or other orders ; and the other risks listed from time to time in the company’s filings with the Securities and Exchange Commission, which by this reference are incorporated herein . The company assumes no obligation to update or revise the forward - looking statements in this presentation because of new information, future events, or otherwise . Reconciliations to GAAP financials can be found in our earnings press releases at www . varian . com/investors and the appendix to this presentation . Varian has not filed its Form 10 - K for the quarter ended September 28 , 2018 . As a result, all financial results described here should be considered preliminary, and are subject to change to reflect any necessary adjustments, or changes in accounting estimates, that are identified prior to the time the company files the Form 10 - K . Medical Advice Disclaimer Varian as a medical device manufacturer cannot and does not recommend specific treatment approaches. Individual treatment res ult s may vary. 2

Long - Term Strategy

Eclipse ™ Treatment planning system RapidPlan ™ Knowledge - based planning software Calypso ® Real - time tracking technology Edge ™ System Full - body radiosurgery platform Halcyon ™ Image - guided IMRT treatment platform TrueBeam ® /VitalBeam ™ Trilogy ® /Clinac ® /UNIQUE ™ Treatment procedures with ease, speed and accuracy Varian Brachytherapy Product suite for planning and delivery BRAVOS ™ launched at ASTRO 2018 ProBeam ® Proton therapy systems ProBeam ® 360 ° launched at ASTRO 2018 Radiation oncology OIS Radiosurgery Brachytherapy Radiation oncology treatment planning Proton therapy Radiation therapy Global leader in radiation therapy ARIA ® Oncology information system InSightive ™ Oncology analytics HyperArc ™ High - definition radiotherapy Multi - Criteria Optimization (MCO) Enhanced control of plan optimization Graphics Processing Unit (GPU) Support Faster dose calculation and plan optimization 4

Long - term growth and value creation strategy Global Leader in Radiation Therapy Radiation oncology OIS Radiosurgery Brachytherapy Radiation oncology treatment planning Proton therapy Radiation therapy Global Leader in Multi - Disciplinary, Integrated Cancer Care Solutions Interventional oncology Surgical oncology Diagnostic imaging Radiation oncology Precision medicine Medical oncology Generate insights Call on all oncologists Aggregate data Disseminated insights Build AI/ML capabilities 5
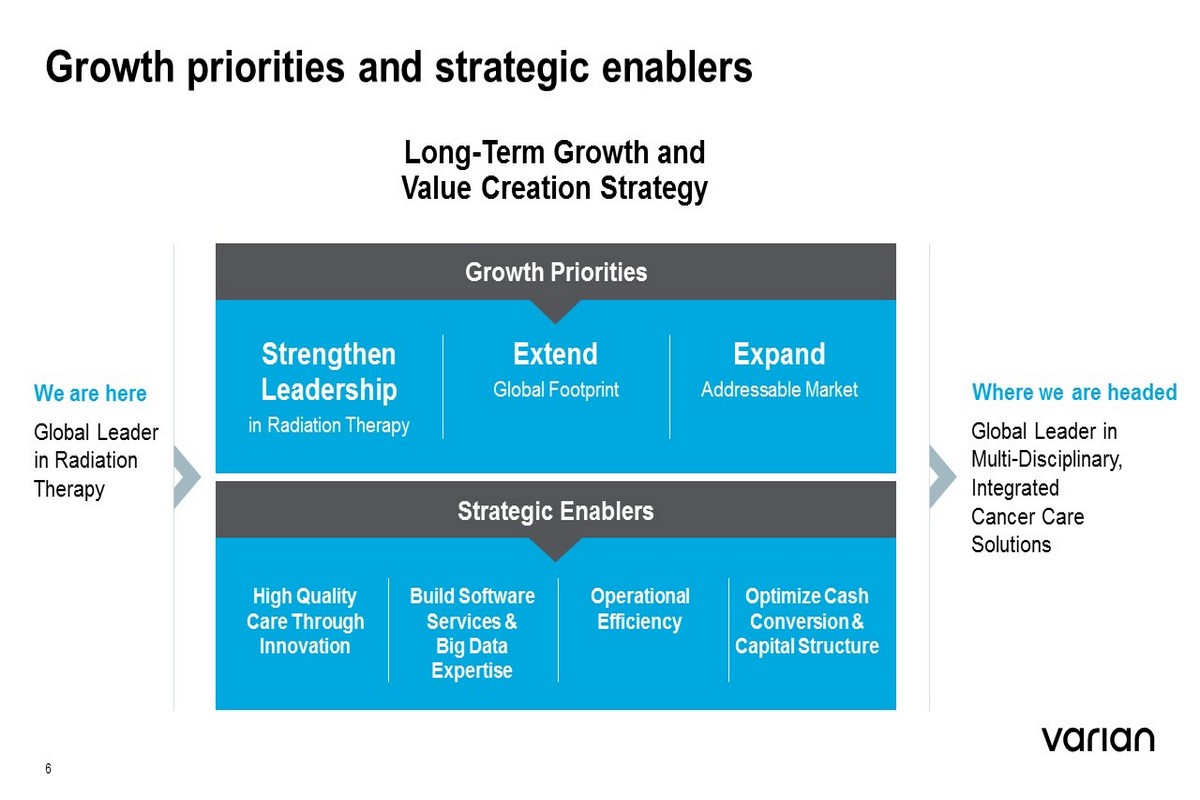
Growth priorities and strategic enablers We are here Global Leader in Radiation Therapy Global Leader in Multi - Disciplinary, Integrated Cancer Care Solutions Long - Term Growth and Value Creation Strategy Strengthen Leadership in Radiation Therapy Extend Global Footprint Expand Addressable Market Growth Priorities High Quality Care Through Innovation Build Software Services & Big Data Expertise Operational Efficiency Optimize Cash Conversion & Capital Structure Strategic Enablers Where we are headed 6

Global market leader with >50% share in radiation therapy, maintaining share in an 8% growth market 1 Grew linac net installed base by 224 units Total installed base of 8,057 units R&D up 15% maintaining commitment to driving high - quality, organic innovation 13% Oncolog Orders growth in the quarter; ⁃ Oncology orders growth of 9% (+8% cc) for the full fiscal year 84 Halcyon Orders in 4Q ⁃ 182 orders to date, since launch last May ⁃ Over half are incremental ⁃ >40% for greenfield sites Growth priority: Strengthen our leadership in radiation therapy (1) Based on company estimates and industry reports and data humediQ acquisition Acquired the manufacturer of IDENTIFY, an automated patient ID, positioning, and motion management system for radiation therapy 7

Growth priority: Extend global footprint ~40% of Halcyon orders in emerging markets, since May 2017 launch ⁃ ~80% of emerging market orders to date were for incremental units 5 th consecutive quarter of double - digits orders growth in EMEA in Oncology in the quarter; ⁃ EMEA orders growth of 14% (+15% cc) for the quarter and 17% (+13% cc) for the full fiscal year 8

Growth priority: Expand addressable market Noona Healthcare acquisition strengthens 360 Oncology platform with its cloud - based mobile service designed to capture cancer patient - reported outcomes (PROs) and communicate directly with patients ~600 Eclipse MCO orders to date (4Q FY17 launch); almost doubling the cumulative amount of licenses as of the previous quarter Unique software customers grew 5% in 4Q; bringing us to ~5,000 software customers ⁃ Software revenues growth of +7% ⁃ Second consecutive record quarter for RapidPlan , our knowledge - based treatment planning software; >250 licenses in 4Q 9

4Q FY 2018 Business Highlights

• First $1B orders quarter, with $3B orders in the full fiscal year • Record APAC orders for the year with 31% orders growth in APAC in the 4 th quarter, the strongest quarter in APAC history • First $1.0B orders year in EMEA, in conjunction with 5 th consecutive quarter of double - digits orders growth • First $1.5B orders year in the Americas Record - setting quarter and year Regional Orders Oncology business highlights • Strongest quarter for Halcyon orders, nearly doubling orders to date from 98 in the 3 rd quarter to 182 orders to date in the 4 th quarter • Strongest quarter for Eclipse MCO license orders, bringing us to ~600 orders to date • Second consecutive record quarter for RapidPlan , our knowledge - based treatment planning software; over 250 license orders in the 4 th quarter Product Orders 11

Year in review Varian launches Halcyon 2.0 with kilovoltage cone - beam CT imaging at ESTRO Calypso Anchored Beacon transponder for lung receives FDA 510k clearance Varian publishes 2017 Sustainability Report OCT 2017 DEC JAN FEB MAR NOV Halcyon receives Shonin approval in Japan Varian opens new facility in Brazil Varian partners with Penn Medicine for proton therapy training and education Peter MacCallum Cancer Centre in Australia standardizes on Varian solution for cancer treatment planning Halcyon receives Taiwan FDA approval Varian acquires Mobius Medical Systems Halcyon receives AERB Certificate for Import and Supply in India ARIA, Eclipse and TrueBeam named category leaders in 2018 Best in KLAS Report Varian acquires Evinance Innovation Eclipse customers take top Overall spots at World Championships of Treatment Planning Varian signs memorandum of understanding with Ping An to expand access to high - quality cancer care in China 12 MAY APR JUN Varian signs training & education cooperation agreement with Brazil Ministry of Health and science and technology institutions Varian wins "Best After - Sales Service Performance Award for Radiotherapy Products" in China Varian acquires COOP, a leading radiotherapy equipment distributor in Taiwan Varian launches Velocity 4.0, including RapidSphere Varian installs ProBeam cyclotron at UCLH proton beam therapy center AUG JUL SEP 2018 Dr. Jeff Balser named to Varian Board of Directors Varian shares vision of a world without fear of cancer Varian installs ProBeam cyclotron at Delray Medical Center in Florida Varian CEO Dow Wilson joins USISPF Varian announces acquisition of humediQ Corporate Milestone Geo Expansion Acquisition Proton

0% 5% 10% 15% 20% 4Q FY17 1Q FY18 2Q FY18 3Q FY18 4Q FY18 +40 bps Y/Y Cash Flow from Operations ($M) $0 $50 $100 $150 $200 4Q FY17 1Q FY18 2Q FY18 3Q FY18 4Q FY18 Non - GAAP Operating Earnings (% of Revenues) Financial highlights Operating trends* Strong performance in key financial measures • Revenues up 11% (+12% in cc) driven by growth across hardware, software and services • Cash Flow from Operations down 17%, driven by faster growth in Europe resulting in higher receivables balance Oncology DSO down from 111 to 102 days • GAAP operating margin up 232 bps to 16.8% and Non - GAAP operating margin up 40 bps to 17.8% * All financial metrics, including historical figures, reflect the new revenue recognition standard, ASC 606. 13 Revenues ($M) GAAP Operating Earnings (% of Revenues) $600 $650 $700 $750 $800 $850 4Q FY17 1Q FY18 2Q FY18 3Q FY18 4Q FY18 0% 5% 10% 15% 20% 4Q FY17 1Q FY18 2Q FY18 3Q FY18 4Q FY18 - 17% Y/Y +11% Y/Y +232 bps Y/Y
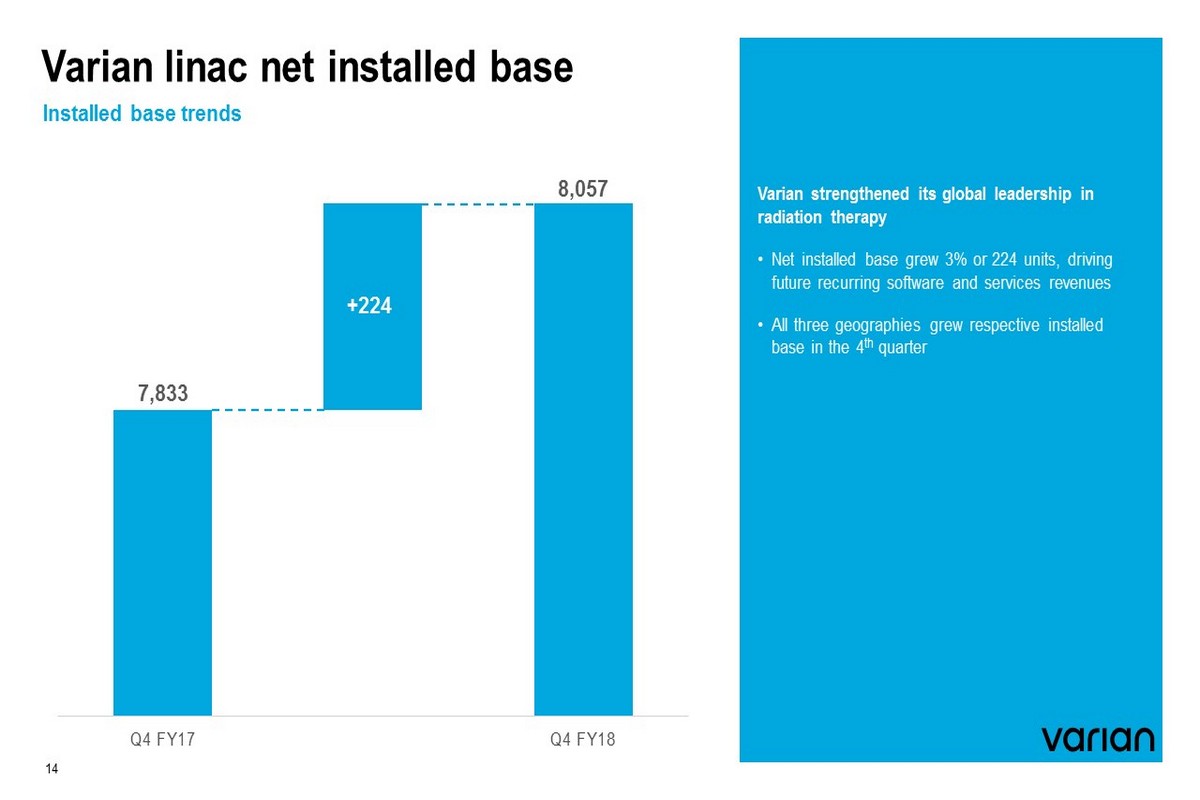
Varian linac net installed base Installed base trends Varian strengthened its global leadership in radiation therapy • Net installed base grew 3% or 224 units, driving future recurring software and services revenues • All three geographies grew respective installed base in the 4 th quarter Q4 FY17 Q4 FY18 7,833 8,057 +224 14

Key wins Russia – New Medical Technologies KFT 7 Halcyon and 3 TrueBeam systems Sweden – VGR Tender ( Götebord & Boraas ) 6 TrueBeam systems Africa – Eldoret Mediheal , Kenya 3 Halcyon systems and 1 TrueBeam system Africa – Sierra Leone 1 st linac in the country Australia – Genesis Care 9 Edge systems and 1 Halcyon system Malaysia – Beacon Hospital 1 st HyperArc and Halcyon order Japan – Kyoto University & National Cancer Center East 1 st Halcyon orders in Japan Barnes Jewish 8 TrueBeams , 1 Halcyon and 5 HDR Afterloaders Alliance Oncology 5 TrueBeam systems CHI - Catholic Health 3 TrueBeam systems McKesson/US Oncology 4 TrueBeams , 2 VitalBeams , and 1 Clinac iX system Uruguay MOH 2 VitalBeams and 1 Unique system INCA 2 Halcyon systems Americas EMEA APAC 15

4Q FY 2018 Financial Overview

Varian consolidated (GAAP) Key P&L financial metrics 17 • Record Oncology Gross Orders growth: >$1B gross orders in 4Q, +13% growth; and >$3.1B for the year, +9% growth • Proton orders of $58M for the year primarily reflects the two orders taken in 1Q FY18 • Revenues growth driven by balanced double - digit growth in both Products and Services • 4Q Gross Margin rate negatively impacted by 12 bps due to the impact of tariffs; FY Gross Margin rate driven by higher TrueBeam mix • SG&A driven by continued investments in sales and marketing partially offset by G&A productivity improvements • R&D driven by investments in software, adaptive radiotherapy, and other strategic innovation programs • GAAP Diluted EPS up 49% for the quarter and down 33% for the year due to the Tax Cuts and Jobs Act • Grew linac installed base 224 units Note: Unless noted otherwise, all ‘Orders’ reflects Gross Orders, all growth rates are in dollars, and year on year, and all num bers reflect continuing operations. VARIAN FISCAL 2018 $M 4Q Y/Y Full Year Y/Y Gross Orders $1,072 5% $3,172 3% Revenues $802 11% $2,919 11% Product $446 11% $1,570 13% Services $356 11% $1,349 10% Gross Margin $339 11% $1,274 14% % of Revenues 42.3% -12 bps 43.6% 110 bps SG&A $145 -3% $598 -1% % of Revenues 18.1% -270 bps 20.5% -256 bps R&D $60 15% $234 11% % of Revenues 7.4% 26 bps 8.0% -1 bps Operating Earnings $134 29% $442 47% % of Revenues 16.8% 232 bps 15.1% 367 bps Diluted EPS ($) $1.26 49% $1.62 -33% Installed Base (Linac) 8,057 3%

Varian consolidated (non - GAAP) Key P&L financial metrics 18 • Record Oncology Gross Orders growth: >$1B gross orders in 4Q, +13% growth; and >$3.1B for the year, +9% growth • Proton orders of $58M for the year primarily reflects the two orders taken in 1Q FY18 • Revenues growth driven by balanced double - digit growth in both Products and Services • 4Q Gross Margin rate negatively impacted by 5 bps due to the impact of tariffs; FY Gross Margin rate driven by higher TrueBeam mix • SG&A driven by continued investments in sales and marketing partially offset by G&A productivity improvements • R&D driven by investments in software, adaptive radiotherapy, and other strategic innovation programs • Non - GAAP Diluted EPS up 11% for the quarter and 36% for the year • Grew linac installed base 224 units Note: Unless noted otherwise, all ‘Orders’ reflects Gross Orders, all growth rates are in dollars, and year on year, and all num bers reflect continuing operations. VARIAN FISCAL 2018 $M 4Q Y/Y Full Year Y/Y Gross Orders $1,072 5% $3,172 3% Revenues $802 11% $2,919 11% Product $446 11% $1,570 13% Services $356 11% $1,349 10% Gross Margin $341 11% $1,280 14% % of Revenues 42.5% -5 bps 43.9% 114 bps SG&A $138 7% $529 3% % of Revenues 17.3% -71 bps 18.1% -149 bps R&D $60 15% $234 11% % of Revenues 7.4% 26 bps 8.0% -1 bps Operating Earnings $143 14% $517 31% % of Revenues 17.8% 40 bps 17.7% 263 bps Diluted EPS ($) $1.16 11% $4.42 36% Installed Base (Linac) 8,057 3%
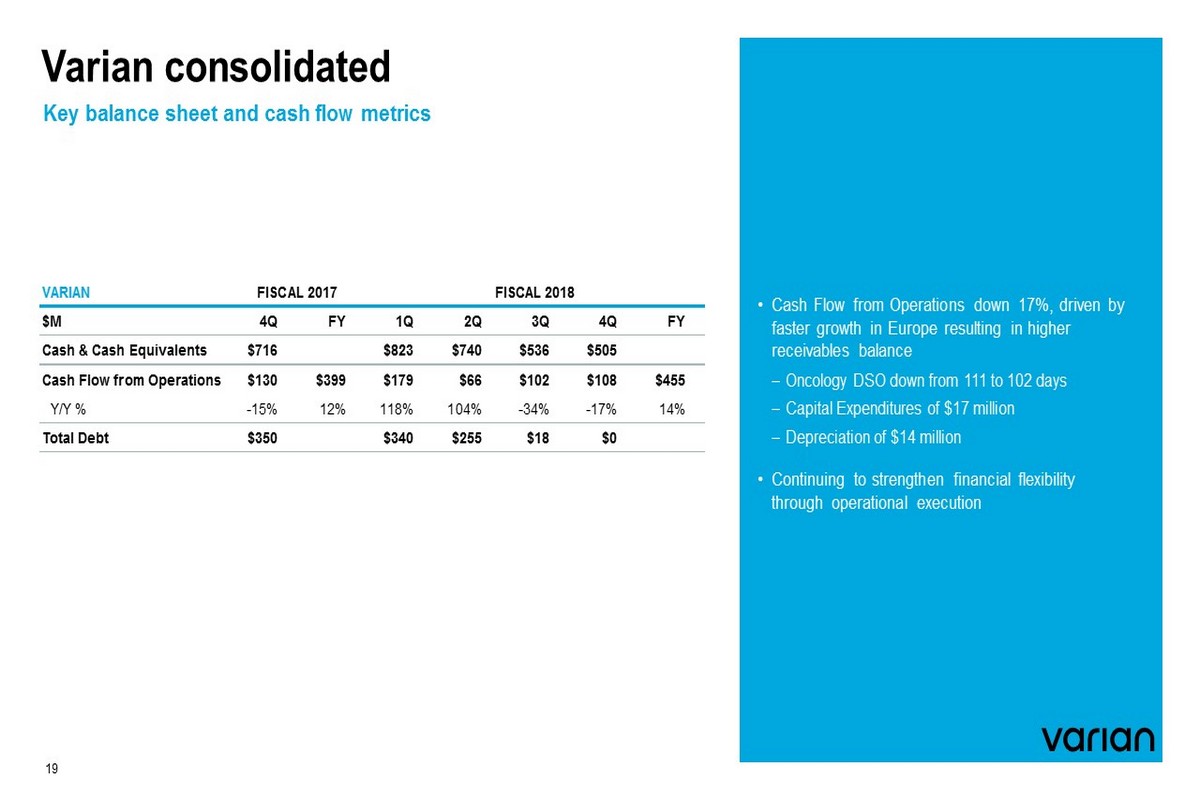
Varian consolidated Key balance sheet and cash flow metrics • Cash Flow from Operations down 17%, driven by faster growth in Europe resulting in higher receivables balance Oncology DSO down from 111 to 102 days Capital Expenditures of $17 million Depreciation of $14 million • Continuing to strengthen financial flexibility through operational execution 19 VARIAN FISCAL 2017 FISCAL 2018 $M 4Q FY 1Q 2Q 3Q 4Q FY Cash & Cash Equivalents $716 $823 $740 $536 $505 Cash Flow from Operations $130 $399 $179 $66 $102 $108 $455 Y/Y % -15% 12% 118% 104% -34% -17% 14% Total Debt $350 $340 $255 $18 $0
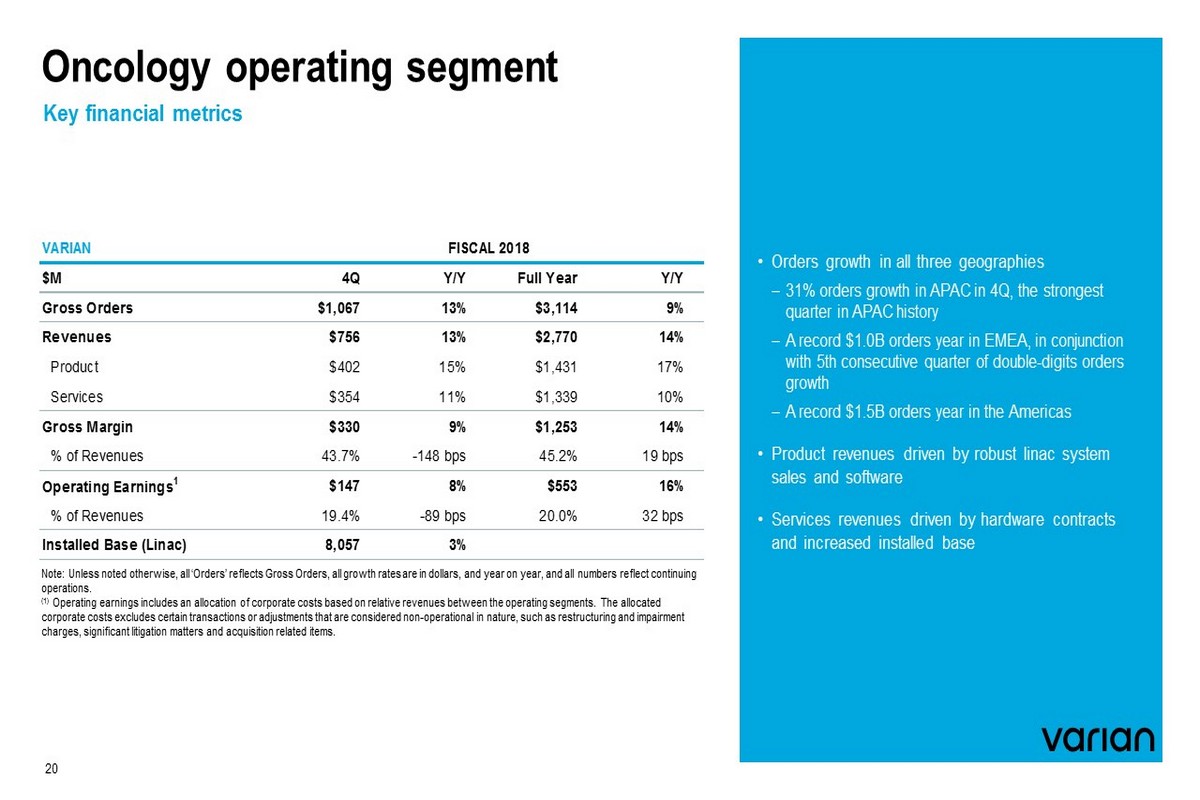
Oncology operating segment Key financial metrics • Orders growth in all three geographies 31% orders growth in APAC in 4Q, the strongest quarter in APAC history A record $1.0B orders year in EMEA, in conjunction with 5th consecutive quarter of double - digits orders growth A record $1.5B orders year in the Americas • Product revenues driven by robust linac system sales and software • Services revenues driven by hardware contracts and increased installed base 20 Note: Unless noted otherwise, all ‘Orders’ reflects Gross Orders, all growth rates are in dollars, and year on year, and all num bers reflect continuing operations. (1) Operating earnings includes an allocation of corporate costs based on relative revenues between the operating segments. The all ocated corporate costs excludes certain transactions or adjustments that are considered non - operational in nature, such as restructurin g and impairment charges, significant litigation matters and acquisition related items. VARIAN FISCAL 2018 $M 4Q Y/Y Full Year Y/Y Gross Orders $1,067 13% $3,114 9% Revenues $756 13% $2,770 14% Product $402 15% $1,431 17% Services $354 11% $1,339 10% Gross Margin $330 9% $1,253 14% % of Revenues 43.7% -148 bps 45.2% 19 bps Operating Earnings 1 $147 8% $553 16% % of Revenues 19.4% -89 bps 20.0% 32 bps Installed Base (Linac) 8,057 3%

21 Oncology gross orders by geography AMERICAS 6% 4 Q Y/Y ( +6% c c) 5% FY 2018 1 (+5% cc ) APAC 31% 4 Q Y/Y ( +33% c c) 9% FY 2018 (+8% cc ) EMEA 14% 4Q Y/Y ( +15% cc ) 17% FY 2018 (+13% cc ) (1) In North America, FY18 orders growth of 3% in dollars and constant currency
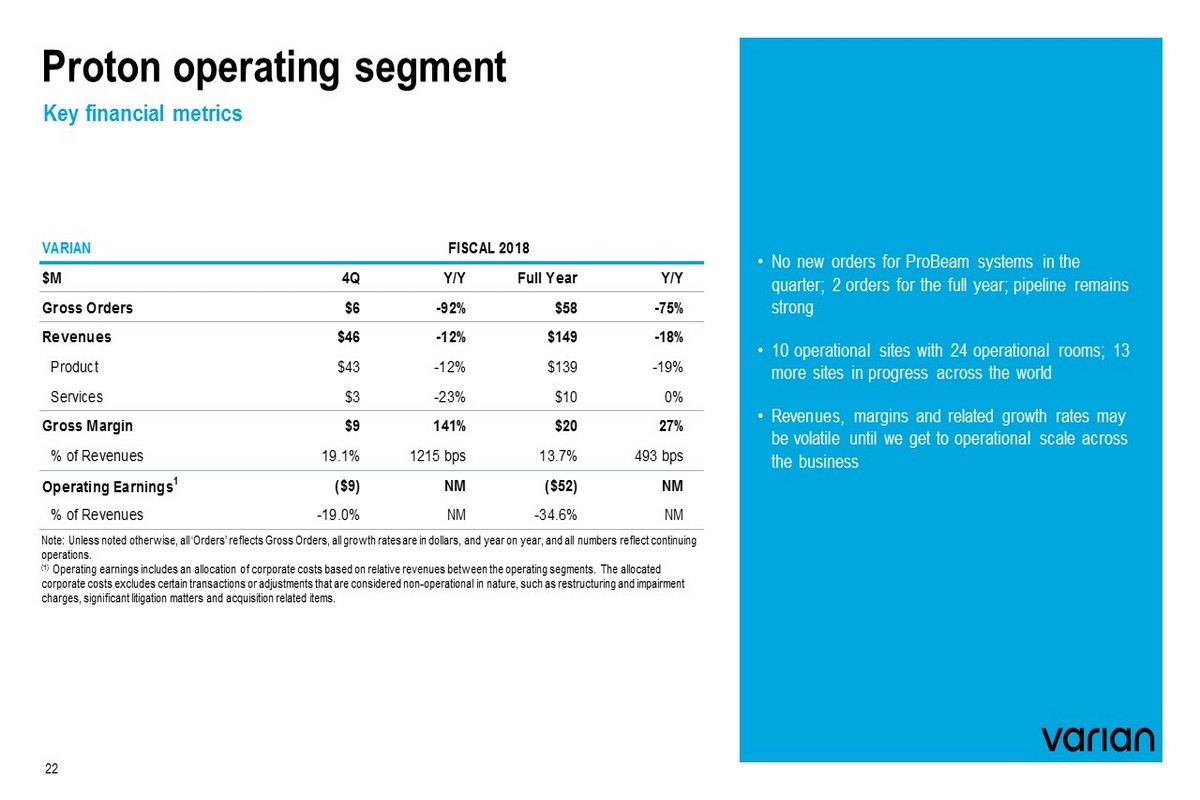
Proton operating segment Key financial metrics • No new orders for ProBeam systems in the quarter; 2 orders for the full year; pipeline remains strong • 10 operational sites with 24 operational rooms; 13 more sites in progress across the world • Revenues, margins and related growth rates may be volatile until we get to operational scale across the business 22 Note: Unless noted otherwise, all ‘Orders’ reflects Gross Orders, all growth rates are in dollars, and year on year, and all num bers reflect continuing operations. (1) Operating earnings includes an allocation of corporate costs based on relative revenues between the operating segments. The all ocated corporate costs excludes certain transactions or adjustments that are considered non - operational in nature, such as restructurin g and impairment charges, significant litigation matters and acquisition related items. VARIAN FISCAL 2018 $M 4Q Y/Y Full Year Y/Y Gross Orders $6 -92% $58 -75% Revenues $46 -12% $149 -18% Product $43 -12% $139 -19% Services $3 -23% $10 0% Gross Margin $9 141% $20 27% % of Revenues 19.1% 1215 bps 13.7% 493 bps Operating Earnings 1 ($9) NM ($52) NM % of Revenues -19.0% NM -34.6% NM
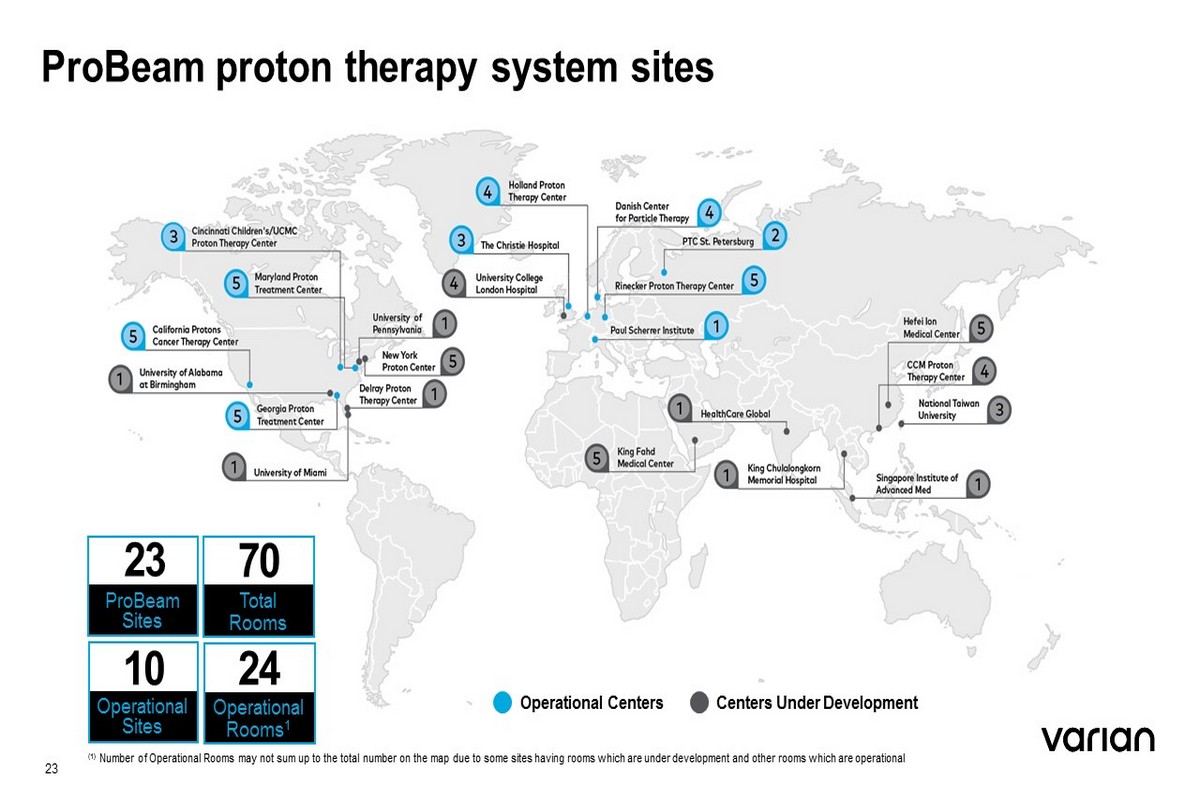
ProBeam proton therapy system sites Operational Centers Centers Under Development Total Rooms ProBeam Sites Operational R ooms 1 Operational Sites 70 24 10 23 (1) Number of Operational Rooms may not sum up to the total number on the map due to some sites having rooms which are under development an d o ther rooms which are operational 23

FY 2019 Guidance

Varian consolidated Fiscal year 2019 guidance 25 (1) Guidance implies the 5% to 8% year on year Revenues range (2) These values are presented on a non - GAAP basis. We have not provided a reconciliation of non - GAAP guidance measures to the corresponding GAAP measures on a forward - looking basis due to potential significant variability and limited visibility of the ex cluded items. (3) Cash Flow is shown on a Total Company basis, including Varex FY17. • The guidance assumes a Non - GAAP effective tax rate of 21% to 22% and a weighted average diluted share count of 92 million • The guidance also assumes FX rates as of the beginning of fiscal year 2019, excludes any future M&A activity, and includes the expected impact of all currently enacted tariffs • We expect our earnings performance to be more heavily weighted toward the back half of the year as it will take several months to phase in our various mitigation efforts around the US/China tariffs VARIAN $M FY17 Actual FY18 Actual FY19 Guidance 1 Revenues $2,619 $2,919 $3.06B to $3.15B Y/Y % 1% 11% 5% to 8% Non-GAAP EPS ($) 2 $3.26 $4.42 $4.60 to $4.75 Cash Flow from Operations 3 $399 $455 $460 to $510 15.1% 17.7% 17.0% to 18.0% Non-GAAP Operating Earnings as percent of Revenues 2

4Q FY 2018 Financial Overview

Non - GAAP disclosure 27 Discussion of Non - GAAP Financial Measures This presentation includes the following non - GAAP financial measures derived from our Condensed Consolidated Statements of Earnings : non - GAAP operating earnings, non - GAAP net earnings and non - GAAP net earnings per diluted share . We define non - GAAP operating earnings from continuing operations as operating earnings from continuing operations excluding amortization of intangible assets, restructuring charges, certain legal costs, impairment charges and acquisition and integration related expenses and benefits . These measures are not presented in accordance with, nor are they a substitute for U . S . generally accepted accounting principles, or GAAP . In addition, these measures may be different from non - GAAP measures used by other companies, limiting their usefulness for comparison purposes . The non - GAAP financial measures should not be considered in isolation from measures of financial performance prepared in accordance with GAAP . Investors are cautioned that there are material limitations associated with the use of non - GAAP financial measures as an analytical tool . We have provided a reconciliation of each non - GAAP financial measure used in this earnings release to the most directly comparable GAAP financial measure . We have not provided a reconciliation of non - GAAP guidance measures to the corresponding GAAP measures on a forward - looking basis due to the potential significant variability and limited visibility of the excluded items discussed below . We utilize a number of different financial measures, both GAAP and non - GAAP, in analyzing and assessing the overall performance of our business, in making operating decisions, forecasting and planning for future periods, and determining payments under compensation programs . We consider the use of the non - GAAP measures to be helpful in assessing the performance of the ongoing operation of our business . We believe that disclosing non - GAAP financial measures provides useful supplemental data that, while not a substitute for financial measures prepared in accordance with GAAP, allows for greater transparency in the review of our financial and operational performance . We also believe that disclosing non - GAAP financial measures provides useful information to investors and others in understanding and evaluating our operating results and future prospects in the same manner as management and in comparing financial results across accounting periods and to those of peer companies . Non - GAAP operating earnings and non - GAAP net earnings exclude the following items, except for significant non - recurring tax expense or benefit, which are only excluded from non - GAAP net earnings : Amortization of intangible assets : We do not acquire businesses and assets on a predictable cycle . The amount of purchase price allocated to intangible assets and the term of amortization can vary significantly and are unique to each acquisition or purchase . We believe that excluding amortization of intangible assets allows the users of our financial statements to better review and understand the historic and current results of our operations, and also facilitates comparisons to peer companies . Acquisition and integration - related expenses and benefits : We incur expenses or benefits with respect to certain items associated with our acquisitions, such as transaction costs, hedging gains and losses, changes in the fair value of contingent consideration liabilities, gain or expense on settlement of pre - existing relationships, integration costs, breakup fees etc . We exclude such expenses or benefits as they are related to acquisitions and have no direct correlation to the operation of our on - going business . Restructuring and impairment charges : We incur restructuring and impairment charges that result from events, which arise from unforeseen circumstances and/or often occur outside of the ordinary course of our on - going business . Although these events are reflected in our GAAP financials, these unique transactions may limit the comparability of our on - going operations with prior and future periods . Significant litigation charges or benefits and legal costs : We may incur charges or benefits as well as legal costs from time to time related to litigation and other contingencies . We exclude these charges or benefits, when significant, as well as legal costs associated with significant legal matters, because we do not believe they are reflective of on - going business and operating results . Significant non - recurring tax expense or benefit : We may incur significant non - recurring tax expense or benefit as a result of tax legislation and/or a change in judgment about the need for a valuation allowance that are generally unrelated to the level of business activity in the period in which these tax effects are reported . We exclude such expenses or benefits because we believe they do not accurately reflect the underlying performance of our continuing business operations . This exclusion is applicable to non - GAAP net earnings only . We apply our GAAP consolidated effective tax rate to our non - GAAP financial measures, other than when the underlying item has a materially different tax treatment .
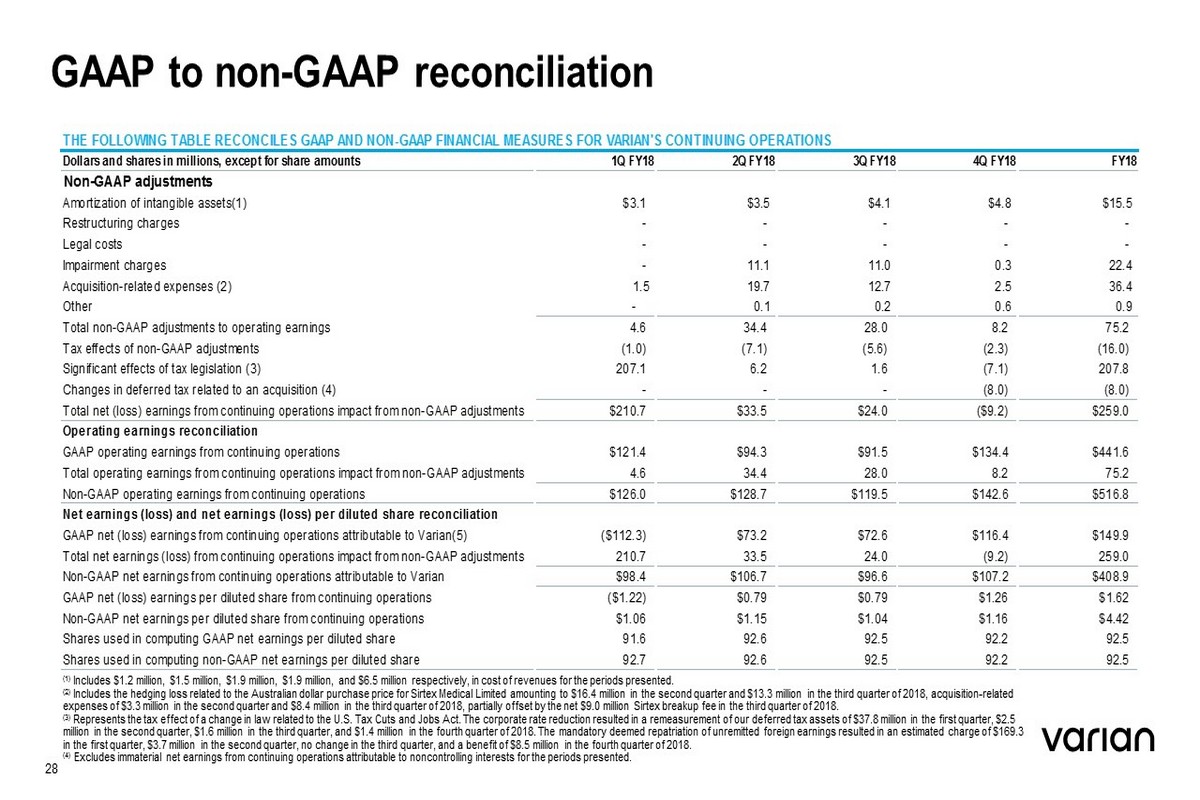
GAAP to non - GAAP reconciliation 28 (1) Includes $1.2 million, $1.5 million, $1.9 million, $1.9 million, and $6.5 million respectively, in cost of revenues for the p eri ods presented. (2) Includes the hedging loss related to the Australian dollar purchase price for Sirtex Medical Limited amounting to $16.4 million in the second quarter and $13.3 million in the third quarter of 2018, acquisition - re lated expenses of $3.3 million in the second quarter and $8.4 million in the third quarter of 2018, partially offset by the net $9. 0 m illion Sirtex breakup fee in the third quarter of 2018. (3) Represents the tax effect of a change in law related to the U.S. Tax Cuts and Jobs Act. The corporate rate reduction resulted in a remeasurement of our deferred tax assets of $37.8 million in the first quarter, $2.5 million in the second quarter, $1.6 million in the third quarter, and $1.4 million in the fourth quarter of 2018. The mandato ry deemed repatriation of unremitted foreign earnings resulted in an estimated charge of $169.3 in the first quarter, $3.7 million in the second quarter, no change in the third quarter, and a benefit of $8.5 million in th e f ourth quarter of 2018. (4) Excludes immaterial net earnings from continuing operations attributable to noncontrolling interests for the periods presente d. THE FOLLOWING TABLE RECONCILES GAAP AND NON-GAAP FINANCIAL MEASURES FOR VARIAN'S CONTINUING OPERATIONS Dollars and shares in millions, except for share amounts 1Q FY18 2Q FY18 3Q FY18 4Q FY18 FY18 Non-GAAP adjustments Amortization of intangible assets(1) $3.1 $3.5 $4.1 $4.8 $15.5 Restructuring charges - - - - - Legal costs - - - - - Impairment charges - 11.1 11.0 0.3 22.4 Acquisition-related expenses (2) 1.5 19.7 12.7 2.5 36.4 Other - 0.1 0.2 0.6 0.9 Total non-GAAP adjustments to operating earnings 4.6 34.4 28.0 8.2 75.2 Tax effects of non-GAAP adjustments (1.0) (7.1) (5.6) (2.3) (16.0) Significant effects of tax legislation (3) 207.1 6.2 1.6 (7.1) 207.8 Changes in deferred tax related to an acquisition (4) - - - (8.0) (8.0) Total net (loss) earnings from continuing operations impact from non-GAAP adjustments $210.7 $33.5 $24.0 ($9.2) $259.0 Operating earnings reconciliation GAAP operating earnings from continuing operations $121.4 $94.3 $91.5 $134.4 $441.6 Total operating earnings from continuing operations impact from non-GAAP adjustments 4.6 34.4 28.0 8.2 75.2 Non-GAAP operating earnings from continuing operations $126.0 $128.7 $119.5 $142.6 $516.8 Net earnings (loss) and net earnings (loss) per diluted share reconciliation GAAP net (loss) earnings from continuing operations attributable to Varian(5) ($112.3) $73.2 $72.6 $116.4 $149.9 Total net earnings (loss) from continuing operations impact from non-GAAP adjustments 210.7 33.5 24.0 (9.2) 259.0 Non-GAAP net earnings from continuing operations attributable to Varian $98.4 $106.7 $96.6 $107.2 $408.9 GAAP net (loss) earnings per diluted share from continuing operations ($1.22) $0.79 $0.79 $1.26 $1.62 Non-GAAP net earnings per diluted share from continuing operations $1.06 $1.15 $1.04 $1.16 $4.42 Shares used in computing GAAP net earnings per diluted share 91.6 92.6 92.5 92.2 92.5 Shares used in computing non-GAAP net earnings per diluted share 92.7 92.6 92.5 92.2 92.5

Total revenues by sales classification 29 CC – Constant currency $M 1Q FY18 2Q FY18 3Q FY18 4Q FY18 FY18 Product revenues $365.6 $393.8 $365.0 $445.5 $1,569.9 Y/Y 18% 8% 14% 11% 13% Service revenues $312.9 $336.1 $344.1 $356.1 $1,349.2 Y/Y 7% 13% 10% 11% 10% Total revenues $678.5 $729.9 $709.1 $801.6 $2,919.1 Y/Y 13% 10% 12% 11% 11% Y/Y – CC 11% 6% 10% 12% 10% Product revenues as a percentage of total revenues 54% 54% 51% 56% 54% Service revenues as a percentage of total revenues 46% 46% 49% 44% 46%
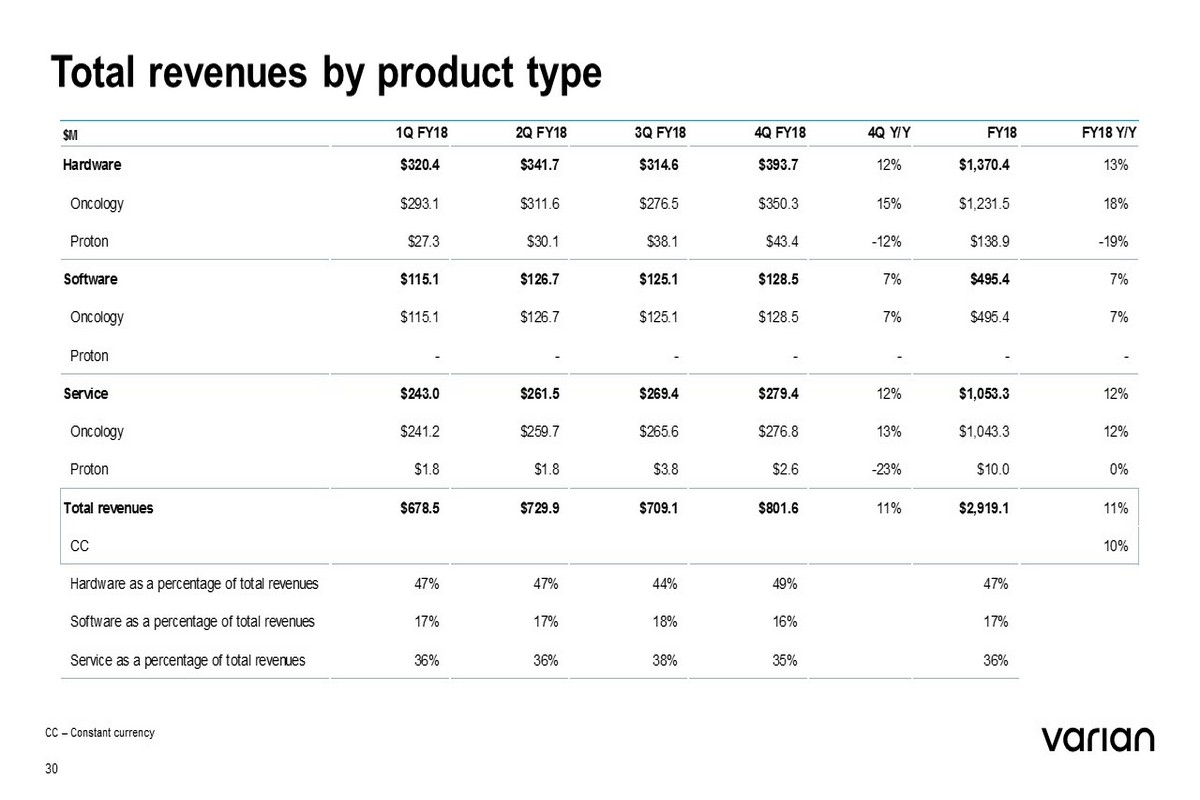
Total revenues by product type 30 CC – Constant currency $M 1Q FY18 2Q FY18 3Q FY18 4Q FY18 4Q Y/Y FY18 FY18 Y/Y Hardware $320.4 $341.7 $314.6 $393.7 12% $1,370.4 13% Oncology $293.1 $311.6 $276.5 $350.3 15% $1,231.5 18% Proton $27.3 $30.1 $38.1 $43.4 -12% $138.9 -19% Software $115.1 $126.7 $125.1 $128.5 7% $495.4 7% Oncology $115.1 $126.7 $125.1 $128.5 7% $495.4 7% Proton - - - - - - - Service $243.0 $261.5 $269.4 $279.4 12% $1,053.3 12% Oncology $241.2 $259.7 $265.6 $276.8 13% $1,043.3 12% Proton $1.8 $1.8 $3.8 $2.6 -23% $10.0 0% Total revenues $678.5 $729.9 $709.1 $801.6 11% $2,919.1 11% CC 10% Hardware as a percentage of total revenues 47% 47% 44% 49% 47% Software as a percentage of total revenues 17% 17% 18% 16% 17% Service as a percentage of total revenues 36% 36% 38% 35% 36%

Total revenues by region 31 CC – Constant currency $M 1Q FY18 2Q FY18 3Q FY18 4Q FY18 FY18 Americas revenues $356.7 $340.2 $342.6 $397.4 $1,436.9 Y/Y 20% 0% 2% 8% 7% Y/Y – CC 20% -1% 2% 8% 7% EMEA revenues $193.0 $253.8 $229.7 $266.3 $942.8 Y/Y 5% 37% 35% 21% 24% Y/Y – CC -2% 23% 28% 22% 18% APAC revenues $128.8 $135.9 $136.8 $137.9 $539.4 Y/Y 8% 0% 8% 4% 5% Y/Y – CC 10% -3% 6% 5% 4% Total revenues $678.5 $729.9 $709.1 $801.6 $2,919.1 Y/Y 13% 10% 12% 11% 11% Y/Y – CC 11% 6% 10% 12% 10%

Total Oncology revenues by sales classification 32 CC – Constant currency $M 1Q FY18 2Q FY18 3Q FY18 4Q FY18 FY18 Product revenues $338.3 $363.7 $326.9 $402.1 $1,431.0 Y/Y 20% 9% 29% 15% 17% Y/Y – CC 18% 7% 26% 15% 15% Service revenues $311.1 $334.3 $340.3 $353.5 $1,339.2 Y/Y 8% 13% 10% 11% 10% Y/Y – CC 6% 11% 7% 12% 8% Total revenues $649.4 $698.0 $667.2 $755.6 $2,770.2 Y/Y 14% 10% 18% 13% 14% Y/Y – CC 12% 6% 16% 14% 12% Product as a percentage of total Oncology Systems revenues 52% 52% 49% 53% 52% Service as a percentage of total Oncology Systems revenues 48% 48% 51% 47% 48% Oncology Systems revenues as a percentage of total revenues 96% 96% 94% 94% 95%

Total Oncology revenues by region 33 CC – Constant currency $M 1Q FY18 2Q FY18 3Q FY18 4Q FY18 FY18 Americas revenues $337.4 $321.2 $323.2 $369.5 $1,351.3 Y/Y 16% -3% 13% 6% 8% Y/Y – CC 16% -3% 13% 7% 8% EMEA revenues $183.5 $241.2 $208.5 $250.0 $883.2 Y/Y 9% 44% 32% 27% 28% Y/Y – CC 2% 29% 24% 28% 21% APAC revenues $128.5 $135.6 $135.5 $136.1 $535.7 Y/Y 15% 2% 13% 9% 10% Y/Y – CC 17% 0% 11% 10% 9% Total revenues $649.4 $698.0 $667.2 $755.6 $2,770.2 Y/Y 14% 10% 18% 13% 14% Y/Y – CC 12% 6% 16% 14% 12%

Total Proton revenues by sales classification 34 $M 1Q FY18 2Q FY18 3Q FY18 4Q FY18 FY18 Product revenues $27.3 $30.1 $38.1 $43.4 $138.9 Y/Y 2% 0% -43% -12% -19% Service revenues $1.8 $1.8 $3.8 $2.6 $10.0 Y/Y -49% 61% 95% -23% 0% Total revenues $29.1 $31.9 $41.9 $46.0 $148.9 Y/Y -4% 2% -39% -12% -18% VPT revenues as a percentage of total revenues 4% 4% 6% 6% 5%
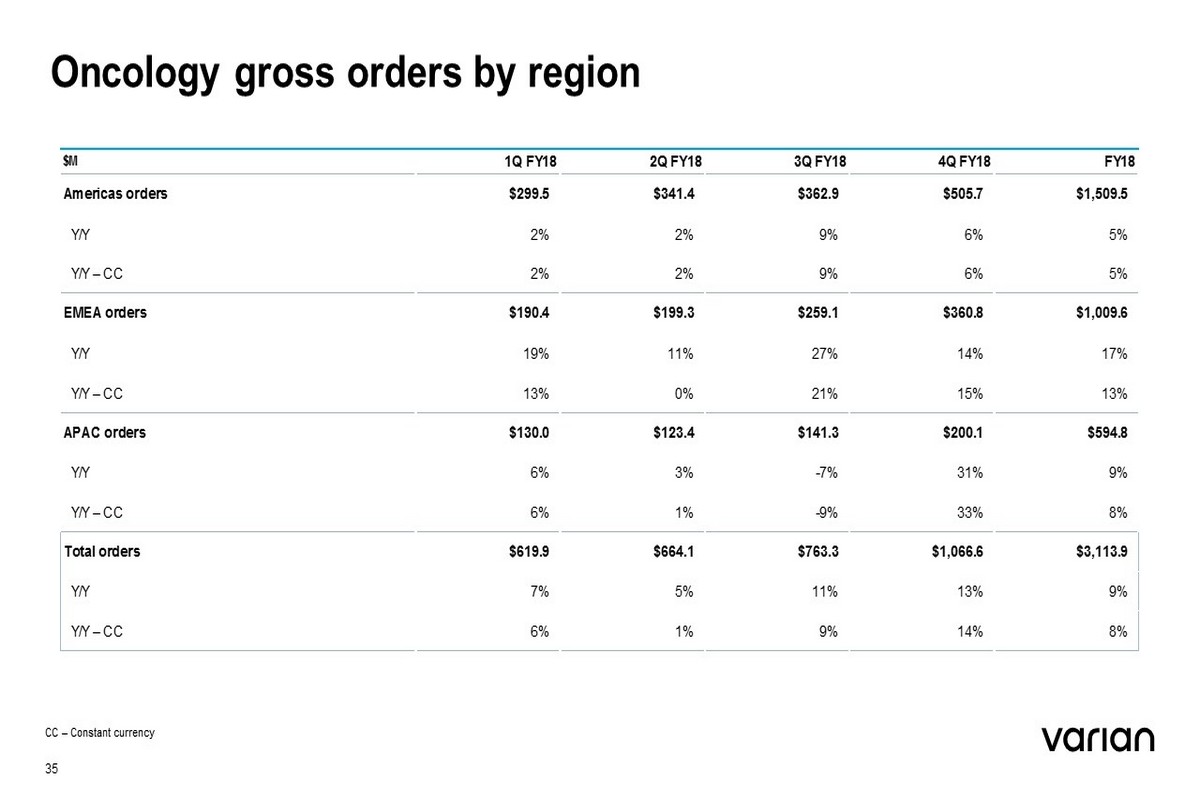
Oncology gross orders by region 35 CC – Constant currency $M 1Q FY18 2Q FY18 3Q FY18 4Q FY18 FY18 Americas orders $299.5 $341.4 $362.9 $505.7 $1,509.5 Y/Y 2% 2% 9% 6% 5% Y/Y – CC 2% 2% 9% 6% 5% EMEA orders $190.4 $199.3 $259.1 $360.8 $1,009.6 Y/Y 19% 11% 27% 14% 17% Y/Y – CC 13% 0% 21% 15% 13% APAC orders $130.0 $123.4 $141.3 $200.1 $594.8 Y/Y 6% 3% -7% 31% 9% Y/Y – CC 6% 1% -9% 33% 8% Total orders $619.9 $664.1 $763.3 $1,066.6 $3,113.9 Y/Y 7% 5% 11% 13% 9% Y/Y – CC 6% 1% 9% 14% 8%

Our promise 36 People powering victories Imagine a world without fear of cancer. We do, every day. We innovate new technologies for treating cancer and for connecting clinical teams to advance patient outcomes. Through ingenuity we inspire new victories and empower people in the fight against cancer. We are Varian.