Attached files
| file | filename |
|---|---|
| EX-32.2 - EXHIBIT 32.2 - VARIAN MEDICAL SYSTEMS INC | fy17exhibit_322.htm |
| EX-32.1 - EXHIBIT 32.1 - VARIAN MEDICAL SYSTEMS INC | fy17exhibit_321.htm |
| EX-31.2 - EXHIBIT 31.2 - VARIAN MEDICAL SYSTEMS INC | fy17exhibit_312.htm |
| EX-31.1 - EXHIBIT 31.1 - VARIAN MEDICAL SYSTEMS INC | fy17exhibit_311.htm |
| EX-23 - EXHIBIT 23 - VARIAN MEDICAL SYSTEMS INC | fy17exhibit23.htm |
| EX-21 - EXHIBIT 21 - VARIAN MEDICAL SYSTEMS INC | fy17exhibit21.htm |
UNITED STATES
SECURITIES AND EXCHANGE COMMISSION
Washington, D.C. 20549
FORM 10-K
ý | ANNUAL REPORT PURSUANT TO SECTION 13 or 15(d) OF THE SECURITIES EXCHANGE ACT OF 1934 |
For the fiscal year ended September 29, 2017
OR
¨ | TRANSITION REPORT PURSUANT TO SECTION 13 OR 15(d) OF THE SECURITIES EXCHANGE ACT OF 1934 |
For the transition period from to
Commission File Number: 1-7598
VARIAN MEDICAL SYSTEMS, INC.
(Exact name of Registrant as specified in its charter)
Delaware | 94-2359345 |
(State or other jurisdiction of incorporation or organization) | (I.R.S. Employer Identification Number) |
3100 Hansen Way, Palo Alto, California | 94304-1038 |
(Address of principal executive offices) | (Zip Code) |
(650) 493-4000
(Registrant’s telephone number, including area code)
Securities registered pursuant to Section 12(b) of the Act:
Title of each class | Name of each exchange on which registered | |
Common Stock, $1 par value | New York Stock Exchange | |
Securities registered pursuant to Section 12(g) of the Act: None
Indicate by check mark if the Registrant is a well-known seasoned issuer, as defined in Rule 405 of the Securities Act. Yes ý No ¨
Indicate by check mark if the Registrant is not required to file reports pursuant to Section 13 or Section 15(d) of the Act. Yes ¨ No ý
Indicate by check mark whether the Registrant: (1) has filed all reports required to be filed by Section 13 or 15(d) of the Securities Exchange Act of 1934 during the preceding 12 months (or for such shorter period that the registrant was required to file such reports), and (2) has been subject to such filing requirements for the past 90 days. Yes ý No ¨
Indicate by check mark whether the Registrant has submitted electronically and posted on its corporate Web site, if any, every Interactive Data File required to be submitted and posted pursuant to Rule 405 of Regulation S-T during the preceding 12 months (or for such shorter period that the registrant was required to submit and post such files). Yes ý No ¨
Indicate by check mark if disclosure of delinquent filers pursuant to Item 405 of Regulation S-K is not contained herein, and will not be contained, to the best of Registrant’s knowledge, in definitive proxy or information statements incorporated by reference in Part III of this Form 10-K or any amendment to this Form 10 K ý
Indicate by check mark whether the Registrant is a large accelerated filer, an accelerated filer, a non-accelerated filer, smaller reporting company, or an emerging growth company. See the definitions of “large accelerated filer,” “accelerated filer,” “smaller reporting company,” and "emerging growth company" in Rule 12b-2 of the Exchange Act. (Check one):
Large accelerated filer x | Accelerated filer o | |||||
Non-accelerated filer o | Smaller reporting company o | |||||
(Do not check if a smaller reporting company) | Emerging growth company o | |||||
If an emerging growth company, indicate by check mark if the registrant has elected not to use the extended transition period for complying with any new or revised financial accounting standards provided pursuant to Section 13(a) of the Exchange Act. ¨
Indicate by check mark whether the Registrant is a shell company (as defined in Rule 12b-2 of the Exchange Act). Yes ¨ No ý
As of March 31, 2017, the last business day of Registrant’s most recently completed second fiscal quarter, the aggregate market value of shares of Registrant’s common stock held by non-affiliates of Registrant (based upon the closing sale price of such shares on the New York Stock Exchange on March 31, 2017) was $8,340,019,028. Shares of Registrant’s common stock held by the Registrant’s executive officers and directors and by each entity that owned 10% or more of Registrant’s outstanding common stock have been excluded in that such persons may be deemed to be affiliates. This determination of affiliate status is not necessarily a conclusive determination for other purposes.
At November 21, 2017, the number of shares of the Registrant’s common stock outstanding was 91,616,924.
DOCUMENTS INCORPORATED BY REFERENCE
Definitive Proxy Statement for the Company’s 2018 Annual Meeting of Stockholders—Part III of this Form 10 K
VARIAN MEDICAL SYSTEMS, INC.
INDEX
Page | ||
FORWARD-LOOKING STATEMENTS
This Annual Report on Form 10-K (this “Annual Report”), including the Management’s Discussion and Analysis of Financial Condition and Results of Operations (“MD&A”), contains “forward-looking statements” within the meaning of the Private Securities Litigation Reform Act of 1995, which provides a “safe harbor” for statements about future events, products and future financial performance that are based on the beliefs of, estimates made by and information currently available to the management of Varian Medical Systems, Inc. (“VMS”) and its subsidiaries (collectively “we,” “our,” “Varian” or the “Company”). The outcome of the events described in these forward-looking statements is subject to risks and uncertainties. Actual results and the outcome or timing of certain events may differ significantly from those projected in these forward-looking statements due to the factors listed under Item 1A, “Risk Factors,” MD&A and disclosed from time to time in our other filings with the Securities and Exchange Commission (“SEC”). For this purpose, statements concerning: industry or market segment outlook; market acceptance of or transition to new products or technology such as fixed field intensity-modulated radiation therapy, image-guided radiation therapy, stereotactic radiosurgery, volumetric modulated arc therapy, brachytherapy, software, treatment techniques, proton therapy; growth drivers; future orders, revenues, backlog, earnings or other financial results; and any statements using the terms “believe,” “expect,” “anticipate,” “can,” “should,” “would,” “could,” “estimate,” “may,” “intended,” “potential,” and “possible” or similar statements are forward-looking statements that involve risks and uncertainties that could cause our actual results and the outcome and timing of certain events to differ materially from those projected or management’s current expectations. By making forward-looking statements, we have not assumed any obligation to, and you should not expect us to, update or revise those statements because of new information, future events or otherwise.
PART I
Item 1. Business
Overview
We, Varian Medical Systems, Inc., are a Delaware corporation originally incorporated in 1948 as Varian Associates, Inc. We are the world’s leading manufacturer of medical devices and software for treating cancer and other medical conditions with radiotherapy, stereotactic radiosurgery, stereotactic body radiotherapy, brachytherapy and proton therapy. Our mission is to combine the ingenuity of people with the power of data and technology to achieve new victories against cancer. To meet this challenge, we offer comprehensive solutions for fighting cancer.
Our operations are currently grouped into two reportable operating segments: Oncology Systems and Varian Particle Therapy ("VPT"). In the first quarter of fiscal year 2017, our Ginzton Technology Center ("GTC") business, previously reflected in the "Other" category, was dissolved and absorbed primarily into our Oncology Systems segment and our former Imaging Components business, which was distributed as Varex Imaging Corporation (“Varex”), and is no longer part of continuing operations. See “Distribution” below. The operating segments were determined based on how our Chief Executive Officer, who is our Chief Operating Decision Maker (“CODM”), views and evaluates our operations. The CODM allocates resources to and evaluates the financial performance of each operating segment primarily based on operating earnings.
Long-term growth and value creation strategy. We are focused on cancer care solutions and well-positioned to positively influence more and more patients globally every day by bringing smarter and simpler solutions to healthcare providers. Our long-term growth and value creation strategy is to transform our company from the global leader in radiation therapy to become the global leader in multidisciplinary, integrated cancer care solutions. We intend to leverage our deep customer relationships, human-centered design, scale and financial strength to selectively broaden our capabilities to capitalize on industry trends. To achieve these long-term objectives, we are focused on driving growth through strengthening our leadership in radiation therapy, extending our global footprint and expanding into other addressable markets.
Distribution. On January 28, 2017 (the "Distribution Date"), we completed the separation and distribution (the "Distribution") of Varex, our former Imaging Components business segment. On the Distribution Date, each of our stockholders of record as of the close of business on January 20, 2017 (the "Record Date") received 0.4 of a share of Varex common stock for every one share of our common stock as of the Record Date. Varex is now an independent publicly traded company and is listed on The NASDAQ Global Select Market under the ticker symbol "VREX." Varian continues to trade on the New York Stock Exchange under the ticker symbol "VAR." see Note 2, "Discontinued Operations" of the Notes to the Consolidated Financial Statements.
Oncology Systems. Our Oncology Systems business designs, manufactures, sells and services hardware and software products for treating cancer with conventional radiotherapy, and advanced treatments such as fixed field intensity-modulated radiation therapy (“IMRT”), image-guided radiation therapy (“IGRT”), volumetric modulated arc therapy (“VMAT”), stereotactic radiosurgery (“SRS”), stereotactic body radiotherapy (“SBRT”) and brachytherapy. Our software solutions also include
1
informatics software for information management, clinical knowledge exchange, patient care management, practice management and decision-making support for comprehensive cancer clinics, radiotherapy centers and medical oncology practices.
Our hardware products include linear accelerators, brachytherapy afterloaders, treatment simulation and verification equipment and accessories; and our software products include information management, treatment planning, image processing, clinical knowledge exchange, patient care management, decision-making support and practice management software. Our products enable radiation oncology departments in hospitals and clinics to perform conventional radiotherapy treatments and advanced treatments such as IMRT, IGRT, VMAT, SRS and SBRT, as well as the treatment of patients using brachytherapy techniques, which involves the temporary application of radioactive sources. Our products are also used by surgeons and radiation oncologists to perform stereotactic radiosurgery. Our software products help improve physician engagement and clinical knowledge-sharing, patient care management and management of cancer clinics, radiotherapy centers and oncology practices for better performance. Our worldwide customers include university research and community hospitals, private and government institutions, healthcare agencies, physicians’ offices, oncology practices, radiotherapy centers and cancer care clinics.
Varian Particle Therapy. Our VPT business develops, designs, manufactures, sells and services products and systems for delivering proton therapy, another form of external beam radiotherapy using proton beams, for the treatment of cancer. Although proton therapy has been in clinical use for more than four decades, it has not been widely deployed due to high capital cost. Our current focus is bringing our expertise in traditional radiation therapy to proton therapy to improve its clinical utility and to reduce its cost of treatment per patient, so that it is more widely accepted and deployed.
The Americas region includes North America (primarily United States and Canada) and Latin America. The EMEA region includes Europe, Russia, the Middle East, India and Africa. The APAC region primarily includes East and Southeast Asia and Australia.
Our business is subject to various risks and uncertainties. You should carefully consider the factors described in Item 1A, “Risk Factors” in conjunction with the description of our business set forth below and the other information included in this Annual Report on Form 10-K.
Radiation Therapy and the Cancer Care Market
Radiotherapy is the use of certain types of focused energy to kill cancer cells and shrink tumors. Radiotherapy is commonly used either alone or in combination with surgery, chemotherapy or targeted drugs. One important advantage is that radiation has its greatest effect on replicating cells. When radiation interacts with a cell the therapeutic effect is primarily mediated by damaging cellular genetic material (chromosomes), which interrupts cell replication and results in eventual cellular death. Since the need for replication is particularly critical to the survival of a cancer and since normal tissues are better able to repair such damage, radiation tends to disproportionately kill cancer cells. The clinical goal in radiation oncology is to deliver the highest possible radiation dose directly to the tumor to kill the cancerous cells while minimizing radiation exposure to surrounding healthy tissue in order to limit or avoid complications, side effects and secondary effects caused by the treatment. This goal has been the driving force in clinical care advancements in radiation oncology over the past two decades, from conventional radiotherapy to advanced forms of treatment such as IMRT, IGRT, VMAT, SRS, SBRT and proton therapy.
The process for delivering radiotherapy typically consists of examining the patient, planning the treatment, simulating and verifying the treatment plan, providing quality assurance for the equipment and software, delivering the treatment, verifying that the treatment was delivered correctly and recording the history and results of the treatment. The team responsible for delivering the radiotherapy treatment generally is comprised of a physician specializing in radiation oncology, a medical physicist or dosimetrist for planning patient treatments, a medical physicist for conducting appropriate quality assurance procedures and a radiation therapist for positioning the patients for treatment and operating the machines.
The most common form of radiotherapy involves delivering X-ray beams from outside of the patient’s body, a process sometimes referred to as external beam radiotherapy. A device called a medical linear accelerator generates the high-energy X-ray beams and delivers the radiation to the patient lying on a treatment couch. The radiation source rotates around a patient delivering the radiation beam that is shaped to the tumor from different angles. This concentrates radiation at the tumor while at the same time minimizing the dose delivered to the surrounding healthy tissue. Conventional radiotherapy typically involves multiple, or fractionated, treatments of a tumor in up to 50 treatment sessions. The linear accelerator may also deliver electron beams for the treatment of diseases closer to the body surface.
2
IMRT is an advanced form of external beam radiotherapy in which the shape and intensity of the radiation beams are varied optimally (modulated) across the target region. IMRT allows the radiation dose to be more precisely conformed to the volume of the tumor, allowing physicians to deliver higher doses of radiation to the tumor than conventional radiation treatments, while limiting radiation dose to nearby healthy tissue. In this way, clinicians can design and administer an individualized treatment plan for each patient, targeting the tumor within millimeters. IMRT can be used to treat head and neck, breast, prostate, pancreatic, lung, liver, gynecological and central nervous system cancers. IMRT has become a well-accepted standard of treatment for cancer, and every year additional treatment centers, from university hospitals to local community clinics, adopt IMRT for their treatments. We are a leading global provider of products that enable IMRT for the treatment of cancer.
VMAT is a significant further advancement in IMRT that allows physicians to control three parameters simultaneously: (i) the rate at which the linear accelerator gantry rotates around the patient, (ii) the beam-shaping aperture and (iii) the rate at which the radiation dose is delivered to the patient. This creates a finely-shaped IMRT dose distribution that more closely matches the size and shape of the tumor, with faster treatment times. Our RapidArc® radiotherapy products plan and deliver VMAT treatments.
Physicians, hospitals and clinics place additional value on radiotherapy equipment and treatments, such as VMAT, that enable shorter treatment times and greater patient throughput. From the patient’s standpoint, reduced treatment times means that the patient is immobilized on the treatment couch for a shorter time period. Shorter treatment sessions decrease waiting times and, since treatments are delivered in fractions over the course of many days, can mean fewer disruptions to a patient’s daily routine. From the physicians’ and hospitals’ standpoint, shorter treatment times can lessen the chance of tumors moving during treatment and can increase patient throughput. Shorter treatment times and increased patient throughput can increase the number of treatments per day (which is a particular concern in countries with lower numbers of treatment machines per capita), and, as a result, can decrease the cost per treatment which in turn can mean greater access to advanced care for more patients.
IGRT is another advanced form of external beam radiotherapy complementing IMRT to enhance treatments. While IMRT helps physicians more precisely conform the beam to the tumor, IGRT allows physicians to see how a tumor moves or shrinks during a course of treatment, thereby improving treatment accuracy. This allows clinicians to tighten the margin of certainty around the tumor and spare more of the surrounding healthy tissue, potentially improving outcomes. We believe IGRT has become an accepted standard for treatment in the radiation oncology community.
SRS and SBRT, often collectively referred to as radiosurgery, are advanced ablative radiation treatment procedures performed in a small number of treatment sessions with high doses of radiation. Radiosurgery typically incorporates advanced image-guidance to focus many small beams of radiation from many orientations precisely on the target and to minimize the dose to surrounding normal tissues. Radiation oncologists, surgeons and other oncology specialists increasingly recognize radiosurgery as a useful tool to treat cancerous and non-cancerous lesions anywhere in the body.
An alternative to external beam radiotherapy, brachytherapy involves the insertion of radioactive seeds, wires or ribbons directly into a tumor or body cavity near the tumor. These techniques tend to irradiate much less surrounding healthy tissue so that physicians can prescribe a higher total dose of radiation, typically over a shorter period of time. Brachytherapy is often used for cancers of the head and neck, breast, uterus, cervix, soft tissue and prostate.
Proton therapy is another form of external beam radiotherapy that uses proton particles in the form of a beam generated with a cyclotron rather than X-ray beams from a linear accelerator. A proton beam’s signature energy distribution curve, also known as the “Bragg peak,” allows for greater precision in targeting tumor cells with an even lower dose to nearby healthy tissue than may be delivered with X-ray beams from a linear accelerator. This makes proton therapy a preferred option for treating certain cancers, particularly cancers in children and tumors near critical structures such as the optic nerve. Pencil-beam scanning capability, which is an advanced way of delivering the proton beam, allows for greater sparing of healthy tissue compared to fan-beam scanning of the proton beam and external beam radiotherapy treatments. Although proton therapy has been in clinical use for more than four decades, it has not been widely deployed due to its high capital cost and the market is still developing. We believe we can apply our experience in traditional radiotherapy to proton therapy, reducing the cost of treatment per patient for existing clinical applications and expanding the use of proton therapy into a broader array of cancer types. We believe that proton therapy will over time become a more widely accepted method of treatment.
The radiation oncology market is growing globally due to a number of factors. Worldwide, the number of new cancer cases diagnosed annually is projected to increase from approximately 14 million in 2012 to almost 25 million by 2030, according to the September 2015 Lancet Oncology report compiled by the Global Task Force on Radiotherapy for Cancer Control. In addition, technological advancements have helped to improve the precision and applicability of radiotherapy and radiosurgery, potentially expanding the use of radiotherapy and radiosurgery equipment to treat a broader range of cases. Technological
3
advances in hardware and software are also creating a market for replacing an aging installed base of machines that are unable to deliver new, higher standards of care.
The rise in cancer cases, together with the increase in sophistication of new treatment protocols, have created demand for more automated products that can be integrated into clinically practical systems to make treatments more rapid and cost effective. Technology advances leading to improvements in patient care, the availability of more advanced, automated and efficient clinical tools in radiation therapy, the advent of more precise forms of radiotherapy treatment (such as IMRT, IGRT, VMAT, SRS, SBRT, brachytherapy and proton therapy), and developing technology and equipment (such as EDGE™ and TrueBeam™) that enable treatments that reduce treatment times and increase patient throughput should drive the demand for our radiation therapy products and services.
International markets in particular are under-equipped to address the growing cancer incidence. Patients in many foreign countries must frequently endure long waits for radiotherapy. According to a peer-reviewed publication in the International Journal of Radiation Oncology Biology and Physics in 2014, radiotherapy is required in more than half of new cancer patients, particularly in low- and middle-income countries, and according to an article published in Seminars in Radiation Oncology in 2017, it is estimated that more than 12,000 additional treatment machines will be required by 2035 in these countries alone. For example, China, India and Brazil are estimated to require over 3,800, 1,200 and 400 additional machines, respectively, by 2035. The ever-increasing incidences of cancer and the demand for additional treatment machines in these regions represent additional drivers for our continued growth in international markets.
Products
Oncology Systems
Our Oncology Systems business is the leading provider of advanced hardware and software products for treatment of cancer with conventional radiation therapy, and advanced treatments such as IMRT, IGRT, VMAT, SRS, SBRT and brachytherapy. Oncology Systems products address each major aspect of the radiotherapy process, including linear accelerators and accessory products for positioning the patient and delivering the X-ray beam; brachytherapy afterloaders for delivering radioactive implantable seeds; treatment planning software for planning treatment sessions and dose delivery; treatment simulation and verification equipment and quality assurance software for simulating and verifying treatment plans before treatment as well as verification of correct treatment delivery; and information management software for recording the history and results of treatments and other patient treatment information and data, including patient images.
The focus of our Oncology Systems business is addressing the key concerns of the market for advanced cancer care systems; improving efficiency, precision, cost-effectiveness and ease of delivery of these treatments; and providing greater access to advanced treatments. A core element of our business strategy is to provide our customers with highly versatile, proven products that are interoperable and can be configured and integrated into automated systems that combine greater precision, shorter treatment times and greater cost effectiveness and that improve the entire process of treating a patient. Our products and accessories for IMRT and IGRT allow clinicians to track and treat tumors using very precisely shaped beams, targeting the tumor as closely as currently possible and allowing the delivery of higher doses of radiation to the tumor while limiting exposure of nearby healthy tissue. Additionally, the precision and versatility of our products and technology make it possible to use radiotherapy to treat metastatic cancers. With our treatment planning, verification and information management software products, a patient’s treatment plans, treatment data and images are recorded and stored in a single database shared by each of our products, which enables better communication among products. Our products also allow multiple medical specialties - radiation oncology, neurosurgery, diagnostic radiology and medical oncology, as well as clinicians in multiple locations - to share equipment, resources and information in a more efficient, cost-effective manner. Furthermore, the ability of our products and technology to interoperate with each other and to interconnect into automated systems allows physicians to schedule and treat more patients within a set time period, which adds to the cost-effectiveness of our equipment.
Medical linear accelerators are the core device for delivering conventional external beam radiotherapy, IMRT, IGRT, VMAT, SRS and SBRT, and we produce versions of these devices to suit various clinical requirements. In May 2017, we introduced our Halcyon™ treatment system, our newest device for cancer treatment. We received a CE mark for the Halcyon system in May 2017 and FDA 510(k) clearance in June 2017. The Halcyon system has been designed on a platform of next generation technology including a full field ring gantry design that operates at 4RPM, an innovative stacked and staggered multi-leaf collimator design, virtually silent magnetic drive motors and solid-state modulators. This new platform is the smallest footprint linear accelerator in our portfolio, uses less energy, and has been designed with a human centered user experience concept that benefits both the patient as well as the health care practitioner for simplicity of treatment and use. At the high end, the TrueBeam and EDGE systems for image-guided radiotherapy and radiosurgery are fully-integrated high-energy systems designed from the ground up to treat a moving target with higher speed and accuracy and complement our accelerator product
4
line portfolio. The Clinac® iX linear accelerators deliver high-energy X-ray beams and are designed for more streamlined and advanced treatment processes, including IMRT and IGRT. We also produce the Trilogy™ linear accelerator, designed to be a versatile, cost-effective, precise high-energy device with a faster dose delivery rate and more precise isocenter compared to the Clinac iX. Our UNIQUE™ medical linear accelerator is a low-energy linear accelerator for the more price sensitive emerging markets, designed to meet the evolving needs of our IMRT and IGRT customers in these markets.
Our Millennium™ series of multi-leaf collimators and High Definition 120 (“HD 120”) multi-leaf collimators are used with a linear accelerator to define the size, shape and intensity of the generated beams. PortalVision™, our electronic portal-imager, is used to verify a patient’s position while on the treatment couch, which is critical for accurate treatments and simplifies quality assurance of individual treatment plans. We also offer an innovative real-time patient position monitoring product, the RPM™ respiratory gating system, which allows the linear accelerator to be synchronized with patient breathing to help compensate for tumor motion during treatment. In addition, we manufacture the Calypso® system (some features not approved for use in all markets), which can continuously track and monitor the position of implanted and surface Beacon® transponders. This technology allows the treatment beam to be precisely aimed to deliver the full, prescribed dose to the tumor, and minimize exposure of surrounding healthy tissues.
We also offer the EDGE radiosurgery suite, a combination of products for performing advanced radiosurgery using new real-time tumor tracking technology and motion management capabilities. The EDGE radiosurgery suite includes the EDGE radiosurgery accelerator and the Calypso System with Dynamic Edge™ Gating, and the PerfectPitch™ Couch with six degrees of freedom to accurately and precisely align the patient position. Our IGRT accessories include the On-Board Imager® (“OBI”) hardware accessory affixed to the linear accelerator that allows dynamic, real-time imaging of tumors while the patient is on the treatment couch and offers cone-beam computerized tomography (“CBCT”) imaging software capability to allow patient positioning based on soft-tissue anatomy. Using sophisticated image analysis tools, the CBCT scan can be compared with a reference CT scan taken previously to determine how the treatment couch should be adjusted to fine-tune and verify the patient’s treatment setup and positioning prior to delivery of the radiation. To deliver the most advanced forms of IGRT, our accelerators would typically have an OBI, CBCT, PortalVision and other IGRT-related hardware and software as accessories.
Our RapidArc radiotherapy products are a proprietary implementation of VMAT that coordinates beam shaping, dose rate and gantry speed to deliver a highly conformal dose distribution to the target tumor. RapidArc products enable the planning and delivery of image-guided IMRT in a single continuous rotation of up to 360 degrees rather than as a series of fixed fields. Our RapidArc products enable faster delivery of radiation treatment with the possibility of reduced opportunity for tumor movement during treatment, as well as greater patient throughput and lower cost per patient for the hospital or clinic. We believe RapidArc represents a significant advancement in IMRT cancer treatment.
Our HyperArcTM High-Definition Radiotherapy product is designed to simplify, automate and improve the quality of intracranial SRS, making SRS accessible to more clinics and patients around the world. HyperArc received a CE mark in August 2017 and FDA 510(k) clearance in September 2017 and is currently available for sale in the United States and other global markets where a CE mark is applicable. We expect that HyperArc will significantly improve the quality and efficiency of sophisticated SRS procedures. HyperArc is available only on the TrueBeam and Edge platforms.
Our software products enhance and enable the delivery of advanced radiotherapy treatments, from the initial treatment planning and plan quality assurance verification to the post-treatment recording of data and storing of patient information, as well as help improve physician engagement and clinical knowledge-sharing, patient care management and management of cancer clinics, radiotherapy centers and oncology practices for better performance. Prior to any treatment, physicians must prescribe, or plan, the course of radiation delivery for the patient. We offer a range of treatment planning products that assist physicians in designing this plan. Our Eclipse™ treatment planning system provides physicians with 3D image viewing, treatment simulation, radiation dosage calculation and verification and other tools for generating treatment delivery plans for the patient. The Eclipse software utilizes a sophisticated technique known as inverse planning to enable physicians to rapidly develop optimal treatment plans based on a desired radiation dose outcome to the tumor and surrounding tissue. Our RapidPlan™ Knowledge-based Planning tool creates a new category for treatment planning systems in which statistical models can be used to predict the achievable quality of an IMRT treatment from a patient’s anatomy. RapidPlan is designed to streamline the planning process by using shared clinical knowledge embedded in its statistical plan models. Clinics may use plan models included with Eclipse or can create models based on their own treatment methods and protocols.
We continue to enhance our treatment planning software products and work to integrate multi-criteria optimization radiotherapy treatment planning algorithms licensed from the Fraunhofer Institute that enable clinicians to quickly navigate solution space to find the ideal treatment plan for each patient. We aim to incorporate this technology along with other treatment planning software tools to enhance both treatment planning efficiency and quality.
5
Our software product offerings also include Varian Treatment™, which connects ARIA® Oncology Information Management System (“ARIA”) to third party linear accelerators and expands our software support of third party manufacturers.
The ARIA information system is a comprehensive real-time information management system and database that records and verifies radiotherapy treatments carried out on the linear accelerator, records and stores patient data relating to chemotherapy treatment which may be prescribed by a physician in addition to radiotherapy, performs patient charting and manages patient information and patient image data. This gives clinics and hospitals the ability to manage treatment and patient information across radiation oncology and medical oncology procedures. Also, because ARIA is an electronic medical record, it can enable users to operate filmless and paperless oncology departments and cancer clinics. ARIA is ARRA-HITECH Stage II certified and supports the ICD-10 billing codes. Our FullScale™ oncology-specific information technology solutions take advantage of virtualization or cloud technologies to deploy our ARIA oncology information and Eclipse treatment planning systems in a way that enables treatment centers to take advantage of economies of scale. We have from time to time entered into agreements with a variety of companies to increase the capabilities of our ARIA Information Systems software.
Our Insightive™ analytics software solution aggregates clinical and operational data and allows for improved decision making and practice management. Insightive enables oncology administrators and clinicians to use real-time information to discover patterns and trends through interactive dashboards and visualizations. We also created an interactive online group on the OncoPeer™ platform for clinicians to share knowledge-based cancer treatment models that can improve the efficiency and quality of cancer care across multiple institutions. The OncoPeer cloud community is a platform where oncologists, clinicians and other oncology professionals can publish knowledge, share data, exchange treatment techniques and discuss best practices within a professional oncology network.
Our Velocity™ software provides solutions at the clinical process level to aggregate unstructured treatment and imaging data from diverse systems. It allows for a more comprehensive view of a patient’s diagnostic imaging and treatment history and helps clinicians make more informed treatment decisions.
Qumulate™ is our cloud-based software technology that collects and analyzes machine performance data in a radiation therapy department and allows users to compare their machine performance data and trends against a community of users’ data.
360 Oncology™ is a care management platform designed to integrate and coordinate key elements of cancer care so patients and their cancer teams can collaborate on achieving the best outcomes. In a single platform, 360 Oncology brings together radiation, medical and surgical oncology, social services, primary care physicians, as well as the patient, to facilitate true collaborative and coordinated care. It enables tumor boards to more effectively coordinate patient care among the numerous specialists involved in cancer treatment. With Varian 360 Oncology care management, a clinic’s data, records and patient information are connected through a single platform, enabling the entire cancer-fighting team to coordinate care.
In addition to offering our own suite of equipment and software products for planning and delivering radiotherapy treatments, we have partnered with selected leaders in certain segments of the radiation therapy and radiosurgery market. In October 2016, we established a three-year strategic agreement with McKesson to supply its US Oncology Network and Vantage Oncology affiliated sites of care with treatment delivery systems and planning, service and radiotherapy information system solutions. Under the agreement, we are collaborating with McKesson to establish interoperability between our Aria product and McKesson IT solutions which we anticipate will facilitate access to McKesson's networks for future conversion to Aria, Eclipse and Velocity at sites that do not currently utilize these solutions. We have a strategic global partnership with Siemens AG (“Siemens”) through which, among other things, we represent Siemens diagnostic imaging products to radiation oncology clinics in most global markets, and Siemens, in turn, represents our equipment and software products for radiotherapy and radiosurgery to its healthcare customers in agreed upon countries. Furthermore, we and Siemens have developed interfaces to enable ARIA and Eclipse to connect with Siemens linear accelerators and imaging systems, and are exploring opportunities to co-develop new imaging and treatment solutions. We hold a minority equity interest in Augmenix, Inc. (“Augmenix”), a company that is developing hydrogel products to decrease irradiation of radiation sensitive tissue such as the rectum, as well as in Grail, Inc., a life sciences company developing blood tests for early-stage cancer detection, and Fusion Pharmaceuticals Inc., a clinical stage company focused on developing targeted alpha-particle radiotherapeutics for the treatment of cancer.
Our brachytherapy operations design, manufacture, sell and service advanced brachytherapy products, including VariSource™ HDR afterloaders and GammaMed™ HDR/PDR afterloaders, BrachyVision™ brachytherapy treatment planning system, applicators and accessories. Brachytherapy also develops and markets the VariSeed™ LDR prostate treatment planning system and the Vitesse™ software for real-time treatment planning for HDR prostate brachytherapy.
Revenues from our Oncology Systems business represented 93%, 94% and 94% of total revenues for fiscal years 2017, 2016 and 2015, respectively. Our Oncology Systems business revenues include revenue from product and service. Product revenues
6
in Oncology Systems accounted for 52%, 55% and 55% of total revenues for fiscal years 2017, 2016 and 2015, respectively. Service revenues in Oncology Systems accounted for 41%, 39% and 39% of total revenues for fiscal years 2017, 2016 and 2015, respectively. See further discussion in “Customer Services and Support.” For a discussion of Oncology Systems business segment financial information, see Note 17, "Segment Information" of the Notes to the Consolidated Financial Statements.
Varian Particle Therapy
Our VPT business develops, designs, manufactures, sells and services products and systems for delivering proton therapy, another form of external beam therapy using proton beams, for the treatment of cancer. Our ProBeam® system is capable of delivering precise intensity modulated proton therapy (“IMPT”) using pencil beam scanning technology. During fiscal year 2016, we booked our first ProBeam Compact order. ProBeam Compact is our lower cost, single room proton therapy product launched in fiscal year 2014. Proton therapy is a preferred option for treating certain cancers, particularly tumors near critical structures such as the optic nerve and pediatric cancers. Although proton therapy has been in clinical use for more than four decades, it has not been widely deployed due to high capital cost. Proton therapy facilities are large-scale construction projects that are time consuming, involve significant customer investment and often complex project financing.
Our VPT technology and systems are in operation at the Paul Scherrer Institute in Villigen, Switzerland, the Rinecker Proton Therapy Center in Munich, Germany, the Scripps Proton Therapy Center in San Diego, California, the Maryland Proton Therapy Center ("MPTC") in Baltimore, Maryland and the Proton Therapy Center at Cincinnati Children's Hospital in Liberty Township, Ohio.
During fiscal years 2017, 2016 and 2015, we recorded six, two, and six VPT proton therapy product orders, respectively.
In July 2017, we purchased the outstanding senior secured debt related to the Rinecker Proton Therapy Center ("RPTC") in Munich, Germany for 21.5 million Euros or $24.5 million. By purchasing the senior secured debt, we have a right to 89 million Euros in claims against all of RPTC's assets. In September 2017, the management of RPTC filed for bankruptcy in Germany. As of September 29, 2017, preliminary insolvency proceedings have not been finalized, but we expect the insolvency proceedings to be finalized within the next 12 months. Upon finalization of bankruptcy proceedings, we believe it is probable we will recover our outstanding senior secured debt balance and accounts receivable, net. As of September 29, 2017, we had $4.5 million in accounts receivable, net, for RPTC.
For certain proton therapy project orders, we may elect to provide a portion of the financing for the project, such as:
In July 2017, we committed to purchase up to $16.1 million in Senior Capital Appreciation Bonds ("Senior Bonds") from the Atlanta Development Authority, which is financing the Georgia Proton Therapy Center in Atlanta, Georgia. We purchased $4.3 million of the Senior Bonds in July 2017, with the balance to be purchased in July 2018.
In April 2017, we purchased $8.0 million in Subordinate Bonds from the Public Finance Authority, which is financing the Delray Radiation Therapy Center. In addition to the purchase of the Subordinate Bonds, we also loaned $3.0 million to Proton International LLC ("PI") to allow PI to purchase $3.0 million in Subordinate Bonds from the Public Finance Authority.
In July 2015, we committed to loan up to $91.5 million to MM Proton I, LLC in connection with a purchase agreement to supply a proton system to equip the New York Proton Center that included a senior first lien loan and a subordinated loan. In June 2016, we assigned to Deutsche Bank AG our entire $73.0 million senior first lien loan commitment. As of September 29, 2017, we have an outstanding loan balance of $18.5 million under the subordinated loan.
In May 2015, we committed to loan up to $35.0 million to MPTC. As of September 29, 2017, we have an outstanding loan balance of $35.0 million to MPTC. As of September 29, 2017, we have also recorded a $25.1 million long-term notes receivable related to a deferred payment arrangement with MPTC.
As of September 29, 2017, our outstanding loans ("Original CPTC Loans") to California Proton Treatment Center, LLC ("CPTC") to fund the development, construction and initial operations of the Scripps Proton Therapy Center were $47.4 million. In March 2017, we entered into a Debtor-in-Possession facility (the "DIP Facility") with the Lenders. Our pro rata share of the DIP Facility is $7.3 million. As of September 29, 2017, our outstanding loans under the DIP Facility were $5.1 million with the remaining amount expected to be funded over the next 12 months. In fiscal year 2017, we recorded $51.4 million in impairment charges and a $34.2 million allowance for doubtful accounts due to credit-related issues at CPTC.
See Note 16, "VPT Loans and Securities" of the Notes to the Consolidated Financial Statements for further discussion on our VPT financing arrangements.
7
Revenues from our VPT business represented 7%, 6% and 6% of total revenues in fiscal year 2017, 2016 and 2015, respectively. For a discussion of segment financial information, see Note 17, "Segment Information" of the Notes to the Consolidated Financial Statements.
Marketing and Sales
We employ a combination of direct sales forces and independent distributors or resellers for the marketing and sales of our products worldwide. Our gross orders and revenues reflect a growing percentage coming from international regions and particularly emerging markets. As a U.S.-based company, the competitiveness of our product pricing is influenced by the fluctuation of the U.S. Dollar against other currencies. A stronger U.S. Dollar against foreign currencies would make our product pricing more expensive and less competitive compared to products sold in non-U.S. Dollar currencies. A stronger U.S. Dollar against foreign currencies would also lower our international revenues and gross orders when measured in U.S. Dollars. These conditions affected our business and demand for our products in fiscal year 2015 and the first half of fiscal year 2016. In fiscal years 2017, 2016 and 2015, we did not have a single customer that represented 10% or more of our total revenues.
Oncology Systems
Our Oncology Systems business sells direct in the United States and Canada and uses a combination of direct sales and independent distributors in international regions.
Through our strategic global partnership with Siemens, we represent Siemens diagnostic imaging products to radiation oncology clinics in most global markets. Siemens represents our equipment and software products for radiotherapy and radiosurgery to its healthcare customers in agreed upon countries. We sell our Oncology Systems products primarily to university research and community hospitals, private and governmental institutions, healthcare agencies, physicians’ offices and cancer care clinics worldwide. These hospitals, institutes, agencies, physicians’ offices and clinics replace equipment and upgrade treatment capability as technology evolves. Sales cycles for our external beam radiotherapy products typically can be quite lengthy since many of them are considered capital equipment and are affected by budgeting cycles. Our customers frequently fix capital budgets one or more years in advance. In recent years, we have seen the purchasing cycle lengthen as a result of the more complex decision-making process associated with larger dollar value transactions for more sophisticated IGRT and surgical equipment, and other technical advances.
During the last economic downturn, we saw customers’ decision-making process further complicated and lengthened, especially in the United States, which caused hospitals, clinics and research institutions to more closely scrutinize and prioritize their capital spending in light of tightened capital budgets, tougher credit requirements, the general constriction in credit availability, and consolidation of providers. In addition, the last economic downturn caused customers to delay requested delivery dates. Because our product revenues are influenced by the timing of product shipments, which are tied to customer-requested delivery dates, these delivery delays increased the average order to revenue conversion cycle in the United States. Historically, this conversion cycle has been longer when new products are introduced or when we sell more products internationally. The lengthening of our order to revenue conversion cycle could reduce our revenues and margins. In addition, the same factors impacting the order to revenue conversion cycle may extend the receivables collection cycle and potentially increase bad debts.
Over the last few years, we have seen a greater percentage of Oncology Systems gross orders and revenues coming from emerging markets around the globe, which typically have lower gross margins and longer installation cycles compared to developed markets. We have also seen an increased portion of gross orders and revenues coming from services and software licenses, both of which have higher gross margin percentages than our hardware products. We have also been investing a higher portion of our Oncology Systems research and development budget in software and software-related products.
The radiation oncology market in North America is largely saturated, characterized by replacements of aging treatment machines, with periodic increases in demand driven by the introduction of new technologies. Reimbursement rates in the United States have generally supported a favorable return on investment for the purchase of new radiotherapy equipment and technologies. While we believe that improved product functionality, greater cost-effectiveness and prospects for better clinical outcomes with new capabilities such as IMRT, IGRT and VMAT tend to drive demand for radiotherapy products, large changes in reimbursement rates or reimbursement structure can affect customer demand and cause market shifts. We do not know the full impact of the Patient Protection and Affordable Care Act (the “Affordable Care Act”) or its potential repeal, or changes in policy resulting from President Trump's administration, will have on long-term growth or demand for our products and services. We believe, however, that growth of the radiation oncology market in the United States could be impacted as customers’ decision-making processes are complicated by the uncertainties surrounding Medicare Access & CHIP Reauthorization Act of 2015 and the Affordable Care Act, or its replacement, and reimbursement rates for radiotherapy and
8
radiosurgery, and that this uncertainty will likely continue in future fiscal years. We believe this uncertainty could impact transaction size, timing and purchasing processes, and also contribute to increased quarterly business variability.
Total revenues for our Oncology Systems business segment were approximately $2.5 billion, $2.5 billion, and $2.3 billion for fiscal years 2017, 2016 and 2015, respectively. We divide our market segments for Oncology Systems revenues by region into The Americas, EMEA, and APAC. These regions constituted 52%, 28%, and 20%, respectively, of Oncology Systems revenues during fiscal year 2017; 50%, 30%, and 20%, respectively, of Oncology Systems revenues during fiscal year 2016; and 52%, 30%, and 18%, respectively, of Oncology Systems revenues during fiscal year 2015.
Varian Particle Therapy
Our VPT business primarily uses direct sales specialists who collaborate with our Oncology Systems sales group globally on projects. Potential customers are government-sponsored hospitals and research institutions and research universities, which typically purchase products through public tenders, as well as private hospitals, clinics and private developers. While this market is still developing and can be highly variable, there has been significant growth in this market over the last several years and we believe that growth in this business will continue in the major metropolitan areas in the United States and abroad, driven by institutions that wish to expand their clinical offerings and increase their profile in their respective communities. We are investing substantial resources to grow this business. Proton therapy facilities are large-scale construction projects that are time consuming and involve significant customer investment and often complex project financing. Consequently, this business is vulnerable to general economic and market conditions, as well as reimbursement rates. Customer decision-making cycles tend to be very long, and orders generally involve many contingencies. While credit markets have improved in recent years, the funding environment for large capital projects, such as proton therapy projects, remains constrained.
Backlog
Backlog is the accumulation of all gross orders for which revenues have not been recognized but are still considered valid. Backlog also includes a small portion of billed service contracts that are included in deferred revenue. Backlog is stated at historical foreign currency exchange rates and revenue is released from backlog at current exchange rates, with any difference recorded as a backlog adjustment. Orders may be revised or canceled, either according to their terms or as customers’ needs change; consequently, it is difficult to predict with certainty the amount of backlog that will result in revenues. Our backlog at the end of fiscal year 2017 was $3.5 billion, of which we expect to recognize approximately 39% to 46% as revenues in fiscal year 2018. Our backlog at the end of fiscal year 2017 included approximately $323 million in VPT. Our backlog at the end of fiscal year 2016 was $3.2 billion, of which $1.4 billion was recognized as revenues in fiscal year 2017. Our Oncology Systems backlog represented 91% of the total backlog at the end of fiscal years 2017 and 2016.
Gross orders are defined as the sum of new orders recorded during the period adjusted for any revisions to existing orders during the period. New orders are recorded for the total contractual amount, excluding certain pass-through items, once a written agreement for the delivery of goods or provision of services is in place and, other than VPT, when shipment of the product is expected to occur within two years, so long as any contingencies are deemed perfunctory. For our VPT business, we record orders when construction of the related proton therapy treatment center is reasonably expected to start within two years, but only if any contingencies are deemed perfunctory. However, we will not record VPT orders if there are major financing contingencies, if a substantial portion of the financing for the project is not reasonably assured or if customer board approval contingencies are pending. We perform a quarterly review to verify that outstanding orders in the backlog remain valid. If an order is no longer expected to ultimately convert to revenue, we record a backlog adjustment which reduces backlog but does not impact gross orders for the period.
Backlog adjustments are comprised of dormancies, cancellations, foreign currency exchange rate adjustments, backlog acquired from new acquisitions, and other adjustments. In fiscal years 2017, 2016 and 2015, our backlog adjustments were a reduction of $154.5 million, $189.8 million and $179.8 million, respectively.
Competition
The markets for cancer treatment are characterized by rapidly evolving technology, intense competition and pricing pressure. We compete with companies worldwide, some of whom may have greater financial, marketing and other resources than we have. Large amounts of resources are being invested in the research and development of new therapies for cancer. The successful development of alternative therapies for cancer, for example, immunotherapy, increased efficacy of new therapies or existing products, pricing decisions by competitors and the rate of market penetration by competitive products may render our products obsolete or noncompetitive.
9
Our smaller competitors could be acquired by companies with greater financial strength, which could enable them to compete more aggressively. Some of our suppliers or distributors could also be acquired by competitors, which could disrupt these supply or distribution arrangements and result in less predictable and reduced revenues. New competitors and new competitive technologies will enter our markets as new technologies are promulgated, such as radiosurgery, VMAT, MR-Linac and proton therapy. We have directed substantial product development efforts into (i) increasing the interconnectivity of our products for more seamless operation within a system, (ii) enhancing the ease of use of our software products and (iii) reducing setup and treatment times and increasing patient throughput. We have also maintained an “open systems” approach that allows customers to “mix and match” our various individual products, incorporate products from other manufacturers, share information with other systems or products and use the equipment for offering various methods of radiation therapy treatment. We have done this based on our belief that such interconnectivity will increase the acceptance and adoption of IMRT, IGRT and VMAT and will stimulate demand for our products. There are competitive “closed-ended” dedicated-use systems, however, that place simplicity of use ahead of flexibility. If we have misjudged the importance to our customers of maintaining an “open systems” approach, or if we are unsuccessful in our efforts to sustain interconnectivity, enhance ease-of-use and reduce setup and treatment times, our revenues could suffer.
Our Oncology Systems customers’ equipment purchase considerations typically include: reliability, servicing, patient throughput, precision, price, payment terms, connectivity, clinical features, the ability to track patient referral patterns, long-term relationship and capabilities of customers’ existing equipment. We believe we compete favorably with our competitors based upon our strategy of providing a complete package solution of products and services in the field of radiation oncology and our continued commitment to global distribution and customer services, value-added manufacturing, technological leadership and new product innovation. To compete successfully, we must provide technically superior, clinically proven products that deliver more precise, cost effective, high quality clinical outcomes, together in a complete package of products and services, and do so ahead of our competitors. Since our Oncology Systems products are generally sold on a basis of total value to the customer, our business may suffer when purchase decisions are based solely upon price, which can happen if hospitals and clinics give purchasing decision authority to group purchasing organizations. Further, competitors may delay customer purchasing decisions as customers evaluate the products of these competitors along with ours, potentially extending our sales cycle and adversely affecting our gross orders.
We are the leading provider of medical linear accelerators and related accessories. In radiotherapy and radiosurgery markets, we compete primarily with Elekta AB and Accuray Incorporated. Additionally, Elekta AB and ViewRay Incorporated announced the introduction of MR-Linac devices that are also expected to compete with us for hospital budget allocations. With our information and image management, simulation, treatment planning and radiosurgery products, we also compete with a variety of companies, such as Philips Medical Systems, RaySearch Laboratories AB, Brainlab AG and Best Theratronics, Ltd. We also encounter some competition from providers of enterprise hospital information systems. With respect to our brachytherapy solutions, our competitors are Elekta AB, MIM Software Inc. and Eckert & Ziegler BEBIG GmbH. In our Oncology Systems service and maintenance business, we compete with independent service organizations and our customers’ internal service organizations.
In addition, as a radiotherapy and radiosurgery equipment provider, we also face competition from other cancer treatment alternatives, such as traditional surgery, chemotherapy, robotic surgery and drug therapies, among others. To compete successfully, we need to demonstrate and convince our customers and cancer patients of the advantages of radiation therapy over other cancer treatment alternatives. This may involve funding and, in some instances, sponsoring clinical research and studies relating to the efficacy, comparative effectiveness and safety of radiation therapy as compared to such other alternative treatments.
The market for proton therapy products is still developing and is characterized by rapidly evolving technology, high competition and pricing pressure. Our ability to compete successfully depends, in part, on our ability to lower our product costs, and develop and provide technically superior, clinically proven products that deliver more precise, cost-effective, high quality clinical outcomes, including integration of IGRT technologies such as integrated volumetric imaging. In the proton therapy market, we compete principally with Hitachi Heavy Industries, Ion Beam Applications S.A., and Mevion Medical Systems, Inc. There are a number of smaller competitors that are also developing proton therapy products. We are the only established company in the field of radiation therapy to enter the particle therapy market directly.
Customer Services and Support
We warrant most of our Oncology Systems products for parts and labor for 12 months, and we offer a variety of post-warranty equipment service contracts and software support contracts to suit customers’ requirements. Our domestic service centers are in Atlanta, Georgia; Las Vegas, Nevada; and Milpitas, California. Our international service centers are in Australia, Austria, Belgium, Brazil, Canada, China, Denmark, Finland, France, Germany, Hungary, India, Italy, Japan, Malaysia, the Netherlands,
10
Russia, Saudi Arabia, Singapore, South Korea, Spain, Switzerland, Thailand, United Arab Emirates, and the United Kingdom. We also have field service personnel throughout the world for Oncology Systems customer support services. Key Oncology Systems education operations are located in Beijing, China; Cham, Switzerland; Las Vegas, Nevada; Mumbai, India; and Tokyo, Japan. Our network of service engineers and customer support specialists provide installation, warranty, repair, training and support services, project management, site planning, and professional services. We also have a distributed service parts network of regional hubs and forward-stocking locations across all major geographic areas. We generate service revenues by providing our customers with time-and-materials services, replacement part sales, post-warranty equipment service contracts and software support contracts. Most of the field service engineers are our employees, but our products are serviced by employees of distributors and/or agents in a few foreign countries. Customers can access our extensive service network by calling any of our service centers.
We believe customer service and support are an integral part of our Oncology Systems competitive strategy. Growth in our service revenues has resulted from the increasing customer adoption of service contracts as the sophistication and installed base of our products increase. We also believe superior service plays an important role in marketing and selling medical products and systems, particularly as the products become more complex. Nevertheless, some of our customers use their own internal biomedical engineering organizations and/or independent service organizations to service equipment after the warranty period expires and therefore do not enter into agreements with us for extended service.
In the VPT business, we sell our proton therapy equipment generally with a 12-month warranty. Upon transfer of a treatment room to a customer, we generally begin generating service revenues by providing on-site proton therapy system technical operation and maintenance support services, which typically are for relatively long-term periods (e.g., a five-year term or longer). We believe customer service and support are an integral part of our VPT competitive strategy.
Manufacturing and Supplies
We manufacture our medical linear accelerators in Palo Alto, California and in Beijing, China. Our treatment simulator systems and some accelerator subsystems are manufactured in Crawley, United Kingdom and some of our other accessory products in Baden, Switzerland; Helsinki, Finland; Toulouse, France; and Winnipeg, Canada. We manufacture our high dose rate brachytherapy systems in Crawley, United Kingdom; and Haan, Germany and our brachytherapy treatment planning products in Charlottesville, Virginia. We manufacture Calypso components for tumor tracking and motion management products in Seattle, Washington. We manufacture components and sub-systems for our proton therapy products and systems in Troisdorf, Germany. These facilities employ state-of-the-art manufacturing techniques, and several have been honored by the press, governments and trade organizations for their commitment to quality improvement. These manufacturing facilities are certified by International Standards Organization (“ISO”) under ISO 9001 (for security and inspection products) or ISO 13485 (for medical devices).
Manufacturing processes at our various facilities include machining, fabrication, subassembly, system assembly and final testing. We have invested in various automated and semi-automated equipment for the fabrication and machining of the parts and assemblies that we incorporate into our products. We may, from time to time, invest further in such equipment. Our quality assurance program includes various quality control measures from inspection of raw materials, purchased parts and assemblies through online inspection. We outsource the manufacturing of many major subassemblies and perform system design, assembly and testing in house. We believe outsourcing enables us to reduce or maintain fixed costs and capital expenditures, while also providing us with the flexibility to increase production capacity. We purchase material and components from various suppliers that are either standard products or customized to our specifications. We obtain some of the components included in our products from a limited group of suppliers or from a single source supplier, such as: the radioactive sources for high dose afterloaders; klystrons for linear accelerators; and radiofrequency components, magnets and gantry hardware for proton therapy systems. We require certain raw materials such as tungsten, lead and copper for Oncology Systems; and high-grade steel, high-grade copper and iron for the VPT business. Worldwide demand, availability and pricing of these raw materials have been volatile, and we expect that availability and pricing will continue to fluctuate in the future.
Research and Development
Developing products, systems and services based on advanced technology is essential to our ability to compete effectively in the marketplace. We maintain a research and development and engineering staff responsible for product design and engineering. Research and development expenses totaled $210.0 million, $200.4 million and $195.4 million in fiscal years 2017, 2016 and 2015, respectively.
Within Oncology Systems, our development efforts focus on enhancing the reliability and performance of existing products and developing new products. This development is conducted primarily in the United States, Switzerland, Canada, England,
11
Finland, Germany, India and China. In addition, we support research and development programs at selected hospitals and clinics. Current areas for development within Oncology Systems include linear accelerator systems and accessories for medical applications, information systems, radiation treatment planning software, image processing software, imaging devices, patient positioning and equipment diagnosis and maintenance tools. Development for our high-energy linear accelerators is focused on improvements in accelerator technology, size, and mobility to address the needs of our customers in the market.
Within VPT, our development efforts focus on integrating patient set-up, motion management and clinical workflow solutions originally developed in Oncology Systems as well as reducing the size of our proton therapy system. We expect that, in order to realize the full potential of the VPT business, we will need to invest substantial resources to continue to develop proton therapy technology.
Product and Other Liabilities
Our business exposes us to potential product liability claims that are inherent in the manufacture, sale, installation, servicing and support of medical devices and other devices that deliver radiation. Because our products are involved in the intentional delivery of radiation to the human body and other situations where people may come in contact with radiation, the collection and storage of patient treatment data for medical analysis and treatment delivery, the planning of radiation treatment and diagnostic imaging of the human body, and the diagnosis of medical problems, the possibility for significant injury and/or death exists.
Our medical products operate within our customers’ facilities and network systems, and under quality assurance procedures established by the facilities that ultimately deliver radiation to patients. Human and other errors or accidents may arise from the operation of our products in complex environments, particularly with products from other vendors, where interoperability or data sharing protocol may not be optimized even though the equipment or system operates according to specifications. As a result, we may face substantial liability to patients, our customers and others for damages resulting from the faulty, or allegedly faulty, design, manufacture, installation, servicing, support, testing or interoperability of our products with other products, or their misuse or failure, as well as liability related to the loss or misuse of private patient data, including resulting from unauthorized intrusion into our products. We may also be subject to claims for property damages or economic loss related to or resulting from any errors or defects in our products, or the installation, servicing and support of our products. Any accident or mistreatment could subject us to legal costs, litigation, adverse publicity and damage to our reputation, whether or not our products or services were a factor. In addition, if a product we design or manufacture were defective (whether due to design, labeling or manufacturing defects, improper use of the product or other reasons), or found to be so by a competent regulatory authority, we may be required to correct or recall the product and notify other regulatory authorities. We maintain limited product liability insurance coverage and currently do not maintain professional liability/errors and omissions insurance.
Government Regulation
U.S. Regulations
Laws governing marketing a medical device. In the United States, our products and operations are subject to extensive regulation by federal governmental authorities, such as the FDA, Nuclear Regulatory Commission (“NRC”), and state and local regulatory agencies, such as the State of California, to ensure the devices are safe and effective and comply with laws governing products which emit, produce or control radiation. Similar international regulations apply overseas. These regulations, which include the U.S. Food, Drug and Cosmetic Act (the “FDC Act”) and regulations promulgated by the FDA, govern, among other things, the design, development, testing, manufacturing, packaging, labeling, distribution, import/export, sale and marketing and disposal of medical devices, post market surveillance and reporting of serious injuries and death, repairs, replacements, recalls and other matters relating to medical devices, radiation emitting devices and devices utilizing radioactive by-product material. State regulations are extensive and vary from state to state. Our Oncology Systems equipment and software, as well as proton therapy systems offered by our VPT business, constitute medical devices subject to these regulations. Under the FDC Act, each medical device manufacturer must comply with quality system regulations that are strictly enforced by the FDA.
Unless an exception applies, the FDA requires that the manufacturer of a new medical device or a new indication for use of, or other significant change in, existing currently marketed medical device obtain either 510(k) pre-market notification clearance or pre-market approval (“PMA”) before it can market or sell those products in the United States. We do not manufacture any Class III medical devices, which require PMA. Certain of our products, like our radiation delivery systems manufactured by our Oncology Systems business and proton therapy systems manufactured by our VPT business, are Class II medical devices that require 510(k) clearance, while our other products are exempt from 510(k) clearance. Modifications or enhancements to a product that could significantly affect its safety or effectiveness, or that would constitute a major change in the intended use of
12
the device, technology, materials, labeling, packaging, or manufacturing process may also require a new 510(k) clearance. Manufacturers make the initial determination whether a change to a cleared device requires a new 510(k) clearance, but the FDA can review any such decision. If the FDA disagrees with the manufacturer’s decision not to seek a new 510(k) clearance or PMA approval for a change, it may retroactively require the manufacturer to seek 510(k) clearance or PMA approval. The FDA can also require the manufacturer to cease United States and/or recall the product until 510(k) clearance or PMA approval is obtained.
The FDA has issued draft guidance that, if finalized and implemented, will result in manufacturers needing to seek a significant number of new clearances for changes made to legally marketed devices. If we cannot establish that a proposed product is substantially equivalent to a legally marketed device, we must seek pre-market approval through a PMA application. Under the PMA process, the applicant submits extensive supporting data, including, in most cases, data from clinical studies, in the PMA application to establish reasonable evidence of the safety and effectiveness of the product. This process typically takes at least one to two years from the date the PMA is accepted for filing, but can take significantly longer for the FDA to review.
Quality systems. Our manufacturing operations for medical devices, and those of our third-party suppliers, are required to comply with the FDA’s Quality System Regulation (“QSR”), as well as other federal and state regulations for medical devices and radiation emitting products. The QSR requires that each manufacturer establish a quality systems program by which the manufacturer monitors the manufacturing process and maintains records that show compliance with FDA regulations and the manufacturer’s written specifications and procedures relating to the devices. QSR compliance is necessary to receive and maintain FDA clearance or approval to market new and existing products. The FDA makes announced and unannounced periodic and on-going inspections of medical device manufacturers to determine compliance with the QSR. If in connection with these inspections, the FDA believes the manufacturer has failed to comply with applicable regulations and/or procedures, it may issue observations that would necessitate prompt corrective action. If FDA inspection observations are not addressed and/or corrective action taken in a timely manner and to the FDA’s satisfaction, the FDA may issue a Warning Letter (which would similarly necessitate prompt corrective action) and/or proceed directly to other forms of enforcement action. Failure to respond timely to FDA inspection observations, a Warning Letter or other notice of noncompliance and to promptly come into compliance could result in the FDA bringing enforcement action against us, which could include the total shutdown of our production facilities, denial of importation rights to the United States for products manufactured in overseas locations and denial of export rights for U.S. products and criminal and civil fines.
Regulations on Advertising and Promotions. The FDA and the Federal Trade Commission (“FTC”) also regulate advertising and promotion of our products to ensure that the claims we make are consistent with our regulatory clearances, that there are adequate and reasonable scientific data to substantiate the claims and that our promotional labeling and advertising is neither false nor misleading. We may not promote or advertise our products for uses not within the scope of our intended use statement in our clearances or approvals or make unsupported safety and effectiveness claims.
Electrical Safety and Environmental Regulations. It is also important that our products comply with electrical safety and environmental standards, such as those of Underwriters Laboratories (“UL”), the Canadian Standards Association (“CSA”), and the International Electrotechnical Commission (“IEC”). In addition, the manufacture and distribution of medical devices utilizing radioactive material requires a specific radioactive material license. For the United States, manufacture and distribution of these radioactive sources and devices also must be in accordance with a model specific certificate issued by either the NRC or by a state regulatory authority. In essentially every country and state, installation and service of these products must be in accordance with a specific radioactive materials license issued by the applicable radiation control agency. We are also subject to a variety of additional environmental laws regulating our manufacturing operations and the handling, storage, transport and disposal of hazardous materials, and which impose liability for the cleanup of any contamination from these materials. For a further discussion of these laws and regulations, see “Critical Accounting Estimates” in MD&A, and Note 9, “Commitments and Contingencies” of the Notes to the Consolidated Financial Statements.”
Data Privacy Laws. As a participant in the healthcare industry, we are also subject to extensive laws and regulations protecting the privacy and integrity of patient medical information that we receive, including the Health Insurance Portability and Accountability Act of 1996 (“HIPAA”), “fraud and abuse” laws and regulations, including, physician self-referral prohibitions, and false claims laws. From time to time, these laws and regulations may be revised or interpreted in ways that could make it more difficult for our customers to conduct their businesses, such as recent proposed revisions to the laws prohibiting physician self-referrals, and such revisions could have an adverse effect on the demand for our products, and therefore our business and results of operations.
Within the EU/EEA/Switzerland area, data protection legislation is comprehensive and complex. Data protection authorities from the different member states of the EU may interpret the legislation differently, which adds to this complexity, and data protection is a dynamic field where guidance is often revised. Fully understanding and implementing this legislation could be
13
quite costly and timely, which could adversely affect our business. Additionally, in some instances, in order to fulfill the requirements of applicable U.S. laws, we may be faced with deciding whether to comply with EU/EEA/Switzerland data protection rules. Failure or partial failure to comply with data protection rules and regulations across the EU/EEA/Switzerland area could result in substantial monetary fines. New data protection legislation that entails substantial changes to the current legal framework, some stricter than before, some less strict, was enacted by the EU Commission and becomes effective in 2018.
The laws and regulations and their enforcement are constantly undergoing change, and we cannot predict what effect, if any, changes to these laws and regulations may have on our business.
Medicare and Medicaid Reimbursement
The federal and state governments of the United States establish guidelines and pay reimbursements to hospitals and free-standing clinics for diagnostic examinations and therapeutic procedures under Medicare at the federal level and Medicaid at the state level. Private insurers often establish payment levels and policies based on reimbursement rates and guidelines established by the government.
The federal government and the Congress review and adjust rates annually, and from time to time consider various Medicare and other healthcare reform proposals that could significantly affect both private and public reimbursement for healthcare services, including radiotherapy and radiosurgery, in hospitals and free-standing clinics. In the past, we have seen our customers’ decision-making process complicated by the uncertainties surrounding reimbursement rates for radiotherapy and radiosurgery in the United States. State government reimbursement for services is determined pursuant to each state’s Medicaid plan, which is established by state law and regulations, subject to requirements of federal law and regulations.
The provisions of the Affordable Care Act went into effect in 2012. Specifically, one of the components of the law is a 2.3% excise tax on sales of most medical devices, which include our Oncology Systems products, which started on January 1, 2013. In December 2015, President Obama signed into law a spending package that included a two-year moratorium on the medical device tax starting January 1, 2016 and ending December 31, 2017. This tax has had, and may continue to have, a negative impact on our gross margin when the moratorium expires. Other elements of this legislation, including comparative effectiveness research, an independent payment advisory board, payment system reforms (including shared savings pilots) and other provisions, could meaningfully change the way healthcare is developed and delivered, and may materially impact numerous aspects of our business, including the demand and availability of our products, the reimbursement available for our products from governmental and third-party payors, and reduced medical procedure volumes. In addition, it is possible that changes in administration and policy, including the potential repeal of the Affordable Care Act, resulting from President Trump's election could result in additional proposals and/or changes to health care system legislation which could have a material adverse effect on our business.
In April 2015, MACRA was signed into law, which made numerous changes to Medicare, Medicaid, and other healthcare related programs. These changes include new systems for establishing the annual updates to payment rates for physicians’ services in Medicare. MACRA was effective beginning January 1, 2017. Our business may be significantly and negatively affected by MACRA and any changes in reimbursement policies and other legislative initiatives aimed at or having the effect of reducing healthcare costs associated with Medicare and other government healthcare programs.
Various healthcare reform proposals have also emerged at the state level, and we are unable to predict which, if any of these proposals will be enacted. We believe that the uncertainty created by healthcare reform in the United States has complicated our customers’ decision-making process and impacted our Oncology Systems and VPT businesses, and may continue to do so.
The sale of medical devices including radiotherapy products, the referral of patients for diagnostic examinations and treatments utilizing such devices, and the submission of claims to third-party payors (including Medicare and Medicaid) seeking reimbursement for such services, are subject to various federal and state laws pertaining to healthcare “fraud and abuse.” These laws include physician self-referral prohibitions, anti-kickback laws and false claims laws. Subject to enumerated exceptions, the federal physician self-referral law, also known as Stark II, prohibits a physician from referring Medicare or Medicaid patients to an entity with which the physician (or a family member) has a financial relationship, if the referral is for a “designated health service,” which is defined explicitly to include radiology and radiation therapy services. Anti-kickback laws make it illegal to solicit, induce, offer, receive or pay any remuneration in exchange for the referral of business, including the purchase of medical devices from a particular manufacturer or the referral of patients to a particular supplier of diagnostic services utilizing such devices. False claims laws prohibit anyone from knowingly and willfully presenting, or causing to be presented, claims for payment to third-party payors (including Medicare and Medicaid) that are false or fraudulent, for services not provided as claimed, or for medically unnecessary services. The Office of the Inspector General prosecutes violations of
14
fraud and abuse laws and any violation may result in criminal and/or civil sanctions including, in some instances, imprisonment and exclusion from participation in federal healthcare programs such as Medicare and Medicaid.
Foreign Regulations
Our operations, sales and service of our products outside the United States are subject to regulatory requirements that vary from country to country and may differ significantly from those in the United States. In general, our products are regulated outside the United States as medical devices by foreign governmental agencies similar to the FDA.
Marketing a medical device internationally. In order for us to market our products internationally, we must obtain clearances or approvals for products and product modifications. We are required to affix the CE mark to our products in order to sell them in member countries of the European Economic Area (“EEA”). The CE mark is an international symbol of adherence to certain essential principles of safety and effectiveness, which once affixed enables a product to be sold in member countries of the EEA. The CE mark is also recognized in many countries outside the EEA, such as Switzerland and Australia, and can assist in the clearance process. In order to receive permission to affix the CE mark to our products, we must obtain Quality System certification, e.g., ISO 13485, and must otherwise have a quality management system that complies with the EU Medical Device Directive. The ISO promulgates standards for certification of quality assurance operations. We are certified as complying with the ISO 9001 for our security and inspection products and ISO 13485 for our medical devices. Several Asian countries, including Japan and China, have adopted regulatory schemes that are comparable, and in some cases more stringent, than the EU scheme. To import medical devices into Japan, the requirements of Japan’s New Medical Device Regulation must be met and a “shonin,” the approval to sell medical products in Japan, must be obtained. Similarly, in China a registration certification issued by the State Food and Drug Administration and a China Compulsory Certification mark for certain products are required to sell medical devices in that country. Obtaining such certifications on our products can be time-consuming and burdensome and can cause us to delay marketing or sales of certain products in such countries. Similarly, prior to selling a device in Canada, manufacturers of Class II, III and IV devices must obtain a medical device license. We sell Class II and Class III devices in Canada. Additionally, many countries have laws and regulations relating to radiation and radiation safety that also apply to our products. In most countries, radiological regulatory agencies require some form of licensing or registration by the facility prior to acquisition and operation of an X-ray generating device or a radiation source. The handling, transportation and the recycling of radioactive metals and source materials are also highly regulated.
A number of countries, including the members of the EU, have implemented or are implementing regulations that would require manufacturers to dispose, or bear certain disposal costs, of products at the end of a product’s useful life and restrict the use of some hazardous substances in certain products sold in those countries. For a further discussion of these regulations, see “Critical Accounting Estimates” in MD&A and Note 9, “Commitments and Contingencies” of the Notes to the Consolidated Financial Statements.”
Manufacturing and selling a device internationally. We are also subject to laws and regulations outside the United States applicable to manufacturers of radiation-producing devices and products utilizing radioactive materials, and laws and regulations of general applicability relating to matters such as environmental protection, safe working conditions, manufacturing practices and other matters, in each case that are often comparable to, if not more stringent than, regulations in the United States. In addition, our sales of products in foreign countries are also subject to regulation of matters such as product standards, packaging requirements, labeling requirements, import restrictions, environmental and product recycling requirements, tariff regulations, duties and tax requirements. In some countries, we rely on our foreign distributors and agents to assist us in complying with foreign regulatory requirements.
Other applicable international regulations. In addition to the U.S. laws regarding the privacy and integrity of patient medical information, we are subject to similar laws and regulations in foreign countries covering data privacy and other protection of health and employee information. Particularly within Europe, data protection legislation is comprehensive and complex and there has been a recent trend toward more stringent enforcement of requirements regarding protection and confidentiality of personal data, as well as enactment of stricter legislation. We are also subject to international “fraud and abuse” laws and regulations, as well as false claims and misleading advertisement laws.
Anti-Corruption Laws and Regulations
We are subject to the U.S. Foreign Corrupt Practices Act and anti-corruption laws, and similar laws in foreign countries, such as the U.K. Bribery Act of 2010 and the Law “On the Fundamentals of Health Protection in the Russian Federation.” In general, there is a worldwide trend to strengthen anticorruption laws and their enforcement, and the healthcare industry and medical equipment manufacturers have been particular targets of these investigation and enforcement efforts. Any violation of these
15
laws by us or our agents or distributors could create a substantial liability for us, subject our officers and directors to personal liability and also cause a loss of reputation in the market.
Transparency International’s 2016 Corruption Perceptions Index measured the degree to which public sector corruption is perceived to exist in 176 countries/territories around the world, and found that approximately sixty-nine percent of the countries in the index, including many that we consider to be high growth areas for our products, such as China, India, Russia and Brazil, scored below 50, on a scale from 100 (very clean) to 0 (highly corrupt). We currently operate in many countries where the public sector is perceived as being more or highly corrupt and our strategic business plans include expanding our business in regions and countries that are rated as higher risk for corruption activity by Transparency International.
Increased business in higher risk countries could subject us and our officers and directors to increased scrutiny and increased liability. In addition, becoming familiar with and implementing the infrastructure necessary to comply with laws, rules and regulations applicable to new business activities and mitigating and protecting against corruption risks could be quite costly. Failure by us or our agents or distributors to comply with these laws, rules and regulations could delay our expansion into high-growth markets and could adversely affect our business.
Patent and Other Proprietary Rights
We place considerable importance on obtaining and maintaining patent, copyright and trade secret protection for significant new technologies, products and processes, because of the length of time and expense associated with bringing new products through the development process and to the marketplace.
We generally rely upon a combination of patents, copyrights, trademarks, trade secret and other laws, and contractual restrictions on disclosure, copying and transferring title, including confidentiality agreements with vendors, strategic partners, co-developers, employees, consultants and other third parties, to protect our proprietary rights in the developments, improvements and inventions that we have originated and which are incorporated in our products or that fall within our fields of interest. As of September 29, 2017, we owned 348 patents issued in the United States and 180 patents issued throughout the rest of the world and had 380 patent applications on file with various patent agencies worldwide. We intend to file additional patent applications as appropriate. We have trademarks, both registered and unregistered, that are maintained and enforced to provide customer recognition for our products in the marketplace. We also have agreements with third parties that provide for licensing of patented or proprietary technology, including royalty bearing licenses and technology cross licenses.
Environmental Matters
For a discussion of environmental matters, see “Critical Accounting Estimates” in MD&A and Note 9, “Commitments and Contingencies” of the Notes to the Consolidated Financial Statements, which discussions are incorporated herein by reference.
Financial Information about Geographic Areas
We do business globally with manufacturing, engineering, and development in the United States, Europe, China, India and Canada with sales and service operations and customers throughout the world. More than half of our revenues are generated from our international regions. In addition to the potentially adverse impact of foreign regulations, see “Government Regulation—Foreign Regulations,” we also may be affected by other factors related to our international sales such as: lower average selling prices and profit margins; longer time periods from shipment to revenue recognition (which increases revenue recognition deferrals and time in backlog); and longer time periods from shipment to cash collection (which increases days sales outstanding (“DSO”)). To the extent that the geographic distribution of our sales continues to shift more towards international regions, our overall revenues and margins may suffer. We sell our products internationally predominantly in local currencies, but our cost structure is weighted towards the U.S. Dollar. Accordingly, there may be adverse consequences from strengthening of the U.S. Dollar against foreign currencies, which may affect both the affordability and competitiveness of our products and our profit margins. We engage in currency hedging strategies to offset the effect of fluctuations in foreign currency exchange rates, but the protection offered by these hedges depends upon the timing of transactions, the effectiveness of the hedges, the number of transactions that are hedged and forecast volatility.
We are also exposed to other economic, political and other risks inherent in doing business globally. For an additional discussion of these risks, see Item 1A, “Risk Factors.”
For a discussion of financial information about geographic areas, see Note 17, “Segment Information” of the Notes to the Consolidated Financial Statements and MD&A, which discussions are incorporated herein by reference.
16
Employees
We had approximately 6,600 full-time and part-time employees worldwide, including approximately 2,900 in the United States and approximately 3,700 elsewhere at September 29, 2017. None of our employees based in the United States are unionized or subject to collective bargaining agreements. Employees based in some other countries may, from time to time, be represented by works councils or unions or subject to collective bargaining agreements. We consider our relations with our employees to be good.
Information Available to Investors
As soon as reasonably practicable after our filing or furnishing the information to the SEC, we make the following available free of charge on the Investors page of our website http://www.varian.com: our annual reports on Form 10-K; quarterly reports on Form 10-Q; current reports on Form 8-K (including any amendments to those reports); and proxy statements. Our Code of Conduct, Corporate Governance Guidelines and the charters of the Audit Committee, Compensation and Management Development Committee, Ethics and Compliance Committee, Nominating and Corporate Governance Committee and Executive Committee are also available on the Investors page of our website. Investors and others should note that we announce material financial and operational information to our investors using our investor relations website (http://investors.varian.com/), press releases, SEC filings and public conference calls and webcasts. Please note that information on, or that can be accessed through, our website is not deemed “filed” with the SEC and is not to be incorporated by reference into any of our filings under the Securities Act of 1933, as amended (the “Securities Act”), or the Securities Exchange Act of 1934, as amended (the “Exchange Act”).
Executive Officers of the Registrant
The biographical summaries of our executive officers, as of November 1, 2017, are as follows:
Name | Age | Position | ||
Dow R. Wilson | 58 | President and Chief Executive Officer | ||
Kolleen T. Kennedy | 58 | Executive Vice President and President, Oncology Systems | ||
Gary E. Bischoping, Jr. | 49 | Senior Vice President and Chief Financial Officer | ||
John W. Kuo | 54 | Senior Vice President, General Counsel and Corporate Secretary | ||
Dow R. Wilson was appointed President and Chief Executive Officer effective September 29, 2012. Mr. Wilson served as Corporate Executive Vice President and Chief Operating Officer from October 2011 through September 2012 and as Corporate Executive Vice President and President, Oncology Systems from August 2005 through September 2011. Mr. Wilson served as Corporate Vice President and President, Oncology Systems from January 2005 to August 2005. Prior to joining the Company in January 2005, Mr. Wilson was Chief Executive Officer of the Healthcare-Information Technologies business in General Electric (a diversified technology and services company), from 2003 to 2005. During the previous 18 years, Mr. Wilson held various management positions within General Electric. Mr. Wilson holds a B.A. degree in English from Brigham Young University and an M.B.A. degree from Dartmouth’s Amos Tuck School of Business. Mr. Wilson serves on the board of directors of Varex Imaging Corporation, our former Imaging Components business segment. He also served on the board of directors of Saba Software, Inc. (an e-learning software provider) from August 2006 to March 2015 and as the lead independent director of that board from August 2011 to March 2013. Mr. Wilson was appointed to our Board of Directors in September 2012.
Kolleen T. Kennedy was appointed Executive Vice President and President, Oncology Systems effective September 2014, and was Senior Vice President and President, Oncology Systems from October 2011 to September 2014. From January 2006 through September 2011, Ms. Kennedy served as Vice President, Oncology Systems Customer Service and Support. Prior to that, Ms. Kennedy was the Company’s Vice President, Oncology Systems Marketing, Product Management and Engineering from September 2004 to January 2006. Prior to becoming Vice President, Ms. Kennedy served in various marketing management positions since she joined the Company in 1997. Ms. Kennedy holds a B.S. degree in Radiation Oncology and a B.S. degree in Psychology, both from Wayne State University, as well as an M.S. in Medical Physics from the University of Colorado.
Gary E. Bischoping, Jr. was appointed Senior Vice President, Finance and Chief Financial Officer ("CFO") in May 2017. Prior to joining the Company, Mr. Bischoping was with Dell Technologies for 17 years where he held several management roles, including CFO of its Client Solutions Group. Before joining Dell, Mr. Bischoping worked in financial management consulting for Stern Stewart & Company, Xerox and the SK Group. Mr. Bischoping earned his M.B.A. degree from the Simon School of
17
Business at the University of Rochester and a B.S. degree in Accounting from the State University of New York at Oswego. He passed the Certified Public Accountants examination in 1991.
John W. Kuo was appointed Senior Vice President, in addition to being General Counsel and Corporate Secretary, in February 2012. Prior to that, he served as Corporate Vice President and General Counsel from July 2005 through January 2012 and as Corporate Secretary since February 2005. Mr. Kuo joined the Company as Senior Corporate Counsel in March 2003 and became Associate General Counsel in March 2004. Prior to joining the Company, Mr. Kuo was General Counsel and Secretary at BroadVision, Inc. (an e-commerce software provider) and held senior legal positions at 3Com Corporation (a networking equipment provider). Mr. Kuo has previously been with the law firms of Gray Cary Ware & Freidenrich (now DLA Piper) and Fulbright & Jaworski. Mr. Kuo holds a B.A. degree from Cornell University and a J.D. degree from Boalt Hall School of Law at the University of California at Berkeley.
Item 1A. Risk Factors
The following risk factors and other information included in this Annual Report on Form 10-K should be carefully considered. Although the risk factors described below are the ones management deems significant, additional risks and uncertainties not presently known to us or that we presently deem less significant may also adversely affect our business operations. If any of the following risks or additional risks and uncertainties actually occur, our business, operating results, and financial condition could be adversely affected.
RISKS RELATING TO OUR BUSINESSES
Our performance depends on successful improvements to our existing products and commercialization of new products.
The markets in which we operate are characterized by rapid change and technological innovation. Our performance depends on the successful commercialization of new products that reflect and respond to changes in the marketplace, technology and customer demands.
Our Oncology Systems products often have long development and government approval cycles, are technologically complex and must demonstrate high performance to remain competitive.
Our software products compete in markets characterized by rapid technological advances, changing delivery models, evolving standards and frequent new product introductions and enhancements. We are expanding our software product lines and investing in the development of cloud and software-as-a-service (“SaaS”) solutions. The development and introduction of new software platforms and software delivery models, as well as different business models, is complex with many technology, regulatory and legal hurdles. We cannot assure you we can successfully develop and implement such platforms or models or that our customers will accept them.
Our VPT products require capital commitment, planning, design, development and testing, as well as involvement of senior management. Because of the large footprint and high price of many proton therapy systems there is increasing demand for the development of smaller, more compact proton therapy systems. Other companies currently offer smaller, less expensive proton therapy systems, and our competitiveness will depend on our ability to timely develop new technologies to reduce the size and price of our system or provide additional features and functionality that our competitors do not.
We may need to spend more time and money than anticipated to develop and introduce new products or product enhancements. We may not be able to recover all or a meaningful part of our investment. New products may adversely impact orders and sales of our existing products, or make them less desirable or even obsolete, which could adversely impact our revenues and operating results. In addition, certain costs, including installation and warranty costs, associated with new products may be disproportionately greater than the costs associated with other products, and if we are unable to lower these costs over time, our operating results could be adversely affected.
Our ability to successfully develop and introduce new products and product enhancements depends on our ability to:
•properly identify and respond to customer needs;
•demonstrate the value proposition of new products;
•limit the time required from proof of feasibility to routine production;
•timely and efficiently comply with internal quality assurance systems and processes;
18
•limit the timing and cost of regulatory approvals;
• | accurately predict and control costs associated with inventory overruns or shortages caused by phase-in of new products and phase-out of old products; |
•price our products competitively and profitably;
• | manufacture, deliver and install our products in sufficient volumes on time, and accurately predict and control costs associated with manufacturing, installation, warranty and maintenance of the products; and |
•and manage customer demands for new and old products, and optimize complementary product lines and services.
Furthermore, we cannot be sure that we will be able to successfully commercialize new products because commercialization involves compliance with complex quality assurance processes, including the Quality System Regulation (“QSR”) of the FDA. Failure to complete these processes on a timely and efficient basis could result in delays that could affect our ability to attract or retain customers, or could cause customers to delay or cancel orders.
A portion of a product’s revenue is generally tied to installation and acceptance of the product and our recognition of revenue associated with new products may be deferred where it takes longer to manufacture or install the new products. Customers may also decide not to upgrade their equipment, or customers may delay delivery of some of our more sophisticated products because of the longer preparation and renovation of treatment rooms required.
We compete in highly competitive markets, and we may lose market share to companies with greater resources or more effective technologies, or be forced to reduce our prices.
The markets for cancer treatment are characterized by rapidly evolving technology, intense competition and pricing pressure. In radiotherapy and radiosurgery markets, we compete primarily with Elekta AB and Accuray Incorporated. In addition, our software products compete with the product offerings of a variety of companies, such as Philips Medical Systems, RaySearch Laboratories AB and Brainlab AG.
New competitors may enter our markets and have already entered some of our newer markets such as radiosurgery, VMAT and proton therapy. Established enterprise software developers with greater software development capability may enter the markets for cancer treatment software. Some of these competitors may have greater financial, marketing and other development resources than we have. To compete successfully, we must provide technically superior, proven products that deliver more precise, cost-effective, high quality clinical capabilities, in a complete package of products and services, and do so ahead of our competitors.
As our Oncology Systems products are generally sold on a basis of total value to the customer, our business may suffer when purchase decisions are based solely upon price, which can happen if hospitals and clinics give purchasing decision authority to group purchasing organizations. New competitors may also delay the purchasing decisions of customers as they evaluate the products of these competitors along with ours, potentially extending our sales cycle and adversely affecting our gross orders and revenues.
The shift in the proportion of sales outside the United States towards emerging market countries, which typically purchase less complex, lower-priced products compared to more developed countries, and which usually have stiffer price competition and longer periods from placement of orders to revenue recognition, could also adversely impact our results of operations.
The market for proton therapy products is still developing and is characterized by rapidly evolving technology and pricing pressure. Our primary competitor in the proton therapy market is Ion Beam Applications S.A. Our ability to compete successfully depends, in part, on our ability to lower our product costs, and develop and provide technically superior, proven products that deliver precise, cost-effective, high quality capabilities.
Large amounts of resources are being invested in the research and development of new therapies for cancer. The successful development of alternative therapies for cancer, including, for example, pharmaceutical treatments such as immunotherapy, increased efficacy information about new therapies or existing products, pricing decisions by competitors and the rate of market penetration by competitive products may render our products obsolete, result in lost market share for us, reduced utilization of our products, lower prices, and reduced product sales.
The timing of our competitors’ introduction of products into the market could affect the market acceptance and market share of our products. Some competitors offer specialized products that provide, or may be perceived by customers to provide, a
19
marketing advantage over our mainstream cancer treatment products. Also, some of our competitors may not be subject to the same standards, regulatory and/or other legal requirements that we are subject to, and therefore, they could have a competitive advantage in developing, manufacturing and marketing products and services. Any inability to develop, gain regulatory approval for and supply commercial quantities of competitive products to the market as quickly and effectively as our competitors could limit market acceptance of our products and reduce our sales. In addition, some of our smaller competitors could be acquired by larger companies that have greater financial strength, which could enable them to compete more aggressively. Our competitors could also acquire some of our suppliers or distributors, which could disrupt supply or distribution arrangements and result in less predictable and reduced revenues in our businesses.
The interoperability of radiation oncology treatment products is becoming increasingly important, and sales of our products could fall if we fail to establish interoperability.
As radiation oncology treatment becomes more complex, our customers are increasingly focusing on ease-of-use and interconnectivity. We have directed substantial product development efforts into (1) increasing the interconnectivity of our products for more seamless operation within a system, (2) making our software products easier to use and (3) reducing setup and treatment times to increase patient throughput. Our equipment and software are highly sophisticated and a high level of training and education is required to use them safely and effectively. The requirements are made even more important because they work together within integrated environments.
We have emphasized an “open systems” approach that allows customers to “mix and match” our individual products, incorporate products from other manufacturers, share information with other systems or products and use the equipment for offering various methods of radiation and chemotherapy treatment. We have done this based on our belief that such interconnectivity will increase the acceptance and adoption of IMRT, IGRT and VMAT and will stimulate demand for our products. There are competitive “closed-ended” dedicated-use systems that place simplicity of use ahead of flexibility. If we have misjudged the importance to our customers of maintaining an “open systems” approach, or if we are unsuccessful in our efforts to increase interconnectivity, enhance ease-of-use and reduce setup and treatment times, our revenues could suffer. Obtaining and maintaining interoperability and compatibility can be costly and time-consuming. While we try to use standard published protocols for communication with widely-used oncology products manufactured by other companies, if we cannot do this, we may need to develop individual interfaces so that our products communicate correctly with other products.
When other companies modify the design or functionality of their products, this may affect their compatibility with our products. In addition, when we improve our products, customers may be reluctant to adopt our new technology due to potential interoperability issues. For example, a clinic may be unwilling to implement one of our new technologies because its third-party software does not yet communicate correctly with our new product. Our ability to obtain compatibility with products of other companies may depend on our ability to obtain adequate information from them regarding their products. In many cases, these third parties are our competitors and may schedule their product changes and delay their release of relevant information to place us at a competitive disadvantage.
When we modify our products to make them interoperable or compatible with third-party products, we may be required to obtain additional regulatory clearances. This process is costly and could delay our ability to release our products for commercial use. It is also possible that, despite our efforts, we may not be able to make our products interoperable or compatible with widely used third-party products or may only be able to do so at a prohibitive expense, making our products less attractive to our customers.
Disruption of critical information systems or material security breaches in our products may adversely affect our business and customer relations.
Information technology helps us operate efficiently, interface with and support our customers, maintain financial accuracy and efficiency, and produce our financial statements. There is an increasing threat of information security attacks that pose risk to companies, including Varian. Because the techniques used to obtain unauthorized access, or to sabotage systems, change frequently and generally are not recognized until launched against a target, we may be unable to anticipate these techniques or to implement adequate preventative measures. If we do not allocate and effectively manage the resources necessary to build and sustain the proper technology infrastructure, we could be subject to, among other things, transaction errors, processing inefficiencies, the loss of customers, business disruptions, or the loss of or damage to intellectual property through a security breach. Such security breaches could expose us to a risk of loss of information, litigation and possible liability to employees, customers and regulatory authorities. If our data management systems do not effectively collect, secure, store, process and report relevant data for the operation of our business, whether due to equipment malfunction or constraints, software deficiencies, or human error, our ability to effectively plan, forecast and execute our business plan and comply with applicable
20
laws and regulations will be impaired. Any such impairment could materially and adversely affect our financial condition and results of operations, and the timeliness with which we report our operating results internally and externally.
We manufacture and sell hardware products that rely upon software systems to operate properly and software that deliver treatment instructions and store confidential patient information. Both types of products often are connected to and reside within our customers' information technology infrastructures. While we have implemented security measures to protect our hardware and software products from unauthorized access, these measures may not be effective in securing these products, particularly since techniques used to obtain unauthorized access, or to sabotage systems, change frequently and generally are not recognized until launched against a target. Additionally, we are developing and offering cloud and SaaS software products which reside upon and are hosted by third-party providers. A security breach, whether of our products, of our customers’ network security and systems or of third-party hosting services could disrupt treatments occurring on our products, disrupt access to our customers' stored information, such as patient treatment delivery instructions, and could lead to the loss of, damage to or public disclosure of our customers’ stored information, including patient health information. Such an event could have serious negative consequences, including possible patient injury, regulatory action, fines, penalties and damages, reduced demand for our solutions, an unwillingness of our customers to use our solutions, harm to our reputation and brand, and time-consuming and expensive litigation, any of which could have an adverse effect on our financial results.
If we were to experience a significant security breach of our information systems or data, the costs associated with the investigation, remediation and potential notification of the breach to customers and counter-parties could be material. We currently self-insure for cybersecurity liability. If we seek to obtain third party insurance coverage for cybersecurity liability in the future, our insurance coverage may be inadequate, expensive and/or not be available on acceptable terms or in sufficient amounts, if at all.
We may offer extended payment terms to certain customers, which could adversely affect our financial results.
We offer longer or extended payment terms for qualified customers. As of September 29, 2017, customer contracts with remaining terms of more than one year amounted to approximately two percent of our net accounts receivable balance.
While we qualify customers to whom we offer longer or extended payment terms, their financial positions may change adversely over the longer payment term. Many of the customers where we offer such longer or extended payment terms are located in under-developed legal systems for securing debt and enforcing collection of debt. Concerns over economic instability could also make it more difficult for us to collect outstanding receivables. This may result in an increase in payment defaults and uncollectible accounts, or could cause us to increase our bad debt expense, which would adversely affect our net earnings. In addition, longer or extended payment terms decrease our cash flow from operations and could impact the timing of our revenue recognition.
Economic, political and other risks associated with international sales and operations could adversely affect our sales or make them less predictable.
Our international revenues accounted for approximately 54%, 56%, and 51% of our total revenues during fiscal years 2017, 2016 and 2015, respectively. Correspondingly, we must provide significant service and support globally. We intend to continue to expand our presence in international markets and expect to expend resources in doing so. We cannot assure you that we will be able to recover these investments in international markets.
Our results of operation could be adversely affected by a variety of factors, including:
• | the lower sales prices and gross margins usually associated with sales of our products in international regions, and in emerging markets in particular; |
•the longer payment cycles associated with many foreign customers;
• | the typically longer periods from placement of orders to revenue recognition in certain international and emerging markets; |
•currency fluctuations;
• | difficulties in interpreting or enforcing agreements and collecting receivables through many foreign country’s legal systems; |
• | unstable regional political and economic conditions or changes in restrictions on trade between the United States and other countries; |
21
• | changes in the political, regulatory, safety or economic conditions in a country or region, including as a result of the initiation by United Kingdom to exit the European Union (“Brexit”); |
• | the imposition by governments, including the United States, of additional taxes, tariffs, global economic sanctions programs or other restrictions on foreign trade; |
•any inability to obtain required export or import licenses or approvals;
• | any inability to comply with export or import laws and requirements or any violation of sanctions regulations, which may result in enforcement actions, civil or criminal penalties and restrictions on exportation; |
• | any increase in the cost of trade compliance functions to comply with changes to regulatory requirements; |
• | failure to obtain proper business licenses or other documentation, or to otherwise comply with local laws and requirements to conduct business in a foreign jurisdiction; and |
• | the possibility that it may be more difficult to protect our intellectual property in foreign countries. |
Most of our cash and cash equivalents are held abroad. If these funds are repatriated to the United States, we could be subject to additional taxation.
As of September 29, 2017, approximately 95% of our cash and cash equivalents were held abroad. If these funds were repatriated to the United States, a portion of this amount could be subject to additional taxation and our overall tax rate and our results of operations could suffer.
Our effective tax rate is impacted by tax laws in both the United States and in the countries in which our international subsidiaries do business. Earnings from our international regions are generally taxed at rates lower than U.S. rates. A change in the percentage of our total earnings from outside the United States, a change in the mix of our earnings in particular international tax jurisdictions, or a change in currency exchange rates, could cause our effective tax rate to increase or decrease. Also, we are not currently taxed in the United States on certain undistributed earnings of certain foreign subsidiaries. These earnings could become subject to incremental foreign withholding or United States federal and state taxes if they are remitted, or deemed to be remitted, to the United States, in which case our financial results would be adversely affected. In addition, changes in the valuation of our deferred tax assets or liabilities, changes in tax laws or rates, changes in the interpretation of tax laws or other changes beyond our control could adversely affect our financial position and results of operations. For example, the U.S. Congress is considering changes to U.S. tax law, including provisions, which if passed into law, would have a significant impact on the taxation of the foreign earnings of U.S.-based multinational corporations.
Changes in foreign currency exchange rates may impact our results.
Because our business is global and payments are generally made in local currency, fluctuations in foreign currency exchange rates can impact our results by affecting product demand, or our revenues and expenses, and/or the profitability in U.S. Dollars of products and services that we sell in foreign markets.
While we use hedging strategies to help offset the effect of fluctuations in foreign currency exchange rates, the protection these strategies provide is affected by the timing of transactions, the effectiveness of the hedges, the number of transactions that are hedged and forecast accuracy. If our hedging strategies do not offset these fluctuations, our revenues, margins and other operating results may be adversely impacted. Furthermore, movements in foreign currency exchange rates could impact our financial results positively or negatively in one period and not in another, making it more difficult to compare our financial results from period to period.
In addition, our hedging program is designed to hedge currency movements on a relatively short-term basis, typically up to the next twelve-month period. Therefore, we are exposed to currency fluctuations over a longer term. Long-term movements in foreign currency exchange rates can also affect the competitiveness of our products in the local currencies of our international customers. A substantial portion of our international sales are priced in local currencies, although our cost structure is weighted towards the U.S. Dollar. Therefore, the strengthening of the U.S. Dollar may adversely affect our competitiveness and financial results, as our foreign competitors may have cost structures based in other currencies and they may be more competitive when the U.S. Dollar strengthens against those currencies.
Changes in monetary or other policies here and abroad, including as a result of economic and or political instability, or in reaction thereto, would also likely affect foreign currency exchange rates. Furthermore, if one or more European countries were
22
to replace the Euro with another currency, our sales into these countries, or into Europe generally, would likely be adversely affected until stable exchange rates are established.
We are subject to certain risks related to the separation of our former imaging components business into Varex Imaging Corporation.
On January 28, 2017, we completed the separation of our former Imaging Components business through the distribution of 100% of the outstanding common stock of Varex Imaging Corporation (“Varex”) to our stockholders. Following the separation, Varex is the sole source of supply of X-ray tubes, flat panels and detector components used in certain of our products, such as our On-Board Imager.
In connection with the separation, we entered into several agreements with Varex providing for transition and other services to Varex for a period of time following the separation. Performing our obligations under these agreements requires significant time and attention from many of our employees, which could adversely affect our business and results of operations. We may not realize some or all of the anticipated strategic, financial, operational, marketing or other benefits from the separation. Following the separation, Varian is a smaller, less diversified company with a narrower business focus and may be more vulnerable to changing market conditions, which could materially and adversely affect our business, financial condition and results of operations and lead to increased volatility in the price of our common stock.
We obtained an opinion of outside counsel to the effect that the separation will qualify as a transaction that is generally tax-free to both Varian and its stockholders for United States federal income tax purposes under Sections 355 and 368(a)(1)(D) of the United States Internal Revenue Code of 1986, as amended. An opinion of outside counsel represents their legal judgment but is not binding on the Internal Revenue Service (the “IRS”) or any court. Accordingly, there can be no assurance that the IRS will not challenge the conclusions reflected in the opinion or that a court would not sustain such a challenge.
Unfavorable results of legal proceedings could adversely affect our financial results.
From time to time, we are a party to or otherwise involved in legal proceedings, claims and government inspections or investigations and other legal matters, both inside and outside the United States, including product liability claims and intellectual property claims. Legal proceedings are often lengthy, taking place over a period of years before the outcome is final. Litigation is subject to significant uncertainty and may be expensive, time-consuming, and disruptive to our operations.
If a legal proceeding were finally resolved against us, it could result in significant compensatory damages, and in certain circumstances punitive or trebled damages, disgorgement of revenue or profits, remedial corporate measures or injunctive relief imposed on us. If our existing insurance does not cover the amount or types of damages awarded, or if other resolution or actions taken as a result of the legal proceeding were to restrain our ability to market one or more of our material products or services, our consolidated financial position, results of operations or cash flows could be materially adversely affected. In addition, legal proceedings, and any adverse resolution thereof, can result in adverse publicity and damage to our reputation, which could adversely impact our business.
Consolidation among our oncology systems customers could adversely affect our sales of oncology products.
We have seen and may continue to see some consolidation among our customers in our Oncology Systems business, as hospitals and clinics combine through mergers and acquisitions, and as they join group purchasing organizations or affiliated enterprises. In addition, we have seen and may continue to see integration of equipment and information systems among hospitals as they consolidate their networks. As customers consolidate and/or integrate, the volume of product sales to these customers might decrease. Alternatively, order size may increase, as what were previously more than one customer combine orders as one entity, or as groups of organizations combine their purchases. If orders increase in size and require more customer approvals, the purchasing cycle for our Oncology Systems products could lengthen. Both increased order size and extended purchasing cycles could cause our gross orders to be more volatile and less predictable and could result in longer overall order to revenue cycles. In addition, some customers appear to be developing new partnerships across clinical specialties to prepare for the possibility of operating in an ACO environment and the possibility of bundled reimbursement payments. Group purchasing organizations often focus on pricing as the determinant in making purchase decisions. A reduction in pricing could negatively impact gross orders, future revenues and gross margins.
23
Our business will suffer if we are unable to provide the significant education and training required for the healthcare market to accept our products.
In order to achieve market acceptance for our radiation therapy products, we often need to educate physicians about the use of treatment procedures such as IMRT, IGRT, VMAT, SRS, SBRT or proton therapy, overcome physician objections to some of the effects of the product or its related treatment regimen, convince healthcare payors that the benefits of the product and its related treatment process outweigh its costs and help train qualified physicists in the skilled use of the product. For example, the complex and dynamic nature of IMRT and IGRT requires significant education of hospital personnel and physicians regarding the benefits of and practices associated with IMRT and IGRT. Further, the complexity and high cost of proton therapy requires similar significant education, as well as education regarding construction and facility requirements. We have devoted and will continue to devote significant resources on marketing and educational efforts to create awareness of IMRT, IGRT, VMAT radiotherapy, SRS, SBRT and proton therapy, to encourage the acceptance and adoption of our products for these technologies and to promote the safe and effective use of our products in compliance with their operating procedures. Future products may not gain adequate market acceptance among physicians, patients and healthcare payors, even if we spend significant time and expense educating them about these products.
Our business may suffer if we are not able to hire and retain qualified personnel.
Our future success depends, to a great degree, on our ability to retain, attract, expand, integrate and train our management team and other key personnel, such as qualified engineering, service, sales, marketing and other staff. We compete for key personnel with other medical equipment and software manufacturers, as well as universities and research institutions. As we continue to grow our software revenues, we face intense competition for personnel from software and technology companies. Because this competition is intense, compensation-related costs could increase significantly if the supply of qualified personnel decreases or demand increases. If we are unable to hire and train qualified personnel, we may not be able to maintain or expand our business. Some of our executive officers have had long careers at our company. If these executives retire or leave, and we are unable to locate qualified or suitable replacements in a timely manner, our business could be adversely affected.
We may not realize expected benefits from acquisitions of or investments in new businesses, products, or technologies, which could harm our business.
We need to grow and evolve our businesses in response to changing technologies, customer demands and competitive pressures. In some circumstances, we may decide to grow our business through the acquisition of businesses, products or technologies rather than through internal development. Identifying suitable acquisition candidates can be difficult, time-consuming and costly, and we may not be able to identify suitable candidates or successfully complete identified acquisitions. In addition, completing an acquisition can divert our management and key personnel from our current business operations, which could harm our business and affect our financial results.
Even if we complete an acquisition, we may not be able to successfully integrate newly acquired businesses or fully realize some of the expected synergies.
Integrating an acquisition can also be expensive and time-consuming, and may strain our resources. It may cost us more to commercialize new products, as we experienced with our proton therapy systems, or cause us to increase our research and development, sales and marketing or general and administrative expenses, either of which could adversely impact our results of operations. In many instances, integrating a new business will also involve implementing or improving internal controls appropriate for a public company into a business that lacks them. It is also possible that an acquisition could increase our risk of litigation, as a third-party may be more likely to assert a legal claim following an acquisition because of perceived deeper pockets or perceived greater value of a claim. In addition, we may be unable to retain the employees of acquired companies, or the acquired company’s customers, suppliers, distributors or other partners for a variety of reasons, including the fact that these entities may be our competitors or may have close relationships with our competitors. Failure to manage these risks could have a material and adverse effect on our business, results of operations and financial condition.
If we acquire a business, we allocate the total purchase price to the acquired businesses’ tangible assets and liabilities, identifiable intangible assets and liabilities based on their fair values as of the date of the acquisition, and record the excess of the purchase price over those fair values as goodwill. If we fail to achieve the anticipated growth or cash flows from an acquisition, or if we decide to sell assets or a business, we may be required to recognize an impairment loss on the write down of our assets and goodwill, which could adversely affect our financial results. In addition, acquisitions can result in potentially dilutive issuances of equity securities or the incurrence of debt, contingent liabilities or expenses, or other charges, any of which could harm our business and affect our financial results.
24
Additionally, we have investments in privately held companies. These investments are inherently risky, in some instances because the markets for the technologies or products these companies have under development may never materialize or reach expectations. If these companies do not succeed, we may be forced to record impairment charges and could lose some or all of our investment in these companies.
We may face additional risks from the acquisition or development of new lines of business.
From time to time, we may acquire or develop new lines of business, as we did with particle therapy. There are substantial risks and uncertainties associated with new lines of business, particularly in instances where the markets are not fully developed. Risks include developing knowledge of and experience in the new business, recruiting market professionals, increasing research and development expenditures, and developing and capitalizing on new relationships with experienced market participants. This may mean significant investment and involvement of our senior management to acquire or develop, then integrate the business into our operations. External factors, such as compliance with regulations, competitive alternatives, and shifting market preferences, may also impact whether implementation of a new business will be successful. Failure to manage these risks could have a material adverse effect on our business, results of operations and financial condition.
Losing distributors may harm our revenues in some territories.
We have strategic relationships with a number of key distributors for sales and service of our products. If these strategic relationships end and are not replaced, our revenues from product sales or the ability to service our products in the territories serviced by these distributors could be adversely affected.
We entered into a credit facility agreement that restricts certain activities, and failure to comply with this agreement may adversely affect our business, liquidity and financial position.
We maintain a credit facility that contains affirmative and negative covenants that could restrict our operating and financing activities. These provisions limit our ability to, among other things, incur future indebtedness, contingent obligations or liens, guarantee indebtedness, make certain investments and capital expenditures, sell stock or assets and pay dividends, and consummate certain mergers or acquisitions. Because of the restrictions on our ability to create or assume liens, we may find it difficult to secure additional indebtedness if required.
We have in the past used borrowings under our credit facility to fund the repurchase of VMS shares and we may continue to do so in the future. If we cannot use borrowings under our credit facility to fund announced share repurchases, because we have drawn down the maximum amounts borrowable under our credit facility, to do so would violate covenants in our credit facility, or otherwise, and we do not have access to other cash resources necessary to fund the desired share repurchases, it could have an adverse effect on our earnings per share. Furthermore, if we fail to comply with the credit facility requirements, we may be in default. Upon an event of default, if the credit agreement is not amended or the event of default is not waived, the lender could declare all amounts outstanding, together with accrued interest, to be immediately due and payable. If this happens, we may not be able to make those payments or borrow sufficient funds from alternative sources to make those payments. Even if we were to obtain additional financing, that financing may be on unfavorable terms.
Changes in the interpretation or application of generally accepted accounting principles may adversely affect our operating results.
We prepare our financial statements to conform to GAAP. These principles are subject to interpretation by the Financial Accounting Standards Board (“FASB”), American Institute of Certified Public Accountants, the SEC and various other regulatory or accounting bodies. A change in interpretations of, or our application of, these principles can have a significant effect on our reported results and may even affect our reporting of transactions completed before a change is announced. In addition, when we are required to adopt new accounting standards, our methods of accounting for certain items may change, which could cause our results of operations to fluctuate each period and make it more difficult to compare our financial results to prior periods. We may introduce new products or new technologies that require us to apply different accounting principles, including ones regarding revenue recognition, than we have applied in past periods.
Currently, we recognize revenues for our proton therapy systems and services under contract accounting rules, which affects the timing of revenue recognition. Under contract accounting rules, the use of the percentage-of-completion method involves considerable use of estimates in determining revenues, costs and profits and in assigning dollar amounts to relevant accounting periods, estimates which must be periodically reviewed and appropriately adjusted. For example, revenues recognized under
25
the percentage-of-completion method are based on contract costs incurred to date compared with total estimated contract costs. In circumstances in which the final outcome of a contract cannot be precisely estimated but a loss on the contract is not expected, we recognize revenues under the percentage-of-completion method based on a zero-profit margin until more precise estimates can be made. Recognizing revenues this way lowers our gross margins and makes it more difficult to compare our financial results from quarter to quarter. In addition, if we were to recognize revenues for our proton therapy systems and services under either the completed contract method or outside of contract accounting rules altogether, we would defer revenue until a contract is completed or substantially completed. This may cause our results of operations to fluctuate from period to period.
If our estimates prove to be inaccurate or circumstances change over time, we would be required to adjust revenues or even record a contract loss in later periods, and our financial results could suffer. In addition, if a loss is expected on a contract under the percentage-of-completion method, the estimated loss would be charged to cost of sales in the period the loss is identified. The application of different types of accounting principles and related potential changes may make it more difficult to compare our financial results from quarter to quarter, and the trading price of VMS common stock could suffer or become more volatile.
Our operations are vulnerable to interruption or loss due to natural or other disasters, power loss, strikes and other events beyond our control.
We conduct a significant portion of our activities, including manufacturing, administration and data processing at facilities located in the State of California and other seismically active areas that have experienced major earthquakes and other natural disasters. We carry limited earthquake insurance that may not be adequate or continue to be available at commercially reasonable rates and terms. A major earthquake or other disaster (such as a major fire, hurricane, flood, tsunami, volcanic eruption or terrorist attack) affecting our facilities, or those of our suppliers, could significantly disrupt our operations, and delay or prevent product manufacture and shipment during the time required to repair, rebuild or replace the damaged facilities. These delays could be lengthy and costly. If any of our customers’ facilities are adversely affected by a disaster, shipments of our products could be delayed. Additionally, customers may delay purchases of our products until operations return to normal or may move to a competitor that can meet their desired delivery time frame. In addition, our facilities may be subject to a shortage of available electrical power and other energy supplies. Any shortages may increase our costs for power and energy supplies or could result in blackouts, which could disrupt the operations of our affected facilities and harm our business. Further, our products are typically shipped from a limited number of ports, and any disaster, strike or other event blocking shipment from these ports could delay or prevent shipments and harm our business. In addition, concerns about terrorism, the effects of a terrorist attack, political turmoil or an outbreak of epidemic diseases could have a negative effect on our business operations, those of our suppliers and customers, and the ability to travel, resulting in adverse consequences on our revenues and financial performance.
We work in international locations with high security risks, which could result in harm to our employees or contractors or cause us to incur substantial costs.
We work in some international locations where there are high security risks, which could result in harm to our employees and contractors or substantial costs. Some of our services are performed in or adjacent to high-risk locations where the country or surrounding area is suffering from political, social, or economic issues; war or civil unrest, or has a high level of criminal or terrorist activity. In those locations where we have employees or operations, we may incur substantial costs to maintain the safety of our personnel. Despite these precautions, the safety of our personnel in these locations may continue to be at risk, and we may in the future suffer the loss of employees and contractors, which could harm our business and operating results.
Product defects or misuse may result in material product liability or professional errors and omissions claims, litigation, investigation by regulatory authorities or product recalls that could harm our future financial results.
Our business exposes us to potential product liability claims that are inherent in the manufacture, sale, installation, servicing and support of medical devices and other devices that deliver radiation. Because our products are involved in the intentional delivery of radiation to the human body and other situations where people may come into contact with radiation, the possibility for significant injury and/or death exists to the intended or unintended recipient of the delivery. Our products operate within our customers’ facilities and network systems, and under quality assurance procedures established by the facility that ultimately delivers radiation to patients. Human and other errors or accidents may arise from the operation of our products in complex environments, particularly with products from other vendors, where interoperability or data sharing protocol may not be optimized even though the equipment or system operates according to specifications. As a result, we may face substantial liability to patients, our customers and others for damages resulting from the faulty, or allegedly faulty, design, manufacture,
26
installation, servicing, support, testing or interoperability of our products with other products, or their misuse or failure. In addition, third-party service providers could fail to adequately perform their obligations, which could subject us to further liability. We may also be subject to claims for property damages or economic loss related to or resulting from any errors or defects in our products, or the installation, servicing and support of our products. Any accident or mistreatment could subject us to legal costs, litigation, adverse publicity and damage to our reputation, whether or not our products or services were a factor. In connection with our products that collect and store patient treatment data, we may be liable for the loss or misuse of such private data, if those products fail or are otherwise defective.
Product liability actions are subject to significant uncertainty and may be expensive, time-consuming, and disruptive to our operations. If a product liability action were finally determined against us, it could result in significant damages, including the possibility of punitive damages and our consolidated financial position, results of operations or cash flows could be materially adversely affected.
Adverse publicity regarding any accidents or mistreatments could cause patients to be less receptive to radiotherapy or radiosurgery treatments, to question the efficacy of radiation therapy and radiosurgery and to seek other methods of treatment. Adverse publicity could also result in additional regulation that could adversely affect our ability to promote, manufacture and sell our products.
In addition, if a product we design or manufacture were defective or found to be so by a competent regulatory authority, we may be required to correct or recall the product and notify other regulatory authorities. The adverse publicity resulting from a correction or recall, however imposed, could damage our reputation and cause customers to review and potentially terminate their relationships with us. A product correction or recall could consume management time and have an adverse effect on our results of operation.
We maintain limited product liability insurance coverage and do no maintain professional liability/errors and omissions insurance. Our product liability insurance policies are expensive and have high deductible amounts and self-insured retentions. Our insurance coverage may be inadequate, and future policies may not be available on acceptable terms or in sufficient amounts, if at all. If a material claim is successfully brought against, we may have to pay substantial damages if they are not covered by insurance.
ADDITIONAL RISKS RELATING TO OUR SOFTWARE PRODUCTS
We may face delays in the installation of our software products, which could have a material adverse effect on our operating results.
We may face delays in the installation and acceptance of our software products, which may take more time from order to completion of installation and acceptance than our hardware products. Though several of our software products are cloud-enabled, our current software product offerings are for the most part designed as on-premise products which must be installed on customer systems on-site. Delays in installation of our software products may arise as a result of a variety of factors, including longer installation timetables resulting from challenges in coordinating on-site visits with the customer personnel, customer IT systems not being ready to host the installation or the planning and customization required to deploy our software products in order to be compatible with a customer’s unique, complex and/or dated health IT systems. Delays in installation of our software products could result in delays in our ability to recognize revenues from the sale of these products, which could have a material adverse effect on our operating results and financial performance.
The need to maintain and service multiple versions of the same software product across our installed base of customers could adversely affect our ability to release upgraded or new products.
Because there is no uniform practice among our customer base of updating to more recent versions of our software products and, for a variety of reasons, many of our customers do not regularly update to the newest version of our software products, at any point in time our installed base of customers may be running several different versions of our software products. The need to maintain and service multiple versions of the same software product across our installed base of customers can be cumbersome, time consuming and may require more personnel and other resources than would be the case if all of our customers utilized the same versions of our software products. Moreover, the fact that not all of our customers run the same version of our software products can complicate our ability to efficiently release upgrades to, or new versions of, our software products across our installed base. Similar complications to the release and installation of upgrades may be experienced with certain of our cloud-enabled products that have been developed using single tenant architecture, such as our 360 Oncology product. In addition, in many instances, unless a customer has a certain version of our software products installed, their system
27
will not be compatible with certain of our other software or hardware products. Our inability to release new versions of software to customers or to sell customers other products because of incompatibility issues hurts our revenues and may make revenue projection less predictable.
Coding errors in our software and cloud offerings could adversely affect our results of operations.
Despite extensive testing prior to the release and throughout the lifecycle of a product or service, our software and cloud offerings sometimes contain coding or manufacturing errors that can impact their function, performance and security, and result in other negative consequences. The detection and correction of any errors in released software or cloud offerings can be time consuming and costly. Errors in our software or cloud offerings could affect their ability to properly function or operate with other software, hardware or cloud offerings, could delay the development or release of new products or services or new versions of products or services, could create security vulnerabilities in our products or services, and could adversely affect market acceptance of our products or services. If we experience errors or delays in releasing our software or cloud offerings or new versions thereof, our sales could be affected and revenues could decline.
We may not be successful in transitioning our customer base to software solutions deployed via cloud and SaaS solutions.
We are expanding our software product lines and investing in the development of cloud and SaaS solutions. Cloud and SaaS solutions for use in the health care industry must comply with stringent regulations in many of the countries in which our customers are located, particularly in relation to the use and storage of patient health data and privacy, and the regulations vary on a country-by-country basis. Our software products must be compliant with applicable regulation in the country in question before we can operationalize our offerings for customers located in those countries. Ensuring the compliance of our cloud and SaaS solutions with applicable regulation may take longer than expected, occur more slowly in certain countries than in others, require that design changes be developed into our products, or require more financial resources than anticipated.
In addition, even where our cloud and SaaS solutions are compliant with applicable regulation, customers may nevertheless refuse to adopt our products for numerous reasons, particularly in regards to the security of patient health data. Moreover, unless and until our cloud and SaaS solutions find general acceptance among our customer base we would likely need to maintain and continue to develop both our on-premise software product offerings and our cloud and SaaS solution platforms, which could prevent us from realizing the full benefits and efficiencies from transitioning to a cloud platform, result in higher costs and have a material adverse effect on our operating results and financial performance.
An increase in the prevalence of cloud and SaaS delivery models offered by us and our competitors could also unfavorably impact the pricing of our on-premise software offerings, and have a dampening impact on overall demand for our on-premise software product and related service offerings, which could reduce our revenues and profitability, at least in the shorter term. In addition, to the extent that demand for our cloud offerings increases in the future, we may experience volatility in our reported revenues and operating results due to the differences in timing of revenue recognition between our software licenses and our cloud offering arrangements.
Furthermore, our cloud and SaaS software products may reside upon and be hosted by third party providers. A security breach, whether of our products, of our customers’ network security and systems or of third party hosting services, could disrupt treatments utilizing our products, disrupt access to our customers’ stored information, such as patient treatment delivery instructions, and could lead to the loss of, damage to or public disclosure of our customers’ stored information, including patient health information.
ADDITIONAL RISKS RELATING TO OUR VARIAN PARTICLE THERAPY BUSINESS
We participate in project financing for our particle therapy business, which has resulted in impairment charges and could result in payment defaults that adversely affect our financial results.
We have participated along with others in providing financing for the construction and start-up operations of several proton therapy centers and may provide financing to other particle therapy customers in the future. As of September 29, 2017, we had $171.9 million carrying value of loans outstanding to VPT customers, available-for-sale securities, notes receivable and short-term senior secured debt related to the VPT business. See “Management Discussion and Analysis - Overview - Varian Particle Therapy” and Note 16, "VPT Loans and Securities" of the Notes to the Consolidated Financial Statements for the carrying value of our outstanding loans relating to the establishment of proton therapy centers. Providing such financing has affected and could in the future adversely affect, our financial results, since a center may not be completed on time or within budget, or
28
may not generate sufficient patient volumes and revenues to support scheduled loan payments or to facilitate a refinancing. If a borrower does not have the financial means to pay off loan amounts owing to us, and if we cannot recover loan amounts owing to us from the sale of any collateral or through other means, or in the event of a bankruptcy of the borrower, we may be required to write-off all, or a portion, of the loans, which would adversely affect our financial results. For example, in fiscal year 2017, the CPTC, to which we had project financing outstanding, filed for bankruptcy and we recorded $51.4 million in impairment charges related to that financing. We also recorded an allowance for doubtful accounts of $37.8 million related to CPTC and one other proton center in fiscal year 2017. Moreover, as of September 29, 2017, we had $35.0 million in subordinated loans and $25.1 million in long-term notes receivable outstanding from the Maryland Proton Therapy Center (“MPTC”). We have been informed that MPTC intends to refinance its outstanding senior indebtedness in early 2018. If MPTC fails to refinance its senior indebtedness as planned, it may impact debt with later maturities including ours, and we may be required to impair all or a portion of our indebtedness outstanding to MPTC. Please refer to “Management Discussion and Analysis - Overview - Varian Particle Therapy” and Note 16, "VPT Loans and Securities" of the Notes to the Consolidated Financial Statements for a more detailed discussion of the impairment of the loans we extended. Any impairment charges relating to our VPT business could have a material adverse impact our operating results and financial position.
The financial results of our VPT business may be unpredictable and if our proton customers are unsuccessful, our financial results will be adversely affected.
The success of our particle therapy business will depend upon the widespread awareness, acceptance and adoption by the oncology market of proton therapy systems for the treatment of cancer. This technology is expensive and has not been widely adopted. Future developments may not be adopted as quickly as technological developments in more traditional areas of radiation therapy.
Since proton therapy projects are generally large, highly customized and more complex than projects in our Oncology Systems radiotherapy business, planning for these projects takes more resources. Many of the components used in proton therapy equipment require long lead times, which may require an increase in our inventory levels. This may cause fluctuations in the operating results of VPT that may make it difficult to predict our results and to compare our results from period to period.
The construction of a proton therapy facility requires significant capital investment and may involve complex project financing. Consequently, this business is vulnerable to deterioration in general economic and market conditions. Economic downturns, that result in a contraction in credit markets, have made and may continue to make it more difficult for potential customers of this business to find appropriate financing for large proton therapy projects, which could cause them to delay or cancel their projects, or request payment concessions in their agreements with us, which could adversely impact our operating results.
Proton therapy is expensive and changes in reimbursement rates for proton therapy treatments, or uncertainty regarding these reimbursement rates, such as we experienced in 2012 with the reductions to reimbursement rates for hospital based proton therapy centers in the United States by CMS, can affect growth or demand for our VPT products and services.
After a proton therapy facility is established, there can be no assurance that it will have sufficient patient volume to be successful or profitable. If a proton treatment center cannot generate sufficient patient volume, it may lead to a need to refinance or renegotiate debt, seek concession on payments, or ultimately insolvency and bankruptcy, as in the case of CPTC and Rinecker in Germany, which has and may in the future require us to impair loans if we have extended loans to the proton treatment center, or to record an allowance for doubtful accounts against accounts receivables due from the proton treatment center.
Our estimates as to future operating results include certain assumptions about the future results of VPT’s business. If we are incorrect in our assumptions, our financial results could be materially and adversely affected. It is possible that VPT could perform significantly below our expectations due to a number of factors that cannot be predicted with certainty, including future market conditions, market acceptance of proton therapy and reimbursement rates. These factors could adversely impact VPT’s ability to meet its projected results, which could cause a portion or all of the goodwill of VPT to become impaired. As of September 29, 2017, the goodwill of VPT was $52.4 million. VPT's fair value was 21% in excess of its carrying value, and we believe each of the assumptions used to calculate VPT’s fair value to be reasonable. However, VPT could be at risk for future goodwill impairment because adjustments to revenue growth rates, operating margins, weighted-average cost of capital ("WACC") and/or our working capital used in the fair value calculation could lead to an impairment. If we determine that VPT’s goodwill becomes impaired, we would be required to record a charge that could have a material adverse effect on our results of operations in such period.
29
We compete for many proton therapy system sales through tenders, where parties compete on price and other factors. Many companies sell their products at a lower price than we do. If we are unable to lower our prices or our customers are not willing to pay for additional features and functionality that we may provide, we may lose sales, and if we lower our prices to gain business, our margins and other financial results may suffer. Further, the award of certain proton therapy system orders may be subject to challenge by third parties, which can make these orders more unpredictable than orders for other products. Because an order for a proton therapy system can be large and complex, and the sales cycle for proton therapy projects may take several years, an order in one fiscal period may cause our gross orders and revenues to vary significantly, making it difficult to predict and compare our results of operations from period to period.
We expect that a limited number of customers will account for a substantial portion of VPT’s business for the foreseeable future. In instances where one customer undertakes multiple proton center projects, an adverse event with respect to one project could cause an adverse event with respect to the other projects, which in turn could adversely impact our operating results and financial position.
Our VPT business may subject us to increased liability.
VPT’s business may subject us to increased liability. For example, because proton therapy projects are large in scale and require detailed project planning, failure to deliver or delays in delivering on our commitments could result in greater than expected liabilities, as we could be required to indemnify business partners and customers for losses suffered or incurred if we are unable to deliver our products in accordance with the terms of customer contracts. Additionally, customers have in the past requested and may in the future request that the systems vendor, as the primary technology provider, provide guarantees for and suffer penalties in relation to the overall construction project. Since the cost of each proton therapy center project can often exceed $100 million, the amount of potential liability and potential for financial loss would likely be higher than the levels historically assumed by us for our traditional radiation therapy business and may also exceed the project’s value. Insurance covering these contingencies may be unobtainable or expensive. If we cannot reasonably mitigate or eliminate these contingencies or risks, our ability to competitively bid upon proton center projects will be negatively impacted or we may be required to assume material amounts of potential liability, all of which may have adverse consequences to us.
RISKS RELATING TO THE MANUFACTURE OF OUR PRODUCTS
Any inability to obtain supplies of important components could restrict the manufacture of products, cause delays in delivery, or significantly increase our costs.
We obtain some of the components included in our products from a limited group of suppliers or from a single source supplier, such as the radioactive sources for high dose rate brachytherapy, klystrons for linear accelerators and specialized integrated circuits and various other components; and radiofrequency components, magnets and gantry hardware for proton therapy systems.
If we lose any of these suppliers, if their operations were substantially interrupted, or if any of them failed to meet performance or quality specifications, we may be required to obtain and qualify one or more replacement suppliers. Such an event may then also require us to redesign or modify our products to incorporate new parts and/or further require us to obtain clearance, qualification or certification of these products by the FDA or obtain other applicable regulatory approvals in other countries. Events like these could significantly increase costs for the affected product and likely cause material delays in delivery of our products, which could have an adverse effect on our revenue and results of operations.
Some of our single-source suppliers provide components for some of our growing product lines. Manufacturing capacity limitations of any of our suppliers or other inability of these suppliers to meet increasing demand could adversely affect us, resulting in curtailed growth opportunities for our affected product lines. Shortage of, and greater demand for, components and subassemblies could also increase manufacturing costs if the supply/demand imbalance increases the price of the components and subassemblies. Disruptions or loss of any of our limited-sourced or sole-sourced components or subassemblies or the capacity limitations of the suppliers for these components or subassemblies could adversely affect our business and financial results and could damage our customer relationships.
In addition, following the separation of our former Imaging Components business into Varex in January 2017, Varex is the sole source supplier of tubes, panels and detector components used in certain of our products, such as our On-Board Imager. Any disruption or reduction in the supply of these components could result in delays or reductions in our product deliveries, which could adversely affect our business and financial results and could damage our customer relationships. Also, any unforecasted increases in the price of these components could adversely impact our profitability.
30
A shortage or change in source of raw materials could restrict our ability to manufacture products, cause delays, or significantly increase our cost of goods.
We rely upon the supplies of certain raw materials such as tungsten, lead, iridium and copper for Oncology Systems and high-grade steel, high-grade copper and iron for VPT. Worldwide demand, availability and pricing of these raw materials have been volatile, and we expect that availability and pricing will continue to fluctuate in the future. If supplies are restricted or become unavailable or if prices increase, this could constrain our manufacturing of affected products, reduce our profit margins or otherwise adversely affect our business.
Pursuant to the Dodd-Frank Wall Street Reform and Consumer Protection Act, the SEC has promulgated rules regarding disclosure of the presence in a company’s products of certain metals, known as “conflict minerals,” which are metals mined from the Democratic Republic of the Congo and adjoining countries, as well as procedures regarding a manufacturer’s efforts to identify the sourcing of those minerals from this region. Complying with these rules requires investigative efforts, which has and will continue to cause us to incur associated costs, and could adversely affect the sourcing, supply, and pricing of materials used in our products, or result in process or manufacturing modifications, all of which could adversely affect our results of operations.
Our financial results may suffer if we are not able to match our manufacturing capacity with demand for our products.
Many of our products have a long production cycle, and we need to anticipate demand for our products in order to ensure adequate manufacturing or testing capacity. If we are unable to anticipate demand and our manufacturing or testing capacity does not keep pace with product demand, we will not be able to fulfill orders in a timely manner, which may negatively impact our financial results and overall business. Conversely, if demand for our products decreases, the fixed costs associated with excess manufacturing capacity may harm our financial results.
We rely on third parties to perform spare parts shipping and other logistics functions on our behalf. Disruptions at our logistics providers may adversely impact our business.
Third-party logistics providers store a significant portion of our spare parts inventory in depots around the world and perform a significant portion of our spare parts logistics and shipping activities. If any of our logistics providers terminates its relationship with us, suffers an interruption in its business, or experiences delays, disruptions or quality control problems in its operations, or if we have to change and qualify alternative logistics providers for our spare parts, shipments of spare parts to our customers may be delayed and our reputation, business, financial condition and results of operations may be adversely affected.
RISKS RELATING TO OUR REGULATORY ENVIRONMENT
We face significant costs in complying with laws and regulations, and failure or delays in obtaining regulatory approvals or complying with laws and regulations could prevent product distribution, require product recalls, and result in significant penalties.
Our products and operations are subject to regulation by the FDA, the State of California, the Nuclear Regulatory Commission (‘NRC”) and countries or regions in which we market our products. In addition, our products must meet the requirements of a large and growing body of international standards which govern the design, manufacture, materials content and source, testing, certification, packaging, installation, use and disposal of our products. We must continually keep abreast of these standards and requirements and integrate our compliance protocols into the development and regulatory documentation for our products. Failure to obtain regulatory approval in a timely manner and to meet all local requirements including language and specific safety standards in any foreign country in which we plan to market our products could prevent us from marketing products in such countries or subject us to sanctions and fines.
United States FDA Regulations. Unless an exception applies, the FDA requires that the manufacturer of a new medical device obtain either 510(k) pre-market notification clearance or pre-market approval (“PMA”) before it can market or sell those products in the United States. Certain of our devices are subject to 510(k) clearance while others are exempt from 510(k) clearance. Modifications or enhancements to a product that could significantly affect its safety or effectiveness, or that would constitute a major change in the intended use of the device, technology, materials, labeling, packaging, or manufacturing process also require a new 510(k) clearance. Manufacturers make the initial determination whether a change to a cleared device requires a new 510(k) clearance, but the FDA can review any such decision. If the FDA disagrees with a manufacturer’s
31
decision not to seek a new 510(k) clearance or PMA approval for a change, the FDA may retroactively require the manufacturer to seek 510(k) clearance or PMA approval. The FDA also can require the manufacturer to cease United States marketing and/or recall the modified device until 510(k) clearance or PMA approval is obtained. The FDA clearance process is uncertain and we may not be able to obtain the necessary clearances or approvals in a timely manner or at all.
We do not manufacture Class III medical devices which require PMA. The PMA process is more complex than the 510(k) clearance. As we enter new businesses or pursue new business opportunities that require clinical trials, we may seek to conduct clinical studies or trials in the United States or other countries on products that have not yet been cleared or approved for a particular indication. Additional regulations govern the approval, initiation, conduct, documentation and reporting of clinical studies to regulatory agencies in the countries or regions in which they are conducted. Such investigational use is generally also regulated by local and institutional requirements and policies which usually include review by an ethics committee or institutional review board (‘IRB”). Failure to comply with all regulations governing such studies could subject us to significant enforcement actions and sanctions, including halting of the study, seizure of investigational devices or data, sanctions against investigators, civil or criminal penalties, and other actions. Without the data from one or more clinical studies, it may not be possible for us to secure the data necessary to support certain regulatory submissions, to secure reimbursement or demonstrate other requirements. We cannot assure you that access to clinical investigators, sites and subjects, documentation and data will be available on the terms and timeframes necessary.
The FDA has issued draft guidance that, if finalized and implemented, will result in manufacturers needing to seek a significant number of new clearances for changes made to legally marketed devices. If we cannot establish that a proposed product is substantially equivalent to a legally marketed device, we must seek pre-market approval through a PMA application. Under the PMA process, the applicant submits extensive supporting data, including, in most cases, data from clinical studies, in the PMA application to establish reasonable evidence of the safety and effectiveness of the product. This process typically takes at least one to two years from the date the PMA is accepted for filing, but can take significantly longer for the FDA to review.
In addition, after a device is placed on the market, numerous FDA and other regulatory requirements continue to apply. These include compliance with the medical device reporting regulations (“MDRs”), that require that we report to regulatory authorities if our devices may have caused or contributed to a death or serious injury or malfunctioned in a way that would likely cause or contribute to a death or serious injury if the malfunction were to recur, and compliance with corrections and removal reporting regulations, which require that manufacturers report to the FDA field corrections and product recalls or removals if undertaken to reduce a risk to health posed by the device or to remedy a violation of the FFDCA that may present a risk to health. If these reports are not filed on a timely basis, regulators may impose sanctions and sales of our products may suffer, and we may be subject to product liability or regulatory enforcement actions, all of which could harm our business. The FDA and the Federal Trade Commission (“FTC”) also regulate the advertising and promotion of our products to ensure that the claims we make are consistent with our regulatory clearances, that there is scientific data to substantiate the claims and that our advertising is neither false nor misleading. In general, we may not promote or advertise our products for uses not within the scope of our intended use statement in our clearances or make unsupported safety and effectiveness claims. Many regulatory jurisdictions outside of the United States have similar regulations to which we are subject.
Our manufacturing operations for medical devices, and those of our third-party suppliers are required to comply with the FDA’s Quality System Regulation (“QSR”), as well as other federal and state regulations for medical devices and radiation-emitting products. The QSR covers, among other things, the methods used in, and the facilities and controls used for, the design, manufacture, packaging, labeling, storage, installation, and servicing of all medical devices intended for human use. The QSR also requires maintenance of extensive records which demonstrate compliance with FDA regulation, the manufacturer’s own procedures, specifications and testing as well as distribution and post-market experience. Compliance with the QSR is necessary to receive FDA clearance or approval to market new products and is necessary for a manufacturer to be able to continue to market cleared or approved product offerings in the United States. The FDA makes announced and unannounced periodic and on-going inspections of medical device manufacturers to determine compliance with the QSR. In connection with these inspections, the FDA issues reports, known as Form FDA 483 reports, when it believes the manufacturer has failed to comply with applicable regulations and/or procedures. If observations from the inspection are not addressed, and/or corrective action is not taken in a timely manner and to the FDA’s satisfaction, the FDA may issue an Untitled Letter, a Warning Letter and/or proceed directly to other forms of enforcement action. Failure to respond timely to Form FDA 483 observations, a Warning Letter or other notice of noncompliance and to promptly come into compliance could result in fines, injunctions, civil penalties, delays, suspension or withdrawal of clearances, seizures or recalls of products, operating restrictions, total shutdown of production facilities, prohibition on export or import and criminal prosecution. Such actions may have further indirect consequences for the manufacturer outside of the United States, and may adversely affect the reputation of the manufacturer and the product.
32
United States NRC Regulations. Our products utilizing radioactive material are also subject to the NRC clearance and approval requirements, and the manufacture and sale of these products are subject to federal and state regulation that varies from state to state and among regions. The manufacture, distribution, installation and service (and decommissioning and removal) of medical devices utilizing radioactive material or emitting radiation also requires a number of licenses and certifications. Service of these products must also be in accordance with a specific radioactive materials license. In addition, the handling and disposal of radioactive materials resulting from the manufacture, use or disposal of our products may impose significant requirements. Disposal sites for the lawful disposal of materials generated by the manufacture, use or decommissioning of our products may no longer accept these materials in the future, or may accept them on unfavorable terms.
Foreign regulations. In general, outside the United States, our products are regulated as medical devices by foreign governmental agencies similar to the FDA. In order for us to market our products internationally, we must obtain clearances or approvals for products and product modifications. These processes (including for example in the European Union (“EU”), the European Economic Area (“EEA”), Switzerland, China, Japan and Canada) can be time consuming, burdensome and uncertain, which can delay our ability to market products in those countries. Failure to obtain regulatory approval in a timely manner and to meet all local requirements including language and specific safety standards in any foreign country in which we plan to market our products could prevent us from marketing products in such countries or subject us to sanctions and fines.
Within the EEA, we must affix a CE mark, a marking of conformity that indicates that a product meets the essential requirements of the Medical Device Directive. This conformity to the Medical Device Directive is done through self-declaration and is verified by an independent certification body, called a “Notified Body.” Once the CE mark is affixed, the Notified Body will regularly audit us to ensure that we remain in compliance with the applicable European laws and Medical Device Directive. By affixing the CE mark marking to our product, we are certifying that our products comply with the laws and regulations required by the EEA countries, thereby allowing the free movement of our products within these countries and others that accept CE mark standards. If we cannot support our performance claims and demonstrate compliance with the applicable European laws and Medical Device Directive, we would lose our right to affix the CE mark to our products, which would prevent us from selling our products within the EU/EEA/Switzerland territory and in other countries that recognize the CE mark.
In April 2017, the Medical Device Regulation was adopted to replace the Medical Device Directive. The Medical Device Regulation will apply after a three-year transition period and imposes stricter requirements for the marketing and sale of medical devices and grants Notified Bodies increased post-market surveillance authority. We may be subject to risks associated with additional testing, modification, certification or amendment of our existing market authorizations, or we may be required to modify products already installed at our customers’ facilities to comply with the official interpretations of these revised regulations.
We are also subject to laws and regulations that apply to manufacturers of radiation emitting devices and products utilizing radioactive materials, as well as laws and regulations of general applicability relating to matters such as environmental protection, safe working conditions, manufacturing practices and other matters. These are often comparable to, if not more stringent than, the equivalent regulations in the United States. Sales overseas are also affected by regulation of matters such as product standards, packaging, labeling, environmental and product recycling requirements, import and export restrictions, tariffs, duties and taxes. In some countries, we rely on our foreign distributors and agents to assist us in complying with foreign regulatory requirements, and we cannot be sure that they will always do so.
We are also subject to international “fraud and abuse” laws and regulations, as well as false claims and misleading advertisement laws. From time to time, these laws and regulations may be revised or interpreted in ways that could make it more difficult for our customers to conduct their businesses, which could have an adverse effect on the demand for our products, and therefore our business and results of operations. The laws and regulations and their enforcement are constantly undergoing change, and we cannot predict what effect, if any, changes to these laws and regulations may have on our business.
Data Privacy Laws. We are subject to laws and regulations in foreign countries covering data privacy and other protection of health and employee information. Particularly within the EU/EEA/Switzerland area, data protection legislation is comprehensive and complex. Data protection authorities from the different member states of the EU may interpret the legislation differently, which adds to this complexity, and data protection is a dynamic field where guidance is often revised. Fully understanding and implementing this legislation could be quite costly and time consuming, which could adversely affect our business. Additionally, in some instances, in order to fulfill the requirements of applicable U.S. laws, we may be faced with deciding whether to comply with EU/EEA/Switzerland data protection rules. Failure or partial failure to comply with data protection rules and regulations across the EU/EEA/Switzerland area could result in substantial monetary fines. New data protection legislation that entails substantial changes to the current legal framework, some stricter than before, some less strict, was enacted by the EU Commission and will come into effect in 2018.
33
Other United States Healthcare Laws. As a participant in the healthcare industry, we are also subject to federal and state laws and regulations pertaining to patient privacy and data security, fraud and abuse and physician payment transparency. The laws and regulations and their enforcement are constantly undergoing change, and we cannot predict what effect, if any, changes to these laws and regulations may have on our business. Government regulation also may cause considerable delay or even prevent the marketing and full commercialization of future products or services that we may develop. Non-compliance with “anti-kickback”, “false claims” and transparency laws and regulations can result in civil and criminal penalties, which can be substantial, and potential mandatory or discretionary exclusion from healthcare programs. These healthcare laws include:
• | The Medicare and Medicaid “anti-kickback” laws, and similar state laws, that prohibit payments or other remuneration intended to induce hospitals, physicians or others either to refer patients or to purchase, lease or order, or arrange for or recommend the purchase, lease or order of healthcare products or services for which payment may be made under federal and state healthcare programs, such as Medicare and Medicaid. These laws affect our sales, marketing and other promotional activities by limiting the kinds of financial arrangements we may have with hospitals, physicians or other potential purchasers of our products. They particularly impact how we structure our sales offerings, including discount practices, customer support, education and training programs, physician consulting, research grants and other service arrangements. These laws are broadly written, and it is often difficult to determine precisely how these laws will be applied to specific circumstances. |
• | Federal and state “false claims” laws generally prohibit knowingly presenting, or causing to be presented, claims for payment from Medicare, Medicaid or other government payors that are false or fraudulent, or for items or services that were not provided as claimed. Although we do not submit claims directly to payors, manufacturers can be, and have been, held liable under these laws if they are deemed to “cause” the submission of false or fraudulent claims by providing inaccurate billing or coding information to customers, or through certain other activities, including promoting products for uses not approved or cleared by the FDA. |
• | State and federal transparency laws, including laws in Massachusetts and Vermont, and the federal Physician Payment Sunshine Act which require, among other things, the disclosure of equity ownership and payments to physicians, healthcare providers and hospitals. |
Any failure or delay in complying with one or more of the regulatory requirements we face could result in reduced sales, increased costs, and harm to our reputation and competitiveness, all of which could have a material adverse effect on our business and financial results.
The Affordable Care Act includes provisions that may adversely affect our business, including an excise tax on the sales of most medical devices.
The Patient Protection and Affordable Care Act, as amended by the Health Care and Education Reconciliation Act (collectively, the “ACA”) became effective in 2010. The ACA could adversely impact the demand for our products and services, and therefore our financial position and results of operations, possibly materially. Specifically, one of the components of the ACA is a 2.3% excise tax on sales of most medical devices, which include our Oncology Systems and VPT products, which took effect on January 1, 2013. This tax has had, and may in the future continue to have, a negative impact on our gross margin, but was suspended for 2016 and 2017. Unless there is further legislative action, the tax will be automatically reinstated for sales of medical devices on or after January 1, 2018.
In addition, discussions relating to the ACA have included the possibility for bundled reimbursement payments and accountable care organizations (“ACOs”). ACOs and bundled payment programs were established by the ACA to reward integrated, efficient care and allow providers to share in any savings they achieve through the coordination of care and meeting certain mandated quality standards. ACOs and the bundled payment programs have primarily focused on primary care. However, some customers appear to be developing new partnerships across clinical specialties to prepare for the possibility of operating in an ACO environment and bundled reimbursement payments. These and other elements of the ACA, including comparative effectiveness research, an independent payment advisory board, payment system reforms (including shared savings pilots) and the reporting of certain payments by us to healthcare professionals and hospitals, could meaningfully change the way healthcare is developed and delivered, and may materially impact numerous aspects of our business, including the demand and availability of our products, the reimbursement available for our products from governmental and third-party payors, and medical procedure volumes. We believe that growth of the radiation oncology market, which includes both traditional radiation therapy as well as proton therapy, in the United States could be adversely impacted as customers’ decision-making processes
34
are complicated by the uncertainties surrounding the implementation of the ACA and reimbursement rates for radiotherapy and radiosurgery, and that this uncertainty will likely continue into the next fiscal year and could result in a high degree of variability of gross orders and revenues from quarter-to-quarter.
Various healthcare reform proposals have also emerged at the state level, and we are unable to predict which, if any of these proposals will be enacted. We are also unable to predict what effect ongoing uncertainty surrounding federal and state health reform proposals, uncertainty related to implementation of ACA provisions, and instability within insurance markets created under the ACA, will have on our customer’s purchasing decisions. However, an expansion in government’s role in the United States healthcare industry may adversely affect our business, possibly materially. In addition, it is possible that changes in administration and policy, including the potential repeal of all or parts of the ACA could result in additional proposals and/or changes to health care system legislation which could have a material adverse effect on our business. The full effect that a full or partial repeal of the ACA would have on our business remains unclear at this time.
More recently, President Trump has signed an executive order and made statements that suggest he plans to seek repeal of all or portions of the ACA, and has asked Congress to replace the current legislation with new legislation. There is uncertainty with respect to the impact President Trump’s administration may have, if any, and any changes likely will take time to unfold, and could have an impact on coverage and reimbursement for healthcare items and services covered by plans that were authorized by the ACA. However, we cannot predict the ultimate content, timing or effect of any healthcare reform legislation or the impact of potential legislation on us.
Changes to radiation oncology, reimbursements, and insurance deductibles and administration may affect demand for our products.
Sales of our healthcare products indirectly depend on whether adequate reimbursement is available to our customers from a variety of sources, such as government healthcare insurance programs, including the Medicare and Medicaid programs; private insurance plans; health maintenance organizations; and preferred provider organizations. In general, employers and third-party payors in the United States have become increasingly cost-conscious, with higher deductibles imposed or encouraged in many medical plans. The imposition of higher deductibles tends to inhibit individuals from seeking the same level of medical treatments as they might seek if the costs were lower. Third-party payors have also increased utilization controls related to the use of our products by healthcare providers.
There is no uniform policy on reimbursement among third-party payors, and we cannot be sure that third-party payors will reimburse our customers at a level that will enable us to achieve or maintain adequate sales and price levels for our products. Without adequate support from third-party payors, the market for our products may be limited.
Once Medicare makes a decision to provide reimbursement for a given treatment, these reimbursement rates are generally reviewed and adjusted by Medicare annually. Private third-party payors, although independent from Medicare, sometimes use portions of Medicare reimbursement policies and payment amounts in making their own reimbursement decisions. As a result, decisions by the Centers for Medicare and Medicaid Services ("CMS") to reimburse for a treatment, or changes to Medicare’s reimbursement policies or reductions in payment amounts may extend to third-party payor reimbursement policies and amounts for that treatment. We have seen our customers’ decision-making process complicated by the uncertainty surrounding Medicare reimbursement rates for radiotherapy and radiosurgery in the United States. From time to time, CMS and third-party payors may review and modify the factors upon which they rely to determine appropriate levels of reimbursement for cancer treatments. For example, CMS and third-party payors have begun to focus on the comparative effectiveness of radiation therapy versus other methods of cancer treatment, including surgery, and could modify reimbursement rates based on the results of comparative effectiveness studies. In addition, discussions relating to the Affordable Care Act have included the possibility for bundled reimbursement payments and ACOs. Any significant cuts in reimbursement rates or changes in reimbursement methodology or administration for radiotherapy, radiosurgery, proton therapy or brachytherapy, or concerns or proposals regarding further cuts or changes in methodology or administration, could further increase uncertainty, influence our customers’ decisions, reduce demand for our products, cause customers to cancel orders and have a material adverse effect on results of operations, financial position and stock price.
In April 2015, the Medicare Access and CHIP Reauthorization Act of 2015 (“MACRA”) was signed into law, which made numerous changes to Medicare, Medicaid, and other healthcare related programs. These changes include new systems for establishing the annual updates to payment rates for physicians’ services in Medicare. MACRA became effective on January 1, 2017. Our business may be significantly affected by MACRA and any changes in reimbursement policies and other legislative initiatives aimed at or having the effect of reducing healthcare costs associated with Medicare and other government healthcare programs.
35
Foreign governments also have their own healthcare reimbursement systems and there can be no assurance that adequate reimbursement will be made available with respect to our products under any foreign reimbursement system.
Any violation of federal, state and foreign laws governing our business practices may result in substantial penalties. Investigation into our business practices could cause adverse publicity and harm our business.
Anti-corruption laws and regulations. We are subject to the United States Foreign Corrupt Practices Act and anti-corruption laws, and similar laws in foreign countries, such as the U.K. Bribery Act of 2010, which became effective on July 1, 2011, and the Law “On the Fundamentals of Health Protection in the Russian Federation,” which became effective in January 2012. Any violation of these laws by us or our agents or distributors could create a substantial liability for us, subject our officers and directors to personal liability and also cause a loss of reputation in the market. Transparency International’s 2016 Corruption Perceptions Index found that approximately sixty-nine percent of the countries in the index, including many that we consider to be high growth areas for our products, such as China, India, Russia and Brazil, scored below 50, on a scale from 100 (very clean) to 0 (highly corrupt). We currently operate in many countries where the public sector is perceived as being more or highly corrupt. Our strategic business plans include expanding our business in regions and countries that are rated as higher risk for corruption activity by Transparency International. Increased business in higher risk countries could subject us and our officers and directors to increased scrutiny and increased liability.
In addition, we have conducted, and in the future expect to conduct internal investigations or face audits or investigations by one or more domestic or foreign government agencies. For example, in June 2015, one of our foreign subsidiaries was charged by the Department for Investigation and Penal Action of Lisbon with alleged improper activities relating to three tenders of medical equipment in Portugal during the period of 2003 to 2009. We previously undertook an internal investigation of this matter and voluntarily disclosed the results of this investigation to the United States Department of Justice and the United States Securities and Exchange Commission. After the Company requested a judicial review available under Portuguese criminal procedure processes as to whether or not such charges are proper under Portuguese law, the matter was resolved and definitively dismissed on December 9, 2016, with no adverse findings or charges against the Company. Any such proceeding results in costs and management distraction, which could adversely affect our business and financial results. An adverse outcome under any such proceeding, investigation or audit could subject us to fines, or criminal or other penalties, which could adversely affect our business and financial results.
Competition laws. We are subject to competition laws in the regions where we do business. Regulatory authorities under whose laws we operate may have enforcement powers that can subject us to sanctions, and can impose changes or conditions in the way we conduct our business. In addition, an increasing number of jurisdictions also provide private rights of action for competitors or consumers to seek damages asserting claims of anti-competitive conduct. Increased government scrutiny of our actions or enforcement or private rights of action could adversely affect our business or damage our reputation. In addition, we have conducted, and in the future expect to conduct, internal investigations or face audits or investigations by one or more domestic or foreign government agencies, which could be costly and time-consuming, and could divert our management and key personnel from our business operations. An adverse outcome under any such investigation or audit could subject us to fines or criminal or other penalties, which could adversely affect our business and financial results.
Environmental laws impose compliance costs on our business and can result in liability.
We are subject to environmental laws around the world. These laws regulate many aspects of our operations, including our handling, storage, transport and disposal of hazardous materials. They can also impose cleanup liabilities, including with respect to discontinued operations. As a consequence, we can incur significant environmental costs and liabilities, some recurring and others not recurring. Although we follow procedures intended to comply with existing environmental laws, we, like other businesses, can never completely eliminate the risk of contamination or injury from certain materials that we use in our business and, therefore, the prospect of resulting claims and damage payments. We may also be assessed fines or penalties for failure to comply with environmental laws and regulations. Although insurance has provided coverage for portions of cleanup costs resulting from historical occurrences, we maintain only limited insurance coverage for costs or claims that might result from any future contamination.
Future changes in environmental laws could also increase our costs of doing business, perhaps significantly. Several countries, including some in the EU, now require medical equipment manufacturers to bear certain disposal costs of products at the end of the product’s useful life, increasing our costs. The EU has also adopted directives that may lead to restrictions on the use of certain hazardous substances or other regulated substances in some of our products sold there. These directives, along with another that requires substance information to be provided upon request, could increase our operating costs in order to maintain
36
access to certain markets. All of these costs, and any future violations or liabilities under environmental laws or regulations, could have a material adverse effect on our business.
Proposed changes to U.S. tax law may result in a reduced corporate tax rate, while also limiting or eliminating certain tax deductions and changing the taxation of foreign earnings of U.S. multinational companies. These changes could have a material adverse impact on the value of our deferred tax assets, our income taxes payable and our effective tax rate.
The U.S. Congress is considering significant changes to the U.S. tax code, including a reduction in the corporate tax rate, and changes to a number of deductions and to the treatment of foreign earnings of U.S. multinational companies. Our net deferred tax assets are measured using tax rates under current law. The proposed reduction in the corporate tax rate would result in a significant reduction in the value of our existing deferred tax assets, and consequently a charge to our earnings, in the period in which any rate change is enacted. The proposed changes also include a mandatory deemed repatriation of the foreign earnings of a U.S. company's foreign subsidiaries. If enacted, this proposal could result in an increase in our provision for income taxes in the period in which the proposal is enacted. At this time, it is uncertain whether or when any such tax reform proposals will be enacted into law and the ultimate impact of such legislation on our business and financial results is uncertain.
RISKS RELATING TO OUR INTELLECTUAL PROPERTY
Protecting our intellectual property can be costly and we may not be able to maintain licensed rights, which would harm our business.
We file applications for patents covering new products and manufacturing processes. We cannot assure you that our current patents, the claims allowed under our current patents, or patents for technologies licensed to us will be sufficiently broad to protect our technology position against competitors. Issued patents owned by, or licensed to, us may be challenged, invalidated or circumvented, or the rights granted under the patents may not provide us with competitive advantages. We also cannot be sure that patents will be issued from any of our pending or future patent applications. Asserting our patent rights against others in litigation or other legal proceedings is costly and diverts managerial resources. An unfavorable outcome in such litigation or proceedings could harm us. In addition, we may not be able to detect patent infringement by others or may lose our competitive position in the market before we are able to do so.
We also rely on a combination of copyright, trade secret and other laws, and contractual restrictions on disclosure, copying and transferring title (including confidentiality agreements with vendors, strategic partners, co-developers, employees, consultants and other third parties), to protect our proprietary and other confidential rights. These protections may prove inadequate, since agreements may still be breached and we may not have adequate remedies for a breach, and our trade secrets may otherwise become known to or be independently developed by others. In the event that our proprietary or confidential information is misappropriated, our business and financial results could be adversely impacted. We have trademarks, both registered and unregistered, that are maintained and enforced to provide customer recognition for our products in the marketplace, but unauthorized third parties may still use them. We also have agreements with third parties that license to us certain patented or proprietary technologies. In some cases, products with substantial revenues may depend on these license rights. If we were to lose the rights to license these technologies, or our costs to license these technologies were to materially increase, our business would suffer.
Third parties may claim we are infringing their intellectual property, and we could suffer significant litigation or licensing expenses or be prevented from selling our products.
There is a substantial amount of litigation over patent and other intellectual property rights in the industries in which we compete. Our competitors, like companies in many high technology businesses, continually review other companies’ activities for possible conflicts with their own intellectual property rights. In addition, non-practicing entities may review our activities for conflicts with their patent rights. Determining whether a product infringes a third party’s intellectual property rights involves complex legal and factual issues, and the outcome of this type of litigation is uncertain. Third parties may claim that we are infringing their intellectual property rights. We may not be aware of intellectual property rights of others that relate to our products, services or technologies. From time to time, we have received notices from third parties asserting infringement and we have been subject to lawsuits alleging infringement of third-party patent or other intellectual property rights. Any dispute regarding patents or other intellectual property could be costly and time-consuming, and could divert our management and key personnel from our business operations. We may not prevail in a dispute. We do not maintain insurance for intellectual property infringement, so costs of defense, whether or not we are successful in defending an infringement claim, will be borne by us and could be significant. If we are unsuccessful in defending or appealing an infringement claim, we may be subject to
37
significant damages and our consolidated financial position, results of operations or cash flows could be materially adversely affected. We may also be subject to injunctions against development and sale of our products, the effect of which could be to materially reduce our revenues.
RISKS RELATING TO OUR COMMON STOCK
Fluctuations in our operating results, including quarterly gross orders, revenues, margins, and cash flows may cause our stock price to be volatile, resulting in losses for our stockholders.
We have experienced and expect to experience fluctuations in our operating results, including gross orders, revenues, margins and cash flows from period to period. Drivers of orders include the introduction and timing of announcement of new products or product enhancements by us and our competitors, as well as changes or anticipated changes in third-party reimbursement amounts or policies applicable to treatments using our products. The availability of economic stimulus packages or other government funding, or reductions thereof, may also affect timing of customer purchases. Many of our products require significant capital expenditures by our customers. Accordingly, individual product orders can be quite large in dollar amounts, which can extend the customer purchasing cycle. We have experienced this with our IGRT products, and it is especially true with our proton therapy products because of the high cost of the proton therapy equipment and the complexity of project financing. In addition, the budgeting cycles of hospitals and clinics for capital equipment purchases are frequently fixed well in advance. Economic uncertainty also tends to extend the purchasing cycle as potential customers more closely scrutinize and prioritize their capital spending budgets, and analyze appropriate financing alternatives. In addition, some of our more sophisticated equipment, such as IGRT and proton therapy products, requires greater site preparation and longer construction cycles, which can delay customer decision cycles and the placement of orders even further. The timing of order placement, equipment installation and revenue recognition affect our quarterly results.
Once orders are received and booked into backlog, factors that may affect whether these orders become revenue (or are cancelled or deemed dormant and reflected as a reduction in the backlog amounts) and the timing of revenue include:
• | delay in shipment due, for example, to an unanticipated construction delay at a customer location where our products are to be installed, cancellations or reschedulings by customers, extreme weather conditions, natural disasters, port strikes or other labor actions; |
•a challenge to a bid award for one or more of our products;
•delay in the installation and/or acceptance of a product;
•failure to satisfy contingencies associated with an order;
•the method of accounting used to recognize revenue;
•a change in a customer’s financial condition or ability to obtain financing; or
•timing of necessary regulatory approvals or authorizations.
Our operating results, including our margins, may also be affected by a number of other factors, including:
•changes in our or our competitors’ pricing or discount levels;
•impairment of loans, notes receivables, accounts receivable;
•changes in foreign currency exchange rates;
•changes in the relative mix between higher margin and lower margin products;
•changes in the relative portion of our revenues represented by different geographic regions;
•fluctuation in our effective tax rate, which may or may not be known to us in advance;
•changes to our organizational structure, which may result in restructuring or other charges;
• | disruptions in the supply or changes in the costs of raw materials, labor, product components or transportation services; |
• | disruptions in our operations, including our ability to manufacture products, caused by events such as earthquakes, fires, floods, terrorist attacks or the outbreak of epidemic diseases; |
38
• | the unfavorable outcome of any litigation or administrative proceeding or inquiry, as well as ongoing costs associated with legal proceedings; and |
•accounting changes and adoption of new accounting pronouncements.
Because many of our operating expenses are based on anticipated capacity levels and a high percentage of these expenses are fixed for the short term, a small variation in the timing of revenue recognition can cause significant variations in operating results from quarter to quarter. Our overall gross margin may also be impacted by the gross margin of our proton therapy products, which presently carry lower gross margins than do our traditional radiotherapy products. If our gross margins fall below the expectation of securities analysts and investors, the trading price of VMS common stock would likely decline.
We report our gross orders and backlog on a quarterly and annual basis. It is important to understand that, unlike revenues, gross orders and backlog are not governed by GAAP, and are not within the scope of the quarterly review or annual audit conducted by our independent registered public accounting firm; therefore, investors should not interpret our gross orders or backlog in such a manner. Also, for the reasons set forth above, our gross orders and backlog cannot necessarily be relied upon as accurate predictors of future revenues. Order cancellation or delays in delivery dates will reduce our backlog and future revenues, and we cannot predict if or when orders will mature into revenues. Particularly high levels of cancellations in one period will make it difficult to compare our operating results for other periods.
In addition, our gross orders, backlog, revenues and net earnings in one or more future periods may fall below the expectations of securities analysts and investors. In that event, the trading price of VMS common stock would almost certainly decline.
Item 1B. Unresolved Staff Comments
None.
Item 2. Properties
As of September 29, 2017, we owned and leased a total of approximately 1.8 million square feet of floor space for office, manufacturing, research and development and other services worldwide. Our executive offices, our Oncology Systems management and some of our Oncology Systems manufacturing facilities are located in Palo Alto, California, on approximately 30 acres of land under leasehold which expires in 2056. We own these facilities which contain approximately 481,000 square feet of space. In Crawley, England, we own approximately 2 acres of land and approximately 48,000 square feet of space used for office space and manufacturing. In Beijing, China, we have approximately 5 acres of land under leasehold that expires in 2056, and own approximately 147,000 square feet of space used for office space and manufacturing. In Jundiai, Brazil, we own approximately 4 acres of land, and we are in the process of constructing a building, which will become operational in fiscal year 2018, that will be used for light assembly, office space and customer training. In Las Vegas, Nevada, we own approximately 8 acres of land and approximately 97,000 square feet of space where we have Oncology Systems customer service and support operations. The balance of our remaining facilities are leased to support our business operations worldwide.
Substantially all of this space is fully utilized for its intended purpose. We believe that our facilities and equipment are generally well maintained, in good operating condition and adequate for our present operations.
39
Item 3. Legal Proceedings
In 1999, we transferred our instruments business to Varian, Inc. (“VI”) and our semiconductor equipment business to Varian Semiconductor Equipment Associates, Inc. (“VSEA”) and subsequently spun off VI and VSEA, which resulted in a non-cash dividend to our stockholders (the “Spin-offs”). Under the Amended and Restated Distribution Agreement dated as of January 14, 1999 and other associated agreements that govern the Spin-offs, we retained the liabilities related to the medical systems business and agreed to manage and defend claims related to legal proceedings and environmental matters arising from corporate and discontinued operations. Generally, each of the spun-off subsidiaries is obligated to indemnify us for one third of these liabilities (after adjusting for any insurance proceeds we realize or tax benefits we receive), including certain environmental liabilities, and to indemnify us fully for liabilities arising from the operations of the business transferred to it as part of the Spin-offs. For a more detailed discussion of environmental costs and liabilities, see Note 9, "Commitments and Contingencies" to the Notes to the Consolidated Financial Statements, which is by this reference incorporated herein.
From time to time, we are involved in other legal proceedings arising in the ordinary course of our business or otherwise and, from time to time, acquired as part of business acquisitions that we make. For a detailed discussion of current material legal proceedings, see Note 9, "Commitments and Contingencies" of the Notes to the Consolidated Financial Statements, which is by this reference incorporated herein.
Item 4. Mine Safety Disclosures
Not applicable.
40
PART II
Item 5. Market for the Registrant’s Common Equity, Related Stockholder Matters and Issuer Purchases of Equity Securities
VMS common stock is traded on the New York Stock Exchange (“NYSE”) under the symbol “VAR.” The following table sets forth the high and low sales prices for VMS common stock as reported in the consolidated transaction reporting system for the NYSE in fiscal years 2017 and 2016.
High | Low | |||||||
Fiscal Year 2017 | ||||||||
First Quarter | $ | 94.48 | $ | 75.94 | ||||
Second Quarter | $ | 92.57 | $ | 76.29 | ||||
Third Quarter | $ | 105.30 | $ | 87.49 | ||||
Fourth Quarter | $ | 107.87 | $ | 95.23 | ||||
Fiscal Year 2016 | ||||||||
First Quarter | $ | 72.76 | $ | 65.04 | ||||
Second Quarter | $ | 72.01 | $ | 64.80 | ||||
Third Quarter | $ | 76.37 | $ | 68.75 | ||||
Fourth Quarter | $ | 88.62 | $ | 71.49 | ||||
Since the Spin-offs in 1999, we have not paid any cash dividends on VMS common stock. We have no current plan to pay cash dividends on VMS common stock, and will review that decision periodically. Further, our existing credit agreement contains provisions that limit our ability to pay cash dividends. Specifically, dividends would not be permitted if, when aggregated with other transactions, we would not be in compliance with our financial covenants. See Note 7, "Borrowings" of the Notes to the Consolidated Financial Statements for more information.
As of November 21, 2017, there were 1,949 holders of record of VMS common stock.
41
PERFORMANCE GRAPH
This graph shows the total return on VMS common stock and certain indices from September 28, 2012 until the last day of fiscal year 2017.
COMPARISON OF FIVE YEAR CUMULATIVE TOTAL RETURN*
AMONG VARIAN MEDICAL SYSTEMS, INC., THE S&P 500 INDEX AND
THE S&P HEALTHCARE EQUIPMENT INDEX
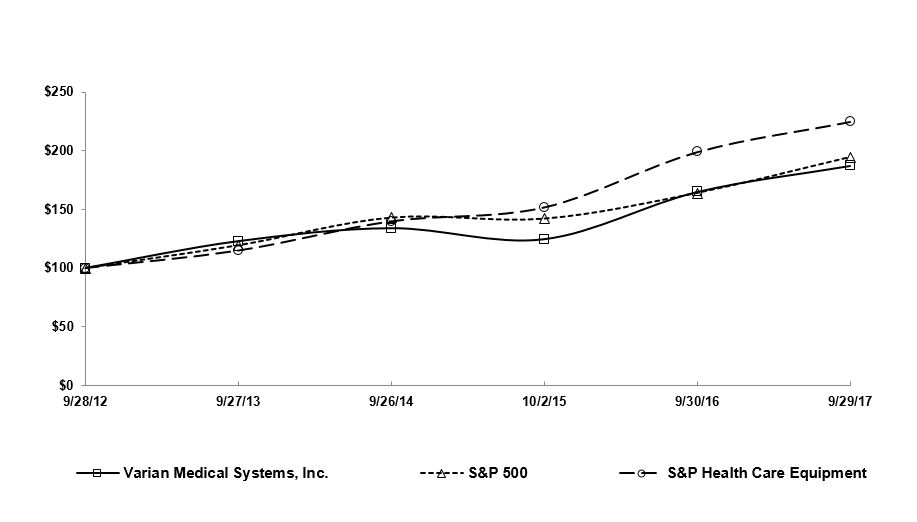
*$100 invested on September 28, 2012 in stock or index, including reinvestment of dividends. Indexes are calculated based on our fiscal year-end.
9/28/2012 | 9/27/2013 | 9/26/2014 | 10/2/2015 | 9/30/2016 | 9/29/2017 | |||||||
Varian Medical Systems, Inc. | 100.00 | 122.98 | 134.12 | 124.65 | 165.00 | 187.32 | ||||||
S&P 500 | 100.00 | 119.34 | 142.89 | 142.02 | 163.93 | 194.44 | ||||||
S&P Health Care Equipment | 100.00 | 114.92 | 139.91 | 151.75 | 199.02 | 224.92 | ||||||
The performance graph and related information shall not be deemed to be soliciting material or to be “filed” with the SEC or to be deemed to be incorporated by reference to any filing under the Securities Act or the Exchange Act.
42
Share Repurchase Program
The following table provides information with respect to the shares of VMS common stock repurchased by VMS during the fourth quarter of fiscal year 2017 (in millions, except per share price).
Period | Total Number of Shares Purchased | Average Price Paid Per Share | Total Number of Shares Purchased as Part of Publicly Announced Plans or Programs | Maximum Number of Shares that May Yet Be Purchased Under the Plans or Programs (1) | ||||||||
July 1, 2017 – July 28, 2017 | — | $ | — | — | 5.5 | |||||||
July 29, 2017 – August 25, 2017 | 0.1 | $ | 97.00 | 0.1 | 5.4 | |||||||
August 26, 2017 – September 29, 2017 | 0.2 | $ | 105.30 | 0.2 | 5.2 | |||||||
Total | 0.3 | $ | 101.98 | 0.3 | 5.2 | |||||||
(1) | In November 2016, the VMS Board of Directors authorized the repurchase of an additional 8.0 million shares of VMS common stock commencing on January 1, 2017. Share repurchases may be made in the open market, in privately negotiated transactions (including accelerated share repurchase programs), or in Rule 10b5-1 share repurchase plans, and also may be made from time to time or in one or more larger blocks. All shares that were repurchased under the share repurchase programs have been retired. |
The preceding table excludes an immaterial number of shares of VMS common stock that were tendered to VMS in satisfaction of tax withholding obligations upon the vesting of restricted stock units granted under our employee stock plans.
43
Item 6. Selected Financial Data
The following financial data should be read in conjunction with our consolidated financial statements and the accompanying notes and the MD&A included elsewhere herein.
Summary of Operations: | Fiscal Years (1) | |||||||||||||||||||
(In millions, except per share amounts) | 2017 | 2016 | 2015 | 2014 | 2013 | |||||||||||||||
Revenues | $ | 2,668.2 | $ | 2,621.1 | $ | 2,490.7 | $ | 2,392.7 | $ | 2,304.0 | ||||||||||
Earnings from continuing operations before taxes (2) | 344.8 | 440.6 | 401.3 | 374.2 | 417.8 | |||||||||||||||
Taxes on earnings | 87.7 | 115.3 | 89.9 | 100.2 | 107.1 | |||||||||||||||
Net earnings from continuing operations | 257.1 | 325.3 | 311.4 | 274.0 | 310.7 | |||||||||||||||
Net earnings (loss) from discontinued operations | (6.8 | ) | 77.4 | 100.6 | 129.7 | 127.5 | ||||||||||||||
Net earnings | 250.3 | 402.7 | 412.0 | 403.7 | 438.2 | |||||||||||||||
Less: Net earnings attributable to noncontrolling interests | 0.7 | 0.4 | 0.5 | — | — | |||||||||||||||
Net earnings attributable to Varian | $ | 249.6 | $ | 402.3 | $ | 411.5 | $ | 403.7 | $ | 438.2 | ||||||||||
Net earnings (loss) per share - basic | ||||||||||||||||||||
Continuing operations | $ | 2.78 | $ | 3.41 | $ | 3.13 | $ | 2.63 | $ | 2.87 | ||||||||||
Discontinued operations | (0.08 | ) | 0.81 | 1.00 | 1.25 | 1.17 | ||||||||||||||
Net earnings per share - basic | $ | 2.70 | $ | 4.22 | $ | 4.13 | $ | 3.88 | $ | 4.04 | ||||||||||
Net earnings (loss) per share – diluted | ||||||||||||||||||||
Continuing operations | $ | 2.75 | $ | 3.39 | $ | 3.10 | $ | 2.60 | $ | 2.82 | ||||||||||
Discontinued operations | (0.07 | ) | 0.80 | 0.99 | 1.23 | 1.16 | ||||||||||||||
Net earnings per share - diluted | $ | 2.68 | $ | 4.19 | $ | 4.09 | $ | 3.83 | $ | 3.98 | ||||||||||
Financial Position at Fiscal Year End: | ||||||||||||||||||||
Working capital (3) | $ | 640.2 | $ | 1,002.0 | $ | 1,016.4 | $ | 1,177.3 | $ | 1,429.5 | ||||||||||
Total assets (3) (4) | 3,179.4 | 3,814.8 | 3,576.9 | 3,336.3 | 3,455.2 | |||||||||||||||
Short-term borrowings | 350.0 | 329.6 | 108.4 | — | — | |||||||||||||||
Long-term debt (including current maturities) (4) | — | 336.3 | 385.7 | 435.1 | 503.3 | |||||||||||||||
Total equity (3) | $ | 1,499.3 | $ | 1,744.2 | $ | 1,726.3 | $ | 1,616.4 | $ | 1,713.8 | ||||||||||
(1) | Our fiscal years as reported are the 52- or 53-weeks periods ending on the Friday nearest September 30. Fiscal years 2017, 2016, 2014 and 2013 each included 52 weeks. Fiscal year 2015 included 53 weeks. |
(2) | In fiscal year 2017, earnings from continuing operations before taxes includes $51.4 million in impairment charges related to our Original CPTC Loans and a $37.8 million allowance for doubtful accounts from CPTC and another proton center. In fiscal year 2014, $25.1 million litigation charge related to a settlement agreement with the University of Pittsburgh. |
(3) | The financial position at year end includes Varex, which is presented as a discontinued operation. See Note 2, "Discontinued Operations" for more information. |
(4) | In the first quarter of fiscal year 2017, we adopted the Financial Accounting Standards Board ("FASB") issued accounting guidance related to the presentation of debt issuance costs. The amendment requires that debt issuance costs related to a recognized debt liability be presented in the balance sheet as a direct deduction from the carrying amount of that debt liability. We retrospectively adopted this amendment and all prior periods have been adjusted. |
44
Item 7. Management’s Discussion and Analysis of Financial Condition and Results of Operations
Overview
We, Varian Medical Systems, Inc., are a Delaware corporation originally incorporated in 1948 as Varian Associates, Inc. We are the world’s leading manufacturer of medical devices and software for treating cancer and other medical conditions with radiotherapy, stereotactic radiosurgery, stereotactic body radiotherapy, brachytherapy and proton therapy. Our mission is to combine the ingenuity of people with the power of data and technology to achieve new victories against cancer. To meet this challenge, we offer comprehensive solutions for fighting cancer.
In fiscal year 2017, our Varian Particle Therapy ("VPT") business met the criteria of a reportable operating segment and subsequent to the spin-off of our former Imaging Components business, our operations are now grouped into two reportable operating segments: Oncology Systems and VPT. In the first quarter of fiscal year 2017, our Ginzton Technology Center business, previously reflected in the "Other" category, was dissolved and absorbed primarily into Oncology Systems. This change did not result in any recast of prior period financial information, because the impact was not material. The operating segments were determined based on how our Chief Executive Officer, who is our Chief Operating Decision Maker ("CODM"), views and evaluates our operations. The CODM allocates resources to and evaluates the financial performance of each operating segment primarily based on operating earnings.
Long-term growth and value creation strategy. We are focused on cancer care solutions and well-positioned to positively influence more and more patients globally every day by bringing smarter and simpler solutions to healthcare providers. Our long-term growth and value creation strategy is to transform our company from the global leader in radiation therapy to become the global leader in multidisciplinary, integrated cancer care solutions. We intend to leverage our deep customer relationships, human-centered design, scale and financial strength to selectively broaden our capabilities to capitalize on industry trends. To achieve these long-term objectives, we are focused on driving growth through strengthening our leadership in radiation therapy, extending our global footprint and expanding into other addressable markets.
Distribution. On January 28, 2017 (the "Distribution Date"), we completed the separation and distribution (the "Distribution") of Varex Imaging Corporation ("Varex"), our former Imaging Components business segment. On the Distribution Date, each of our stockholders of record as of the close of business on January 20, 2017 (the "Record Date") received 0.4 of a share of Varex common stock for every one share of our common stock held on the Record Date. Varex is now an independent publicly traded company and is listed on The NASDAQ Global Select Market under the ticker symbol "VREX."
The historical financial position and results of operations of the Imaging Components business and costs relating to the Distribution are reported in the consolidated financial statements as discontinued operations for all the periods presented. Unless otherwise noted, the financial information herein has been recast to reflect the effect of the Distribution. The Consolidated Statements of Comprehensive Earnings, Cash Flows and Statement of Equity have not been recast to reflect the effect of the Distribution. See Note 2, "Discontinued Operations" of the Notes to the consolidated financial statements for additional information.
On January 25, 2017, we entered into a term facility ("Varex Term Facility"), and on the same day drew down $203.0 million under the facility. In conjunction with the Distribution, we used $200.0 million of those proceeds to repay a portion of our outstanding 2013 Revolving Credit Facility. At the Distribution Date, we contributed $81.3 million in cash and cash equivalents to Varex as part of the distribution and transfer of certain legal entities. In fiscal year 2017, we received $38.7 million from Varex for excess cash and cash equivalents contributed at the Distribution Date. As of September 29, 2017, the change to our stockholders' equity was primarily due to a $334.1 million reduction recorded in retained earnings as a result of the Distribution of Varex, which included assets and liabilities transferred to Varex on the distribution date, including $203.0 million debt outstanding under the Varex Term Facility. In December 2016, we entered into a master purchase and sale agreement ("MPSA") to acquire the Medical Imaging business of PerkinElmer, Inc. for approximately $276 million. In connection with the Distribution, we assigned the MPSA and any rights and obligations thereunder to Varex.
We incurred separation costs of $34.2 million and $16.9 million in fiscal year 2017 and 2016, respectively, relating to the separation of our Imaging Components business. We do not expect to incur any future separation costs. Separation costs include expenses for transaction advisory services, consulting services, restructuring and other expenses. Separation costs are included in discontinued operations for all periods presented.
Financial Information. Total revenues increased 2%, gross margin increased 0.8 percentage points, net earnings from continuing operations decreased 21%, and diluted net earnings per share decreased 19% in fiscal year 2017 compared to fiscal year 2016. Our effective tax rate decreased to 25.4% in fiscal year 2017 from 26.2% in fiscal year 2016. We repurchased 3.3
45
million shares of VMS common stock totaling $294.5 million in fiscal year 2017. Our backlog at the end of fiscal year 2017 was $3.5 billion, or 10% higher, as compared to the end of fiscal year 2016.
We report our revenues by geographical regions. The Americas region includes North America (primarily United States and Canada) and Latin America. The EMEA region includes Europe, Russia, the Middle East, India and Africa. The APAC region primarily includes East and Southeast Asia and Australia.
In order to assist with the assessment of how our underlying businesses performed, we compare the percentage change in revenues and gross orders from one period to another, excluding the effect of foreign currency fluctuations (i.e., using constant currency exchange rates). To present this information on a constant currency basis, we convert current period revenues and Oncology gross orders in currencies other than U.S. Dollars into U.S. Dollars using the comparable prior period’s average exchange rate. Percentage changes in revenue and gross orders are not adjusted for constant currency unless indicated.
Currency fluctuations did not have a significant impact on total revenues and gross orders in fiscal year 2017 compared to fiscal year 2016. Fluctuations of non-U.S. Dollar currencies against the U.S. Dollar may cause variability in our financial performance.
In December 2015, President Obama signed into law the Protecting Americans from Tax Hikes Act of 2015 ("PATH Act"), which suspended the 2.3% medical device excise tax implemented as part of the Patient Protection and Affordable Care Act (the “Affordable Care Act”) for a two-year period through December 31, 2017. The suspension of the medical device excise tax had a positive impact on our gross margin in fiscal year 2016 compared to fiscal year 2015. Additionally, the PATH Act permanently extended the research and development ("R&D") tax credit, which had a favorable impact on our effective tax rate in fiscal year 2016 compared to fiscal year 2015.
Oncology Systems. Our Oncology Systems business designs, manufactures, sells and services hardware and software products for treating cancer with conventional radiotherapy, and advanced treatments such as fixed field intensity-modulated radiation therapy ("IMRT"), image-guided radiation therapy ("IGRT"), volumetric modulated arc therapy ("VMAT"), stereotactic radiotherapy, stereotactic body radiotherapy and brachytherapy. Our software solutions also include informatics software for information management, clinical knowledge exchange, patient care management, practice management and decision-making support for comprehensive cancer clinics, radiotherapy centers and medical oncology practices.
Our primary goal in the Oncology Systems business is to promote the adoption of more advanced and effective cancer treatments. In our view, the fundamental market forces that drive long-term growth in our Oncology Systems business are the rise in cancer cases; technology advances and product developments that are leading to improvements in patient care; customer demand for the more advanced and effective cancer treatments that we enable; competitive conditions among hospitals and clinics to offer such advanced treatments; continued improvement in safety and cost efficiency in delivering radiation therapy; and underserved medical needs outside of the United States. Over the last few years, we have seen a greater percentage of Oncology Systems gross orders and revenues coming from emerging markets within our international region, which typically have lower gross margins and longer installation cycles compared to mature markets. We have also seen an increased portion of gross orders and revenues coming from services and software licenses, both of which have higher gross margin percentages than our hardware products. We have also been investing a higher portion of our Oncology Systems research and development budget in software and software-related products.
The radiation oncology market in North America is largely characterized by replacements of older machines, with periodic increases in demand driven by the introduction of new technologies. Reimbursement rates in the United States have generally supported a favorable return on investment for the purchase of new radiotherapy equipment and technologies. While we believe that improved product functionality, greater cost-effectiveness and prospects for better clinical outcomes with new capabilities such as IMRT, IGRT and VMAT tend to drive demand for radiotherapy products, large changes in reimbursement rates or reimbursement structure can affect customer demand and cause market shifts. We do not know the full impact of the Affordable Care Act or its potential repeal, or the possible impact of changes in policy resulting from President Trump's administration, will have on long-term growth or demand for our products and services. We believe, however, that growth of the radiation oncology market in the United States could be impacted as customers’ decision-making processes are complicated by the uncertainties surrounding Medicare Access and CHIP Reauthorization Act of 2015 and the Affordable Care Act, or its replacement, and reimbursement rates for radiotherapy and radiosurgery, and that this uncertainty will likely continue in future fiscal years. We believe this uncertainty could impact transaction size, timing and purchasing processes, and also contribute to increased quarterly business variability. Given all the dynamic elements affecting this market, as outlined above, we believe the North America market will continue to grow in the low to mid-single digit range.
46
In the radiation oncology markets outside of North America, we expect the EMEA market to grow over the long-term with mixed performance across the region. In APAC, we expect China to lead longer term regional growth, off-setting a slower Japanese market. Latin America is currently experiencing volatility; however, our long-term outlook is cautiously optimistic. Overall, we believe the global radiation oncology market can grow over the long-term, in constant currencies, in the low to mid-single-digit range.
In May 2017, we introduced our Halcyon™ treatment system, our newest device for cancer treatment. We received a CE mark for the Halcyon system in May 2017 and FDA 510(k) clearance in June 2017.
Our HyperArc High Definition Radiotherapy, a new type of radiosurgery treatment received a CE mark in August 2017 and FDA 510(k) clearance in September 2017 and is currently available for sale in the United States and other global markets where CE mark is applicable.
Oncology Systems total revenues increased 1% in fiscal year 2017, as compared to fiscal year 2016. Oncology Systems gross margin percentage increased 1.5 percentage points in fiscal year 2017 from fiscal year 2016. Oncology Systems gross orders increased 7% in fiscal year 2017, as compared to fiscal year 2016, with increases of 6% from North America and 8% from our international regions.
Varian Particle Therapy. Our VPT business develops, designs, manufactures, sells and services products and systems for delivering proton therapy, another form of external beam radiotherapy using proton beams, for the treatment of cancer.
VPT revenues increased $19.9 million and gross orders increased $124.9 million in fiscal year 2017, as compared to fiscal year 2016.
In January 2017, we were informed of actions taken by California Proton Treatment Center, LLC (“CPTC”) and the loan agent, including CPTC obtaining shareholder consents for voluntary bankruptcy filing and the loan agent deciding that no additional funding would be available outside of a bankruptcy process. As a result of this information and our analysis that these actions would likely lead to insolvency or bankruptcy proceedings at CPTC, in the first quarter of fiscal year 2017 we recorded a $38.3 million other-than-temporary impairment for our Original CPTC Loans on the Consolidated Statements of Earnings. In addition, we also recorded an allowance for doubtful accounts of $37.8 million from CPTC and another proton center in the first quarter of fiscal year 2017. The expense associated with the allowance for doubtful accounts was recorded in selling, general and administrative expense on the Consolidated Statements of Earnings.
In March 2017, CPTC filed for bankruptcy and concurrently entered into a Debtor-in-Possession facility (the "DIP Facility") with ORIX Capital Markets, LLC, J.P. Morgan and the Company for up to $16.0 million of additional financing during the bankruptcy process. Our pro-rata share of the DIP Facility is $7.3 million. At September 29, 2017, our remaining commitment under the DIP Facility was $2.2 million.
In September 2017, ORIX, J.P. Morgan and the Company (collectively the "Lenders") and the Scripps Proton Therapy Center ("Scripps") signed a Transition Agreement to transition the operations of the center from Scripps to a new operator. Based on the terms of the Transition Agreement, a slower projected growth in patient volume, and an increase in additional projected capital needs, we reassessed the value of our Original CPTC Loans and recorded an additional $13.1 million impairment charge in the fourth quarter of fiscal year 2017.
As of September 29, 2017, we had a total of $171.9 million carrying value of loans outstanding to VPT customers, available-for-sale securities, notes receivable and short-term senior secured debt. See Note 16, "VPT Loans and Securities" of the Notes to the Consolidated Financial Statements for further information.
This discussion and analysis of our financial condition and results of operations is based upon and should be read in conjunction with the Consolidated Financial Statements and the Notes included elsewhere in this Annual Report on Form 10-K, as well as the information contained under Item 1A, “Risk Factors.” We discuss our results of operations below.
Critical Accounting Estimates
The preparation of our financial statements and related disclosures in conformity with accounting principles generally accepted in the United States (“GAAP”) requires us to make estimates and assumptions that affect the reported amounts of assets, liabilities, revenues and expenses. These estimates and assumptions are based on historical experience and on various other factors that we believe are reasonable under the circumstances. We periodically review our accounting policies, estimates and assumptions and make adjustments when facts and circumstances dictate. In addition to the accounting policies that are more
47
fully described in the Notes to the Consolidated Financial Statements included in this Annual Report on Form 10-K, we consider the critical accounting policies described below to be affected by critical accounting estimates. Our critical accounting policies that are affected by accounting estimates include revenue recognition, share-based compensation expense, valuation of allowance for doubtful accounts, impairment of investments and notes receivable, valuation of inventories, assessment of recoverability of goodwill and intangible assets, valuation of warranty obligations, assessment of loss contingencies, valuation of defined benefit pension and post-retirement benefit plans, valuation of derivative instruments and taxes on earnings. Such accounting policies require us to use judgments, often as a result of the need to make estimates and assumptions regarding matters that are inherently uncertain, and actual results could differ materially from these estimates. For a discussion of how these estimates and other factors may affect our business, see Item 1A, “Risk Factors.”
Revenue Recognition
Our revenues are derived primarily from the sale of hardware and software products, and services from our Oncology Systems and VPT businesses. We recognize revenues net of any value added or sales tax and net of sales discounts.
We frequently enter into sales arrangements with customers that contain multiple elements or deliverables such as hardware, software and services. Judgments as to the allocation of consideration from an arrangement to the multiple elements of the arrangement, and the appropriate timing of revenue recognition are critical with respect to these arrangements to ensure compliance with GAAP.
The allocation of consideration in a multiple element arrangement is affected by the determination of whether any software deliverables that function together with other hardware components to deliver the hardware products’ essential functionality are considered as non-software products for purpose of revenue recognition. The allocation of consideration to each non-software deliverable is based on the assumptions we use to establish its selling price, which are based on vendor-specific objective evidence (“VSOE”) of selling price, if it exists, otherwise, third-party evidence of selling price, if it exists, and, if not, on estimated selling prices. In addition, the allocation of consideration to each software deliverable in a multiple element arrangement is affected by our judgment as to whether VSOE of its fair value exists in these arrangements.
Changes to the elements in an arrangement and the amounts allocated to each element could affect the timing and amount of revenue recognition. Revenue recognition also depends on the timing of shipment, readiness of customers’ facilities for installation, installation requirements, and availability of products or customer acceptance terms. If shipments or installations are not made on scheduled timelines or if the products are not accepted by the customer in a timely manner, our reported revenues may differ materially from expectations.
Service revenues include revenues from hardware service contracts, software service agreements, bundled support arrangements, paid services and trainings, and parts that are sold by the service department. Revenues allocated to service contracts are generally recognized ratably over the period of the related contracts.
In addition, revenues related to proton therapy systems and proton therapy system commissioning contracts are recognized in accordance with contract accounting. We recognize contract revenues under the percentage-of-completion method which are based on contract costs incurred to date compared with total estimated contract costs. Changes in estimates of total contract revenue, total contract cost or the extent of progress towards completion are recognized in the period in which the changes in estimates are identified. Estimated losses on contracts are recognized in the period in which the loss is identified. In circumstances in which the final outcome of a contract cannot be precisely estimated but a loss on the contract is not expected, we recognize revenues under the percentage-of-completion method based on a zero profit margin until more precise estimates can be made. If and when we can make more precise estimates, revenues and costs of revenues are adjusted in the same period. Because the percentage-of-completion method involves considerable use of estimates in determining revenues, costs and profits and in assigning the dollar amounts to relevant accounting periods, and because the estimates must be periodically reviewed and appropriately adjusted, if our estimates prove to be inaccurate or circumstances change over time, we may be forced to adjust revenues or even record a contract loss in later periods.
Share-based Compensation Expense
We grant restricted stock units, deferred stock units, performance units, and stock options to employees and permit employees to purchase shares under the VMS employee stock purchase plan. We value our stock options granted and the option component of the shares of VMS common stock purchased under the employee stock purchase plan using the Black-Scholes option-pricing model. We value our performance units, which contain a market condition, using the Monte Carlo simulation model. The determination of fair value of share-based payment awards on the date of grant under both the Black-Scholes option-pricing model and the Monte Carlo simulation model is affected by VMS’s stock price, as well as the input of other
48
subjective assumptions, including the expected terms of share-based awards and the expected price volatilities of shares of VMS common stock and peer companies that are used to assess certain performance targets over the expected term of the awards, and the expected dividend yield of shares of VMS common stock.
The expected term of our stock options is based on the observed and expected time to post-vesting exercise and post-vesting cancellations of stock options by our employees. We use a blended volatility in deriving the expected volatility assumption for our stock options. Blended volatility represents the weighted average of implied volatility and historical volatility. Implied volatility is derived based on traded options on VMS common stock. Implied volatility is weighted in the calculation of blended volatility based on the ratio of the term of the exchange-traded options to the expected terms of the employee stock options. Historical volatility represents the remainder of the weighting. Our decision to incorporate implied volatility was based on our assessment that implied volatility of publicly traded options on VMS common stock is reflective of market conditions and is generally reflective of both historical volatility and expectations of how future volatility will differ from historical volatility. In determining the extent of use of implied volatility, we considered: (i) the volume of market activity of traded options; (ii) the ability to reasonably match the input variables of traded options to those of stock options granted by us, including the date of grant; (iii) the similarity of the exercise prices; and (iv) the length of term of traded options. After considering the above factors, we determined that we could not rely exclusively on implied volatility based on the fact that the term of VMS exchange-traded options is less than one year and that it is different from the expected terms of the stock options we grant. Therefore, we believe a combination of the historical volatility over the expected terms of the stock options we grant and the implied volatility of exchange-traded options best reflects the expected volatility of VMS common stock. In determining the grant date fair value of our performance units, historical volatilities of shares of VMS common stock, as well as the shares of common stock of peer companies, were used to assess certain performance targets. The risk-free interest rate assumption is based upon observed interest rates appropriate for the term of our stock awards. The dividend yield assumption is based on our history and expectation of no dividend payouts. If factors change and we employ different assumptions in future periods, the compensation expense that we record may differ significantly from what we have recorded in the current period. In addition, we are required to estimate the expected forfeiture rate, as well as the probability that certain performance conditions that affect the vesting of performance units will be achieved, and recognize expense only for those awards expected to vest. If the actual forfeiture rate and/or the actual number of performance units that vest based on achievement of performance conditions are materially different from our estimates, the share-based compensation expense could be significantly different from what we have recorded in the current period.
Allowance for Doubtful Accounts
We evaluate the creditworthiness of our customers prior to authorizing shipment for all major sale transactions. Except for government tenders, group purchases and orders with letters of credit in Oncology Systems, our payment terms usually require payment of a small portion of the total amount due when the customer signs the purchase order, a significant amount upon transfer of risk of loss to the customer and the remaining amount upon completion of the installation. On a quarterly basis, we evaluate aged items in the accounts receivable aging report and provide an allowance in an amount we deem adequate for doubtful accounts. If our evaluation of our customers’ financial conditions does not reflect our future ability to collect outstanding receivables, additional provisions may be needed and our operating results could be negatively affected.
Impairment of Investments and Notes Receivable
We recognize an impairment charge when the declines in the fair values of our available-for-sale investments below their cost basis are determined to be other than temporary impairments (“OTTI”). Our available-for-sale investments consists of loans and securities for the funding, development and construction of various proton therapy centers.
We monitor our available-for-sale investments for possible OTTI on an ongoing basis. When there has been a decline in fair value of a debt security below the amortized cost basis, we recognize OTTI if: (i) we have the intention to sell the security; (ii) it is more likely than not that we will be required to sell the security before recovery of the entire amortized cost basis; or (iii) we do not expect to recover the entire amortized cost basis of the security. We assess the fair value of the our available-for-sale securities, which are classified in the level 3 fair value hierarchy based on the income approach by using the discounted cash flow model with key assumptions that include discount rates corresponding to the terms and risks associated with the loans, as well as underlying cash flow assumptions. In January 2017, we were informed of actions taken by CPTC and the loan agent, including CPTC obtaining shareholder consents for voluntary bankruptcy filing and the loan agent deciding that no additional funding would be available outside of a bankruptcy process. As a result of this information and our analysis that these actions would likely lead to insolvency or bankruptcy proceedings at CPTC, we determined that the Original CPTC Loans with a carrying value of $98.1 million were other-than-temporarily impaired relating to credit losses as of December 30, 2016. As a result of this determination, the investment was written down to its estimated fair value of $60.0 million, resulting in an
49
impairment charge of $38.3 million, which includes $0.2 million of other loan related charges, recorded in the Consolidated Statements of Earnings. In September 2017, the Lenders and Scripps signed a Transition Agreement to transition the operations of the center from Scripps to a new operator. Based on the terms of the Transition Agreement, a slower growth in patient volume, an increase in additional capital needs and our analysis we determined that the Original CPTC Loans were other-than-temporarily impaired and recorded an additional $13.1 million impairment charge related to the Original CPTC Loans. As of September 29, 2017, the fair value our Original CPTC Loans was $47.4 million. See Note 4, "Fair Value" and Note 16, "VPT Loans and Securities" of the Notes to the Consolidated Financial Statements.
We also have investments in privately-held companies, some of which are in the startup or development stages. We monitor these investments for events or circumstances indicative of potential impairment, and we make appropriate reductions in carrying values if we determine that an impairment charge is required, based primarily on the financial condition, near-term prospects and recent financing activities of the investee. These investments are inherently risky because the markets for the technologies or products these companies are developing are typically in the early stages and may never materialize.
At times, we advance notes to third parties, including our customers. We regularly assess these notes for collectability by considering internal factors such as historical experience, credit quality, age of the note balances as well as external factors such as economic conditions that may affect the note holder's ability to pay.
Our ongoing consideration of all the factors described above could result in impairment charges in the future, which could adversely affect our operating results.
Inventories
Our inventories include high technology parts and components that are highly specialized in nature and that are subject to rapid technological obsolescence. We have programs to minimize the required inventories on hand and we regularly review inventory quantities on hand and on order and adjust for excess and obsolete inventory based primarily on historical usage rates and our estimates of product demand and production. Actual demand may differ from our estimates, in which case we may have understated or overstated the provision required for obsolete and excess inventory, which would have an impact on our operating results.
Goodwill, Intangible Assets and Impairment Assessment
Goodwill represents the excess of the purchase price in a business combination over the fair value of net tangible and intangible assets acquired. The determination of the value of the intangible assets acquired involves certain judgments and estimates. These judgments can include, but are not limited to, the cash flows that an asset is expected to generate in the future and the appropriate weighted-average cost of capital ("WACC"). Each period we evaluate the estimated remaining useful lives of purchased intangible assets and whether events or changes in circumstances warrant a revision to the remaining periods of amortization.
Goodwill is allocated to reporting units expected to benefit from the business combination. We evaluate our reporting units when changes in our operating structure occur, and if necessary, reassign goodwill using a relative fair value allocation approach. Goodwill is tested for impairment at the reporting unit level on an annual basis or whenever events or changes in circumstances indicate its carrying value may not be recoverable. We can opt to perform a qualitative assessment to test a reporting unit’s goodwill for impairment or we can directly perform the two-step impairment test. Various factors are considered in the qualitative assessment, including macroeconomic conditions, industry and market considerations, financial performance and other relevant events affecting the reporting unit. Based on our qualitative assessment, if we determine that the fair value of a reporting unit is more likely than not (i.e., a likelihood of more than 50 percent) to be less than its carrying amount, the two-step impairment test will be performed. In the first step, we compare the fair value of a reporting unit against its carrying amount, including the goodwill allocated to each reporting unit. We determine the fair value of our reporting units based on a combination of income and market valuation approaches. The income approach is based on the present value of estimated future cash flows that the reporting unit is expected to generate and the market approach is based on a market multiple calculated for each reporting unit based on market data of other companies engaged in similar business. If the carrying amount of the reporting unit is in excess of its fair value, step two requires the comparison of the implied fair value of the reporting unit’s goodwill against the carrying amount of the reporting unit’s goodwill. Any excess of the carrying value of the reporting unit’s goodwill over the implied fair value of the reporting unit’s goodwill is recorded as an impairment loss.
Determining the fair value of a reporting unit involves the use of significant estimates and assumptions. These estimates and assumptions include revenue growth rates, operating margins and working capital needs to calculate projected future cash flows, WACC, future economic and market conditions, estimation of the long-term rate of growth for our business and
50
determination of appropriate market comparables. We base our fair value estimates on assumptions we believe to be reasonable but that are inherently uncertain. Actual future results related to assumed variables could differ from these estimates. In addition, we make certain judgments and assumptions in allocating assets and liabilities to determine the carrying values for each reporting unit.
We have two reporting units: (i) Oncology Systems and (ii) VPT, with $170.2 million and $52.4 million in goodwill, respectively, as of September 29, 2017. Based upon the most recent annual goodwill analysis that we performed during the fourth quarter of fiscal year 2017, we opted to evaluate Oncology Systems by using qualitative factors and VPT by using the step one approach, and determined no further goodwill impairment analysis was required. VPT's fair value was 21% in excess of its carrying value, and we believe each of the assumptions used to calculate VPT’s fair value to be reasonable. However, VPT could be at risk for goodwill impairment because adjustments to revenue growth rates, operating margins, WACC and/or our working capital used in the fair value calculation could lead to an impairment.
Warranty Obligations
We warrant most of our products for a specific period of time, usually 12 months from installation, against material defects. We provide for the estimated future costs of warranty obligations in cost of revenues when the related revenues are recognized. The accrued warranty costs represent our best estimate at the time of sale of the total costs that we will incur to repair or replace product parts that fail while still under warranty. The amount of accrued estimated warranty costs obligation for established products is primarily based on historical experience as to product failures adjusted for current information on repair costs. For new products, estimates will include historical experience of similar products, as well as reasonable allowance for start-up expenses. Actual warranty costs could differ from the estimated amounts. On a quarterly basis, we review the accrued balances of our warranty obligations and update the historical warranty cost trends, if required. If we were required to accrue additional warranty costs in the future, it would have a negative effect on our operating results.
Loss Contingencies
From time to time, we are a party to or otherwise involved in legal proceedings, claims and government inspections or investigations or other legal matters, both inside and outside the United States, arising in the ordinary course of our business or otherwise. We accrue amounts, to the extent they can be reasonably estimated, that we believe are adequate to address any liabilities related to legal proceedings and other loss contingencies that we believe will result in a probable loss. Such matters are subject to many uncertainties, outcomes are not predictable with assurance, and actual liabilities could significantly exceed our estimates of potential liabilities. In addition, we are subject to a variety of environmental laws around the world. Those laws regulate multiple aspects of our operations, including the handling, storage, transport and disposal of hazardous substances. They impose costs on our operations. In connection with our past and present operations and facilities, we record environmental remediation liabilities when we conclude that environmental assessments or remediation efforts are probable and we believe we can reasonably estimate the costs of those efforts. Our accrued environmental costs represent our best estimate of the total costs of assessments and remediation and the time period over which we expect to incur those costs. We review these accrued balances quarterly. If we were required to increase or decrease the accrued environmental costs in the future, it would adversely or favorably impact our operating results.
Defined Benefit Pension Plans
We sponsor five defined benefit pension plans in Germany, Japan, Switzerland and the United Kingdom covering employees who meet the applicable eligibility requirements in these countries. Several statistical and other factors that attempt to anticipate future events are used in calculating the expenses and liabilities related to the aforementioned plans. These factors include assumptions about the discount rate, expected return on plan assets, and rate of future compensation increases, all of which we determine within certain guidelines. In addition, we also use assumptions, such as withdrawal and mortality rates, to calculate the expenses and liabilities. The actuarial assumptions we use are long-term assumptions and may differ materially from actual experience particularly in the short term due to changing market and economic conditions and changing participant demographics. These differences may have a significant impact on the amount of defined benefit pension plan expenses we record.
The expected rates of return on the various defined benefit pension plans’ assets are based on the asset allocation of each plan and the long-term projected return on those assets. The discount rate enables us to state expected future cash flows at a present value on the measurement date. The discount rates used for defined benefit plans are primarily based on the current effective yield of long-term corporate bonds that are of high quality with satisfactory liquidity and credit rating with durations corresponding to the expected durations of the benefit obligations. A change in the discount rate may cause the present value of benefit obligations to change significantly. The net liabilities recognized for defined benefit pension plans decreased by $23.4
51
million in fiscal year 2017 to $15.6 million at September 29, 2017, primarily due to an increase in the discount rate partially offset by changes in exchange rates. See Note 10, "Retirement Plans" in the Notes to the Consolidated Financial Statements for further information.
Valuation of Derivative Instruments
We use foreign currency forward contracts to reduce the effects of currency rate fluctuations on sales transactions denominated in foreign currencies and on net monetary assets and liabilities denominated in foreign currencies. These foreign currency forward contracts are derivative instruments and are measured at fair value. There are three levels of inputs that may be used to measure fair value (see Note 4, "Fair Value" of the Notes to the Consolidated Financial Statements). The fair value of foreign currency forward contracts is calculated primarily using Level 2 inputs, which include currency spot and forward rates, interest rate and credit or non-performance risk. The spot rate for each currency is the same spot rate used for all balance sheet translations at the measurement date and sourced from our major trading banks. The forward point values for each currency and the London Interbank Offered Rate (“LIBOR”) to discount assets and liabilities are interpolated from commonly quoted broker services. One year credit default swap spreads of the counterparty at the measurement date are used to adjust derivative assets, all of which mature in 13 months or less, for non-performance risk. We are required to adjust derivative liabilities to reflect the potential non-performance risk to lenders based on our incremental borrowing rate. Each contract is individually adjusted using the counterparty credit default swap rates (for net assets) or our borrowing rate (for net liabilities). The use of Level 2 inputs in determining fair values requires certain management judgment and subjectivity. Changes to these Level 2 inputs could have a material impact on the valuation of our derivative instruments. There were no transfers of assets or liabilities between fair value measurement levels during fiscal years 2017, 2016 and 2015.
Taxes on Earnings
We are subject to taxes on earnings in both the United States and numerous foreign jurisdictions. As a global taxpayer, significant judgments and estimates are required in evaluating our tax positions and determining our provision for taxes on earnings. We account for uncertainty in income taxes following a two-step approach for recognizing and measuring uncertain tax positions. The first step is to evaluate the tax position for recognition by determining whether the weight of available evidence indicates that it is more likely than not that, based on the technical merits, the position will be sustained on audit, including resolution of related appeals or litigation processes, if any. The second step is to measure the tax benefit as the largest amount that is more than 50% likely of being realized upon settlement. Recognition and measurement are based on management’s best judgment given the facts, circumstances and information available at the end of the accounting period.
Generally, the carrying value of our net deferred tax assets assumes that we will be able to generate sufficient future taxable earnings in the applicable tax jurisdictions to utilize these deferred tax assets. Should we conclude it is more likely than not that we will be unable to recover our net deferred tax assets in these tax jurisdictions, we would increase our valuation allowance and our tax provision would increase in the period in which we make such a determination.
Our foreign earnings are generally taxed at rates lower than U.S. rates. Our effective tax rate is impacted by existing tax laws in both the United States and in the respective countries in which our foreign subsidiaries do business. In addition, a decrease in the percentage of our total earnings from foreign countries, or a change in the mix of foreign countries among particular tax jurisdictions could increase or decrease our effective tax rate. Our current effective tax rate does not assume U.S. taxes on certain undistributed profits of certain foreign subsidiaries. These earnings could become subject to incremental foreign withholding or U.S. federal and state taxes should they either be remitted or deemed to be remitted to the United States.
Results of Operations
Fiscal Year
Our fiscal year is the 52- or 53-week period ending on the Friday nearest September 30. Fiscal year 2017 was the 52-week period ended September 29, 2017, fiscal year 2016 was the 52-week period ended September 30, 2016, and fiscal year 2015 was the 53-week period ended on October 2, 2015. Set forth below is a discussion of our results of operations for fiscal years 2017, 2016 and 2015.
52
Discussion of Results of Operations for Fiscal Years 2017, 2016 and 2015
Total Revenues
Revenues by sales classification | Fiscal Years | ||||||||||||||||
(Dollars in millions) | 2017 | Percent Change | 2016 | Percent Change | 2015 | ||||||||||||
Product | $ | 1,555.5 | (2 | )% | $ | 1,583.9 | 6 | % | $ | 1,497.1 | |||||||
Service | 1,112.7 | 7 | % | 1,037.2 | 4 | % | 993.6 | ||||||||||
Total Revenues | $ | 2,668.2 | 2 | % | $ | 2,621.1 | 5 | % | $ | 2,490.7 | |||||||
Product as a percentage of total revenues | 58 | % | 60 | % | 60 | % | |||||||||||
Service as a percentage of total revenues | 42 | % | 40 | % | 40 | % | |||||||||||
Total product revenues decreased in fiscal year 2017 over fiscal year 2016 due to a decrease in revenues from Oncology Systems, partially offset by an increase in revenues from VPT. Total product revenues increased in fiscal year 2016 over fiscal year 2015 due to an increase in revenues from Oncology Systems, and to a lesser extent, an increase in revenues from VPT. Total service revenues increased in fiscal year 2017 over fiscal year 2016, and fiscal year 2016 over fiscal year 2015, mostly due to an increase in revenues from Oncology Systems.
Revenues by region | Fiscal Years | ||||||||||||||||||||||
(Dollars in millions) | 2017 | Percent Change | Constant Currency (1) | 2016 | Percent Change | Constant Currency | 2015 | ||||||||||||||||
Americas | $ | 1,363.8 | 6 | % | 6 | % | $ | 1,285.4 | (3 | )% | (3 | )% | $ | 1,329.4 | |||||||||
EMEA | 771.6 | (6 | )% | (5 | )% | 824.7 | 13 | % | 18 | % | 730.5 | ||||||||||||
APAC | 532.8 | 4 | % | 3 | % | 511.0 | 19 | % | 17 | % | 430.8 | ||||||||||||
Total Revenues | $ | 2,668.2 | 2 | % | 2 | % | $ | 2,621.1 | 5 | % | 7 | % | $ | 2,490.7 | |||||||||
North America | $ | 1,283.0 | 7 | % | 7 | % | $ | 1,201.2 | (4 | )% | (4 | )% | $ | 1,248.3 | |||||||||
International (2) | 1,385.2 | (2 | )% | (2 | )% | 1,419.9 | 14 | % | 17 | % | 1,242.4 | ||||||||||||
Total Revenues | $ | 2,668.2 | 2 | % | 2 | % | $ | 2,621.1 | 5 | % | 7 | % | $ | 2,490.7 | |||||||||
North America as a percentage of total revenues | 48 | % | 47 | % | 51 | % | |||||||||||||||||
International as a percentage of total revenues | 52 | % | 53 | % | 49 | % | |||||||||||||||||
(1) | Constant currency is the percent change excluding the effect of foreign currency fluctuations against the U.S. Dollar. |
(2) | We consider international revenues to be revenues outside of North America. |
The Americas revenues increased in fiscal year 2017 over fiscal year 2016 due to increases in revenues from Oncology Systems and VPT. The Americas revenues decreased in fiscal year 2016 over fiscal year 2015 due to a decrease in revenues from VPT, partially offset by an increase in revenues from Oncology Systems.
EMEA revenues decreased in fiscal year 2017 over fiscal year 2016 primarily due to a decrease in revenues from Oncology Systems and, to a lesser extent, a decrease in revenues from VPT. EMEA revenues increased in fiscal year 2016 over fiscal year 2015 due to increases in revenues from VPT and Oncology Systems.
APAC revenues increased in fiscal year 2017 over fiscal year 2016 primarily due to an increase in revenues in Oncology Systems and, to a lesser extent, an increase in revenues from VPT. APAC revenues increased in fiscal year 2016 over fiscal year 2015 primarily due to an increase in revenues from Oncology Systems and, to a lesser extent, an increase in revenues from VPT.
53
Oncology Systems Revenues
Revenues by sales classification | Fiscal Years | ||||||||||||||||||||||
(Dollars in millions) | 2017 | Percent Change | Constant Currency | 2016 | Percent Change | Constant Currency | 2015 | ||||||||||||||||
Product | $ | 1,383.0 | (3 | )% | (3 | )% | $ | 1,430.3 | 5 | % | 6 | % | $ | 1,359.2 | |||||||||
Service | 1,102.7 | 7 | % | 7 | % | 1,027.7 | 4 | % | 5 | % | 987.6 | ||||||||||||
Total Oncology Systems Revenues | $ | 2,485.7 | 1 | % | 1 | % | $ | 2,458.0 | 5 | % | 6 | % | $ | 2,346.8 | |||||||||
Product as a percentage of Oncology Systems revenues | 56 | % | 58 | % | 58 | % | |||||||||||||||||
Service as a percentage of Oncology Systems revenues | 44 | % | 42 | % | 42 | % | |||||||||||||||||
Oncology Systems revenues as a percentage of total revenues | 93 | % | 94 | % | 94 | % | |||||||||||||||||
Oncology systems product revenues decreased in fiscal year 2017 over fiscal year 2016, primarily due to a decrease in revenues from hardware products resulting from a lengthening backlog conversion cycle due to a greater portion of the backlog being from emerging markets, and customer readiness delays in several countries. Oncology Systems product revenues increased in fiscal year 2016 over fiscal year 2015 primarily due to increases in revenues from hardware products, which resulted from an improved product mix, and software licenses.
Oncology Systems service revenues increased in fiscal year 2017 over fiscal year 2016 and in fiscal year 2016 over fiscal year 2015, primarily due to increased customer adoption of service contracts as the warranty period on our TrueBeam systems expire and an increased number of service contracts as the installed base of our products continues to grow. The extra week of operations in fiscal year 2015 contributed approximately an additional $7 million in Oncology Systems service revenues.
Revenues by region | Fiscal Years | ||||||||||||||||||||||
(Dollars in millions) | 2017 | Percent Change | Constant Currency | 2016 | Percent Change | Constant Currency | 2015 | ||||||||||||||||
Americas | $ | 1,276.0 | 4 | % | 4 | % | $ | 1,229.8 | 1 | % | 2 | % | $ | 1,212.1 | |||||||||
EMEA | 703.5 | (5 | )% | (3 | )% | 739.3 | 5 | % | 9 | % | 703.9 | ||||||||||||
APAC | 506.2 | 4 | % | 3 | % | 488.9 | 13 | % | 12 | % | 430.8 | ||||||||||||
Total Oncology System Revenues | $ | 2,485.7 | 1 | % | 1 | % | $ | 2,458.0 | 5 | % | 6 | % | $ | 2,346.8 | |||||||||
North America | $ | 1,195.2 | 4 | % | 4 | % | $ | 1,145.6 | 1 | % | 1 | % | $ | 1,131.0 | |||||||||
International | 1,290.5 | (2 | )% | (1 | )% | 1,312.4 | 8 | % | 10 | % | 1,215.8 | ||||||||||||
Total Oncology System Revenues | $ | 2,485.7 | 1 | % | 1 | % | $ | 2,458.0 | 5 | % | 6 | % | $ | 2,346.8 | |||||||||
North America as a percentage of total Oncology Systems revenues | 49 | % | 47 | % | 49 | % | |||||||||||||||||
International as a percentage of total Oncology Systems revenues | 51 | % | 53 | % | 51 | % | |||||||||||||||||
The Americas Oncology Systems revenues increased in fiscal year 2017 over fiscal year 2016 primarily due to an increase in revenues from services in North America and, to a lesser extent, increases in revenues from hardware products and software licenses in North America, partially offset by a decrease in revenues from software licenses in Latin America. The Americas Oncology Systems revenues increased in fiscal year 2016 over fiscal year 2015 primarily due to increases in revenues from services, primarily in North America, and software licenses, partially offset by a decrease in revenues from hardware products.
54
EMEA Oncology Systems revenues decreased in fiscal year 2017 over fiscal year 2016 due to a decrease in revenues from hardware products and, to a lesser extent, a decrease in revenues from software licenses, partially offset by an increase in revenues from services. EMEA Oncology Systems revenues increased in fiscal year 2016 over fiscal year 2015 due to an increase in revenues from hardware products, and to a lesser extent, an increase in revenues from services and software licenses.
APAC Oncology Systems revenues increased in fiscal year 2017 over fiscal year 2016, primarily due to an increase in revenues from services and, to lesser extent, an increase in revenues from software licenses, partially offset by a decrease in revenues from hardware products. APAC Oncology Systems revenues increased in fiscal year 2016 over fiscal year 2015 primarily due to an increase in revenues from hardware products and, to a lesser extent, increases in revenues from software licenses and services.
Varying cycles of higher and lower revenues between the North American and international regions are impacted by regional influences, which recently have included government stimulus programs, economic and political instability in some countries, uncertainty created by health care reform (such as the excise tax on the sale of most medical devices, Medicare reimbursement rates and consolidation of free standing clinics in the United States), and different technology adoption cycles that are consistent with the gross order patterns. See further discussion of orders under “Gross Orders.”
Varian Particle Therapy Revenues
Revenues by sales classification | Fiscal Years | ||||||||||||||||
(Dollars in millions) | 2017 | Percent Change | 2016 | Percent Change | 2015 | ||||||||||||
Product | $ | 172.5 | 13 | % | $ | 153.1 | 11 | % | $ | 137.9 | |||||||
Service | 10.0 | 4 | % | 9.5 | 70 | % | 5.6 | ||||||||||
Total VPT revenues | $ | 182.5 | 12 | % | $ | 162.6 | 13 | % | $ | 143.5 | |||||||
VPT revenues as a percentage of total revenues | 7 | % | 6 | % | 6 | % | |||||||||||
VPT revenues increased in fiscal year 2017 over fiscal year 2016 and in fiscal year 2016 over fiscal year 2015, primarily due to the continued production and installation of VPT projects. The increase in fiscal year 2017 over fiscal year 2016 was primarily due to the completion and financing of the Georgia Proton Treatment Center in fiscal year 2017, which resulted in $56.0 million of revenue recorded for that project.
Other
Revenues from the "Other" category in fiscal year 2016 and 2015 were $0.5 million and $0.4 million, respectively. Revenues from the "Other" category represent revenues from our former Ginzton Technology Center business, which was dissolved in the first quarter of fiscal year 2017 and is no longer a separate business.
Gross Margin
Fiscal Years | |||||||||||||||||
Dollars by segment | 2017 | Percent Change | 2016 | Percent Change | 2015 | ||||||||||||
(Dollars in millions) | |||||||||||||||||
Oncology Systems | $ | 1,139.6 | 5 | % | $ | 1,087.7 | 9 | % | $ | 998.9 | |||||||
Varian Particle Therapy | 16.0 | (36 | )% | 25.2 | (24 | )% | 33.2 | ||||||||||
Gross margin | $ | 1,155.6 | 4 | % | $ | 1,112.9 | 8 | % | $ | 1,032.1 | |||||||
Percentage by segment | |||||||||||||||||
Oncology Systems | 45.8 | % | 44.3 | % | 42.6 | % | |||||||||||
Varian Particle Therapy | 8.8 | % | 15.4 | % | 23.1 | % | |||||||||||
Total Company | 43.3 | % | 42.5 | % | 41.4 | % | |||||||||||
55
Total product gross margin percentage was 34.1% in fiscal year 2017, compared to 32.4% in fiscal year 2016 and 30.9% in fiscal year 2015. Total service gross margin percentage was 56.2% in fiscal year 2017, compared to 57.9% in fiscal year 2016 and 57.4% in fiscal year 2015.
Oncology Systems product gross margin percentage was 37.3% in fiscal year 2017, compared to 34.2% in fiscal year 2016 and 31.5% in fiscal year 2015. The increase in product gross margin percentage in fiscal year 2017 over fiscal year 2016 was primarily due to a favorable product mix and supply chain efficiencies. The increase in product gross margin in fiscal year 2016 over fiscal year 2015 was due to the suspension of the medical device excise tax in fiscal year 2016, an increase in software license revenue which has a higher gross margin percentage, and the impact of cost reduction programs.
Oncology Systems service gross margin percentage was 56.5% in fiscal year 2017, compared to 58.2% in fiscal year 2016 and 57.8% in fiscal year 2015. The decrease in service gross margin percentage in fiscal year 2017 compared to fiscal year 2016 was primarily due to higher personnel-related costs and materials associated with operating system upgrades for our installed customer base. The increase in service gross margin percentage in fiscal year 2016 over fiscal year 2015 was primarily due to cost containment and an increase in service revenues.
VPT gross margin percentage decreased in fiscal year 2017, compared to fiscal year 2016, primarily due to lower service revenues and the revision of profitability estimates caused by the weakening of the British Pound for projects in the United Kingdom during the second quarter of fiscal year 2017, partially offset by higher margins of new project revenue recognized in fiscal year 2017.
VPT gross margin percentage decreased in fiscal year 2016, compared to fiscal year 2015, primarily due to more revenue generated in fiscal year 2016 from projects with lower product gross margins.
Research and Development
Fiscal Years | |||||||||||||||||
(Dollars in millions) | 2017 | Percent Change | 2016 | Percent Change | 2015 | ||||||||||||
Research and development | $ | 210.0 | 5 | % | $ | 200.4 | 3 | % | $ | 195.4 | |||||||
As a percentage of total revenues | 8 | % | 8 | % | 8 | % | |||||||||||
Research and development expenses increased $9.6 million in fiscal year 2017 over fiscal year 2016 primarily due to increased headcount in Oncology Systems and an increase in consulting services to support new product development projects and enhancement of existing products in both Oncology Systems and VPT.
Research and development expenses increased $5.0 million in fiscal year 2016, over fiscal year 2015 was primarily due to increase in new development projects and employee related costs in VPT.
Selling, General and Administrative and Impairment Charges
Fiscal Years | |||||||||||||||||
(Dollars in millions) | 2017 | Percent Change | 2016 | Percent Change | 2015 | ||||||||||||
Selling, general and administrative | $ | 552.3 | 16 | % | $ | 475.3 | 8 | % | $ | 441.0 | |||||||
Impairment charges | $ | 51.4 | n/m | $ | 2.2 | n/m | $ | — | |||||||||
Selling, general and administrative as a percentage of total revenues | 21 | % | 18 | % | 18 | % | |||||||||||
Impairment charges as a percentage of total revenues | 2 | % | — | % | — | % | |||||||||||
n/m = not meaningful
Selling, general and administrative expenses increased $77.0 million in fiscal year 2017 over fiscal year 2016 primarily due to a $39.6 million increase in the allowance for doubtful accounts that was mostly for CPTC and another proton center in fiscal year 2017, a $24.4 million increase in employee-related costs largely due to an increase in headcount, a $9.1 million increase in restructuring charges, a $3.5 million increase in consulting expenses and a $3.4 million increase in trade show and marketing expenses, partially offset by an $8.3 million decrease in litigation expenses primarily as a result of the settlement with Elekta in April 2017 and a $4.4 million decrease in international commissions paid to third-party distributors who sell our products.
56
Selling, general and administrative expenses increased $34.3 million in fiscal year 2016 over fiscal year 2015 primarily due to a $21.1 million increase in legal expenses primarily related to legal proceedings, a $19.1 million increase in employee-related costs largely due to an increase in headcount, primarily in Oncology Systems, and accrued bonuses, a $6.9 million increase in international commissions paid to third-party distributors who sell our products, and a $3.8 million increase in trade show expense. These increases were partially offset by a $7.9 million decrease in restructuring charges and a $7.6 million favorable impact when foreign-currency denominated expenses were translated into U.S. dollars.
In fiscal year 2017, we recorded $51.4 million in impairment charges related to our Original CPTC Loans. In fiscal year 2016, we recorded a $2.2 million impairment related to the sale of the New York Proton Center Senior First Lien loan. See Note 16, "VPT Loans" in our Notes to the Consolidated Financial Statements for additional information.
Interest Income, Net
Fiscal Years | |||||||||||||||||
(Dollars in millions) | 2017 | Percent Change | 2016 | Percent Change | 2015 | ||||||||||||
Interest income, net | $ | 2.9 | (49 | )% | $ | 5.6 | — | % | $ | 5.6 | |||||||
Interest income, net of interest expense, decreased in fiscal year 2017 over fiscal year 2016, primarily due to a decrease in interest income generated from our loans to CPTC, partially offset by an increase in interest expense associated with the borrowing from our credit facility.
Interest income, net of interest expense, in fiscal year 2016 over fiscal year 2015, was flat primarily due to an increase in interest expense associated with increased borrowings from our credit facility being mostly offset by an increase in interest income generated from our loans to finance proton treatment centers.
Taxes on Earnings
Fiscal Years | ||||||||||||||
2017 | Percent Change | 2016 | Percent Change | 2015 | ||||||||||
Effective tax rate | 25.4 | % | (0.8 | )% | 26.2 | % | 3.8 | % | 22.4 | % | ||||
Our effective tax rate decreased in fiscal year 2017 over fiscal year 2016 primarily due to a favorable shift in the geographic mix of earnings. Our effective tax rate increased in fiscal year 2016 from fiscal year 2015 primarily due to an unfavorable shift in the geographic mix of earnings, including an increase in the amount of loss from our VPT business in Germany, a jurisdiction for which we have a full valuation allowance. This increase was partially offset by a larger benefit of the federal research and development credit. Because of the timing of the lapses and retroactive reinstatements of the federal research and development credit, we were eligible for seven quarters of benefit in fiscal year 2016 and four quarters of benefit in fiscal year 2015.
In general, our effective income tax rate differs from the U.S. federal statutory rate primarily because our foreign earnings are taxed at rates that are, on average, lower than the U.S. federal rate, and our domestic earnings are subject to state income taxes. See Note 14, "Taxes on Earnings" of the Notes to the Consolidated Financial Statements for further information.
57
Discontinued Operations
The following table summarizes the key components of net (loss) earnings from discontinued operations:
Fiscal Years | |||||||||||
(in millions) | 2017(1) | 2016 | 2015 | ||||||||
Revenues | $ | 194.0 | $ | 596.7 | $ | 608.4 | |||||
Cost of revenues | 117.3 | 348.3 | 357.9 | ||||||||
Gross margin | 76.7 | 248.4 | 250.5 | ||||||||
Operating expenses (2) | 76.1 | 132.6 | 97.2 | ||||||||
Operating earnings | 0.6 | 115.8 | 153.3 | ||||||||
Taxes on earnings | 7.4 | 38.4 | 52.7 | ||||||||
Net earnings (loss) from discontinued operations | (6.8 | ) | 77.4 | 100.6 | |||||||
Less: Net earnings from discontinued operations attributable to noncontrolling interests | 0.1 | 0.5 | 0.7 | ||||||||
Net earnings (loss) from discontinued operations attributable to Varian | $ | (6.9 | ) | $ | 76.9 | $ | 99.9 | ||||
(1) | Fiscal year 2017 net earnings (loss) from discontinued operations represents activity through the date of the Distribution. |
(2) | Operating expenses from discontinued operations included separation costs of $34.2 million and $16.9 million during fiscal years 2017 and 2016, respectively. Separation costs include expenses for transaction advisory services, consulting services, restructuring and other expenses. |
Net Earnings Per Diluted Share
Fiscal Years | |||||||||||||||||
2017 | Percent Change | 2016 | Percent Change | 2015 | |||||||||||||
Net earnings per diluted share - continuing operations | $ | 2.75 | (19 | )% | $ | 3.39 | 9 | % | $ | 3.10 | |||||||
Net earnings per diluted share - discontinued operations | (0.07 | ) | (109 | )% | 0.80 | (19 | )% | 0.99 | |||||||||
Total net earnings per diluted share | $ | 2.68 | (36 | )% | $ | 4.19 | 2 | % | $ | 4.09 | |||||||
Net earnings per diluted share from continuing operations decreased in fiscal year 2017 over fiscal year 2016 primarily due to$51.4 million in impairment charges related to our Original CPTC Loans and a $37.8 million allowance for doubtful accounts from CPTC and another proton center in fiscal year 2017, partially offset by a reduction in the number of diluted shares of common stock outstanding due to share repurchases.
Net earnings per diluted share from continuing operations increased in fiscal year 2016 over fiscal year 2015 primarily due to a reduction in the number of diluted shares of common stock outstanding due to share repurchases, partially offset by an increase in the effective tax rate. Net earnings per diluted share from continuing operations in fiscal year 2016 was negatively impacted by $24.8 million in legal expenses.
Gross Orders
Total Gross Orders (by segment) | Fiscal Years | ||||||||||||||||
(Dollars in millions) | 2017 | Percent Change | 2016 | Percent Change | 2015 | ||||||||||||
Oncology Systems | $ | 2,905.8 | 7 | % | $ | 2,724.5 | 1 | % | $ | 2,699.7 | |||||||
Varian Particle Therapy | 229.2 | 120 | % | 104.3 | (67 | )% | 316.9 | ||||||||||
Other | — | (100 | )% | 0.4 | 7 | % | 0.3 | ||||||||||
Total Gross Orders | $ | 3,135.0 | 11 | % | $ | 2,829.2 | (6 | )% | $ | 3,016.9 | |||||||
58
Gross orders are defined as new orders recorded during the period adjusted for any revisions to existing orders during the period. New orders are recorded for the total contractual amount, excluding certain pass-through items, once a written agreement for the delivery of goods or provision of services is in place and, other than VPT, when shipment of the product is expected to occur within two years, so long as any contingencies are deemed perfunctory. For our VPT business, we record orders when construction of the related proton therapy treatment center is reasonably expected to start within two years, but only if any contingencies are deemed perfunctory. We will not record VPT orders if there are major financing contingencies, if a substantial portion of the financing for the project is not reasonably assured or if customer board approval contingencies are pending. We perform a quarterly review to verify that outstanding orders remain valid. If an order is no longer expected to ultimately convert to revenue, we record a backlog adjustment, which reduces backlog but does not impact gross orders for the period.
Gross orders in any period may not be directly correlated to the level of revenues in any particular future quarter or period since the timing of revenue recognition will vary significantly based on the delivery requirements of individual orders, acceptance schedules and the readiness of individual customer sites for installation of our products. Moreover, certain types of orders, such as orders for software or newly introduced products in our Oncology Systems segment, typically take more time from order to completion of installation and acceptance than hardware or older products. Because an order for a proton therapy system can be relatively large, an order in one fiscal period will cause gross orders in our VPT business to vary significantly, making comparisons between fiscal periods more difficult. Furthermore, bid awards, primarily in our VPT business, may be subject to challenge by third parties, which can make these orders more unpredictable than other products.
Oncology Systems Gross Orders
Gross Orders by region | Fiscal Years | ||||||||||||||||||||||
(Dollars in millions) | 2017 | Percent Change | Constant Currency | 2016 | Percent Change | Constant Currency | 2015 | ||||||||||||||||
Americas | $ | 1,479.0 | 3 | % | 3 | % | $ | 1,438.4 | 4 | % | 4 | % | $ | 1,384.1 | |||||||||
EMEA | 878.2 | 14 | % | 14 | % | 772.9 | (6 | )% | (4 | )% | 826.0 | ||||||||||||
APAC | 548.6 | 7 | % | 7 | % | 513.2 | 5 | % | 3 | % | 489.6 | ||||||||||||
Total Oncology Systems Gross Orders | $ | 2,905.8 | 7 | % | 7 | % | $ | 2,724.5 | 1 | % | 1 | % | $ | 2,699.7 | |||||||||
North America | $ | 1,386.2 | 6 | % | 5 | % | $ | 1,313.8 | 4 | % | 4 | % | $ | 1,258.2 | |||||||||
International | 1,519.6 | 8 | % | 8 | % | 1,410.7 | (2 | )% | (1 | )% | 1,441.5 | ||||||||||||
Total Oncology Systems Gross Orders | $ | 2,905.8 | 7 | % | 7 | % | $ | 2,724.5 | 1 | % | 1 | % | $ | 2,699.7 | |||||||||
The Americas Oncology Systems gross orders increased in fiscal year 2017 over fiscal year 2016 primarily due to an increase in gross orders for services and, to a lesser extent, software licenses in North America, partially offset by a decrease in gross orders for hardware products in Latin America. The Americas Oncology Systems gross orders increased in fiscal year 2016 over fiscal year 2015 primarily due to an increase in gross orders for hardware products in North America and, to a lesser extent, an increase in gross orders for services in North America, primarily offset by a decrease in gross orders for software licenses in North America.
EMEA Oncology Systems gross orders increased in fiscal year 2017 over fiscal year 2016 due to increases in gross orders for hardware products and, to a lesser extent, an increase in gross orders for services. EMEA Oncology Systems gross orders decreased in fiscal year 2016 over fiscal year 2015 primarily due to a decrease in gross orders for hardware products, and to a lesser extent, decreases in gross orders for software licenses and services.
APAC Oncology Systems gross orders increased in fiscal year 2017 over fiscal year 2016 primarily due to increases in gross orders for hardware products and services. APAC Oncology Systems gross orders increased in fiscal year 2016 over fiscal year 2015 primarily due to increases in gross orders for services and hardware products.
The extra week of operations in fiscal year 2015 approximately contributed an additional $7 million in Oncology Systems service gross orders in fiscal year 2015.
59
The trailing 12 months' growth in gross orders for Oncology Systems at the end of September 29, 2017, and at the end of the three previous fiscal quarters were:
Trailing 12 months ended | |||||||
September 29, 2017 | June 30, 2017 | March 31, 2017 | December 30, 2016 | ||||
Americas | 3% | 4% | 5% | 4% | |||
EMEA | 14% | (3)% | (4)% | (2)% | |||
APAC | 7% | 13% | 15% | 13% | |||
North America | 6% | 2% | 5% | 6% | |||
International | 8% | 5% | 3% | 3% | |||
Total Oncology Systems Gross Orders | 7% | 3% | 4% | 4% | |||
Consistent with the historical pattern, we expect that Oncology Systems gross orders will continue to experience regional fluctuations. In recent years before 2017, the percentage of domestic gross orders has increased, but we expect in the long-term international gross orders, specifically from emerging markets, will grow as a percentage of overall orders. Oncology Systems gross orders are affected by foreign currency fluctuations, which could impact the demand for our products. In addition, government programs that stimulate the purchase of healthcare products could affect the demand for our products from period to period, and could therefore make it difficult to compare our financial results.
Varian Particle Therapy Gross Orders
VPT gross orders increased in fiscal year 2017 over fiscal year 2016 primarily due to recording six proton therapy gross orders in fiscal year 2017 compared to two proton therapy gross orders in fiscal year 2016. VPT gross orders decreased in fiscal year 2016 over fiscal year 2015 primarily due to recording two proton therapy product gross orders in fiscal year 2016, compared to six proton therapy product gross orders in fiscal year 2015.
Backlog
Backlog is the accumulation of all gross orders for which revenues have not been recognized but are still considered valid. Backlog also includes a small portion of billed service contracts that are included in deferred revenue. Backlog is stated at historical foreign currency exchange rates and revenue is released from backlog at current exchange rates, with any difference recorded as a backlog adjustment. Backlog at September 29, 2017 was $3.5 billion, including approximately $323 million in VPT backlog, which was an increase of 10% over the backlog at September 30, 2016. Our Oncology Systems backlog at September 29, 2017 was 9% higher than the backlog at September 30, 2016, which reflected a 9% increase for both our North America and international regions.
We perform a quarterly review to verify that outstanding orders in the backlog remain valid. Aged orders that are not expected to ultimately convert to revenues are deemed dormant and are reflected as a reduction in the backlog amounts in the period identified. Backlog adjustments are comprised of dormancies, cancellations, foreign currency exchange rate adjustments, backlog acquired from our acquisitions, and other adjustments. Gross orders do not include backlog adjustments. In fiscal years 2017, 2016 and 2015, our backlog adjustments were a reduction of $154.5 million, $189.8 million and $179.8 million, respectively.
Liquidity and Capital Resources
Liquidity is the measurement of our ability to meet potential cash requirements, including ongoing commitments to repay borrowings, acquire businesses or make other investments or loans, repurchase shares of VMS common stock, and fund continuing operations and capital expenditures. Our sources of cash have included operations, borrowings, stock option exercises and employee stock purchases. Our cash usage is actively managed on a daily basis to ensure the maintenance of sufficient funds to meet our needs.
On January 25, 2017, we drew down $203.0 million under the Varex Term Facility. In conjunction with the Distribution, we used $200.0 million of those proceeds to repay a portion of our outstanding 2013 Revolving Credit Facility. At the Distribution Date, we contributed $81.3 million in cash and cash equivalents to Varex as part of the distribution and transfer of certain legal
60
entities. In fiscal year 2017, we received $38.7 million from Varex for excess cash and cash equivalents contributed at the Distribution Date.
Cash and Cash Equivalents
The following table summarizes our cash and cash equivalents:
September 29, | September 30, | ||||||||||
(In millions) | 2017 | 2016 | Increase (Decrease) | ||||||||
Cash and cash equivalents in continuing operations | $ | 716.2 | $ | 811.4 | $ | (95.2 | ) | ||||
Cash and cash equivalents in discontinued operations | — | 32.1 | (32.1 | ) | |||||||
Total cash and cash equivalents. | $ | 716.2 | $ | 843.5 | $ | (127.3 | ) | ||||
The decrease in cash and cash equivalents in fiscal year 2017 compared to fiscal year 2016 was due to $314.5 million in net debt repayments under our credit facility agreements, $294.5 million of cash used for the repurchase of shares of VMS common stock, $59.1 million used for purchases of property, plant and equipment, $42.6 million in net cash and cash equivalents contributed to Varex, $24.5 million used for the purchase of senior secured debt and $18.2 million used for the issuance of notes receivable. These decreases were mostly offset by $399.1 million in cash provided by operating activities, $200.0 million in cash received from the Varex Term Facility and $72.1 million of cash provided by stock option exercises and employee stock purchases.
We earn a significant amount of our operating income outside of the United States, which is deemed to be indefinitely reinvested in foreign jurisdictions. At September 29, 2017, we had approximately $32.8 million, or 5%, of cash and cash equivalents in the United States. At September 29, 2017, approximately $683.4 million, or 95%, of cash and cash equivalents were held abroad and a portion of this amount could be subject to additional taxation if it were repatriated to the United States. We currently do not intend to repatriate these funds. As of September 29, 2017, most of our cash and cash equivalents that were held abroad were in U.S. Dollars and were primarily held as bank deposits. In addition to cash flows generated from operations, a significant portion of which are generated in the United States, we have used our credit facilities to meet our cash needs from time to time and expect to continue to do so in the next 12 months and thereafter for the foreseeable future. Borrowings under our credit facilities may be used for working capital, capital expenditures, VMS share repurchases, acquisitions, and other corporate purposes. Should we require more capital in the United States than is generated by our operations domestically, we could elect to repatriate future earnings from foreign jurisdictions or raise capital in the United States through debt or equity issuance. These actions could result in higher effective tax rates, increased interest expense, or dilution of our earnings. We have borrowed funds domestically and continue to believe we have the ability to do so at a reasonable interest rates.
Cash Flows
Fiscal Years | ||||||||||||
(In millions) | 2017 | 2016 | 2015 | |||||||||
Net cash flow provided by (used in): | ||||||||||||
Operating activities | $ | 399.1 | $ | 356.3 | $ | 469.6 | ||||||
Investing activities | (130.1 | ) | (109.2 | ) | (210.9 | ) | ||||||
Financing activities | (392.4 | ) | (245.8 | ) | (276.7 | ) | ||||||
Effects of exchange rate changes on cash and cash equivalents | (3.9 | ) | (3.3 | ) | 14.2 | |||||||
Net decrease in cash and cash equivalents | $ | (127.3 | ) | $ | (2.0 | ) | $ | (3.8 | ) | |||
Our primary cash inflows and outflows for fiscal years 2017, 2016, and 2015, were as follows:
• | We generated net cash from operating activities of $399.1 million in fiscal year 2017, compared to $356.3 million in fiscal year 2016. The $42.8 million increase in net cash from operating activities during fiscal year 2017 compared to fiscal year 2016 was driven primarily by an increase of $105.3 million in the net change from operating assets and liabilities, an increase of $89.9 million in non-cash items, partially offset by a decrease of $152.4 million in net earnings. |
61
The major contributors to the net change in operating assets and liabilities in fiscal year 2017 were as follows:
• | Accounts receivable increased $52.6 million primarily due to an increase in unbilled receivables associated with additional projects booked in VPT. |
• | Prepaid and other assets increased $46.7 million mainly due to an increase in prepaid income taxes. |
• | Accrued liabilities and other long-term liabilities increased $11.7 million primarily due to an increase in accrued compensation and benefit costs, partially offset by a decrease in accruals for income taxes. |
• | Deferred revenues increased $30.0 million primarily due to an increase in service revenues and advances from customers in Oncology Systems. |
The $113.3 million decrease in net cash from operating activities during fiscal year 2016 compared to fiscal year 2015 was driven primarily by a decrease of $92.4 million in net change from operating assets and liabilities, a decrease of $11.6 million in non-cash items, and a decrease of $9.3 million in net earnings.
The major contributors to the net change in operating assets and liabilities in fiscal year 2016 were as follows:
• | Accounts receivable increased $168.3 million primarily due to higher revenues and timing of collections in Oncology Systems and an increase in unbilled receivables in VPT. |
• | Inventories increased $27.7 million due to increases in inventories in Imaging Components and VPT in anticipation of future demand, partially offset by a decrease in inventories in Oncology Systems due to increased sales activity. |
• | Accrued liabilities and other long-term liabilities increased $61.0 million primarily due to timing of payments processed for employee compensation, an increase in our long-term pension liability and timing of income tax payments. |
• | Deferred revenues decreased $40.2 million primarily due to timing of revenue recognition in Oncology Systems and timing of customer payments in VPT. |
We expect that cash provided by operating activities may fluctuate in future periods as a result of a number of factors, including fluctuations in our operating results, timing of product shipments, product installation or customer acceptance, collection of accounts receivable, inventory management, and the timing and amount of tax and other payments. See Item 1A, “Risk Factors.”
• | Investing activities used $130.1 million, $109.2 million and $210.9 million of net cash in fiscal years 2017, 2016 and 2015, respectively. Cash used for purchases of property, plant and equipment was $59.1 million, $80.4 million and $91.4 million in fiscal years 2017, 2016 and 2015, respectively. During fiscal year 2017, we also used $24.5 million for the purchase of a senior secured debt, $18.2 million for the issuance of notes receivable and $13.4 million for the investment in available-for-sale securities. During fiscal year 2016, we also used $21.7 million for the issuance of notes receivable and $21.1 million of net cash primarily for asset and business acquisitions. During fiscal year 2015, we also used $95.3 million of net cash for acquisitions of businesses and $23.7 million for issuance of notes receivable. |
• | Financing activities used $392.4 million, $245.8 million and $276.7 million of net cash in fiscal years 2017, 2016 and 2015, respectively. We used $294.5 million, $461.3 million and $422.0 million of net cash for the repurchase of VMS common stock in fiscal years 2017, 2016 and 2015, respectively. Cash proceeds from employee stock option exercises and employee stock purchases were $72.1 million, $60.6 million and $91.0 million in fiscal years 2017, 2016 and 2015, respectively. Under our credit facility agreements, we had $314.5 million of net debt repayments in fiscal year 2017, $167.1 million of net borrowings in fiscal year 2016 and $58.6 million of net borrowings in fiscal year 2015. In fiscal year 2017, we also received $200 million from the Varex Term Facility in conjunction with the Distribution, and contributed $42.6 million in cash and cash equivalents to Varex. |
We expect our capital expenditures, which typically represent construction and/or purchases of facilities, manufacturing equipment, office equipment and furniture and fixtures, as well as capitalized costs related to the implementation of software applications, will be approximately 2% of revenues in fiscal year 2018.
62
The following table summarizes our short-term and long-term debt:
September 29, 2017 | September 30, 2016 | ||||||||||||
(In millions, except for percentages) | Amount | Weighted-Average Interest Rate | Amount | Weighted-Average Interest Rate | |||||||||
2017 Revolving Credit Facility | $ | 350.0 | 2.36 | % | $ | — | — | % | |||||
Current portion of 2013 Term Loan Facility | — | — | % | 50.0 | 1.65 | % | |||||||
2013 Revolving Credit Facility | — | — | % | 300.0 | 1.91 | % | |||||||
Sumitomo Credit Facility | — | — | % | 29.6 | 0.53 | % | |||||||
Debt issuance costs | — | (0.6 | ) | ||||||||||
Total short-term debt | $ | 350.0 | $ | 379.0 | |||||||||
2013 Term Loan Facility | $ | — | — | % | $ | 287.5 | 1.65 | % | |||||
Debt issuance costs | — | (0.6 | ) | ||||||||||
Total long-term debt | $ | — | $ | 286.9 | |||||||||
In September 2017, we terminated our existing credit facility ("2013 Credit Facility") and entered into a new credit facility ("2017 Credit Facility"). The 2017 Credit Facility provides a five-year revolving credit facility in an aggregate principal amount of up to $600.0 million. We may increase the aggregate commitments under the new credit facility by up to $100 million, plus an amount based on our consolidated leverage ratio on a pro forma basis, subject to certain conditions being met, including lender approval. The 2013 Credit Facility was terminated and paid down by the initial drawdowns from the 2017 Credit Facility. See Note 7, "Borrowings" of the Notes to the Consolidated Financial Statements for a detailed discussion regarding our Credit Facility and the Sumitomo Credit Facility.
The following table provides additional information regarding our short-term borrowings (excluding current maturities of long-term debt):
Fourth Quarter of Fiscal Year 2017 | Fiscal Years | ||||||||||||||
(In millions except for percentages) | 2017 | 2016 | 2015 | ||||||||||||
Amount outstanding (at end of period) | $ | 350.0 | $ | 350.0 | $ | 329.6 | $ | 108.4 | |||||||
Weighted average interest rate (at end of period) | 2.36 | % | 2.36 | % | 1.78 | % | 1.41 | % | |||||||
Average amount outstanding (during period) | $ | 146.0 | $ | 192.6 | $ | 320.8 | $ | 104.5 | |||||||
Weighted average interest rate (during period) | 2.30 | % | 1.90 | % | 1.68 | % | 1.48 | % | |||||||
Maximum month-end amount outstanding during period | $ | 350.0 | $ | 350.0 | $ | 431.6 | $ | 140.0 | |||||||
Our liquidity is affected by many factors, some of which result from the normal ongoing operations of our business and some of which arise from uncertainties and conditions in the United States and global economies. Although our cash requirements will fluctuate as a result of the shifting influences of these factors, we believe that existing cash and cash equivalents and cash to be generated from operations and current or future credit facilities will be sufficient to satisfy anticipated commitments for capital expenditures and other cash requirements for the next twelve months and into the foreseeable future. We currently anticipate that we will continue to utilize our available liquidity and cash flows from operations, as well as borrowed funds, to make strategic acquisitions, invest in the growth of our business, invest in advancing our systems and processes, repurchase VMS common stock and fund loan commitments and other strategic investments.
Total debt as a percentage of total capital decreased to 18.9% at September 29, 2017 from 27.6% at September 30, 2016 primarily due to a decrease in borrowings. The ratio of current assets to current liabilities decreased to 1.41 to 1 at September 29, 2017 from 1.62 to 1 at September 30, 2016.
Days Sales Outstanding
Our Oncology Systems trade accounts receivable days sales outstanding (“DSO”) was 90 days at both September 29, 2017 and September 30, 2016. Our accounts receivable and DSO are impacted by a number of factors, primarily including the timing of product shipments, product installation or customer acceptance, collections performance, payment terms, the mix of revenues
63
from different regions and the effects of economic instability. VPT's DSO is not meaningful because it is highly variable. As of September 29, 2017, approximately 2% of our net accounts receivable balance was related to customer contracts with remaining terms of more than one year.
Share Repurchase Program
We repurchased shares of VMS common stock under various authorizations during the periods presented as follows:
Fiscal Years | |||||||||||
(In millions, except per share amounts) | 2017 | 2016 | 2015 | ||||||||
Number of shares | 3.3 | 5.7 | 4.8 | ||||||||
Average repurchase price per share | $ | 90.63 | $ | 81.61 | $ | 87.47 | |||||
Total cost | $ | 294.5 | $ | 461.3 | $ | 422.0 | |||||
In November 2016, the VMS Board of Directors authorized the repurchase of an additional 8.0 million shares of VMS common stock commencing on January 1, 2017. As of September 29, 2017, approximately 5.2 million shares of VMS common stock remained available for repurchase under the November 2016 authorization. We repurchased approximately 0.5 million shares of VMS common stock in the three months ended December 30, 2016, under the November 2015 authorization, which expired on December 31, 2016.
Stock repurchases may be made in the open market, in privately negotiated transactions (including accelerated share repurchase programs), or under Rule 10b5-1 share repurchase plans, and also may be made from time to time or in one or more larger blocks. All shares that were repurchased under our share repurchase programs have been retired.
For more details see Note 11, "Stockholders' Equity and Noncontrolling Interests" of the Notes to the Consolidated Financial Statements for further discussion.
Contractual Obligations
The following summarizes our contractual obligations as of September 29, 2017 and the effect such obligations are expected to have on our liquidity and cash flows in future periods:
Payments Due By Period | |||||||||||||||||||
Fiscal Year | Fiscal Years | Fiscal Years | |||||||||||||||||
(In millions) | 2018 | 2019-2020 | 2021-2022 | Beyond | Total | ||||||||||||||
Operating leases (1) | $ | 24.9 | $ | 37.3 | $ | 25.6 | $ | 19.1 | $ | 106.9 | |||||||||
Purchase obligations (2) | 31.0 | 39.7 | 3.6 | — | 74.3 | ||||||||||||||
Defined benefit pension plans (3) | 8.7 | — | — | — | 8.7 | ||||||||||||||
Total (4) | $ | 64.6 | $ | 77.0 | $ | 29.2 | $ | 19.1 | $ | 189.9 | |||||||||
(1) | Operating leases include future minimum lease payments under all our non-cancellable operating leases as of September 29, 2017. |
(2) | Purchase obligations include agreements to purchase goods or services that are enforceable, are legally binding and non-cancellable. Purchase obligations do not include agreements that are cancellable without penalty. |
(3) | As further described in Note 10, "Retirement Plans" of the Notes to the Consolidated Financial Statements, our post-retirement benefit plan is not presented in the table above as it is not material. As of September 29, 2017, the remaining defined benefit pension plans were underfunded by $15.6 million. Due to the impact of future plan asset performance, changes in interest rates and other economic and demographic assumptions, the potential for changes in legislation in the United States and other foreign jurisdictions, we are not able to reasonably estimate the timing and amount of contributions necessary to fund our defined benefit pension plans beyond the next fiscal year. |
(4) | The following items are not included in the table above: |
• | Long-term income taxes payable includes the liability for uncertain tax positions, including interest and penalties, and may also include other long-term tax liabilities. As of September 29, 2017, our total liability for uncertain tax |
64
positions was $48.6 million, of which we do not anticipate a payment in the next 12 months. We are unable to reliably estimate the timing of the remainder of future payments related to uncertain tax positions. See a detailed discussion in Note 14, "Taxes on Earnings" of the Notes to the Consolidated Financial Statements.
• | As further described in Note 9, “Commitments and Contingencies,” of the Notes to the Consolidated Financial Statements, as of September 29, 2017, we had accrued $6.0 million for environmental remediation liabilities. The amount accrued represents estimates of anticipated future costs and the timing and amount of actual future environmental remediation costs may vary as the scope of our obligations becomes more clearly defined. |
• | As further described in Note 16, "VPT Loans,” of the Notes to the Consolidated Financial Statements, as of September 29, 2017, our outstanding commitments for the GPTC securities was $11.8 million and $2.2 million for the CPTC DIP loan, both of which are expected to be drawn down over the next 12 months. |
Contingencies
Environmental Remediation Liabilities
For a discussion of environmental remediation liabilities, see Note 9, “Commitments and Contingencies — Environmental Remediation Liabilities” of the Notes to the Consolidated Financial Statements, which discussion is incorporated herein by reference.
Other Matters
From time to time, we are a party to or otherwise involved in legal proceedings, claims and government inspections or investigations and other legal matters both inside and outside the United States, arising in the ordinary course of our business or otherwise. Such matters are subject to many uncertainties and outcomes are not predictable with assurance. See Note 9, “Commitments and Contingencies — Other Matters” of the Notes to the Consolidated Financial Statements, which discussion is incorporated herein by reference.
Off-Balance Sheet Arrangements
In conjunction with the sale of our products in the ordinary course of business, we provide standard indemnification of business partners and customers for losses suffered or incurred for property damages, death and injury and for patent, copyright or any other intellectual property infringement claims by any third parties with respect to our products. The terms of these indemnification arrangements are generally perpetual. Except for losses related to property damages, the maximum potential amount of future payments we could be required to make under these arrangements is unlimited. As of September 29, 2017, we have not incurred any significant costs since the Spin-offs to defend lawsuits or settle claims related to these indemnification arrangements. As a result, we believe the estimated fair value of these arrangements is minimal.
We have entered into indemnification agreements with our directors and officers and certain of our employees that serve as officers or directors of our foreign subsidiaries that may require us to indemnify our directors and officers and those certain employees against liabilities that may arise by reason of their status or service as directors or officers, and to advance their expenses incurred as a result of any legal proceeding against them as to which they could be indemnified.
Recent Accounting Standards or Updates Not Yet Effective
See Note 1, "Summary of Significant Accounting Policies" of the Notes to the Consolidated Financial Statements for a description of recent accounting standards, including the expected dates of adoption and the estimated effects on our consolidated financial statements.
Item 7A. Quantitative and Qualitative Disclosures About Market Risks
We are exposed to three primary types of market risks: credit risk and counterparty risk, foreign currency exchange rate risk and interest rate risk.
Credit Risk and Counterparty Risk
We are exposed to credit loss in the event of nonperformance by counterparties on the foreign currency forward contracts used in hedging activities. These counterparties are large international and regional financial institutions and to date, no such counterparty has failed to meet its financial obligation to us under such contracts.
65
We are also exposed to credit loss in the event of default by counterparties of our financing receivables and CPTC, the obligor under the loan facility in which we are participating to finance the construction and start-up operations of the Scripps Proton Therapy Center. In January 2017, we were informed of actions taken by CPTC and the loan agent, including CPTC obtaining shareholder consents for voluntary bankruptcy filing and the loan agent deciding that no additional funding would be available outside of a bankruptcy process. As a result of this information and our analysis that these actions would likely lead to insolvency or bankruptcy proceedings at CPTC, we determined that it was appropriate to record a $38.3 million other-than temporary impairment due to credit losses associated with the Original CPTC Loans on the Consolidated Statements of Earnings in the first quarter of fiscal year 2017. As a result of this impairment, the Original CPTC Loans were written down to their estimated fair value and reclassified from short-term investments to other assets on the Consolidated Balance Sheet because we did not expect to collect or sell all or a portion of the loans in the next twelve months. In September 2017, the Lenders and Scripps signed a Transition Agreement to transition the operations of the center from Scripps to a new operator. Based on the terms of the Transition Agreement, a slower growth in patient volume, an increase in additional capital needs and our analysis we determined that the Original CPTC Loans were other-than-temporarily impaired and recorded an additional $13.1 million impairment charge on the Consolidated Statements of Earnings in the fourth quarter of fiscal year 2017. As of September 29, 2017, the Original CPTC Loans have a fair value of $47.4 million.
In March 2017, CPTC filed for bankruptcy and concurrently entered into a Debtor-in-Possession Facility ("DIP") with ORIX Capital Markets, LLC, J.P. Morgan and the Company for up to $16.0 million of additional financing during the bankruptcy process. Our pro-rata share of the DIP Facility is $7.3 million. As of September 29, 2017, our outstanding commitment under the DIP facility was $2.2 million and is expected to be drawn down over the next twelve months.
As of September 29, 2017, we have an outstanding loan of $35.0 million to the Maryland Proton Therapy Center ("MPTC"). Our subordinated loan is due, with accrued interest, in three annual payments from 2020 to 2022. The interest on the outstanding loan accrues at 12%. We also have $25.1 million as long-term notes receivable related to a deferred payment arrangement with MPTC. The notes receivable carries an interest rate of 15% and is due September 30, 2018.
Financing receivables also include notes receivable from the New York Proton Center, and Proton International LLC totaling $18.5 million and $3.0 million, respectively.
In July 2017, we purchased the outstanding senior secured debt related to the RPTC in Munich, Germany for 21.5 million Euros or $24.5 million. By purchasing the senior secured debt, we have a right to 89 million Euros in claims against all of RPTC's assets. In September 2017, the management of RPTC filed for bankruptcy in Germany. As of September 29, 2017, preliminary insolvency proceedings have not been finalized, but we expect the insolvency proceedings to be finalized within the next twelve months. Upon finalization of bankruptcy proceedings, we expect to recover our outstanding senior secured debt balance.
In addition, cash and cash equivalents held with financial institutions may exceed the Federal Deposit Insurance Corporation insurance limits or similar limits in foreign jurisdictions. We also may need to rely on our credit facilities as described below under “Interest Rate Risk.” Our access to our cash and cash equivalents or ability to borrow could be reduced if one or more financial institutions with which we have deposits or from which we borrow should fail or otherwise be adversely impacted by conditions in the financial or credit markets. Conditions such as those we experienced as a result of the last economic downturn and accompanying contraction in the credit markets heighten these risks. Concerns over economic instability could make it more difficult for us to collect outstanding receivables and could adversely impact our liquidity.
Foreign Currency Exchange Rate Risk
As a global entity, we are exposed to movements in foreign currency exchange rates. These exposures may change over time as business practices evolve. Adverse foreign currency rate movements could have a material negative impact on our financial results. Our primary exposures related to foreign currency denominated sales and purchases are in Europe, Asia, Australia and Canada.
We have many transactions denominated in foreign currencies and address certain of those financial exposures through a risk management program that includes the use of derivative financial instruments. We sell products throughout the world, often in the currency of the customer’s country, and may hedge certain of these larger foreign currency sale transactions when they are not transacted in the subsidiaries’ functional currency or in U.S. Dollars. The foreign currency transactions that fit our risk management policy criteria are hedged with foreign currency forward contracts. We may use other derivative instruments in the future. We enter into foreign currency forward contracts primarily to reduce the effects of fluctuating foreign currency exchange rates. We do not enter into foreign currency forward contracts for speculative or trading purposes. The forward contracts range from one to thirteen months in maturity.
66
We also hedge the balance sheet exposures from our various foreign subsidiaries and business units. We enter into foreign currency forward contracts to minimize the short-term impact of currency fluctuations on assets and liabilities denominated in currencies other than the subsidiaries' functional currency or the U.S. Dollar.
The notional amounts of foreign currency forward contracts are not a measure of our exposure. The fair value of forward contracts generally reflects the estimated amounts that we would receive or pay to terminate the contracts at the reporting date, thereby taking into account and approximating the current unrealized and realized gains or losses of the open contracts. A move in foreign currency exchange rates would change the fair value of the contracts, and the fair value of the underlying exposures hedged by the contracts would change in a similar offsetting manner.
The notional values and the weighted average contractual foreign currency exchange rates of our sold and purchased foreign currency forward contracts outstanding at September 29, 2017 were as follows:
(Dollars in millions) | Notional Value Sold | Notional Value Purchased | Weighted Average Contract Rate (Foreign Currency Units per USD) | ||||||||
Australian Dollar | $ | 29.1 | $ | — | 1.28 | ||||||
Brazilian Real | 5.2 | — | 3.18 | ||||||||
British Pound | 14.8 | 0.1 | 0.75 | ||||||||
Canadian Dollar | 8.2 | — | 1.25 | ||||||||
Danish Krone | — | 0.3 | 6.29 | ||||||||
Euro | 247.2 | 6.1 | 0.85 | ||||||||
Hungarian Forint | 3.1 | — | 262.83 | ||||||||
Indian Rupee | 12.7 | — | 65.65 | ||||||||
Japanese Yen | 47.1 | — | 112.45 | ||||||||
Polish Zloty | 4.6 | — | 3.65 | ||||||||
Swedish Krona | 0.6 | — | 8.16 | ||||||||
Swiss Franc | — | 59.8 | 0.97 | ||||||||
Thai Baht | 4.8 | — | 33.31 | ||||||||
Totals | $ | 377.4 | $ | 66.3 | |||||||
Interest Rate Risk
Our market risk exposure to changes in interest rates depends primarily on our investment portfolio and borrowings. Our investment portfolio primarily consisted of cash and cash equivalents and available-for-sale investments as of September 29, 2017. The principal amount of cash and cash equivalents at September 29, 2017 totaled $716.2 million with a weighted average interest rate of 0.39%. At September 29, 2017, our available-for-sale investments included the Original CPTC Loans of $47.4 million, $8.0 million in subordinated bonds with a fixed interest rate to finance the Delray Radiation Therapy Center ("DRTC") and $4.4 million in Senior Capital Appreciation Bonds to finance the Georgia Proton Therapy Center ("GPTC"). The Original CPTC Loans bear interest at the London Interbank Offer Rate ("LIBOR") plus 7.0% per annum with a minimum interest rate of 9.0% per annum, the DRTC subordinated bonds bear an interest rate of 8.5% per annum and the GPTC Senior Capital Appreciation Bonds bear an interest rate of 8.0%. Our available-for-sale investments are carried at fair value.
Borrowings under the 2017 Revolving Credit Facility accrue interest either (i) based on the Eurodollar Rate plus a margin of 1.125% to 1.875% based on a leverage ratio involving funded indebtedness and EBITDA, or (ii) based upon a base rate of (a) the federal funds rate plus 0.50%, (b) BofA’s announced prime rate, or (c) the Eurodollar Rate plus 1.00%, whichever is highest, plus a margin of 0.125% to 0.875% based on the same leverage ratio, depending upon instructions from the Company. Borrowings under the 2017 Revolving Credit Facility have a contract repayment date of twelve months, or less, and a final maturity of five years if based on the Eurodollar Rate and all overnight borrowings on the base rate would also have a final maturity of five years.
We are affected by market risk exposure primarily through the effect of changes in interest rates on amounts payable under our 2017 Revolving Credit Facility. At September 29, 2017, borrowings under the under the 2017 Revolving Credit Facility totaled $350.0 million with a weighted average interest rate of 2.36%. If the amount outstanding under our 2017 Revolving Credit Facility remained at this level for an entire year and interest rates increased or decreased by 1%, our annual interest expense would increase or decrease, respectively, by an additional $3.5 million. See a detailed discussion of our credit facilities in “MD&A – Liquidity and Capital Resources.”
67
In addition, the Sumitomo Credit Facility allows VMS KK to borrow up to a maximum amount of 3.0 billion Japanese Yen. Borrowings under the Sumitomo Credit Facility accrue interest based on the basic loan rate announced by the Bank of Japan plus a margin of 0.5% per annum. As of September 29, 2017, the there was no outstanding balance under the Sumitomo Credit Facility.
To date, we have not used derivative financial instruments to hedge the interest rate within our investment portfolio, borrowings, but may consider the use of derivative instruments in the future. In addition, although payments under certain of our operating leases for our facilities are tied to market indices, these operating leases do not expose us to material interest rate risk.
68
Item 8. Financial Statements and Supplementary Data
VARIAN MEDICAL SYSTEMS, INC. AND SUBSIDIARIES
CONSOLIDATED STATEMENTS OF EARNINGS
Fiscal Years | ||||||||||||
(In millions, except per share amounts) | 2017 | 2016 | 2015 | |||||||||
Revenues: | ||||||||||||
Product | $ | 1,555.5 | $ | 1,583.9 | $ | 1,497.1 | ||||||
Service | 1,112.7 | 1,037.2 | 993.6 | |||||||||
Total revenues | 2,668.2 | 2,621.1 | 2,490.7 | |||||||||
Cost of revenues: | ||||||||||||
Product | 1,025.3 | 1,071.3 | 1,035.3 | |||||||||
Service | 487.3 | 436.9 | 423.3 | |||||||||
Total cost of revenues | 1,512.6 | 1,508.2 | 1,458.6 | |||||||||
Gross margin | 1,155.6 | 1,112.9 | 1,032.1 | |||||||||
Operating expenses: | ||||||||||||
Research and development | 210.0 | 200.4 | 195.4 | |||||||||
Selling, general and administrative | 552.3 | 475.3 | 441.0 | |||||||||
Impairment charges | 51.4 | 2.2 | — | |||||||||
Total operating expenses | 813.7 | 677.9 | 636.4 | |||||||||
Operating earnings | 341.9 | 435.0 | 395.7 | |||||||||
Interest income | 13.6 | 17.2 | 13.5 | |||||||||
Interest expense | (10.7 | ) | (11.6 | ) | (7.9 | ) | ||||||
Earnings from continuing operations before taxes | 344.8 | 440.6 | 401.3 | |||||||||
Taxes on earnings | 87.7 | 115.3 | 89.9 | |||||||||
Net earnings from continuing operations | 257.1 | 325.3 | 311.4 | |||||||||
Net earnings (loss) from discontinued operations | (6.8 | ) | 77.4 | 100.6 | ||||||||
Net earnings | 250.3 | 402.7 | 412.0 | |||||||||
Less: Net earnings attributable to noncontrolling interests | 0.7 | 0.4 | 0.5 | |||||||||
Net earnings attributable to Varian | $ | 249.6 | $ | 402.3 | $ | 411.5 | ||||||
Net earnings (loss) per share - basic | ||||||||||||
Continuing operations | $ | 2.78 | $ | 3.41 | $ | 3.13 | ||||||
Discontinued operations | (0.08 | ) | 0.81 | 1.00 | ||||||||
Net earnings per share - basic | $ | 2.70 | $ | 4.22 | $ | 4.13 | ||||||
Net earnings (loss) per share - diluted | ||||||||||||
Continuing operations | $ | 2.75 | $ | 3.39 | $ | 3.10 | ||||||
Discontinued operations | (0.07 | ) | 0.80 | 0.99 | ||||||||
Net earnings per share - diluted | $ | 2.68 | $ | 4.19 | $ | 4.09 | ||||||
Shares used in the calculation of net earnings per share: | ||||||||||||
Weighted average shares outstanding - basic | 92.5 | 95.4 | 99.7 | |||||||||
Weighted average shares outstanding - diluted | 93.2 | 96.0 | 100.6 | |||||||||
See accompanying notes to the consolidated financial statements.
69
VARIAN MEDICAL SYSTEMS, INC. AND SUBSIDIARIES
CONSOLIDATED STATEMENTS OF COMPREHENSIVE EARNINGS
Fiscal Years | ||||||||||||
(In millions) | 2017 | 2016 | 2015 | |||||||||
Net earnings | $ | 250.3 | $ | 402.7 | $ | 412.0 | ||||||
Other comprehensive earnings (loss), net of tax: | ||||||||||||
Defined benefit pension and post-retirement benefit plans: | ||||||||||||
Net gain (loss) arising during the year, net of tax (expense) benefit of ($2.5), $4.3 and $0.9 | 10.0 | (21.4 | ) | (4.7 | ) | |||||||
Prior service credit arising during the year, net of tax expense of ($0.7), ($0.2) and $0.0 | 4.3 | 1.1 | — | |||||||||
Amortization of prior service cost included in net periodic benefit cost, net of tax benefit of $0.2, $0.2 and $0.1 | (0.8 | ) | (0.4 | ) | (0.2 | ) | ||||||
Amortization, settlement and curtailment of net actuarial loss included in net periodic benefit cost, net of tax expense of ($1.0), ($0.5) and ($0.6) | 5.7 | 3.5 | 2.9 | |||||||||
19.2 | (17.2 | ) | (2.0 | ) | ||||||||
Derivative instruments: | ||||||||||||
Change in unrealized gain (loss), net of tax (expense) benefit of $0.0, $0.4 and ($0.8) | — | (0.6 | ) | 1.4 | ||||||||
Reclassification adjustments, net of tax (expense) benefit of $0.0, ($0.4) and $1.4 | — | 0.6 | (2.4 | ) | ||||||||
— | — | (1.0 | ) | |||||||||
Available-for-sale securities: | ||||||||||||
Change in unrealized loss, net of tax benefit of $0.0, $0.1 and $0.1 | — | (0.3 | ) | (0.1 | ) | |||||||
Reclassification adjustments, net of tax expense of $0.0, ($0.2) and $0.0 | — | 0.4 | — | |||||||||
— | 0.1 | (0.1 | ) | |||||||||
Currency translation adjustment | 12.8 | 2.8 | (24.8 | ) | ||||||||
Other comprehensive earnings (loss) | 32.0 | (14.3 | ) | (27.9 | ) | |||||||
Comprehensive earnings | 282.3 | 388.4 | 384.1 | |||||||||
Less: Comprehensive earnings attributable to noncontrolling interests | 0.7 | 0.4 | 0.5 | |||||||||
Comprehensive earnings attributable to Varian | $ | 281.6 | $ | 388.0 | $ | 383.6 | ||||||
See accompanying notes to the consolidated financial statements.
70
VARIAN MEDICAL SYSTEMS, INC. AND SUBSIDIARIES
CONSOLIDATED BALANCE SHEETS
September 29, | September 30, | ||||||
(In millions, except par values) | 2017 | 2016 | |||||
Assets | |||||||
Current assets: | |||||||
Cash and cash equivalents | $ | 716.2 | $ | 811.4 | |||
Short-term investments | — | 95.3 | |||||
Accounts receivable, net of allowance for doubtful accounts of $45.9 at September 29, 2017 and $24.2 at September 30, 2016 | 823.5 | 769.6 | |||||
Inventories | 439.7 | 442.4 | |||||
Prepaid expenses and other current assets | 199.8 | 141.1 | |||||
Current assets of discontinued operations | 11.1 | 355.6 | |||||
Total current assets | 2,190.3 | 2,615.4 | |||||
Property, plant and equipment, net | 255.3 | 258.6 | |||||
Goodwill | 222.6 | 220.0 | |||||
Intangible assets | 71.6 | 84.1 | |||||
Deferred tax assets | 138.8 | 136.8 | |||||
Other assets | 300.8 | 227.0 | |||||
Non-current assets of discontinued operations | — | 272.9 | |||||
Total assets | $ | 3,179.4 | $ | 3,814.8 | |||
Liabilities, Redeemable Noncontrolling Interests and Equity | |||||||
Current liabilities: | |||||||
Accounts payable | $ | 162.3 | $ | 159.2 | |||
Accrued liabilities | 394.7 | 383.6 | |||||
Deferred revenues | 640.6 | 608.6 | |||||
Short-term borrowings | 350.0 | 329.6 | |||||
Current maturities of long-term debt | — | 49.4 | |||||
Current liabilities of discontinued operations | 2.5 | 83.0 | |||||
Total current liabilities | 1,550.1 | 1,613.4 | |||||
Long-term debt | — | 286.9 | |||||
Other long-term liabilities | 130.0 | 155.8 | |||||
Non-current liabilities of discontinued operations | — | 4.2 | |||||
Total liabilities | 1,680.1 | 2,060.3 | |||||
Commitments and contingencies (Note 9) | |||||||
Redeemable noncontrolling interests of discontinued operations | — | 10.3 | |||||
Equity: | |||||||
Varian stockholders' equity: | |||||||
Preferred stock of $1 par value: 1.0 shares authorized; none issued and outstanding | — | — | |||||
Common stock of $1 par value: 189.0 shares authorized; 91.7 and 93.7 shares issued and outstanding at September 29, 2017 and at September 30, 2016, respectively | 91.7 | 93.7 | |||||
Capital in excess of par value | 716.1 | 678.6 | |||||
Retained earnings | 756.0 | 1,069.0 | |||||
Accumulated other comprehensive loss | (68.8 | ) | (100.8 | ) | |||
Total Varian stockholders' equity | 1,495.0 | 1,740.5 | |||||
Noncontrolling interests | 4.3 | 3.7 | |||||
Total equity | 1,499.3 | 1,744.2 | |||||
Total liabilities, redeemable noncontrolling interests and equity | $ | 3,179.4 | $ | 3,814.8 | |||
See accompanying notes to the consolidated financial statements.
71
VARIAN MEDICAL SYSTEMS, INC. AND SUBSIDIARIES
CONSOLIDATED STATEMENTS OF CASH FLOWS
Fiscal Years | |||||||||||
(In millions) | 2017 | 2016 | 2015 | ||||||||
Cash flows from operating activities: | |||||||||||
Net earnings | $ | 250.3 | $ | 402.7 | $ | 412.0 | |||||
Adjustments to reconcile net earnings to net cash provided by operating activities: | |||||||||||
Share-based compensation expense | 41.2 | 48.3 | 46.3 | ||||||||
Tax benefits from exercises of share-based payment awards | 0.7 | 3.0 | 12.6 | ||||||||
Excess tax benefits from share-based compensation | (1.0 | ) | (3.9 | ) | (12.6 | ) | |||||
Depreciation | 58.5 | 64.2 | 60.1 | ||||||||
Amortization of intangible assets | 18.4 | 15.6 | 8.4 | ||||||||
Deferred taxes | (14.9 | ) | (23.9 | ) | 5.4 | ||||||
Provision for doubtful accounts receivable | 43.7 | 3.5 | 1.1 | ||||||||
Impairment charges | 51.4 | 2.2 | — | ||||||||
Other, net | 3.0 | 2.1 | 1.4 | ||||||||
Changes in assets and liabilities, net of effects of acquisitions: | |||||||||||
Accounts receivable | (52.6 | ) | (168.3 | ) | (79.4 | ) | |||||
Inventories | (0.1 | ) | (27.7 | ) | (41.6 | ) | |||||
Prepaid expenses and other assets | (46.7 | ) | 8.0 | (8.2 | ) | ||||||
Accounts payable | 5.5 | 9.7 | 6.5 | ||||||||
Accrued liabilities and other long-term liabilities | 11.7 | 61.0 | (14.0 | ) | |||||||
Deferred revenues | 30.0 | (40.2 | ) | 71.6 | |||||||
Net cash provided by operating activities | 399.1 | 356.3 | 469.6 | ||||||||
Cash flows from investing activities: | |||||||||||
Purchases of property, plant and equipment | (59.1 | ) | (80.4 | ) | (91.4 | ) | |||||
Issuance of notes receivable | (18.2 | ) | (21.7 | ) | (23.7 | ) | |||||
Purchase of senior secured debt | (24.5 | ) | — | — | |||||||
Investment in available-for-sale securities | (13.4 | ) | (3.3 | ) | (1.8 | ) | |||||
Sale of available-for-sale securities | — | 8.6 | 0.6 | ||||||||
Sale of notes receivable | — | 8.3 | — | ||||||||
Investment in privately-held companies | (8.4 | ) | (0.6 | ) | — | ||||||
Acquisitions, net of cash acquired | (3.0 | ) | (21.1 | ) | (95.3 | ) | |||||
Net amounts received from (paid to) deferred compensation plan trust account | (4.4 | ) | 0.3 | 1.8 | |||||||
Other | 0.9 | 0.7 | (1.1 | ) | |||||||
Net cash used in investing activities | (130.1 | ) | (109.2 | ) | (210.9 | ) | |||||
Cash flows from financing activities: | |||||||||||
Repurchases of common stock | (294.5 | ) | (461.3 | ) | (422.0 | ) | |||||
Proceeds from issuance of common stock to employees | 72.1 | 60.6 | 91.0 | ||||||||
Excess tax benefits from share-based compensation | 1.0 | 3.9 | 12.6 | ||||||||
Employees' taxes withheld and paid for restricted stock and restricted stock units | (10.7 | ) | (11.0 | ) | (16.3 | ) | |||||
Cash received from Varex term facility | 200.0 | — | — | ||||||||
Cash and cash equivalents contributed to Varex Imaging Corporation | (42.6 | ) | — | — | |||||||
Borrowings under credit facility agreement | 231.0 | 83.0 | 145.0 | ||||||||
Repayments under credit facility agreement | (223.5 | ) | (133.0 | ) | (195.0 | ) | |||||
Net (repayments) borrowings under the credit facility agreements with maturities less than 90 days | (322.0 | ) | 217.1 | 108.6 | |||||||
Contingent consideration and hold back | (1.4 | ) | (5.6 | ) | (3.4 | ) | |||||
Other | (1.8 | ) | 0.5 | 2.8 | |||||||
Net cash used in financing activities | (392.4 | ) | (245.8 | ) | (276.7 | ) | |||||
Effects of exchange rate changes on cash and cash equivalents | (3.9 | ) | (3.3 | ) | 14.2 | ||||||
Net decrease in cash and cash equivalents | (127.3 | ) | (2.0 | ) | (3.8 | ) | |||||
Cash and cash equivalents at beginning of period* | 843.5 | 845.5 | 849.3 | ||||||||
Cash and cash equivalents at end of period* | $ | 716.2 | $ | 843.5 | $ | 845.5 | |||||
* Cash and cash equivalents includes $32.1 million and $20.5 million at September 30, 2016 and October 2, 2015, respectively classified as discontinued operations. See Note 2, "Discontinued Operations" for more information.
See accompanying notes to the consolidated financial statements.
72
VARIAN MEDICAL SYSTEMS, INC. AND SUBSIDIARIES
CONSOLIDATED STATEMENTS OF EQUITY
Common Stock | |||||||||||||||||||||||||||||||
(In millions) | Shares | Amount | Capital in Excess of Par Value | Retained Earnings | Accumulated Other Comprehensive Loss | Total Varian Stockholders' Equity | Noncontrolling Interests | Total Equity | |||||||||||||||||||||||
Balances at September 26, 2014 | 101.0 | $ | 101.0 | $ | 642.8 | $ | 931.2 | $ | (58.6 | ) | $ | 1,616.4 | $ | — | $ | 1,616.4 | |||||||||||||||
Net earnings | — | — | — | 411.5 | — | 411.5 | 0.5 | 412.0 | |||||||||||||||||||||||
Other comprehensive loss | — | — | — | — | (27.9 | ) | (27.9 | ) | — | (27.9 | ) | ||||||||||||||||||||
Issuance of common stock | 2.1 | 2.1 | 88.9 | — | — | 91.0 | — | 91.0 | |||||||||||||||||||||||
Tax benefits from exercises of share-based payment awards | — | — | 12.6 | — | — | 12.6 | — | 12.6 | |||||||||||||||||||||||
Shares repurchased for tax withholdings on vesting of restricted stock and restricted stock units | (0.2 | ) | (0.2 | ) | (16.1 | ) | — | — | (16.3 | ) | — | (16.3 | ) | ||||||||||||||||||
Share-based compensation expense | — | — | 46.3 | — | — | 46.3 | — | 46.3 | |||||||||||||||||||||||
Repurchases of common stock | (4.8 | ) | (4.8 | ) | (92.3 | ) | (324.9 | ) | — | (422.0 | ) | — | (422.0 | ) | |||||||||||||||||
Acquisition of MeVis Medical Solutions AG | — | — | — | — | — | — | 10.2 | 10.2 | |||||||||||||||||||||||
Capital contributions by Noncontrolling interests | — | — | — | — | — | — | 4.0 | 4.0 | |||||||||||||||||||||||
Balances at October 2, 2015 | 98.1 | 98.1 | 682.2 | 1,017.8 | (86.5 | ) | 1,711.6 | 14.7 | 1,726.3 | ||||||||||||||||||||||
Net earnings | — | — | — | 402.3 | — | 402.3 | (0.1 | ) | 402.2 | ||||||||||||||||||||||
Other comprehensive loss | — | — | — | — | (14.3 | ) | (14.3 | ) | — | (14.3 | ) | ||||||||||||||||||||
Issuance of common stock | 1.4 | 1.4 | 60.5 | — | — | 61.9 | — | 61.9 | |||||||||||||||||||||||
Tax benefits from exercises of share-based payment awards | — | — | 3.0 | — | — | 3.0 | — | 3.0 | |||||||||||||||||||||||
Shares repurchased for tax withholdings on vesting of restricted stock and restricted stock units | (0.1 | ) | (0.1 | ) | (10.9 | ) | — | — | (11.0 | ) | — | (11.0 | ) | ||||||||||||||||||
Share-based compensation expense | — | — | 48.3 | — | — | 48.3 | — | 48.3 | |||||||||||||||||||||||
Repurchases of common stock | (5.7 | ) | (5.7 | ) | (104.5 | ) | (351.1 | ) | — | (461.3 | ) | — | (461.3 | ) | |||||||||||||||||
Reclassification of noncontrolling interest in MeVis to redeemable noncontrolling interest | — | — | — | — | — | — | (10.4 | ) | (10.4 | ) | |||||||||||||||||||||
Other | — | — | — | — | — | — | (0.5 | ) | (0.5 | ) | |||||||||||||||||||||
Balances at September 30, 2016 | 93.7 | 93.7 | 678.6 | 1,069.0 | (100.8 | ) | 1,740.5 | 3.7 | 1,744.2 | ||||||||||||||||||||||
Net earnings | — | — | — | 249.6 | — | 249.6 | 0.6 | 250.2 | |||||||||||||||||||||||
Other comprehensive earnings | — | — | — | — | 32.0 | 32.0 | — | 32.0 | |||||||||||||||||||||||
Issuance of common stock | 1.4 | 1.4 | 69.3 | — | — | 70.7 | — | 70.7 | |||||||||||||||||||||||
Tax benefits from exercises of share-based payment awards | — | — | 0.7 | — | — | 0.7 | — | 0.7 | |||||||||||||||||||||||
Shares repurchased for tax withholdings on vesting of restricted stock and restricted stock units | (0.1 | ) | (0.1 | ) | (10.6 | ) | — | — | (10.7 | ) | — | (10.7 | ) | ||||||||||||||||||
Share-based compensation expense | — | — | 40.8 | — | — | 40.8 | — | 40.8 | |||||||||||||||||||||||
Repurchases of common stock | (3.3 | ) | (3.3 | ) | (62.7 | ) | (228.5 | ) | — | (294.5 | ) | — | (294.5 | ) | |||||||||||||||||
Distribution of Varex | — | — | — | (334.1 | ) | — | (334.1 | ) | — | (334.1 | ) | ||||||||||||||||||||
Balances at September 29, 2017 | 91.7 | $ | 91.7 | $ | 716.1 | $ | 756.0 | $ | (68.8 | ) | $ | 1,495.0 | $ | 4.3 | $ | 1,499.3 | |||||||||||||||
See accompanying notes to the consolidated financial statements.
73
VARIAN MEDICAL SYSTEMS, INC. AND SUBSIDIARIES
NOTES TO CONSOLIDATED FINANCIAL STATEMENTS
1. SUMMARY OF SIGNIFICANT ACCOUNTING POLICIES
Description of Business
Varian Medical Systems, Inc. (“VMS”) and subsidiaries (collectively, the “Company”) designs, manufactures, sells and services hardware and software products for treating cancer with radiotherapy, stereotactic radiosurgery, stereotactic body radiotherapy, and brachytherapy. Software solutions also include informatics software for information management, clinical knowledge exchange, patient care management, practice management and decision-making support for comprehensive cancer clinics, radiotherapy centers and medical oncology practices. The Company also develops, designs, manufactures, sells and services proton therapy products and systems for cancer treatment.
Distribution
On January 28, 2017 (the "Distribution Date"), the Company completed the separation and distribution (the "Distribution") of Varex Imaging Corporation ("Varex"), the Company's former Imaging Components business segment. On the Distribution Date, each of Varian's stockholder of record as of the close of business on January 20, 2017 (the "Record Date") received 0.4 of a share of Varex common stock for every one share of Varian common stock as of the Record Date. Varex is now an independent publicly traded company and is listed on The NASDAQ Global Select Market under the ticker “VREX.” Varian continues to trade on the New York Stock Exchange under the ticker “VAR.” See Note 2, "Discontinued Operations" for additional information.
Basis of Presentation
The consolidated financial statements have been prepared in conformity with accounting principles generally accepted in the United States ("GAAP").
The historical financial position and results of operations of the Imaging Components business and costs relating to the Distribution are reported in the consolidated financial statements as discontinued operations for all the periods presented. Information in the accompanying notes to the consolidated financial statements have been recast to reflect the effect of the Distribution. The Consolidated Statements of Comprehensive Earnings, Cash Flows and Statement of Equity have not been recast to reflect the effect of the Distribution.
Reclassifications
In fiscal year 2017, the Company's Varian Particle Therapy ("VPT") business met the criteria of a reportable operating segment and the Company now has two reportable operating segments: Oncology Systems and VPT. In addition, in conjunction with the Distribution of Varex, the Company changed its methodology for how corporate costs are allocated to its operating segments. See Note 17, "Segment Information" for further information on the change in reportable segments and the methodology of the allocation of corporate costs
In the first quarter of fiscal year 2017, the Company began presenting debt issuance costs as a direct deduction from the carrying amount of its debt on its Consolidated Balance Sheets as discussed further in "Accounting Pronouncement Recently Adopted" below.
All prior year amounts have been adjusted to conform to the current year's presentation.
Fiscal Year
The fiscal years of the Company as reported are the 52- or 53-week periods ending on the Friday nearest September 30. Fiscal year 2017 was the 52-week period that ended on September 29, 2017. Fiscal year 2016 was the 52-week period that ended on September 30, 2016. Fiscal year 2015 was the 53-week period that ended on October 2, 2015.
Spin-offs
On April 2, 1999, Varian Associates, Inc. reorganized into three separate publicly traded companies by spinning off, through a tax-free distribution, two of its businesses to stockholders (the “Spin-offs”). The Spin-offs resulted in the following three companies: 1) the Company (renamed from Varian Associates, Inc. to Varian Medical Systems, Inc. following the Spin-offs); 2)
74
Varian, Inc. (“VI”), which became a wholly owned subsidiary of Agilent Technologies Inc. in May 2010; and 3) Varian Semiconductor Equipment Associates, Inc. (“VSEA”), which became a wholly owned subsidiary of Applied Materials, Inc. in November 2011. The Spin-offs resulted in a non-cash dividend to stockholders.
In connection with the Spin-offs, the Company, VI and VSEA also entered into various agreements that set forth the principles to be applied in separating the companies and allocating certain related costs and specified portions of contingent liabilities. See Note 9, "Commitments and Contingencies" for additional information.
Principles of Consolidation
The consolidated financial statements include those of VMS and its wholly-owned and majority-owned or controlled subsidiaries. Intercompany balances, transactions and stock holdings have been eliminated in consolidation.
Consolidation of Variable Interest Entities
For entities in which the Company has variable interests, the Company focuses on identifying which entity has the power to direct the activities that most significantly impact the variable interest entity’s economic performance and which enterprise has the obligation to absorb losses or the right to receive benefits from the variable interest entity. If the Company is the primary beneficiary of a variable interest entity, the assets, liabilities, and results of operations of the variable interest entity will be included in the Company’s Consolidated Financial Statements. For fiscal years 2017, 2016 and 2015, the Company did not consolidate any variable interest entities because the Company determined that it was not the primary beneficiary.
Use of Estimates
The preparation of financial statements in conformity with GAAP requires management to make estimates and assumptions that affect the reported amounts of assets and liabilities and disclosure of contingent assets and liabilities at the date of the financial statements and the reported amounts of revenues and expenses during the reporting period. Actual results could differ from these estimates.
Foreign Currency Translation
The Company uses the U.S. dollar predominately as the functional currency of its foreign subsidiaries. For foreign subsidiaries where the U.S. dollar is the functional currency, gains and losses from remeasurement of foreign currency balances into U.S. dollars are included in the Consolidated Statements of Earnings. The aggregate net gains (losses) resulting from foreign currency transactions and remeasurement of foreign currency balances into U.S. dollars that were included in the Consolidated Statements of Earnings were $3.0 million, $1.6 million and $(2.0) million in fiscal years 2017, 2016 and 2015, respectively. For the foreign subsidiary where the local currency is the functional currency, translation adjustments of foreign currency financial statements into U.S. dollars are recorded to a separate component of accumulated other comprehensive loss. See Note 8, "Derivative Instruments and Hedging Activities" regarding the Company’s hedging activities and derivative instruments.
Cash and Cash Equivalents
The Company considers currency on hand, demand deposits, time deposits, and all highly liquid investments with an original maturity of three months or less at the date of purchase to be cash and cash equivalents. Cash and cash equivalents is held in various financial institutions in the United States and internationally.
Fair Value
Fair value is defined as the exchange price that would be received for an asset or paid to transfer a liability (an exit price) in the principal or most advantageous market for the asset or liability in an orderly transaction between market participants at the measurement date. There is a three-level fair value hierarchy that prioritizes the inputs used to measure fair value. This hierarchy requires entities to maximize the use of observable inputs and minimize the use of unobservable inputs. The three levels of inputs used to measure fair value are as follows:
Level 1 — Quoted prices in active markets for identical assets or liabilities.
Level 2 — Observable inputs other than quoted prices included in Level 1, such as quoted prices for similar assets and liabilities in active markets; quoted prices for identical or similar assets and liabilities in markets that are not active; or other inputs that are observable or can be corroborated by observable market data.
75
Level 3 — Unobservable inputs that are supported by little or no market activity and that are significant to the fair value of the assets or liabilities.
See Note 4, "Fair Value" for additional discussions.
Available-For-Sale Investments and Notes Receivable
The Company has investments in securities that are classified as available-for-sale investments, and which are reflected on the Consolidated Balance Sheets at fair value. Unrealized gains and losses on these investments are included as a separate component of accumulated other comprehensive loss, net of tax, on the Consolidated Balance Sheets. The Company classifies its available-for-sale securities as short-term or long-term based on the nature of the investment, its maturity date and its availability for use in current operations. The Company monitors its available-for-sale securities for possible other-than-temporary impairment when business events or changes in circumstances indicate that the carrying value of the investment may not be recoverable. The Company recorded $51.4 million of impairment charges in fiscal year 2017 and did not record an impairment of its available-for-sale investments for fiscal years 2016 and 2015. See Note 16, "VPT Loans and Securities" for more information about the impairment charge.
The Company advances notes to third parties, including its customers. The Company regularly assesses these notes for collectability by considering internal factors such as historical experience, credit quality, age of the note balances as well as external factors such as economic conditions that may affect the note holder's ability to pay.
Investments in Privately-Held Companies
Equity investments in privately-held companies in which the Company holds less than a 20% ownership interest and does not have the ability to exercise significant influence are accounted for under the cost-method of accounting and are included in other assets on the Consolidated Balance Sheets. See Note 3, “Balance Sheet Components.” The Company monitors these investments for impairment and makes appropriate reductions in carrying values if the Company determines that impairment charges are required based primarily on the financial condition and near-term prospects of these companies. At September 29, 2017, the Company did not have any equity investments in privately-held companies in which the Company holds at least a 20% ownership interest or in which it has the ability to exercise significant influence are accounted for under the equity method of accounting.
Concentration of Risk
Financial instruments that potentially expose the Company to concentrations of credit risk consist principally of cash, cash equivalents, available-for-sale investments, trade accounts receivable, notes receivable, and derivative financial instruments used in hedging activities. Cash and cash equivalents held with financial institutions may exceed the Federal Deposit Insurance Corporation insurance limits or similar limits in foreign jurisdictions. The Company has not experienced any losses on its deposits of cash and cash equivalents. With respect to its available-for-sale investments and notes receivable, the Company performs a periodic credit evaluation of various counterparties. In addition, the Company will be exposed to credit loss in the event of nonperformance by counterparties on the foreign currency forward contracts used in hedging activities. The Company transacts its foreign currency forward contracts with several large international and regional financial institutions and, therefore, does not consider the risk of nonperformance to be concentrated in any specific counterparty. The Company has not experienced any losses resulting from the failure of counterparty to meet its financial obligations under foreign currency forward contracts. Concentrations of credit risk with respect to trade accounts receivable are limited due to the large number of customers comprising the Company’s customer base and their geographic dispersion. The Company performs ongoing credit evaluations of its customers and, except for government tenders, group purchases and orders with a letter of credit, often requires its Oncology Systems and VPT customers to provide a down payment. The Company maintains an allowance for doubtful accounts based upon the expected collectability of all accounts receivable. See, Note 5, Receivables for additional information on allowance for doubtful accounts. No single customer represented 10% or more of the accounts receivable amount for any period presented. The Company obtains some of the components in its products from a limited group of suppliers or from a single-source supplier.
Inventories
Inventories are valued at the lower of cost or market (realizable value). Excess and obsolete inventories are determined primarily based on future demand forecasts and write-downs of excess and obsolete inventories are recorded as a component of
76
cost of revenues. Cost is computed using standard cost (which approximates actual cost) or actual cost on a first-in-first-out or average basis.
Property, Plant and Equipment
Property, plant and equipment are stated at cost, net of accumulated depreciation and amortization. Major improvements are capitalized, while repairs and maintenance are expensed as incurred. Internal and external costs incurred to acquire or create internal use software during the application development stage are capitalized in accordance with guidance on internal-use software. Internally developed software primarily includes enterprise-level business software that the Company customizes to meet its specific operational needs. Depreciation and amortization are computed using the straight-line method over the estimated useful lives of the assets. Land is not subject to depreciation, but land improvements are depreciated over fifteen years. Land leasehold rights and leasehold improvements are amortized over the lesser of their estimated useful lives or remaining term of the lease. Buildings are depreciated over twenty or thirty years. Machinery and equipment are depreciated over their estimated useful lives, which range from three to seven years. Assets subject to lease are amortized over the lesser of their estimated useful lives or remaining lease terms. When assets are retired or otherwise disposed of, the assets and related accumulated depreciation are removed from the accounts. Gains or losses resulting from retirements or disposals of property, plant and equipment are included in operating expenses.
Goodwill and Intangible Assets
Goodwill is recorded when the purchase price of an acquisition exceeds the fair value of the net identified tangible and intangible assets acquired. Purchased intangible assets are carried at cost, net of accumulated amortization. Intangible assets with finite lives are amortized primarily using the straight-line method over their estimated useful lives which generally range from two to ten years. In-process research and development (“IPR&D”) is initially capitalized at fair value as an intangible asset with an indefinite life and assessed for impairment thereafter. The impairment test for intangible assets with indefinite useful lives, if any, consists of a comparison of fair value to carrying value, with any excess of carrying value over fair value being recorded as an impairment loss. When an IPR&D project is completed, the IPR&D is reclassified as an amortizable purchased intangible asset and amortized over the asset’s estimated useful life.
Impairment of Long-lived Assets, Goodwill and Intangible Assets
The Company reviews long-lived assets and identifiable intangible assets with finite lives for impairment whenever events or changes in circumstances indicate that the carrying amount of these assets may not be recoverable. The Company assesses these assets for impairment based on their estimated undiscounted future cash flows. If the carrying value of the assets exceeds the estimated future undiscounted cash flows, the Company recognizes an impairment loss based on the excess of the carrying amount over the fair value of the assets. The Company did not recognize any impairment charges for long-lived assets and identifiable intangible assets in fiscal years 2017, 2016 and 2015.
The Company evaluates goodwill for impairment at least annually or whenever an event occurs or circumstances changes that would more likely than not reduce the fair value of a reporting unit below its carrying amount. If the Company determines that a quantitative analysis is necessary, the impairment test for goodwill is a two-step process. Step one consists of a comparison of the fair value of a reporting unit against its carrying amount, including the goodwill allocated to each reporting unit. The Company determines the fair value of its reporting units based on a combination of income and market approaches. The income approach is based on the present value of estimated future cash flows of the reporting units and the market approach is based on a market multiple calculated for each business unit based on market data of other companies engaged in similar business. If the carrying amount of the reporting unit is in excess of its fair value, step two requires the comparison of the implied fair value of the reporting unit’s goodwill against the carrying amount of the reporting unit’s goodwill. Any excess of the carrying value of the reporting unit’s goodwill over the implied fair value of the reporting unit’s goodwill is recorded as an impairment loss.
In fiscal years 2017, 2016 and 2015 the Company performed the annual goodwill impairment test for its two reporting units that carried goodwill: Oncology Systems and VPT. Based upon the most recent annual goodwill analysis performed during the fourth quarter of fiscal year 2017, the Company opted to evaluate Oncology Systems by using qualitative factors and VPT by using the step one approach and determined no further goodwill impairment analysis was required. The Company considered various factors in the qualitative assessment for Oncology Systems, including macroeconomic conditions, industry and market considerations, financial performance and other relevant events affecting the reporting unit. VPT's fair value was 21% in excess of its carrying value. The Company did not record any goodwill impairment charges in fiscal years 2017, 2016 and 2015.
77
Loss Contingencies
From time to time, the Company is a party to or otherwise involved in legal proceedings, claims and government inspections or investigations and other legal matters, both inside and outside the United States, arising in the ordinary course of its business or otherwise. The Company accrues amounts, to the extent they can be reasonably estimated, that it believes are adequate to address any liabilities related to legal proceedings and other loss contingencies that it believes will result in a probable loss.
Environmental remediation liabilities are recorded when environmental assessments and/or remediation efforts are probable, and the costs of these assessments or remediation efforts can be reasonably estimated.
Product Warranty
The Company warrants most of its products for a specific period of time, usually 12 months from installation, against material defects. The Company provides for the estimated future costs of warranty obligations in cost of revenues when the related revenues are recognized. The accrued warranty costs represent the best estimate at the time of sale of the total costs that the Company will incur to repair or replace product parts that fail while still under warranty. The amount of the accrued estimated warranty costs obligation for established products is primarily based on historical experience as to product failures adjusted for current information on repair costs. For new products, estimates include the historical experience of similar products, as well as reasonable allowance for warranty expenses associated with new products. On a quarterly basis, the Company reviews the accrued warranty costs and updates the historical warranty cost trends, if required.
Revenue Recognition
The Company’s revenues are derived primarily from the sale of hardware and software products, and services from the Company’s Oncology Systems and VPT businesses. The Company recognizes its revenues net of any value added or sales tax and net of sales discounts.
Many of the Company’s revenue arrangements consist of multiple deliverables of its software and non-software products, as well as related services. In Oncology Systems, the linear accelerators are often sold with hardware and software accessory products that enhance efficiency and enable delivery of advanced radiotherapy and radiosurgery treatments. Many of the Oncology Systems hardware and software accessory products are occasionally sold on a stand-alone basis. As discussed below, the majority of the Oncology Systems products are sold with installation obligations. Delivery of different elements in a revenue arrangement often span more than one reporting period. For example, a linear accelerator may be delivered in a reporting period but the related installation is completed in a later period. Service contracts are occasionally sold with Oncology Systems products, but most often sold separately closer to the end of the warranty period. Revenues related to service contracts usually starts after the expiration of the warranty period for non-software products or upon acceptance for software products.
The Company recognizes contract revenues under the percentage-of-completion method for equipment sold by VPT. See “Contracts for Customized Equipment” below for more details.
For a multiple element arrangement that includes software and non-software deliverables which includes service contracts, the Company first allocates revenues among the software and non-software deliverables on a relative selling price basis. The amounts allocated to the non-software products and software are accounted for as follows:
Non-software Products
Non-software products include hardware products, software components that function together with the hardware components to deliver the product’s essential functionality, as well as service contracts. Except as described below under “Service,” the Company recognizes revenues for non-software products when persuasive evidence of an arrangement exists, delivery has occurred or services have been rendered, the price is fixed or determinable and collectability is reasonably assured.
For multiple element revenue arrangements that involve non-software products, a delivered non-software element is considered as a separate unit of accounting when it has stand-alone value and there is no customer-negotiated refund or return rights for the delivered element. The allocation of revenue to all deliverables based on their relative selling prices is determined at the inception of the arrangement. The selling price for each deliverable is determined using vendor-specific objective evidence (“VSOE”) of selling price, if it exists; otherwise, third-party evidence of selling price (“TPE”). If neither VSOE nor TPE of selling price exists for a deliverable the Company uses the deliverable’s best estimated selling prices (“BESP”).
78
The Company’s non-software products have stand-alone value because they are sold separately. Product installation, which is a standard process and does not involve changes to the features or capabilities of the Company’s products, is considered as a separate unit of accounting. Installation of Oncology Systems non-software products involves the Company’s testing of each product at its factory prior to the product’s delivery to ensure that the product meets the Company’s published specifications. Once these tests establish that the specifications have been met, the product is then disassembled and shipped to the customer’s site as specified in the customer contract. Risk of loss is transferred to the customer typically at the time of shipment or delivery, depending upon the terms of the contract. At the customer’s site, the product is reassembled, installed and retested in accordance with the Company’s installation procedures to ensure and demonstrate compliance with the Company’s published specifications for that product.
Under the terms of the Company’s standard non-software sales contracts, “acceptance” of a non-software product with installation obligations is deemed to have occurred upon the earliest of (i) completion of product installation and testing in accordance with the Company’s standard installation procedures showing compliance with the Company’s published specifications for that product, (ii) receipt by the Company of an acceptance form executed by the customer acknowledging installation and compliance with the Company’s published specifications for that product, (iii) use by the customer of the product for any purpose after its delivery or (iv) six months after the delivery of the product to the customer by the Company. The contracts allow for cancellation only by mutual agreement, thus the customer does not have a unilateral right to return the delivered non-software product.
On occasion, the Company segregates certain hardware products at the request of the customer for a limited period of time at a third-party storage facility. Revenue is recognized for these "bill-and-hold" transactions which requires consideration of, among other things, whether the customer has made a written fixed commitment to purchase the product; the existence of a substantial business purpose for the arrangement; the bill-and-hold arrangement is at the request of the customer; the scheduled delivery date must be reasonable and consistent with the buyer's business purpose; title and risk of ownership must pass to the customer and no additional performance obligations exist by the Company, at the time of the bill-and-hold the product is complete and ready for shipment and the product has been segregated from the Company's inventory. In addition, the Company requires a substantial advance payment in order for the transaction to qualify as a bill-and-hold.
The Company establishes VSOE of selling price based on the price charged for a deliverable when sold separately. Occasionally for a deliverable not yet being sold separately, the Company may initially establish VSOE by management having the relevant authority. As discussed above, many products are occasionally sold in stand-alone arrangements and accordingly may have VSOE of selling price. Service contracts are sold separately through either original sale or subsequent renewal of annual contracts. The Company establishes TPE generally by evaluating the Company’s and competitors’ largely interchangeable competing products or services in stand-alone sales to similarly situated customers. The TPE for product installation is determined based on the estimated labor hours and the prevailing hourly rate charged for similar services, as well as the prices charged by outside vendors for installation of the Company’s products. For certain products for which the Company is not able to establish VSOE or TPE of selling prices, BESPs are used as the basis of their selling prices. The Company estimates selling prices following an established process that considers market conditions, including the product offerings and pricing strategies of competitors, as well as internal factors such as historical pricing practices and margin objectives. The establishment of product and service BESPs is controlled and reviewed by the appropriate level of management in all of the Company’s businesses.
The Company limits the amount of revenue recognized for delivered items to the amount that is not contingent upon the delivery of additional products or services. For Oncology Systems non-software products with installation obligations, the Company recognizes as revenues a portion of the product purchase price upon transfer of risk of loss and defers revenue recognition on the portion associated with product installation, provided that all other criteria for revenue recognition have been met. The portion deferred is the greater of the relative selling price of the installation services for such products or the amount of payment contractually linked to product installation services.
The Company does not have installation obligations for certain hardware Oncology Systems. For the products that do not include installation obligations, the Company recognizes revenues upon the transfer of risk of loss, which is either at the time of shipment or delivery, depending upon the terms of the contract, provided that all other revenue recognition criteria have been met.
Software Products
The Company recognizes revenues for software products in accordance with the software revenue recognition guidance. The Company recognizes license revenues when all of the following criteria have been met: persuasive evidence of an arrangement exists, the vendor’s fee is fixed or determinable, collection of the related receivable is probable, delivery of the product has
79
occurred and the Company has received from the customer an acceptance form acknowledging installation and substantial conformance with the Company’s specifications (as set forth in the user manual) for such product, or upon verification of installation when customer acceptance is not required to be received, or upon the expiration of an acceptance period, provided that all other criteria for revenue recognition have been met.
Revenues earned on software arrangements involving multiple elements are allocated to each element based on VSOE of fair value, which is based on the price charged when the same element is sold separately. In instances when evidence of VSOE of fair value of all undelivered elements exists, but evidence does not exist for one or more delivered elements, revenues are recognized using the residual method. Under the residual method, the fair value of the undelivered elements is deferred and the remaining portion of the arrangement fee is recognized as revenue. Revenue allocated to maintenance and support is recognized ratably over the maintenance term (typically one year).
For those software products that are not sold stand-alone or for which VSOE cannot be established or maintained, all software revenue under the contract will be deferred until the software product(s) that lack VSOE are all delivered. If the only undelivered software element that lacks VSOE is maintenance and support then the software and maintenance revenue would be recognized ratably over the term of the maintenance and support arrangement.
Installation of the Company’s software products may involve a certain amount of customer-specific implementation to enable the software product to function within the customer’s operating environment (i.e., with the customer’s information technology network and other hardware, with the customer’s data interfaces and with the customer’s administrative processes) and substantially in conformance with the Company’s specifications (as set forth in the user manual) for such product. With these software products, customers do not have full use of the software (i.e., functionality) until the software is installed as described above and functioning within the customer’s operating environment. Therefore, the Company recognizes 100% of such software revenues upon receipt from the customer of the Company’s acceptance form acknowledging installation and such substantial conformance, or upon verification of installation when the Company is not required to receive customer acceptance, or upon the expiration of an acceptance period, provided that all other criteria for revenue recognition have been met.
The Company does not have installation obligations for certain brachytherapy software products. For software products that do not include installation obligations, the Company recognizes revenues upon the transfer of risk of loss, which is either at the time of shipment or delivery, depending upon the shipping terms of the contract, provided that all other criteria for revenue recognition have been met.
Contracts for Customized Equipment
Revenues related to proton therapy systems and proton therapy system commissioning contracts are recognized in accordance with contract accounting. The Company recognizes contract revenues under the percentage-of-completion method which are based on contract costs incurred to date compared with total estimated contract costs. Changes in estimates of total contract revenue, total contract cost or the extent of progress towards completion are recognized in the period in which the changes in estimates are identified. Estimated losses on contracts are recognized in the period in which the loss is identified. In circumstances in which the final outcome of a contract cannot be precisely estimated but a loss on the contract is not expected, the Company recognizes revenues under the percentage-of-completion method based on a zero profit margin until more precise estimates can be made. If and when the Company can make more precise estimates, revenues and costs of revenues are adjusted in the same period.
Contracts accounted for in accordance with contract accounting are billable upon achievement of milestones specified in the contracts or upon customer acceptance. Costs incurred and revenues recognized under the percentage-of-completion method in excess of customer billings are included in accounts receivable and other assets on the Consolidated Balance Sheets. See Note 5, "Receivables". Customer billings in excess of costs incurred and revenue recognized under the percentage-of-completion method, which typically reflect initial down payments, are included in deferred revenues on the Consolidated Balance Sheets. Customer billings in excess of costs incurred and revenue recognized were $10.0 million as of September 29, 2017 and $13.7 million as of September 30, 2016.
Service
Service revenues include revenues from hardware and software service contracts, bundled support arrangements, paid services and trainings, and parts that are sold by the service department. Revenues allocated to service contracts are generally recognized ratably over the period of the related contracts. For proton therapy systems service contracts, revenues subject to certain penalty provisions are deferred until reliable estimates can be made or the related penalty provisions lapse. Revenues related to services performed on a time-and-materials basis are recognized when they are earned and billable.
80
Deferred Revenues
Deferred revenues include (i) the amount billed, billable or received applicable to non-software products for which installation and/or acceptance have not been completed (ii) the amount billed, billable or received applicable to shipment of software products but for which installation and/or final acceptance have not been completed and (iii) the amount billed, billable or received for service contracts for which the services have not been rendered. Deferred costs associated with deferred revenues are included in inventories on the Consolidated Balance Sheets. Except for government tenders, group purchases and orders with letters of credit, the Company typically requires its Oncology Systems and VPT customers to provide a down payment prior to transfer of risk of loss of ordered products. These payments are also recorded as deferred revenues on the Consolidated Balance Sheets.
Share-Based Compensation Expense
The Company measures and recognizes compensation expense for all share-based payment awards made to employees and directors, including stock options, employee stock purchases related to the Varian Medical Systems, Inc. Employee Stock Purchase Plan (the “Employee Stock Purchase Plan”), deferred stock units, restricted stock, restricted stock units and performance units based on their fair values.
Share-based compensation expense recognized in the Consolidated Statements of Earnings includes compensation expense for the share-based payment awards based on the grant date fair value estimated in accordance with the guidance on share-based compensation. The Company values VMS’s stock options granted and the option component of the shares of VMS common stock purchased under the Employee Stock Purchase Plan using the Black-Scholes option-pricing model, which was developed for use in estimating the fair value of traded options that have no vesting restrictions and are fully transferable. Share-based compensation expense for restricted common stock, restricted stock units and deferred stock units is measured at the stock’s fair value on the date of grant and is amortized over each award’s respective service period. The Company values performance units, which contain a market condition, using the Monte Carlo simulation model on the date of grant with assumptions that includes the historical volatility of shares of VMS common stock, as well as the shares of common stock of peer companies. In addition, the Company estimates the probability that certain performance conditions that affect the vesting of performance units will be achieved, and recognizes expense only for those awards expected to vest. Both the Black-Scholes option-pricing model and the Monte Carlo simulation model require the input of certain assumptions and changes in the assumptions can materially affect the fair value estimates of share-based payment awards.
Share-based compensation expense recognized is based on the value of the portion of share-based payment awards that is ultimately expected to vest. The Company attributes the value of share-based compensation to expense using the straight-line method. The Company considers only the direct tax impacts of share-based compensation awards when calculating the amount of tax windfalls or shortfalls.
Earnings per share
Basic net earnings per share is computed by dividing net earnings attributable to Varian by the weighted average number of shares of VMS common stock outstanding for the period. Diluted net earnings per share is computed by dividing net earnings attributable to Varian by the sum of the weighted average number of common shares outstanding and dilutive common shares under the treasury stock method. The Company excludes potentially dilutive common shares from the computation of diluted weighted average shares outstanding if the per share value, either the exercise price of the awards or the sum of (a) the exercise price of the awards and (b) the amount of the compensation cost attributed to future services and not yet recognized and (c) the amount of tax benefit or shortfall that would be recorded in additional paid-in capital when the award becomes deductible, is greater than the average market price of the shares, because the inclusion of the shares underlying these stock awards would be antidilutive to earnings per share.
Shipping and Handling Costs
Shipping and handling costs are included as a component of cost of revenues.
81
Research and Development
Research and development costs have been expensed as incurred. These costs primarily include employees’ compensation, consulting fees, material costs and research grants.
Software Development Costs
Costs for the development of new software products and substantial enhancements to existing software products are expensed as incurred until technological feasibility has been established, at which time any additional costs would be capitalized. No costs associated with the development of software have been capitalized as the Company believes its current software development process is essentially completed concurrent with the establishment of technological feasibility.
Comprehensive Earnings
Comprehensive earnings include all changes in equity (net assets) during a period from non-owner sources. Comprehensive earnings include currency translation adjustments, change in unrealized gain or loss on derivative instruments designated as cash flow hedges, net of taxes (see Note 8, "Derivative Instruments and Hedging Activities"), change in unrealized gain or loss on available for sale securities, net of taxes and adjustments to and amortization of unrecognized actuarial gain or loss, unrecognized transition obligation and unrecognized prior service cost of our defined benefit pension and post-retirement benefit plans (see Note 10, "Retirement Plans").
Taxes on Earnings
Taxes on earnings are based on pretax financial accounting income. Deferred tax assets and liabilities are recorded based on the difference between the financial statement and tax bases of assets and liabilities using enacted tax rates in effect for the year in which the differences are expected to reverse.
Accounting Pronouncement Recently Adopted
In March 2015, the Financial Accounting Standards Board ("FASB") issued an amendment to its accounting guidance related to the presentation of debt issuance costs. The amendment requires that debt issuance costs related to a recognized debt liability be presented in the balance sheet as a direct deduction from the carrying amount of that debt liability. The Company retrospectively adopted this amendment in the first quarter of fiscal year 2017, resulting in a $0.6 million change from prepaid expenses and other current assets to current maturities of long-term debt and a $0.6 million change from other assets to long-term debt as of September 30, 2016 on the Consolidated Balance Sheets.
Recent Accounting Standards or Updates Not Yet Effective
In August 2017, the FASB issued targeted improvements to accounting for hedging activities which amends and simplifies existing guidance in order to allow companies to more accurately present the economic effects of risk management activities in the financial statements. The guidance is effective for the Company beginning in the first quarter of fiscal year 2020 and early adoption is permitted. The Company has decided to early adopt this guidance in its first quarter of fiscal year 2018. The Company does not expect that the adoption of this guidance will have a material impact on its consolidated financial statements.
In May 2017, the FASB provided guidance about which changes to the terms or conditions of a share-based payment award require an entity to apply modification accounting. The guidance is effective for the Company beginning in the first quarter of fiscal year 2019. Early adoption is permitted. The Company does not expect that the adoption of this guidance will have a material impact on its consolidated financial statements.
In March 2017, the FASB amended its guidance on the accounting related to defined benefit plans and other post-retirement benefits. This amendment requires the service cost component of net periodic pension and post-retirement benefit cost be presented in the same line item as other employee compensation costs, while the other components be presented separately as non-operating income (expense). The amendment will be effective for the Company beginning in its first quarter of fiscal year 2019. Early adoption is permitted. The Company is evaluating the impact of adopting this amendment to its consolidated financial statements.
In January 2017, the FASB clarified its guidance to simplify the measurement of goodwill by eliminating the Step 2 impairment test. The new guidance requires companies to perform the goodwill impairment test by comparing the fair value of a reporting
82
unit with its carrying amount. The amendment will be effective for the Company beginning in its first quarter of fiscal year 2021. The amendment is required to be adopted prospectively. Early adoption is permitted.
In January 2017, the FASB clarified its guidance on the definition of a business in accounting for transactions when determining whether they represent acquisitions or disposals of assets or of a business. The amendment will be effective for the Company beginning in its first quarter of fiscal year 2019. The amendment is required to be adopted prospectively.
In November 2016, the FASB amended its guidance on the classification and presentation of restricted cash in the statement of cash flow. The amendment requires entities to include restricted cash and restricted cash equivalents in its cash and cash equivalents in the statement of cash flow. The amendment will be effective for the Company beginning in its first quarter of fiscal year 2019 with early adoption permitted. The amendment is required to be adopted retrospectively. The Company is evaluating the impact of adopting this amendment to its consolidated financial statements.
In October 2016, the FASB amended its guidance for tax accounting for intra-entity asset transfers. The amendment removes the prohibition against the immediate recognition of the current and deferred income tax effects of intra-entity transfers of assets other than inventory. The amendment will be effective for the Company beginning in its first quarter of fiscal year 2019. Early adoption is permitted. The amendment is required to be adopted on a modified retrospective basis. The Company is evaluating the impact of adopting this amendment to its consolidated financial statements.
In August 2016, the FASB issued an amendment to its accounting guidance related to the classification of certain cash receipts and cash payments. The amendment was issued to reduce the diversity in practice in how certain transactions are classified in the statement of cash flows. The amendment will be effective for the Company beginning in its first quarter of fiscal year 2019 with early adoption permitted. The amendment is required to be adopted retrospectively unless it is impracticable. The Company is evaluating the impact of adopting this amendment to its consolidated financial statements.
In June 2016, the FASB issued an amendment to its accounting guidance related to impairment of financial instruments. The amendment adds a new impairment model that is based on expected losses rather than incurred losses. The amendment will be effective for the Company beginning in its first quarter of fiscal year 2021 with early adoption permitted beginning in the first quarter of fiscal year 2020. The Company is evaluating the impact of adopting this amendment to its consolidated financial statements.
In March 2016, the FASB issued an amendment to its accounting guidance related to employee share-based payments. The amendment simplifies several aspects of the accounting for employee share-based payments including the accounting for income taxes, forfeitures, and statutory tax withholding requirements, as well as classification in the statement of cash flows. The amendment will be effective for the Company beginning in its first quarter of fiscal year 2018. The amendment is not expected to have a material impact to the Company's consolidated financial statements.
In February 2016, the FASB issued a new standard on accounting for leases. The new standard is intended to provide enhanced transparency and comparability by requiring lessees to record right-of-use assets and corresponding lease liabilities on the balance sheet. The new standard will continue to classify leases as either finance or operating, with classification affecting the pattern of expense recognition in the statement of earnings. The new standard is required to be adopted using a modified retrospective method to each prior reporting period presented with various optional practical expedients. The new standard will be effective for the Company beginning in its first quarter of fiscal year 2020 with early adoption permitted. The Company is evaluating the impact of adopting this new standard to its consolidated financial statements.
In January 2016, the FASB issued an amendment to its accounting guidance related to recognition and measurement of financial assets and financial liabilities. The amendment addresses certain aspects of recognition, measurement, presentation and disclosure of financial instruments. The amendment will be effective for the Company beginning in its first quarter of fiscal year 2019. The Company is evaluating the impact of adopting this amendment to its consolidated financial statements.
In July 2015, the FASB issued an amendment to its accounting guidance related to inventory measurement. The amendment requires inventory measured using first-in, first-out (FIFO) or average cost to be subsequently measured at the lower of cost and net realizable value, thereby simplifying the current guidance that requires an entity to measure inventory at the lower of cost or market. The amendment will be effective for the Company beginning in its first quarter of fiscal year 2018. The amendment is not expected to have a material impact to the Company’s consolidated financial statements.
In May 2014, the FASB issued a new revenue standard, which sets forth a single, comprehensive revenue recognition model for all contracts with customers to improve comparability. The new standard requires revenue recognition to depict the transfer of goods or services to customers in an amount that reflects the consideration to which the entity expects to be entitled in
83
exchange for those goods or services. In March 2016, the FASB amended the principal-versus-agent implementation guidance and illustrations in the new standard. In April 2016, the FASB amended the guidance on identifying performance obligations and the implementation guidance on licensing in the new standard. In May 2016, the FASB amended the guidance on collectability, noncash consideration, presentation of sales tax, and transition to the new standard. The new standard will be effective for the Company beginning in its first quarter of fiscal year 2019, with early adoption permitted, but not before the first quarter of fiscal year 2018. The new standard can be applied either retrospectively to each prior reporting period presented (i.e., full retrospective adoption) or with the cumulative effect of initially applying the update recognized at the date of the initial application (i.e., modified retrospective adoption) along with additional disclosures.
The Company will adopt the standard effective September 30, 2017 and will utilize the full retrospective method to restate each prior period presented. In preparation for adoption of the standard, the Company has implemented internal controls and key system functionalities to enable the preparation of financial information and has also reached conclusions on key accounting assessments related to the standard. Based on the Company's impact assessment, the areas with the greatest impact are in the Oncology segment and primarily due to the removal of the contingent revenue cap, the elimination of mandatory revenue deferral for software extended payment terms and the removal of the vendor-specific objective evidence requirement for the separation of bundled software products. This will result in a decrease of net revenues of approximately $29 million and $9 million for fiscal years 2017 and 2016, respectively. In fiscal year 2017, the net decrease in revenues was primarily due to vendor-specific objective evidence and to a lesser extent due to the contingent revenue cap partially offset by an increase in revenues due to extended payment terms. In fiscal year 2016, the net decrease in revenues was primarily due to the contingent revenue cap, partially offset by increases in revenue due to extended payment terms and vendor-specific objective evidence. As a result of the Company’s impact assessment, the Company identified additional performance obligations for training and certain elements of warranty that will be recognized as separate performance obligations; however, the Company is still finalizing the quantitative impact. The Company also identified that certain new performance obligations were previously accounted for as part of hardware products and will result in a shift of revenues from product to service. The Company will finalize its accounting assessment and quantitative impact of the adoption during the first quarter of fiscal year 2018.
2. DISCONTINUED OPERATIONS
On January 28, 2017, the Company completed the Distribution of Varex. In connection with the Distribution, Varian and Varex have entered into a separation and distribution agreement as well as various other agreements that will govern the relationships between the parties going forward, including a transition services agreement, a tax matters agreement, an employee matters agreement, an intellectual property matters agreement, a trademark license agreement and supply/distribution agreements. The separation and distribution agreement and other agreements related to the separation were entered into on January 27, 2017. Services under the transition services agreement are expected to continue for 60 days to 24 months following the Distribution Date, depending on the service provided.
On January 25, 2017, the Company entered into a term facility ("Varex Term Facility"), and on the same day drew down $203.0 million under the facility. In conjunction with the Distribution, the Company used $200.0 million of those proceeds to repay a portion of its outstanding 2013 Revolving Credit Facility. At the Distribution Date, the Company contributed $81.3 million in cash and cash equivalents to Varex as part of the distribution and transfer of certain legal entities. In fiscal year 2017, the Company received $38.7 million from Varex for excess cash and cash equivalents contributed at the Distribution Date. As of September 29, 2017, the change to the Company's stockholders' equity was primarily due to a $334.1 million reduction recorded in retained earnings as a result of the Distribution of Varex, which included assets and liabilities transferred to Varex on the distribution date, including $203.0 million debt outstanding under the Varex Term Facility. In December 2016, the Company entered into a master purchase and sale agreement ("MPSA") to acquire the Medical Imaging business of PerkinElmer, Inc. for approximately $276 million. In connection with the Distribution, the Company assigned the MPSA and all rights and obligations to Varex.
Following the Distribution, Varex retained a specified amount of cash that would enable Varex to pay the Company consideration for certain net assets outside of the United States that were required to be transferred to Varex but which did not occur on the Distribution Date due to not having received regulatory approvals for such transfers. Once those regulatory approvals are received, the Company will receive a cash payment from Varex in consideration for such net asset transfers. At September 29, 2017, the Company had $8.6 million in assets (net of liabilities) on its Consolidated Balance Sheet related to Varex net assets to be transferred. The Company expects the remainder of Varex's net assets will be transferred in fiscal year 2018. If the Company does not receive the necessary regulatory approvals during a specified time period, Varex will be required to transfer such cash amounts to Varian.
The financial results of Varex are presented as net earnings (loss) from discontinued operations on the Consolidated Statements of Earnings, and primarily include the financial results of the Company's former Imaging Components operating segment and
84
costs relating to the Distribution. Corporate costs previously allocated to the Company's Imaging Components operating segment are not included in discontinued operations. See Note 17, "Segment Information" for more information related to corporate allocated costs.
The following table summarizes the key components of net earnings (loss) from discontinued operations:
Fiscal Years | |||||||||||
(In millions) | 2017(1) | 2016 | 2015 | ||||||||
Revenues | $ | 194.0 | $ | 596.7 | $ | 608.4 | |||||
Cost of revenues | 117.3 | 348.3 | 357.9 | ||||||||
Gross margin | 76.7 | 248.4 | 250.5 | ||||||||
Operating expenses (2) | 76.1 | 132.6 | 97.2 | ||||||||
Operating earnings | 0.6 | 115.8 | 153.3 | ||||||||
Taxes on earnings | 7.4 | 38.4 | 52.7 | ||||||||
Net earnings (loss) from discontinued operations | (6.8 | ) | 77.4 | 100.6 | |||||||
Less: Net earnings from discontinued operations attributable to noncontrolling interests | 0.1 | 0.5 | 0.7 | ||||||||
Net earnings (loss) from discontinued operations attributable to Varian | $ | (6.9 | ) | $ | 76.9 | $ | 99.9 | ||||
(1) | Fiscal year 2017 net earnings (loss) from discontinued operations represents activity through the date of the Distribution. |
(2) | Operating expenses from discontinued operations included separation costs of $34.2 million and $16.9 million during fiscal years 2017 and 2016, respectively. Separation costs include expenses for transaction advisory services, consulting services, restructuring and other expenses. |
The following table summarizes the major classes of assets and liabilities of discontinued operations that were included in the Company's balance sheet:
(In millions) | September 29, 2017 | September 30, 2016 | |||||
Assets: | |||||||
Cash | $ | — | $ | 32.1 | |||
Accounts receivable, net | 8.1 | 122.2 | |||||
Inventories | 2.9 | 197.3 | |||||
Prepaid expenses and other current assets | 0.1 | 4.0 | |||||
Current assets of discontinued operations | 11.1 | 355.6 | |||||
Property, plant and equipment, net | — | 120.6 | |||||
Goodwill | — | 74.7 | |||||
Intangible assets | — | 20.6 | |||||
Deferred tax assets | — | 2.1 | |||||
Other assets | — | 54.9 | |||||
Total assets of discontinued operations | $ | 11.1 | $ | 628.5 | |||
Liabilities: | |||||||
Accounts payable | $ | 2.0 | $ | 41.9 | |||
Accrued liabilities | 0.5 | 29.1 | |||||
Deferred revenues | — | 12.0 | |||||
Current liabilities of discontinued operations | 2.5 | 83.0 | |||||
Other long-term liabilities | — | 4.2 | |||||
Total liabilities of discontinued operations | $ | 2.5 | $ | 87.2 | |||
Redeemable noncontrolling interests of discontinued operations | $ | — | $ | 10.3 | |||
85
The following table presents supplemental cash flow information of discontinued operations:
Fiscal Years | |||||||||||
(In millions) | 2017 | 2016 | 2015 | ||||||||
Operating activities: | |||||||||||
Share-based compensation expense | $ | 2.0 | $ | 6.1 | $ | 6.4 | |||||
Depreciation expense | 4.8 | 10.5 | 10.5 | ||||||||
Amortization expense | 1.8 | 5.5 | 2.7 | ||||||||
Investing activities: | |||||||||||
Purchases of property, plant & equipment | (6.4 | ) | (28.9 | ) | (34.3 | ) | |||||
Acquisition of business, net of cash acquired (1) | — | (1.2 | ) | (67.9 | ) | ||||||
Sale of available-for-sale securities | $ | — | $ | 8.6 | $ | — | |||||
(1) | Fiscal year 2015 includes the acquisition of MeVis and Claymount Investment B.V. |
3. BALANCE SHEET COMPONENTS
The following tables summarize the Company's available-for-sale securities:
September 29, 2017 | |||||||||||||||
(In millions) | Amortized Cost | Gross Unrealized Gains | Gross Unrealized Losses | Fair Value | |||||||||||
Original CPTC Loans | $ | 47.4 | $ | — | $ | — | $ | 47.4 | |||||||
DRTC Securities | 8.0 | — | — | 8.0 | |||||||||||
GPTC securities | 4.4 | — | — | 4.4 | |||||||||||
Total available-for-sale securities | $ | 59.8 | $ | — | $ | — | $ | 59.8 | |||||||
September 30, 2016 | |||||||||||||||
(In millions) | Amortized Cost | Gross Unrealized Gains | Gross Unrealized Losses | Fair Value | |||||||||||
Original CPTC Loans | $ | 95.3 | $ | — | $ | — | $ | 95.3 | |||||||
Total available-for-sale securities | $ | 95.3 | $ | — | $ | — | $ | 95.3 | |||||||
See Note 16, "VPT Loans and Securities" for more information on CPTC, Delray Radiation Therapy Center ("DRTC") and Georgia Proton Therapy Center ("GPTC") Securities.
As of September 29, 2017, the available-for-sale securities are recorded in other assets on the Consolidated Balance Sheets, because their maturity dates are greater than one year or the Company does not intend to collect or sell all or a portion of its loans or securities in the next twelve months. In the fiscal year 2017, the Company's Original CPTC Loans were determined to be other-than-temporarily impaired due to credit losses. As a result of this determination, the investment was written down to its estimated fair value of $47.4 million, resulting in impairment charges of $51.4 million. As of September 29, 2017, the Company believes recoverability of the entire amortized cost basis of all of its available-for-sale securities is probable. See Note 16, "VPT Loans and Securities" for further information on CPTC impairment charges during fiscal year 2017.
As of September 30, 2016, the available-for-sale securities are recorded in short-term investments because their maturity dates were less than one year.
86
The following table summarizes the Company's inventories:
September 29, | September 30, | |||||||
(In millions) | 2017 | 2016 | ||||||
Raw materials and parts | $ | 296.5 | $ | 257.9 | ||||
Work-in-process | 47.7 | 69.6 | ||||||
Finished goods | 95.5 | 114.9 | ||||||
Total inventories | $ | 439.7 | $ | 442.4 | ||||
The following table summarizes the Company's prepaid expenses and other current assets:
September 29, | September 30, | |||||||
(In millions) | 2017 | 2016 | ||||||
Prepaid income taxes | $ | 69.4 | $ | 41.3 | ||||
RPTC senior secured debt (1) | 25.4 | — | ||||||
Prepaid compensation | 11.6 | 9.9 | ||||||
Advance payments to suppliers | 11.1 | 16.9 | ||||||
Other current receivables | 32.5 | 29.2 | ||||||
Other prepaid expenses | 49.8 | 43.8 | ||||||
Total prepaid expenses and other current assets | $ | 199.8 | $ | 141.1 | ||||
(1) See Note 16, "VPT Loans and Securities" for more information on Rinecker Proton Therapy Center ("RPTC").
The following table summarizes the Company's property, plant and equipment, net:
September 29, | September 30, | |||||||
(In millions) | 2017 | 2016 | ||||||
Land and land improvements | $ | 44.2 | $ | 44.2 | ||||
Buildings and leasehold improvements | 220.4 | 211.7 | ||||||
Machinery and equipment | 375.9 | 358.3 | ||||||
Construction in progress | 14.6 | 15.9 | ||||||
655.1 | 630.1 | |||||||
Accumulated depreciation and amortization | (399.8 | ) | (371.5 | ) | ||||
Total property, plant and equipment, net | $ | 255.3 | $ | 258.6 | ||||
The following table summarizes the Company's other assets:
September 29, | September 30, | |||||||
(In millions) | 2017 | 2016 | ||||||
Long-term receivables, net | $ | 101.3 | $ | 113.8 | ||||
Deferred Compensation Plan ("DCP") assets | 72.7 | 61.1 | ||||||
Long-term available-for-sale securities | 59.8 | — | ||||||
Investments in privately-held companies | 27.1 | 18.7 | ||||||
Other | 39.9 | 33.4 | ||||||
Total other assets | $ | 300.8 | $ | 227.0 | ||||
87
The following table summarizes the Company's accrued liabilities:
September 29, | September 30, | |||||||
(In millions) | 2017 | 2016 | ||||||
Accrued compensation and benefits | $ | 109.7 | $ | 105.1 | ||||
DCP liabilities | 70.7 | 61.5 | ||||||
Product warranty | 42.9 | 44.2 | ||||||
Income taxes payable | 38.8 | 54.4 | ||||||
Other | 132.6 | 118.4 | ||||||
Total accrued liabilities | $ | 394.7 | $ | 383.6 | ||||
The following table summarizes the Company's other long-term liabilities:
September 29, | September 30, | |||||||
(In millions) | 2017 | 2016 | ||||||
Long-term income taxes payable | $ | 48.6 | $ | 46.2 | ||||
Deferred income taxes | 19.8 | 24.5 | ||||||
Other | 61.6 | 85.1 | ||||||
Total other long-term liabilities | $ | 130.0 | $ | 155.8 | ||||
4. FAIR VALUE
Assets/Liabilities Measured at Fair Value on a Recurring Basis
In the tables below, the Company has segregated all assets and liabilities that are measured at fair value on a recurring basis into the most appropriate level within the fair value hierarchy based on the inputs used to determine the fair value at the measurement date.
Fair Value Measurement Using | ||||||||||||||||
Type of Instruments | Quoted Prices in Active Markets for Identical Instruments (Level 1) | Significant Other Observable Inputs (Level 2) | Significant Unobservable Inputs (Level 3) | Total Balance | ||||||||||||
(In millions) | ||||||||||||||||
Assets at September 29, 2017: | ||||||||||||||||
Available-for-sale securities: | ||||||||||||||||
Original CPTC Loans | $ | — | $ | — | $ | 47.4 | $ | 47.4 | ||||||||
DRTC securities | — | 8.0 | — | 8.0 | ||||||||||||
GPTC securities | — | 4.4 | — | 4.4 | ||||||||||||
Total assets measured at fair value | $ | — | $ | 12.4 | $ | 47.4 | $ | 59.8 | ||||||||
Assets at September 30, 2016: | ||||||||||||||||
Available-for-sale securities: | ||||||||||||||||
Original CPTC Loans | $ | — | $ | — | $ | 95.3 | $ | 95.3 | ||||||||
Total assets measured at fair value | $ | — | $ | — | $ | 95.3 | $ | 95.3 | ||||||||
Liabilities at September 30, 2016: | ||||||||||||||||
Contingent consideration | $ | — | $ | — | $ | (1.3 | ) | $ | (1.3 | ) | ||||||
Total liabilities measured at fair value | $ | — | $ | — | $ | (1.3 | ) | $ | (1.3 | ) | ||||||
At September 29, 2017 and September 30, 2016, the fair value of the Company's derivative instruments was not material. The Company has elected to use the income approach to value its derivative instruments using standard valuation techniques and
88
Level 2 inputs, such as currency spot rates, forward points and credit default swap spreads. The Company’s derivative instruments are generally short-term in nature, typically one month to thirteen months in duration.
The Company's Level 2 available-for-sale securities consist of bonds for both DRTC and GPTC. The observable inputs for these securities are comparable bond issues, broker/dealer quotations for the same or similar investments in active markets and other observable inputs such as yields, credit risks, default rates, and volatility. As of September 29, 2017, the carrying amount of the Level 2 available-for-sale securities approximated its fair value. See Note 16, "VPT Loans and Securities" for more information on the DRTC and GPTC bonds.
The fair value of the Company’s Level 3 available-for-sale securities is based on the income approach by using the discounted cash flow model with key assumptions that include discount rates corresponding to the terms and risks associated with the loans as well as underlying cash flow assumptions. If the estimated discount rates used were to increase or decrease, the fair value of the debt securities would decrease or increase, respectively. However, the Company does not increase the fair value of the Original CPTC Loans above their par values as ORIX Capital Markets, LLC (“ORIX”), the loan agent, has the option to purchase these loans from the Company under the original terms and conditions at par value. In fiscal year 2017, the Original CPTC Loans were determined to be other-than-temporarily impaired as determined by the discounted cash flow model using a single best estimate methodology and were written down to their estimated fair value, which resulted in impairment charges of $51.4 million, including $0.2 million of other loan related charges, recorded in the Consolidated Statements of Earnings. See Note 16, "VPT Loans and Securities" for more information on the Original CPTC Loans.
The Company measures the fair value of its Level 3 contingent consideration liabilities based on the income approach by using a discounted cash flow model with key assumptions that include estimated sales units or revenues of the acquired business or completion of certain milestone targets during the earn-out period, volatility, and estimated discount rates corresponding to the periods of expected payments. If the estimated sales units, revenues or probability of completing certain milestones were to increase or decrease during the respective earn-out period, the fair value of the contingent consideration would increase or decrease, respectively. If the estimated discount rates were to increase or decrease, the fair value of contingent consideration would decrease or increase, respectively. Changes in volatility may result in an increase or decrease in the fair value of contingent consideration. At September 30, 2016, the Company's contingent consideration was included in accrued liabilities on the Consolidated Balance Sheets.
The following table presents the reconciliation for all assets and liabilities measured and recorded at fair value on a recurring basis using significant unobservable inputs (Level 3):
(In millions) | Available-for-sale Securities | Contingent Consideration | ||||||
Balance at October 2, 2015 | $ | 83.9 | $ | (4.1 | ) | |||
Additions (1) | 11.4 | — | ||||||
Settlements (2) | — | 3.5 | ||||||
Change in fair value recognized in earnings | — | (0.7 | ) | |||||
Balance at September 30, 2016 | 95.3 | (1.3 | ) | |||||
Additions (1) | 3.3 | — | ||||||
Settlements (2) | — | 1.6 | ||||||
Change in fair value recognized in earnings | (51.2 | ) | (0.3 | ) | ||||
Balance at September 29, 2017 | $ | 47.4 | $ | — | ||||
(1) | Amounts reported represent additional investments and accrued interest. |
(2) | Amounts reported under Contingent Consideration represent cash payments to settle contingent consideration liabilities. |
There were no transfers of assets or liabilities between fair value measurement levels during fiscal years 2017, 2016 and 2015. Transfers between fair value measurement levels are recognized at the end of the reporting period.
89
Fair Value of Other Financial Instruments
The fair values of certain of the Company’s financial instruments, including bank deposits included in cash equivalents, accounts receivable, net of allowance for doubtful accounts, short-term notes receivable, senior secured debt, accounts payable, and short-term borrowings approximate their carrying amounts due to their short maturities.
As of September 30, 2016, the fair value of current maturities of the long-term debt approximated its carrying value of $50.0 million due to its short-term maturity. At September 30, 2016, the fair value of the long-term debt approximated its carrying value of $287.5 million because it is carried at a market observable interest rate that resets periodically and is categorized as Level 2 in the fair value hierarchy.
The fair value of the outstanding long-term notes receivable approximated their carrying value of $86.7 million and $59.2 million at September 29, 2017 and September 30, 2016, respectively, because it is based on terms of recent comparable transactions and is categorized as Level 3 in the fair value hierarchy. The fair value is based on the income approach by using the discounted cash flow model with key assumptions that include discount rates corresponding to the terms and risks as well as underlying cash flow assumptions.
5. RECEIVABLES
The following table summarizes the Company's accounts receivable and notes receivable as of September 29, 2017 and September 30, 2016:
September 29, | September 30, | ||||||
(In millions) | 2017 | 2016 | |||||
Accounts receivable, gross | $ | 901.2 | $ | 848.4 | |||
Allowance for doubtful accounts | (63.1 | ) | (24.2 | ) | |||
Accounts receivable, net | $ | 838.1 | $ | 824.2 | |||
Short-term | $ | 823.5 | $ | 769.6 | |||
Long-term (1) | $ | 14.6 | $ | 54.6 | |||
Notes receivable | $ | 91.7 | $ | 65.0 | |||
Short-term (2) | $ | 5.0 | $ | 5.8 | |||
Long-term (1) | $ | 86.7 | $ | 59.2 | |||
(1) Included in other assets on the Company's Consolidated Balance Sheets.
(2) Included in prepaid expenses and other current assets on the Company's Consolidated Balance Sheets.
A financing receivable represents a financing arrangement with a contractual right to receive money, on demand or on fixed or determinable dates, and that is recognized as an asset on the Company’s Consolidated Balance Sheets. The Company’s financing receivables consist of accounts receivable with contractual maturities of more than one year and notes receivable. A small portion of the Company's financing accounts receivables are included in short-term accounts receivable.
As of September 29, 2017, accounts receivable, net, included unbilled receivables of $124.4 million, which includes $17.2 million of long-term unbilled receivables that has a full allowance for doubtful accounts. As of September 30, 2016, accounts receivable, net, included unbilled receivables of $111.6 million, which includes $37.9 million of long-term unbilled receivables.
As of September 29, 2017, the allowance for doubtful accounts includes $45.9 million related to short-term accounts receivable and $17.2 million related to long-term unbilled accounts receivable. As of September 30, 2016, the allowance for doubtful accounts was entirely related to the short-term accounts receivable. In the first quarter of fiscal year 2017, the Company recorded an allowance for doubtful accounts of $34.2 million from CPTC due to credit-related issues.
See Note 16, "VPT Loans and Securities" for more information on the Company's short-term and long-term notes receivable balances.
90
6. GOODWILL AND INTANGIBLE ASSETS
The following table reflects the activity of goodwill by reportable operating segment:
(In millions) | Oncology Systems | Varian Particle Therapy | Total | |||||||||
Balance at October 2, 2015 | $ | 158.8 | $ | 50.0 | $ | 208.8 | ||||||
Business combinations | 11.4 | — | 11.4 | |||||||||
Foreign currency translation adjustments | — | (0.2 | ) | (0.2 | ) | |||||||
Balance at September 30, 2016 | 170.2 | 49.8 | 220.0 | |||||||||
Foreign currency translation adjustments | — | 2.6 | 2.6 | |||||||||
Balance at September 29, 2017 | $ | 170.2 | $ | 52.4 | $ | 222.6 | ||||||
The following table reflects the gross carrying amount and accumulated amortization of the Company’s intangible assets:
September 29, 2017 | September 30, 2016 | |||||||||||||||||||||||
(In millions) | Gross Carrying Amount | Accumulated Amortization | Net Carrying Amount | Gross Carrying Amount | Accumulated Amortization | Net Carrying Amount | ||||||||||||||||||
Technologies and patents | $ | 102.0 | $ | (60.9 | ) | $ | 41.1 | $ | 99.6 | $ | (50.2 | ) | $ | 49.4 | ||||||||||
Customer contracts and supplier relationship | 33.9 | (14.3 | ) | 19.6 | 32.3 | (10.8 | ) | 21.5 | ||||||||||||||||
Other | 5.5 | (3.4 | ) | 2.1 | 5.6 | (1.2 | ) | 4.4 | ||||||||||||||||
Total intangible with finite lives | 141.4 | (78.6 | ) | 62.8 | 137.5 | (62.2 | ) | 75.3 | ||||||||||||||||
In-process research and development with indefinite lives | 8.8 | — | 8.8 | 8.8 | — | 8.8 | ||||||||||||||||||
Total intangible assets | $ | 150.2 | $ | (78.6 | ) | $ | 71.6 | $ | 146.3 | $ | (62.2 | ) | $ | 84.1 | ||||||||||
Amortization expense for intangible assets was $16.6 million, $10.1 million and $5.7 million for fiscal years 2017, 2016 and 2015, respectively.
As of September 29, 2017, the Company estimates that its remaining amortization expense for intangible assets with finite lives will be as follows (in millions):
Fiscal Years | Total | |||
2018 | $ | 17.4 | ||
2019 | 13.0 | |||
2020 | 9.3 | |||
2021 | 7.2 | |||
2022 | 6.0 | |||
Thereafter | 9.9 | |||
Total remaining amortization | $ | 62.8 | ||
91
7. BORROWINGS
The following table summarizes the Company's short-term and long-term debt:
September 29, 2017 | September 30, 2016 | ||||||||||||
(In millions, except for percentages) | Amount | Weighted-Average Interest Rate | Amount | Weighted-Average Interest Rate | |||||||||
Short-term debt: | |||||||||||||
2017 Revolving Credit Facility | $ | 350.0 | 2.36 | % | $ | — | — | % | |||||
Current portion of 2013 Term Loan Facility | — | — | % | 50.0 | 1.65 | % | |||||||
2013 Revolving Credit Facility | — | — | % | 300.0 | 1.91 | % | |||||||
Sumitomo Credit Facility | — | — | % | 29.6 | 0.53 | % | |||||||
Debt issuance costs | — | (0.6 | ) | ||||||||||
Total short-term debt | $ | 350.0 | $ | 379.0 | |||||||||
Long-term debt: | |||||||||||||
2013 Term Loan Facility | $ | — | — | % | $ | 287.5 | 1.65 | % | |||||
Debt issuance costs | — | (0.6 | ) | ||||||||||
Total long-term debt | $ | — | $ | 286.9 | |||||||||
On September 1, 2017, the Company terminated its credit facility entered into on August 27, 2013 ("Prior Credit Facility") by repaying $363.8 million, which represented $300.0 million of its 2013 Term Loan Facility, $63.0 million of its 2013 Revolving Credit Facility, and $0.8 million in accrued interest and fees. Our Prior Credit Facility was originally due in August 2018 and had a prepayment option, therefore the Company did not incur any prepayment penalty. The Company entered into an agreement, dated September 1, 2017, ("Credit Agreement") with certain lenders and Bank of America, N.A. (“BofA”) as administrative agent ("Debt Lenders"). The Credit Agreement provides for a five-year revolving credit facility (the "2017 Revolving Credit Facility") in an aggregate principal amount of up to $600.0 million. The 2017 Revolving Credit Facility also includes a $50 million sub-facility for the issuance of letters of credit and permits swing line loans of up to $25 million. The Company may increase the aggregate commitments under the 2017 Revolving Credit Facility by up to $100 million, plus an amount based on the Company's consolidated leverage ratio on a pro forma basis, subject to certain conditions being met, including lender approval. The Credit Agreement will expire in September 2022. The 2017 Revolving Credit Facility can be prepaid without any premium or penalty. The proceeds of the 2017 Credit Facility may be used for working capital, capital expenditures, Company share repurchases, acquisitions and other corporate purposes, as well as to satisfy the outstanding obligation under the prior credit facility. On September 1, 2017, the Company borrowed $368.0 million under the 2017 Revolving Credit Facility, which was used to pay down the 2013 Term Loan Facility and 2013 Revolving Credit Facility.
The Company determined that the Prior Credit Facility and the 2017 Revolving Credit Facility are not considered substantially different therefore the Company accounted for this transaction as a debt modification. Accordingly, the $0.6 million unamortized debt issuance cost from the Prior Credit Facility will be amortized over the five-year term of the 2017 Revolving Credit Facility. The Company also incurred $1.8 million debt issuance costs for its 2017 Revolving Credit Facility, which will be amortized over the five-year term. Debt issuance costs are recorded in prepaid expenses and other current assets and other assets on the Consolidated Balance Sheets.
Borrowings under the 2017 Revolving Credit Facility accrue interest at either (i) based on the Eurodollar Rate plus a margin of 1.125% to 1.875% based on a leverage ratio involving funded indebtedness and EBITDA, or (ii) based upon a base rate of (a) the federal funds rate plus 0.50%, (b) BofA’s announced prime rate, or (c) the Eurodollar Rate plus 1.00%, whichever is highest, plus a margin of 0.125% to 0.875% based on the same leverage ratio, depending upon instructions from the Company. Borrowings under the 2017 Revolving Credit Facility have a contract repayment date of twelve months, or less, and a final maturity of five years if based on the Eurodollar Rate and all overnight borrowings on the base rate would also have a final maturity of five years.
The Company must pay a commitment fee on the unused portion of the 2017 Revolving Credit Facility at a rate from 0.125% to 0.25% based on a leverage ratio. The Company may prepay, reduce or terminate the commitments without penalty. Swing line loans under the 2017 Credit Facility will bear interest at the base rate plus the then applicable margin for base rate loans. The Company paid commitment fees of $0.7 million, $0.3 million, and $0.6 million in fiscal years 2017, 2016 and 2015, respectively, related to its borrowings.
92
The Credit Agreement provides that certain material domestic subsidiaries must guaranty the 2017 Revolving Credit Facility, subject to certain limitations on the amount secured. As of September 29, 2017, no subsidiary guaranties were required to be executed under the Credit Agreement.
The Credit Agreement contains provisions that limit the Company's ability to, among other things, incur future indebtedness, contingent obligations or liens, guarantee indebtedness, make certain investments and capital expenditures, sell stock or assets and pay dividends, and consummate certain mergers or acquisitions.
The Credit Agreement contains affirmative and negative covenants applicable to the Company and its subsidiaries that are typical for credit facilities of this type, and that are subject to materiality and other qualifications, carve-outs, baskets and exceptions. The Company has also agreed to maintain certain financial covenants including (i) a maximum consolidated leverage ratio, involving funded indebtedness and EBITDA and (ii) a minimum consolidated interest coverage ratio. The Company was in compliance with all financial covenants under the Credit Agreement for all periods within these consolidated financial statements.
VMS’s Japanese subsidiary (“VMS KK”) has an unsecured uncommitted credit agreement with Sumitomo that enables VMS KK to borrow and have outstanding at any given time a maximum of 3.0 billion Japanese Yen (the “Sumitomo Credit Facility”). In February 2017, the Sumitomo Credit Facility was extended and will expire in February 2018. Borrowings under the Sumitomo Credit Facility accrue interest based on the basic loan rate announced by the Bank of Japan plus a margin of 0.5%.
Total Company interest paid on borrowings was $9.0 million, $10.8 million and $7.1 million in fiscal years 2017, 2016 and 2015, respectively.
8. DERIVATIVE INSTRUMENTS AND HEDGING ACTIVITIES
The Company measures all derivatives at fair value on the Consolidated Balance Sheets. The accounting for gains or losses resulting from changes in the fair value of those derivatives depends upon the use of the derivative and whether it qualifies for hedge accounting.
As of September 29, 2017 and September 30, 2016, the Company did not have any outstanding derivatives designated as hedging instruments. As of September 29, 2017 and September 30, 2016, the fair value of the Company's derivatives not designated as hedging instruments were not material. See Note 4, "Fair Value" for the valuation of the Company’s derivative instruments. Also, see Note 1, "Summary of Significant Accounting Policies" for the credit risk associated with the Company’s derivative instruments.
Offsetting of Derivatives
The Company presents its derivative assets and derivative liabilities on a gross basis on the Consolidated Balance Sheets. However, under agreements containing provisions on netting with certain counterparties of foreign exchange contracts, subject to applicable requirements, the Company is allowed to net-settle transactions on the same date in the same currency, with a single net amount payable by one party to the other. As of September 29, 2017 and September 30, 2016, there were no potential effects of rights of setoff associated with derivative instruments. The Company is neither required to pledge nor entitled to receive cash collateral related to these derivative transactions.
Cash Flow Hedging Activities
The Company has many transactions denominated in foreign currencies and addresses certain of those financial exposures through a risk management program that includes the use of derivative financial instruments. The Company sells products throughout the world, often in the currency of the customer’s country, and may hedge certain of the larger foreign currency transactions when they are either not denominated in the relevant subsidiary’s functional currency or the U.S. Dollar. These foreign currency sales transactions are hedged using foreign currency forward contracts. The Company may use other derivative instruments in the future. The Company does not enter into foreign currency forward contracts for speculative or trading purposes. Foreign currency forward contracts are entered into several times a quarter and range from one to thirteen months in maturity.
The hedges of foreign currency denominated forecasted revenues are designated and accounted for as cash flow hedges. The designated cash flow hedges de-designate when the anticipated revenues associated with the transactions are recognized and the effective portion in accumulated other comprehensive loss on the Consolidated Balance Sheets is reclassified to revenues in
93
the Consolidated Statements of Earnings. Subsequent changes in fair value of the derivative instrument are recorded in selling, general and administrative expenses in the Consolidated Statements of Earnings to offset changes in fair value of the resulting non-functional currency receivables. For derivative instruments that are designated and qualified as cash flow hedges, the Company formally documents for each derivative instrument at the hedge’s inception, the relationship between the hedging instrument (foreign currency forward contract) and hedged item (forecasted foreign currency revenues), the nature of the risk being hedged and its risk management objective and strategy for undertaking the hedge. The Company records the effective portion of the gain or loss on the derivative instruments that are designated and qualified as cash flow hedges in accumulated other comprehensive loss on the Consolidated Balance Sheets and reclassifies these amounts into revenues in the Consolidated Statements of Earnings in the period in which the hedged transaction is recognized in earnings. The Company assesses hedge effectiveness both at the onset of the hedge and on an ongoing basis using regression analysis. The Company measures hedge ineffectiveness by comparing the cumulative change in the fair value of the effective component of the hedge contract with the cumulative change in the fair value of the hedged item. The Company recognizes any over performance of the derivative as ineffectiveness in revenues, and time value amounts excluded from the assessment of effectiveness in cost of revenues in the Consolidated Statements of Earnings. During fiscal years 2017, 2016 and 2015, the Company did not discontinue any cash flow hedges. At the inception of the hedge relationship and quarterly thereafter, the Company assesses whether the likelihood of meeting the forecasted cash flow is highly probable. As of September 29, 2017 and September 30, 2016, the Company did not have any foreign currency forward contracts designated as cash flow hedges.
The following table presents the amounts, before tax, recognized in accumulated other comprehensive loss on the Consolidated Balance Sheets and in the Consolidated Statements of Earnings that are related to the effective portion of the foreign currency forward contracts designated as cash flow hedges:
Gain (Loss) Recognized in Other Comprehensive Income (Effective Portion) | Location of Gain (Loss) Reclassified from Accumulated Other Comprehensive Income into Net Earnings (Effective Portion) | Gain (Loss) Reclassified from Accumulated Other Comprehensive Income into Net Earnings (Effective Portion) | ||||||||||||||||||||||||
Fiscal Years | Fiscal Years | |||||||||||||||||||||||||
(In millions) | 2017 | 2016 | 2015 | 2017 | 2016 | 2015 | ||||||||||||||||||||
Foreign currency forward contracts | $ | — | $ | (1.0 | ) | $ | 2.2 | Revenues | $ | — | $ | (1.0 | ) | $ | 3.8 | |||||||||||
The portion of cash flow hedges gain or loss excluded from the assessment of effectiveness and the ineffective portion of the cash flow hedges were not material in fiscal years 2017, 2016 and 2015.
Balance Sheet Hedging Activities
The Company also hedges balance sheet exposures from its various subsidiaries and business units where the U.S. Dollar is the functional currency. The Company enters into foreign currency forward contracts to minimize the short-term impact of foreign currency fluctuations on monetary assets and liabilities denominated in currencies other than the U.S. Dollar functional currency. The foreign currency forward contracts are short term in nature, typically with a maturity of approximately one month, and are based on the net forecasted balance sheet exposure. For derivative instruments not designated as hedging instruments, changes in their fair values are recognized in selling, general and administrative expenses in the Consolidated Statements of Earnings. Changes in the values of these hedging instruments are offset by changes in the values of foreign-currency-denominated assets and liabilities. Variations from the forecasted foreign currency assets or liabilities, coupled with a significant currency rate movement, may result in a material gain or loss if the hedges are not effectively offsetting the change in value of the foreign currency asset or liability. Other than foreign exchange hedging activities, the Company has no other free-standing or embedded derivative instruments.
94
The Company had the following outstanding foreign currency forward contracts:
September 29, 2017 | ||||||||
(In millions) | Notional Value Sold | Notional Value Purchased | ||||||
Australian Dollar | $ | 29.1 | $ | — | ||||
Brazilian Real | 5.2 | — | ||||||
British Pound | 14.8 | 0.1 | ||||||
Canadian Dollar | 8.2 | — | ||||||
Danish Krone | — | 0.3 | ||||||
Euro | 247.2 | 6.1 | ||||||
Hungarian Forint | 3.1 | — | ||||||
Indian Rupee | 12.7 | — | ||||||
Japanese Yen | 47.1 | — | ||||||
Polish Zloty | 4.6 | — | ||||||
Swedish Krona | 0.6 | — | ||||||
Swiss Franc | — | 59.8 | ||||||
Thai Baht | 4.8 | — | ||||||
Totals | $ | 377.4 | $ | 66.3 | ||||
The following table presents the gains (losses) recognized in the Company's Consolidated Statements of Earnings related to the foreign currency forward contracts that are not designated as hedging instruments.
Location of Gain (Loss) Recognized in Income on Derivative | Amount of Gain (Loss) Recognized in Net Earnings on Derivative | |||||||||||
Fiscal Years | ||||||||||||
(In millions) | 2017 | 2016 | 2015 | |||||||||
Selling, general and administrative expenses | $ | (10.9 | ) | $ | (5.3 | ) | $ | 27.6 | ||||
The gains (losses) on these derivative instruments were significantly offset by the gains (losses) resulting from the re-measurement of monetary assets and liabilities denominated in currencies other than the U.S. Dollar functional currency.
Contingent Features
Certain of the Company’s derivative instruments are subject to master agreements which contain provisions that require the Company, in the event of a default, to settle the outstanding contracts in net liability positions by making settlement payments in cash or by setting off amounts owed to the counterparty against any credit support or collateral held by the counterparty. As of September 29, 2017 and September 30, 2016, the Company did not have any outstanding derivative instruments with credit-risk-related contingent features that were in a net liability position.
9. COMMITMENTS AND CONTINGENCIES
Indemnification Agreements
In conjunction with the sale of the Company’s products in the ordinary course of business, the Company provides standard indemnification of business partners and customers for losses suffered or incurred for property damages, death and injury and for patent, copyright or any other intellectual property infringement claims by any third parties with respect to its products. The terms of these indemnification arrangements are generally perpetual. Except for losses related to property damages, the maximum potential amount of future payments the Company could be required to make under these arrangements is unlimited. As of September 29, 2017, the Company had not incurred any significant costs to defend lawsuits or settle claims related to these indemnification arrangements. As a result, the Company believes the estimated fair value of these arrangements is minimal.
VMS has entered into indemnification agreements with its directors and officers and certain of its employees that serve as officers or directors of its foreign subsidiaries that may require VMS to indemnify its directors and officers and those certain employees against liabilities that may arise by reason of their status or service as directors or officers, and to advance their expenses incurred as a result of any legal proceeding against them as to which they could be indemnified.
95
Product Warranty
The following table reflects the changes in the Company’s accrued product warranty:
Fiscal Years | ||||||||
(In millions) | 2017 | 2016 | ||||||
Accrued product warranty, at beginning of period | $ | 48.0 | $ | 39.8 | ||||
Charged to cost of revenues | 46.9 | 46.4 | ||||||
Actual product warranty expenditures | (47.7 | ) | (38.2 | ) | ||||
Accrued product warranty, at end of period | $ | 47.2 | $ | 48.0 | ||||
The long term portion of accrued product warranty costs were $4.3 million and $3.8 million at September 29, 2017 and September 30, 2016, respectively and were included in other long-term liabilities on the Consolidated Balance Sheets.
Lease Commitments
At September 29, 2017, the Company was committed to minimum rentals under non-cancelable operating leases (including rent escalation clauses) for fiscal years 2018 through 2022 and thereafter, as follows (in millions): $24.9, $20.3, $17.0, $13.9, $11.7 and $19.1, respectively. Rental expenses were $26.4 million, $24.3 million and $27.0 million for fiscal years 2017, 2016 and 2015, respectively.
Other Commitments
See Note 16, "VPT Loans and Securities" for additional information about the Company's commitments for funding development and construction of various proton therapy centers.
Contingencies
Environmental Remediation Liabilities
The Company’s operations and facilities, past and present, are subject to environmental laws, including laws that regulate the handling, storage, transport and disposal of hazardous substances. Certain of those laws impose cleanup liabilities on the Company in connection with its past and present operations. Those include facilities sold as part of the Company’s electron devices business in 1995 and thin film systems business in 1997. As a result, the Company oversees various environmental cleanup projects and receives reimbursements from third parties for a portion of the costs of its cleanup activities.
The Company also reimburses certain third parties for cleanup activities. The Company spent $0.7 million, $0.9 million, and $1.0 million (net of amounts borne by third parties) during fiscal years 2017, 2016 and 2015, respectively, on environmental cleanup costs, third-party claim costs, project management costs and legal costs.
With respect to some of these facilities, inherent uncertainties make it difficult to estimate the likelihood of the cost of future cleanup, third-party claims, project management and legal services for the cleanup sites (“Group A Sites”). Nonetheless, as of September 29, 2017, the Company estimated that, net of third parties' indemnification obligations, future costs associated with environmental remediation liabilities for the Group A Sites would range in total from $1.0 million to $8.0 million. The time frames over which these cleanup project costs are estimated vary, ranging from one year up to thirty years as of September 29, 2017. Management believes that no amount in that range is more probable of being incurred than any other amount and therefore had accrued $1.0 million for these cleanup projects as of September 29, 2017. The accrued amount has not been discounted to present value due to the uncertainties that make it difficult to develop a single best estimate.
In addition to the Group A Sites, there are other past and present facilities (“Group B Sites”) where the Company believes it has gained sufficient knowledge to better estimate the scope and cost of monitoring, cleanup and management activities. This, in part, is based on agreements with other parties and also cleanup plans approved by or completed in accordance with the requirements of the governmental agencies having jurisdiction. As of September 29, 2017, the Company estimated that the Company’s future exposure on the Group B Sites, net of third parties' indemnification obligations, for the costs at these facilities, and reimbursements of third-party’s claims for these facilities, ranged in total from $3.7 million to $19.7 million. The time frames over which these costs are estimated to be incurred vary, ranging from one to thirty years as of September 29, 2017. As to each of these facilities, management determined that a particular amount within the range of estimated costs was a better estimate than any other amount within the range, and that the amount and timing of these future costs were reliably determinable. The best estimate within that range was $5.8 million at September 29, 2017. Accordingly, the Company had
96
accrued $5.0 million for these costs as of September 29, 2017, which represented the best estimate discounted at 4%, net of inflation. This accrual is in addition to the $1.0 million described for the Group A Sites.
The table that follows presents information about the Company’s liabilities for future environmental costs at September 29, 2017, based on estimates as of that date.
(In millions) | Recurring Costs | Non-Recurring Costs | Total Anticipated Future Costs | |||||||||
Fiscal Years: | ||||||||||||
2018 | $ | 0.4 | $ | 0.7 | $ | 1.1 | ||||||
2019 | 0.4 | 0.5 | 0.9 | |||||||||
2020 | 0.4 | 0.4 | 0.8 | |||||||||
2021 | 0.4 | 0.2 | 0.6 | |||||||||
2022 | 0.4 | 0.4 | 0.8 | |||||||||
Thereafter | 1.7 | 0.9 | 2.6 | |||||||||
Total costs | $ | 3.7 | $ | 3.1 | $ | 6.8 | ||||||
Less imputed interest | 0.8 | |||||||||||
Reserve amount | $ | 6.0 | ||||||||||
Recurring costs include expenses for such tasks as the ongoing operation, maintenance and monitoring of cleanup. Non-recurring costs include expenses for such tasks as soil excavation and treatment, installation of injection and monitoring wells, other costs for soil and groundwater treatment by injection, construction of ground and surface water treatment systems, soil and groundwater investigation, governmental agency costs required to be reimbursed by the Company, removal and closure of treatment systems and monitoring wells, and the defense and settlement of pending and anticipated third-party claims.
These amounts are only estimates of anticipated future costs. The amounts the Company will actually spend may be greater than these estimates. The Company believes its reserve is adequate, as the scope of the Company’s obligations becomes more clearly defined, the Company may modify the reserve, and charge or credit future earnings accordingly. Based on information currently known to management, management believes the costs of these environmental related matters are not reasonably likely to have a material adverse effect on the consolidated financial statements of the Company in any one fiscal year.
The Company evaluates its liability for investigation and cleanup costs in light of the obligations and apparent financial strength of potential third parties and insurance companies the Company believes it has rights to indemnity or reimbursement. The Company has an agreement with an insurance company under which that insurer has agreed to pay a portion of the Company’s past and future environmental related expenditures. Receivables, net of the portion due to third parties who reimburse the Company, from that insurer amounted to $1.6 million at both September 29, 2017 and September 30, 2016, with the respective current portion included in prepaid expenses and other current assets and the respective noncurrent portion included in other assets on the Consolidated Balance Sheets. The payable portion to that insurer is included in other long-term liabilities on the Consolidated Balance Sheets. The Company believes that this receivable is recoverable, because it is based on a binding, written settlement agreement with an insurance company that appears to be a financially viable and who has paid the Company’s claims in the past.
The availability of the indemnities of third parties' will depend upon the future of their financial strength. Given the long-term nature of some of the liabilities, the third parties may be unable to fund the indemnities in the future. It is also possible that a court would disregard this contractual allocation among the parties and require the Company to assume responsibility for obligations allocated to another party, particularly if the other party were to refuse or was unable to pay any of its allocated share. The agreement governing the Spin-offs generally provides that if a court prohibits a company from satisfying its shared indemnification obligations, the indemnification obligations will be shared equally by the two other companies.
Other Matters
From time to time, the Company is a party to or otherwise involved in legal proceedings, claims and government inspections or investigations and other legal matters, both inside and outside the United States, arising in the ordinary course of its business or otherwise. The Company accrues amounts, to the extent they can be reasonably estimated, that it believes are adequate to address any liabilities related to legal proceedings and other loss contingencies that the Company believes will result in a probable loss (including, among other things, probable settlement value). A loss or a range of loss is disclosed when it is
97
reasonably possible that a material loss will be incurred and can be estimated or when it is reasonably possible that the amount of a loss, when material, will exceed the recorded provision.
In September 2015, Elekta Ltd. and William Beaumont Hospital served the Company with a complaint alleging infringement of patents related to certain aspects of cone beam imaging in conjunction with radiotherapy. During September 2015 and October 2015, the Company filed several complaints in the United States and foreign courts and the U.S. International Trade Commission against Elekta AB and its subsidiaries alleging infringement of various patents relating to certain aspects of cone beam imaging, cone-beam imaging gantries, volumetric modulated arc therapy (“VMAT”), and combined magnetic resonance imaging linear accelerator systems. In February 2016, Elekta Ltd. filed several complaints in the U.S. and foreign courts alleging infringement of certain patents related to linear accelerator control systems and treatment planning. In October 2016, Elekta Ltd. filed a complaint in the United Kingdom alleging infringement of a further patent related to linear accelerator control systems and treatment planning, and added a patent relating to the same subject matter to its existing U.S. suit filed in February 2016. In April 2017, Varian and Elekta settled all claims in all of these legal proceedings and all suits were dismissed, with no current or future payments between Varian and Elekta or William Beaumont Hospital.
In June 2015, a foreign subsidiary of the Company was charged by the Department for Investigation and Penal Action of Lisbon with alleged improper activities relating to three tenders of medical equipment in Portugal during the period of 2003 to 2009. The Company previously undertook an internal investigation of this matter and voluntarily disclosed the results of this investigation to the U.S. Department of Justice and the U.S. Securities and Exchange Commission. After the Company requested a judicial review available under Portuguese criminal procedure processes as to whether or not such charges are proper under Portuguese law, the matter was resolved and definitively dismissed on December 9, 2016, with no adverse findings or charges against the Company or its foreign subsidiary.
In addition to the above, the Company is involved in other legal matters. However, such matters are subject to many uncertainties and outcomes are not predictable with assurance. The Company is unable to estimate a range of reasonably possible losses with respect to such matters. There can be no assurances as to whether the Company will become subject to significant additional claims and liabilities with respect to ongoing or future proceedings. If actual liabilities significantly exceed the estimates made, the Company’s consolidated financial position, results of operations or cash flows could be materially adversely affected. Legal expenses relating to legal matters are expensed as incurred.
Restructuring Charges
2017 Restructuring Plan
In the first quarter of fiscal year 2017, the Company offered an enhanced retirement program to its qualifying employees and implemented a workforce reduction (collectively "the 2017 Restructuring Plan"), primarily in its Oncology Systems and VPT segments, to improve operational performance. The Company incurred $13.2 million in restructuring charges during fiscal year 2017. As of September 29, 2017, the Company does not expect the remaining restructuring charges under this plan to be material and expects to complete the plan in fiscal year 2018.
2016 Restructuring Plan
In fiscal year 2016, the Company's implemented a workforce reduction to enhance operational performance through productivity initiatives in its Oncology Systems segment. The Company incurred restructuring reversals of $0.6 million and charges of $3.5 million in during fiscal years 2017 and 2016, respectively, in connection with the restructuring program. The Company completed this restructuring program in fiscal year 2017.
2015 Restructuring Plan
In fiscal year 2015, the Company incurred $11.4 million in restructuring charges related to an enhanced retirement program to its qualifying employees and a workforce reduction. A significant portion of these charges were paid in cash in fiscal year 2015. The Company substantially completed this restructuring program in fiscal year 2016.
98
The following table provides a summary of changes in the restructuring liability related to the Company's restructuring plans:
(in millions) | September 30, 2016 | Restructuring Charges (Reversals) | Cash Payments | September 29, 2017 | |||||||||||
2017 Restructuring Plan | $ | — | $ | 13.2 | $ | (9.3 | ) | $ | 3.9 | ||||||
2016 Restructuring Plan and prior plans | 1.6 | (0.6 | ) | (1.0 | ) | — | |||||||||
$ | 1.6 | $ | 12.6 | $ | (10.3 | ) | $ | 3.9 | |||||||
The restructuring charges are included in selling, general and administrative expenses in the Consolidated Statements of Earnings.
10. RETIREMENT PLANS
The Company sponsors the Varian Medical Systems, Inc. Retirement Plan (the “Retirement Plan”) — a defined contribution plan that is available to substantially all of its employees in the United States. Under Section 401(k) of the Internal Revenue Code, the Retirement Plan allows for tax-deferred salary contributions by eligible employees. Participants can contribute from 1% to 25% of their eligible base compensation to the Retirement Plan on a pre-tax or Roth basis (plus up to an additional 15% on an after-tax basis if they have more than one year of service with the Company) and all or a portion of their bonuses under the Employee Incentive Plan. However, participant contributions are limited to a maximum annual amount as determined periodically by the Internal Revenue Service. The Company matches eligible participant contributions dollar for dollar for the first 6% of eligible base compensation or bonus without a waiting period. Employees are immediately vested in their own contributions to the Plan. Employees hired on or after July 1, 2017 are 100% vested in the company matching contributions after one year of service. All matching contributions vest immediately. The Company also has a defined contribution plan that is available to regular full-time employees in the United Kingdom (the “U.K. Savings Plan”). Participants can contribute from 4% to 100% of their eligible compensation to the U.K. Savings Plan subject to a maximum annual amount determined by certain tax rules. The Company matches participant contributions up to 6% of participants’ eligible base compensation, based on the participants’ level of contributions under this U.K. Savings Plan. All matching contributions vest immediately.
The Company sponsors five defined benefit pension plans for regular full-time employees in Germany, Japan, Switzerland and the United Kingdom. The Company also sponsors a post-retirement benefit plan that provides healthcare benefits to certain eligible retirees in the United States.
The Company recognizes the funded status of its defined benefit pension and post-retirement benefit plans on its Consolidated Balance Sheets. Each overfunded plan is recognized as an asset, and each underfunded plan is recognized as a liability. Unrecognized prior service costs or credits and net actuarial gains or losses, as well as subsequent changes in the funded status are recognized as a component of accumulated other comprehensive loss within Stockholders’ equity.
Total retirement, post-retirement benefit plan and defined benefit plan expense for all retirement plans amounted to $30.1 million, $29.8 million and $28.7 million for fiscal years 2017, 2016 and 2015, respectively. The Company's post-retirement benefit plan is not presented in any of the following information as it is not material.
99
Obligations and Funded Status
The following table presents the funded status of the defined benefit pension plans:
(In millions) | September 29, 2017 | September 30, 2016 | |||||
Change in benefit obligation: | |||||||
Benefit obligation - beginning of fiscal year | $ | 238.3 | $ | 206.9 | |||
Service cost | 7.1 | 5.9 | |||||
Interest cost | 2.4 | 4.0 | |||||
Plan participants’ contributions | 8.7 | 8.6 | |||||
Plan amendments | (5.0 | ) | (1.2 | ) | |||
Plan settlements | (6.9 | ) | (4.0 | ) | |||
Net transfer in | 0.5 | — | |||||
Actuarial (gain) loss | (11.3 | ) | 31.6 | ||||
Foreign currency changes | 1.6 | (8.8 | ) | ||||
Benefit and expense payments | (4.7 | ) | (4.7 | ) | |||
Benefit obligation - end of fiscal year | $ | 230.7 | $ | 238.3 | |||
Change in plan assets: | |||||||
Plan assets - beginning of fiscal year | $ | 199.3 | $ | 186.9 | |||
Employer contributions | 8.2 | 8.0 | |||||
Actual return on plan assets | 8.0 | 12.9 | |||||
Plan participants’ contributions | 8.7 | 8.6 | |||||
Plan settlements | (6.9 | ) | (4.0 | ) | |||
Foreign currency changes | 2.0 | (8.6 | ) | ||||
Acquisitions / divestitures | 0.5 | — | |||||
Benefit and expense payments | (4.7 | ) | (4.5 | ) | |||
Plan assets - end of fiscal year | $ | 215.1 | $ | 199.3 | |||
Funded status | $ | (15.6 | ) | $ | (39.0 | ) | |
Amounts recognized within the consolidated balance sheet: | |||||||
Other assets | $ | 3.6 | $ | — | |||
Other long-term liabilities | (19.2 | ) | (39.0 | ) | |||
Net amount recognized | $ | (15.6 | ) | $ | (39.0 | ) | |
The following table presents the amounts recognized in accumulated other comprehensive loss, before tax, for the defined benefit pension plans:
(In millions) | September 29, 2017 | September 30, 2016 | |||||
Prior service credit | $ | 6.3 | $ | 1.8 | |||
Net loss | (61.5 | ) | (79.5 | ) | |||
Accumulated other comprehensive loss | $ | (55.2 | ) | $ | (77.7 | ) | |
The following table presents the projected benefit obligation, accumulated benefit obligation and fair value of plan assets for those defined benefit pension plans where accumulated benefit obligations exceeded the fair value of plan assets:
(In millions) | September 29, 2017 | September 30, 2016 | |||||
Projected benefit obligation | $ | 16.6 | $ | 17.2 | |||
Accumulated benefit obligation | $ | 15.4 | $ | 16.3 | |||
Fair value of plan assets | $ | 13.4 | $ | 12.8 | |||
The accumulated benefit obligation for all defined benefit pension plans was $199.0 million and $190.1 million at September 29, 2017 and September 30, 2016, respectively.
100
Components of Net Periodic Benefit Cost and Other Amounts Recognized in Other Comprehensive Loss
The following table shows the components of the Company’s net periodic benefit costs and the other amounts recognized in other comprehensive loss, before tax, for the Company’s defined benefit pension plans:
Fiscal Years | ||||||||||||
(In millions) | 2017 | 2016 | 2015 | |||||||||
Net Periodic Benefit Costs: | ||||||||||||
Service cost | $ | 7.1 | $ | 5.9 | $ | 5.6 | ||||||
Interest cost | 2.4 | 4.0 | 4.4 | |||||||||
Loss due to settlement | 1.4 | 1.0 | 1.1 | |||||||||
Expected return on assets | (7.1 | ) | (6.7 | ) | (7.1 | ) | ||||||
Amortization of prior service cost | (0.5 | ) | — | 0.1 | ||||||||
Recognized actuarial loss | 4.3 | 2.9 | 2.4 | |||||||||
Net periodic benefit cost | 7.6 | 7.1 | 6.5 | |||||||||
Other Amounts Recognized in Other Comprehensive (Income) Loss: | ||||||||||||
New prior service credit | (5.0 | ) | (1.2 | ) | (1.1 | ) | ||||||
Net (gain) loss arising during the year | (12.2 | ) | 25.3 | 6.7 | ||||||||
Amortization of prior service credit (cost) | 0.5 | — | (0.1 | ) | ||||||||
Amortization or settlement of net actuarial loss | (5.7 | ) | (3.9 | ) | (3.5 | ) | ||||||
Total recognized in other comprehensive (income) loss | (22.4 | ) | 20.2 | 2.0 | ||||||||
Total recognized in net periodic benefit cost and other comprehensive (income) loss | $ | (14.8 | ) | $ | 27.3 | $ | 8.5 | |||||
The amounts in accumulated other comprehensive loss that are expected to be recognized as components of net periodic benefit cost during fiscal year 2018 for the Company’s defined benefit pension plans are as follows:
(In millions) | Total | |||
Prior service credit | $ | 0.6 | ||
Net loss | (2.9 | ) | ||
Total | $ | (2.3 | ) | |
Assumptions
The assumptions used to determine net periodic benefit cost and to compute the expected long-term return on assets for the Company’s defined benefit pension plans were as follows:
Fiscal Years | |||||||||
Net Periodic Benefit Cost | 2017 | 2016 | 2015 | ||||||
Discount rate | 1.03 | % | 2.05 | % | 2.59 | % | |||
Rate of compensation increase | 2.33 | % | 2.42 | % | 2.46 | % | |||
Expected long-term return on assets | 3.56 | % | 3.57 | % | 3.76 | % | |||
The assumptions used to measure the benefit obligation for the Company’s defined benefit pension plans were as follows:
Benefit Obligation | September 29, 2017 | September 30, 2016 | ||||
Discount rate | 1.40 | % | 1.03 | % | ||
Rate of compensation increase | 2.40 | % | 2.33 | % | ||
The benefit obligation of defined benefit pension plans was measured as of September 29, 2017. The discount rate was adjusted as of September 29, 2017 to a range of 0.60% to 2.70%, primarily based on the current effective yield of long-term corporate bonds that are of high quality with satisfactory liquidity and credit rating with durations corresponding to the expected duration of the benefit obligations. Additionally, the rate of projected compensation increase was adjusted as of September 29, 2017 to a range of 1.75% to 3.70% reflecting expected inflation levels and the Company’s future outlook.
101
During the fourth quarter of fiscal year 2017, the Company reviewed the expected long-term rate of return on defined benefit pension plan assets. This review consisted of forward-looking projections for a risk-free rate of return, inflation rate and implied equity risk premiums for particular asset classes. The results of this review were applied to the target asset allocation in accordance with the Company’s planned investment strategies, which are implemented by outside investment managers. The expected long-term rate of return on plan assets was determined based on the weighted average of projected returns on each asset class.
Plan Assets
For the defined benefit pension plans, the investment objectives of the Company are to generate returns that will enable the defined benefit pension plans to meet their future obligations. The precise amount of these obligations depends on future events, including the life expectancies of the pension plans’ members and the level of salary increases. The obligations are estimated using actuarial assumptions, based on the current economic environment. The investment strategy depends on the country in which the defined benefit pension plan applies. The investment objectives of some defined benefit pension plans are more conservative than others. In general, the investment strategy of the defined benefit pension plans is to balance the requirement to generate return using higher-returning assets such as equity securities, with the need to control risk with less volatile assets, such as fixed-income securities. Risks include, among others, the likelihood of the defined benefit pension plans becoming underfunded, thereby increasing their dependence on contributions from the Company. Within each asset class, investment managers give consideration to balancing the portfolio among industry sectors, geographies, interest rate sensitivity, dependence on economic growth, currency and other factors that affect investment returns. The target allocation as of the end of fiscal year 2017 was 30% equities, 60% debt and fixed income assets, 3% real estate, and 7% other.
The following table presents the Company’s defined benefit pension plans’ major asset categories, their associated fair values, as well as the actual allocation of equity, debt and fixed income, real estate and all other types of investments:
(In millions) | Quoted Prices in Active Markets for Identical Assets (Level 1) | Significant Observable Inputs (Level 2) | Significant Unobservable Inputs (Level 3) | Total | ||||||||||||
As of September 29, 2017: | ||||||||||||||||
Investment funds: | ||||||||||||||||
Mutual funds - equities | $ | — | $ | 62.6 | $ | — | $ | 62.6 | ||||||||
Mutual funds - debt | — | 36.3 | — | 36.3 | ||||||||||||
Mutual funds - real estate | — | 4.9 | — | 4.9 | ||||||||||||
Other | — | 3.2 | — | 3.2 | ||||||||||||
Assets held by insurance company: | ||||||||||||||||
Insurance contracts | — | 107.6 | — | 107.6 | ||||||||||||
Cash and cash equivalents | 0.5 | — | — | 0.5 | ||||||||||||
Total | $ | 0.5 | $ | 214.6 | $ | — | $ | 215.1 | ||||||||
As of September 30, 2016: | ||||||||||||||||
Investment funds: | ||||||||||||||||
Mutual funds - equities | $ | — | $ | 51.7 | $ | — | $ | 51.7 | ||||||||
Mutual funds - debt | — | 27.1 | — | 27.1 | ||||||||||||
Mutual funds - real estate | — | 4.6 | — | 4.6 | ||||||||||||
Other | — | 2.9 | — | 2.9 | ||||||||||||
Assets held by insurance company: | ||||||||||||||||
Insurance contracts | — | 112.7 | — | 112.7 | ||||||||||||
Cash and cash equivalents | 0.3 | — | — | 0.3 | ||||||||||||
Total | $ | 0.3 | $ | 199.0 | $ | — | $ | 199.3 | ||||||||
102
Valuation Techniques
Debt securities are valued at the closing price reported on the stock exchange on which the individual securities are traded. Mutual funds held in trust or similar entities include investments in publicly traded mutual funds and are typically valued using the net asset value provided by the administrator of the fund. Insurance contracts are valued by the insurer using the cash surrender value, which is the amount a plan would receive if a contract was terminated. Cash includes deposits and money market accounts, which are valued at their cost plus interest on a daily basis, which approximates fair value. There were no significant changes in valuation techniques during fiscal years 2017 and 2016.
Estimated Contributions and Future Benefit Payments
The Company made contributions of $8.2 million to the defined benefit pension plans during fiscal year 2017, compared to $8.0 million in fiscal year 2016 and $6.7 million in fiscal year 2015. The Company expects total contributions to the defined benefit pension plans for fiscal year 2018 will be approximately $8.7 million.
Estimated future benefit payments to the defined benefit pension plans at September 29, 2017 were as follows:
(In millions) | Total | |||
Fiscal Years: | ||||
2018 | $ | 6.6 | ||
2019 | 6.9 | |||
2020 | 6.2 | |||
2021 | 7.6 | |||
2022 | 7.9 | |||
Thereafter | 41.4 | |||
Total | $ | 76.6 | ||
11. STOCKHOLDERS’ EQUITY AND NONCONTROLLING INTERESTS
Share Repurchase Program
In November 2016, the VMS Board of Directors authorized the repurchase of an additional 8.0 million shares of VMS common stock commencing on January 1, 2017. Share repurchases under the Company's authorizations may be made in open market purchases, in privately negotiated transactions (including accelerated share repurchase (“ASR”) programs), or under Rule 10b5-1 share repurchase plans, and may be made from time to time in one or more blocks. All shares that were repurchased under the Company's share repurchase programs have been retired. The Company purchased 0.5 million shares of VMS common stock in the three months ended December 30, 2016, under the November 2015 authorization, which expired on December 31, 2016. As of September 29, 2017, approximately 5.2 million shares of VMS common stock remained available for repurchase under the November 2016 authorization.
The Company repurchased shares of VMS common stock under various authorizations during the periods presented as follows:
Fiscal Years | |||||||||||
(In millions, except per share amounts) | 2017 | 2016 | 2015 | ||||||||
Number of shares | 3.3 | 5.7 | 4.8 | ||||||||
Average repurchase price per share | $ | 90.63 | $ | 81.61 | $ | 87.47 | |||||
Total cost | $ | 294.5 | $ | 461.3 | $ | 422.0 | |||||
103
Included in the table above, VMS repurchased common stock under various ASR agreements during the periods presented as follows:
Fiscal Years(1) | |||||||
(In millions, except per share amounts) | 2016 | 2015 | |||||
Number of shares | 1.0 | 2.3 | |||||
Average repurchase price per share | $ | 83.98 | $ | 90.00 | |||
Total cost | $ | 85.8 | $ | 203.9 | |||
(1) The Company did not repurchase any VMS common stock under ASR agreements during fiscal year 2017.
Accumulated Other Comprehensive Loss
(In millions) | Net Unrealized Gains (Losses) Defined Benefit Pension and Post-Retirement Benefit Plans | Net Unrealized Gains (Losses) Cash Flow Hedging Instruments | Net Unrealized Gains (Losses) Available-for- Sale Securities | Cumulative Translation Adjustment | Accumulated Other Comprehensive Earnings (Loss) | |||||||||||||||
Balance at September 26, 2014 | $ | (44.1 | ) | $ | 1.0 | $ | — | $ | (15.5 | ) | $ | (58.6 | ) | |||||||
Other comprehensive earnings (loss) before reclassifications | (4.5 | ) | 2.2 | (0.2 | ) | (24.8 | ) | (27.3 | ) | |||||||||||
Amounts reclassified out of other comprehensive loss | 2.1 | (3.8 | ) | — | — | (1.7 | ) | |||||||||||||
Tax expense | 0.4 | 0.6 | 0.1 | — | 1.1 | |||||||||||||||
Balance at October 2, 2015 | (46.1 | ) | — | (0.1 | ) | (40.3 | ) | (86.5 | ) | |||||||||||
Other comprehensive earnings (loss) before reclassifications | (23.4 | ) | (1.0 | ) | (0.4 | ) | 2.8 | (22.0 | ) | |||||||||||
Amounts reclassified out of other comprehensive loss | 2.4 | 1.0 | 0.6 | — | 4.0 | |||||||||||||||
Tax benefit (expense) | 3.8 | — | (0.1 | ) | — | 3.7 | ||||||||||||||
Balance at September 30, 2016 | (63.3 | ) | — | — | (37.5 | ) | (100.8 | ) | ||||||||||||
Other comprehensive earnings (loss) before reclassifications | 19.8 | — | — | 12.8 | 32.6 | |||||||||||||||
Amounts reclassified out of other comprehensive loss | 3.4 | — | — | — | 3.4 | |||||||||||||||
Tax expense | (4.0 | ) | — | — | — | (4.0 | ) | |||||||||||||
Balance at September 29, 2017 | $ | (44.1 | ) | $ | — | $ | — | $ | (24.7 | ) | $ | (68.8 | ) | |||||||
The amounts reclassified out of other comprehensive earnings (loss) into the Consolidated Statements of Earnings, with line item location, during each period were as follows (in millions):
Fiscal Years | ||||||||||||||
Comprehensive Earnings Components | 2017 | 2016 | 2015 | Line Item in Statements of Earnings | ||||||||||
Unrealized loss on defined benefit pension and post-retirement benefit plans | $ | (3.4 | ) | $ | (2.4 | ) | $ | (2.1 | ) | Cost of revenues & Operating expenses | ||||
Unrealized gains (losses) on cash flow hedging instruments | — | (1.0 | ) | 3.8 | Revenues | |||||||||
Unrealized loss on available-for-sale investments | — | (0.6 | ) | — | Operating expenses | |||||||||
Total amounts reclassified out of other comprehensive loss | $ | (3.4 | ) | $ | (4.0 | ) | $ | 1.7 | ||||||
104
Noncontrolling Interests
In connection with the Distribution of Varex in January 2017, the Company's redeemable noncontrolling interests relating to MeVis Medical Solutions AG ("MeVis") were transferred to Varex.
Changes in noncontrolling interests and redeemable noncontrolling interests relating to MeVis and other subsidiaries of the Company were as follows:
Fiscal Years | |||||||||||||||
2017 | 2016 | ||||||||||||||
(In millions) | Noncontrolling Interests | Redeemable Noncontrolling Interests | Noncontrolling Interests | Redeemable Noncontrolling Interests | |||||||||||
Balance at beginning of period | $ | 3.7 | $ | 10.3 | $ | 14.7 | $ | — | |||||||
Net earnings (loss) attributable to noncontrolling interests | 0.6 | 0.1 | (0.1 | ) | 0.5 | ||||||||||
Reclassification of noncontrolling interests in MeVis to redeemable noncontrolling interests | — | — | (10.4 | ) | 10.4 | ||||||||||
Transfer of redeemable noncontrolling interests in MeVis to Varex | — | (10.3 | ) | — | — | ||||||||||
Other | — | (0.1 | ) | (0.5 | ) | (0.6 | ) | ||||||||
Balance at end of period | $ | 4.3 | $ | — | $ | 3.7 | $ | 10.3 | |||||||
12. EMPLOYEE STOCK PLANS
Employee Stock Plans
In connection with the Distribution of Varex, on January 28, 2017, the Company's outstanding equity awards were modified using a conversion ratio designed to preserve the intrinsic value of these awards immediately prior to the Distribution. The modification of the Company's equity awards did not result in any additional fair value of the awards immediately before and after the modification, therefore no additional share-based compensation expense was required. The modification also did not change the original vesting terms of the equity awards immediately prior to the Distribution. The outstanding equity awards for the Company employees who were part of Varex were cancelled on January 27, 2017, and no new Company equity awards were granted to these employees.
Varian's 2005 Omnibus Stock Plan (the “2005 Plan”) was last amended and restated in November 2016 and approved by VMS’s stockholders at the 2017 Annual Meeting of Stockholders. The 2005 Plan, as amended and restated to date, is referred to as the Fourth Amended 2005 Plan (the “Fourth Amended 2005 Plan”). The Fourth Amended 2005 Plan provides for the grant of equity incentive awards, including stock options, restricted stock and restricted stock units, stock appreciation rights, and performance units and performance shares to officers, directors, key employees and consultants. The Fourth Amended 2005 Plan also provides for the grant of deferred stock units to non-employee directors. The maximum number of shares issuable under the Fourth Amended 2005 Plan is (a) 25.0 million, plus (b) the number of shares authorized for issuance, but never issued, under previously approved plans, plus (c) the number of shares subject to awards previously granted under previously approved plans that terminate, expire, or lapse, plus (d) amounts granted in substitution of options in connection with certain transactions.
Stock options granted under the Fourth Amended 2005 Plan have an exercise price equal to the closing market price of a share of VMS common stock on the grant date. Except for directors, stock options granted under the Fourth Amended 2005 Plan generally are exercisable in the following manner: the first one-third one year from the date of grant, with the remainder vesting monthly during the following two-year period. Stock option grants to directors are generally immediately exercisable. For grants of non-qualified stock options made on or after November 17, 2005 under the Fourth Amended 2005 Plan to employees who retire from the Company within one year of the grant date, the number of shares subject to the stock option shall be adjusted proportionally by the time during such one-year period that the employee remained an employee of the Company (based upon a 365-day year). The revised number of shares subject to the stock option would continue to vest in accordance with the original vesting schedule, and the remaining shares would be cancelled as of the date of retirement. Stock options under the Fourth Amended 2005 Plan generally have a term of seven years. The Fourth Amended 2005 Plan prohibits the repricing of stock options and stock appreciation rights without the approval of VMS’s stockholders.
105
Restricted stock awards and restricted stock unit awards generally vest over a period of one to three years from the date of grant. For awards of restricted stock and restricted stock units prior to fiscal year 2010, any unvested awards are generally forfeited at the time of termination. However, restricted stock units granted in fiscal year 2010 and thereafter that are unvested at death become fully vested and unvested restricted stock units will generally continue to vest in accordance with the original vesting schedule if a retirement eligible employee retires one year or more from the grant date. If a retirement eligible employee retires on or after January 1 of the calendar year immediately following the calendar year in which the grant date occurred, the number of restricted stock units shall be adjusted proportionally, subject to local regulations, by the time during such one year period that the employee remained an employee of the Company (based upon a 365-day year). The revised number of restricted stock units would vest in accordance with the original vesting schedule and the remaining restricted stock units would be cancelled as of the date of retirement.
Deferred stock unit awards to non-employee directors vest over a period of not less than one year from the date of grant, unless otherwise provided in the grant agreement as determined by VMS’s Board of Directors, and vesting may be pro rata during the vesting period. Each deferred stock unit is deemed to be the equivalent of one share of VMS common stock. Payment of deferred stock units generally will be made in shares of VMS common stock upon the earlier of the third anniversary of the grant date or the director’s termination.
In fiscal years 2017, 2016 and 2015, the Company granted performance units to certain employees under the Fourth Amended 2005 Plan. The number of shares of VMS common stock ultimately issued under the performance units at vesting depend on the Company’s business performance and total shareholder return during the performance period, against specified performance targets, both of which are set by the Compensation and Management Development Committee of the Board of Directors at the beginning of the period. The performance units vest at the end of a three-year service period. Performance units granted prior to fiscal year 2015 have one three-year performance period for both the Company's performance and total shareholder return. Performance units granted in fiscal year 2015 have a one-year Company's performance period and a three-year total shareholder return performance period. Performance unit grants made after fiscal year 2015 have three separate one-year Company performance periods and a three-year total shareholder return. Subject to certain exceptions, any unvested performance unit awards are forfeited at the time of termination. Also, similar to the adjustments discussed above for restricted stock unit awards, the number of performance units that ultimately vest is adjusted in the case of retirement.
The fair value of options granted and the option component of the shares purchased under the Employee Stock Purchase Plan (which is described further below) were estimated at the date of grant using the Black-Scholes model with the following weighted average assumptions:
Employee Stock Option Plans | Employee Stock Purchase Plans | |||||||||||||||||||||||
Fiscal Years | Fiscal Years | |||||||||||||||||||||||
2017 | 2016 | 2015 | 2017 | 2016 | 2015 | |||||||||||||||||||
Expected term (in years) | 3.99 | 4.13 | 4.15 | 0.50 | 0.50 | 0.50 | ||||||||||||||||||
Risk-free interest rate | 1.7 | % | 1.1 | % | 1.3 | % | 0.7 | % | 0.3 | % | 0.1 | % | ||||||||||||
Expected volatility | 21.3 | % | 20.1 | % | 22.1 | % | 20.3 | % | 17.6 | % | 12.7 | % | ||||||||||||
Expected dividend | — | % | — | % | — | % | — | % | — | % | — | % | ||||||||||||
Weighted average fair value at grant date | $ | 16.12 | $ | 13.71 | $ | 18.52 | $ | 18.92 | $ | 16.09 | $ | 15.87 | ||||||||||||
The expected term of stock options represents the weighted average period the stock options are expected to remain outstanding. The expected term is based on the observed and expected time to post-vesting exercise and post-vesting cancellations of stock options by Company employees. The Company used a combination of historical and implied volatility of its traded options, or blended volatility, in deriving the expected volatility assumption. The risk-free interest rate assumption is based upon observed interest rates appropriate for the term of VMS’s stock options. The dividend yield assumption is based on the Company’s history and expectation of no dividend payouts.
As share-based compensation expense recognized in the Consolidated Statements of Earnings is based on awards ultimately expected to vest, it has been reduced for estimated forfeitures, based on historical experience. Forfeitures are estimated at the time of grant and revised, in subsequent periods if actual forfeitures differ from those estimates. Beginning in fiscal year 2018, the Company has adopted the new accounting guidance that allows it to account for forfeitures as they occur.
106
The table below summarizes the effect of recording share-based compensation expense:
Fiscal Years | ||||||||||||
(In millions) | 2017 | 2016 | 2015 | |||||||||
Cost of revenues - Product | $ | 3.0 | $ | 3.3 | $ | 3.5 | ||||||
Cost of revenues - Service | 4.1 | 4.1 | 4.0 | |||||||||
Research and development | 5.1 | 5.3 | 5.4 | |||||||||
Selling, general and administrative | 27.0 | 29.5 | 27.0 | |||||||||
Total share-based compensation expense | $ | 39.2 | $ | 42.2 | $ | 39.9 | ||||||
Income tax benefit for share-based compensation | $ | (11.5 | ) | $ | (12.8 | ) | $ | (12.0 | ) | |||
The table below summarizes the effect of recording pre-tax share-based compensation expense for equity incentive awards:
Fiscal Years | ||||||||||||
(In millions) | 2017 | 2016 | 2015 | |||||||||
Stock options | $ | 9.2 | $ | 9.9 | $ | 10.1 | ||||||
Restricted stock units and restricted stock awards (1) | 26.2 | 28.7 | 26.7 | |||||||||
Employee stock purchase plan | 3.8 | 3.6 | 3.1 | |||||||||
Total share-based compensation expense | $ | 39.2 | $ | 42.2 | $ | 39.9 | ||||||
(1) | Restricted stock units and restricted stock awards include performance units and deferred stock units. |
A summary of share-based awards available for grant is as follows:
(In millions) | Shares Available for Grant | |
Balance at September 26, 2014 | 8.2 | |
Granted | (1.8 | ) |
Canceled or expired | 0.3 | |
Balance at October 2, 2015 | 6.7 | |
Granted | (2.4 | ) |
Canceled or expired | 0.3 | |
Balance at September 30, 2016 | 4.6 | |
Granted | (1.8 | ) |
Canceled or expired | 0.3 | |
Adjustment due to Distribution | (0.6 | ) |
Balance at September 29, 2017 | 2.5 | |
For purposes of the total number of shares available for grant under the Fourth Amended 2005 Plan, any shares subject to awards of stock options are counted against the available-for-grant limit as one share for every one share subject to the award. Awards other than stock options are counted against the available-for-grant limit as 2.6 shares for every one share awarded on or after February 9, 2012. The shares available for grant limit is further adjusted to reflect a maximum payout that could be issued for each performance unit granted. The maximum payouts that could be issued for each performance grant are 1.75 shares beginning in fiscal year 2016, 2.0 shares in fiscal year 2015 and 1.5 shares prior to fiscal year 2015. All awards may be subject to restrictions on transferability and continued employment as determined by the Compensation and Management Development Committee.
107
Activity under the Company’s employee stock plans related to stock options is presented below:
Options Outstanding | |||||||
(In millions, except per share amounts) | Number of Shares | Weighted Average Exercise Price | |||||
Balance at September 30, 2016 (1.4 million options exercisable at a weighted average exercise price of $76.31) | 2.6 | $ | 78.25 | ||||
Granted | 0.6 | 82.29 | |||||
Adjustment due to Distribution | 0.3 | 70.15 | |||||
Canceled, expired or forfeited | (0.4 | ) | 70.26 | ||||
Exercised | (0.8 | ) | 66.80 | ||||
Balance at September 29, 2017 | 2.3 | $ | 74.08 | ||||
The total pre-tax intrinsic value of stock options exercised was $25.6 million, $23.8 million and $51.1 million in fiscal years 2017, 2016 and 2015, respectively. The total fair value of stock options vested was $9.7 million, $10.2 million and $10.0 million in fiscal years 2017, 2016 and 2015, respectively.
The following table summarizes information related to stock options outstanding and exercisable under the Company’s employee stock plans at September 29, 2017:
Options Outstanding | Options Exercisable | |||||||||||||||||||||||||
Range of Exercise Prices | Number of Shares | Weighted Average Remaining Contractual Term (in years) | Weighted Average Exercise Price | Aggregate Intrinsic Value (1) | Number of Shares | Weighted Average Remaining Contractual Term (in years) | Weighted Average Exercise Price | Aggregate Intrinsic Value (1) | ||||||||||||||||||
(In millions, except years and per-share amounts) | ||||||||||||||||||||||||||
$51.23 - $57.27 | 0.1 | 1.2 | $ | 52.91 | $ | 3.7 | 0.1 | 1.2 | $ | 52.91 | $ | 3.7 | ||||||||||||||
$60.91 - $67.12 | 0.8 | 4.5 | 65.71 | 28.2 | 0.5 | 3.9 | 64.55 | 16.0 | ||||||||||||||||||
$71.47 - $77.49 | 0.3 | 3.5 | 74.28 | 9.0 | 0.3 | 3.4 | 74.29 | 8.6 | ||||||||||||||||||
$80.40 - $99.26 | 1.1 | 5.5 | 82.18 | 18.6 | 0.3 | 4.2 | 81.97 | 6.0 | ||||||||||||||||||
Total | 2.3 | 4.7 | $ | 74.08 | $ | 59.5 | 1.2 | 3.7 | $ | 71.37 | $ | 34.3 | ||||||||||||||
(1) | The aggregate intrinsic value represents the total pre-tax intrinsic value, which is computed based on the difference between the exercise price and the closing price of VMS common stock of $100.06 as of September 29, 2017, the last trading date of fiscal year 2017, and which represents the amount that would have been received by the option holders had all option holders exercised their options and sold the shares received upon exercise as of that date. |
As of September 29, 2017, there was $9.8 million of total unrecognized compensation expense related to stock options granted under the Company’s employee stock plans. This unrecognized compensation expense is expected to be recognized over a weighted average period of 1.8 years.
The activity for restricted stock, restricted stock units, deferred stock units and performance units is summarized as follows:
(In millions, except per share amounts) | Number of Shares | Weighted Average Grant-Date Fair Value | |||||
Balance at September 30, 2016 | 1.0 | $ | 82.51 | ||||
Granted | 0.4 | 83.96 | |||||
Adjustment due to Distribution | 0.1 | 74.18 | |||||
Vested | (0.4 | ) | 72.77 | ||||
Canceled or expired | (0.2 | ) | 72.74 | ||||
Balance at September 29, 2017 | 0.9 | $ | 75.37 | ||||
108
The total grant-date fair value of restricted stock units, deferred stock units and performance units was $31.4 million, $38.4 million and $38.1 million in fiscal years 2017, 2016 and 2015, respectively. The total fair value of restricted stock, restricted stock units, deferred stock units and performance units that vested was $29.8 million, $31.7 million and $44.5 million in fiscal years 2017, 2016 and 2015, respectively.
As of September 29, 2017, unrecognized compensation expense totaling $30.6 million was related to restricted stock, restricted stock units, deferred stock units and performance units granted under the Company’s employee stock plans. This unrecognized share-based compensation expense is expected to be recognized over a weighted average period of 1.7 years. The Company withheld 0.1 million shares with a fair value of $10.7 million for employees’ minimum withholding taxes at vesting of such awards in fiscal year 2017.
Employee Stock Purchase Plan
In February 2010, VMS’s stockholders approved the 2010 Employee Stock Purchase Plan (the “2010 ESPP”). The 2010 ESPP provides eligible employees with an opportunity to purchase shares of VMS common stock at 85% of the lower of its fair market value at the start and end of a six-month purchase period. The 2010 ESPP provides for the purchase of up to seven million shares of VMS common stock.
VMS issued approximately 0.2 million shares for $16.2 million in fiscal year 2017 and approximately 0.3 million shares for $17.2 million in fiscal year 2016. At September 29, 2017, 5.4 million shares were available for issuance under the 2010 ESPP.
13. EARNINGS PER SHARE
The following table sets forth the computation of basic and diluted net earnings per share:
Fiscal Years | ||||||||||||
(In millions, except per share amounts) | 2017 | 2016 | 2015 | |||||||||
Net earnings from continuing operations | $ | 257.1 | $ | 325.3 | $ | 311.4 | ||||||
Less: Net earnings (loss) from continuing operations attributable to noncontrolling interests | 0.6 | (0.1 | ) | (0.2 | ) | |||||||
Net earnings from continuing operations attributable to Varian | 256.5 | 325.4 | 311.6 | |||||||||
Net earnings (loss) from discontinued operations | (6.8 | ) | 77.4 | 100.6 | ||||||||
Less: Net earnings from discontinued operations attributable to noncontrolling interests | 0.1 | 0.5 | 0.7 | |||||||||
Net earnings (loss) from discontinued operations attributable to Varian | $ | (6.9 | ) | $ | 76.9 | $ | 99.9 | |||||
Net earnings attributable to Varian | $ | 249.6 | $ | 402.3 | $ | 411.5 | ||||||
Denominator: | ||||||||||||
Weighted average shares outstanding - basic | 92.5 | 95.4 | 99.7 | |||||||||
Dilutive effect of potential common shares | 0.7 | 0.6 | 0.9 | |||||||||
Weighted average shares outstanding - diluted | 93.2 | 96.0 | 100.6 | |||||||||
Net earnings (loss) per share attributable to Varian - basic | ||||||||||||
Continuing operations | $ | 2.78 | $ | 3.41 | $ | 3.13 | ||||||
Discontinued operations | (0.08 | ) | 0.81 | 1.00 | ||||||||
Net earnings per share - basic | $ | 2.70 | $ | 4.22 | $ | 4.13 | ||||||
Net earnings (loss) per share attributable to Varian - diluted | ||||||||||||
Continuing operations | $ | 2.75 | $ | 3.39 | $ | 3.10 | ||||||
Discontinued operations | (0.07 | ) | 0.80 | 0.99 | ||||||||
Net earnings per share - diluted | $ | 2.68 | $ | 4.19 | $ | 4.09 | ||||||
Anti-dilutive employee share-based awards, excluded | 0.2 | 1.6 | 1.0 | |||||||||
109
14. TAXES ON EARNINGS
The Company accounts for income taxes under an asset and liability approach where deferred income taxes are based upon enacted tax laws and rates applicable to the periods in which the taxes become payable.
Taxes on earnings from continuing operations were as follows:
Fiscal Years | ||||||||||||
(In millions) | 2017 | 2016 | 2015 | |||||||||
Current provision: | ||||||||||||
Federal | $ | 31.6 | $ | 57.6 | $ | 5.5 | ||||||
State and local | 4.3 | 7.4 | 4.6 | |||||||||
Foreign | 68.9 | 74.5 | 73.2 | |||||||||
Total current | 104.8 | 139.5 | 83.3 | |||||||||
Deferred provision (benefit): | ||||||||||||
Federal | (13.3 | ) | (14.9 | ) | 4.4 | |||||||
State and local | 0.2 | (1.6 | ) | (0.4 | ) | |||||||
Foreign | (4.0 | ) | (7.7 | ) | 2.6 | |||||||
Total deferred | (17.1 | ) | (24.2 | ) | 6.6 | |||||||
Taxes on earnings | $ | 87.7 | $ | 115.3 | $ | 89.9 | ||||||
Earnings from continuing operations before taxes are generated from the following geographic areas:
Fiscal Years | ||||||||||||
(In millions) | 2017 | 2016 | 2015 | |||||||||
United States | $ | 93.7 | $ | 83.2 | $ | 82.3 | ||||||
Foreign | 251.1 | 357.4 | 319.0 | |||||||||
Total earnings before taxes | $ | 344.8 | $ | 440.6 | $ | 401.3 | ||||||
The effective tax rate on continuing operations differs from the U.S. federal statutory tax rate as a result of the following:
Fiscal Years | |||||||||
2017 | 2016 | 2015 | |||||||
Federal statutory income tax rate | 35.0 | % | 35.0 | % | 35.0 | % | |||
State and local taxes, net of federal tax benefit | 0.9 | % | 0.3 | % | 0.5 | % | |||
Non-U.S. income taxed at different rates, net | (8.4 | )% | (8.7 | )% | (12.6 | )% | |||
Other | (2.1 | )% | (0.4 | )% | (0.5 | )% | |||
Effective tax rate | 25.4 | % | 26.2 | % | 22.4 | % | |||
During fiscal years 2017, 2016 and 2015, the Company’s effective tax rate was lower than the U.S. federal statutory rate primarily because the Company’s foreign earnings are taxed at rates that, on average, are lower than the U.S. federal rate. This reduction is partly offset by the fact that the Company’s domestic earnings are also subject to state income taxes.
110
Significant components of deferred tax assets and liabilities are as follows:
September 29, | September 30, | ||||||
(In millions) | 2017 | 2016 | |||||
Deferred Tax Assets: | |||||||
Deferred revenues | $ | 29.6 | $ | 29.5 | |||
Deferred compensation | 45.0 | 36.5 | |||||
Product warranty | 9.6 | 9.7 | |||||
Inventory adjustments | 11.1 | 8.7 | |||||
Share-based compensation | 17.8 | 22.3 | |||||
Environmental reserve | 3.9 | 3.6 | |||||
Accruals and reserves | 20.1 | 13.6 | |||||
Net operating loss carryforwards | 124.4 | 106.4 | |||||
Other | 29.7 | 37.1 | |||||
291.2 | 267.4 | ||||||
Valuation allowance | (105.8 | ) | (79.6 | ) | |||
Total deferred tax assets | 185.4 | 187.8 | |||||
Deferred Tax Liabilities: | |||||||
Tax-deductible goodwill | (27.7 | ) | (23.2 | ) | |||
Property, plant and equipment | (13.6 | ) | (14.4 | ) | |||
Unremitted earnings of foreign subsidiaries | (16.2 | ) | (20.2 | ) | |||
Other | (8.9 | ) | (17.7 | ) | |||
Total deferred tax liabilities | (66.4 | ) | (75.5 | ) | |||
Net deferred tax assets | $ | 119.0 | $ | 112.3 | |||
Reported As: | |||||||
Deferred tax assets | $ | 138.8 | $ | 136.8 | |||
Deferred tax liabilities (included in other long-term liabilities) | (19.8 | ) | (24.5 | ) | |||
Net deferred tax assets | $ | 119.0 | $ | 112.3 | |||
The Company has not provided for U.S. federal income and foreign withholding taxes on $2,176.9 million of cumulative undistributed earnings of non-U.S. subsidiaries as of September 29, 2017. Such earnings are intended to be reinvested in the non-U.S. subsidiaries for an indefinite period of time. If such earnings were not considered to be reinvested indefinitely, an additional deferred tax liability of approximately $573.8 million would be provided.
The Company has federal net operating loss carryforwards of approximately $9.6 million expiring between 2018 and 2031. The federal net operating loss carryforwards are subject to an annual limitation of approximately $1.1 million per year. The Company has state net operating loss carryforwards of $7.2 million expiring between 2018 and 2032. The Company has foreign net operating loss carryforwards of $382.8 million with an indefinite life. Of this amount, $21.1 million is unavailable to the Company under local loss utilization rules.
The valuation allowance relates primarily to net operating losses in certain foreign jurisdictions where, based on the weight of available evidence, it is more likely than not that the tax benefit of the net operating losses will not be realized. The valuation allowance increased by $26.2 million, $9.9 million and $2.2 million in fiscal years 2017, 2016 and 2015, respectively.
Income taxes paid were as follows:
Fiscal Years | ||||||||||||
(In millions) | 2017 | 2016 | 2015 | |||||||||
Federal income taxes paid, net | $ | 62.0 | $ | 78.3 | $ | 57.1 | ||||||
State, income taxes paid, net | 5.0 | 5.0 | 7.2 | |||||||||
Foreign income taxes paid, net | 77.1 | 72.6 | 55.5 | |||||||||
Total income taxes paid, net | $ | 144.1 | $ | 155.9 | $ | 119.8 | ||||||
111
The Company accounts for uncertainty in income taxes following a two-step approach for recognizing and measuring uncertain tax positions. The first step is to evaluate the tax position for recognition by determining whether the weight of available evidence indicates that it is more likely than not that, based on the technical merits, the position will be sustained on audit, including resolution of related appeals or litigation processes, if any. The second step is to measure the tax benefit as the largest amount that is more than 50% likely of being realized upon settlement.
Changes in the Company’s unrecognized tax benefits were as follows:
Fiscal Years | ||||||||||||
(In millions) | 2017 | 2016 | 2015 | |||||||||
Unrecognized tax benefits balance–beginning of fiscal year | $ | 40.7 | $ | 39.5 | $ | 49.6 | ||||||
Additions based on tax positions related to a prior year | 1.4 | 0.6 | — | |||||||||
Reductions based on tax positions related to a prior year | (0.3 | ) | (0.8 | ) | (9.9 | ) | ||||||
Additions based on tax positions related to the current year | 5.8 | 6.6 | 5.7 | |||||||||
Settlements | — | — | — | |||||||||
Reductions resulting from the expiration of the applicable statute of limitations | (4.9 | ) | (5.2 | ) | (5.9 | ) | ||||||
Unrecognized tax benefits balance–end of fiscal year | $ | 42.7 | $ | 40.7 | $ | 39.5 | ||||||
As of September 29, 2017, the total amount of gross unrecognized tax benefits was $42.7 million. Of this amount, $36.6 million would affect the effective tax rate if recognized. The difference would be offset by changes to deferred tax assets and liabilities.
The Company includes interest and penalties related to income taxes within taxes on earnings on the Consolidated Statements of Earnings. As of September 29, 2017, the Company had accrued $8.9 million for the payment of interest and penalties related to unrecognized tax benefits. During fiscal year 2017, a net expense of $0.9 million related to interest and penalties was included in taxes on earnings in the Consolidated Statements of Earnings. As of September 30, 2016, the Company had accrued $8.0 million for the payment of interest and penalties related to unrecognized tax benefits. During fiscal year 2016, a net benefit of $0.8 million related to interest and penalties was included in taxes on earnings in the Consolidated Statements of Earnings.
The Company files U.S. federal, U.S. state, and foreign tax returns. The Company’s U.S. federal tax returns are generally no longer subject to tax examinations for years prior to 2014. The Company has significant operations in Switzerland. The Company’s Swiss tax returns are generally no longer subject to tax examinations for years prior to 2013. For U.S. states and other foreign tax returns, the Company is generally no longer subject to tax examinations for years prior to 2007.
15. BUSINESS COMBINATIONS
The Company did not have any business combinations in fiscal year 2017.
Business Combination in Fiscal Year 2016
Candela
In September 2016, the Company closed the acquisition of the radiotherapy business of Candela sp. z o.o. ("Candela"), a distributor of Varian's radiotherapy equipment in Poland. The Company integrated the acquired Candela business into its Oncology Systems reporting unit to strengthen its market position in Poland.
The following table presents the total purchase consideration:
(In millions) | Purchase Consideration | ||
Cash paid | $ | 13.0 | |
Net non-cash assets transferred (1) | 21.7 | ||
Escrow payable | 0.5 | ||
Total purchase consideration | $ | 35.2 | |
(1) | Primarily comprised of accounts receivable. |
112
The following table summarizes the purchase price allocation:
(In millions) | Fair Value | ||
Net assumed liabilities | $ | (1.1 | ) |
Finite-lived intangible assets with a weighted average useful life of 6.2 years | 24.9 | ||
Goodwill | 11.4 | ||
Net assets acquired | $ | 35.2 | |
Business Combinations in Fiscal Year 2015
In September 2015, the Company purchased certain assets comprising a business from a sole proprietor for treatment planning software tools that will enhance both planning efficiency and treatment plan quality and allow oncologists to quickly adjust their intended dose distributions ahead of the treatment planning process. Through the acquisition, the Company also entered into a consulting agreement with the sole proprietor. The acquired assets were integrated into the Company's Oncology Systems reporting unit. The Company paid a total of $27.0 million in cash for all of the assets. The following table summarizes the purchase price allocation:
(In millions) | Fair Value | ||
Finite-lived intangible assets with a weighted average useful life of 8.3 years | $ | 8.3 | |
Indefinite-lived intangible assets — IPR&D | 8.8 | ||
Goodwill | 9.9 | ||
Net assets acquired | $ | 27.0 | |
Other information
All acquisitions listed above were accounted for as business combinations. Total transaction costs related to the Company’s acquisitions incurred during fiscal years 2017, 2016 and 2015 were $1.7 million, $3.1 million, and $0.8 million, respectively. These transaction costs were expensed as incurred in selling, general and administrative expenses in the Consolidated Statements of Earnings.
The goodwill generated from the Company’s acquisitions completed is primarily attributable to expected synergies. The goodwill is deductible for income tax purposes for all acquisitions except Candela. The Consolidated Financial Statements include the operating results of each acquisition from the date of acquisition. Pro forma results of operations for the acquisitions completed during the fiscal years presented have not been presented, because the effects of the acquisitions, individually and in the aggregate, were not material to the Company’s financial results.
113
16. VPT LOANS AND SECURITIES
The following table lists the Company's outstanding loans and commitments for funding development and construction of various proton therapy centers:
September 29, 2017 | September 30, 2016 | ||||||||||||||
(In millions) | Balance | Commitment | Balance | Commitment | |||||||||||
Notes receivable and senior secured debt: | |||||||||||||||
MPTC loans (1) | $ | 60.1 | $ | — | $ | 40.7 | $ | 11.4 | |||||||
NYPC loan (1) | 18.5 | — | 18.5 | — | |||||||||||
RPTC senior secured debt (2) | 25.4 | — | — | — | |||||||||||
CPTC DIP loan (1) | 5.1 | 2.2 | — | — | |||||||||||
PI loan (1) | 3.0 | — | — | — | |||||||||||
$ | 112.1 | $ | 2.2 | $ | 59.2 | $ | 11.4 | ||||||||
Available-for-sale securities: | |||||||||||||||
Original CPTC loans (3) | $ | 47.4 | $ | — | $ | 95.3 | $ | 1.1 | |||||||
DRTC securities (1) | 8.0 | — | — | — | |||||||||||
GPTC securities (1) | 4.4 | 11.8 | — | — | |||||||||||
$ | 59.8 | $ | 11.8 | $ | 95.3 | $ | 1.1 | ||||||||
(1) | Included in other assets on the Company's Consolidated Balance Sheets. |
(2) | Included in prepaid and other current assets on the Company's Consolidated Balance Sheets. |
(3) | Included in other assets at September 29, 2017 and in short-term investments at September 30, 2016, on the Company's Consolidated Balance Sheets. |
Rinecker Proton Therapy Center ("RPTC") Senior Secured Debt
In July 2017, the Company purchased the outstanding senior secured debt related to the RPTC in Munich, Germany for 21.5 million Euros or $24.5 million. By purchasing the senior secured debt, the Company has a right to 89 million Euros in claims against all of RPTC's assets. In September 2017, the management of RPTC filed for bankruptcy in Germany. As of September 29, 2017, preliminary insolvency proceedings have not been finalized, but the Company expects the insolvency proceedings to be finalized within the next twelve months. Upon finalization of bankruptcy proceedings, the Company believes it is probable it will recover its outstanding senior secured debt balance and accounts receivable, net.
As of September 29, 2017 and September 30, 2016, the Company also had $4.5 million and $4.8 million, respectively, in accounts receivable, net for RPTC, which does not include any unbilled accounts receivable.
Georgia Proton Therapy Center ("GPTC") Security
In July 2017, the Company committed to purchase up to $16.1 million in Senior Capital Appreciation Bonds ("Senior Bonds") from the Atlanta Development Authority, which is financing the GPTC. In July 2017, the Company purchased $4.3 million of the Senior Bonds in July 2017 that carry an interest rate of 8.0% per annum with interest accruing up to the principal amount of $6.6 million until January 1, 2023 and then will pay cash interest semi-annually. The Company will purchase the remaining commitment in July 2018. The Company is scheduled based upon the original terms to start receiving annual principal payments on the Senior Bonds beginning on January 1, 2024. The Senior Bonds will mature on January 1, 2028.
Delray Radiation Therapy Center ("DRTC") Securities and Loan
In April 2017, the Company purchased $8.0 million in Subordinate Bonds from the Public Finance Authority which is financing the DRTC. The Subordinate Bonds carry an interest rate of 8.5% and pay interest semi-annually. The Company is scheduled based upon the original terms to start receiving annual principal payments on the Subordinate Bonds beginning on November 1, 2021. The Subordinate Bonds will mature on November 1, 2046. In addition to the purchase of the Subordinate Bonds, the Company also loaned $3.0 million to Proton International LLC ("PI") to allow PI to purchase $3.0 million in Subordinate Bonds from the Public Finance Authority. The loan to PI carries an interest rate of 8.5% per annum, paid semi-
114
annually and matures on April 30, 2022, subject to early repayment as proceeds are received by PI from the bonds purchased, and is secured by the related bonds.
New York Proton Center ("NYPC") Loan
In July 2015, the Company committed to loan up to $91.5 million to MM Proton I, LLC in connection with a purchase agreement to supply a proton system to equip the NYPC. The commitment included a $73.0 million “Senior First Lien Loan” with a six-year term at 9.0% interest and an $18.5 million “Subordinate Loan” with a six-and-a-half-year term at up to 13.5% interest. The principal balance and accrued interest on the Subordinate Loan are due in full on the maturity date. The Company's entire commitment of the Subordinate Loan was drawn down in fiscal year 2015.
In June 2016, the Company assigned to Deutsche Bank AG ("Deutsche Bank") its entire $73.0 million Senior First Lien Loan commitment. The Company had funded $10.5 million in aggregate principal amount of Senior First Lien Loan commitments at the date of assignment. The total consideration paid by Deutsche Bank to the Company in consideration for the assignment was approximately $8.3 million in cash, representing the funded portion, less a discount of 3.0% of the Company's total Senior First Lien Loan commitment, both funded and unfunded. The Company recorded a $2.2 million impairment charge associated with the sale of the loan in the Consolidated Statements of Earnings in fiscal year 2016.
In addition to the outstanding loan, the Company had $13.3 million and $17.4 million as of September 29, 2017 and September 30, 2016, respectively, in accounts receivable, which included $1.3 million and $5.4 million in unbilled accounts receivable as of September 29, 2017 and September 30, 2016, respectively, from NYPC.
Maryland Proton Therapy Center ("MPTC") Loans
In May 2015, the Company committed to loan up to $35.0 million to MPTC. A total of $12.2 million (consisting of $10.0 million principal amount and $2.2 million in accrued interest) of a previously existing loan was rolled over into the loan commitment with the remaining $22.8 million funded in two equal amounts of $11.4 million each in fiscal year 2016 and fiscal year 2017. Varian's lending is in the form of a subordinated loan that is due, with accrued interest, in three annual payments from 2020 to 2022. The interest on the loan accrues at 12.0%. In addition, the Company had previously entered into an agreement with MPTC to supply it with a proton system, which included a deferral of up to $25 million of equipment payments when triggered by achievement of delivery milestones under the contract. As of September 29, 2017, the Company had recorded $25.1 million as long-term notes receivable related to this deferred payment arrangement. The notes receivable carry an interest rate of 15.0% and are due September 30, 2018.
As of September 29, 2017, the Company had zero net accounts receivable from MPTC. As of September 30, 2016, the Company had recorded $9.2 million in accounts receivable from MPTC, which included $7.1 million in unbilled accounts receivable.
CPTC Loans
In September 2011, ORIX and the Company committed to loan up to $165.3 million ("Tranche A loan") to CPTC to fund the development, construction and initial operations of the Scripps Proton Therapy Center in San Diego, California. ORIX is the loan agent for this facility and, along with CPTC and Scripps, has budgetary approval authority for the Scripps Proton Therapy Center. The Company’s maximum loan commitment under the Tranche A loan was $115.3 million. In June 2014, the Company, through its Swiss subsidiary, entered into a series of agreements, pursuant to which J.P. Morgan assumed $45.0 million of the Company’s original maximum commitment of $115.3 million, reducing the Company’s maximum commitment under the Tranche A loan to $70.3 million. Pursuant to these agreements, J.P. Morgan purchased $38.1 million of the Company’s outstanding Tranche A loan at par value. Through these agreements, the Company’s Swiss subsidiary also increased its individual loan commitment by $10.0 million (“Tranche B loan”). The Tranche B loan is subordinated to the Tranche A loan in the event of default, but otherwise has the same terms as the Tranche A loan. In November 2015, ORIX, J.P. Morgan and the Company (collectively the “Lenders”) and CPTC entered into a forbearance agreement whereby the lenders agreed not to enforce their rights to principal and interest payments until April 2017, subject to CPTC maintaining certain covenants and achieving certain targets, with additional extensions through September 2017 based on hitting additional targets largely around patient volume and cash flow. In connection with the forbearance agreement the Lenders agreed to make available up to an additional $9.7 million of loan proceeds (based on their pro-rata share of the existing loan) with terms similar to the Tranche A loan for additional working capital needs; the Company's proportionate share of this commitment was $4.4 million ("Tranche C loan"). The Tranche A, Tranche B, and Tranche C loans are collectively, referred to as the “Original CPTC Loans.” No amounts are currently available for drawdown under the Original CPTC Loans.
115
As of December 30, 2016, even though patient volumes continued to increase, CPTC was not in compliance with one of the patient volume covenants in the forbearance agreement, which would allow the Lenders to cease funding under the Tranche C loan and terminate the forbearance agreement. In January 2017, the Company was informed of actions taken by CPTC and the loan agent, including CPTC obtaining shareholder consents for voluntary bankruptcy filing and the loan agent deciding that no additional funding would be available outside of a bankruptcy process. As a result of this information and the Company’s analysis that these actions would likely lead to insolvency or bankruptcy proceedings at CPTC, the Company determined that it was appropriate to record a $38.3 million impairment, as determined by the discounted cash flow model using a single best estimate methodology, of its Original CPTC Loans on the Consolidated Statements of Earnings in the first quarter of fiscal year 2017. As a result of this impairment, the Original CPTC Loans were written down to their estimated fair value of $60.0 million and reclassified from short-term investments to other assets on the Company's Consolidated Balance Sheet because the Company does not expect to collect or sell all or a portion of these loans in the next twelve months.
In March 2017, CPTC filed for bankruptcy and concurrently entered into a Debtor-in-Possession facility (the "DIP Facility") with the Lenders for up to $16.0 million of additional financing during the bankruptcy process. The Company's pro-rata share of the DIP Facility is $7.3 million. At September 29, 2017, the Company's remaining commitment under the DIP Facility is expected to be drawn down over the next 12 months. The DIP Facility carries an interest rate at the London Interbank Offer Rate (“LIBOR”) plus 9.0% per annum and has a senior secured position ahead of the Original CPTC Loans.
Between April 2017 and August 2017, the Company did not become aware of any new information that warranted an impairment assessment. In September 2017, the Lenders and Scripps signed a Transition Agreement to transition the operations of the center from Scripps to a new operator. Based on the terms of the Transition Agreement, a slower projected growth in patient volume, an increase in additional projected capital needs and the Company's analysis, the Company determined that an additional $13.1 million impairment charge was deemed appropriate on its Original CPTC Loans and was recorded on the Consolidated Statements of Earnings in the fourth quarter of fiscal year 2017. Based on the most current available financial and operational information, the Company believes that recoverability of the entire $47.4 million of amortized cost of its Original CPTC Loans is probable.
ORIX has the option to purchase the Company's share of the Original CPTC Loans at par. The Original CPTC Loans meet the definition of a debt security and therefore are accounted for as available-for-sale securities and recorded at fair value as of September 29, 2017 and September 30, 2016. The Original CPTC Loans are collateralized by all of the assets of the Scripps Proton Therapy Center, subordinated to the DIP Facility. The Original CPTC Loans mature in September 2017 and bear interest at the LIBOR plus 7.0% per annum with a minimum interest rate of 9.0% per annum. Interest only payments on the Original CPTC Loans were due monthly in arrears until January 1, 2015, at which time monthly payments based on amortization of the principal balance over a 15-year period at the above mentioned interest rate become due and payable. To date, no amortizing principal payments have been made.
In the first quarter of fiscal year 2017, the Company reserved the entire accounts receivable balance, which included $17.2 million in unbilled accounts receivable, from CPTC and recorded an allowance for doubtful accounts of $34.2 million due to the credit-related issues referred to above. The expense associated with the allowance for doubtful accounts was included in selling, general and administrative expense on the Consolidated Statements of Earnings. As of September 30, 2016, the Company had recorded $32.6 million in accounts receivable, net, from CPTC, which included $17.2 million in unbilled accounts receivable.
The Company has determined that MM Proton I, LLC, MPTC, CPTC and RPTC are variable interest entities and that the Company holds a significant variable interest of each of the entities through its participation in the loan facilities and its agreements to supply and service the proton therapy equipment. The Company has concluded that it is not the primary beneficiary of any of these entities. The Company has no voting rights, has no approval authority or veto rights for these centers' budget, and does not have the power to direct patient recruitment, clinical operations and management of these Centers, which the Company believes are the matters that most significantly affect their economic performance. The Company’s exposure to loss as a result of its involvement with MM Proton I, LLC, MPTC, CPTC and RPTC is limited to the carrying amounts of the above mentioned assets on its Consolidated Balance Sheets.
17. SEGMENT INFORMATION
In fiscal year 2017, the Company's VPT business met the criteria of a reportable operating segment and the Company now has two reportable operating segments: Oncology Systems and VPT. The Company's former Imaging Components reportable segment was part of the Distribution of Varex and is included in discontinued operations. In the first quarter of fiscal year 2017, the Company's Ginzton Technology Center ("GTC") previously reflected in the “Other” category, was dissolved and absorbed primarily into the Oncology Systems and also the Company's former Imaging Components businesses and is no longer a
116
separate business. This change did not result in any recast of prior period financial information because GTC operating results were not material. Prior to the first quarter of 2017, the GTC business was reflected in the “Other” category because the operating segment did not meet the criteria of a reportable operating segment. The operating segments were determined based on how the Company’s Chief Executive Officer, its Chief Operating Decision Maker (“CODM”), views and evaluates the Company’s operations. The CODM allocates resources to and evaluates the financial performance of each operating segment primarily based on operating earnings.
Description of Segments
The Oncology Systems segment designs, manufactures, sells and services hardware and software products for treating cancer with conventional radiation therapy, and advanced treatments such as fixed field intensity-modulated radiation therapy (“IMRT”), image-guided radiation therapy (“IGRT”), VMAT, stereotactic radiosurgery (“SRS”), stereotactic body radiotherapy (“SBRT”) and brachytherapy. Products include linear accelerators, brachytherapy afterloaders, treatment simulation and verification equipment and accessories; as well as information management, treatment planning and image processing, clinical knowledge exchange, patient care management, decision-making support and practice management software. Oncology Systems’ products enable radiation oncology departments in hospitals and clinics to perform conventional radiotherapy treatments and offer advanced treatments such as IMRT, IGRT, VMAT, SRS and SBRT, as well as to treat patients using brachytherapy techniques, which involve temporarily implanting radioactive sources. The Company’s Oncology Systems products are also used by neurosurgeons to perform stereotactic radiosurgery. Oncology Systems’ customers worldwide include university research and community hospitals, private and governmental institutions, healthcare agencies, physicians’ offices and cancer care clinics.
The VPT segment develops, designs, manufactures, sells and services products and systems for delivering proton therapy, a form of external beam radiotherapy using proton beams for the treatment of cancer.
Accordingly, the following information is provided for purposes of achieving an understanding of operations, but may not be indicative of the financial results of the reported segments were they independent organizations. In addition, comparisons of the Company’s operations to similar operations of other companies may not be meaningful.
Change in Segment Measure of Earnings and Loss
During the second quarter of 2017, the Company changed its methodology for how corporate costs are allocated to its operating segments. Based on the relative revenues of Oncology Systems and VPT, the Company allocates these costs excluding certain corporate related costs, transactions or adjustments that the Company's CODM considers to be non-operational, such as restructuring and impairment charges, significant litigation charges or benefits and legal costs, acquisition-related expenses and benefits. Although the Company excludes these amounts from segment operating earnings and loss, they are included in the consolidated operating earnings and included in the reconciliation below. Prior period segment information has been recast to conform to the 2017 presentation.
Segment Data
Revenues | |||||||||||
Fiscal Years | |||||||||||
(In millions) | 2017 | 2016 | 2015 | ||||||||
Oncology Systems: | |||||||||||
Product | $ | 1,383.0 | $ | 1,430.3 | $ | 1,359.2 | |||||
Service | 1,102.7 | 1,027.7 | 987.6 | ||||||||
Total Oncology Systems | 2,485.7 | 2,458.0 | 2,346.8 | ||||||||
Varian Particle Therapy: | |||||||||||
Product | 172.5 | 153.1 | 137.9 | ||||||||
Service | 10.0 | 9.5 | 5.6 | ||||||||
Total Varian Particle Therapy | 182.5 | 162.6 | 143.5 | ||||||||
Total reportable segments | 2,668.2 | 2,620.6 | 2,490.3 | ||||||||
Other | — | 0.5 | 0.4 | ||||||||
Total Company | $ | 2,668.2 | $ | 2,621.1 | $ | 2,490.7 | |||||
117
Operating Earnings | |||||||||||
Fiscal Years | |||||||||||
(In millions) | 2017 | 2016 | 2015 | ||||||||
Oncology Systems | $ | 520.7 | $ | 518.6 | $ | 447.4 | |||||
Varian Particle Therapy | (95.7 | ) | (44.6 | ) | (26.5 | ) | |||||
Total reportable segments | 425.0 | 474.0 | 420.9 | ||||||||
Other | — | (5.6 | ) | (6.2 | ) | ||||||
Corporate | (83.1 | ) | (33.4 | ) | (19.0 | ) | |||||
Total Company | $ | 341.9 | $ | 435.0 | $ | 395.7 | |||||
Depreciation & Amortization | Total Assets | |||||||||||||||||||||||
Fiscal Years | Fiscal Years | |||||||||||||||||||||||
(In millions) | 2017 | 2016 | 2015 | 2017 | 2016 | 2015 | ||||||||||||||||||
Oncology Systems | $ | 39.4 | $ | 28.5 | $ | 21.8 | $ | 1,452.7 | $ | 1,491.2 | $ | 1,411.3 | ||||||||||||
Varian Particle Therapy | 6.1 | 6.8 | 4.8 | 354.4 | 367.8 | 294.0 | ||||||||||||||||||
Total reportable segments | 45.5 | 35.3 | 26.6 | 1,807.1 | 1,859.0 | 1,705.3 | ||||||||||||||||||
Other | — | 0.2 | 0.2 | — | 2.1 | 2.2 | ||||||||||||||||||
Corporate | 24.8 | 28.3 | 28.5 | 1,361.2 | 1,325.2 | 1,275.9 | ||||||||||||||||||
Discontinued operations | 6.6 | 16.0 | 13.2 | 11.1 | 628.5 | 595.3 | ||||||||||||||||||
Total Company | $ | 76.9 | $ | 79.8 | $ | 68.5 | $ | 3,179.4 | $ | 3,814.8 | $ | 3,578.7 | ||||||||||||
The reconciliation of segment operating earnings (losses) to the Company’s earnings from continuing operations before taxes was as follows:
Fiscal Years | ||||||||||||
(In millions) | 2017 | 2016 | 2015 | |||||||||
Oncology Systems | $ | 520.7 | $ | 518.6 | $ | 447.4 | ||||||
Varian Particle Therapy | (95.7 | ) | (44.6 | ) | (26.5 | ) | ||||||
Total reportable segments | 425.0 | 474.0 | 420.9 | |||||||||
Other | — | (5.6 | ) | (6.2 | ) | |||||||
Corporate | (83.1 | ) | (33.4 | ) | (19.0 | ) | ||||||
Interest income, net | 2.9 | 5.6 | 5.6 | |||||||||
Total earnings from continuing operations before taxes | $ | 344.8 | $ | 440.6 | $ | 401.3 | ||||||
Geographic Information
Revenues | Property, plant and equipment, net | |||||||||||||||||||||||
Fiscal Years | Fiscal Years | |||||||||||||||||||||||
(In millions) | 2017 | 2016 | 2015 | 2017 | 2016 | 2015 | ||||||||||||||||||
United States | $ | 1,237.0 | $ | 1,161.7 | $ | 1,212.3 | $ | 163.8 | $ | 177.0 | $ | 194.8 | ||||||||||||
International | 1,431.2 | 1,459.4 | 1,278.4 | 91.5 | 81.6 | 78.3 | ||||||||||||||||||
Total Company | $ | 2,668.2 | $ | 2,621.1 | $ | 2,490.7 | $ | 255.3 | $ | 258.6 | $ | 273.1 | ||||||||||||
The Company operates various manufacturing and marketing operations outside the United States. Allocation between domestic and foreign revenues is based on the final destination of products sold. No country outside the United States represented 10% or more of the Company’s total revenues and property, plant and equipment, net, in fiscal years 2017, 2016 and 2015, respectively. Intercompany and intracompany profits are eliminated in consolidation.
118
18. QUARTERLY FINANCIAL DATA (UNAUDITED)
Fiscal Year 2017 | ||||||||||||||||||||
(In millions, except per share amounts) | First Quarter (1) | Second Quarter | Third Quarter | Fourth Quarter (2) | Total Year | |||||||||||||||
Total revenues | $ | 611.8 | $ | 655.0 | $ | 662.4 | $ | 739.0 | $ | 2,668.2 | ||||||||||
Gross margin | $ | 275.7 | $ | 275.3 | $ | 293.3 | $ | 311.3 | $ | 1,155.6 | ||||||||||
Net earnings from continuing operations | $ | 14.5 | $ | 69.3 | $ | 90.6 | $ | 82.7 | $ | 257.1 | ||||||||||
Net earnings (loss) from discontinued operations | $ | 6.5 | $ | (13.3 | ) | $ | — | $ | — | $ | (6.8 | ) | ||||||||
Net earnings attributable to Varian | $ | 20.4 | $ | 56.1 | $ | 90.4 | $ | 82.7 | $ | 249.6 | ||||||||||
Net earnings (loss) per share attributable to Varian – basic: | ||||||||||||||||||||
Continuing operations | $ | 0.15 | $ | 0.75 | $ | 0.99 | $ | 0.90 | $ | 2.78 | ||||||||||
Discontinued operations | $ | 0.07 | $ | (0.15 | ) | $ | — | $ | — | $ | (0.08 | ) | ||||||||
Net earnings per share - basic | $ | 0.22 | $ | 0.60 | $ | 0.99 | $ | 0.90 | $ | 2.70 | ||||||||||
Net earnings (loss) per share attributable to Varian – diluted: | ||||||||||||||||||||
Continuing operations | $ | 0.15 | $ | 0.74 | $ | 0.98 | $ | 0.89 | $ | 2.75 | ||||||||||
Discontinued operations | $ | 0.07 | $ | (0.14 | ) | $ | — | $ | — | $ | (0.07 | ) | ||||||||
Net earnings per share - diluted | $ | 0.22 | $ | 0.60 | $ | 0.98 | $ | 0.89 | $ | 2.68 | ||||||||||
Fiscal Year 2016 | ||||||||||||||||||||
(In millions, except per share amounts) | First Quarter | Second Quarter | Third Quarter | Fourth Quarter | Total Year | |||||||||||||||
Total revenues | $ | 615.8 | $ | 615.2 | $ | 642.9 | $ | 747.2 | $ | 2,621.1 | ||||||||||
Gross margin | $ | 252.5 | $ | 258.1 | $ | 283.5 | $ | 318.8 | $ | 1,112.9 | ||||||||||
Net earnings from continuing operations | $ | 71.9 | $ | 77.2 | $ | 81.9 | $ | 94.3 | $ | 325.3 | ||||||||||
Net earnings from discontinued operations | $ | 17.1 | $ | 19.8 | $ | 17.0 | $ | 23.5 | $ | 77.4 | ||||||||||
Net earnings attributable to Varian | $ | 89.0 | $ | 97.0 | $ | 98.8 | $ | 117.5 | $ | 402.3 | ||||||||||
Net earnings per share attributable to Varian – basic: | ||||||||||||||||||||
Continuing operations | $ | 0.74 | $ | 0.81 | $ | 0.86 | $ | 1.00 | $ | 3.41 | ||||||||||
Discontinued operations | $ | 0.18 | $ | 0.20 | $ | 0.18 | $ | 0.25 | $ | 0.81 | ||||||||||
Net earnings per share - basic | $ | 0.92 | $ | 1.01 | $ | 1.04 | $ | 1.25 | $ | 4.22 | ||||||||||
Net earnings per share attributable to Varian – diluted: | ||||||||||||||||||||
Continuing operations | $ | 0.74 | $ | 0.80 | $ | 0.86 | $ | 1.00 | $ | 3.39 | ||||||||||
Discontinued operations | $ | 0.17 | $ | 0.21 | $ | 0.18 | $ | 0.24 | $ | 0.80 | ||||||||||
Net earnings per share - diluted | $ | 0.91 | $ | 1.01 | $ | 1.04 | $ | 1.24 | $ | 4.19 | ||||||||||
(1) | In the first quarter of fiscal year 2017, net earnings from continued operations includes a $38.3 million impairment charge related to its Original CPTC Loans and a $37.8 million allowance for doubtful accounts from CPTC and another proton center. |
(2) | In the fourth quarter of fiscal year 2017, net earnings from continued operations includes a $13.1 million impairment charge related to its Original CPTC loans. |
119
REPORT OF MANAGEMENT ON INTERNAL CONTROL
OVER FINANCIAL REPORTING
Management of Varian Medical Systems, Inc. and its subsidiaries (the “Company”) is responsible for establishing and maintaining adequate internal control over financial reporting as defined in Rules 13a-15(f) and 15d-15(f) under the Securities Exchange Act of 1934. The Company’s internal control over financial reporting is designed to provide reasonable assurance regarding the reliability of financial reporting and the preparation of financial statements for external purposes in accordance with generally accepted accounting principles in the United States of America. Internal control over financial reporting includes those policies and procedures that: (i) pertain to the maintenance of records that, in reasonable detail, accurately and fairly reflect the transactions and dispositions of the assets of the company; (ii) provide reasonable assurance that transactions are recorded as necessary to permit preparation of financial statements in accordance with generally accepted accounting principles in the United States of America, and that receipts and expenditures of the Company are being made only in accordance with authorizations of management and directors of the Company; and (iii) provide reasonable assurance regarding prevention or timely detection of unauthorized acquisition, use or disposition of the company’s assets that could have a material effect on the consolidated financial statements.
Because of its inherent limitations, internal control over financial reporting may not prevent or detect misstatements. In addition, projections of any evaluation of effectiveness to future periods are subject to the risk that controls may become inadequate because of changes in conditions and that the degree of compliance with the policies or procedures may deteriorate.
Management assessed the effectiveness of the Company’s internal control over financial reporting as of September 29, 2017. In making this assessment, management used the criteria set forth in Internal Control-Integrated Framework (2013) issued by the Committee of Sponsoring Organizations of the Treadway Commission. Based on its assessment and those criteria, management concluded that the Company maintained effective internal control over financial reporting as of September 29, 2017. PricewaterhouseCoopers LLP has issued a report on the Company’s internal control over financial reporting as of September 29, 2017, which appears immediately after this report.
120
REPORT OF INDEPENDENT REGISTERED PUBLIC ACCOUNTING FIRM
To the Board of Directors and Stockholders of
Varian Medical Systems, Inc.:
In our opinion, the consolidated financial statements listed in the index appearing under Item 15(a)(1) present fairly, in all material respects, the financial position of Varian Medical Systems, Inc. and its subsidiaries as of September 29, 2017 and September 30, 2016, and the results of their operations and their cash flows for each of the three years in the period ended September 29, 2017 in conformity with accounting principles generally accepted in the United States of America. In addition, in our opinion, the financial statement schedule listed in the index appearing under Item 15(a)(2) presents fairly, in all material respects, the information set forth therein when read in conjunction with the related consolidated financial statements. Also in our opinion, the Company maintained, in all material respects, effective internal control over financial reporting as of September 29, 2017, based on criteria established in Internal Control - Integrated Framework (2013) issued by the Committee of Sponsoring Organizations of the Treadway Commission (COSO). The Company's management is responsible for these financial statements and financial statement schedule, for maintaining effective internal control over financial reporting and for its assessment of the effectiveness of internal control over financial reporting, included in the accompanying Report of Management on Internal Control over Financial Reporting. Our responsibility is to express opinions on these financial statements, on the financial statement schedule, and on the Company's internal control over financial reporting based on our integrated audits. We conducted our audits in accordance with the standards of the Public Company Accounting Oversight Board (United States). Those standards require that we plan and perform the audits to obtain reasonable assurance about whether the financial statements are free of material misstatement and whether effective internal control over financial reporting was maintained in all material respects. Our audits of the financial statements included examining, on a test basis, evidence supporting the amounts and disclosures in the financial statements, assessing the accounting principles used and significant estimates made by management, and evaluating the overall financial statement presentation. Our audit of internal control over financial reporting included obtaining an understanding of internal control over financial reporting, assessing the risk that a material weakness exists, and testing and evaluating the design and operating effectiveness of internal control based on the assessed risk. Our audits also included performing such other procedures as we considered necessary in the circumstances. We believe that our audits provide a reasonable basis for our opinions.
A company’s internal control over financial reporting is a process designed to provide reasonable assurance regarding the reliability of financial reporting and the preparation of financial statements for external purposes in accordance with generally accepted accounting principles. A company’s internal control over financial reporting includes those policies and procedures that (i) pertain to the maintenance of records that, in reasonable detail, accurately and fairly reflect the transactions and dispositions of the assets of the company; (ii) provide reasonable assurance that transactions are recorded as necessary to permit preparation of financial statements in accordance with generally accepted accounting principles, and that receipts and expenditures of the company are being made only in accordance with authorizations of management and directors of the company; and (iii) provide reasonable assurance regarding prevention or timely detection of unauthorized acquisition, use, or disposition of the company’s assets that could have a material effect on the financial statements.
Because of its inherent limitations, internal control over financial reporting may not prevent or detect misstatements. Also, projections of any evaluation of effectiveness to future periods are subject to the risk that controls may become inadequate because of changes in conditions, or that the degree of compliance with the policies or procedures may deteriorate.
/s/ PricewaterhouseCoopers LLP
San Jose, California
November 27, 2017
121
Item 9. Changes in and Disagreements With Accountants on Accounting and Financial Disclosure
None.
Item 9A. Controls and Procedures
(a) | Evaluation of disclosure controls and procedures. Based on the evaluation of our disclosure controls and procedures (as defined in the Rules 13a-15(e) and 15d-15(e) under the Exchange Act required by Exchange Act) Rules 13a-15(b) or 15d-15(b), our principal executive officer and principal financial officer have concluded that as of the end of the period covered by this report, our disclosure controls and procedures were effective to ensure that information required to be disclosed by the Company in reports that it files or submits under the Exchange Act is recorded, processed, summarized and reported within the time periods specified in SEC rules and forms, and include controls and procedures designed to ensure that information required to be disclosed by us in such reports is accumulated and communicated to our management, including the principal executive officer and principal financial officer, as appropriate, to allow timely decisions regarding required disclosure. |
(b) | Report of management on internal control over financial reporting. The information required to be furnished pursuant to this item is set forth under the caption “Report of Management on Internal Control over Financial Reporting” under Item 8, “Financial Statements and Supplementary Data” of this Annual Report on Form 10-K, and is incorporated here by reference. |
(c) | Changes in internal control over financial reporting. There were no changes in our internal control over financial reporting that occurred during our fourth fiscal quarter of fiscal year 2017 that have materially affected, or are reasonably likely to materially affect, our internal control over financial reporting. |
Item 9B. Other Information
None.
122
PART III
Item 10. Directors, Executive Officers and Corporate Governance
Directors and Executive Officers
The information required by this item with respect to our executive officers is set forth in Part I of this Annual Report on Form 10-K. The information required by this item with respect to our directors, our Audit Committee and its members, and audit committee financial expert is incorporated by reference from our definitive proxy statement for the 2018 Annual Meeting of Stockholders under the caption “Proposal One—Election of Directors.” The information required by this item with respect to compliance with Section 16(a) of the Exchange Act is incorporated by reference from our definitive proxy statement for the 2018 Annual Meeting of Stockholders under the caption “Stock Ownership—Section 16(a) Beneficial Ownership Reporting Compliance.”
Code of Conduct
We have adopted a Code of Conduct that applies to all of our executive officers and directors. The Code of Conduct is posted on our website. The Internet address for our website is http://www.varian.com, and the Code of Conduct may be found as follows:
1. | From our main web page, first click “Investors.” |
2. | Next click on “Corporate Governance” in the left hand navigation bar. |
3. | Finally, click on “Code of Conduct.” |
We intend to satisfy the disclosure requirements under Item 5.05(c) of Form 8-K regarding an amendment to, or waiver from, a provision of the Code of Conduct that applies to our principal executive officer, principal financial officer, principal accounting officer or controller or persons performing similar functions by posting such information on our website, at the address and location specified above.
Item 11. Executive Compensation
The information required by this item is incorporated by reference from our definitive proxy statement for the 2018 Annual Meeting of Stockholders under the caption “Compensation of the Named Executive Officers and Directors.”
Item 12. Security Ownership of Certain Beneficial Owners and Management and Related Stockholder Matters
Equity Compensation Plan Information
The following table provides information as of September 29, 2017 with respect to the shares of VMS common stock that may be issued under existing equity compensation plans.
A | B | C | ||||||||
(in millions, except price per share) | Number of securities to be issued upon exercise of outstanding options, warrants and rights | Weighted average exercise price of outstanding options, warrants and rights (1) | Number of securities remaining available for future issuance under equity compensation plans (excluding securities reflected in column A) | |||||||
Equity compensation plans approved by security holders | 3.2 | (2) | $ | 74.08 | 7.9 | (3) | ||||
Total | 3.2 | $ | 74.08 | 7.9 | ||||||
(1) | The weighted average exercise price does not take into account the shares issuable upon vesting of outstanding restricted stock units, deferred stock units and performance units, which have no exercise price. |
(2) | Consists of stock options, restricted stock units, deferred stock units and performance units granted under the Fourth Amended and Restated 2005 Omnibus Stock Plan (the “Fourth Amended 2005 Plan”). The shares available for grant limit is further adjusted to reflect a maximum payout of 1.75 shares that could be issued for each performance unit |
123
beginning in fiscal year 2016, 2.0 shares that could be issued for each performance unit granted in fiscal year 2015 and a maximum payout of 1.5 shares that could be issued for each performance unit granted prior to fiscal year 2015.
(3) | Includes 5.4 million shares available for future issuance under the 2010 Employee Stock Purchase Plan. |
For a description of the material features of the Fourth Amended 2005 Plan, see Note 12, "Employee Stock Plans" of the Notes to the Consolidated Financial Statements, which description is incorporated by reference.
The information required by this item with respect to the security ownership of certain beneficial owners and the security ownership of directors and executive officers is incorporated by reference from our definitive proxy statement for the 2018 Annual Meeting of Stockholders under the caption “Stock Ownership—Beneficial Ownership of Certain Stockholders, Directors and Executive Officers.”
Item 13. Certain Relationships and Related Transactions, and Director Independence
The information required by this item with respect to certain relationships and related transactions is incorporated by reference from our definitive proxy statement for the 2018 Annual Meeting of Stockholders under the caption “Certain Relationships and Related Transactions.” The information required by this item with respect to director and committee member independence is incorporated by reference from our definitive proxy statement for the 2018 Annual Meeting of Stockholders under the caption “Proposal One—Election of Directors.”
Item 14. Principal Accountant Fees and Services
The information required by this item is incorporated by reference from our definitive proxy statement for the 2018 Annual Meeting of Stockholders under the caption “Proposal Four—Ratification of the Appointment of Our Independent Registered Public Accounting Firm.”
124
PART IV
Item 15. Exhibits and Financial Statement Schedules
(a) | The following documents are filed as part of this report: |
(1) | Consolidated Financial Statements: |
•Consolidated Statements of Earnings
•Consolidated Statements of Comprehensive Earnings
•Consolidated Balance Sheets
•Consolidated Statements of Cash Flows
•Consolidated Statements of Equity
•Notes to the Consolidated Financial Statements
•Report of Independent Registered Public Accounting Firm
(2) | Consolidated Financial Statement Schedule: |
The following financial statement schedule of the Registrant and its subsidiaries for fiscal years 2017, 2016 and 2015 is filed as a part of this report and should be read in conjunction with the Consolidated Financial Statements of the Registrant and its subsidiaries:
Schedule | ||
II | Valuation and Qualifying Accounts | |
All other schedules are omitted because of the absence of conditions under which they are required or because the required information is given in the financial statements or the notes thereto.
(3) | Exhibits: |
The exhibits listed below are filed or incorporated by reference as part of this Form 10-K.
Exhibit Number | Description | |
2.1 | ||
2.2 | ||
3.1 | ||
3.2 | ||
4.1 | ||
10.1† | ||
10.2† | ||
10.3† | ||
125
Exhibit Number | Description | |
10.4† | ||
10.5† | ||
10.6 | RESERVED. | |
10.7 | ||
10.8 | ||
10.9 | ||
10.10† | ||
10.11† | ||
10.12† | ||
10.13† | ||
10.14† | ||
10.15 | RESERVED. | |
10.16† | ||
10.17† | ||
10.18† | ||
10.19† | ||
126
Exhibit Number | Description | |
10.20† | ||
10.21† | ||
10.22† | ||
10.23† | ||
10.24† | ||
10.25† | ||
10.26† | ||
10.27† | ||
10.28† | ||
10.29† | ||
10.30† | ||
10.31† | ||
10.32† | ||
10.33† | ||
127
Exhibit Number | Description | |
10.34† | ||
10.35† | ||
10.36 | ||
10.37 | ||
10.38 | ||
10.39 | ||
10.40 | ||
10.41 | ||
10.42++ | ||
10.43++ | ||
10.44++ | ||
10.45++ | ||
128
Exhibit Number | Description | |
10.46 | ||
. | ||
10.47† | ||
10.48 | ||
10.49 | ||
10.50 | ||
10.51 | ||
10.52 | ||
10.53† | ||
10.54† | ||
21* | ||
23* | ||
31.1* | ||
31.2* | ||
32.1* | ||
32.2* | ||
101.INS | XBRL Instance Document | |
101.SCH | XBRL Taxonomy Extension Schema Document | |
101.CAL | XBRL Taxonomy Extension Calculation Linkbase Document | |
101.DEF | XBRL Taxonomy Extension Definition Linkbase Document | |
101.LAB | XBRL Taxonomy Extension Label Linkbase Document | |
101.PRE | XBRL Taxonomy Extension Presentation Linkbase Document | |
129
† | Management contract or compensatory arrangement. |
* | Filed herewith |
++ | Confidential treatment has been granted as to certain portions of this exhibit pursuant to Rule 24b-2 of the Securities Exchange Act of 1934, as amended. |
130
SIGNATURES
Pursuant to the requirements of Section 13 or 15(d) of the Securities Exchange Act of 1934, the registrant has duly caused this report to be signed on its behalf by the undersigned, thereunto duly authorized.
Dated: November 27, 2017
VARIAN MEDICAL SYSTEMS, INC. | ||
By: | /s/ GARY E. BISCHOPING, JR. | |
Gary E. Bischoping, Jr. Senior Vice President and Chief Financial Officer | ||
Pursuant to the requirements of the Securities Exchange Act of 1934, this report has been signed below by the following persons on behalf of the registrant and in the capacities indicated.
Signature | Capacity | Date | ||
/s/ DOW R. WILSON | President and Chief Executive Officer and Director (Principal Executive Officer) | November 27, 2017 | ||
Dow R. Wilson | ||||
/s/ GARY E. BISCHOPING, JR. | Senior Vice President and Chief Financial Officer (Principal Financial Officer) | November 27, 2017 | ||
Gary E. Bischoping, Jr. | ||||
/s/ MAGNUS A. MOMSEN | Senior Vice President, Chief Accounting Officer and Corporate Controller (Principal Accounting Officer) | November 27, 2017 | ||
Magnus A. Momsen | ||||
/s/ R. ANDREW ECKERT | Chairman of the Board of Directors | November 27, 2017 | ||
R. Andrew Eckert | ||||
/s/ TIMOTHY E. GUERTIN | Vice Chairman of the Board | November 27, 2017 | ||
Timothy E. Guertin | ||||
/s/ JOSE BASELGA | Director | November 27, 2017 | ||
Jose Baselga | ||||
/s/ SUSAN L. BOSTROM | Director | November 27, 2017 | ||
Susan L. Bostrom | ||||
/s/ JUDY BRUNER | Director | November 27, 2017 | ||
Judy Bruner | ||||
/s/ JEAN-LUC BUTEL | Director | November 27, 2017 | ||
Jean-Luc Butel | ||||
/s/ REGINA E. DUGAN | Director | November 27, 2017 | ||
Regina E. Dugan | ||||
/s/ DAVID J. ILLINGWORTH | Director | November 27, 2017 | ||
David J. Illingworth | ||||
/s/ MARK R. LARET | Director | November 27, 2017 | ||
Mark R. Laret | ||||
131
Schedule II
VARIAN MEDICAL SYSTEMS, INC. AND SUBSIDIARIES
VALUATION AND QUALIFYING ACCOUNTS
Fiscal Year | Description | Balance at Beginning of Period | Charged to Bad Debt Expense | Write-offs Adjustments Charged to Allowance | Balance at End of Period | |||||||||||||
(In millions) | ||||||||||||||||||
2017 | Allowance for doubtful accounts receivable | $ | 24.2 | $ | 43.0 | $ | (4.1 | ) | $ | 63.1 | ||||||||
2016 | Allowance for doubtful accounts receivable | $ | 21.1 | $ | 3.4 | $ | (0.3 | ) | $ | 24.2 | ||||||||
2015 | Allowance for doubtful accounts receivable | $ | 20.2 | $ | 1.1 | $ | (0.2 | ) | $ | 21.1 | ||||||||
Fiscal Year | Description | Balance at Beginning of Period | Increases | Deductions | Balance at End of Period | |||||||||||||
(In millions) | ||||||||||||||||||
2017 | Valuation allowance for deferred tax assets | $ | 79.6 | $ | 26.2 | $ | — | $ | 105.8 | |||||||||
2016 | Valuation allowance for deferred tax assets | $ | 69.7 | $ | 12.2 | $ | (2.3 | ) | $ | 79.6 | ||||||||
2015 | Valuation allowance for deferred tax assets | $ | 67.5 | $ | 4.7 | $ | (2.5 | ) | $ | 69.7 | ||||||||
132