Attached files
| file | filename |
|---|---|
| EX-99.1 - EX-99.1 - KAPSTONE PAPER & PACKAGING CORP | a18-37058_1ex99d1.htm |
| 8-K - 8-K - KAPSTONE PAPER & PACKAGING CORP | a18-37058_18k.htm |
Forward-looking Statements The information in this presentation may contain certain forward-looking statements within the meaning of federal securities laws. These statements reflect management’s expectations regarding future events and operating performance. Risk Factors These forward-looking statements involve a number of risks and uncertainties. A list of the factors that could cause actual results to differ materially from those expressed in, or underlying, any forward-looking statements can be found in the Company’s filings with the Securities and Exchange Commission, such as its annual and quarterly reports. The Company disclaims any obligation to revise or update such statements to reflect the occurrence of events after the date of this presentation. Non-GAAP Financial Measures This presentation refers to non-U.S. GAAP financial information. A reconciliation of non-U.S. GAAP to U.S. GAAP financial measures is available at the end of the press release and on the company’s website at KapStonepaper.com under Investors. Forward-Looking Statements 2
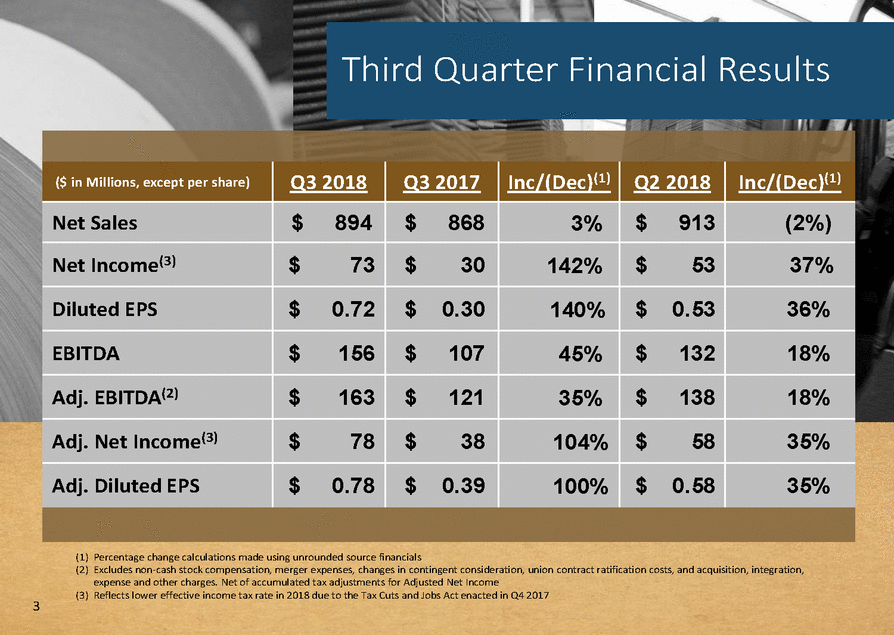
Third Quarter Financial Results (1) Percentage change calculations made using unrounded source financials (2) Excludes non-cash stock compensation, merger expenses, changes in contingent consideration, union contract ratification costs, and acquisition, integration, expense and other charges. Net of accumulated tax adjustments for Adjusted Net Income (3) Reflects lower effective income tax rate in 2018 due to the Tax Cuts and Jobs Act enacted in Q4 2017 3 ($ in Millions, except per share) Q3 2018 Q3 2017 Inc/(Dec)(1) Q2 2018 Inc/(Dec)(1) Net Sales $894 $868 3% $913 (2%) Net Income(3) $73 $30 142% $53 37% Diluted EPS $0.72 $0.30 140% $0.53 36% EBITDA $156 $107 45% $132 18% Adj. EBITDA(2) $163 $121 35% $138 18% Adj. Net Income(3) $78 $38 104% $58 35% Adj. Diluted EPS $0.78 $0.39 100% $0.58 35%
Q3 2018 Compared to Q3 2017 Higher Prices Drive Earnings Growth Price/mix was favorably impacted by higher average mill selling prices, up $58 per ton reflecting: Higher containerboard and specialty paper prices of $27 million Favorable product mix of $1 million Higher corrugated products prices of $10 million and improved product mix of $3 million Sales volume down 33,000 tons in Paper and Packaging segment driven by lower production due to hurricane Florence and the Longview mill’s planned maintenance outage Distribution segment sales up $10 million mainly on price. Adjusted EBITDA up $2 million Deflation includes $14 million of lower OCC costs, offset by $12 million of higher virgin fiber and other costs Hurricane Florence had an impact of $6 million as the Charleston mill was idled for five days Other reflects $9 million of productivity and lower spending, partially offset by $7 million of higher incentives 4 $868 $41 $24 $10 $894 Net Sales $ in Millions $121 $41 $3 $2 $2 $6 $4 $2 $163 $ in Millions Adjusted EBITDA

Q3 2018 Compared to Q2 2018 Higher Prices, Productivity and Lower Outage Costs Increase Earnings 5 Price/mix was favorably impacted by higher average mill selling prices, up $20 per ton reflecting: Higher containerboard and specialty paper prices of $4 million Higher corrugated products prices of $6 million Paper and Packaging segment sales volume down $24 million, or 41,000 tons. Distribution segment sales down $5 million due to seasonality resulting in $2 million of lower Adjusted EBITDA Planned outages includes Q2’s Roanoke Rapids annual outage and completion of the Charleston boiler upgrade, partially offset by Q3 Longview outage (last performed in 2013) Hurricane Florence reflects the impact of idling the Charleston mill for five days Other reflects higher productivity and lower spending $913 $10 $24 $5 $894 Net Sales $ in Millions $138 $10 $4 $2 $12 $6 $15 $163 $ in Millions Adjusted EBITDA

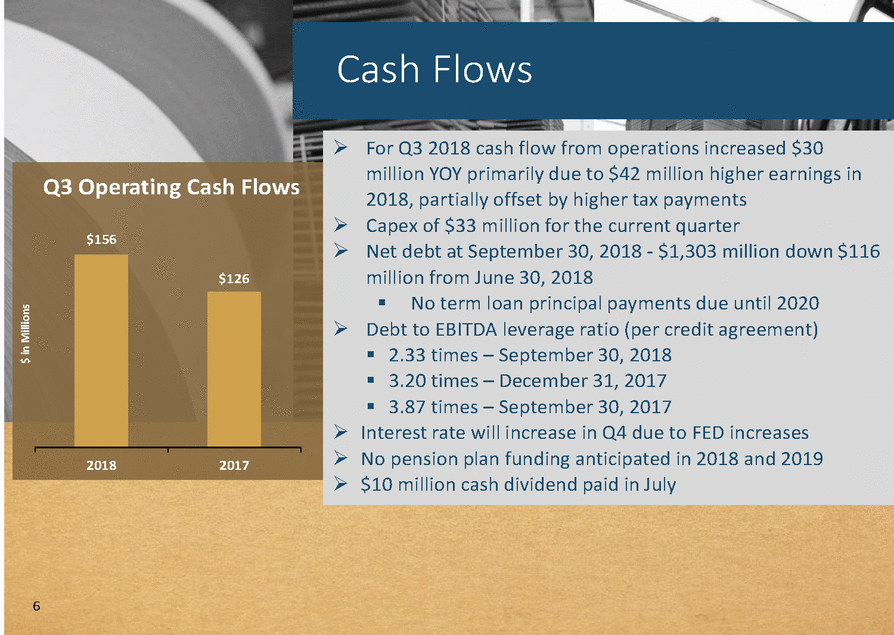
Cash Flows For Q3 2018 cash flow from operations increased $30 million YOY primarily due to $42 million higher earnings in 2018, partially offset by higher tax payments Capex of $33 million for the current quarter Net debt at September 30, 2018 - $1,303 million down $116 million from June 30, 2018 No term loan principal payments due until 2020 Debt to EBITDA leverage ratio (per credit agreement) 2.33 times – September 30, 2018 3.20 times – December 31, 2017 3.87 times – September 30, 2017 Interest rate will increase in Q4 due to FED increases No pension plan funding anticipated in 2018 and 2019 $10 million cash dividend paid in July 6 $ in Millions Q3 Operating Cash Flows $156 20182017 $126
Quarterly Key Performance Indicators 7 Sales and Production Paper and Packaging Product Mix (000 Tons) Containerboard includes all domestic and export sales of linerboard and medium Specialty paper includes Kraft paper, Durasorb®, Kraftpak® and roll pulp Containerboard and Corrugated Products(1) Specialty Paper(2) Average Mill Revenue per Ton Tons Produced (000) Mill External Shipments (000 Tons) $756 $736 $698 3Q 18 2Q 18 3Q 17 693 689 693 3Q 18 2Q 18 3Q 17 472 508 506 3Q 18 2Q 18 3Q 17 450 492 475 252 251 260 3Q 18 2Q 18 3Q 17 3Q 18 2Q 18 3Q 17

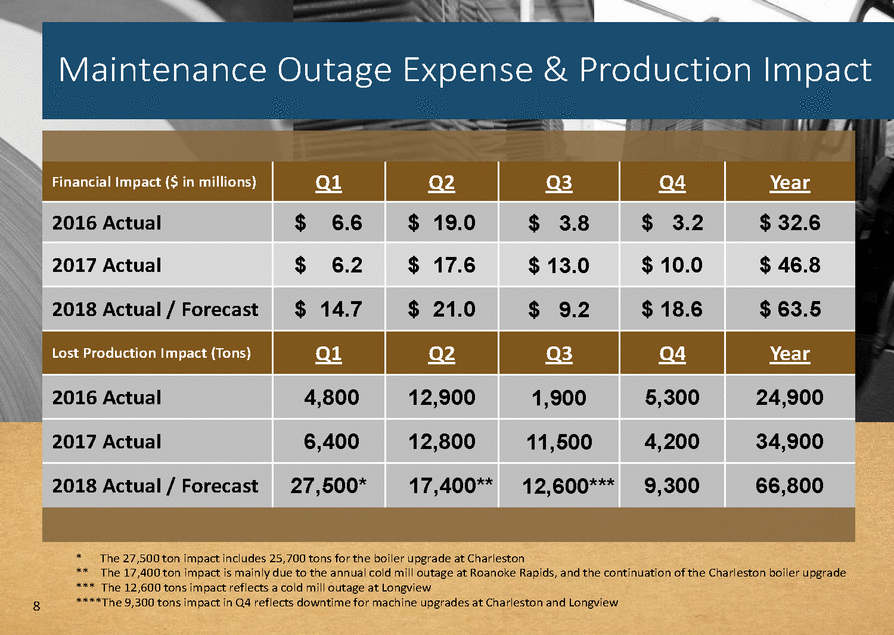
Maintenance Outage Expense & Production Impact *The 27,500 ton impact includes 25,700 tons for the boiler upgrade at Charleston ** The 17,400 ton impact is mainly due to the annual cold mill outage at Roanoke Rapids, and the continuation of the Charleston boiler upgrade *** The 12,600 tons impact reflects a cold mill outage at Longview ****The 9,300 tons impact in Q4 reflects downtime for machine upgrades at Charleston and Longview 8 Financial Impact ($ in millions) Q1 Q2 Q3 Q4 Year 2016 Actual $6.6 $19.0 $3.8 $3.2 $ 32.6 2017 Actual $6.2 $17.6 $ 13.0 $ 10.0 $ 46.8 2018 Actual / Forecast $14.7 $21.0 $9.2 $ 18.6 $ 63.5 Lost Production Impact (Tons) Q1 Q2 Q3 Q4 Year 2016 Actual 4,800 12,900 1,900 5,300 24,900 2017 Actual 6,400 12,800 11,500 4,200 34,900 2018 Actual / Forecast 27,500* 17,400** 12,600*** 9,300 66,800
