Attached files
| file | filename |
|---|---|
| EX-99.1 - EX-99.1 - SOUTH STATE Corp | ex-99d1.htm |
| 8-K - 8-K - SOUTH STATE Corp | f8-k.htm |
Exhibit 99.2
| 1 3rd Quarter 2018 Earnings Call October 23, 2018 |

| 22 Forward Looking Statements Statements included in this communication, which are not historical in nature are intended to be, and are hereby identified as, forward looking statements for purposes of the safe harbor provided by Section 27A of the Securities Act of 1933 and Section 21E of the Securities Exchange Act of 1934. Forward looking statements generally include words such as “expects,” “projects,” “anticipates,” “believes,” “intends,” “estimates,” “strategy,” “plan,” “potential,” “possible” and other similar expressions. South State Corporation (“South State”) cautions readers that forward looking statements are subject to certain risks and uncertainties that could cause actual results to differ materially from anticipated results. Such risks and uncertainties, include, among others, the following possibilities: (1) the outcome of any legal proceedings instituted against South State or Park Sterling Corporation (“Park Sterling”); (2) the possibility that the anticipated benefits of the transaction are not realized when expected or at all, including as a result of the impact of, or problems arising from, the integration of the two companies or as a result of the strength of the economy and competitive factors in the areas where South State and Park Sterling do business; (3) the possibility that the transaction may be more expensive to complete than anticipated, including as a result of unexpected factors or events; (4) diversion of management’s attention from ongoing business operations and opportunities; (5) potential adverse reactions or changes to business or employee relationships, including those resulting from the announcement or completion of the transaction; (6) South State’s ability to complete the integration of Park Sterling successfully; (7) credit risks associated with an obligor’s failure to meet the terms of any contract with the bank or otherwise fail to perform as agreed under the terms of any loan-related document; (8) interest risk involving the effect of a change in interest rates on the bank’s earnings, the market value of the bank’s loan and securities portfolios, and the market value of South State’s equity; (9) liquidity risk affecting the bank’s ability to meet its obligations when they come due; (10) risks associated with an anticipated increase in South State’s investment securities portfolio, including risks associated with acquiring and holding investment securities or potentially determining that the amount of investment securities South State desires to acquire are not available on terms acceptable to South State; (11) price risk focusing on changes in market factors that may affect the value of traded instruments in “mark-to-market” portfolios; (12) transaction risk arising from problems with service or product delivery; (13) compliance risk involving risk to earnings or capital resulting from violations of or nonconformance with laws, rules, regulations, prescribed practices, or ethical standards; (14) regulatory change risk resulting from new laws, rules, regulations, accounting principles, proscribed practices or ethical standards, including, without limitation, increased capital requirements (including, without limitation, the impact of the capital rules adopted to implement Basel III), Consumer Financial Protection Bureau rules and regulations, and potential changes in accounting principles relating to loan loss recognition; (15) strategic risk resulting from adverse business decisions or improper implementation of business decisions; (16) reputation risk that adversely affects earnings or capital arising from negative public opinion; (17) terrorist activities risk that results in loss of consumer confidence and economic disruptions; (18) cybersecurity risk related to the dependence of South State and Park Sterling on internal computer systems and the technology of outside service providers, as well as the potential impacts of third party security breaches, subjects each company to potential business disruptions or financial losses resulting from deliberate attacks or unintentional events; (19) economic downturn risk potentially resulting in deterioration in the credit markets, greater than expected non-interest expenses, excessive loan losses and other negative consequences, with risks could be exacerbated by potential negative economic developments resulting from federal spending cuts and/or one or more federal budget-related impasses or actions; (20) greater than expected noninterest expenses; (21) excessive loan losses; (22) failure to realize synergies and other financial benefits from, and to limit liabilities associated with, mergers and acquisitions within the expected time frame; (23) potential deposit attrition, higher than expected costs, customer loss and business disruption associated with merger and acquisition integration, including, without limitation, potential difficulties in maintaining relationships with key personnel and other integration related-matters; (24) the risks of fluctuations in market prices for South State common stock that may or may not reflect economic condition or performance of South State; (25) the payment of dividends on South State common stock is subject to regulatory supervision as well as the discretion of the board of directors of South State, South State’s performance and other factors; and (26) other risks and uncertainties disclosed in South State’s or Park Sterling’s most recent Annual Report on Form 10-K filed with the U.S. Securities and Exchange Commission (“SEC) or disclosed in documents filed or furnished by South State or Park Sterling with or to the SEC after the filing of such Annual Reports on Form 10-K, and of which could cause actual results to differ materially from future results expressed, implied or otherwise anticipated by such forward-looking statements. All forward-looking statements speak only as of the date they are made and are based on information available at that time. South State does not undertake any obligation to update or otherwise revise any forward-looking statements, whether as a result of new information, future events, or otherwise, except as required by federal securities laws. As forward-looking statements involve significant risks and uncertainties, caution should be exercised against placing undue reliance on such statements. |
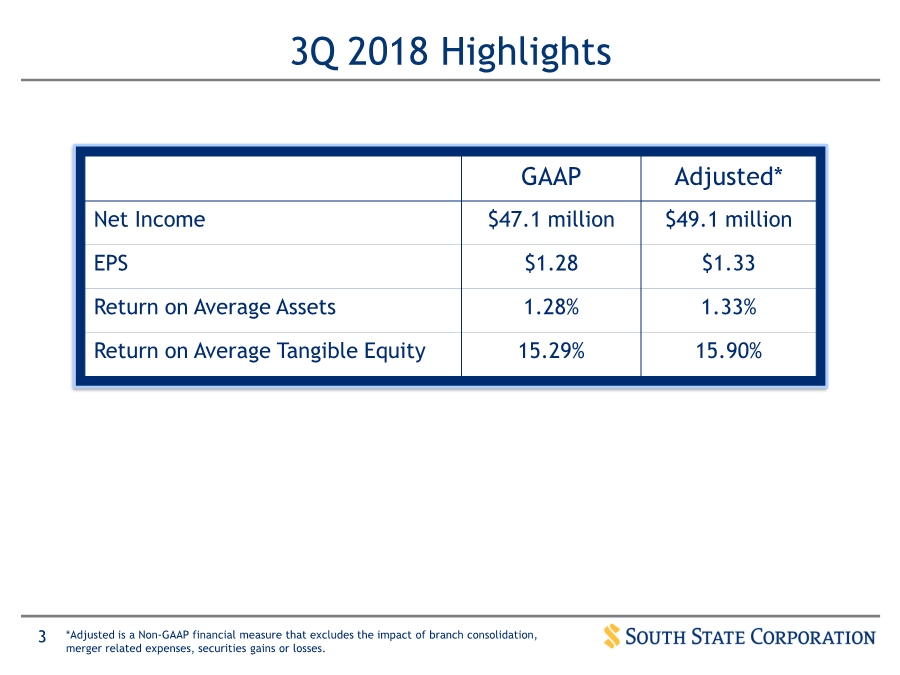
| 33 3Q 2018 Highlights GAAP Adjusted* Net Income $47.1 million $49.1 million EPS $1.28 $1.33 Return on Average Assets 1.28% 1.33% Return on Average Tangible Equity 15.29% 15.90% *Adjusted is a Non-GAAP financial measure that excludes the impact of branch consolidation, merger related expenses, securities gains or losses. |
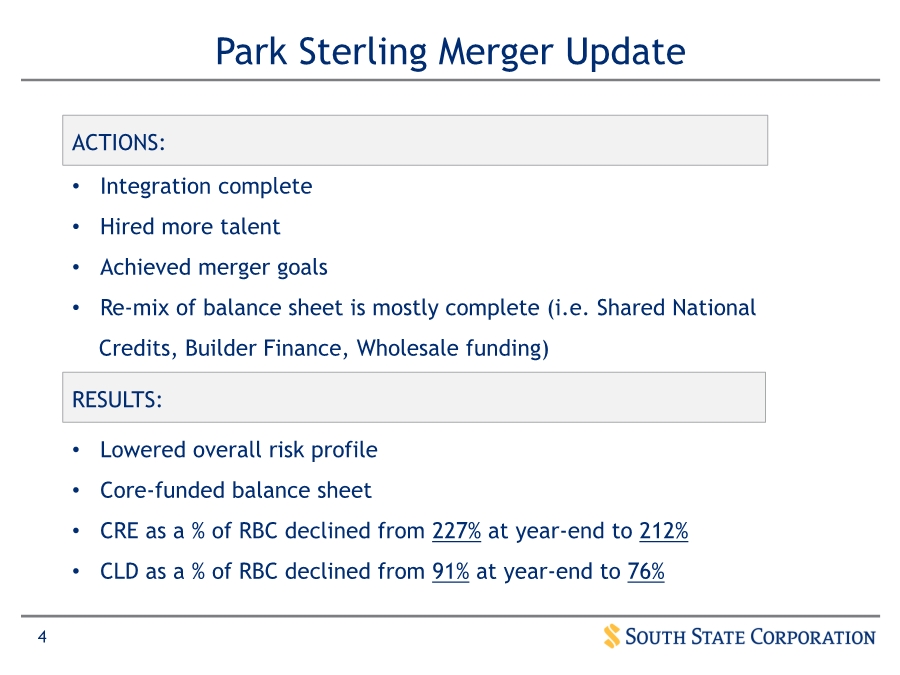
| 44 • Lowered overall risk profile • Core-funded balance sheet • CRE as a % of RBC declined from 227% at year-end to 212% • CLD as a % of RBC declined from 91% at year-end to 76% Park Sterling Merger Update • Integration complete • Hired more talent • Achieved merger goals • Re-mix of balance sheet is mostly complete (i.e. Shared National Credits, Builder Finance, Wholesale funding) ACTIONS: RESULTS: |
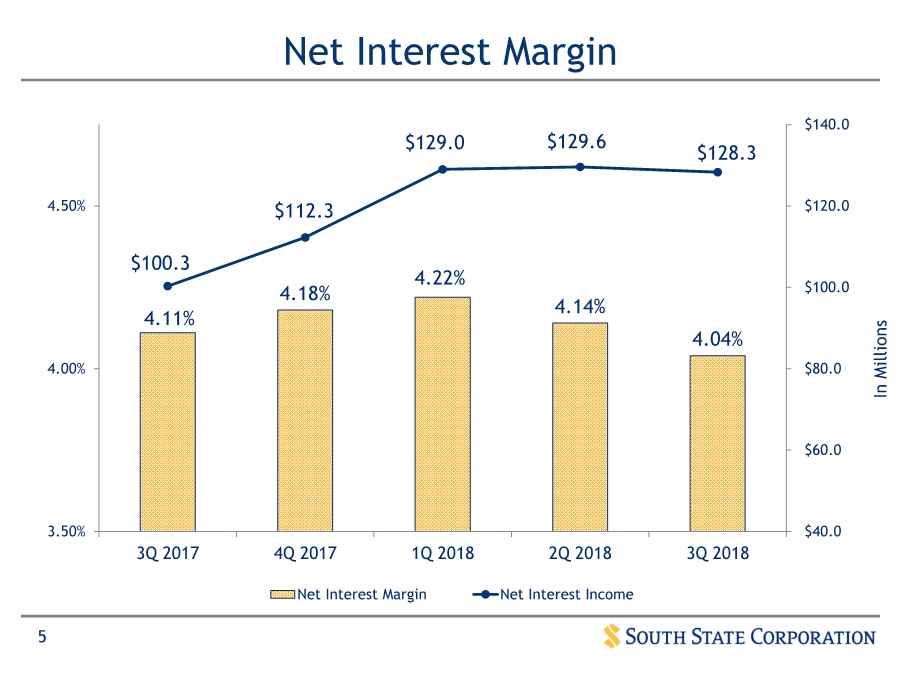
| 55 Net Interest Margin 4.11% 4.18% 4.22% 4.14% 4.04% $100.3 $112.3 $129.0 $129.6 $128.3 $40.0 $60.0 $80.0 $100.0 $120.0 $140.0 3.50% 4.00% 4.50% 3Q 2017 4Q 2017 1Q 2018 2Q 2018 3Q 2018 Net Interest Margin Net Interest Income In Millions |
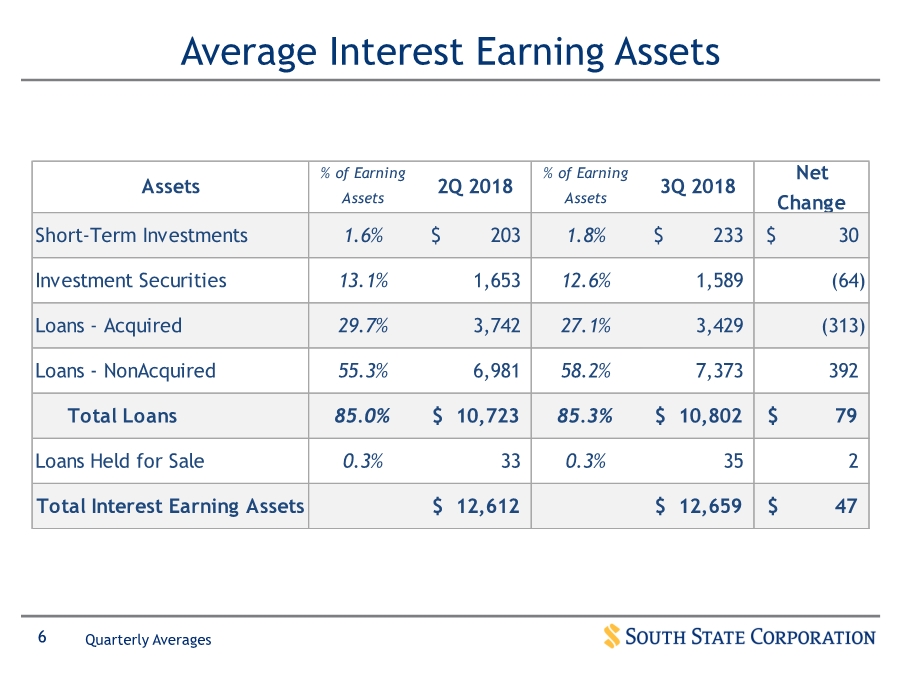
| 66 Average Interest Earning Assets Quarterly Averages Assets % of Earning Assets 2Q 2018 % of Earning Assets 3Q 2018 Net Change Short-Term Investments 1.6% 203$ 1.8% 233$ 30$ Investment Securities 13.1% 1,653 12.6% 1,589 (64) Loans - Acquired 29.7% 3,742 27.1% 3,429 (313) Loans - NonAcquired 55.3% 6,981 58.2% 7,373 392 Total Loans 85.0% 10,723$ 85.3% 10,802$ 79$ Loans Held for Sale 0.3% 33 0.3% 35 2 Total Interest Earning Assets 12,612$ 12,659$ 47$ |
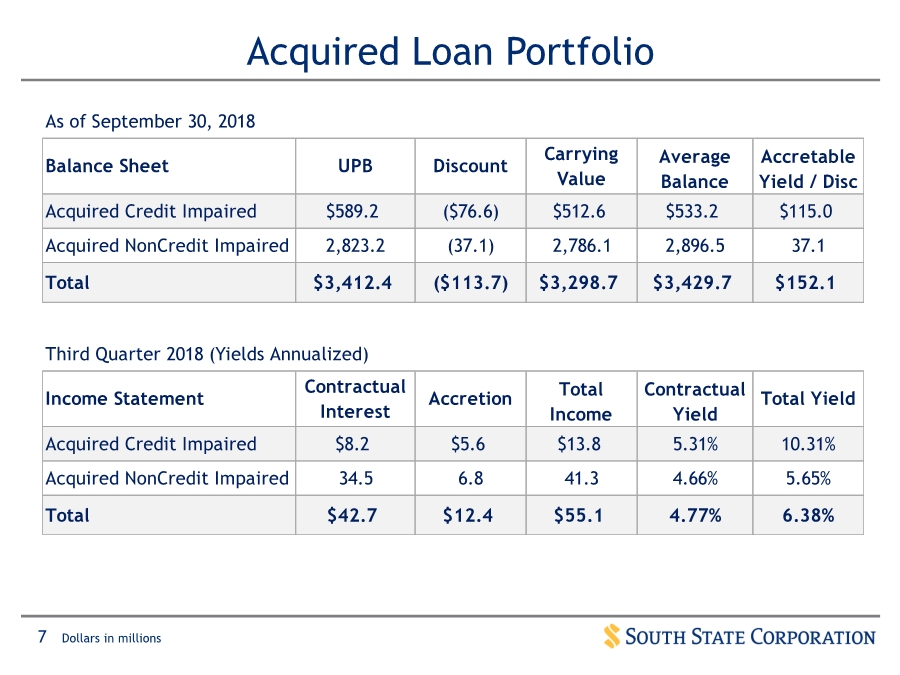
| 77 Acquired Loan Portfolio Dollars in millions As of September 30, 2018 Balance Sheet UPB Discount Carrying Value Average Balance Accretable Yield / Disc Acquired Credit Impaired $589.2 ($76.6) $512.6 $533.2 $115.0 Acquired NonCredit Impaired 2,823.2 (37.1) 2,786.1 2,896.5 37.1 Total $3,412.4 ($113.7) $3,298.7 $3,429.7 $152.1 Third Quarter 2018 (Yields Annualized) Income Statement Contractual Interest Accretion Total Income Contractual Yield Total Yield Acquired Credit Impaired $8.2 $5.6 $13.8 5.31% 10.31% Acquired NonCredit Impaired 34.5 6.8 41.3 4.66% 5.65% Total $42.7 $12.4 $55.1 4.77% 6.38% |
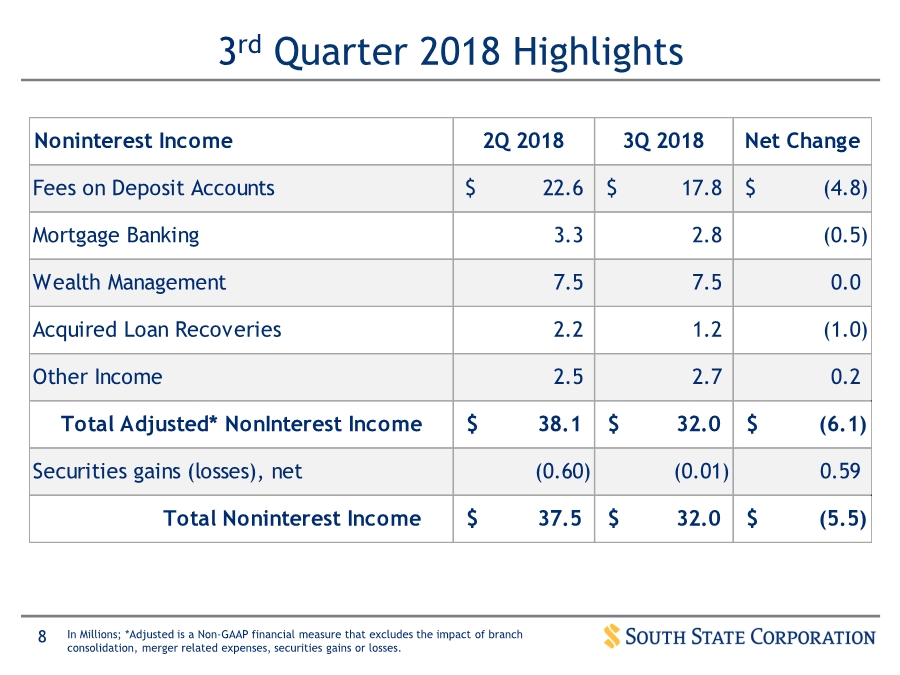
| 88 3rd Quarter 2018 Highlights In Millions; *Adjusted is a Non-GAAP financial measure that excludes the impact of branch consolidation, merger related expenses, securities gains or losses. Noninterest Income 2Q 2018 3Q 2018 Net Change Fees on Deposit Accounts 22.6$ 17.8$ (4.8)$ Mortgage Banking 3.3 2.8 (0.5) Wealth Management 7.5 7.5 0.0 Acquired Loan Recoveries 2.2 1.2 (1.0) Other Income 2.5 2.7 0.2 Total Adjusted* NonInterest Income 38.1$ 32.0$ (6.1)$ Securities gains (losses), net (0.60) (0.01) 0.59 Total Noninterest Income 37.5$ 32.0$ (5.5)$ |
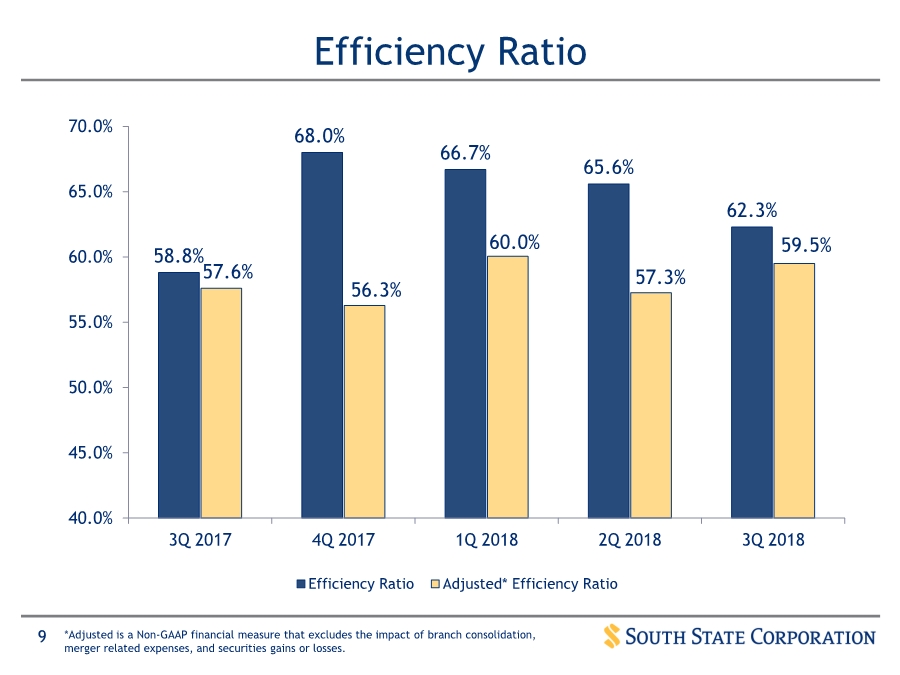
| 99 Efficiency Ratio 58.8% 68.0% 66.7% 65.6% 62.3% 57.6% 56.3% 60.0% 57.3% 59.5% 40.0% 45.0% 50.0% 55.0% 60.0% 65.0% 70.0% 3Q 2017 4Q 2017 1Q 2018 2Q 2018 3Q 2018 Efficiency Ratio Adjusted* Efficiency Ratio *Adjusted is a Non-GAAP financial measure that excludes the impact of branch consolidation, merger related expenses, and securities gains or losses. |
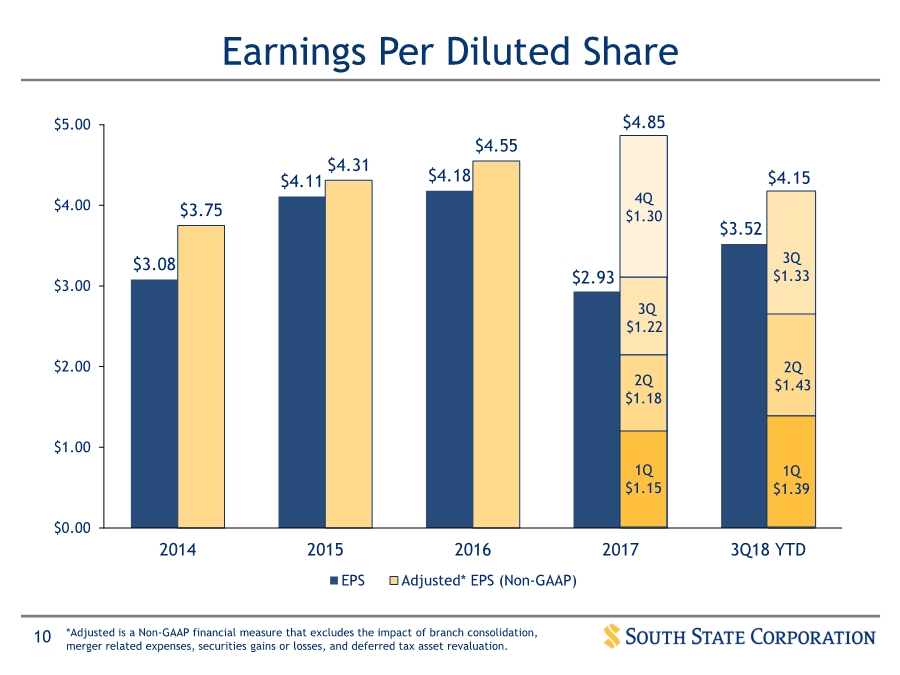
| 1010 Earnings Per Diluted Share $3.08 $4.11 $4.18 $2.93 $3.52 $3.75 $4.31 $4.55 $4.85 $4.15 $0.00 $1.00 $2.00 $3.00 $4.00 $5.00 2014 2015 2016 2017 3Q18 YTD EPS Adjusted* EPS (Non-GAAP) *Adjusted is a Non-GAAP financial measure that excludes the impact of branch consolidation, merger related expenses, securities gains or losses, and deferred tax asset revaluation. 1Q $1.391Q $1.15 2Q $1.18 3Q $1.22 1Q $1.39 2Q $1.43 3Q $1.33 4Q $1.30 |
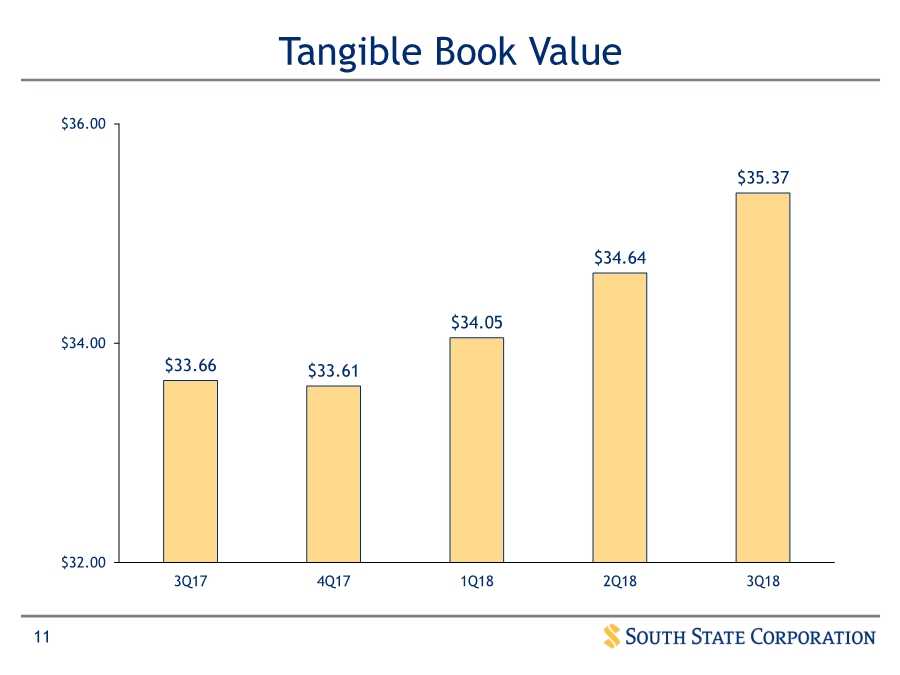
| 1111 Tangible Book Value $33.66 $33.61 $34.05 $34.64 $35.37 $32.00 $34.00 $36.00 3Q17 4Q17 1Q18 2Q18 3Q18 |