Attached files
| file | filename |
|---|---|
| EX-32.2 - EX-32.2 - JABIL INC | d636018dex322.htm |
| EX-32.1 - EX-32.1 - JABIL INC | d636018dex321.htm |
| EX-31.2 - EX-31.2 - JABIL INC | d636018dex312.htm |
| EX-31.1 - EX-31.1 - JABIL INC | d636018dex311.htm |
| EX-23.1 - EX-23.1 - JABIL INC | d636018dex231.htm |
| EX-21.1 - EX-21.1 - JABIL INC | d636018dex211.htm |
Table of Contents
UNITED STATES
SECURITIES AND EXCHANGE COMMISSION
Washington, D.C. 20549
FORM 10-K
(Mark One)
| ☒ | ANNUAL REPORT PURSUANT TO SECTION 13 OR 15(d) OF THE SECURITIES EXCHANGE ACT OF 1934 |
For the fiscal year ended August 31, 2018
or
| ☐ | TRANSITION REPORT PURSUANT TO SECTION 13 OR 15(d) OF THE SECURITIES EXCHANGE ACT OF 1934 |
For the transition period from to
Commission file number 001-14063

JABIL INC.
(Exact name of registrant as specified in its charter)
| Delaware | 38-1886260 | |
| (State or other jurisdiction of incorporation or organization) |
(I.R.S. Employer Identification No.) |
10560 Dr. Martin Luther King, Jr. Street North, St. Petersburg, Florida 33716
(Address of principal executive offices) (Zip Code)
(727) 577-9749
Registrant’s telephone number, including area code
Securities registered pursuant to Section 12(b) of the Act:
| Title of each class | Name of each exchange on which registered | |
| Common Stock, $0.001 par value per share | New York Stock Exchange |
Securities registered pursuant to Section 12(g) of the Act: None
Indicate by check mark if the registrant is a well-known seasoned issuer, as defined in Rule 405 of the Securities Act. Yes ☒ No ☐
Indicate by check mark if the registrant is not required to file reports pursuant to Section 13 or Section 15(d) of the Act. Yes ☐ No ☒
Indicate by check mark whether the registrant (1) has filed all reports required to be filed by Section 13 or 15(d) of the Securities Exchange Act of 1934 during the preceding 12 months (or for such shorter period that the registrant was required to file such reports), and (2) has been subject to such filing requirements for the past 90 days. Yes ☒ No ☐
Indicate by check mark whether the registrant has submitted electronically every Interactive Data File required to be submitted pursuant to Rule 405 of Regulation S-T (§ 232.405 of this chapter) during the preceding 12 months (or for such shorter period that the registrant was required to submit such files). Yes ☒ No ☐
Indicate by check mark if disclosure of delinquent filers pursuant to Item 405 of Regulation S-K (§ 229.405 of this chapter) is not contained herein, and will not be contained, to the best of registrant’s knowledge, in definitive proxy or information statements incorporated by reference in Part III of this Form 10-K or any amendment to this Form 10-K. ☒
Indicate by check mark whether the registrant is a large accelerated filer, an accelerated filer, a non-accelerated filer, a smaller reporting company, or an emerging growth company. See the definitions of “large accelerated filer,” “accelerated filer,” “smaller reporting company,” and “emerging growth company” in Rule 12b-2 of the Exchange Act.
| Large accelerated filer | ☒ | Accelerated filer | ☐ | |||
| Non-accelerated filer | ☐ | Smaller reporting company | ☐ | |||
| Emerging growth company |
☐ | |||||
If an emerging growth company, indicate by check mark if the registrant has elected not to use the extended transition period for complying with any new or revised financial accounting standards provided pursuant to Section 13(a) of the Exchange Act. ☐
Indicate by check mark whether the registrant is a shell company (as defined in Rule 12b-2 of the Act). Yes ☐ No ☒
The aggregate market value of the voting common stock held by non-affiliates of the registrant based on the closing sale price of the Common Stock as reported on the New York Stock Exchange on February 28, 2018 was approximately $4.0 billion. For purposes of this determination, shares of Common Stock held by each officer and director and by each person who owns 10% or more of the outstanding Common Stock have been excluded in that such persons may be deemed to be affiliates. This determination of affiliate status is not necessarily a conclusive determination for other purposes. The number of outstanding shares of the registrant’s Common Stock as of the close of business on October 9, 2018, was 161,878,931. The registrant does not have any non-voting stock outstanding.
DOCUMENTS INCORPORATED BY REFERENCE
The registrant’s definitive Proxy Statement for the Annual Meeting of Stockholders scheduled to be held on January 24, 2019 is incorporated by reference in Part III of this Annual Report on Form 10-K to the extent stated herein.
Table of Contents
JABIL INC. AND SUBSIDIARIES
2018 FORM 10-K ANNUAL REPORT
Table of Contents
References in this report to “the Company,” “Jabil,” “we,” “our,” or “us” mean Jabil Inc. together with its subsidiaries, except where the context otherwise requires. This Annual Report on Form 10-K contains certain statements that are, or may be deemed to be, forward-looking statements within the meaning of Section 27A of the Securities Act of 1933, as amended (the “Securities Act”) and Section 21E of the Securities Exchange Act of 1934, as amended (the “Exchange Act”). These forward-looking statements (such as when we describe what “will,” “may,” or “should” occur, what we “plan,” “intend,” “estimate,” “believe,” “expect” or “anticipate” will occur, and other similar statements) include, but are not limited to, statements regarding future sales and operating results, potential risks pertaining to these future sales and operating results, future prospects, anticipated benefits of proposed (or future) acquisitions, dispositions and new facilities, growth, the capabilities and capacities of business operations, any financial or other guidance, expected capital expenditures and dividends, expected restructuring charges and related savings and all statements that are not based on historical fact, but rather reflect our current expectations concerning future results and events. We make certain assumptions when making forward-looking statements, any of which could prove inaccurate, including assumptions about our future operating results and business plans. Therefore, we can give no assurance that the results implied by these forward-looking statements will be realized. Furthermore, the inclusion of forward-looking information should not be regarded as a representation by the Company or any other person that future events, plans or expectations contemplated by the Company will be achieved. The following important factors, among others, could affect future results and events, causing those results and events to differ materially from those expressed or implied in our forward-looking statements:
| • | fluctuation in our operating results; |
| • | our dependence on a limited number of customers; |
| • | our ability to manage growth effectively; |
| • | competitive factors affecting our customers’ businesses and ours; |
| • | the susceptibility of our production levels to the variability of customer requirements; |
| • | our ability to keep pace with technological changes and competitive conditions; |
| • | our reliance on a limited number of suppliers for critical components; |
| • | exposure to financially troubled customers and suppliers; |
| • | our exposure to the risks of a substantial international operation; |
| • | our ability to achieve the expected profitability from our acquisitions; |
For a further list and description of various risks, factors and uncertainties that could cause future results or events to differ materially from those expressed or implied in our forward-looking statements, see the “Risk Factors” and “Management’s Discussion and Analysis of Financial Condition and Results of Operations” sections contained in this document, and any subsequent reports on Form 10-Q and Form 8-K, and other filings we make with the Securities and Exchange Commission (“SEC”). Given these risks and uncertainties, the reader should not place undue reliance on these forward-looking statements.
All forward-looking statements included in this Annual Report on Form 10-K are made only as of the date of this Annual Report on Form 10-K, and we do not undertake any obligation to publicly update or correct any forward-looking statements to reflect events or circumstances that subsequently occur, or of which we hereafter become aware. You should read this document completely and with the understanding that our actual future results or events may be materially different from what we expect. All forward-looking statements attributable to us are expressly qualified by these cautionary statements.
1
Table of Contents
PART I
The Company
We are one of the leading providers of worldwide manufacturing services and solutions. We provide comprehensive electronics design, production and product management services to companies in various industries and end markets. Our services enable our customers to reduce manufacturing costs, improve supply-chain management, reduce inventory obsolescence, lower transportation costs and reduce product fulfillment time. Our manufacturing and supply chain management services and solutions include innovation, design, planning, fabrication and assembly, delivery and managing the flow of resources and products.
We serve our customers primarily through dedicated business units that combine highly automated, continuous flow manufacturing with advanced electronic design and design for manufacturability. We depend, and expect to continue to depend, upon a relatively small number of customers for a significant percentage of our net revenue, which in turn depends upon their growth, viability and financial stability. Based on net revenue, for the fiscal year ended August 31, 2018, our largest customers include Apple, Inc., Cisco Systems, Inc., Hewlett-Packard Company, Keysight Technologies, LM Ericsson Telephone Company, NetApp, Inc., Nokia Networks, SolarEdge Technologies Inc., Valeo S.A. and Zebra Technologies Corporation. For the fiscal year ended August 31, 2018, we had net revenues of $22.1 billion and net income attributable to Jabil Inc. of $86.3 million.
We conduct our operations in facilities that are located worldwide, including but not limited to, China, Hungary, Malaysia, Mexico, Singapore and the United States. We derived a substantial majority, 91.7%, of net revenue from our international operations for the fiscal year ended August 31, 2018. Our global manufacturing production sites allow customers to manufacture products simultaneously in the optimal locations for their products. Our global presence is key to assessing and executing on our business opportunities.
We have two reporting segments: Electronics Manufacturing Services (“EMS”) and Diversified Manufacturing Services (“DMS”), which are organized based on the economic profiles of the services performed, including manufacturing capabilities, market strategy, margins, return on capital and risk profiles. Our EMS segment is focused around leveraging IT, supply chain design and engineering, technologies largely centered on core electronics, utilizing our large-scale manufacturing infrastructure and our ability to serve a broad range of end markets. Our EMS segment is typically a lower-margin but high-volume business that produces products at a quicker rate (i.e. cycle time) and in larger quantities and includes customers primarily in the automotive and transportation, capital equipment, computing and storage, defense and aerospace, digital home, industrial and energy, networking and telecommunications, point of sale and printing industries. Our DMS segment is focused on providing engineering solutions, with an emphasis on material sciences and technologies. Our DMS segment is typically a higher-margin business and includes customers primarily in the consumer wearables, healthcare, mobility and packaging industries.
The following table sets forth, for the periods indicated, revenue by segment expressed as a percentage of net revenue:
| Fiscal Year Ended August 31, | ||||||||||||
| 2018 | 2017 | 2016 | ||||||||||
| EMS |
56 | % | 58 | % | 60 | % | ||||||
| DMS |
44 | % | 42 | % | 40 | % | ||||||
|
|
|
|
|
|
|
|||||||
| Total |
100 | % | 100 | % | 100 | % | ||||||
|
|
|
|
|
|
|
|||||||
Additional financial information regarding our reportable operating segments is included in Item 7 of this report and Note 12 – “Concentration of Risk and Segment Data” to the Consolidated Financial Statements.
Industry Background
The industry in which we operate has historically been composed of companies that provide a range of design and manufacturing services to companies that utilize electronics components in their products.
2
Table of Contents
We monitor the current economic environment and its potential impact on both the customers we serve as well as our end markets and closely manage our costs and capital resources so that we can respond appropriately as circumstances change. Over the long term we believe the factors driving our customers and potential customers to use our industry’s services include:
| • | Efficient Manufacturing. Manufacturing service providers are often able to manufacture products at a reduced total cost to companies. These cost advantages result from higher utilization of capacity and efficiencies of scale because of diversified product demand and, generally, a greater focus on the components of manufacturing cost. Companies are increasingly seeking to reduce their investment in inventory, facilities and equipment used in manufacturing and prioritizing capital investments in other activities such as sales and marketing and research and development (“R&D”). This strategic shift in capital deployment has contributed to increased demand for and interest in outsourcing to external manufacturing service providers. |
| • | Accelerated Product Time-to-Market and Time-to-Volume. Manufacturing service providers are often able to deliver accelerated production start-ups and achieve high efficiencies in bringing new products to production. Providers are also able to more rapidly scale production for changing markets and to position themselves in global locations that serve the leading world markets. With increasingly shorter product life cycles, these key services allow new products to be sold in the marketplace in an accelerated time frame. |
| • | Access to Advanced Design and Manufacturing Technologies. By utilizing manufacturing service providers, customers gain access to additional advanced technologies in manufacturing processes, as well as to product and production design, which can offer customers significant improvements in the performance, quality, cost, time-to-market and manufacturability of their products. |
| • | Improved Inventory Management and Purchasing Power. Manufacturing service providers are often able to more efficiently manage both procurement and inventory, and have demonstrated proficiency in purchasing components at improved pricing due to the scale of their operations and continuous interaction with the materials marketplace. |
Our Strategy
Our vision for the future is to become the world’s most technologically advanced manufacturing services and solutions provider. As we work to achieve our vision, we continue to pursue the following strategies:
| • | Establish and Maintain Long-Term Customer Relationships. An important element of our strategy is to establish and maintain long-term relationships with leading companies in expanding industries with size and growth characteristics that can benefit from highly automated, continuous flow manufacturing on a global scale. We have made concentrated efforts to diversify our industry sectors and customer base. Because of these efforts, we have experienced business growth from both existing and new customers as well as from acquisitions. We focus on maintaining long-term relationships with our customers and seek to expand these relationships to include additional product lines and services. In addition, we focus on identifying and developing relationships with new customers that meet our targeted profile, which includes financial stability, the need for technology-driven turnkey manufacturing, anticipated unit volume and long-term relationship stability. |
| • | Utilize Customer-Centric Business Units. Most of our business units are dedicated to serve one customer each and operate by primarily utilizing dedicated production equipment, production workers, supervisors, buyers, planners and engineers to provide comprehensive manufacturing solutions that are customized to each customer’s needs. We believe our customer-centric business units promote increased responsiveness to our customers’ needs, particularly for customer relationships that extend across multiple production locations. |
| • | Leverage Global Production. We believe that global production is a key strategy to reduce obsolescence risk and secure the lowest possible landed costs while simultaneously supplying products of equivalent or comparable quality throughout the world. Consistent with this strategy, we have established or acquired operations in Europe, Asia, Latin America and Africa. |
| • | Offer Systems Assembly, Direct-Order Fulfillment and Configure-to-Order Services. Our systems assembly, direct-order fulfillment and configure-to-order services allow our customers to reduce product cost and risk of product obsolescence by reducing total work-in-process and finished goods inventory. These services are available at all of our manufacturing locations. |
| • | Offer Design Services. We offer a wide spectrum of value-add design services to achieve improvements in performance, cost, time-to-market and manufacturability. |
3
Table of Contents
| • | Pursue Acquisition Opportunities Selectively. Traditionally, electronics manufacturing service companies have acquired manufacturing capacity from their customers to drive growth, expand their footprint and gain new customers. In recent years, our acquisition strategy has expanded to include opportunities to acquire competitors who are focused on our key growth areas, which include specialized manufacturing in key markets, materials technology and design operations, as well as other acquisition opportunities complementary to our services offerings. The primary goals of our acquisition strategy are to complement our current capabilities, diversify our business into new industry sectors and with new customers and expand the scope of the services we can offer to our customers. |
Our Approach to Manufacturing
To achieve high levels of manufacturing performance, we have adopted the following approaches:
| • | Decentralized Business Unit Model. Most of our business units are dedicated to serve one customer each and are empowered to formulate strategies tailored to individual customer’s needs. Our business units generally have dedicated production lines consisting of equipment, production workers, supervisors, buyers, planners and engineers. Under certain circumstances, a production line may serve more than one business unit to maximize resource utilization. Business units have direct responsibility for manufacturing results and time-to-volume production, thereby promoting a sense of individual commitment and ownership. The business unit approach is modular and enables us to grow incrementally without disrupting the operations of other business units. Business unit management reviews the customer financial information to assess whether the business units are meeting their designated responsibilities and to ensure that the daily execution of manufacturing activities is being effectively managed. The business units aggregate into operating segments based on the economic profiles of the services performed, including manufacturing capabilities, market share strategy, margins, return on capital and risk profiles. |
| • | Automated Continuous Flow. We use a highly automated, continuous flow approach to manufacturing, whereby different pieces of equipment are joined directly or by conveyor to create an in-line assembly process. This process contrasts with a batch approach, whereby individual pieces of assembly equipment are operated as freestanding work-centers. The elimination of waiting time prior to sequential operations results in faster manufacturing, which improves production efficiencies and quality control, and reduces inventory work-in-process. We believe continuous flow manufacturing provides cost reductions and quality improvement when applied to high volumes of product. |
| • | Computerized Control and Monitoring. We support all aspects of our manufacturing activities with advanced computerized control and monitoring systems. Component inspection and vendor quality are monitored electronically in real-time. Materials planning, purchasing, stockroom and shop floor control systems are supported through a computerized manufacturing resource planning system, which provides customers with the ability to continuously monitor material availability and track work-in-process on a real-time basis. In addition, manufacturing processes are supported by a computerized statistical process control system, whereby customers can remotely access our computer systems to monitor real-time yields, inventory positions, work-in-process status and vendor quality data. |
| • | Electronic Supply Chain Management. We make available to our customers and suppliers an electronic commerce system/electronic data interchange and web-based tools to implement a variety of supply chain management programs. Our customers use these tools to share demand and product forecasts and deliver purchase orders, and we use these tools with our suppliers for just-in-time delivery, supplier-managed inventory and consigned supplier-managed inventory. |
4
Table of Contents
Our Design Services
We offer a wide spectrum of value-add design services to enhance our relationships with current customers and to help develop relationships with our new customers. Our teams are strategically staffed to support Jabil customers for all development projects, including turnkey system design and design for manufacturing activities. These design services include:
| • | Electronic Design. Our Electronic Design team provides electronic circuit design services, including application-specific integrated circuit design, firmware development and rapid prototyping services. These services have been used by our customers for a variety of products including smart phones and accessory products, notebook and personal computers, servers, radio frequency products, video set-top boxes, optical communications products, communication and broadband products, and automotive and consumer appliance controls. |
| • | Industrial Design. Our Industrial Design team designs the “look and feel” of the plastic and metal enclosures that house the products’ electro-mechanics, including the printed circuit board assemblies (“PCBA”). |
| • | Mechanical Design. Our Mechanical Design team specializes in three-dimensional mechanical design with the analysis of electronic, electro-mechanical and optical assemblies using state of the art modeling and analytical tools. This team has extended Jabil’s product design offering capabilities to include all aspects of industrial design, advance mechanism development and tooling management. |
| • | Computer-Assisted Design. Our Computer-Assisted Design (“CAD”) team provides PCBA design services using advanced CAD engineering tools, PCBA design validation and verification services, and other consulting services, which include generating a bill of materials, approved vendor list and assembly equipment configuration for a particular PCBA design. We believe that our CAD services result in PCBA designs that are optimized for manufacturability and cost efficiencies and accelerate a product’s time-to-market and time-to-volume production. |
| • | Product Validation. Our Product Validation team provides complete product and process validation. This includes product system tests, product safety, regulatory compliance and reliability tests. |
| • | Manufacturing Test Solution Development. Our Manufacturing Test Solution Development team provides integral support to the design teams to embed design with testability and to promote efficient capital and resource investment in the manufacturing process. The use of software driven instrumentation and test process design and management has enhanced our product quality and reduced our operating costs relative to human dependent test processes. The full electronic test data-log of customer products has allowed customer product test traceability and visibility throughout the manufacturing test process. |
Fabrication and Assembly
We offer systems assembly, test, direct-order fulfillment and configure-to-order services to our customers. Our systems assembly services extend our range of assembly activities to include assembly of higher-level sub-systems and systems incorporating multiple PCBAs. In addition, based on quality assurance programs developed with our customers, we provide testing services for our PCBAs, sub-systems and systems products. Our quality assurance programs include circuit testing under various environmental conditions to ensure that our products meet or exceed required customer specifications. We also offer direct-order fulfillment and configure-to-order services for delivery of final products.
Technology and Research and Development
We believe that our manufacturing and testing technologies are among the most advanced in our industry. To meet our customers’ increasingly sophisticated needs, we continuously engage in R&D activities designed to create new and improved products and manufacturing solutions for our customers. Through our R&D efforts, we intend to continue to offer our customers highly automated, continuous flow manufacturing process technologies for precise and aesthetic mechanical components and system assembly. These technologies and R&D activities include:
| • | Automation, including automated tooling |
| • | Electronic interconnection |
| • | Advanced polymer and metal material science |
| • | Single/multi-shot injection molding, stamping and in-mold labeling |
5
Table of Contents
| • | Multi-axis computer numerical control |
| • | Vacuum metallization |
| • | Physical vapor deposition |
| • | Digital printing |
| • | Anodization |
| • | Thermal-plastic composite formation |
| • | Plastic with embedded electronics |
| • | Metal and plastic covers with insert-molded or dies-casting features for assembly |
| • | Display cover with integrated touch sensor |
| • | Material processing research (including plastics, metal, glass and ceramic) |
We engage in R&D activities for many products including mobile internet devices and associated accessories, multi-media tablets, two-way radios, health care and life science products, server and storage products, set-top and digital home products and printing products. The following table sets forth, for the periods indicated, the amount expended on R&D activities:
| Fiscal Year Ended August 31, | ||||||||||||
| (dollars in millions) | 2018 | 2017 | 2016 | |||||||||
| R&D activities |
$ | 38.5 | $ | 29.7 | $ | 32.0 | ||||||
Customers and Marketing
A key tenet of our strategy is to establish and maintain long-term relationships with leading companies in expanding industries with the size and growth characteristics that can benefit from highly automated, continuous flow manufacturing on a global scale. A small number of customers and significant industry sectors have historically comprised a major portion of our net revenue. We also market our services and solutions through our website and our Blue Sky Innovation Centers.
In fiscal year 2018, our five largest customers accounted for approximately 48% of our net revenue and 80 customers accounted for approximately 90% of our net revenue. The table below sets forth the respective portion of net revenue attributable to the customers that accounted for approximately 10% or more of our net revenue during the fiscal years ended August 31, 2018, 2017 and 2016:
| Fiscal Year Ended August 31, | ||||||||||||
| 2018 | 2017 | 2016 | ||||||||||
| Apple, Inc. |
28 | % | 24 | % | 24 | % | ||||||
Competition
Our business is highly competitive. We compete against numerous domestic and foreign electronic manufacturing service providers and design providers, including Benchmark Electronics, Inc., Celestica Inc., Flex Ltd., Hon-Hai Precision Industry Co., Ltd., Plexus Corp. and Sanmina Corporation. We also compete against numerous domestic and foreign diversified manufacturing service providers, including AptarGroup, Inc., Berry Plastics Group, Inc., Catcher Technology Co., Ltd., Gerresheimer AG, Quanta Computer, Inc. and Zeniya Aluminum Engineering, Ltd. In addition, past consolidation in our industry has resulted in larger and more geographically diverse competitors that have significant resources.
We also face competition from the manufacturing operations of our current and potential customers, who are continually evaluating the merits of manufacturing products internally against the advantages of outsourcing. In the past, some of our customers moved a portion of their manufacturing from us to more fully utilize their excess internal manufacturing capacity.
Backlog
Our order backlog as of August 31, 2018 and 2017 was valued at approximately $6.8 billion and $4.9 billion, respectively. Our order backlog is expected to be filled within the current fiscal year. Although our backlog consists of firm purchase orders, the level of backlog at any particular time may not be necessarily indicative of future sales. Given the nature of our relationships with our customers, and the fact that we generally do not enter into long-term contracts or purchase commitments with our customers, we frequently allow our customers to cancel or reschedule deliveries, and therefore, backlog is often not a meaningful indicator of future financial results.
6
Table of Contents
Seasonality
Production levels for a portion of the DMS segment are subject to seasonal influences. Historically, we have realized greater net revenue during our first fiscal quarter, which ends on November 30, due to higher demand for consumer-related products during the holiday selling season.
Components Procurement
We procure components from a broad group of suppliers, determined on an assembly-by-assembly basis. Some of the products we manufacture contain one or more components that are only available from a single source. Some of these components are allocated from time to time in response to supply shortages. In some cases, supply shortages will substantially curtail production of all assemblies using a particular component.
Proprietary Rights
We regard certain aspects of our design, production and product management services as proprietary intellectual property. To protect our trade secrets, manufacturing know-how and other proprietary rights, we rely largely upon a combination of intellectual property laws, non-disclosure agreements with our customers, employees, and suppliers and our internal security systems, policies and procedures. We currently have a relatively modest number of solely owned and/or jointly held patents for various innovations. We believe that our research and design activities, along with developments relating thereto, may result in growth of our patent portfolio and its importance to us, particularly as we expand our business activities. Other factors significant to our proprietary rights include the knowledge and experience of our management and personnel and our ability to develop, enhance and market manufacturing services.
We license some technology and intellectual property rights from third parties that we use in providing some of our design, production and product management services to our customers. Generally, the license agreements that govern such third-party technology and intellectual property rights grant us the right to use the subject technology anywhere in the world and terminate upon a material breach by us.
Employees
As of August 31, 2018, we employed approximately 199,000 people worldwide. None of our U.S. domestic employees are represented by a labor union. In certain international locations, our employees are represented by labor unions and by works councils. We have never experienced a significant work stoppage or strike and we believe that our employee relations are good.
Geographic Information
The information regarding net revenue and long-lived assets set forth in Note 12 – “Concentration of Risk and Segment Data” to the Consolidated Financial Statements is hereby incorporated by reference into this Part I, Item 1. Each of our segments is dependent on foreign operations.
Environmental
We are subject to a variety of federal, state, local and foreign environmental, health and safety, product stewardship and producer responsibility laws and regulations, including those relating to the use, storage, discharge and disposal of hazardous chemicals used during our manufacturing process, those governing worker health and safety, those requiring design changes, supply chain investigation or conformity assessments or those relating to the recycling or reuse of products we manufacture.
Executive Officers of the Registrant
Executive officers are appointed by the Board of Directors and serve at the discretion of the Board. Except as otherwise noted below, each executive officer is a full-time employee of Jabil. There are no family relationships among our executive officers and directors. There are no arrangements or understandings between any of our executive officers and any other persons pursuant to which any of such executive officers were selected. Below is a list of our executive officers:
Steven D. Borges (age 50) was named Executive Vice President, Chief Executive Officer, Healthcare in September 2016. Mr. Borges joined Jabil in 1993 and has global experience in positions of increasing responsibility in Operations, Business Development, Manufacturing Operations and Supply Chain Management. He holds a Bachelor’s Degree in Business Administration and Management from Fitchburg State University.
7
Table of Contents
Sergio A. Cadavid (age 62) was named Senior Vice President, Treasurer in September 2013. Mr. Cadavid joined Jabil in 2006 as Treasurer. Prior to joining Jabil, Mr. Cadavid was Corporate Assistant Treasurer for Owens-Illinois, Inc. in Toledo, Ohio. He has also held various positions with The Quaker Oats Company, Arthur Andersen & Co. and J.M. Family Enterprises, Inc. He holds an M.B.A. from the University of Florida and a B.B.A. from Florida International University.
Brenda Chamulak (age 47) was named Senior Vice President, Chief Executive Officer, Jabil Packaging Solutions in July 2018. Prior to joining Jabil, Ms. Chamulak was Vice President and General Manager of the Personal Care & Home Care, a business unit of Aptar Inc., a global supplier of dispensing and sealing solutions based in Crystal Lake, Illinois. Ms. Chamuluk served as the President, Global Market Development for Aptar’s Beauty + Home, Personal Care Business Unit from 2016 to 2017 and served as the General Manager, Aptar Midland from 2013 to 2016. She joined Aptar in 1992 and held positions of increasing responsibility with Aptar. Ms. Chamulak has a B.A. in Marketing and International Business from Carthage College and an MBA from Marquette University.
Michael Dastoor (age 52) was named Executive Vice President, Chief Financial Officer effective September 2018. Mr. Dastoor joined Jabil in 2000 as Regional Controller – Asia Pacific and was named Controller in June 2004 and Senior Vice President, Controller in July 2010. Prior to joining Jabil, Mr. Dastoor was a Regional Financial Controller for Inchcape PLC. He holds a degree in Finance and Accounting from the University of Bombay. Mr. Dastoor is a Chartered Accountant from the Institute of Chartered Accountants in England and Wales.
Bruce A. Johnson (age 62) was named Senior Vice President, Chief Human Resources Officer in January 2017. Mr. Johnson joined Jabil in 2015 as Vice President, Human Resources. Prior to joining Jabil, Mr. Johnson was Chief Organizational Effectiveness Officer/Executive Vice President, Human Resources for C&S Wholesale Grocers, Inc., a wholesale distributor of food and grocery items with headquarters in Keene, New Hampshire from 2007 to 2014. Mr. Johnson also served in senior roles at The Timberland Company, a footwear and apparel designer, retailer and manufacturer in New Hampshire, and E.I. Du Pont De Nemours and Company (Du Pont) in Delaware. He holds a Bachelor of Arts in History from Middlebury College in Vermont.
Robert L. Katz (age 56) joined Jabil in March 2016 and was named Executive Vice President, General Counsel and Corporate Secretary in September 2016. Mr. Katz transitioned the Corporate Secretary role to a member of his staff in April 2017. Prior to joining Jabil, Mr. Katz served as Executive Vice President, General Counsel and Secretary of SharkNinja, a vacuum and kitchen appliance manufacturer. He was previously Senior Vice President and General Counsel of Ingersoll Rand plc, a diversified industrial manufacturer, from 2010 to 2015. Mr. Katz served as Senior Vice President, General Counsel, Corporate Secretary and Chief Compliance Officer of Federal-Mogul Corporation from 2007 to 2010. From 1999 to 2007 he was General Counsel—EMEA for Delphi Corporation in Paris, France. He began his career with Milbank, Tweed, Hadley & McCloy working in the Mergers and Acquisitions and General Corporate Group in New York and London. He earned a Bachelor of Laws (LL.B.) and a Bachelor of Civil Law (B.C.L.) from McGill University. He is a member of the New York Bar.
Michael J. Loparco (age 47) was named Executive Vice President, Chief Executive Officer, Engineered Solutions Group in January 2016. Previously, Mr. Loparco served as Executive Vice President, Chief Executive Officer, Industrial and Energy, Senior Vice President, Global Business Units in Jabil’s High Velocity business and held a variety of global management positions. Before joining Jabil in 1999, Mr. Loparco was an attorney at Holland & Knight, LLP, practicing corporate and commercial litigation. He holds a Juris Doctorate from Stetson University College of Law. He holds a Bachelor of Arts in International Business, with minor degrees in Spanish and Business Management, from Eckerd College.
Mark Mondello (age 54) was named Chief Executive Officer in March 2013. Mr. Mondello joined Jabil in 1992 as a manufacturing supervisor. Mr. Mondello was promoted to Project Manager in 1993, named Vice President, Business Development in 1997, Senior Vice President, Business Development in 1999 and served as Chief Operating Officer from 2002 to 2013. Prior to joining Jabil, Mr. Mondello was a commercial and defense-related aerospace project manager for Moog, Inc. He holds a B.S. in Mechanical Engineering from the University of South Florida.
Alessandro Parimbelli (age 50) was named Executive Vice President, Chief Executive Officer, Enterprise and Infrastructure in July 2013. Mr. Parimbelli joined Jabil in 1998 as a Test Engineering Manager. At Jabil, Mr. Parimbelli served in business management positions in Boise, Idaho and Paris, France before being promoted to Vice President, Global Business Units in 2006. From 2010 through 2012, Mr. Parimbelli was Senior Vice President, Global Business Units and was responsible for Jabil’s Enterprise and Infrastructure business. Prior to joining Jabil, Mr. Parimbelli held various engineering positions within Hewlett-Packard and other software engineering companies. He holds an MBA from Colorado State University and a Software Engineering degree from Politecnico of Milan, Italy.
William E. Peters (age 55) was named President in March 2013. Mr. Peters served as Executive Vice President, Human Development, Human Resources from 2010 to 2013. He joined Jabil in 1990 as a buyer and has held positions of increasing responsibility in Operations, Supply Chain and Manufacturing Operations. Prior to joining Jabil, Mr. Peters was a financial analyst for Electronic Data Systems. He holds a B.A. in Economics from Michigan State University.
Courtney J. Ryan (age 48) was named Executive Vice President, Corporate Development/Chief of Staff in July 2016. Mr. Ryan joined Jabil in 1993 as a Quality Engineer and worked his way through various operations and business development management positions. He was named Senior Vice President, Global Business Units in 2007. Mr. Ryan served as Executive Vice President, Chief Executive Officer, Nypro from July 2013 to June 2016. Mr. Ryan holds an MBA with a concentration in Decision and Information Science and a Bachelor of Arts in Economics, both from the University of Florida. He also serves on the University of Florida’s MBA and Supply Chain Advisory Board.
8
Table of Contents
Daryn Smith (age 48) was named Senior Vice President, Enterprise & Commercial Controller effective September 2018. Mr. Smith served as Chief Financial Officer of EMS from June 2013—June 2018. Mr. Smith joined Jabil in 2002 and he has held various leadership roles in Risk and Assurance, Financial Planning and Analysis, and Controllership for Jabil. Prior to joining Jabil, Mr. Smith was with the Assurance and Advisory Services practice for Arthur Andersen (Andersen). He holds a Bachelor’s degree in Accounting from the University of South Florida and an MBA from the University of Florida.
Kenneth S. Wilson (age 53) was named Executive Vice President and CEO of Jabil Green Point in 2017. Prior to that, Mr. Wilson was Senior Vice President of the Telecommunications Infrastructure Sector within Jabil’s Enterprise & Infrastructure group. He first joined Jabil in 2000 as a business unit manager; and has held various leadership roles, including VP of Global Business Units, running businesses such as consumer electronics and telecommunications. Prior to Jabil, he spent 8 years at Motorola, where he served as Operations Director in their Handset Division. Kenny has a Bachelor’s degree in Manufacturing Engineering and a MBA from Edinburgh Business School.
Additional Information
Our principal executive offices are located at 10560 Dr. Martin Luther King, Jr. Street North, St. Petersburg, Florida 33716, and our telephone number is (727) 577-9749. We were incorporated in Delaware in 1992. Our website is located at http://www.jabil.com. Through a link on the “Investors” section of our website, we make available our Annual Report on Form 10-K, our Quarterly Reports on Form 10-Q, our Current Reports on Form 8-K and any amendments to those reports, free of charge, as soon as reasonably practicable after they are electronically filed with, or furnished to, the SEC. The “Investors” section of our website contains a significant amount of information about our Company, including financial and other information for investors. The information that we post on the “Investors” section of our website could be deemed to be material information. We encourage investors, the media and others interested in Jabil to visit our website. Information on our website, however, is not a part of this report.
9
Table of Contents
Our operating results may fluctuate due to a number of factors, many of which are beyond our control.
Our annual and quarterly operating results are affected by a number of factors, including:
| • | adverse changes in current macro-economic conditions, both in the U.S. and internationally; |
| • | how well we execute on our strategy and operating plans, and the impact of changes in our business model; |
| • | the volume and timing of orders placed by our customers; |
| • | the level of capacity utilization of our manufacturing facilities and associated fixed costs; |
| • | the composition of the costs of revenue among materials, labor and manufacturing overhead; |
| • | price competition; |
| • | changes in demand for our products or services, as well as the volatility of these changes; |
| • | changes in demand in our customers’ end markets, as well as the volatility of these changes; |
| • | our exposure to financially-troubled customers; |
| • | any potential future termination, or substantial winding down, of significant customer relationships; |
| • | our level of experience in manufacturing particular products; |
| • | the degree of automation used in our assembly process; |
| • | the efficiencies achieved in managing inventories and property, plant and equipment; |
| • | significant costs incurred in acquisitions and other transactions; |
| • | fluctuations in the cost and availability of materials; |
| • | adverse changes in political conditions, both in the U.S. and internationally, including among other things, adverse changes in tax laws and rates (and government interpretations thereof), adverse changes in trade policies and adverse changes in fiscal and monetary policies; |
| • | seasonality in customers’ product demand; |
| • | the timing of expenditures in anticipation of increased sales, customer product delivery requirements and shortages of components or labor; |
| • | changes in stock-based compensation expense due to changes in the expected vesting of performance-based equity awards comprising a portion of such stock-based compensation expense; and |
| • | failure to comply with foreign laws, which could result in increased costs and/or taxes. |
Any one or a combination of these factors could adversely affect our annual and quarterly results of operations in the future. See “Management’s Discussion and Analysis of Financial Condition and Results of Operations – Results of Operations.”
If we do not manage our growth effectively, our profitability could decline.
Our business at times experiences periods of rapid growth which can place considerable demands upon our management team and our operational, financial and management information systems. Our ability to manage growth effectively requires us to continue to implement and improve these systems; avoid cost overruns; maintain customer, supplier and other favorable business relationships during transition periods; efficiently and effectively dedicate resources to existing customers; acquire or construct additional facilities; occasionally transfer operations to different facilities; acquire equipment in anticipation of demand; continue to develop the management skills of our managers and supervisors; adapt relatively quickly to new markets or technologies and continue to train, motivate and manage our employees. Our failure to effectively manage growth, as well as our failure to realize the anticipated benefits of the actions we take to try to manage our growth, could have a material adverse effect on our results of operations. See “Management’s Discussion and Analysis of Financial Condition and Results of Operations.”
10
Table of Contents
Because we depend on a limited number of customers, a reduction in sales to any one of those customers could cause a significant decline in our revenue.
We currently depend, and expect to continue to depend for the foreseeable future, upon a relatively small number of customers for a significant percentage of our net revenue and upon their growth, viability and financial stability. See “Business – The Company.” In some instances, particular manufacturing services we provide for a customer represent a significant portion of the overall revenue we receive from that customer. As a result of this concentration, a reduction in business from one or more of our largest customers could have a material adverse effect on our results of operations. In addition, if one or more of our significant customers were to become insolvent or otherwise become unable to pay us on a timely basis, or at all, our operating results and financial condition could be adversely affected.
Consolidation among our customers exposes us to increased risks, including reduced revenue and dependence on a smaller number of customers. Increasing consolidation in industries that utilize our services may occur as companies combine to achieve further economies of scale and other synergies, which could result in an increase in excess manufacturing capacity as companies seek to divest manufacturing operations or eliminate duplicative product lines. Excess manufacturing capacity may increase pricing and competitive pressures for our industry as a whole and for us in particular. If one of our customers is acquired by another company that does not rely on us to provide services and has its own production facilities or relies on another provider of similar services, we may lose that customer’s business. Such consolidation among our customers may further reduce the number of customers that generate a significant percentage of our net revenue and expose us to increased risks relating to dependence on a small number of customers.
Our customers face numerous competitive challenges, which may materially adversely affect their business and ours.
Factors adversely affecting our customers may also adversely affect us. These factors include:
| • | recessionary periods in our customers’ markets; |
| • | the inability of our customers to adapt to rapidly changing technology and evolving industry standards, which may contribute to short product life cycles or shifts in our customers’ strategies; |
| • | the inability of our customers to develop, market or gain commercial acceptance of their products, some of which are new and untested; |
| • | the potential that our customers’ products become commoditized or obsolete; |
| • | loss of business or a reduction in pricing power experienced by our customers; |
| • | the emergence of new business models or more popular products and shifting patterns of demand; and |
| • | a highly-competitive consumer products industry, which is often subject to shorter product lifecycles, shifting end-user preferences and higher revenue volatility. |
If our customers are unsuccessful in addressing these competitive challenges, their businesses may be materially adversely affected, reducing the demand for our services, decreasing our revenues or altering our production cycles and inventory management, each of which could adversely affect our ability to cover fixed costs and our gross profit margins and results of operations.
Most of our customers do not commit to long-term production schedules, and they may cancel their orders, change production quantities, delay production or change their sourcing strategy, which makes it difficult for us to schedule production and manage capital expenditures and to maximize the efficiency of our manufacturing capacity.
Most of our customers do not commit to firm production schedules for more than one quarter. We make significant decisions, including determining the levels of business that we will seek and accept, production schedules, component procurement commitments, personnel needs and other resource requirements, based on our estimate of customer requirements. Our inability to forecast the level of customer orders with certainty makes it difficult to schedule production and maximize utilization of our manufacturing capacity. In the past, we have been required to increase staffing and other expenses in order to meet the anticipated demand. On occasion, customers may require rapid increases in production for one or more of their products or request that we relocate our manufacturing operations or transfer manufacturing from one facility to another, which can stress our resources and reduce operating margins.
Customers have canceled their orders, changed production quantities, delayed production, changed their sourcing strategy and terminated their relationships with us. We cannot assure you that present or future customers will not terminate their service arrangements with us or significantly change, reduce or delay the amount of services ordered. Such changes, delays and cancellations have led to, and may lead in the future to a decline in our production and our possession of excess or obsolete inventory that we may not be able to sell to customers or third parties. This may result in write downs of inventories, a
11
Table of Contents
reduction in the number of products that we sell, delays in payment for inventory that we purchased, and reductions in the use of our manufacturing facilities. As many of our costs and operating expenses are relatively fixed, a reduction in customer demand, particularly a reduction in demand for a product that represents a significant amount of our revenue, can harm our gross profit margins and results of operations.
In addition, we sometimes experience difficulty forecasting the timing of our receipt of revenue and earnings from customers. The necessary process to begin manufacturing can be lengthy. Because we make capital expenditures during this ramping-up process and do not receive revenue until after we produce and ship the customer’s products, any delays or unanticipated costs in the ramping-up process may have a significant adverse effect on our cash flows and our results of operations. Servicing our largest customers may also require us to increase our capital expenditures.
Customer relationships with emerging companies may present more risks than with established companies.
Customer relationships with emerging companies present special risks because we do not have an extensive product or customer relationship history. There is less demonstration of market acceptance of their products making it harder for us to anticipate requirements than with established customers. Our credit risk on these customers, especially in trade accounts receivable and inventories, and the risk that these customers will be unable to fulfill indemnification obligations to us are potentially increased. We sometimes offer these customers extended payment terms, loans and other support and financial accommodations which may increase our financial exposure.
Exposure to financially troubled customers or suppliers may adversely affect our financial results.
We provide manufacturing services to companies and industries that have in the past, and may in the future, experience financial difficulty. If our customers experience financial difficulty, we could have difficulty recovering amounts owed to us from these customers, or demand for our products from these customers could decline. Additionally, if our suppliers experience financial difficulty, we could have difficulty sourcing supplies necessary to fulfill production requirements. If one or more of our customers were to become insolvent or otherwise were unable to pay for the services provided by us on a timely basis, or at all, our operating results and financial condition could be adversely affected. Such adverse effects could include one or more of the following: an increase in our provision for doubtful accounts, a charge for inventory writeoffs, a reduction in revenue, and an increase in our working capital requirements due to higher inventory levels and increases in days our accounts receivable are outstanding. In addition, because we securitize certain of our accounts receivable, our securitization programs could be negatively affected by customer financial difficulty affecting the recovery of a significant amount of receivables.
The success of our business is dependent on our ability to keep pace with technological changes and competitive conditions in our industry, and our ability to effectively adapt our services as our customers react to technological changes and competitive conditions in their respective industries.
If we are unable to offer technologically advanced, cost effective, quick response manufacturing services that are differentiated from our competition and adapt those services as our customers’ requirements change, demand for our services will decline.
Introducing new business models or programs requiring implementation of new competencies, such as new process technologies and our development of new products or services for customers, could affect our operations and financial results.
The introduction of new business models or programs requiring implementation or development of new competencies, such as new process technology within our operations and our independent development of new products or services for customers, presents challenges in addition to opportunities. The success of new business models or programs depends on a number of factors including, but not limited to, a sufficient understanding of the new business or markets, timely and successful product development (by us and/or our customer), market acceptance, our ability to manage the risks associated with new product production ramp-up, the effective management of purchase commitments and inventory levels in line with anticipated product demand, our development or acquisition of appropriate intellectual property, the availability of supplies in adequate quantities and at appropriate costs to meet anticipated demand, and the risk that new products may have quality or other defects in the early stages of introduction. Accordingly, we cannot determine in advance the ultimate result of new business models or programs.
As a result, we must make long-term investments, develop or obtain appropriate intellectual property and commit significant resources before knowing whether our assumptions will accurately reflect customer demand for our services. After the development of a new business model or program, we must be able to manufacture appropriate volumes quickly and at low cost. To accomplish this, we endeavor to accurately forecast volumes, mixes of products and configurations that meet customer requirements; however, we may not succeed at doing so.
12
Table of Contents
We compete with numerous other diversified manufacturing service providers, electronic manufacturing services and design providers and others.
Our business is highly competitive and our manufacturing processes are generally not subject to significant proprietary protection. We compete against numerous domestic and foreign electronic manufacturers, manufacturing service providers and design providers. Past consolidation in our industry has resulted in larger and more geographically diverse competitors who have significant combined resources. The significant purchasing power and market power of these large companies could increase pricing and competitive pressures for us. Most of our competitors have international operations and significant financial resources and some have substantially greater manufacturing, research and development (R&D) and marketing resources. These competitors may:
| • | respond more quickly to new or emerging technologies or changes in customer requirements; |
| • | have technological expertise, engineering capabilities and/or manufacturing resources that are greater than ours; |
| • | have greater name recognition, critical mass and geographic market presence; |
| • | be better able to take advantage of acquisition opportunities; |
| • | devote greater resources to the development, promotion and sale of their services and execution of their strategy; |
| • | be better positioned to compete on price for their services; |
| • | have excess capacity, and be better able to utilize such excess capacity; |
| • | have greater direct buying power from component suppliers, distributors and raw material suppliers; |
| • | have lower cost structures as a result of their geographic location or the services they provide; |
| • | be willing or able to make sales or provide services at lower margins than we do; |
| • | have increased vertical capabilities providing them greater cost savings. |
We also face competition from the manufacturing operations of our current and potential customers, who are continually evaluating the merits of manufacturing products internally against the advantages of outsourcing. In the past, some of our customers moved a portion of their manufacturing from us in order to more fully utilize their excess internal manufacturing capacity.
The actions of competitors and current and potential customers could cause a decline in our sales and/or compression of our profits.
Our business could be adversely affected by any delays, or increased costs, resulting from common carrier or transportation issues.
We rely on a variety of common carriers to transport our materials from our suppliers and to our customers. Problems suffered by any of these common carriers, including natural disaster, labor problems, increased energy prices, or criminal activity, could result in shipping delays for products or materials, increased costs or other supply chain disruptions, and could therefore have a negative impact on our ability to receive products from suppliers and deliver products to customers, resulting in a material adverse effect on our operations.
We may not be able to maintain our engineering, technological and manufacturing expertise.
Many of the markets for our manufacturing and engineering services are characterized by rapidly changing technology and evolving process development. The continued success of our business will depend upon our ability to:
| • | hire, retain and expand our pool of qualified engineering and technical personnel; |
| • | maintain and continually improve our technological expertise; |
| • | develop and market manufacturing services that meet changing customer needs; and |
| • | anticipate and respond to technological changes in manufacturing processes on a cost-effective and timely basis. |
13
Table of Contents
Although we use the assembly and testing technologies, equipment and processes that are currently required by our customers, we cannot be certain that we will be able to maintain or develop the capabilities required by our customers in the future. The emergence of new technology, industry standards or customer requirements may render our equipment, inventory or processes obsolete or noncompetitive. The acquisition and implementation of new technologies and equipment and the offering of new or additional services to our customers may require significant expense or capital investment, which could reduce our operating margins and our operating results. In facilities that we newly establish or acquire, we may not be able to insert or maintain our engineering, technological and manufacturing process expertise. Our failure to anticipate and adapt to our customers’ changing technological needs and requirements or to hire sufficient personnel to maintain our engineering, technological and manufacturing expertise could have a material adverse effect on our results of operations.
We depend on attracting and retaining officers, managers and skilled personnel.
Our success depends to a large extent upon the continued services of our officers, managers and skilled personnel. These employees are not generally bound by employment or non-competition agreements, and we cannot assure you that we will retain them. To aid in managing our growth and strengthening our pool of management and skilled personnel, we will need to internally develop, recruit and retain skilled management personnel. If we are not able to do so, our business and our ability to continue to grow could be harmed.
We depend on a limited number of suppliers for components that are critical to our manufacturing processes. A shortage of these components or an increase in their price could interrupt our operations and reduce our profit, increase our inventory carrying costs, increase our risk of exposure to inventory obsolescence and cause us to purchase components of a lesser quality.
Most of our significant long-term customer contracts permit quarterly or other periodic adjustments to pricing based on decreases and increases in component prices and other factors; however, we typically bear the risk of component price increases that occur between any such re-pricings or, if such re-pricing is not permitted, during the balance of the term of the particular customer contract. Accordingly, certain component price increases could adversely affect our gross profit margins and results of operations.
Some of the products we manufacture require one or more components that are only available from a single source. Some of these components are subject to supply shortages from time to time. In some cases, supply shortages will substantially curtail production of all assemblies using a particular component. A supply shortage can also increase our cost of goods sold if we have to pay higher prices for components in limited supply, or cause us to have to redesign or reconfigure products to accommodate a substitute component. In the past there have been industry wide conditions, natural disasters and global events that have caused material shortages. Our production of a customer’s product could be negatively impacted by any quality, reliability or availability issues with any of our component suppliers. The financial condition of our suppliers could affect their ability to supply us with components and their ability to satisfy any warranty obligations they may have, which could have a material adverse effect on our results of operations.
If a component shortage is threatened or anticipated, we may purchase such components early to avoid a delay or interruption in our operations. Purchasing components early may cause us to incur additional inventory carrying costs and may cause us to experience inventory obsolescence, both of which may not be recoverable from our customers and could adversely affect our gross profit margins and net income. A component shortage may also require us to look to second tier vendors or to procure components through brokers with whom we are not familiar. These components may be of lesser quality than those we have historically purchased and could cause us to incur costs to bring such components up to our quality levels or to replace defective ones. See “Management’s Discussion and Analysis of Financial Condition and Results of Operations” and “Business – Components Procurement.”
We derive a substantial majority of our revenues from our international operations, which may be subject to a number of different risks and often require more management time and expense than our domestic operations.
Our international operations are subject to a number of risks, including:
| • | difficulties in staffing and managing foreign operations and attempting to ensure compliance with our policies, procedures, and applicable local laws; |
| • | less flexible employee relationships that can be difficult and expensive to terminate due to, among other things, labor laws and regulations; |
14
Table of Contents
| • | rising labor costs (including the introduction or expansion of certain social programs), in particular within the lower-cost regions in which we operate, due to, among other things, demographic changes and economic development in those regions; |
| • | labor unrest and dissatisfaction, including potential labor strikes or claims; |
| • | increased scrutiny by the media and other third parties of labor practices within our industry (including working conditions, compliance with employment and labor laws and compensation) which may result in allegations of violations, more stringent and burdensome labor laws and regulations, higher labor costs and/or loss of revenues if our customers become dissatisfied with our labor practices and diminish or terminate their relationship with us; |
| • | burdens of complying with a wide variety of foreign laws, including those relating to export and import duties, domestic and foreign import and export controls, trade barriers (including tariffs and quotas), environmental policies and privacy issues, and local statutory corporate governance rules; |
| • | risk of non-compliance with the U.S. Foreign Corrupt Practices Act (the “FCPA”) or similar regulations in other jurisdictions; |
| • | less favorable, or relatively undefined, intellectual property laws; |
| • | lack of sufficient or available locations from which to operate or inability to renew leases on terms that are acceptable to us or at all; |
| • | unexpected changes in regulatory requirements and laws or government or judicial interpretations of such regulatory requirements and laws and adverse trade policies, and adverse changes to any of the policies of either the U.S. or any of the foreign jurisdictions in which we operate; |
| • | adverse changes in tax rates or accounting rules and the manner in which the U.S. and other countries tax multinational companies or interpret their tax laws or accounting rules or restrictions on the transfer of funds to us from our operations outside the U.S.; |
| • | limitations on imports or exports of components or products, or other trade sanctions; |
| • | political and economic instability and unsafe working conditions; |
| • | risk of governmental expropriation of our property; |
| • | inadequate infrastructure for our operations (e.g., lack of adequate power, water, transportation and raw materials); |
| • | legal or political constraints on our ability to maintain or increase prices; |
| • | health concerns and related government actions; |
| • | increased travel costs and difficulty in coordinating our communications and logistics across geographic distances and multiple time zones; |
| • | longer customer payment cycles and difficulty collecting trade accounts receivable; |
| • | fluctuations in currency exchange rates; and |
| • | economies that are emerging or developing or that may be subject to greater currency volatility, negative growth, high inflation, limited availability of foreign exchange and other risks. |
In particular, a significant portion of our manufacturing, design, support and storage operations are conducted in our facilities in China, and revenues associated with our China operations are important to our success. Therefore, our business, financial condition and results of operations may be materially adversely affected by economic, political, legal, regulatory, competitive and other factors in China. International trade disputes with China could result in tariffs and other measures that could adversely affect the Company’s business. The Chinese economy differs from the economies of most developed countries in many respects, including the level of government involvement and control over economic growth. In addition, our operations in China are governed by Chinese laws, rules and regulations, some of which are relatively new. The Chinese legal system continues to rapidly evolve, which may result in uncertainties with respect to the interpretation and enforcement of Chinese laws, rules and regulations that could have a material adverse effect on our business. China experiences high turnover of direct labor in the manufacturing sector due to the intensely competitive and fluid market for labor, and the retention of adequate labor is a challenge. If our labor turnover rates are higher than we expect, or we otherwise fail to adequately manage our labor needs, then our business and results of operations could be adversely affected. We are also subject to risks associated with our subsidiaries organized in China. For example, regulatory and registration requirements and government approvals affect the financing that we can provide to our subsidiaries. If we fail to receive required registrations and approvals to fund our subsidiaries organized in China, or if our ability to remit currency out of China is limited, then our business and liquidity could be adversely affected.
15
Table of Contents
These factors may harm our results of operations. Also, any measures that we may implement to reduce risks of our international operations may not be effective, may increase our expenses and may require significant management time and effort. Entry into new international markets requires considerable management time as well as start-up expenses related to market, personnel and facilities development before any significant revenue is generated. As a result, initial operations in a new market may operate at low margins or may be unprofitable.
Although we have implemented policies and procedures designed to cause compliance with the FCPA and similar laws, there can be no assurance that all of our employees and agents, as well as those companies to which we outsource certain of our business operations, will not take actions in violation of our policies which could have a material adverse effect on our operations.
We have on occasion not achieved, and may not in the future achieve, expected profitability from our acquisitions.
We have in the past and will continue to seek and complete acquisitions. We cannot assure you that we will be able to successfully integrate the operations and management of our recent acquisitions. Similarly, we cannot assure you that we will be able to identify future strategic acquisitions and adequately conduct due diligence, consummate these potential acquisitions on favorable terms, if at all, or if consummated, successfully integrate the operations and management of future acquisitions. Acquisitions involve significant risks, which could have a material adverse effect on us including:
| • | Financial risks, such as: (1) overpayment; (2) an increase in our expenses and working capital requirements; (3) exposure to liabilities of the acquired businesses, with contractually-based time and monetary limitations on a seller’s obligation to indemnify us; (4) integration costs or failure to achieve synergy targets; (5) incurrence of additional debt; (6) valuation of goodwill and other intangible assets; (7) possible adverse tax and accounting effects; (8) the risk that we acquire manufacturing facilities and assume significant contractual and other obligations with no guaranteed levels of revenue; (9) the risk that, in the future, we may have to close or sell acquired facilities at our cost, which may include substantial employee severance costs and asset write-offs, which have resulted, and may result, in our incurring significant losses; and (10) costs associated with environmental risks including fines, remediation and clean-up. |
| • | Operating risks, such as: (1) the diversion of management’s attention and resources to the integration of the acquired businesses and their employees and to the management of expanding operations; (2) the risk that the acquired businesses will fail to maintain the quality of services that we have historically provided; (3) the need to implement financial and other systems and add management resources; (4) the need to maintain customer, supplier or other favorable business relationships of acquired operations and restructure or terminate unfavorable relationships; (5) the potential for deficiencies in internal controls of the acquired operations; (6) the inability to attract and retain the employees necessary to support the acquired businesses; (7) potential inexperience in a line of business that is either new to us or that has become materially more significant to us as a result of the transaction; (8) unforeseen difficulties (including any unanticipated liabilities) in the acquired operations; (9) the impact on us of any unionized work force we may acquire or any labor disruptions that might occur; (10) the possibility that the acquired business’s past transactions or practices before our acquisition may lead to future commercial or regulatory risks; (11) the difficulty of presenting a unified corporate image; (12) the possibility that we will have unutilized capacity due to our acquisition activity; (13) when acquiring an operation from a customer and continuing or entering into a supply arrangement, our inability to meet the expectations of the customer as to volume, product quality, timeliness and cost reductions. |
Although we conduct what we believe to be a prudent level of due diligence regarding the businesses we purchase, in light of the circumstances of each transaction, an unavoidable level of risk remains regarding the actual condition of these businesses. Until we actually assume operating control of such businesses and their assets and operations, we may not be able to ascertain the actual value or understand the potential liabilities of the acquired entities and their operations.
Most of our acquisitions involve operations outside of the U.S., which are subject to various risks including those described in “Risk Factors – We derive a substantial majority of our revenue from our international operations, which may be subject to a number of risks and often require more management time and expense than our domestic operations.”
We have acquired and may continue to pursue the acquisition of manufacturing and supply chain management operations from our customers (or potential customers). In these acquisitions, the divesting company will typically enter into a supply arrangement with the acquirer. Therefore, our competitors often also pursue these acquisitions. In addition, certain divesting
16
Table of Contents
companies may choose not to offer to sell their operations to us because of our current supply arrangements with other companies or may require terms and conditions that may impact our profitability. If we are unable to attract and consummate some of these acquisition opportunities at favorable terms, our growth and profitability could be adversely impacted.
We have expanded the primary scope of our acquisitions strategy beyond focusing on acquisition opportunities presented by companies divesting internal manufacturing operations. As we continue to pursue acquisitions that diversify our business into new industry sectors with new customers and services, the amount and scope of the risks associated may extend beyond those that we have traditionally faced in making acquisitions. These risks include greater uncertainties in the financial benefits and potential liabilities associated with this expanded base of acquisitions.
We face risks arising from the restructuring of our operations.
Over the past several years, we have undertaken initiatives to restructure our business operations with the intention of improving utilization and realizing cost savings. These initiatives have included changing the number and location of our production facilities, largely to align our capacity and infrastructure with current and anticipated customer demand. The process of restructuring entails, among other activities, moving production between facilities, transferring programs from higher cost geographies to lower cost geographies, closing facilities, reducing the level of staff, realigning our business processes and reorganizing our management.
Restructurings could adversely affect us, including a decrease in employee morale, delays encountered in finalizing the scope of, and implementing, the restructurings, failure to achieve targeted cost savings, and failure to meet operational targets and customer requirements due to the restructuring process. These risks are further complicated by our extensive international operations, which subject us to different legal and regulatory requirements that govern the extent and speed of our ability to reduce our manufacturing capacity and workforce.
When financial markets experience significant turmoil, the financial arrangements we may need to enter into, refinance or repay and our customers may be adversely affected.
Credit market turmoil could negatively impact the counterparties and lenders to our forward foreign exchange contracts, trade accounts receivable securitization and sale programs, unsecured credit and term loan facilities, various foreign subsidiary credit facilities and other debt facilities. These potential negative impacts could limit our ability to borrow under these financing agreements, contracts, facilities and programs or renew or obtain future additional financing. Credit market turmoil could also negatively impact certain of our customers and certain of their respective customers, which could cause them to reduce or cancel their orders and have a negative effect on our results of operations.
We can offer no assurance under the uncommitted trade accounts receivable sales programs that if we attempt to sell receivables through such programs in the future that we will receive funding from the associated banks, which would require us to utilize other available sources of liquidity, including our revolving credit facilities.
We are subject to extensive government regulations and industry standards and the terms of complex contracts; a failure to comply with current and future regulations and standards, or the terms of our contractual arrangements, could have an adverse effect on our business, customer relationships, reputation and profitability.
We are subject to extensive government regulation and industry standards relating to the products we design and manufacture as well as how we conduct our business, including regulations and standards relating to labor and employment practices, workplace health and safety, the environment, sourcing and import/export practices, the market sectors we support, privacy and data protection, the regulations that apply to government contracts, and many other facets of our operations. The regulatory climate in the U.S. and other countries has become increasingly complex and fragmented, and regulatory activity has increased in recent periods. Failure or noncompliance with such regulations or standards could have an adverse effect on our reputation, customer relationships, profitability and results of operations. In addition, we annually enter into a large number of complex contractual arrangements as well as operate pursuant to the terms of a significant number of ongoing intricate contractual arrangements. Our failure to comply with the terms of such arrangements could have an adverse effect on our reputation, customer relationships, profitability and results of operations.
17
Table of Contents
If we manufacture products containing design or manufacturing defects, demand for our services may decline, our reputation may be damaged and we may be subject to liability claims.
Our customers’ products and the manufacturing processes and design services that we use to produce them often are highly complex. Defects in the products we manufacture or design, whether caused by a design, manufacturing or component failure or error, or deficiencies in our manufacturing processes, may result in delayed shipments to customers or reduced or canceled customer orders. If these defects or deficiencies are significant, our business reputation may also be damaged. The failure of the products that we manufacture or of our manufacturing processes or facilities may subject us to regulatory enforcement, fines or penalties and, in some cases, require us to shut down, temporarily halt operations or incur considerable expense to correct a manufacturing process or facility. In addition, these defects may result in liability claims against us, expose us to liability to pay for the recall or remanufacture of a product or adversely affect product sales or our reputation. Even if our customers are responsible for the defects or defective specifications, they may not, or may not have resources to, assume responsibility for any costs or liabilities arising from these defects, which could expose us to additional liability claims. Any of these actions could increase our expenses, reduce our revenue or damage our reputation as a supplier to these customers.
We may face heightened liability risks specific to our medical device business as a result of additional healthcare regulatory related compliance requirements and the potential severe consequences (e.g., death or serious injury) that could result from manufacturing defects or malfunctions of the medical devices we manufacture or design.
As a service provider engaged in the business of designing and manufacturing medical devices for our customers, we have compliance requirements in addition to those relating to other industries we serve within our business. We are required to register with the U.S. Food and Drug Administration (“FDA”) and are subject to periodic inspection by the FDA for compliance with the FDA’s Quality System Regulation (“QSR”), including current Good Manufacturing Practices (cGMPs). This regulation establishes requirements for manufacturers of medical devices to implement design and process manufacturing controls, quality control, labeling, handling and documentation procedures. The FDA, through periodic inspections and post-market surveillance, continuously and rigorously monitors compliance with these QSR requirements and other applicable regulatory requirements. If any FDA inspection reveals noncompliance, and we do not address the FDA’s concerns to its satisfaction, the FDA may elect to take enforcement action against us, including issuing inspection observations or a notice of violation or a warning letter, imposing fines, bringing an action against the Company and its officers, requiring a recall of the products we manufactured, issuing an import detention on products entering the U.S. from an offshore facility or temporarily halting operations at or shutting down a manufacturing facility.
Beyond the FDA, our medical device business is also subject to applicable state and foreign regulatory requirements. Within the European Union (“EU”), we are required to fulfill certain internationally recognized standards and must undergo periodic inspections to obtain and maintain certifications to these standards. Continued noncompliance to the EU regulations could stop the flow of products into the EU from us or from our customers. In China, the Safe Food and Drug Administration controls and regulates the manufacture and commerce of healthcare products. We must comply with the regulatory laws applicable to medical device manufactures or our ability to manufacture products in China could be impacted. In Japan, the Pharmaceutical Affairs Laws regulate the manufacture and commerce of healthcare products. These regulations also require that subcontractors manufacturing products intended for sale in Japan register with authorities and submit to regulatory audits. Other foreign countries where we operate have similar laws regarding the regulation of medical device manufacturing. In the event of any noncompliance with these requirements, interruption of our operations and/or ability to allow commerce in these markets could occur, which in turn could cause our reputation and business to suffer.
Compliance or the failure to comply with current and future environmental, health and safety, product stewardship and producer responsibility laws or regulations could cause us significant expense.
We are subject to a variety of federal, state, local and foreign environmental, health and safety, product stewardship and producer responsibility laws and regulations, including those relating to the use, generation, storage, discharge and disposal of hazardous chemicals used during our manufacturing process, those governing worker health and safety, those requiring design changes, supply chain investigation or conformity assessments and those relating to the recycling or reuse of products we manufacture. If we fail to comply with any present or future regulations or timely obtain any needed permits, we could become subject to liabilities, and we could face fines or penalties, the suspension of production, or prohibitions on sales of products we manufacture. In addition, such regulations could restrict our ability to expand our facilities or could require us to acquire costly equipment, or to incur other significant expenses, including expenses associated with the recall of any non-compliant product or with changes in our operational, procurement and inventory management activities.
Certain environmental laws impose liability for the costs of investigation, removal and remediation of hazardous or toxic substances on an owner, occupier or operator of real estate, or on parties who arranged for hazardous substance treatment or disposal, even if such person or company was unaware of, or not responsible for, contamination at the affected site. Soil and groundwater contamination may have occurred at or near, or may have arisen from, some of our facilities. From time to time we investigate, remediate and monitor soil and groundwater contamination at certain of our operating sites. In certain instances where contamination existed prior to our ownership or occupation of a site, landlords or former owners have retained some contractual responsibility for contamination and remediation. However, failure of such persons to perform those obligations
18
Table of Contents
could result in us being required to address such contamination. As a result, we may incur clean-up costs in such potential removal or remediation efforts. In other instances, we may be responsible for clean-up costs and other liabilities, including the possibility of claims due to health risks by both employees and non-employees, as well as other third-party claims in connection with contaminated sites.
In addition, there is an increasing governmental focus around the world on global warming and environmental impact issues, which may result in new environmental, health and safety regulations that may affect us, our suppliers and our customers. This could cause us to incur additional direct costs for compliance, as well as increased indirect costs resulting from our customers, suppliers or both incurring additional compliance costs that get passed on to us. These costs may adversely impact our operations and financial condition.
We have limited insurance coverage for potential environmental liabilities associated with current operations and we do not anticipate increasing such coverage in the future.
Our manufacturing, production and design processes and services may result in exposure to intellectual property infringement and other claims.
Providing manufacturing services can expose us to potential claims that products, designs or manufacturing processes we use infringe third party intellectual property rights. Even though many of our manufacturing services contracts require our customers to indemnify us for infringement claims relating to their products, including associated product specifications and designs, a particular customer may not, or may not have the resources to, assume responsibility for such claims. In addition, we may be responsible for claims that our manufacturing processes or components used in manufacturing infringe third party intellectual property rights. Providing turnkey design solutions, and design and other services can expose us to different or greater potential liabilities than those we face providing just manufacturing services, including an increase in exposure to potential claims that products we design or supply, or materials or components we use, infringe third party property rights. Infringement claims could subject us to significant liability for damages, potential injunctive action, or hamper our normal operations such as by interfering with the availability of components. Regardless of merits of any such claim, it could be time-consuming and expensive to resolve, and have a material adverse effect on our results of operations and financial position. In the event of such a claim, we may spend significant amounts of money and effort to develop non-infringing alternatives or obtain and maintain licenses. We may not be successful in developing such alternatives or obtaining and maintaining such licenses on reasonable terms or at all. Our customers may be required to or decide to discontinue products that are alleged to be infringing rather than face continued costs of defending infringement claims, and such discontinuance may result in a significant decrease in our business and/or could have a material adverse effect on our results of operations and financial position. These risks may be heightened in connection with our customer relationships with emerging companies.
Components we purchase, products we design and/or manufacture and/or services we provide may infringe the intellectual property rights of third parties, some of whom may hold key intellectual property rights in areas in which we operate. Our customers or suppliers could also become subject to infringement claims. Patent clearance or licensing activities, if any, may be inadequate to anticipate and avoid third party claims. Additionally, customers for our services in which we have significant technology contributions, typically require that we indemnify them against the risk of intellectual property infringement. If any claims are brought against our customers, our suppliers or us for such infringement, regardless of their merits, we could be required to expend significant resources in the defense or settlement of such claims, or in the defense or settlement of related indemnification claims. In the event of a claim, we may be required to spend significant amounts of money and effort to develop non-infringing alternatives or obtain and maintain licenses. We may not be successful in developing such alternatives or obtaining or maintaining such licenses on reasonable terms or at all. We, our suppliers or our customers may be required to or decide to discontinue products which are alleged to be infringing rather than face continued costs of defending the infringement claims, and such discontinuance may result in a significant decrease in our business, and could have a material adverse effect on our results of operations and financial position.
The success of certain aspects of our business depends in part on our ability to obtain, protect and leverage intellectual property rights.
In certain circumstances, we strive to obtain and protect certain intellectual property rights related to solutions, designs, processes and products that we create. We believe that obtaining a significant level of protected proprietary technology may give us a competitive advantage. In addition to selectively relying on patent rights, we rely on unpatented proprietary know-how and trade secrets, and employ various methods, including non-disclosure agreements with our customers, employees and suppliers and our internal security systems, policies and procedures to protect our know-how and trade secrets. However, we cannot be certain the measures we employ will result in protected intellectual property rights or will result in the prevention of
19
Table of Contents
unauthorized use of our technology. If we are unable to obtain and protect intellectual property rights embodied within our solutions, designs, processes and products, this could reduce or eliminate competitive advantages of our proprietary technology, which would harm our business and could have a material adverse effect on our results of operations and financial position.
Even if we take steps to protect certain intellectual property rights, these mechanisms may not afford complete or sufficient protection, and misappropriation may still occur. Further, there can be no assurance that we will be able to acquire or enforce our patent or other rights, if any, and that others will not independently develop similar know-how and trade secrets, or develop better production methods than us. We have not historically sought patent protection for many of our proprietary processes, designs or other patentable intellectual property. Further, we may not be able to prevent current and former employees, contractors and other parties from breaching non-disclosure agreements and misappropriating proprietary information. If any of the foregoing occur, it could impair our ability to compete with others in our industry, result in a significant decrease in our business and/or could have material adverse effect on our results of operations and financial position.
Any delay in the implementation of our information systems could disrupt our operations and cause unanticipated increases in our costs.
We are currently in the process of completing the installation of an enterprise resource planning system in certain of our manufacturing facilities, which will replace the existing planning and financial information systems. Any delay in the implementation of these information systems could result in material adverse consequences, including disruption of operations, loss of information and unanticipated increases in costs.
Disruptions to our information systems, including security breaches, losses of data or outages, and other security issues, could adversely affect our operations.
We rely on information systems, some of which are owned and operated by third parties, to store, process and transmit confidential information, including financial reporting, inventory management, procurement, invoicing and electronic communications, belonging to our customers, our suppliers, our employees and/or us. We attempt to monitor and mitigate our exposure and modify our systems when warranted and we have implemented certain business continuity items including data backups at alternative sites. Nevertheless, these systems are vulnerable to, and at times have suffered from, among other things, damage from power loss or natural disasters, computer system and network failures, loss of telecommunication services, physical and electronic loss of data, terrorist attacks, security breaches and computer viruses. We regularly face attempts by others to access our information systems in an unauthorized manner, to introduce malicious software to such systems or both. The increased use of mobile technologies can heighten these and other operational risks. If we, or the third parties who own and operate certain of our information systems, are unable to prevent such breaches, losses of data and outages, our operations could be disrupted. Also, the time and funds spent on monitoring and mitigating our exposure and responding to breaches, including the training of employees, the purchase of protective technologies and the hiring of additional employees and consultants to assist in these efforts could adversely affect our financial results. The increasing sophistication of cyberattacks requires us to continually evaluate new technologies and processes intended to detect and prevent these attacks. There can be no assurance that the security measures we choose to implement will be sufficient to protect the data we manage. Finally, any theft or misuse of information resulting from a security breach could result in, among other things, loss of significant and/or sensitive information, litigation by affected parties, financial obligations resulting from such theft or misuse, higher insurance premiums, governmental investigations, negative reactions from current and potential future customers (including potential negative financial ramifications under certain customer contract provisions) and poor publicity and any of these could adversely affect our financial results.
We are subject to the risk of increased taxes.
We base our tax position upon the anticipated nature and conduct of our business and upon our understanding of the tax laws of the various countries in which we have assets or conduct activities. Our tax position, however, is subject to review and possible challenge by taxing authorities and to possible changes in law (including adverse changes to the manner in which the U.S. and other countries tax multinational companies or interpret their tax laws). We cannot determine in advance the extent to which some jurisdictions may assess additional tax or interest and penalties on such additional taxes. In addition, our effective tax rate may be increased by the generation of higher income in countries with higher tax rates, changes in the valuation of deferred tax assets and liabilities, changes in our cash management strategies, changes in local tax rates or countries adopting more aggressive interpretations of tax laws.
20
Table of Contents
In the United States, comprehensive tax legislation commonly referred to as the Tax Cuts and Jobs Act of 2017 (“Tax Act”) was enacted on December 22, 2017. The Tax Act contains a broad range of tax reform provisions that reduced the corporate tax rate, limited or eliminated certain tax deductions, and changed the taxation of foreign earnings of U.S. multinational companies. The Tax Act requires complex calculations to be performed that were not previously required in U.S. tax law, significant judgments, estimates in calculations, and the preparation and analysis of information not previously relevant or regularly produced. The U.S. Treasury Department, the Internal Revenue Service, and other standard-setting bodies could interpret or issue guidance on how provisions of the Tax Act will be applied or otherwise administered that are different from our interpretation. In response to the Tax Act, foreign governments may enact new tax laws or new interpretations of the existing tax laws. The full extent of the impact remains uncertain at this time and could adversely impact our effective tax rate and operating results.
Refer to Note 4 – “Income Taxes” to the Consolidated Financial Statements for details of the field examinations completed by the Internal Revenue Service (“IRS”) of our tax returns for the fiscal years 2012 through 2014 and fiscal years 2009 through 2011 which resulted in proposed adjustments. While we currently believe that the resolution of these issues will not have a material adverse effect on our financial position, results of operations or cash flows, an unfavorable resolution could have a material adverse effect on our operating results and financial condition.
Several countries in which we are located allow for tax incentives to attract and retain business. We have obtained incentives where available and practicable. Our taxes could increase if certain tax incentives are retracted, which could occur if we are unable to satisfy the conditions on which such incentives are based, if they are not renewed upon expiration, or if tax rates applicable to us in such jurisdictions otherwise increase. It is not anticipated that any material tax incentives will expire within the next year. However, due to the possibility of changes in existing tax law and our operations, we are unable to predict how any expirations will impact us in the future. In addition, acquisitions may cause our effective tax rate to increase, depending on the jurisdictions in which the acquired operations are located.
Certain of our subsidiaries provide financing, products and services to, and may undertake certain significant transactions with, other subsidiaries in different jurisdictions. Several jurisdictions in which we operate have tax laws with detailed transfer pricing rules that require that all transactions with non-resident related parties be priced using arm’s length pricing principles, and that contemporaneous documentation must exist to support such pricing. There is a risk that the taxing authorities may not deem our transfer pricing documentation acceptable. In addition, the Organization for Economic Cooperation and Development continues to issue guidelines and proposals related to Base Erosion and Profit Shifting which may result in legislative changes that could reshape international tax rules in numerous countries and negatively impact our effective tax rate.
Our credit rating may be downgraded.
Our credit is and certain of our financial instruments are rated by credit rating agencies. Any potential future negative change in our credit ratings may make it more expensive for us to raise additional capital on terms that are acceptable to us, if at all; negatively impact the price of our common stock; increase our interest payments under existing debt agreements; and have other negative implications on our business, many of which are beyond our control. In addition, the interest rate payable under the 2017 Credit Facility (as such terms are defined in Note 8 – “Notes Payable and Long-Term Debt” to the Consolidated Financial Statements) is subject to adjustment from time to time if our credit ratings change. Thus, any potential future negative change in our credit rating may increase the interest rate payable on the 2017 Credit Facility and certain of our other borrowings.
Our amount of debt could significantly increase in the future.
The Company has a number of debt facilities. Refer to “Management’s Discussion and Analysis of Financial Condition and Results of Operations – Liquidity and Capital Resources” and Note 8 – “Notes Payable and Long-Term Debt” to the Consolidated Financial Statements for further details.
Should we desire to consummate significant additional acquisition opportunities, undertake significant additional expansion activities, or make substantial investments in our infrastructure or in support of customer opportunities, our capital needs would increase and could result in our need to increase available borrowings under our revolving credit facilities or access public or private debt and equity markets. There can be no assurance, however, that we would be successful in raising additional debt or equity on terms that we would consider acceptable. An increase in the level of our indebtedness, among other things, could:
| • | make it difficult for us to obtain any necessary financing in the future for other acquisitions, working capital, capital expenditures, debt service requirements or other purposes; |
| • | limit our flexibility in planning for, or reacting to changes in, our business; |
21
Table of Contents
| • | make us more vulnerable in the event of a downturn in our business; and |
| • | impact certain financial covenants that we are subject to in connection with our debt and asset-backed securitization programs. |
There can be no assurance that we will be able to meet future debt service obligations.
An adverse change in the interest rates for our borrowings could adversely affect our financial condition.
We pay interest on outstanding borrowings under our revolving credit facilities and certain other long term debt obligations at interest rates that fluctuate based upon changes in various base interest rates. An adverse change in the base rates upon which our interest rates are determined could have a material adverse effect on our financial position, results of operations and cash flows. If certain economic or fiscal issues occur, interest rates could rise, which would increase our interest costs and reduce our net income. Also, increased interest rates could make any future fixed interest rate debt obligations more expensive.
We are subject to risks of currency fluctuations and related hedging operations.
Although a significant number of our operations are located outside the United States, the majority of our business is conducted in U.S. dollars. Changes in exchange rates will affect our net revenue, cost of sales, operating margins and net income. We cannot predict the impact of future exchange rate fluctuations. We use financial instruments, primarily forward contracts, to hedge our exposure to exchange rate fluctuations. We believe that our hedging activities enable us to largely protect ourselves from future exchange rate fluctuations. If, however, these hedging activities are not successful, if the counterparties to these hedging activities default on their obligations to us or if we change or reduce these hedging activities in the future, we may experience significant unexpected expenses from fluctuations in exchange rates. In addition, certain countries in which we operate have adopted, or may adopt, currency controls requiring that local transactions be settled only in local currency. Such controls could require us to hedge larger amounts of local currency than we have in the past.
Changes in financial accounting standards or policies have affected, and in the future may affect, our reported financial condition or results of operations.
We prepare our financial statements in conformity with U.S. GAAP. These principles are subject to interpretation by the Financial Accounting Standards Board (FASB), the American Institute of Certified Public Accountants, the SEC and various bodies formed to interpret and create appropriate accounting policies. A change in these policies can have a significant effect on our reported results and may affect our reporting of transactions that are completed before a change is announced. Changes to those rules or questions as to how we interpret or implement them may have a material adverse effect on our reported financial results or on the way we conduct business. For example, significant changes to revenue recognition rules have been adopted and will begin to apply to us in fiscal year 2019.
Energy price increases may negatively impact our results of operations.
Certain of the components that we use in our manufacturing activities are petroleum-based. In addition, we, along with our suppliers and customers, rely on various energy sources (including oil) in our facilities and transportation activities. An increase in energy prices, which have been volatile historically, could cause an increase in our raw material costs and transportation costs. In addition, increased transportation costs of certain of our suppliers and customers could be passed along to us. We may not be able to increase our product prices enough to offset these increased costs. In addition, any increase in our product prices may reduce our future customer orders and profitability.
We are subject to risks associated with natural disasters, climate change and global events.
Our operations and those of our customers and suppliers may be subject to natural disasters, climate change-related events, or other business disruptions, which could seriously harm our results of operation and increase our costs and expenses. We are susceptible to losses and interruptions caused by hurricanes (including in Florida, where our headquarters are located), earthquakes, power shortages, telecommunications failures, water or other natural resource shortages, tsunamis, floods, typhoons, drought, fire, extreme weather conditions, rising sea level, geopolitical events such as direct or indirect terrorist acts or acts of war, other natural or manmade disasters, boycotts and sanctions or widespread criminal activities. Such events could make it difficult or impossible to manufacture or to deliver products to our customers, receive production materials from our suppliers, or perform critical functions, which could adversely affect our business globally or in certain regions. While we maintain similar manufacturing capacities at different locations and coordinate multi-source supplier programs on many of our materials, which we believe better enables us to respond to these types of events, we cannot be sure that our plans will fully protect us from all such disruptions. Our insurance coverage with respect to natural disasters is limited and is subject to deductibles and coverage limits. Such coverage may not be adequate, or may not continue to be available at commercially reasonable rates and terms.
22
Table of Contents
While we manufacture our products in a large number of diversified facilities and maintain insurance covering our facilities, including business interruption insurance, a catastrophic loss of the use of all or a portion of one of our key manufacturing facilities due to accident, labor issues, weather conditions, natural disaster or otherwise, whether short- or long-term, could have a material adverse effect on us.
Item 1B. Unresolved Staff Comments
There are no unresolved written comments from the SEC staff regarding our periodic or current reports.
23
Table of Contents
We own or lease facilities located in the countries listed below. We believe that our properties are generally in good condition, are well maintained and are generally suitable and adequate to carry out our business at expected capacity for the foreseeable future.
The table below lists the approximate square footage for our facilities as of August 31, 2018:
| Location | Approximate Square Footage |
Description of Use | ||||
| Austria |
97,000 | Design, Manufacturing | ||||
| Belgium |
66,000 | Design | ||||
| Brazil(2) |
314,000 | Manufacturing | ||||
| Canada |
13,000 | Design | ||||
| China(2)(3) |
22,729,000 | Design, Manufacturing, Prototype Manufacturing, Storage, Support | ||||
| Finland |
12,000 | Design | ||||
| France(1) |
80,000 | Manufacturing, Support | ||||
| Germany |
225,000 | Design, Manufacturing, Support | ||||
| Hungary |
1,451,000 | Manufacturing, Storage | ||||
| India(1) |
646,000 | Manufacturing, Storage, Support | ||||
| Indonesia |
210,000 | Manufacturing | ||||
| Ireland(2) |
354,000 | Manufacturing | ||||
| Israel |
212,000 | Design, Manufacturing, Support | ||||
| Italy(2) |
308,000 | Manufacturing, Storage | ||||
| Japan |
49,000 | Manufacturing, Support | ||||
| Malaysia |
1,413,000 | Manufacturing, Storage, Support | ||||
| Mexico(2) |
3,671,000 | Manufacturing, Storage, Support | ||||
| The Netherlands |
420,000 | Manufacturing | ||||
| Poland(2) |
705,000 | Manufacturing, Storage | ||||
| Russia(2) |
64,000 | Manufacturing | ||||
| Scotland(2) |
143,000 | Manufacturing, Support | ||||
| Singapore |
353,000 | Design, Manufacturing, Storage, Support | ||||
| South Africa(2) |
30,000 | Support | ||||
| Spain |
788,000 | Design, Manufacturing, Storage, Support | ||||
| Sweden |
1,000 | Support | ||||
| Taiwan |
1,210,000 | Design, Manufacturing, Support | ||||
| Ukraine |
259,000 | Manufacturing | ||||
| United States(2) |
8,497,000 | Design, Manufacturing, Prototype Manufacturing, Prototype Design, Support, Storage | ||||
| Vietnam |
293,000 | Manufacturing | ||||
|
|
|
|||||
| Total as of August 31, 2018 |
44,613,000 | |||||
|
|
|
|||||
| (1) | The facilities located in Chartes, France and Chennai, India are no longer used in our business operations. |
| (2) | A portion of the facilities located in Valinhos, Brazil; Chengdu, Wuhan and Yantai, China; St. Petersburg, Florida; Hanover Park, Illinois; Waterford, Ireland; Marcianise, Italy; Guadalajara, Mexico; Kwidzyn, Poland; Tver, Russia; Livingston, Scotland; Johannesburg, South Africa; and Memphis, Tennessee are not currently used in business operations. |
| (3) | The properties in China include approximately 5.9 million square feet of leased property in Chengdu, approximately 4.2 million square feet of property in Huangpu (of which approximately 2.6 million is owned and approximately 1.6 million is leased) and approximately 6.0 million square feet of property in Wuxi (of which approximately 5.2 million is leased and 0.8 million is owned). |
As of August 31, 2018, our facilities consist of 18,821,000 square feet in facilities that we own, with the remaining 25,792,000 square feet in leased facilities. The majority of the square footage in the table above is active manufacturing space. The properties listed in the table above are reported in both the EMS and DMS operating segments, as both segments use these properties. Our manufacturing facilities are ISO certified to ISO 9001:2008 standards and most are also certified to ISO-14001:2004 environmental standards.
24
Table of Contents
Table of Contents
PART II
Item 5. Market for Registrant’s Common Equity, Related Stockholder Matters and Issuer Purchases of Equity Securities
Market Information and Dividends
Our common stock trades on the New York Stock Exchange under the symbol “JBL.” The following table sets forth the high and low intraday sales prices per share for our common stock as reported on the New York Stock Exchange and the cash dividends declared per share for the fiscal periods indicated:
| Sales Price per Share | ||||||||||||||||||||||||
| Fiscal Year 2018 | Fiscal Year 2017 | Dividends per Share(1) | ||||||||||||||||||||||
| High | Low | High | Low | Fiscal Year 2018 | Fiscal Year 2017 | |||||||||||||||||||
| First Quarter |
$ | 31.60 | $ | 27.29 | $ | 23.85 | $ | 20.32 | $ | 0.08 | $ | 0.08 | ||||||||||||
| Second Quarter |
$ | 29.03 | $ | 23.70 | $ | 26.34 | $ | 20.43 | $ | 0.08 | $ | 0.08 | ||||||||||||
| Third Quarter |
$ | 31.77 | $ | 26.16 | $ | 30.00 | $ | 25.69 | $ | 0.08 | $ | 0.08 | ||||||||||||
| Fourth Quarter |
$ | 29.92 | $ | 26.39 | $ | 31.70 | $ | 28.27 | $ | 0.08 | $ | 0.08 | ||||||||||||
| (1) | See further discussion of our cash dividends declared to common shareholders in Note 11—“Stockholders’ Equity” to the Consolidated Financial Statements. |
We expect to continue to declare and pay quarterly dividends of an amount similar to our past declarations. However, the declaration and payment of future dividends are discretionary and will be subject to determination by our Board of Directors each quarter following its review of our financial performance.
On October 9, 2018, the closing sales price for our common stock as reported on the New York Stock Exchange was $24.71. As of October 9, 2018, there were 1,380 holders of record of our common stock. A substantially greater number of holders of our common stock are “street name” or beneficial holders, whose shares are held of record by banks, brokers, and other financial institutions.
Information regarding equity compensation plans is incorporated by reference to the information set forth in Item 12 of Part III of this report.
Stock Performance Graph
The performance graph and table show a comparison of cumulative total stockholder return, assuming the reinvestment of dividends, from a $100 investment in the common stock of Jabil over the five-year period ending August 31, 2018, with the cumulative stockholder return of the (1) S&P MidCap 400 Index and (2) peer group which includes Celestica Inc., Catcher Technology Co., Ltd, Flex Ltd., Hon-Hai Precision Industry Co. Ltd, Plexus Corp., and Sanmina Corp.
26
Table of Contents
Comparison of 5 Year Cumulative Total Return
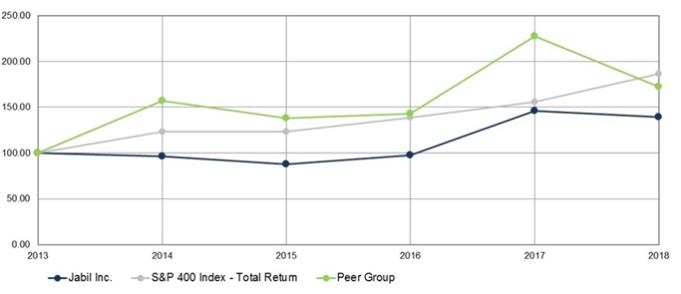
| August 31 | 2013 | 2014 | 2015 | 2016 | 2017 | 2018 | ||||||||||||||||||
| Jabil Inc. |
$ | 100 | $ | 96 | $ | 88 | $ | 97 | $ | 146 | $ | 139 | ||||||||||||
| S&P MidCap 400 Index – Total Returns |
100 | 123 | 123 | 138 | 156 | 187 | ||||||||||||||||||
| Peer Group |
100 | 157 | 138 | 143 | 228 | 172 | ||||||||||||||||||
Issuer Purchases of Equity Securities
The following table provides information relating to our repurchase of common stock during the three months ended August 31, 2018:
| Period | Total Number of Shares Purchased(1) |
Average Price Paid per Share |
Total Number of Shares Purchased as Part of Publicly Announced Program(2)(3) |
Approximate Dollar Value of Shares that May Yet Be Purchased Under the Program (in thousands) |
||||||||||||
| June 1, 2018 - June 30, 2018 |
1,330,709 | $ | 27.66 | 1,330,128 | $ | 447,037 | ||||||||||
| July 1, 2018 - July 31, 2018 |
1,629,279 | $ | 28.42 | 1,627,406 | $ | 400,795 | ||||||||||
| August 1, 2018 - August 31, 2018 |
1,791,201 | $ | 28.36 | 1,791,201 | $ | 350,000 | ||||||||||
|
|
|
|
|
|||||||||||||
| Total |
4,751,189 | $ | 28.18 | 4,748,735 | ||||||||||||
| (1) | The purchases include amounts that are attributable to shares surrendered to us by employees to satisfy, in connection with the vesting of restricted stock awards and the exercise of stock options and stock appreciation rights, their tax withholding obligations. |
| (2) | In July 2017, our Board of Directors authorized the repurchase of up to $450.0 million of our common stock as publicly announced in a press release issued on July 20, 2017 (the “2017 Share Repurchase Program”). The 2017 Share Repurchase Program expired on August 31, 2018. No authorization remains under the 2017 Share Repurchase Program. |
| (3) | In June 2018, our Board of Directors authorized the repurchase of up to $350.0 million of our common stock as publicly announced in a press release on June 14, 2018 (the “2018 Share Repurchase Program”). The 2018 Share Repurchase Program expires on August 31, 2019. |
Issuer Sale of Unregistered Securities
On August 16, 2018, as part of a commercial transaction with a third party, the Company issued a cash settled restricted stock appreciation right. The instrument has a ten-year term and will vest biannually, subject to the satisfaction of performance conditions. Assuming full vesting and exercise at the end of the term, the aggregate amount to be paid by the Company would not in any case exceed $26.0 million. The instrument was issued pursuant to the private placement exemption in Section 4(a)(2) of the Securities Act of 1933, as amended.
27
Table of Contents
Item 6. Selected Financial Data
The following selected data is derived from our Consolidated Financial Statements. This data should be read in conjunction with the Consolidated Financial Statements and notes thereto incorporated into Item 8, “Financial Statements and Supplementary Data” and with Item 7, “Management’s Discussion and Analysis of Financial Condition and Results of Operations.”
| Fiscal Year Ended August 31, | ||||||||||||||||||||
| 2018 | 2017 | 2016 | 2015 | 2014 | ||||||||||||||||
| (in thousands, except for per share data) | ||||||||||||||||||||
| Consolidated Statement of Operations Data: |
||||||||||||||||||||
| Net revenue |
$ | 22,095,416 | $ | 19,063,121 | $ | 18,353,086 | $ | 17,899,196 | $ | 15,762,146 | ||||||||||
|
|
|
|
|
|
|
|
|
|
|
|||||||||||
| Operating income |
542,153 | 410,230 | 522,833 | 555,411 | 204,074 | |||||||||||||||
|
|
|
|
|
|
|
|
|
|
|
|||||||||||
| Income from continuing operations before tax |
373,401 | 256,233 | 387,045 | 431,646 | 72,123 | |||||||||||||||
|
|
|
|
|
|
|
|
|
|
|
|||||||||||
| Income (loss) from continuing operations, net of tax |
87,541 | 127,167 | 254,896 | 294,185 | (1,588 | ) | ||||||||||||||
|
|
|
|
|
|
|
|
|
|
|
|||||||||||
| Discontinued operations, net of tax(1) |
— | — | — | (8,573 | ) | 243,853 | ||||||||||||||
|
|
|
|
|
|
|
|
|
|
|
|||||||||||
| Net income |
87,541 | 127,167 | 254,896 | 285,612 | 242,265 | |||||||||||||||
|
|
|
|
|
|
|
|
|
|
|
|||||||||||
| Net income attributable to Jabil Inc. |
$ | 86,330 | $ | 129,090 | $ | 254,095 | $ | 284,019 | $ | 241,313 | ||||||||||
|
|
|
|
|
|
|
|
|
|
|
|||||||||||
| Earnings per share attributable to the stockholders of Jabil Inc.: |
||||||||||||||||||||
| Basic: |
||||||||||||||||||||
| Income (loss) from continuing operations, net of tax |
$ | 0.50 | $ | 0.71 | $ | 1.33 | $ | 1.51 | $ | (0.01 | ) | |||||||||
|
|
|
|
|
|
|
|
|
|
|
|||||||||||
| Discontinued operations, net of tax(1) |
$ | — | $ | — | $ | — | $ | (0.04 | ) | $ | 1.20 | |||||||||
|
|
|
|
|
|
|
|
|
|
|
|||||||||||
| Net income |
$ | 0.50 | $ | 0.71 | $ | 1.33 | $ | 1.47 | $ | 1.19 | ||||||||||
|
|
|
|
|
|
|
|
|
|
|
|||||||||||
| Diluted: |
||||||||||||||||||||
| Income (loss) from continuing operations, net of tax |
$ | 0.49 | $ | 0.69 | $ | 1.32 | $ | 1.49 | $ | (0.01 | ) | |||||||||
|
|
|
|
|
|
|
|
|
|
|
|||||||||||
| Discontinued operations, net of tax(1) |
$ | — | $ | — | $ | — | $ | (0.04 | ) | $ | 1.20 | |||||||||
|
|
|
|
|
|
|
|
|
|
|
|||||||||||
| Net income |
$ | 0.49 | $ | 0.69 | $ | 1.32 | $ | 1.45 | $ | 1.19 | ||||||||||
|
|
|
|
|
|
|
|
|
|
|
|||||||||||
| Cash dividends declared per common share |
$ | 0.32 | $ | 0.32 | $ | 0.32 | $ | 0.32 | $ | 0.32 | ||||||||||
|
|
|
|
|
|
|
|
|
|
|
|||||||||||
| August 31, | ||||||||||||||||||||
| 2018 | 2017 | 2016 | 2015 | 2014 | ||||||||||||||||
| (in thousands) | ||||||||||||||||||||
| Consolidated Balance Sheets Data: |
||||||||||||||||||||
| Working capital(2) |
$ | 319,050 | $ | (243,910 | ) | $ | 280,325 | $ | 191,168 | $ | 1,037,920 | |||||||||
|
|
|
|
|
|
|
|
|
|
|
|||||||||||
| Total assets |
$ | 12,045,641 | $ | 11,095,995 | $ | 10,322,677 | $ | 9,591,600 | $ | 8,479,746 | ||||||||||
|
|
|
|
|
|
|
|
|
|
|
|||||||||||
| Current installments of notes payable and long-term debt |
$ | 25,197 | $ | 444,255 | $ | 44,689 | $ | 321,964 | $ | 11,750 | ||||||||||
|
|
|
|
|
|
|
|
|
|
|
|||||||||||
| Notes payable and long-term debt, less current installments |
$ | 2,493,502 | $ | 1,606,017 | $ | 2,046,655 | $ | 1,308,663 | $ | 1,639,916 | ||||||||||
|
|
|
|
|
|
|
|
|
|
|
|||||||||||
| Total Jabil Inc. stockholders’ equity |
$ | 1,950,257 | $ | 2,353,514 | $ | 2,438,171 | $ | 2,314,856 | $ | 2,241,828 | ||||||||||
|
|
|
|
|
|
|
|
|
|
|
|||||||||||
| Common stock shares outstanding |
164,588 | 177,728 | 186,998 | 192,068 | 194,114 | |||||||||||||||
|
|
|
|
|
|
|
|
|
|
|
|||||||||||
28
Table of Contents
| Fiscal Year Ended August 31, | ||||||||||||||||||||
| 2018 | 2017 | 2016 | 2015 | 2014 | ||||||||||||||||
| (in thousands) | ||||||||||||||||||||
| Consolidated Cash Flow Data: |
||||||||||||||||||||
| Net cash provided by operating activities |
$ | 933,850 | $ | 1,256,643 | $ | 916,207 | $ | 1,240,528 | $ | 499,639 | ||||||||||
| Investing activities: |
||||||||||||||||||||
| Acquisition of property, plant and equipment |
$ | (1,036,651 | ) | $ | (716,485 | ) | $ | (924,239 | ) | $ | (963,145 | ) | $ | (624,060 | ) | |||||
| Proceeds and advances from sale of property, plant and equipment |
$ | 350,291 | $ | 175,000 | $ | 26,031 | $ | 15,784 | $ | 161,138 | ||||||||||
| Financing activities: |
||||||||||||||||||||
| Payments to acquire treasury stock |
$ | (450,319 | ) | $ | (306,640 | ) | $ | (148,340 | ) | $ | (85,576 | ) | $ | (260,274 | ) | |||||
| (1) | During fiscal year 2014, we sold our Aftermarket Services business for consideration of $725.0 million. |
| (2) | Working capital is defined as current assets minus current liabilities. |
29
Table of Contents
Item 7. Management’s Discussion and Analysis of Financial Condition and Results of Operations
Overview
We are one of the leading providers of worldwide manufacturing services and solutions. We provide comprehensive electronics design, production and product management services to companies in various industries and end markets. We derive substantially all of our revenue from production and product management services (collectively referred to as “manufacturing services”), which encompass the act of producing tangible components that are built to customer specifications and are then provided to the customer.
We have two reporting segments: Electronics Manufacturing Services (“EMS”) and Diversified Manufacturing Services (“DMS”), which are organized based on the economic profiles of the services performed, including manufacturing capabilities, market strategy, margins, return on capital and risk profiles. Our EMS segment is focused around leveraging IT, supply chain design and engineering, technologies largely centered on core electronics, utilizing our large scale manufacturing infrastructure and our ability to serve a broad range of end markets. Our EMS segment is typically a lower-margin but high volume business that produces product at a quicker rate (i.e. cycle time) and in larger quantities and includes customers primarily in the automotive and transportation, capital equipment, computing and storage, defense and aerospace, digital home, industrial and energy, networking and telecommunications, point of sale and printing industries. Our DMS segment is focused on providing engineering solutions, with an emphasis on material sciences and technologies. Our DMS segment is typically a higher-margin business and includes customers primarily in the consumer wearables, healthcare, mobility and packaging industries.
Our cost of revenue includes the cost of electronic components and other materials that comprise the products we manufacture; the cost of labor and manufacturing overhead; and adjustments for excess and obsolete inventory. As a provider of turnkey manufacturing services, we are responsible for procuring components and other materials. This requires us to commit significant working capital to our operations and to manage the purchasing, receiving, inspecting and stocking of materials. Although we bear the risk of fluctuations in the cost of materials and excess scrap, we periodically negotiate cost of materials adjustments with our customers. Net revenue from each product that we manufacture consists of an element based on the costs of materials in that product and an element based on the labor and manufacturing overhead costs allocated to that product. Our gross margin for any product depends on the mix between the cost of materials in the product and the cost of labor and manufacturing overhead allocated to the product.
Our operating results are impacted by the level of capacity utilization of manufacturing facilities; indirect labor costs; and selling, general and administrative expenses. Operating income margins have generally improved during periods of high production volume and high capacity utilization. During periods of low production volume, we generally have reduced operating income margins.
We monitor the current economic environment and its potential impact on both the customers we serve as well as our end markets and closely manage our costs and capital resources so that we can try to respond appropriately as circumstances change.
We have consistently utilized advanced circuit design, production design and manufacturing technologies to meet the needs of our customers. To support this effort, our engineering staff focuses on developing and refining design and manufacturing technologies to meet specific needs of specific customers. Most of the expenses associated with these customer-specific efforts are reflected in our cost of revenue. In addition, our engineers engage in research and development (“R&D”) of new technologies that apply generally to our operations. The expenses of these R&D activities are reflected in the research and development line item within our Consolidated Statement of Operations.
An important element of our strategy is the expansion of our global production facilities. The majority of our revenue and materials costs worldwide are denominated in U.S. dollars, while our labor and utility costs in operations outside the U.S. are denominated in local currencies. We economically hedge certain of these local currency costs, based on our evaluation of the potential exposure as compared to the cost of the hedge, through the purchase of foreign currency exchange contracts. Changes in the fair market value of such hedging instruments are reflected within the Consolidated Statement of Operations and the Consolidated Statement of Comprehensive Income.
See Note 12 – “Concentration of Risk and Segment Data” to the Consolidated Financial Statements.
In September 2017, our operations in Cayey, Puerto Rico received significant hurricane damage. During the fiscal year ended August 31, 2018, we recognized $11.3 million of expenses related to such damages, net of insurance proceeds of $24.9 million. We also expect that the majority of these costs less insurance deductions will ultimately be offset by insurance coverage.
30
Table of Contents
Summary of Results
The following table sets forth, for the fiscal years ended August 31, 2018, 2017 and 2016, certain key operating results and other financial information (in thousands, except per share data):
| Fiscal Year Ended August 31, | ||||||||||||
| 2018 | 2017 | 2016 | ||||||||||
| Net revenue |
$ | 22,095,416 | $ | 19,063,121 | $ | 18,353,086 | ||||||
| Gross profit |
$ | 1,706,792 | $ | 1,545,643 | $ | 1,527,704 | ||||||
| Operating income |
$ | 542,153 | $ | 410,230 | $ | 522,833 | ||||||
| Net income attributable to Jabil Inc. |
$ | 86,330 | $ | 129,090 | $ | 254,095 | ||||||
| Earnings per share – basic |
$ | 0.50 | $ | 0.71 | $ | 1.33 | ||||||
| Earnings per share – diluted |
$ | 0.49 | $ | 0.69 | $ | 1.32 | ||||||
Key Performance Indicators
Management regularly reviews financial and non-financial performance indicators to assess the Company’s operating results. The following table sets forth, for the quarterly periods indicated, certain of management’s key financial performance indicators:
| Three Months Ended | ||||||||||||||||
| August 31, 2018 | May 31, 2018 | February 28, 2018 | November 30, 2017 | |||||||||||||
| Sales cycle(1) |
1 day | 9 days | 3 days | (2) days | ||||||||||||
| Inventory turns (annualized) |
6 turns | 6 turns | 6 turns | 6 turns | ||||||||||||
| Days in accounts receivable |
26 days | 26 days | 26 days | 25 days | ||||||||||||
| Days in inventory(3) |
58 days | 60 days | 62 days | 58 days | ||||||||||||
| Days in accounts payable(4) |
83 days | 77 days | 85 days | 85 days | ||||||||||||
| Three Months Ended | ||||||||||||||||
| August 31, 2017 | May 31, 2017 | February 28, 2017 | November 30, 2016 | |||||||||||||
| Sales cycle(1) |
0 days | 9 days | 11 days | 1 day | ||||||||||||
| Inventory turns (annualized) |
6 turns | 6 turns | 7 turns | 7 turns | ||||||||||||
| Days in accounts receivable(2) |
25 days | 29 days | 29 days | 27 days | ||||||||||||
| Days in inventory(3) |
58 days | 59 days | 55 days | 48 days | ||||||||||||
| Days in accounts payable(4) |
83 days | 79 days | 73 days | 74 days | ||||||||||||
| (1) | The sales cycle is calculated as the sum of days in accounts receivable and days in inventory, less the days in accounts payable; accordingly, the variance in the sales cycle quarter over quarter is a direct result of changes in these indicators. |
| (2) | During the three months ended August 31, 2017, the decrease in days in accounts receivable from the prior sequential quarter was primarily due to the timing of sales and collections activity. |
| (3) | During each of the three months ended August 31, 2018 and May 31, 2018, the decrease in days in inventory from the prior sequential quarter was primarily due to increased sales activity during the quarter. During the three months ended February 28, 2018, the increase in days in inventory from the prior sequential quarter was primarily due to the increase in inventories to support expected sales levels in the third quarter of fiscal year 2018 along with overall increased demand. During the three months ended May 31, 2017, days in inventory increased four days as compared to the prior sequential quarter to support expected sales levels in the fourth quarter of fiscal year 2017. During the three months ended February 28, 2017, days in inventory increased as compared to the prior sequential quarter: (i) as a result of lower production in the DMS segment due to reduced consumer demand in the mobility business and (ii) to support expected revenue levels in the third quarter of fiscal year 2017. |
| (4) | During the three months ended August 31, 2018, the increase in days in accounts payable from the prior sequential quarter was primarily due to higher materials purchases during the quarter and the timing of purchases and cash payments for purchases during the quarter. During the three months ended May 31, 2018, the decrease in days in accounts payable from the prior sequential quarter was primarily due to the timing of purchases and cash payments for purchases during the quarter. During the three months ended November 30, 2017 and August 31, 2017, the increase in |
31
Table of Contents
| days in accounts payable from the prior sequential quarter was primarily due to higher materials purchases during the quarter due to increased demand in the mobility business as well as the timing of purchases and cash payments from purchases during the quarter. During the three months ended May 31, 2017, the increase in days in accounts payable from the prior sequential quarter was primarily due to the timing of purchases and cash payments for purchases during the quarter. |
Critical Accounting Policies and Estimates
The preparation of our Consolidated Financial Statements and related disclosures in conformity with U.S. generally accepted accounting principles (“U.S. GAAP”) requires management to make estimates and judgments that affect our reported amounts of assets and liabilities, revenues and expenses, and related disclosures of contingent assets and liabilities. On an on-going basis, we evaluate our estimates and assumptions based upon historical experience and various other factors and circumstances. Management believes that our estimates and assumptions are reasonable under the circumstances; however, actual results may vary from these estimates and assumptions under different future circumstances. We have identified the following critical accounting policies that affect the more significant judgments and estimates used in the preparation of our Consolidated Financial Statements. For further discussion of our significant accounting policies, refer to Note 1 – “Description of Business and Summary of Significant Accounting Policies” to the Consolidated Financial Statements.
Revenue Recognition
We derive substantially all of our revenue from production and product management services (collectively referred to as “manufacturing services”), which encompasses the act of producing tangible components that are built to customer specifications, which are then provided to the customer. We recognize manufacturing services revenue when such tangible components are shipped to or the goods are received by the customer, title and risk of ownership have passed, the price to the buyer is fixed or determinable and collectability is reasonably assured (net of estimated returns). We also derive revenue to a lesser extent from electronic design services to certain customers. Revenue from electronic design services is generally recognized upon completion and acceptance by the respective customer. Upfront payments from customers are recorded upon receipt as deferred income and are recognized as revenue as the related manufacturing services are provided.
Effective September 1, 2018, our revenue recognition accounting policies changed in conjunction with the adoption of the new revenue recognition standard. Upon adoption, we recognize revenue over time as manufacturing services are completed for the majority of our contracts with customers, which results in revenue being recognized earlier than under the current guidance. Revenue for all other contracts with customers will be recognized at a point in time, upon transfer of control of the product to the customer, which is effectively no change to our historical current accounting. For further discussion of the new revenue recognition standard, refer to Note 16—“New Accounting Guidance” to the Consolidated Financial Statements.
Allowance for Doubtful Accounts
We maintain an allowance for doubtful accounts related to receivables not expected to be collected from our customers. This allowance is based on management’s assessment of specific customer balances after considering the age of receivables and financial stability of the customer. If there is an adverse change in the financial condition and circumstances of our customers, or if actual defaults are higher than provided for, an addition to the allowance may be necessary.
Inventory Valuation
We purchase inventory based on forecasted demand and record inventory at the lower of cost and net realizable value. Management regularly assesses inventory valuation based on current and forecasted usage, customer inventory-related contractual obligations and other lower of cost and net realizable value considerations. If actual market conditions or our customers’ product demands are less favorable than those projected, additional valuation adjustments may be necessary.
Long-Lived Assets
We review property, plant and equipment and amortizable intangible assets for impairment whenever events or changes in circumstances indicate that the carrying amount of an asset may not be recoverable. Recoverability of property, plant and equipment is measured by comparing its carrying value to the undiscounted projected cash flows that the asset(s) or asset group(s) are expected to generate. If the carrying amount of an asset or an asset group is not recoverable, we recognize an impairment loss based on the excess of the carrying amount of the long-lived asset or asset group over its respective fair value, which is generally determined as either the present value of estimated future cash flows or the appraised value. The impairment analysis is based on significant assumptions of future results made by management, including revenue and cash flow projections. Circumstances that may lead to impairment of property, plant and equipment include unforeseen decreases in future performance or industry demand and the restructuring of our operations resulting from a change in our business strategy or adverse economic conditions.
32
Table of Contents
We have recorded intangible assets, including goodwill, in connection with business acquisitions. Estimated useful lives of amortizable intangible assets are determined by management based on an assessment of the period over which the asset is expected to contribute to future cash flows. The fair value of acquired amortizable intangible assets impacts the amounts recorded as goodwill.
We perform a goodwill impairment analysis using the two-step method on an annual basis and whenever events or changes in circumstances indicate that the carrying value may not be recoverable. The recoverability of goodwill is measured at the reporting unit level by comparing the reporting unit’s carrying amount, including goodwill, to the fair value of the reporting unit. We determine the fair value of our reporting units based on an average weighting of both projected discounted future results and the use of comparative market multiples. If the carrying amount of the reporting unit exceeds its fair value, goodwill is considered impaired and a second test is performed to measure the amount of loss, if any.
We perform an indefinite-lived intangible asset impairment analysis on an annual basis and whenever events or changes in circumstances indicate that the carrying value may not be recoverable. The recoverability of indefinite-lived intangible assets is measured by comparing the carrying amount to the fair value. We determine the fair value of our indefinite-lived intangible assets principally based on a variation of the income approach, known as the relief from royalty method. If the carrying amount of the indefinite-lived intangible asset exceeds its fair value, the indefinite-lived intangible asset is considered impaired.
We completed our annual impairment test for goodwill and indefinite-lived intangible assets during the fourth quarter of fiscal year 2018 and determined that the fair values of our reporting units and the indefinite-lived intangible assets are substantially in excess of the carrying values and that no impairment existed as of the date of the impairment test. Significant judgments inherent in this analysis included assumptions regarding appropriate revenue growth rates, discount rates and royalty rates.
Income Taxes
We estimate our income tax provision in each of the jurisdictions in which we operate, a process that includes estimating exposures related to examinations by taxing authorities. We must also make judgments regarding the ability to realize deferred tax assets. The carrying value of our net deferred tax assets is based on our belief that it is more likely than not that we will generate sufficient future taxable income in certain jurisdictions to realize these deferred tax assets. A valuation allowance has been established for deferred tax assets that we do not believe meet the “more likely than not” criteria. We assess whether an uncertain tax position taken or expected to be taken in a tax return meets the threshold for recognition and measurement in the Consolidated Financial Statements. Our judgments regarding future taxable income as well as tax positions taken or expected to be taken in a tax return may change due to changes in market conditions, changes in tax laws or other factors. If our assumptions and consequently our estimates change in the future, the valuation allowances and/or tax reserves established may be increased or decreased, resulting in a respective increase or decrease in income tax expense.
On December 22, 2017, the U.S. government enacted comprehensive tax legislation commonly referred to as the Tax Cuts and Jobs Act of 2017 (“Tax Act”). The Tax Act reduced the corporate tax rate, limited or eliminated certain tax deductions, and changed the taxation of foreign earnings of U.S. multinational companies. The enacted changes include a mandatory income inclusion of the historically untaxed foreign earnings of a U.S. company’s foreign subsidiaries and will effectively tax such income at reduced tax rates (“transition tax”). During fiscal year 2018, we made reasonable estimates related to certain impacts of the Tax Act and, in accordance with the Securities and Exchange Commission (“SEC”) Staff Accounting Bulletin No. 118, Income Tax Accounting Implications of the Tax Cut and Jobs Act (“SAB 118”), recorded a net provisional income tax expense of $142.3 million for the fiscal year ended August 31, 2018. This net provisional expense is mainly comprised of $65.9 million related to the one-time transition tax inclusive of unrecognized tax benefits, $(10.5) million related to the re-measurement of our U.S. deferred tax attributes, and $85.0 million related to the foreign tax impact of a change in indefinite reinvestment assertion on certain earnings from our foreign subsidiaries. As we finalize the accounting for the tax effects of the enactment of the Tax Act during the measurement period, we will reflect adjustments to the provisional amounts recorded and record additional tax effects in the periods such adjustments are identified.
The Internal Revenue Service (“IRS”) completed its field examination of our tax returns for fiscal years 2009 through 2011 and issued a Revenue Agent’s Report (“RAR”) on May 27, 2015, which was updated on June 22, 2016. The IRS completed its field examination of our tax returns for fiscal years 2012 through 2014 and issued an RAR on April 19, 2017. The proposed adjustments in the RAR from both examination periods relate primarily to U.S. taxation of certain intercompany transactions. If the IRS ultimately prevails in its positions, our income tax payments due for the fiscal years 2009 through 2011
33
Table of Contents
and fiscal years 2012 through 2014 would be approximately $28.6 million and $5.3 million, respectively, after utilization of tax loss carry forwards available through fiscal year 2014. Also, the IRS has proposed interest and penalties with respect to fiscal years 2009 through 2011. The IRS may make similar claims in future audits with respect to these types of transactions. At this time, anticipating the amount of any future IRS proposed adjustments, interest, and penalties is not practicable.
We disagree with the proposed adjustments and intend to vigorously contest these matters through the applicable IRS administrative and judicial procedures, as appropriate. As the final resolution of the proposed adjustments remains uncertain, we continue to provide for the uncertain tax positions based on the more likely than not standard. While the resolution of the issues may result in tax liabilities, interest and penalties that are significantly higher than the amounts accrued for these matters, management currently believes that the resolution will not have a material adverse effect on our financial position, results of operations or cash flows. However, there can be no assurance that management’s beliefs will be realized. For further discussion related to our income taxes, refer to Note 4 — “Income Taxes” to the Consolidated Financial Statements.
Recent Accounting Pronouncements
See Note 16 – “New Accounting Guidance” to the Consolidated Financial Statements for a discussion of recent accounting guidance.
Results of Operations
Net Revenue
Generally, we assess revenue on a global customer basis regardless of whether the growth is associated with organic growth or as a result of an acquisition. Accordingly, we do not differentiate or separately report revenue increases generated by acquisitions as opposed to existing business. In addition, the added cost structures associated with our acquisitions have historically been relatively insignificant when compared to our overall cost structure.
The distribution of revenue across our segments has fluctuated, and will continue to fluctuate, as a result of numerous factors, including the following: fluctuations in customer demand; efforts to diversify certain portions of our business; seasonality in our business; business growth from new and existing customers; specific product performance; and any potential termination, or substantial winding down, of significant customer relationships.
| Fiscal Year Ended August 31, | Change | |||||||||||||||||||
| (dollars in millions) | 2018 | 2017 | 2016 | 2018 vs. 2017 | 2017 vs. 2016 | |||||||||||||||
| Net revenue |
$ | 22,095.4 | $ | 19,063.1 | $ | 18,353.1 | 15.9 | % | 3.9 | % | ||||||||||
2018 vs. 2017
Net revenue increased during the fiscal year ended August 31, 2018 compared to the fiscal year ended August 31, 2017. Specifically, the DMS segment revenues increased 23% due to (i) a 19% increase in revenues from customers within our mobility business as a result of increased end user product demand, (ii) a 3% increase in revenues due to new business from existing customers in our healthcare business and (iii) a 1% increase in revenues spread across a variety of industries in the DMS segment. EMS segment revenues increased 11% primarily due to (i) a 3% increase in revenues from a new customer and existing customers within our industrial and energy business, (ii) a 3% increase in revenues from customers within our digital home business, (iii) a 3% increase in revenues from existing customers within our capital equipment business and (iv) a 2% increase in revenues spread across a variety of industries in the EMS segment.
2017 vs. 2016
Net revenue increased during the fiscal year ended August 31, 2017 compared to the fiscal year ended August 31, 2016. The DMS segment revenues increased 9% as a result of (i) a 4% increase in revenues due to new business from existing customers in our consumer lifestyles and wearable technologies business, (ii) a 3% increase in revenues due to new business from existing customers in our healthcare business and (iii) a 2% increase in revenues from existing customers within our mobility business. EMS segment revenues remained relatively consistent due to a mix of increases and decreases spread across various industries within the EMS segment, with no one change being significant individually.
34
Table of Contents
The following table sets forth, for the periods indicated, revenue by segment expressed as a percentage of net revenue:
| Fiscal Year Ended August 31, | ||||||||||||
| 2018 | 2017 | 2016 | ||||||||||
| EMS |
56 | % | 58 | % | 60 | % | ||||||
| DMS |
44 | % | 42 | % | 40 | % | ||||||
|
|
|
|
|
|
|
|||||||
| Total |
100 | % | 100 | % | 100 | % | ||||||
|
|
|
|
|
|
|
|||||||
The following table sets forth, for the periods indicated, foreign source revenue expressed as a percentage of net revenue:
| Fiscal Year Ended August 31, | ||||||||||||
| 2018 | 2017 | 2016 | ||||||||||
| Foreign source revenue |
91.7 | % | 91.4 | % | 90.7 | % | ||||||
Gross Profit
| Fiscal Year Ended August 31, | ||||||||||||
| (dollars in millions) | 2018 | 2017 | 2016 | |||||||||
| Gross profit |
$ | 1,706.8 | $ | 1,545.6 | $ | 1,527.7 | ||||||
| Percent of net revenue |
7.7 | % | 8.1 | % | 8.3 | % | ||||||
2018 vs. 2017
Gross profit decreased as a percent of net revenue during the fiscal year ended August 31, 2018 compared to the fiscal year ended August 31, 2017, primarily due to (i) increased materials costs due to the constrained components market, (ii) increased direct labor costs and (iii) charges related to certain distressed customers in the networking and consumer wearables sectors.
2017 vs. 2016
Gross profit remained relatively consistent as a percent of net revenue during the fiscal year ended August 31, 2017 compared to the fiscal year ended August 31, 2016.
Selling, General and Administrative
| Fiscal Year Ended August 31, | Change | |||||||||||||||||||
| (dollars in millions) | 2018 | 2017 | 2016 | 2018 vs. 2017 | 2017 vs. 2016 | |||||||||||||||
| Selling, general and administrative |
$ | 1,050.7 | $ | 907.7 | $ | 924.4 | $ | 143.0 | $ | (16.7 | ) | |||||||||
2018 vs. 2017
Selling, general and administrative expenses increased during the fiscal year ended August 31, 2018 compared to the fiscal year ended August 31, 2017. During fiscal year 2018, we recognized an additional $32.4 million of stock-based compensation expense due to the modification of certain performance-based restricted stock awards and a one-time cash-settled award while fiscal year 2017 included a $21.0 million reversal of stock-based compensation expense due to decreased expectations for the vesting of certain performance-based restricted stock awards. The remaining increase is primarily driven by an increase in salary and salary related expenses and other costs to support new business growth and development.
2017 vs. 2016
Selling, general and administrative expenses decreased during the fiscal year ended August 31, 2017 compared to the fiscal year ended August 31, 2016. The decrease resulted primarily from a $21.0 million reversal of stock-based compensation expense during fiscal year 2017 due to decreased expectations for the vesting of certain performance-based restricted stock awards. The decrease was partially offset by an increase in salary and salary-related expenses and other costs.
35
Table of Contents
Research and Development
| Fiscal Year Ended August 31, | ||||||||||||
| (dollars in millions) | 2018 | 2017 | 2016 | |||||||||
| Research and development |
$ | 38.5 | $ | 29.7 | $ | 32.0 | ||||||
| Percent of net revenue |
0.2 | % | 0.2 | % | 0.2 | % | ||||||
2018 vs. 2017
Research and development expenses remained relatively consistent as a percent of net revenue during the fiscal year ended August 31, 2018 compared to the fiscal year ended August 31, 2017.
2017 vs. 2016
Research and development expenses remained relatively consistent as a percent of net revenue during the fiscal year ended August 31, 2017 compared to the fiscal year ended August 31, 2016.
Amortization of Intangibles
| Fiscal Year Ended August 31, | Change | |||||||||||||||||||
| (dollars in millions) | 2018 | 2017 | 2016 | 2018 vs. 2017 | 2017 vs. 2016 | |||||||||||||||
| Amortization of intangibles |
$ | 38.5 | $ | 35.5 | $ | 37.1 | $ | 3.0 | $ | (1.6 | ) | |||||||||
2018 vs. 2017
Amortization of intangibles increased during the fiscal year ended August 31, 2018 compared to the fiscal year ended August 31, 2017 primarily due to the incremental additional amortization associated with intangible assets related to the acquisition of True-Tech Corporation (“True-Tech”) that occurred in the first quarter of fiscal year 2018.
2017 vs. 2016
Amortization of intangibles decreased during the fiscal year ended August 31, 2017 compared to the fiscal year ended August 31, 2016 primarily due to certain intangible assets associated with the Plasticos and Shemer acquisitions that were fully amortized during fiscal year 2016.
Restructuring and Related Charges
Following is a summary of our restructuring and related charges:
| Fiscal Year Ended August 31, | ||||||||||||
| (dollars in millions) | 2018(2) | 2017(2) | 2016(3) | |||||||||
| Employee severance and benefit costs |
$ | 16.3 | $ | 56.8 | $ | 8.8 | ||||||
| Lease costs |
1.6 | 4.0 | — | |||||||||
| Asset write-off costs |
16.2 | 94.3 | 1.2 | |||||||||
| Other related costs |
2.8 | 5.3 | 1.4 | |||||||||
|
|
|
|
|
|
|
|||||||
| Total restructuring and related charges(1) |
$ | 36.9 | $ | 160.4 | $ | 11.4 | ||||||
|
|
|
|
|
|
|
|||||||
| (1) | Includes $16.3 million, $51.3 million and $10.7 million recorded in the EMS segment, $16.6 million, $82.4 million and $0.8 million recorded in the DMS segment and $4.0 million, $26.7 million and $(0.1) million of non-allocated charges for the fiscal years ended August 31, 2018, 2017 and 2016, respectively. Except for asset write-off costs, all restructuring and related charges are cash settled. |
| (2) | Primarily relates to the 2017 Restructuring Plan. |
| (3) | Costs relate to the 2013 Restructuring Plan, which was substantially complete during fiscal year 2017. |
2017 Restructuring Plan
On September 15, 2016, our Board of Directors formally approved a restructuring plan to better align our global capacity and administrative support infrastructure to further optimize organizational effectiveness. This action includes headcount reductions across our selling, general and administrative cost base and capacity realignment in higher cost locations (the “2017 Restructuring Plan”).
36
Table of Contents
Upon completion of the 2017 Restructuring Plan, we expect to recognize approximately $195.0 million in restructuring and related costs. We incurred $186.4 million of costs-to-date as of August 31, 2018. The remaining costs for employee severance and benefits costs, asset write-off costs and other related costs are anticipated to be incurred through the first half of fiscal year 2019.
The 2017 Restructuring Plan, once complete, is expected to yield annualized cost savings beginning in fiscal year 2019 of approximately $90.0 million. During fiscal year 2018, we realized costs savings of approximately $80.0 million. The annual cost savings is expected to be reflected as a reduction in cost of revenue as well as a reduction of selling, general and administrative expense.
See Note 14 – “Restructuring and Related Charges” to the Consolidated Financial Statements for further discussion of restructuring and related charges for the 2017 Restructuring Plan.
Other Expense
| Fiscal Year Ended August 31, | Change | |||||||||||||||||||
| (dollars in millions) | 2018 | 2017 | 2016 | 2018 vs. 2017 | 2017 vs. 2016 | |||||||||||||||
| Other expense |
$ | 37.6 | $ | 28.4 | $ | 8.4 | $ | 9.2 | $ | 20.0 | ||||||||||
2018 vs. 2017
Other expense increased during the fiscal year ended August 31, 2018 compared to the fiscal year ended August 31, 2017, primarily due to an increase in fees associated with the utilization of the asset-backed securitization programs and the new trade accounts receivable sale programs of $16.3 million, costs incurred of $2.6 million in connection with a “make-whole” premium and related expenses for the early redemption of the 8.250% Senior Notes due 2018 and $1.2 million for an other than temporary impairment on a cost method investment. The increase was partially offset by an $11.5 million other than temporary impairment on available for sale securities during the third quarter of fiscal year 2017.
2017 vs. 2016
Other expense increased during the fiscal year ended August 31, 2017 compared to the fiscal year ended August 31, 2016, primarily due to an other than temporary impairment on available for sale securities of $11.5 million, an increase in fees associated with the asset-backed securitization programs of $6.6 million and a $1.5 million loss associated with a cost method investment.
Interest Income
| Fiscal Year Ended August 31, | Change | |||||||||||||||||||
| (dollars in millions) | 2018 | 2017 | 2016 | 2018 vs. 2017 | 2017 vs. 2016 | |||||||||||||||
| Interest income |
$ | 17.8 | $ | 12.5 | $ | 9.1 | $ | 5.3 | $ | 3.4 | ||||||||||
2018 vs. 2017
Interest income increased during the fiscal year ended August 31, 2018 compared to the fiscal year ended August 31, 2017 due to increased cash equivalents (investments that are readily convertible to cash with maturity dates of 90 days or less) and higher interest rates.
2017 vs. 2016
Interest income increased during the fiscal year ended August 31, 2017 compared to the fiscal year ended August 31, 2016 due to increased cash equivalents (investments that are readily convertible to cash with maturity dates of 90 days or less).
37
Table of Contents
Interest Expense
| Fiscal Year Ended August 31, | Change | |||||||||||||||||||
| (dollars in millions) | 2018 | 2017 | 2016 | 2018 vs. 2017 | 2017 vs. 2016 | |||||||||||||||
| Interest expense |
$ | 149.0 | $ | 138.1 | $ | 136.5 | $ | 10.9 | $ | 1.6 | ||||||||||
2018 vs. 2017
Interest expense increased during the fiscal year ended August 31, 2018 compared to the fiscal year ended August 31, 2017 due to additional borrowings on the 2017 Revolving Credit Facility and higher interest rates.
2017 vs. 2016
Interest expense remained relatively consistent during the fiscal year ended August 31, 2017 compared to the fiscal year ended August 31, 2016.
Income Tax Expense
| Fiscal Year Ended August 31, | Change | |||||||||||||||||||
| 2018 | 2017 | 2016 | 2018 vs. 2017 | 2017 vs. 2016 | ||||||||||||||||
| Effective tax rate |
76.6 | % | 50.4 | % | 34.1 | % | 26.2 | % | 16.3 | % | ||||||||||
2018 vs. 2017
The increase in the effective tax rate during the fiscal year ended August 31, 2018 compared to the fiscal year ended August 31, 2017 was primarily due to $142.3 million of provisional tax expense associated with the Tax Act impacts of the one-time transition tax, re-measurement of our U.S. deferred tax attributes, and a change in the indefinite reinvestment assertion on certain earnings from our foreign subsidiaries. The increase was also driven by the fiscal year 2017 valuation allowance reversals of $27.5 million related to non-U.S. jurisdictions that did not recur in fiscal year 2018. The increase was partially offset by $16.1 million of tax benefits from the lapse of statute in a non-U.S. jurisdiction and $14.8 million related to the release of stranded tax effects previously classified as accumulated other comprehensive income (“AOCI”).
During fiscal year 2018, we made reasonable estimates of the impact related to certain aspects of the Tax Act and, in accordance with the SEC’s SAB118, recorded a provisional income tax expense of approximately $142.3 million. As of August 31, 2018, we believe this is a reasonable estimate related to the Tax Act based on analyses, interpretations, and guidance available at this time. The final impact of the Tax Act may differ from our estimate due to, among other items, additional regulatory guidance that may be issued, changes in interpretations and assumptions and finalization of calculations of the impact of the Tax Act, including the on-going analysis of U.S. tax attributes, re-measurement of the U.S. deferred tax attributes, analysis of our indefinite reinvestment assertion, and the computation of earnings and profits of our foreign subsidiaries, applicable foreign tax credits and relevant limitations. As we finalize the accounting for the tax effects of the enactment of the Tax Act during the measurement period, we will reflect adjustments to the provisional amounts recorded and record additional tax effects in the periods such adjustments are identified.
2017 vs. 2016
The increase in the effective tax rate during the fiscal year ended August 31, 2017 compared to the fiscal year ended August 31, 2016 was primarily due to decreased income in jurisdictions with low tax rates and increased losses in jurisdictions with existing valuation allowances, which was partially due to an increase in restructuring expense, and increased income in jurisdictions with high tax rates. This effective tax rate increase was partially offset by an income tax benefit of $27.5 million for the reversal of valuation allowances related to non-U.S. jurisdictions.
38
Table of Contents
Non-GAAP (Core) Financial Measures
The following discussion and analysis of our financial condition and results of operations include certain non-GAAP financial measures as identified in the reconciliation below. The non-GAAP financial measures disclosed herein do not have standard meaning and may vary from the non-GAAP financial measures used by other companies or how we may calculate those measures in other instances from time to time. Non-GAAP financial measures should not be considered a substitute for, or superior to, measures of financial performance prepared in accordance with U.S. GAAP. Also, our “core” financial measures should not be construed as an inference by us that our future results will be unaffected by those items that are excluded from our “core” financial measures.
Management believes that the non-GAAP “core” financial measures set forth below are useful to facilitate evaluating the past and future performance of our ongoing manufacturing operations over multiple periods on a comparable basis by excluding the effects of the amortization of intangibles, stock-based compensation expense and related charges, restructuring and related charges, distressed customer charges, acquisition and integration charges, loss on disposal of subsidiaries, settlement of receivables and related charges, impairment of notes receivable and related charges, goodwill impairment charges, business interruption and impairment charges, net, other than temporary impairment on securities, income (loss) from discontinued operations, gain (loss) on sale of discontinued operations and certain other expenses, net of tax and certain deferred tax valuation allowance charges. Among other uses, management uses non-GAAP “core” financial measures to make operating decisions, assess business performance and as a factor in determining certain employee performance when evaluating incentive compensation.
We determine the tax effect of the items excluded from “core” earnings and “core” basic and diluted earnings per share based upon evaluation of the statutory tax treatment and the applicable tax rate of the jurisdiction in which the pre-tax items were incurred, and for which realization of the resulting tax benefit, if any, is expected. In certain jurisdictions where we do not expect to realize a tax benefit (due to a history of operating losses or other factors resulting in a valuation allowance related to deferred tax assets), a 0% tax rate is applied.
We are reporting “core” operating income, “core” earnings and “core” return on invested capital to provide investors with an additional method for assessing operating income and earnings, by presenting what we believe are our “core” manufacturing operations. A significant portion (based on the respective values) of the items that are excluded for purposes of calculating “core” operating income and “core” earnings also impacted certain balance sheet assets, resulting in a portion of an asset being written off without a corresponding recovery of cash we may have previously spent with respect to the asset. In the case of restructuring and related charges, we may make associated cash payments in the future. In addition, although, for purposes of calculating “core” operating income and “core” earnings, we exclude stock-based compensation expense (which we anticipate continuing to incur in the future) because it is a non-cash expense, the associated stock issued may result in an increase in our outstanding shares of stock, which may result in the dilution of our stockholders’ ownership interest. We encourage you to consider these matters when evaluating the utility of these non-GAAP financial measures.
39
Table of Contents
Included in the tables below are a reconciliation of the non-GAAP financial measures to the most directly comparable U.S. GAAP financial measures as provided in our Consolidated Financial Statements (in thousands, except for per share data):
| Fiscal Year Ended August 31, | ||||||||||||
| 2018 | 2017 | 2016 | ||||||||||
| Operating income (U.S. GAAP) |
$ | 542,153 | $ | 410,230 | $ | 522,833 | ||||||
|
|
|
|
|
|
|
|||||||
| Amortization of intangibles |
38,490 | 35,524 | 37,121 | |||||||||
| Stock-based compensation expense and related charges |
98,511 | 48,544 | 58,997 | |||||||||
| Restructuring and related charges |
36,902 | 160,395 | 11,369 | |||||||||
| Acquisition and integration charges(1) |
8,082 | — | — | |||||||||
| Distressed customer charges(2) |
32,710 | 10,198 | — | |||||||||
| Loss on disposal of subsidiaries |
— | 2,112 | — | |||||||||
| Business interruption and impairment charges, net(3) |
11,299 | — | — | |||||||||
|
|
|
|
|
|
|
|||||||
| Adjustments to operating income |
225,994 | 256,773 | 107,487 | |||||||||
|
|
|
|
|
|
|
|||||||
| Core operating income (Non-GAAP) |
$ | 768,147 | $ | 667,003 | $ | 630,320 | ||||||
|
|
|
|
|
|
|
|||||||
| Net income attributable to Jabil Inc. (U.S. GAAP) |
$ | 86,330 | $ | 129,090 | $ | 254,095 | ||||||
| Adjustments to operating income |
225,994 | 256,773 | 107,487 | |||||||||
| Other than temporary impairment on securities(4) |
— | 11,539 | — | |||||||||
| Adjustment for taxes(5) |
146,206 | (4,726 | ) | (2,483 | ) | |||||||
|
|
|
|
|
|
|
|||||||
| Core earnings (Non-GAAP) |
$ | 458,530 | $ | 392,676 | $ | 359,099 | ||||||
|
|
|
|
|
|
|
|||||||
| Earnings per share (U.S. GAAP): |
||||||||||||
| Basic |
$ | 0.50 | $ | 0.71 | $ | 1.33 | ||||||
|
|
|
|
|
|
|
|||||||
| Diluted |
$ | 0.49 | $ | 0.69 | $ | 1.32 | ||||||
|
|
|
|
|
|
|
|||||||
| Core earnings per share (Non-GAAP): |
||||||||||||
| Basic |
$ | 2.66 | $ | 2.16 | $ | 1.89 | ||||||
|
|
|
|
|
|
|
|||||||
| Diluted |
$ | 2.62 | $ | 2.11 | $ | 1.86 | ||||||
|
|
|
|
|
|
|
|||||||
| Weighted average shares outstanding used in the calculations of earnings per share (U.S. GAAP and Non-GAAP): |
||||||||||||
| Basic |
172,237 | 181,902 | 190,413 | |||||||||
|
|
|
|
|
|
|
|||||||
| Diluted |
175,044 | 185,838 | 192,750 | |||||||||
|
|
|
|
|
|
|
|||||||
| (1) | Charges related to our strategic collaboration with a healthcare company. |
| (2) | Charges during fiscal year 2018 relate to inventory and other assets charges for certain distressed customers in the networking and consumer wearables sectors. Charges during fiscal year 2017 relate to inventory and other assets charges for the disengagement with an energy customer. |
| (3) | Charges, net of insurance proceeds of $24.9 million, for the fiscal year ended August 31, 2018 relate to business interruption and asset impairment costs associated with damage from Hurricane Maria, which impacted our operations in Cayey, Puerto Rico. |
| (4) | Relates to an other than temporary impairment on available for sale securities during fiscal year 2017. |
| (5) | Includes a $142.3 million provisional estimate to account for the effects of the Tax Act for the fiscal year ended August 31, 2018. |
40
Table of Contents
| Fiscal Year Ended | ||||||||||||
| August 31, 2018 | August 31, 2017 | August 31, 2016 | ||||||||||
| Numerator: |
||||||||||||
| Operating income (U.S. GAAP) |
$ | 542,153 | $ | 410,230 | $ | 522,833 | ||||||
| Tax effect (1) |
(300,979 | ) | (137,087 | ) | (131,893 | ) | ||||||
|
|
|
|
|
|
|
|||||||
| After-tax operating income |
241,174 | 273,143 | 390,940 | |||||||||
| x1 | x1 | x1 | ||||||||||
|
|
|
|
|
|
|
|||||||
| Annualized after-tax operating income |
$ | 241,174 | $ | 273,143 | $ | 390,940 | ||||||
|
|
|
|
|
|
|
|||||||
| Core operating income (Non-GAAP) |
$ | 768,147 | $ | 667,003 | $ | 630,320 | ||||||
| Tax effect (2) |
(144,261 | ) | (134,930 | ) | (134,426 | ) | ||||||
|
|
|
|
|
|
|
|||||||
| After-tax core operating income |
623,886 | 532,073 | 495,894 | |||||||||
| x1 | x1 | x1 | ||||||||||
|
|
|
|
|
|
|
|||||||
| Annualized after-tax core operating income |
$ | 623,886 | $ | 532,073 | $ | 495,894 | ||||||
|
|
|
|
|
|
|
|||||||
| Denominator: |
||||||||||||
| Average total Jabil Inc. stockholders’ equity (3) |
$ | 2,151,886 | $ | 2,395,843 | $ | 2,376,513 | ||||||
| Average notes payable and long-term debt, less current installments (3) |
2,063,047 | 1,853,302 | 1,704,915 | |||||||||
| Average current installments of notes payable and long-term debt (3) |
235,348 | 245,654 | 184,388 | |||||||||
| Average cash and cash equivalents (3) |
(1,223,934 | ) | (1,050,989 | ) | (913,011 | ) | ||||||
|
|
|
|
|
|
|
|||||||
| Net invested capital base |
$ | 3,226,347 | $ | 3,443,810 | $ | 3,352,805 | ||||||
|
|
|
|
|
|
|
|||||||
| Return on Invested Capital (U.S. GAAP) |
7.5 | % | 7.9 | % | 11.7 | % | ||||||
| Adjustments noted above |
11.8 | % | 7.6 | % | 3.1 | % | ||||||
| Core Return on Invested Capital (Non-GAAP) |
19.3 | % | 15.5 | % | 14.8 | % | ||||||
| (1) | This amount is calculated by adding the amount of income taxes attributable to its operating income (U.S. GAAP) and its interest expense. |
| (2) | This amount is calculated by adding the amount of income taxes attributable to its core operating income (Non-GAAP) and its interest expense. |
| (3) | The average is based on the addition of the account balance at the end of the most recently-ended fiscal year to the account balance at the end of the prior fiscal year for the fiscal years ended August 31, 2018, 2017 and 2016, respectively, and dividing by two. |
Quarterly Results (Unaudited)
The following table sets forth certain unaudited quarterly financial information for the 2018 and 2017 fiscal years. In the opinion of management, this information has been presented on the same basis as the audited consolidated financial statements appearing elsewhere, and all necessary adjustments (consisting primarily of normal recurring accruals) have been included in the amounts stated below to present fairly the unaudited quarterly results when read in conjunction with the audited consolidated financial statements and related notes thereto. The operating results for any quarter are not necessarily indicative of results for any future period.
41
Table of Contents
Fiscal Year 2018
| Three Months Ended | ||||||||||||||||
| (in thousands, except for per share data) | August 31, 2018 | May 31, 2018 | February 28, 2018 | November 30, 2017 |
||||||||||||
| Net revenue |
$ | 5,771,831 | $ | 5,436,952 | $ | 5,301,101 | $ | 5,585,532 | ||||||||
| Gross profit(1) |
442,147 | 398,227 | 397,133 | 469,285 | ||||||||||||
| Operating income(1)(2) |
153,896 | 112,971 | 129,532 | 145,754 | ||||||||||||
| Net (loss) income (1)(2)(3) |
(56,608 | ) | 42,702 | 37,528 | 63,919 | |||||||||||
| Net (loss) income attributable to Jabil Inc.(1)(2)(3) |
$ | (57,314 | ) | $ | 42,541 | $ | 37,308 | $ | 63,795 | |||||||
| (Loss) earnings per share attributable to the stockholders of Jabil Inc. |
||||||||||||||||
| Basic |
$ | (0.34 | ) | $ | 0.25 | $ | 0.21 | $ | 0.36 | |||||||
| Diluted |
$ | (0.34 | ) | $ | 0.25 | $ | 0.21 | $ | 0.35 | |||||||
Fiscal Year 2017
| Three Months Ended | ||||||||||||||||
| (in thousands, except for per share data) | August 31, 2017 | May 31, 2017 | February 28, 2017 | November 30, 2016 |
||||||||||||
| Net revenue |
$ | 5,023,029 | $ | 4,489,557 | $ | 4,445,637 | $ | 5,104,898 | ||||||||
| Gross profit(1) |
425,818 | 326,415 | 361,904 | 431,506 | ||||||||||||
| Operating income(1) |
118,057 | 43,383 | 83,183 | 165,607 | ||||||||||||
| Net income (loss)(1) |
46,041 | (25,699 | ) | 20,124 | 86,701 | |||||||||||
| Net income (loss) attributable to Jabil Inc.(1) |
$ | 45,679 | $ | (25,281 | ) | $ | 20,665 | $ | 88,027 | |||||||
| Earnings (loss) per share attributable to the stockholders of Jabil Inc. |
||||||||||||||||
| Basic |
$ | 0.26 | $ | (0.14 | ) | $ | 0.11 | $ | 0.48 | |||||||
| Diluted |
$ | 0.25 | $ | (0.14 | ) | $ | 0.11 | $ | 0.47 | |||||||
| (1) | Includes a distressed customer charge of $18.0 million, $14.7 million and $10.2 million during the three months ended August 31, 2018, February 28, 2018 and May 31, 2017, respectively. |
| (2) | Includes $32.4 million of stock-based compensation expense for the modification of certain performance-based restricted stock awards and a one-time cash settled award during the three months ended November 30, 2017. |
| (3) | Includes $111.4 million and $30.9 million for the three months ended August 31, 2018 and February 28, 2018, respectively, related to the Tax Act. |
42
Table of Contents
Acquisitions and Expansion
As discussed in Note 15 – “Business Acquisitions” to the Consolidated Financial Statements, we completed one acquisition during the fiscal year ended August 31, 2018 and one acquisition during the fiscal year ended August 31, 2017. Acquisitions are accounted for as business combinations using the acquisition method of accounting. Our Consolidated Financial Statements include the operating results of each business from the date of acquisition.
On July 18, 2018 we submitted a binding offer to form a strategic collaboration with Johnson & Johnson Medical Devices Companies that would significantly expand our medical device manufacturing portfolio, diversification and capabilities. The offer has been accepted with respect to the North American sites and is pending applicable consultative processes for sites in Switzerland and Germany.
Seasonality
Production levels for a portion of the DMS segment are subject to seasonal influences. We may realize greater net revenue during our first fiscal quarter which ends on November 30, due to higher demand for consumer-related products during the holiday selling season.
Liquidity and Capital Resources
We believe that our level of liquidity sources, which includes available borrowings under our revolving credit facilities, additional proceeds available under our asset-backed securitization programs and under our uncommitted trade accounts receivable sale programs, cash on hand, funds provided by operations and the access to the capital markets, will be adequate to fund our capital expenditures, the payment of any declared quarterly dividends, share repurchases, any potential acquisitions and our working capital requirements for the next 12 months. We continue to assess our capital structure and evaluate the merits of redeploying available cash to reduce existing debt or repurchase common stock.
Cash and Cash Equivalents
As of August 31, 2018, we had approximately $1.3 billion in cash and cash equivalents. As our growth remains predominantly outside of the United States, a significant portion of such cash and cash equivalents are held by our foreign subsidiaries.
As a result of the Tax Act and after the one-time transition tax on our historically untaxed foreign earnings, the cash and cash equivalents held by our foreign subsidiaries will no longer be subject to U.S. federal income tax consequences upon subsequent repatriation to the United States. As a result, most of our cash and cash equivalents as of August 31, 2018 could be repatriated to the United States without potential tax consequences.
43
Table of Contents
Notes Payable and Credit Facilities
Following is summary of principal debt payments and debt issuance for our notes payable and credit facilities:
| (in thousands) | 8.250% Senior Notes(1) |
5.625% Senior Notes |
4.700% Senior Notes |
4.900% Senior Notes |
3.950% Senior Notes(1) |
Borrowings under revolving credit facilities(2)(3) |
Borrowings under loans(2)(3) |
Total notes payable and credit facilities |
||||||||||||||||||||||||
| Balance as of August 31, 2016 |
$ | 398,552 | $ | 396,212 | $ | 496,041 | $ | 298,329 | $ | — | $ | — | $ | 502,210 | $ | 2,091,344 | ||||||||||||||||
| Borrowings |
— | — | — | — | — | 7,434,107 | — | 7,434,107 | ||||||||||||||||||||||||
| Payments |
— | — | — | — | — | (7,434,107 | ) | (43,922 | ) | (7,478,029 | ) | |||||||||||||||||||||
| Other |
954 | 892 | 655 | 242 | — | — | 107 | 2,850 | ||||||||||||||||||||||||
|
|
|
|
|
|
|
|
|
|
|
|
|
|
|
|
|
|||||||||||||||||
| Balance as of August 31, 2017 |
399,506 | 397,104 | 496,696 | 298,571 | — | — | 458,395 | 2,050,272 | ||||||||||||||||||||||||
| Borrowings |
— | — | — | — | 498,659 | 8,778,855 | 400,000 | 9,677,514 | ||||||||||||||||||||||||
| Payments |
(400,000 | ) | — | — | — | — | (8,778,855 | ) | (25,907 | ) | (9,204,762 | ) | ||||||||||||||||||||
| Other |
494 | 891 | 654 | 243 | (4,451 | ) | — | (2,156 | ) | (4,325 | ) | |||||||||||||||||||||
|
|
|
|
|
|
|
|
|
|
|
|
|
|
|
|
|
|||||||||||||||||
| Balance as of August 31, 2018 |
$ | — | $ | 397,995 | $ | 497,350 | $ | 298,814 | $ | 494,208 | $ | — | $ | 830,332 | $ | 2,518,699 | ||||||||||||||||
|
|
|
|
|
|
|
|
|
|
|
|
|
|
|
|
|
|||||||||||||||||
| Maturity Date | Mar 15, 2018 |
Dec 15, 2020 |
Sep 15, 2022 |
Jul 14, 2023 |
Jan 12, 2028 |
Nov 8, 2022 and Aug 24, 2020(2)(3) |
Nov 8, 2022 and Aug 24, 2020(2)(3) |
|||||||||||||||||||||||||
| Original Facility/ Maximum Capacity |
$ |
400.0 million |
|
$ |
400.0 million |
|
$ |
500.0 million |
|
$ |
300.0 million |
|
$ |
500.0 million |
|
$ |
2.3 billion |
(2)(3) |
$ |
851.8 million |
(2)(3) |
|||||||||||
| (1) | During the three months ended February 28, 2018, we issued $500.0 million of publicly registered 3.950% Senior Notes due 2028 (the “3.950% Senior Notes”). The net proceeds from the offering were used for general corporate purposes, including to redeem $400.0 million of our outstanding 8.250% Senior Notes due 2018 and pay related costs and a “make-whole” premium. |
| (2) | On November 8, 2017, we entered into an amended and restated senior unsecured five-year credit agreement for additional working capital to support the continued growth of the business. The credit agreement provides for: (i) a Revolving Credit Facility in the initial amount of $1.8 billion, which may, subject to the lenders’ discretion, be increased to $2.3 billion (“the 2017 Revolving Credit Facility”) and (ii) a $500.0 million Term Loan Facility (“the 2017 Term Loan Facility”), collectively “the 2017 Credit Facility.” The 2017 Credit Facility expires on November 8, 2022. The 2017 Revolving Credit Facility is subject to two whole or partial one-year extensions, at the lenders’ discretion. Interest and fees on the 2017 Credit Facility advances are based on the Company’s non-credit enhanced long-term senior unsecured debt rating as determined by Standard & Poor’s Ratings Service, Moody’s Investors Service and Fitch Ratings |
| (3) | On August 24, 2018, the Company entered into a senior unsecured two-year credit agreement for additional working capital to support the continued growth of the business. The credit agreement provides for: (i) a Revolving Credit Facility in the initial amount of $150.0 million (“the 2018 Revolving Credit Facility”) and (ii) a $350.0 million Term Loan Facility (“the 2018 Term Loan Facility”), collectively “the 2018 Credit Facility.” The 2018 Credit Facility expires on August 24, 2020. |
During the fiscal year ended August 31, 2018, no draws were made on the 2018 Revolving Credit Facility and $350.0 million was borrowed against the 2018 Term Loan Facility. The interest rates on the 2017 Revolving Credit Facility borrowings ranged from 2.4% to 5.2% and the 2017 Term Loan Facility ranged from 2.6% to 3.5% during the fiscal year ended August 31, 2018. The interest rate on the 2018 Term Loan Facility was 3.1% during the fiscal year ended August 31, 2018.
Additionally, our foreign subsidiaries have various additional credit facilities that finance their future growth and any corresponding working capital needs.
We have a shelf registration statement with the SEC registering the potential sale of an indeterminate amount of debt and equity securities in the future to augment our liquidity and capital resources.
Our Senior Notes and our 2017 and 2018 Credit Facilities contain various financial and nonfinancial covenants. A violation of these covenants could negatively impact our liquidity by restricting our ability to borrow under the notes payable and credit facilities and potentially causing acceleration of amounts due under these notes payable and credit facilities. As of August 31, 2018 and 2017, we were in compliance with all covenants under our Senior Notes and the 2017 and 2018 Credit Facilities. Refer to Note 8 – “Notes Payable and Long-Term Debt” to the Consolidated Financial Statements for further details.
44
Table of Contents
Asset-Backed Securitization and Trade Accounts Receivable Sale Programs
Asset-Backed Securitization Programs
We continuously sell designated pools of trade accounts receivable, at a discount, under our asset-backed securitization programs to special purpose entities, which in turn sell 100% of the receivables to: (i) conduits administered by unaffiliated financial institutions and (ii) an unaffiliated financial institution. Any portion of the purchase price for the receivables not paid in cash upon the sale occurring is recorded as a deferred purchase price receivable, which is paid from available cash as payments on the underlying receivables are collected.
Following is a summary of our asset-backed securitization programs and key terms:
| Maximum Amount of Net Cash Proceeds (in millions)(1) |
Expiration Date |
|||||||
| North American |
$ | 200.0 | October 20, 2020 | (2) | ||||
| Foreign |
$ | 400.0 | September 30, 2021 | (3) | ||||
| (1) | Maximum amount available at any one time. |
| (2) | On October 9, 2018, the North American asset-backed securitization program was terminated and we repurchased the outstanding receivables. |
| (3) | On September 21, 2018, the foreign asset-backed securitization program terms were amended and the program was extended to September 30, 2021. Under the terms of the amended agreement, we continuously sell designated pools of trade accounts receivable to a special purpose entity, which in turn sells a portion of the receivables to an unaffiliated financial institution and a conduit administered by an unaffiliated financial institution. In connection with this amendment, there is no longer a deferred purchase price receivable for the foreign asset-backed securitization program. |
In connection with our asset-backed securitization programs, during the fiscal year ended August 31, 2018, we sold $8.4 billion eligible trade accounts receivable and we received cash proceeds of $7.8 billion. As of August 31, 2018, we recorded a deferred purchase price receivable of $533.1 million and had up to $16.1 million in available liquidity under our asset-backed securitization programs.
Our asset-backed securitization programs contain various financial and nonfinancial covenants. As of August 31, 2018 and 2017, we were in compliance with all covenants under our asset-backed securitization programs. Refer to Note 2 – “Trade Accounts Receivable Securitization and Sale Programs” to the Consolidated Financial Statements for further details on the programs.
Trade Accounts Receivable Sale Programs
Following is a summary of the nine trade accounts receivable sale programs with unaffiliated financial institutions. Under the programs we may elect to sell receivables and the unaffiliated financial institutions may elect to purchase, at a discount, on an ongoing basis:
| Program |
Maximum Amount (in millions)(1) |
Type of Facility |
Expiration Date |
|||||||||
| A |
$ | 875.0 | Uncommitted | August 31, 2022 | (2)(3) | |||||||
| B |
$ | 150.0 | Uncommitted | November 30, 2018 | (4) | |||||||
| C |
800.0 | CNY | Uncommitted | February 13, 2019 | ||||||||
| D |
$ | 100.0 | Uncommitted | May 4, 2023 | (5) | |||||||
| E |
$ | 50.0 | Uncommitted | August 25, 2019 | ||||||||
| F |
$ | 150.0 | Uncommitted | January 25, 2019 | (6) | |||||||
| G |
$ | 50.0 | Uncommitted | February 23, 2023 | (3) | |||||||
| H |
$ | 100.0 | Uncommitted | August 10, 2019 | (7) | |||||||
| I |
$ | 100.0 | Uncommitted | July 21, 2019 | (8) | |||||||
| (1) | Maximum amount available at any one time. |
45
Table of Contents
| (2) | The maximum amount under the program will reduce to $650.0 million on February 1, 2019. |
| (3) | Any party may elect to terminate the agreement upon 15 days prior notice. |
| (4) | The program will automatically extend for one year at each expiration date unless either party provides 10 days notice of termination. |
| (5) | Any party may elect to terminate the agreement upon 30 days prior notice. |
| (6) | The program will be automatically extended through January 25, 2023 unless either party provides 30 days notice of termination. |
| (7) | The program will be automatically extended through August 10, 2023 unless either party provides 30 days notice of termination. |
| (8) | The program will be automatically extended through August 21, 2023 unless either party provides 30 days notice of termination. |
During the fiscal year ended August 31, 2018, we sold $5.5 billion of trade accounts receivable under these programs and we received cash proceeds of $5.5 billion. As of August 31, 2018, we had up to $606.0 million in available liquidity under our trade accounts receivable sale programs.
Capital Expenditures
For fiscal year 2019, we anticipate our net capital expenditures will be approximately $800.0 million. Our capital expenditures will support investments in new markets and ongoing maintenance in our DMS and EMS segments. The amount of actual capital expenditures may be affected by general economic, financial, competitive, legislative and regulatory factors, among other things.
Cash Flows
The following table sets forth selected consolidated cash flow information (in thousands):
| Fiscal Year Ended August 31, | ||||||||||||
| 2018 | 2017 | 2016 | ||||||||||
| Net cash provided by operating activities |
$ | 933,850 | $ | 1,256,643 | $ | 916,207 | ||||||
| Net cash used in investing activities |
(798,384 | ) | (579,465 | ) | (1,179,981 | ) | ||||||
| Net cash (used in) provided by financing activities |
(47,044 | ) | (404,546 | ) | 253,512 | |||||||
| Effect of exchange rate changes on cash and cash equivalents |
(20,392 | ) | 5,228 | 8,358 | ||||||||
|
|
|
|
|
|
|
|||||||
| Net increase (decrease) in cash and cash equivalents |
$ | 68,030 | $ | 277,860 | $ | (1,904 | ) | |||||
|
|
|
|
|
|
|
|||||||
Operating Activities
Net cash provided by operating activities during the fiscal year ended August 31, 2018 was primarily due to non-cash expenses and increased inventories, accounts receivable and prepaid expenses and other current assets, partially offset by increased accounts payable, accrued expenses and other liabilities. The increase in inventories is largely due to increased demand and supports expected sales levels in the first quarter of fiscal year 2019. The increase in accounts receivable is primarily driven by the timing of sales and cash collections activity as well as increased sales levels. The increase in prepaid expense and other current assets is primarily due to an increase in value added tax receivables, partially offset by a decrease in deferred purchase price receivables due to a decrease in receivables sold and the timing of cash collections. The increase in accounts payable, accrued expenses and other liabilities was primarily due to an increase in materials purchases due to increased demand in the mobility business and the timing of purchases and cash payments.
Investing Activities
Net cash used in investing activities during the fiscal year ended August 31, 2018 consisted primarily of: (i) capital expenditures principally to support ongoing business in the DMS and EMS segments and (ii) cash paid for the acquisition of True-Tech, which were partially offset by proceeds and advances from the sale of property, plant and equipment.
Financing Activities
Net cash used in financing activities during the fiscal year ended August 31, 2018, was primarily due to: (i) payments for debt agreements including the 8.250% Senior Notes, (ii) the repurchase of our common stock, (iii) dividend payments and (iv) treasury stock minimum tax withholding related to vesting of restricted stock. Net cash used in financing activities was partially offset by: (i) borrowings under debt agreements including the 3.950% Senior Notes and the 2018 Credit Facility and (ii) net proceeds from the exercise of stock options and issuance of common stock under the employee stock purchase plan.
46
Table of Contents
Dividends and Share Repurchases
Following is a summary of the dividends and share repurchases for the fiscal years ended August 31, 2018, 2017 and 2016 (in thousands):
| Dividends Paid(1) | Share Repurchases(2) | Total | ||||||||||
| Fiscal year 2016 |
$ | 62,436 | $ | 148,185 | $ | 210,621 | ||||||
| Fiscal year 2017 |
$ | 59,959 | $ | 306,397 | $ | 366,356 | ||||||
| Fiscal year 2018 |
$ | 57,833 | $ | 450,000 | $ | 507,833 | ||||||
|
|
|
|
|
|
|
|||||||
| Total |
$ | 180,228 | $ | 904,582 | $ | 1,084,810 | ||||||
|
|
|
|
|
|
|
|||||||
| (1) | The difference between dividends declared and dividends paid is due to dividend equivalents for unvested restricted stock units that are paid at the time the awards vest. |
| (2) | Excludes commissions. |
We currently expect to continue to declare and pay regular quarterly dividends of an amount similar to our past declarations. However, the declaration and payment of future dividends are discretionary and will be subject to determination by our Board of Directors (the “Board”) each quarter following its review of our financial performance.
During fiscal years 2017 and 2016, our Board authorized the repurchase of $450.0 million and $400.0 million, respectively, of our common stock under share repurchase programs, which were repurchased during fiscal years 2016, 2017 and 2018.
In June 2018, the Board authorized the repurchase of up to $350.0 million of our common stock (the “2018 Share Repurchase Program”). This authorization expires on August 31, 2019. As of August 31, 2018, no shares had yet been repurchased under this authorization and $350.0 million remained available under the 2018 Share Repurchase Program.
Contractual Obligations
Our contractual obligations as of August 31, 2018 are summarized below. As disclosed below, while we have certain non-cancelable purchase order obligations for property, plant and equipment, we generally do not enter into non-cancelable purchase orders for materials until we receive a corresponding purchase commitment from our customer. Non-cancelable purchase orders do not typically extend beyond the normal lead time of several weeks, at most. Purchase orders beyond this time frame are typically cancelable.
| Payments due by period (in thousands) | ||||||||||||||||||||
| Total | Less than 1 year |
1-3 years | 3-5 years | After 5 years |
||||||||||||||||
| Notes payable and long-term debt |
$ | 2,518,699 | $ | 25,197 | $ | 815,949 | $ | 1,183,159 | $ | 494,394 | ||||||||||
| Future interest on notes payable and long-term debt(1) |
516,046 | 112,359 | 197,964 | 112,316 | 93,407 | |||||||||||||||
| Operating lease obligations |
562,911 | 126,038 | 179,075 | 115,709 | 142,089 | |||||||||||||||
| Capital lease obligations |
26,468 | 1,326 | 3,002 | 2,814 | 19,326 | |||||||||||||||
| Non-cancelable purchase order obligations(2) |
288,281 | 271,613 | 12,632 | 4,036 | — | |||||||||||||||
| Pension and postretirement contributions and payments(3) |
6,802 | 799 | 1,076 | 1,322 | 3,605 | |||||||||||||||
| Other(4) |
73,999 | 18,161 | 31,913 | 10,493 | 13,432 | |||||||||||||||
|
|
|
|
|
|
|
|
|
|
|
|||||||||||
| Total contractual obligations(5) |
$ | 3,993,206 | $ | 555,493 | $ | 1,241,611 | $ | 1,429,849 | $ | 766,253 | ||||||||||
|
|
|
|
|
|
|
|
|
|
|
|||||||||||
| (1) | Consists of interest on notes payable and long-term debt outstanding as of August 31, 2018. Certain of our notes payable and long-term debt pay interest at variable rates. We have applied estimated interest rates to determine the value of these expected future interest payments. |
| (2) | Consists of purchase commitments entered into as of August 31, 2018 for property, plant and equipment pursuant to legally enforceable and binding agreements. |
47
Table of Contents
| (3) | Includes the estimated company contributions to funded pension plans during fiscal year 2019 and the expected benefit payments for unfunded pension and postretirement plans from fiscal years 2019 through 2028. These future payments are not recorded on the Consolidated Balance Sheets but will be recorded as incurred. |
| (4) | Includes (i) a $35.7 million capital commitment, (ii) a $19.5 million obligation related to a new human resource system and (iii) an $18.8 million provisional estimate of the one-time transition tax as a result of the Tax Act, in accordance with SAB 118, that will be paid over eight years. |
| (5) | As of August 31, 2018, we have $6.2 million and $130.6 million recorded as a current and a long-term liability, respectively, for uncertain tax positions. We are not able to reasonably estimate the timing of payments, or the amount by which our liability for these uncertain tax positions will increase or decrease over time, and accordingly, this liability has been excluded from the above table. |
48
Table of Contents
Item 7A. Quantitative and Qualitative Disclosures About Market Risk
Foreign Currency Exchange Risks
We transact business in various foreign countries and are, therefore, subject to risk of foreign currency exchange rate fluctuations. We enter into forward contracts to economically hedge transactional exposure associated with commitments arising from trade accounts receivable, trade accounts payable, intercompany transactions and fixed purchase obligations denominated in a currency other than the functional currency of the respective operating entity. We do not, and do not intend to use derivative financial instruments for speculative or trading purposes. All derivative instruments are recorded on our Consolidated Balance Sheets at their respective fair values.
The forward contracts (both those that are designated and not designated as accounting hedging instruments) will generally expire in less than three months, with nine months being the maximum term of the contracts outstanding as of August 31, 2018. The change in fair value related to contracts designated as accounting hedging instruments is initially reported as a component of AOCI and subsequently reclassified to the revenue or expense line in which the underlying transaction occurs within our Consolidated Statements of Operations. The change in fair value related to contracts not designated as accounting hedging instruments will be reflected in cost of revenue within our Consolidated Statements of Operations. The forward contracts are primarily denominated in Chinese yuan renminbi, Euros, Indian rupees and Mexican pesos.
Based on our overall currency rate exposures as of August 31, 2018, including the derivative financial instruments intended to hedge the nonfunctional currency-denominated monetary assets and liabilities, an immediate 10% hypothetical change of foreign currency exchange rates would not have a material effect on our Consolidated Financial Statements. See Note 13 — “Derivative Financial Instruments and Hedging Activities” to the Consolidated Financial Statements for additional information.
Interest Rate Risk
Our exposure to market risk includes changes in interest rates that could affect the Consolidated Balance Sheet, Consolidated Statement of Operations, and the Consolidated Statement of Cash Flows. We are exposed to interest rate risk primarily on variable rate borrowings under the 2017 Credit Facility and 2018 Credit Facility. There were $829.3 million in borrowings outstanding under debt facilities with variable interest rates as of August 31, 2018. See “Management’s Discussion and Analysis of Financial Condition and Results of Operations — Liquidity and Capital Resources” and Note 8 — “Notes Payable and Long-Term Debt” to the Consolidated Financial Statements for additional information regarding our outstanding debt obligations.
To manage our exposure to market risk, we use derivative financial instruments when deemed appropriate. In connection with our variable interest rate debt, we have interest rate swaps with aggregate notional amounts of $200.0 million and $350.0 million, which expire on June 30, 2019 and August 24, 2020, respectively. See Note 13 — “Derivative Financial Instruments and Hedging Activities” to the Consolidated Financial Statements for additional information regarding our interest rate swap transactions. We do not, and do not intend to, use derivative financial instruments for speculative or trading purposes.
We utilize valuation models to estimate the effects of sudden interest rate changes. The impact of a hypothetical change of 10.0% in variable interest rates would result in an increase or decrease in interest expense of approximately $3.3 million for fiscal year 2019.
Item 8. Financial Statements and Supplementary Data
Certain information required by this item is included in Item 7 of Part II of this Report under the heading “Quarterly Results” and is incorporated into this item by reference. All other information required by this item is included in Item 15 of Part IV of this Report and is incorporated into this item by reference.
49
Table of Contents
Item 9. Changes in and Disagreements With Accountants on Accounting and Financial Disclosure
There have been no changes in or disagreements with our accountants on accounting and financial disclosure.
Item 9A. Controls and Procedures
(a) Evaluation of Disclosure Controls and Procedures
We carried out an evaluation required by Rules 13a-15 and 15d-15 under the Exchange Act (the “Evaluation”), under the supervision and with the participation of our Chief Executive Officer (“CEO”) and Chief Financial Officer (“CFO”), of the effectiveness of our disclosure controls and procedures as defined in Rules 13a-15 and 15d-15 under the Exchange Act as of August 31, 2018. Based on the Evaluation, our CEO and CFO concluded that the design and operation of our disclosure controls were effective to ensure that information required to be disclosed by us in reports that we file or submit under the Exchange Act is (i) recorded, processed, summarized and reported within the time periods specified in SEC rules and forms, and (ii) accumulated and communicated to our senior management, including our CEO and CFO, to allow timely decisions regarding required disclosure.
(b) Management’s Report on Internal Control over Financial Reporting
We assessed the effectiveness of our internal control over financial reporting as of August 31, 2018. Management’s report on internal control over financial reporting as of August 31, 2018 is incorporated herein at Item 15. Ernst & Young LLP, our independent registered public accounting firm, issued an audit report on the effectiveness of our internal control over financial reporting as of August 31, 2018, which is incorporated herein at Item 15.
Our management, including our CEO and CFO, does not expect that our internal control over financial reporting will prevent all errors and all fraud. A control system, no matter how well conceived and operated, can provide only reasonable, not absolute, assurance that the objectives of the control system are met. Further, the design of a control system must reflect the fact that there are resource constraints, and the benefits of controls must be considered relative to their costs. Because of the inherent limitations in all control systems, no evaluation of controls can provide absolute assurance that all control issues and instances of fraud, if any, within the Company have been detected. These inherent limitations include the realities that judgments in decision-making can be faulty, and that breakdowns can occur because of simple error or mistake. Additionally, controls may be circumvented by the individual acts of some persons, by collusion of two or more people, or by management override of the control.
The design of any system of controls also is based in part upon certain assumptions about the likelihood of future events, and there can be no assurance that any design will succeed in achieving its stated goals under all potential future conditions; over time, a control may become inadequate because of changes in conditions, or the degree of compliance with the policies or procedures may deteriorate. Because of the inherent limitations in a cost-effective control system, misstatements due to error or fraud may occur and not be detected.
Notwithstanding the foregoing limitations on the effectiveness of controls, we have reached the conclusions set forth in Management’s report on internal control over financial reporting as of August 31, 2018.
(c) Changes in Internal Control over Financial Reporting
For our fiscal quarter ended August 31, 2018, we did not identify any modifications to our internal control over financial reporting that have materially affected, or are reasonably likely to materially affect, our internal control over financial reporting.
None.
50
Table of Contents
PART III
Item 10. Directors, Executive Officers and Corporate Governance
Information regarding our executive officers is included in Item 1 of Part I of this Report under the heading “Executive Officers of the Registrant”.
The other information required by this item is incorporated by reference to the information set forth under the captions “Election of Directors”, “Beneficial Ownership – Section 16(a) Beneficial Ownership Reporting Compliance” and “Corporate Governance and Board of Directors Matters” in our Proxy Statement for the Annual Meeting of Stockholders to be filed with the SEC within 120 days after the end of our fiscal year ended August 31, 2018 (“Proxy Statement”).
Item 11. Executive Compensation
The information required by this item is incorporated by reference to the information set forth under the captions “Compensation Matters – Compensation Discussion and Analysis”, “Corporate Governance and Board of Directors Matters – Director Compensation”, “Corporate Governance and Board of Directors Matters – Compensation Committee Interlocks and Insider Participation” in our Proxy Statement.
Item 12. Security Ownership of Certain Beneficial Owners and Management and Related Stockholder Matters
The information required by this item is incorporated by reference to the information set forth under the captions “Beneficial Ownership – Share Ownership by Principal Stockholders and Management” and “Compensation Matters – Equity Compensation Plan Information” in our Proxy Statement.
Item 13. Certain Relationships and Related Transactions, and Director Independence
The information required by this item is incorporated by reference to the information set forth under the captions “Corporate Governance and Board of Directors Matters”, “Related Party Transactions – Certain Related Party Transactions”, “Determinations of Director Independence” in our Proxy Statement.
Item 14. Principal Accounting Fees and Services
The information required by this item is incorporated by reference to the information set forth under the captions “Ratification of Appointment of Independent Registered Public Accounting Firm – Principal Accounting Fees and Services” and “– Policy on Audit Committee Pre-Approval of Audit, Audit-Related and Permissible Non-Audit Services” in our Proxy Statement.
51
Table of Contents
PART IV
Item 15. Exhibits and Financial Statement Schedules
| (a) | The following documents are filed as part of this Report: |
| 1 | Financial Statements. Our consolidated financial statements, and related notes thereto, with the independent registered public accounting firm reports thereon are included in Part IV of this report on the pages indicated by the Index to Consolidated Financial Statements and Schedule. |
| 2 | Financial Statement Schedule. Our financial statement schedule is included in Part IV of this report on the page indicated by the Index to Consolidated Financial Statements and Schedule. This financial statement schedule should be read in conjunction with our consolidated financial statements, and related notes thereto. |
Schedules not listed in the Index to Consolidated Financial Statements and Schedule have been omitted because they are not applicable, not required, or the information required to be set forth therein is included in the consolidated financial statements or notes thereto.
| 3 | Exhibits. See Item 15(b) below. |
| (b) | Exhibits. The following exhibits are included as part of, or incorporated by reference into, this Report. |
EXHIBIT INDEX
52
Table of Contents
53
Table of Contents
54
Table of Contents
| † | Indicates management compensatory plan, contract of arrangement. |
| * | Filed or furnished herewith. |
| ** | XBRL (Extensible Business Reporting Language) Filed Electronically with this report. |
Certain instruments with respect to long-term debt of the Company and its consolidated subsidiaries are not filed herewith pursuant to Item 601(b)(4)(iii) of Regulation S-K since the total amount of securities authorized under each such instrument does not exceed 10% of the total assets of the Company and its subsidiaries on a consolidated basis. The Company agrees to furnish a copy of any such instrument to the SEC upon request.
| (c) | Financial Statement Schedules. See Item 15(a) above. |
55
Table of Contents
JABIL INC. AND SUBSIDIARIES
INDEX TO CONSOLIDATED FINANCIAL STATEMENTS AND SCHEDULE
56
Table of Contents
MANAGEMENT’S REPORT ON INTERNAL CONTROL OVER FINANCIAL REPORTING
Management of Jabil Inc. (the “Company”) is responsible for establishing and maintaining adequate internal control over financial reporting as defined in Rule13a-15(f) of the Securities Exchange Act of 1934, as amended.
Because of its inherent limitations, internal control over financial reporting may not prevent or detect misstatements. Also, projections of any evaluation of effectiveness to future periods are subject to the risk that controls may become inadequate because of changes in conditions, or that the degree of compliance with the policies or procedures may deteriorate.
Under the supervision of and with the participation of the Chief Executive Officer and the Chief Financial Officer, the Company’s management conducted an assessment of the effectiveness of the Company’s internal control over financial reporting as of August 31, 2018. Management based this assessment on the framework as established in Internal Control – Integrated Framework (2013) issued by the Committee of Sponsoring Organizations of the Treadway Commission. Management’s assessment included an evaluation of the design of the Company’s internal control over financial reporting and testing of the effectiveness of its internal control over financial reporting.
Based on this assessment, management has concluded that, as of August 31, 2018, the Company maintained effective internal control over financial reporting.
Ernst & Young LLP, the Company’s independent registered public accounting firm, issued an audit report on the effectiveness of the Company’s internal control over financial reporting which follows this report.
October 19, 2018
57
Table of Contents
Report of Independent Registered Public Accounting Firm
To the Board of Directors and Stockholders of Jabil Inc.
Opinion on Internal Control over Financial Reporting
We have audited Jabil Inc. and subsidiaries’ internal control over financial reporting as of August 31, 2018, based on criteria established in Internal Control—Integrated Framework issued by the Committee of Sponsoring Organizations of the Treadway Commission (2013 framework) (the COSO criteria). In our opinion, Jabil Inc. and subsidiaries (the Company) maintained, in all material respects, effective internal control over financial reporting as of August 31, 2018, based on the COSO criteria.
We also have audited, in accordance with the standards of the Public Company Accounting Oversight Board (United States) (PCAOB), the consolidated balance sheets of the Company as of August 31, 2018 and 2017, and the related consolidated statements of operations, comprehensive income, stockholders’ equity and cash flows for each of the three years in the period ended August 31, 2018, and the related notes and financial statement schedule listed in the Index at Item 15(a), and our report dated October 19, 2018 expressed an unqualified opinion thereon.
Basis for Opinion
The Company’s management is responsible for maintaining effective internal control over financial reporting and for its assessment of the effectiveness of internal control over financial reporting included in the accompanying Management’s Report on Internal Control over Financial Reporting. Our responsibility is to express an opinion on the Company’s internal control over financial reporting based on our audit. We are a public accounting firm registered with the PCAOB and are required to be independent with respect to the Company in accordance with the U.S. federal securities laws and the applicable rules and regulations of the Securities and Exchange Commission and the PCAOB. We conducted our audit in accordance with the standards of the PCAOB. Those standards require that we plan and perform the audit to obtain reasonable assurance about whether effective internal control over financial reporting was maintained in all material respects. Our audit included obtaining an understanding of internal control over financial reporting, assessing the risk that a material weakness exists, testing and evaluating the design and operating effectiveness of internal control based on the assessed risk, and performing such other procedures as we considered necessary in the circumstances. We believe that our audit provides a reasonable basis for our opinion.
Definition and Limitations of Internal Control over Financial Reporting
A company’s internal control over financial reporting is a process designed to provide reasonable assurance regarding the reliability of financial reporting and the preparation of financial statements for external purposes in accordance with generally accepted accounting principles. A company’s internal control over financial reporting includes those policies and procedures that (1) pertain to the maintenance of records that, in reasonable detail, accurately and fairly reflect the transactions and dispositions of the assets of the company; (2) provide reasonable assurance that transactions are recorded as necessary to permit preparation of financial statements in accordance with generally accepted accounting principles, and that receipts and expenditures of the company are being made only in accordance with authorizations of management and directors of the company; and (3) provide reasonable assurance regarding prevention or timely detection of unauthorized acquisition, use, or disposition of the company’s assets that could have a material effect on the financial statements.
Because of its inherent limitations, internal control over financial reporting may not prevent or detect misstatements. Also, projections of any evaluation of effectiveness to future periods are subject to the risk that controls may become inadequate because of changes in conditions, or that the degree of compliance with the policies or procedures may deteriorate.
/s/ ERNST & YOUNG LLP
Tampa, Florida
October 19, 2018
58
Table of Contents
Report of Independent Registered Public Accounting Firm
To the Board of Directors and Stockholders of Jabil Inc.
Opinion on the Financial Statements
We have audited the accompanying consolidated balance sheets of Jabil Inc. and subsidiaries (the Company) as of August 31, 2018 and 2017, and the related consolidated statements of operations, comprehensive income, stockholders’ equity and cash flows for each of the three years in the period ended August 31, 2018, and the related notes and financial statement schedule listed in the Index at Item 15(a) (collectively referred to as the “consolidated financial statements”). In our opinion, the consolidated financial statements present fairly, in all material respects, the financial position of the Company at August 31, 2018 and 2017, and the results of its operations and its cash flows for each of the three years in the period ended August 31, 2018, in conformity with US generally accepted accounting principles.
We also have audited, in accordance with the standards of the Public Company Accounting Oversight Board (United States) (PCAOB), the Company’s internal control over financial reporting as of August 31, 2018, based on criteria established in Internal Control-Integrated Framework issued by the Committee of Sponsoring Organizations of the Treadway Commission (2013 framework), and our report dated October 19, 2018 expressed an unqualified opinion thereon.
Basis for Opinion
These financial statements are the responsibility of the Company’s management. Our responsibility is to express an opinion on the Company’s financial statements based on our audits. We are a public accounting firm registered with the PCAOB and are required to be independent with respect to the Company in accordance with the U.S. federal securities laws and the applicable rules and regulations of the Securities and Exchange Commission and the PCAOB.
We conducted our audits in accordance with the standards of the PCAOB. Those standards require that we plan and perform the audit to obtain reasonable assurance about whether the financial statements are free of material misstatement, whether due to error or fraud. Our audits included performing procedures to assess the risks of material misstatement of the financial statements, whether due to error or fraud, and performing procedures that respond to those risks. Such procedures included examining, on a test basis, evidence regarding the amounts and disclosures in the financial statements. Our audits also included evaluating the accounting principles used and significant estimates made by management, as well as evaluating the overall presentation of the financial statements. We believe that our audits provide a reasonable basis for our opinion.
/s/ ERNST & YOUNG LLP
We have served as the Company’s auditor since 2010.
Tampa, Florida
October 19, 2018
59
Table of Contents
CONSOLIDATED BALANCE SHEETS
(in thousands, except for share data)
| August 31, | ||||||||
| 2018 | 2017 | |||||||
| ASSETS |
||||||||
| Current assets: |
||||||||
| Cash and cash equivalents |
$ | 1,257,949 | $ | 1,189,919 | ||||
| Accounts receivable, net of allowance for doubtful accounts |
1,693,268 | 1,397,424 | ||||||
| Inventories, net of reserve for excess and obsolete inventory |
3,457,706 | 2,942,083 | ||||||
| Prepaid expenses and other current assets |
1,141,000 | 1,097,257 | ||||||
|
|
|
|
|
|||||
| Total current assets |
7,549,923 | 6,626,683 | ||||||
| Property, plant and equipment, net of accumulated depreciation |
3,198,016 | 3,228,678 | ||||||
| Goodwill |
627,745 | 608,184 | ||||||
| Intangible assets, net of accumulated amortization |
279,131 | 284,596 | ||||||
| Deferred income taxes |
218,252 | 205,722 | ||||||
| Other assets |
172,574 | 142,132 | ||||||
|
|
|
|
|
|||||
| Total assets |
$ | 12,045,641 | $ | 11,095,995 | ||||
|
|
|
|
|
|||||
| LIABILITIES AND EQUITY |
||||||||
| Current liabilities: |
||||||||
| Current installments of notes payable and long-term debt |
$ | 25,197 | $ | 444,255 | ||||
| Accounts payable |
4,942,932 | 4,257,623 | ||||||
| Accrued expenses |
2,262,744 | 2,168,715 | ||||||
|
|
|
|
|
|||||
| Total current liabilities |
7,230,873 | 6,870,593 | ||||||
| Notes payable and long-term debt, less current installments |
2,493,502 | 1,606,017 | ||||||
| Other liabilities |
94,617 | 100,812 | ||||||
| Income tax liabilities |
148,884 | 100,902 | ||||||
| Deferred income taxes |
114,385 | 49,327 | ||||||
|
|
|
|
|
|||||
| Total liabilities |
10,082,261 | 8,727,651 | ||||||
|
|
|
|
|
|||||
| Commitments and contingencies |
||||||||
| Equity: |
||||||||
| Jabil Inc. stockholders’ equity: |
||||||||
| Preferred stock, $0.001 par value, authorized 10,000,000 shares; no shares issued and outstanding |
— | — | ||||||
| Common stock, $0.001 par value, authorized 500,000,000 shares; 257,130,145 and 253,266,684 shares issued and 164,588,172 and 177,727,653 shares outstanding at August 31, 2018 and August 31, 2017, respectively |
257 | 253 | ||||||
| Additional paid-in capital |
2,218,673 | 2,104,203 | ||||||
| Retained earnings |
1,760,097 | 1,730,893 | ||||||
| Accumulated other comprehensive (loss) income |
(19,399 | ) | 54,620 | |||||
| Treasury stock at cost, 92,541,973 and 75,539,031 shares as of August 31, 2018 and August 31, 2017, respectively |
(2,009,371 | ) | (1,536,455 | ) | ||||
|
|
|
|
|
|||||
| Total Jabil Inc. stockholders’ equity |
1,950,257 | 2,353,514 | ||||||
| Noncontrolling interests |
13,123 | 14,830 | ||||||
|
|
|
|
|
|||||
| Total equity |
1,963,380 | 2,368,344 | ||||||
|
|
|
|
|
|||||
| Total liabilities and equity |
$ | 12,045,641 | $ | 11,095,995 | ||||
|
|
|
|
|
|||||
See accompanying notes to Consolidated Financial Statements.
60
Table of Contents
CONSOLIDATED STATEMENTS OF OPERATIONS
(in thousands, except for per share data)
| Fiscal Year Ended August 31, | ||||||||||||
| 2018 | 2017 | 2016 | ||||||||||
| Net revenue |
$ | 22,095,416 | $ | 19,063,121 | $ | 18,353,086 | ||||||
| Cost of revenue |
20,388,624 | 17,517,478 | 16,825,382 | |||||||||
|
|
|
|
|
|
|
|||||||
| Gross profit |
1,706,792 | 1,545,643 | 1,527,704 | |||||||||
| Operating expenses: |
||||||||||||
| Selling, general and administrative |
1,050,716 | 907,702 | 924,427 | |||||||||
| Research and development |
38,531 | 29,680 | 31,954 | |||||||||
| Amortization of intangibles |
38,490 | 35,524 | 37,121 | |||||||||
| Restructuring and related charges |
36,902 | 160,395 | 11,369 | |||||||||
| Loss on disposal of subsidiaries |
— | 2,112 | — | |||||||||
|
|
|
|
|
|
|
|||||||
| Operating income |
542,153 | 410,230 | 522,833 | |||||||||
| Other expense |
37,563 | 28,448 | 8,380 | |||||||||
| Interest income |
(17,813 | ) | (12,525 | ) | (9,128 | ) | ||||||
| Interest expense |
149,002 | 138,074 | 136,536 | |||||||||
|
|
|
|
|
|
|
|||||||
| Income before income tax |
373,401 | 256,233 | 387,045 | |||||||||
| Income tax expense |
285,860 | 129,066 | 132,149 | |||||||||
|
|
|
|
|
|
|
|||||||
| Net income |
87,541 | 127,167 | 254,896 | |||||||||
| Net income (loss) attributable to noncontrolling interests, net of tax |
1,211 | (1,923 | ) | 801 | ||||||||
|
|
|
|
|
|
|
|||||||
| Net income attributable to Jabil Inc. |
$ | 86,330 | $ | 129,090 | $ | 254,095 | ||||||
|
|
|
|
|
|
|
|||||||
| Earnings per share attributable to the stockholders of Jabil Inc.: |
||||||||||||
| Basic |
$ | 0.50 | $ | 0.71 | $ | 1.33 | ||||||
|
|
|
|
|
|
|
|||||||
| Diluted |
$ | 0.49 | $ | 0.69 | $ | 1.32 | ||||||
|
|
|
|
|
|
|
|||||||
| Weighted average shares outstanding: |
||||||||||||
| Basic |
172,237 | 181,902 | 190,413 | |||||||||
|
|
|
|
|
|
|
|||||||
| Diluted |
175,044 | 185,838 | 192,750 | |||||||||
|
|
|
|
|
|
|
|||||||
| Cash dividends declared per common share |
$ | 0.32 | $ | 0.32 | $ | 0.32 | ||||||
|
|
|
|
|
|
|
|||||||
See accompanying notes to Consolidated Financial Statements.
61
Table of Contents
CONSOLIDATED STATEMENTS OF COMPREHENSIVE INCOME
(in thousands)
| Fiscal Year Ended August 31, | ||||||||||||
| 2018 | 2017 | 2016 | ||||||||||
| Net income |
$ | 87,541 | $ | 127,167 | $ | 254,896 | ||||||
| Other comprehensive (loss) income: |
||||||||||||
| Foreign currency translation adjustment |
(50,151 | ) | 41,244 | 9,672 | ||||||||
| Derivative instruments |
(21,851 | ) | 22,183 | 19,817 | ||||||||
| Available for sale securities |
(8,679 | ) | 20,750 | (5,436 | ) | |||||||
| Actuarial gain (loss) |
8,194 | 10,372 | (12,963 | ) | ||||||||
| Prior service cost |
(1,532 | ) | (52 | ) | (113 | ) | ||||||
|
|
|
|
|
|
|
|||||||
| Total other comprehensive (loss) income |
(74,019 | ) | 94,497 | 10,977 | ||||||||
|
|
|
|
|
|
|
|||||||
| Comprehensive income |
$ | 13,522 | $ | 221,664 | $ | 265,873 | ||||||
| Comprehensive income (loss) attributable to noncontrolling interests |
1,211 | (1,923 | ) | 801 | ||||||||
|
|
|
|
|
|
|
|||||||
| Comprehensive income attributable to Jabil Inc. |
$ | 12,311 | $ | 223,587 | $ | 265,072 | ||||||
|
|
|
|
|
|
|
|||||||
See accompanying notes to Consolidated Financial Statements.
62
Table of Contents
CONSOLIDATED STATEMENTS OF STOCKHOLDERS’ EQUITY
(in thousands, except for share data)
| Jabil Inc. Stockholders’ Equity | ||||||||||||||||||||||||||||||||
| Common Stock | Accumulated | |||||||||||||||||||||||||||||||
| Shares Outstanding |
Par Value |
Additional Paid-in Capital |
Retained Earnings |
Other Comprehensive (Loss) Income |
Treasury Stock |
Noncontrolling Interests |
Total Equity |
|||||||||||||||||||||||||
| Balance as of August 31, 2015 |
192,068,068 | $ | 247 | $ | 1,955,104 | $ | 1,468,910 | $ | (50,854 | ) | $ | (1,058,551 | ) | $ | 20,155 | $ | 2,335,011 | |||||||||||||||
| Shares issued upon exercise of stock options |
19,109 | — | — | — | — | — | — | — | ||||||||||||||||||||||||
| Shares issued under employee stock purchase plan |
1,246,947 | 1 | 20,910 | — | — | — | — | 20,911 | ||||||||||||||||||||||||
| Vesting of restricted stock awards |
1,817,635 | 2 | (2 | ) | — | — | — | — | — | |||||||||||||||||||||||
| Purchases of treasury stock under employee stock plans |
(462,900 | ) | — | — | — | — | (10,656 | ) | — | (10,656 | ) | |||||||||||||||||||||
| Treasury shares purchased |
(7,690,387 | ) | — | — | — | — | (148,340 | ) | — | (148,340 | ) | |||||||||||||||||||||
| Recognition of stock-based compensation |
— | — | 58,997 | — | — | — | — | 58,997 | ||||||||||||||||||||||||
| Declared dividends |
— | — | — | (62,185 | ) | — | — | — | (62,185 | ) | ||||||||||||||||||||||
| Comprehensive income |
— | — | — | 254,095 | 10,977 | — | 801 | 265,873 | ||||||||||||||||||||||||
| Declared dividends to noncontrolling interests |
— | — | — | — | — | — | (1,500 | ) | (1,500 | ) | ||||||||||||||||||||||
| Purchase of noncontrolling interests |
— | — | (484 | ) | — | — | — | (116 | ) | (600 | ) | |||||||||||||||||||||
| Foreign currency adjustments attributable to noncontrolling interests |
— | — | — | — | — | — | (14 | ) | (14 | ) | ||||||||||||||||||||||
|
|
|
|
|
|
|
|
|
|
|
|
|
|
|
|
|
|||||||||||||||||
| Balance as of August 31, 2016 |
186,998,472 | $ | 250 | $ | 2,034,525 | $ | 1,660,820 | $ | (39,877 | ) | $ | (1,217,547 | ) | $ | 19,326 | $ | 2,457,497 | |||||||||||||||
|
|
|
|
|
|
|
|
|
|
|
|
|
|
|
|
|
|||||||||||||||||
| Shares issued upon exercise of stock options |
172,620 | — | — | — | — | — | — | — | ||||||||||||||||||||||||
| Shares issued under employee stock purchase plan |
1,228,316 | 1 | 21,791 | — | — | — | — | 21,792 | ||||||||||||||||||||||||
| Vesting of restricted stock awards |
2,102,049 | 2 | (2 | ) | — | — | — | — | — | |||||||||||||||||||||||
| Purchases of treasury stock under employee stock plans |
(550,096 | ) | — | — | — | — | (12,268 | ) | — | (12,268 | ) | |||||||||||||||||||||
| Treasury shares purchased |
(12,223,708 | ) | — | — | — | — | (306,640 | ) | — | (306,640 | ) | |||||||||||||||||||||
| Recognition of stock-based compensation |
— | — | 47,889 | — | — | — | — | 47,889 | ||||||||||||||||||||||||
| Declared dividends |
— | — | — | (59,017 | ) | — | — | — | (59,017 | ) | ||||||||||||||||||||||
| Comprehensive income |
— | — | — | 129,090 | 94,497 | — | (1,923 | ) | 221,664 | |||||||||||||||||||||||
| Declared dividends to noncontrolling interests |
— | — | — | — | — | — | (2,293 | ) | (2,293 | ) | ||||||||||||||||||||||
| Purchase of noncontrolling interests |
— | — | — | — | — | — | (134 | ) | (134 | ) | ||||||||||||||||||||||
| Foreign currency adjustments attributable to noncontrolling interests |
— | — | — | — | — | — | (146 | ) | (146 | ) | ||||||||||||||||||||||
|
|
|
|
|
|
|
|
|
|
|
|
|
|
|
|
|
|||||||||||||||||
| Balance as of August 31, 2017 |
177,727,653 | $ | 253 | $ | 2,104,203 | $ | 1,730,893 | $ | 54,620 | $ | (1,536,455 | ) | $ | 14,830 | $ | 2,368,344 | ||||||||||||||||
|
|
|
|
|
|
|
|
|
|
|
|
|
|
|
|
|
|||||||||||||||||
| Shares issued upon exercise of stock options |
30,832 | — | — | — | — | — | — | — | ||||||||||||||||||||||||
| Shares issued under employee stock purchase plan |
1,105,400 | 1 | 24,865 | — | — | — | — | 24,866 | ||||||||||||||||||||||||
| Vesting of restricted stock awards |
2,727,229 | 3 | (3 | ) | — | — | — | — | — | |||||||||||||||||||||||
| Purchases of treasury stock under employee stock plans |
(793,052 | ) | — | — | — | — | (22,597 | ) | — | (22,597 | ) | |||||||||||||||||||||
| Treasury shares purchased |
(16,209,890 | ) | — | — | — | — | (450,319 | ) | — | (450,319 | ) | |||||||||||||||||||||
| Recognition of stock-based compensation |
— | — | 89,608 | — | — | — | — | 89,608 | ||||||||||||||||||||||||
| Declared dividends |
— | — | — | (57,126 | ) | — | — | — | (57,126 | ) | ||||||||||||||||||||||
| Comprehensive income |
— | — | — | 86,330 | (74,019 | ) | — | 1,211 | 13,522 | |||||||||||||||||||||||
| Declared dividends to noncontrolling interests |
— | — | — | — | — | — | (2,920 | ) | (2,920 | ) | ||||||||||||||||||||||
| Foreign currency adjustments attributable to noncontrolling interests |
— | — | — | — | — | — | 2 | 2 | ||||||||||||||||||||||||
|
|
|
|
|
|
|
|
|
|
|
|
|
|
|
|
|
|||||||||||||||||
| Balance as of August 31, 2018 |
164,588,172 | $ | 257 | $ | 2,218,673 | $ | 1,760,097 | $ | (19,399 | ) | $ | (2,009,371 | ) | $ | 13,123 | $ | 1,963,380 | |||||||||||||||
|
|
|
|
|
|
|
|
|
|
|
|
|
|
|
|
|
|||||||||||||||||
See accompanying notes to Consolidated Financial Statements.
63
Table of Contents
CONSOLIDATED STATEMENTS OF CASH FLOWS
(in thousands)
| Fiscal Year Ended August 31, | ||||||||||||
| 2018 | 2017 | 2016 | ||||||||||
| Cash flows from operating activities: |
||||||||||||
| Net income |
$ | 87,541 | $ | 127,167 | $ | 254,896 | ||||||
| Adjustments to reconcile net income to net cash provided by operating activities: |
||||||||||||
| Depreciation and amortization |
773,704 | 760,405 | 696,752 | |||||||||
| Restructuring and related charges |
16,264 | 94,346 | 1,170 | |||||||||
| Provision for allowance for doubtful accounts |
38,030 | 10,112 | 919 | |||||||||
| Recognition of stock-based compensation expense and related charges |
90,664 | 48,544 | 58,997 | |||||||||
| Deferred income taxes |
52,705 | (63,001 | ) | (23,155 | ) | |||||||
| Other, net |
(13,600 | ) | 22,109 | 21,369 | ||||||||
| Change in operating assets and liabilities, exclusive of net assets acquired: |
||||||||||||
| Accounts receivable |
(316,262 | ) | (31,353 | ) | 122,115 | |||||||
| Inventories |
(499,105 | ) | (445,089 | ) | 67,966 | |||||||
| Prepaid expenses and other current assets |
(76,602 | ) | 19,346 | (194,337 | ) | |||||||
| Other assets |
(34,747 | ) | (30,413 | ) | (4,425 | ) | ||||||
| Accounts payable, accrued expenses and other liabilities |
815,258 | 744,470 | (86,060 | ) | ||||||||
|
|
|
|
|
|
|
|||||||
| Net cash provided by operating activities |
933,850 | 1,256,643 | 916,207 | |||||||||
|
|
|
|
|
|
|
|||||||
| Cash flows used in investing activities: |
||||||||||||
| Acquisition of property, plant and equipment |
(1,036,651 | ) | (716,485 | ) | (924,239 | ) | ||||||
| Proceeds and advances from sale of property, plant and equipment |
350,291 | 175,000 | 26,031 | |||||||||
| Cash paid for business and intangible asset acquisitions, net of cash |
(109,664 | ) | (36,620 | ) | (242,143 | ) | ||||||
| Issuance of notes receivable |
(6,500 | ) | — | (29,380 | ) | |||||||
| Other, net |
4,140 | (1,360 | ) | (10,250 | ) | |||||||
|
|
|
|
|
|
|
|||||||
| Net cash used in investing activities |
(798,384 | ) | (579,465 | ) | (1,179,981 | ) | ||||||
|
|
|
|
|
|
|
|||||||
| Cash flows (used in) provided by financing activities: |
||||||||||||
| Borrowings under debt agreements |
9,677,424 | 7,434,107 | 6,904,215 | |||||||||
| Payments toward debt agreements |
(9,206,016 | ) | (7,479,150 | ) | (6,445,922 | ) | ||||||
| Payments to acquire treasury stock |
(450,319 | ) | (306,640 | ) | (148,340 | ) | ||||||
| Dividends paid to stockholders |
(57,833 | ) | (59,959 | ) | (62,436 | ) | ||||||
| Net proceeds from exercise of stock options and issuance of common stock under employee stock purchase plan |
24,865 | 21,791 | 20,910 | |||||||||
| Treasury stock minimum tax withholding related to vesting of restricted stock |
(22,597 | ) | (12,268 | ) | (10,656 | ) | ||||||
| Other, net |
(12,568 | ) | (2,427 | ) | (4,259 | ) | ||||||
|
|
|
|
|
|
|
|||||||
| Net cash (used in) provided by financing activities |
(47,044 | ) | (404,546 | ) | 253,512 | |||||||
|
|
|
|
|
|
|
|||||||
| Effect of exchange rate changes on cash and cash equivalents |
(20,392 | ) | 5,228 | 8,358 | ||||||||
|
|
|
|
|
|
|
|||||||
| Net increase (decrease) in cash and cash equivalents |
68,030 | 277,860 | (1,904 | ) | ||||||||
| Cash and cash equivalents at beginning of period |
1,189,919 | 912,059 | 913,963 | |||||||||
|
|
|
|
|
|
|
|||||||
| Cash and cash equivalents at end of period |
$ | 1,257,949 | $ | 1,189,919 | $ | 912,059 | ||||||
|
|
|
|
|
|
|
|||||||
| Supplemental disclosure information: |
||||||||||||
| Interest paid, net of capitalized interest |
$ | 167,278 | $ | 130,635 | $ | 128,013 | ||||||
|
|
|
|
|
|
|
|||||||
| Income taxes paid, net of refunds received |
$ | 180,423 | $ | 187,871 | $ | 140,704 | ||||||
|
|
|
|
|
|
|
|||||||
See accompanying notes to Consolidated Financial Statements.
64
Table of Contents
Notes to Consolidated Financial Statements
1. Description of Business and Summary of Significant Accounting Policies
Jabil Inc. (together with its subsidiaries, herein referred to as the “Company”) is one of the leading providers of manufacturing services and solutions. The Company provides comprehensive electronics design, production and product management services to companies in various industries and end markets. The Company’s services combine a highly automated, continuous flow manufacturing approach with advanced electronic design and design for manufacturability technologies. The Company is headquartered in St. Petersburg, Florida and has manufacturing operations in the Americas, Europe, Asia and Africa.
Significant accounting policies followed by the Company are as follows:
Principles of Consolidation and Basis of Presentation
The consolidated financial statements include the accounts and operations of the Company, and its wholly-owned and majority-owned subsidiaries. All significant intercompany balances and transactions have been eliminated in preparing the consolidated financial statements. The Company has made certain reclassification adjustments to conform prior periods’ Consolidated Financial Statements and Notes to the Consolidated Financial Statements to the current presentation.
Use of Accounting Estimates
Management is required to make estimates and assumptions during the preparation of the consolidated financial statements and accompanying notes in conformity with U.S. generally accepted accounting principles (“U.S. GAAP”). These estimates and assumptions affect the reported amounts of assets and liabilities and the disclosure of contingent assets and liabilities at the dates of the consolidated financial statements and the reported amounts of revenues and expenses during the reporting period. Actual results could differ materially from these estimates and assumptions.
Cash and Cash Equivalents
Cash equivalents consist of investments that are readily convertible to cash with original maturities of 90 days or less. As of August 31, 2018 and 2017, there were $21.4 million and $71.5 million of cash equivalents, respectively.
Accounts Receivable
Accounts receivable consist of trade receivables and other miscellaneous receivables. The Company maintains an allowance for doubtful accounts for estimated losses resulting from the inability of its customers to make required payments. Bad debts are charged to this allowance after all attempts to collect the balance are exhausted. Allowances of $15.2 million and $14.1 million were recorded as of August 31, 2018 and 2017, respectively. As the financial condition and circumstances of the Company’s customers change, adjustments to the allowance for doubtful accounts are made as necessary.
Inventories
Inventories are stated at the lower of cost (on a first in, first out (FIFO) basis) and net realizable value. Inventory is valued based on current and forecasted usage, customer inventory-related contractual obligations and other lower of cost and net realizable value considerations. If actual market conditions or customer product demands are less favorable than those projected, additional valuation adjustments may be necessary.
65
Table of Contents
Property, Plant and Equipment, net
Property, plant and equipment is capitalized at cost and depreciated using the straight-line depreciation method over the estimated useful lives of the respective assets. Estimated useful lives for major classes of depreciable assets are as follows:
| Asset Class |
Estimated Useful Life | |
| Buildings |
Up to 35 years | |
| Leasehold improvements |
Shorter of lease term or useful life of the improvement | |
| Machinery and equipment |
2 to 10 years | |
| Furniture, fixtures and office equipment |
5 years | |
| Computer hardware and software |
3 to 7 years | |
| Transportation equipment |
3 years |
Certain equipment held under capital leases is classified as property, plant and equipment and the related obligation is recorded as accrued expenses and other liabilities on the Consolidated Balance Sheets. Amortization of assets held under capital leases is included in depreciation expense in the Consolidated Statements of Operations. Maintenance and repairs are expensed as incurred. The cost and related accumulated depreciation of assets sold or retired is removed from the accounts and any resulting gain or loss is reflected in the Consolidated Statements of Operations as a component of operating income.
Goodwill and Other Intangible Assets
The Company accounts for goodwill in a business combination as the excess of the cost over the fair value of net assets acquired and is assigned to the reporting unit in which the acquired business will operate. The Company tests goodwill and indefinite-lived intangible assets for impairment during the fourth quarter of each fiscal year or whenever events or changes in circumstances indicate the carrying amount may not be recoverable.
The recoverability of goodwill is measured at the reporting unit level by comparing the reporting unit’s carrying amount, including goodwill, to the fair value of the reporting unit. The Company determines the fair value of its reporting units based on an average weighting of both projected discounted future results and the use of comparative market multiples. If the carrying amount of the reporting unit exceeds its fair value, goodwill is considered impaired and a second step is performed to measure the amount of loss, if any.
The recoverability of indefinite-lived intangible assets is measured by comparing the carrying amount to the fair value. The Company determines the fair value of its indefinite-lived intangible assets principally based on a variation of the income approach, known as the relief from royalty method. If the carrying amount of the indefinite-lived intangible asset exceeds its fair value, the indefinite-lived intangible asset is considered impaired.
Business combinations can also result in other intangible assets being recognized. Finite-lived intangible assets are amortized on a straight-line basis over their estimated useful life and include contractual agreements and customer relationships and intellectual property. No significant residual values are estimated for the amortizable intangible assets.
Long-lived Assets
Long-lived assets, such as property, plant and equipment, and finite-lived intangible assets, are reviewed for impairment whenever events or changes in circumstances indicate that the carrying amount of an asset or asset group may not be recoverable. Recoverability of the asset or asset group is measured by comparing its carrying amount to the undiscounted future net cash flows the asset is expected to generate. If the carrying amount of an asset or asset group is not recoverable, the Company recognizes an impairment loss based on the excess of the carrying amount of the long-lived asset or asset group over its respective fair value, which is generally determined as the present value of estimated future cash flows or as the appraised value.
Derivative Instruments
All derivative instruments are recorded gross on the Consolidated Balance Sheets at their respective fair values. The accounting for changes in the fair value of a derivative instrument depends on the intended use and designation of the derivative instrument. For derivative instruments that are designated and qualify as a fair value hedge, the gain or loss on the derivative and the offsetting gain or loss on the hedged item attributable to the hedged risk are recognized in current earnings. For derivative instruments that are designated and qualify as a cash flow hedge, the effective portion of the gain or loss on the derivative instrument is initially reported as a component of accumulated other comprehensive income (“AOCI”), net of tax, and is subsequently reclassified into the line item within the Consolidated Statements of Operations in which the hedged items are recorded in the same period in which the hedged item affects earnings. The ineffective portion of the gain or loss is recognized immediately in current earnings. For derivative instruments that are not designated as hedging instruments, gains and losses from changes in fair values are recognized in earnings. Cash receipts and cash payments related to derivative instruments are recorded in the same category as the cash flows from the items being hedged on the Consolidated Statements of Cash Flows.
66
Table of Contents
Accumulated Other Comprehensive Income
The following table sets forth the changes in AOCI, net of tax, by component during the fiscal year ended August 31, 2018 (in thousands):
| Foreign Currency Translation Adjustment |
Derivative Instruments |
Actuarial (Loss) Gain |
Prior Service Cost |
Available for Sale Securities |
Total | |||||||||||||||||||
| Balance as of August 31, 2016 |
$ | 16,338 | $ | 7,784 | $ | (43,587 | ) | $ | 941 | $ | (21,353 | ) | $ | (39,877 | ) | |||||||||
| Other comprehensive income (loss) before reclassifications |
35,297 | 13,434 | (1) | 8,443 | 86 | 10,611 | 67,871 | |||||||||||||||||
| Amounts reclassified from AOCI |
5,947 | 8,749 | (2) | 1,929 | (3) | (138 | ) (3) | 10,139 | (4) | 26,626 | ||||||||||||||
|
|
|
|
|
|
|
|
|
|
|
|
|
|||||||||||||
| Other comprehensive income (loss)(5) |
41,244 | 22,183 | 10,372 | (52 | ) | 20,750 | 94,497 | |||||||||||||||||
|
|
|
|
|
|
|
|
|
|
|
|
|
|||||||||||||
| Balance as of August 31, 2017 |
$ | 57,582 | $ | 29,967 | $ | (33,215 | ) | $ | 889 | $ | (603 | ) | $ | 54,620 | ||||||||||
|
|
|
|
|
|
|
|
|
|
|
|
|
|||||||||||||
| Other comprehensive (loss) income before reclassifications |
(50,151 | ) | 1,225 | (1) | 7,067 | (1,444 | ) | (8,679 | ) | (51,982 | ) | |||||||||||||
| Amounts reclassified from AOCI |
— | (23,076 | ) (2) | 1,127 | (3) | (88 | ) (3) | — | (22,037 | ) | ||||||||||||||
|
|
|
|
|
|
|
|
|
|
|
|
|
|||||||||||||
| Other comprehensive (loss) income(5) |
(50,151 | ) | (21,851 | ) | 8,194 | (1,532 | ) | (8,679 | ) | (74,019 | ) | |||||||||||||
|
|
|
|
|
|
|
|
|
|
|
|
|
|||||||||||||
| Balance as of August 31, 2018 |
$ | 7,431 | $ | 8,116 | $ | (25,021 | ) | $ | (643 | ) | $ | (9,282 | ) | $ | (19,399 | ) | ||||||||
|
|
|
|
|
|
|
|
|
|
|
|
|
|||||||||||||
| (1) | Represents changes in fair value of derivative instruments. |
| (2) | Represents reclassification of net (gains) losses realized and included in net income related to derivative instruments. $14.8 million was classified into net income as a reduction of income tax expense related to derivative instruments for the fiscal year ended August 31, 2018. The remaining amount for fiscal year 2018 and the amount for fiscal year 2017 was primarily classified as a component of cost of revenue. The Company expects to reclassify $9.0 million into earnings during the next 12 months, which will primarily be classified as a component of cost of revenue. |
| (3) | Amounts are included in the computation of net periodic benefit pension cost. Refer to Note 9 – “Postretirement and Other Employee Benefits” for additional information. |
| (4) | The portion of AOCI reclassified into earnings during the fiscal year ended August 31, 2017 for available for sale |
securities was due to an other than temporary impairment on securities and was classified as a component of other
expense.
| (5) | Amounts are net of tax, which are immaterial. |
Foreign Currency Transactions
For the Company’s foreign subsidiaries that use a currency other than the U.S. dollar as their functional currency, the assets and liabilities are translated at exchange rates in effect at the balance sheet date, and revenues and expenses are translated at the average exchange rate for the period. The effects of these translation adjustments are reported in accumulated other comprehensive income. Gains and losses arising from transactions denominated in a currency other than the functional currency of the entity involved are included in operating income.
Revenue Recognition
The Company derives substantially all of its revenue from production and product management services (collectively referred to as “manufacturing services”), which encompasses the act of producing tangible components that are built to customer specifications, which are then provided to the customer. The Company recognizes manufacturing services revenue when such tangible components are shipped to or the goods are received by the customer, title and risk of ownership have
67
Table of Contents
passed, the price to the buyer is fixed or determinable and collectability is reasonably assured (net of estimated returns). The Company also derives revenue to a lesser extent from electronic design services to certain customers. Revenue from electronic design services is generally recognized upon completion and acceptance by the respective customer. Taxes collected from the Company’s customers and remitted to governmental authorities are presented within the Company’s Consolidated Statement of Operations on a net basis. The Company records shipping and handling costs reimbursed by the customer in revenue. Upfront payments from customers are recorded upon receipt as deferred income and are recognized as revenue as the related manufacturing services are provided.
Effective September 1, 2018, the Company’s revenue accounting policies will change in conjunction with the adoption of the accounting standard for revenue recognition. See further discussion of this new standard in Note 16—“New Accounting Guidance” to the Consolidated Financial Statements.
Stock-Based Compensation
The Company recognizes stock-based compensation expense, reduced for estimated forfeitures, on a straight-line basis over the requisite service period of the award, which is generally the vesting period for outstanding stock awards.
The stock-based compensation expense for time-based and performance based restricted stock is measured at fair value on the date of grant based on the number of shares expected to vest and the quoted market price of the Company’s common stock. For restricted stock awards with performance conditions, stock-based compensation expense is originally based on the number of shares that would vest if the Company achieved 100% of the performance goal, which is the intended outcome at the grant date. Throughout the requisite service period, management monitors the probability of achievement of the performance condition. If it becomes probable, based on the Company’s performance, that more or less than the current estimate of the awarded shares will vest, an adjustment to stock-based compensation expense will be recognized as a change in accounting estimate in the period that such probability changes.
The stock-based compensation expense for market-based restricted stock awards is measured at fair value on the date of grant. The market conditions are considered in the grant date fair value using a Monte Carlo valuation model, which utilizes multiple input variables to determine the probability of the Company achieving the specified market conditions. Stock-based compensation expense related to an award with a market condition will be recognized over the requisite service period regardless of whether the market condition is satisfied, provided that the requisite service period has been completed.
The Company currently expects to satisfy share-based awards with registered shares available to be issued.
See Note 11 – “Stockholders’ Equity” for further discussion of stock-based compensation expense.
Income Taxes
Deferred tax assets and liabilities are recognized for the future tax consequences attributable to differences between the financial statement carrying amounts of existing assets and liabilities and their respective tax basis. Deferred tax assets and liabilities are measured using enacted tax rates expected to apply to taxable income in the years in which those temporary differences are expected to be recovered or settled. The effect on deferred tax assets and liabilities of a change in the tax rate is recognized in income in the period that includes the enactment date of the rate change. The Company records a valuation allowance to reduce its deferred tax assets to the amount that is more likely than not to be realized. The Company considers future taxable income and ongoing feasible tax planning strategies in assessing the need for the valuation allowance.
Earnings Per Share
The Company calculates its basic earnings per share by dividing net income attributable to Jabil Inc. by the weighted average number of shares of common stock outstanding during the period. The Company’s diluted earnings per share is calculated in a similar manner, but includes the effect of dilutive securities. The difference between the weighted average number of basic shares outstanding and the weighted average number of diluted shares outstanding is primarily due to dilutive unvested restricted stock awards and dilutive stock appreciation rights.
Potential shares of common stock are excluded from the computation of diluted earnings per share when their effect would be antidilutive. Performance-based restricted stock awards are considered dilutive when the related performance criterion have been met assuming the end of the reporting period represents the end of the performance period. All potential shares of common stock are antidilutive in periods of net loss. Potential shares of common stock not included in the
68
Table of Contents
computation of earnings per share because their effect would have been antidilutive or because the performance criterion was not met were as follows (in thousands):
| Fiscal Year Ended August 31, | ||||||||||||
| 2018 | 2017 | 2016 | ||||||||||
| Stock appreciation rights |
— | 265 | 2,381 | |||||||||
| Restricted stock awards |
2,426 | 4,539 | 7,599 | |||||||||
Fair Value of Financial Instruments
The three levels of the fair-value hierarchy include: Level 1 – quoted market prices in active markets for identical assets and liabilities; Level 2 – inputs other than quoted market prices included in Level 1 that are observable for the asset or liability, either directly or indirectly; and Level 3 – unobservable inputs for the asset or liability.
The carrying amounts of cash and cash equivalents, trade accounts receivable, prepaid expenses and other current assets, accounts payable and accrued expenses approximate fair value because of the short-term nature of these financial instruments. Refer to Note 2 – “Trade Accounts Receivable Securitization and Sale Programs”, Note 8 – “Notes Payable and Long-Term Debt”, Note 9 – “Postretirement and Other Employee Benefits” and Note 13 –“Derivative Financial Instruments and Hedging Activities” for disclosure surrounding the fair value of the Company’s deferred purchase price receivables, debt obligations, pension plan assets and derivative financial instruments, respectively.
The Company has $50.0 million in Senior Non-Convertible Cumulative Preferred Stock of iQor Holdings, Inc. that accretes dividends at an annual rate of 8 percent and is redeemable on March 31, 2023 or upon a change in control. The Senior Non-Convertible Cumulative Preferred Stock is valued each reporting period using unobservable inputs (Level 3 inputs) based on an interest rate lattice model and is classified as an available for sale security with an unrealized loss recorded to AOCI. The unobservable inputs have an immaterial impact on the fair value calculation of the Senior Non-Convertible Cumulative Preferred Stock. As of August 31, 2018 and 2017, the fair value was $47.3 million and $49.8 million, respectively, and is included within other assets on the Consolidated Balance Sheets.
2. Trade Accounts Receivable Securitization and Sale Programs
The Company regularly sells designated pools of trade accounts receivable under two asset-backed securitization programs and nine uncommitted trade accounts receivable sale programs (collectively referred to herein as the “programs”). The Company continues servicing the receivables sold and in exchange receives a servicing fee under each of the programs. Servicing fees related to each of the programs recognized during the fiscal years ended August 31, 2018, 2017 and 2016 were not material. The Company does not record a servicing asset or liability on the Consolidated Balance Sheets as the Company estimates that the fee it receives to service these receivables approximates the fair market compensation to provide the servicing activities.
Transfers of the receivables under the programs are accounted for as sales and, accordingly, net receivables sold under the programs are excluded from accounts receivable on the Consolidated Balance Sheets and are reflected as cash provided by operating activities on the Consolidated Statements of Cash Flows.
Asset-Backed Securitization Programs
The Company continuously sells designated pools of trade accounts receivable, at a discount, under its North American asset-backed securitization program and its foreign asset-backed securitization program (collectively referred to herein as the “asset-backed securitization programs”) to special purpose entities, which in turn sell 100% of the receivables to: (i) conduits administered by unaffiliated financial institutions for the North American asset-backed securitization program and (ii) to an unaffiliated financial institution and a conduit administered by an unaffiliated financial institution for the foreign asset-backed securitization program. Any portion of the purchase price for the receivables not paid in cash upon the sale occurring is recorded as a deferred purchase price receivable, which is paid from available cash as payments on the underlying receivables are collected.
The special purpose entity in the North American asset-backed securitization program is a wholly-owned subsidiary of the Company. The special purpose entity in the foreign asset-backed securitization program is a separate bankruptcy-remote entity whose assets would be first available to satisfy the creditor claims of the unaffiliated financial institution. The Company is deemed the primary beneficiary of this special purpose entity as the Company has both the power to direct the activities of the entity that most significantly impact the entity’s economic performance and the obligation to absorb losses or the right to
69
Table of Contents
receive the benefits that could potentially be significant to the entity from the transfer of the trade accounts receivable into the special purpose entity. Accordingly, the special purpose entities associated with these asset-backed securitization programs are included in the Company’s Consolidated Financial Statements.
Following is a summary of the asset-backed securitization programs and key terms:
| Maximum Amount of Net Cash Proceeds (in millions)(1) |
Expiration Date |
|||||||
| North American |
$ | 200.0 | October 20, 2020 | (2) | ||||
| Foreign |
$ | 400.0 | September 30, 2021 | (3) | ||||
| (1) | Maximum amount available at any one time. |
| (2) | On October 9, 2018, the North American asset-backed securitization program was terminated and the Company repurchased the outstanding receivables. |
| (3) | On September 21, 2018, the foreign asset-backed securitization program terms were amended and the program was extended to September 30, 2021. Under the terms of the amended agreement, the Company continuously sells designated pools of trade accounts receivable to a special purpose entity, which in turn sells a portion of the receivables to an unaffiliated financial institution and a conduit administered by an unaffiliated financial institution. In connection with this amendment, there is no longer a deferred purchase price receivable for the foreign asset-backed securitization program. |
In connection with the asset-backed securitization programs, the Company recognized the following (in millions):
| Fiscal Year Ended August 31, | ||||||||||||
| 2018 | 2017 | 2016 | ||||||||||
| Eligible trade accounts receivable sold |
$ | 8,386 | $ | 8,878 | $ | 7,870 | ||||||
| Cash proceeds received(1) |
$ | 7,838 | $ | 8,300 | $ | 7,336 | ||||||
| Pre-tax losses on sale of receivables(2) |
$ | 15 | $ | 9 | $ | 5 | ||||||
| Deferred purchase price receivables as of August 31(3) |
$ | 533 | $ | 569 | $ | 527 | ||||||
| (1) | Of this amount, $0.0 million, $0.1 million and $8.4 million, respectively, represented new transfers during fiscal years 2018, 2017 and 2016, respectively. The remainder represented proceeds from collections reinvested in revolving-period transfers. |
| (2) | Recorded to other expense within the Consolidated Statements of Operations. |
| (3) | Recorded initially at fair value as prepaid expenses and other current assets on the Consolidated Balance Sheets and are valued using unobservable inputs (Level 3 inputs), primarily discounted cash flows, and due to their credit quality and short-term maturity, the fair values approximated book values. The unobservable inputs consist of estimated credit losses and estimated discount rates, which both have an immaterial impact on the fair value calculations. |
The asset-backed securitization programs require compliance with several covenants. The North American asset-backed securitization program covenants include compliance with the interest coverage ratio and debt to EBITDA ratio of the five-year unsecured credit facility amended as of November 8, 2017 (“the 2017 Credit Facility”). The foreign asset-backed securitization program covenants include limitations on certain corporate actions such as mergers and consolidations. As of August 31, 2018 and 2017, the Company was in compliance with all covenants under the asset-backed securitization programs.
70
Table of Contents
Trade Accounts Receivable Sale Programs
Following is a summary of the nine trade accounts receivable sale programs with unaffiliated financial institutions where the Company may elect to sell receivables and the unaffiliated financial institution may elect to purchase, at a discount, on an ongoing basis:
| Program | Maximum Amount (in millions)(1) |
Type of Facility |
Expiration Date |
|||||||||
| A |
$ | 875.0 | Uncommitted | August 31, 2022 | (2)(3) | |||||||
| B |
$ | 150.0 | Uncommitted | November 30, 2018 | (4) | |||||||
| C |
800.0 | CNY | Uncommitted | February 13, 2019 | ||||||||
| D |
$ | 100.0 | Uncommitted | May 4, 2023 | (5) | |||||||
| E |
$ | 50.0 | Uncommitted | August 25, 2019 | ||||||||
| F |
$ | 150.0 | Uncommitted | January 25, 2019 | (6) | |||||||
| G |
$ | 50.0 | Uncommitted | February 23, 2023 | (3) | |||||||
| H |
$ | 100.0 | Uncommitted | August 10, 2019 | (7) | |||||||
| I |
$ | 100.0 | Uncommitted | July 21, 2019 | (8) | |||||||
| (1) | Maximum amount available at any one time. |
| (2) | The maximum amount under the program will reduce to $650.0 million on February 1, 2019. |
| (3) | Any party may elect to terminate the agreement upon 15 days prior notice. |
| (4) | The program will automatically extend for one year at each expiration date unless either party provides 10 days notice of termination. |
| (5) | Any party may elect to terminate the agreement upon 30 days prior notice. |
| (6) | The program will be automatically extended through January 25, 2023 unless either party provides 30 days notice of termination. |
| (7) | The program will be automatically extended through August 10, 2023 unless either party provides 30 days notice of termination. |
| (8) | The program will be automatically extended through August 21, 2023 unless either party provides 30 days notice of termination. |
In connection with the trade accounts receivable sale programs, the Company recognized the following for the fiscal years ended August 31 (in millions):
| 2018 | 2017 | 2016 | ||||||||||
| Trade accounts receivable sold |
$ | 5,480 | $ | 2,968 | $ | 3,651 | ||||||
| Cash proceeds received |
$ | 5,463 | $ | 2,962 | $ | 3,647 | ||||||
| Loss on sales(1) |
$ | 17 | $ | 6 | $ | 4 | ||||||
| (1) | The resulting losses on the sales of trade accounts receivable during fiscal years 2018, 2017 and 2016 were recorded to other expense within the Consolidated Statements of Operations. |
3. Inventories
Inventories consist of the following (in thousands):
| August 31, 2018 | August 31, 2017 | |||||||
| Raw materials |
$ | 2,070,569 | $ | 1,574,241 | ||||
| Work in process |
788,742 | 822,628 | ||||||
| Finished goods |
659,335 | 591,227 | ||||||
| Reserve for excess and obsolete inventory |
(60,940 | ) | (46,013 | ) | ||||
|
|
|
|
|
|||||
| Inventories, net |
$ | 3,457,706 | $ | 2,942,083 | ||||
|
|
|
|
|
|||||
4. Income Taxes
Provision for Income Taxes
Income (loss) before income tax expense is summarized below (in thousands):
| Fiscal Year Ended August 31, | ||||||||||||
| 2018 | 2017 | 2016 | ||||||||||
| U.S.(1) |
$ | (426,897 | ) | $ | (373,690 | ) | $ | (317,427 | ) | |||
|
Non-U.S.(1) |
800,298 | 629,923 | 704,472 | |||||||||
|
|
|
|
|
|
|
|||||||
| $ | 373,401 | $ | 256,233 | $ | 387,045 | |||||||
|
|
|
|
|
|
|
|||||||
| (1) | The U.S. and non-U.S. components of income (loss) before income tax expense include the elimination of intercompany foreign dividends paid to the U.S. |
71
Table of Contents
Income tax expense (benefit) is summarized below (in thousands):
| Fiscal Year Ended August 31, | Current | Deferred | Total | |||||||||
| 2018: U.S. – Federal |
$ | 69,080 | $ | (24,342 | ) | $ | 44,738 | |||||
| U.S. – State |
134 | 93 | 227 | |||||||||
| Non-U.S. |
178,790 | 62,105 | 240,895 | |||||||||
|
|
|
|
|
|
|
|||||||
| $ | 248,004 | $ | 37,856 | $ | 285,860 | |||||||
|
|
|
|
|
|
|
|||||||
| 2017: U.S. – Federal |
$ | 2,436 | $ | 253 | $ | 2,689 | ||||||
| U.S. – State |
12 | 30 | 42 | |||||||||
| Non-U.S. |
188,872 | (62,537 | ) | 126,335 | ||||||||
|
|
|
|
|
|
|
|||||||
| $ | 191,320 | $ | (62,254 | ) | $ | 129,066 | ||||||
|
|
|
|
|
|
|
|||||||
| 2016: U.S. – Federal |
$ | (649 | ) | $ | 73 | $ | (576 | ) | ||||
| U.S. – State |
(166 | ) | 9 | (157 | ) | |||||||
| Non-U.S. |
157,069 | (24,187 | ) | 132,882 | ||||||||
|
|
|
|
|
|
|
|||||||
| $ | 156,254 | $ | (24,105 | ) | $ | 132,149 | ||||||
|
|
|
|
|
|
|
|||||||
Reconciliations of the income tax expense at the U.S. federal statutory income tax rate compared to the actual income tax expense are summarized below (in thousands):
| Fiscal Year Ended August 31, | ||||||||||||
| 2018 | 2017 | 2016 | ||||||||||
| Tax at U.S. federal statutory income tax rate(1) |
$ | 95,852 | $ | 89,682 | $ | 135,470 | ||||||
| State income taxes, net of federal tax benefit |
(5,417 | ) | (8,474 | ) | (5,121 | ) | ||||||
| Impact of foreign tax rates(2) |
(71,889 | ) | (109,466 | ) | (144,521 | ) | ||||||
| Permanent impact of non-deductible cost |
21,988 | 7,336 | 3,408 | |||||||||
| Income tax credits |
(10,405 | ) | (16,254 | ) | (5,040 | ) | ||||||
| Changes in tax rates on deferred tax assets and liabilities(3) |
15,048 | 688 | 182 | |||||||||
| Transition tax related to the Tax Act(4) |
232,405 | — | — | |||||||||
| Change in indefinite reinvestment assertion related to the Tax Act(5) |
21,754 | — | — | |||||||||
| Valuation allowance(6) |
(61,186 | ) | 37,934 | 11,770 | ||||||||
| Non-deductible equity compensation |
20,443 | 11,531 | 18,350 | |||||||||
| Impact of intercompany charges and dividends(7) |
27,442 | 98,052 | 94,596 | |||||||||
| Reclassification of stranded tax effects in AOCI |
(14,811 | ) | — | — | ||||||||
| Other, net |
14,636 | 18,037 | 23,055 | |||||||||
|
|
|
|
|
|
|
|||||||
| Total income tax expense |
$ | 285,860 | $ | 129,066 | $ | 132,149 | ||||||
|
|
|
|
|
|
|
|||||||
| (1) | The U.S. federal statutory income tax rate was 25.7%, 35% and 35% for fiscal years ended August 31, 2018, 2017 and 2016, respectively. As a result of the Tax Cuts and Jobs Act of 2017 (“Tax Act”), the Company will be subject to a blended U.S. federal tax rate of 25.7% for the fiscal year ended August 31, 2018 and a 21.0% U.S. federal tax rate for future fiscal years. |
| (2) | For the fiscal year ended August 31, 2018, the decrease in the impact of foreign tax rates was primarily due to a decrease in the U.S. federal statutory income tax rate from 35% to 25.7% due to the Tax Act. |
| (3) | For the fiscal year ended August 31, 2018, the increase in the changes in tax rates on deferred tax assets and liabilities was primarily due to the Tax Act. This increase excludes the impact of the enacted rate change on the U.S. valuation allowance. |
| (4) | The Tax Act introduced a one-time mandatory income inclusion of the historically untaxed foreign earnings of a U.S. company’s foreign subsidiaries and will effectively tax such income at reduced tax rates (“transition tax”). For the fiscal year ended August 31, 2018, the transition tax related to the Tax Act reflects the $65.9 million provisional one-time transition tax inclusive of unrecognized tax benefits and the corresponding utilization of U.S. federal net operating losses and tax credits that historically had valuation allowances. |
72
Table of Contents
| (5) | For the fiscal year ended August 31, 2018, the change in indefinite reinvestment assertion related to the Tax Act reflects the $85.0 million of foreign taxes that would be incurred upon future remittances of certain foreign earnings less the write off of a previously recorded U.S. deferred tax liability that is no longer taxable due to the Tax Act. |
| (6) | For the fiscal year ended August 31, 2018, the valuation allowance decrease was due to utilization of U.S. federal net operating losses and tax credits against the one-time transition tax and the change in enacted tax rate applied to U.S. deferred tax assets and liabilities. The tax benefit from the valuation allowance reversal on U.S. federal net operating losses utilized in the one-time transition tax was $85.0 million. The valuation allowance decrease is partially offset by the current year increase of deferred tax assets in sites with existing valuation allowances. |
| (7) | For the fiscal year ended August 31, 2018, the decrease in the impact of intercompany charges and dividends was due to a change in the U.S. taxation of foreign dividends as a result of the Tax Act. |
On December 22, 2017, the U.S. government enacted comprehensive tax legislation. The Tax Act reduced the corporate tax rate, limited or eliminated certain tax deductions, established the transition tax, and changed the taxation of foreign earnings of U.S. multinational companies. The Securities and Exchange Commission (“SEC”) Staff Accounting Bulletin No. 118, Income Tax Accounting Implications of the Tax Cut and Jobs Act (“SAB 118”), provides guidance on accounting for the tax effects of the Tax Act. SAB 118 provides a measurement period that should not extend beyond one year from the Tax Act enactment date for companies to complete the accounting under Accounting Standards Codification Topic 740, “Income Taxes” (“ASC 740”). In accordance with SAB 118, a company must reflect the income tax effects of those aspects of the Tax Act for which the accounting under ASC 740 is complete. To the extent that a company’s accounting for certain income tax effects of the Tax Act is incomplete, but it is able to determine a reasonable estimate, it must record a provisional estimate in its financial statements.
For the fiscal year ended August 31, 2018, the Company made reasonable estimates related to certain impacts of the Tax Act and, in accordance with SAB 118, recorded a net provisional income tax expense of $142.3 million. This net provisional expense is mainly comprised of $65.9 million related to the one-time transition tax inclusive of unrecognized tax benefits, $(10.5) million related to the re-measurement of the Company’s U.S. deferred tax attributes, and $85.0 million related to a change in the indefinite reinvestment assertion on certain earnings from its foreign subsidiaries. For the three months ended August 31, 2018, the Company recorded $111.4 million associated with the Tax Act, mainly comprised of $24.9 million related to the one-time transition tax to adjust the amount recorded previously through the nine months ended May 31, 2018 and $85.0 million for the change in indefinite reinvestment assertion on certain earnings from the Company’s foreign subsidiaries, resulting in a combined net increase of 29.8% to the Company’s effective tax rate for the fiscal year ended August 31, 2018.
The calculation of the one-time transition tax of $65.9 million for the fiscal year ended August 31, 2018 is based upon preliminary estimates of post-1986 earnings and profits, applicable foreign tax credits and relevant limitations, utilization of U.S. federal net operating losses and tax credits and the amounts of foreign earnings held in cash and non-cash assets. The adjustment to the transition tax of $24.9 million for the three months ended August 31, 2018 was primarily related to further analysis of earnings and profits of the Company’s foreign subsidiaries and utilization of foreign tax credits, a revised provisional calculation of foreign earnings held in cash and other specified assets, and the Company’s interpretation of additional regulatory guidance issued. The transition tax remains provisional pending additional regulatory guidance that may be issued, changes in interpretations and assumptions, and finalization of calculations of the impact of the Tax Act, including foreign earnings and profits of the Company’s foreign subsidiaries and applicable foreign tax credits and relevant limitations for fiscal year 2018.
The provisional income tax benefit of $(10.5) million recorded for the fiscal year ended August 31, 2018 relates to the re-measurement of the Company’s deferred tax balances, inclusive of valuation allowances, and is based primarily on the rates at which the deferred tax assets and liabilities are expected to reverse in the current and future fiscal years. The enactment date re-measurement of U.S. deferred tax assets and liabilities is provisional as the final re-measurement cannot be determined until the final calculation of underlying temporary differences is completed, rather than estimated. In addition, the Company is also analyzing the impact of the Tax Act to the existing valuation allowance assessments from both a federal and state tax perspective, which could potentially affect the realizability of the existing deferred tax assets.
The change in indefinite reinvestment assertion of $85.0 million recorded during the three months and fiscal year ended August 31, 2018 relates to certain foreign earnings and the foreign taxes that would be incurred upon future remittances of such earnings. This amount remains provisional as the Company completes further analysis of available distributable earnings from its foreign subsidiaries and continued review of its capital structure.
73
Table of Contents
The Company is still evaluating the Global Intangible Low-Taxed Income (“GILTI”) provisions and the associated election to record its effects as a period cost or a component of deferred taxes. This analysis has not been completed due to the complexity of the new GILTI tax rules, which is dependent, in part, on analyzing the Company’s global income to determine whether the Company expects to have future U.S. inclusions in taxable income related to GILTI and the associated estimated amount. Because the Company’s expectations around U.S. inclusions in taxable income related to GILTI depend on its estimated future results of global operations and preparation and analysis of information not previously relevant or regularly produced, this accounting election remains open as of August 31, 2018.
For the fiscal year ended August 31, 2018, the Company believes $142.3 million is a reasonable net estimate related to the Tax Act based on the analysis, interpretations and guidance available at this time. As the Company finalizes the accounting for the tax effects of the enactment of the Tax Act during the measurement period, the Company will reflect adjustments to the provisional amounts recorded and record additional tax effects in the periods such adjustments are identified. For the reasons outlined above, the Company has not completed its accounting for any aspect of the Tax Act.
The Company has been granted tax incentives for its Brazilian, Chinese, Malaysian, Polish, Singaporean and Vietnamese subsidiaries. The majority of the tax incentive benefits expire at various dates through fiscal year 2028 and are subject to certain conditions with which the Company expects to comply. These subsidiaries generated income from continuing operations during the fiscal years ended August 31, 2018, 2017 and 2016, resulting in a tax benefit of approximately $52.1 million ($0.30 per basic share), $38.6 million ($0.22 per basic share) and $50.5 million ($0.27 per basic share), respectively. The benefits of these incentives are classified as the impact of foreign tax rates and income tax credits in the reconciliation of income tax expense table above.
Deferred Tax Assets and Liabilities
The significant components of the deferred tax assets and liabilities are summarized below (in thousands):
| Fiscal Year Ended August 31, | ||||||||
| 2018 | 2017 | |||||||
| Deferred tax assets: |
||||||||
| Net operating loss carry forward |
$ | 119,259 | $ | 268,853 | ||||
| Receivables |
7,111 | 7,497 | ||||||
| Inventories |
7,634 | 11,618 | ||||||
| Compensated absences |
8,266 | 10,981 | ||||||
| Accrued expenses |
81,912 | 93,413 | ||||||
| Property, plant and equipment, principally due to differences in depreciation and amortization |
97,420 | 81,954 | ||||||
| U.S. federal and state tax credits |
70,153 | 57,122 | ||||||
| Foreign jurisdiction tax credits |
25,887 | 24,641 | ||||||
| Equity compensation – U.S. |
7,566 | 16,460 | ||||||
| Equity compensation – Non-U.S. |
2,401 | 2,700 | ||||||
| Other |
18,176 | 14,573 | ||||||
|
|
|
|
|
|||||
| Total deferred tax assets before valuation allowances |
445,785 | 589,812 | ||||||
| Less valuation allowances |
(223,487 | ) | (285,559 | ) | ||||
|
|
|
|
|
|||||
| Net deferred tax assets |
$ | 222,298 | $ | 304,253 | ||||
|
|
|
|
|
|||||
| Deferred tax liabilities: |
||||||||
| Unremitted earnings of non-U.S. subsidiaries |
74,654 | 86,202 | ||||||
| Intangible assets |
39,122 | 48,229 | ||||||
| Cash flow hedges |
— | 8,564 | ||||||
| Other |
4,655 | 4,863 | ||||||
|
|
|
|
|
|||||
| Total deferred tax liabilities |
$ | 118,431 | $ | 147,858 | ||||
|
|
|
|
|
|||||
| Net deferred tax assets |
$ | 103,867 | $ | 156,395 | ||||
|
|
|
|
|
|||||
As of August 31, 2018, the Company had state (tax-effected) and foreign income tax net operating loss carry forwards (net of unrecognized tax benefits) of approximately $55.4 million and $318.0 million, respectively, which are available to reduce future taxes, if any. The net operating loss carry forwards in the Company’s major tax jurisdictions expire in fiscal years 2019 through 2038 or have an indefinite carry forward period. The Company has U.S. federal and state tax credit carry forwards of $65.6 million and $4.8 million, respectively, which are available to reduce future taxes, if any. Most of the U.S.
74
Table of Contents
federal tax credits expire through fiscal year 2027. Most of the U.S. state tax credits expire through fiscal year 2027. As of August 31, 2018, the foreign jurisdiction tax credits include foreign investment tax credits of $23.3 million that expire predominantly in fiscal year 2027 and are based on the deferral method.
Based on the Company’s historical operating income, projection of future taxable income, scheduled reversal of taxable temporary differences, and tax planning strategies, management believes that it is more likely than not that the Company will realize the benefit of its deferred tax assets, net of valuation allowances recorded. The net decreases in the total valuation allowance for the fiscal years ended August 31, 2018 and 2017 were $(62.1) million and $(59.3) million, respectively. The fiscal year ended August 31, 2018 decrease in valuation allowance is primarily related to the decrease of a U.S. federal net operating loss carry forward due to utilization against the one-time transition tax under the Tax Act. This decrease is partially offset by the increase of deferred tax assets in sites with existing valuation allowances.
As a result of the one-time transition tax, the Company will have a substantial amount of previously taxed earnings that can be distributed to the U.S. without additional U.S. federal taxation. Additionally, the Tax Act provides for a 100% dividends received deduction for dividends received by U.S. corporations from 10-percent or more owned foreign corporations. During the fiscal year ended August 31, 2018, the Company recorded liabilities of $85.0 million from a change in the indefinite reinvestment assertion on certain earnings from its foreign subsidiaries, primarily associated with foreign withholding taxes that would be incurred upon such future remittances of cash. Of these liabilities, $74.7 million remained as a deferred tax liability as of August 31, 2018 after current year remittances. The Company intends to indefinitely reinvest the remaining earnings from its foreign subsidiaries for which a deferred tax liability has not already been recorded. The accumulated earnings are the most significant component of the basis difference which is indefinitely reinvested. While the Company has made a reasonable estimate of the impact of the Tax Act on its indefinite reinvestment assertion, the Company continues to evaluate its indefinite reinvestment assertion and may further adjust this estimate during the measurement period. As of August 31, 2018, the indefinitely reinvested earnings in foreign subsidiaries upon which taxes had not been provided were approximately $2.4 billion. Determination of the amount of unrecognized deferred tax liability on these undistributed earnings is not practicable.
Unrecognized Tax Benefits
Reconciliations of the unrecognized tax benefits are summarized below (in thousands):
| Fiscal Year Ended August 31, | ||||||||||||
| 2018 | 2017 | 2016 | ||||||||||
| Beginning balance |
$ | 201,355 | $ | 149,898 | $ | 154,648 | ||||||
| Additions for tax positions of prior years |
14,465 | 2,155 | 7,974 | |||||||||
| Reductions for tax positions of prior years |
(21,045 | ) | (12,233 | ) | (20,045 | ) | ||||||
| Additions for tax positions related to current year |
81,866 | 77,807 | 25,892 | |||||||||
| Cash settlements |
(1,659 | ) | (2,298 | ) | (6,553 | ) | ||||||
| Reductions from lapses in statutes of limitations |
(7,496 | ) | (10,446 | ) | (7,099 | ) | ||||||
| Reductions from settlements with taxing authorities |
(5,928 | ) | (6,061 | ) | (1,787 | ) | ||||||
| Foreign exchange rate adjustment |
(4,853 | ) | 2,533 | (3,132 | ) | |||||||
|
|
|
|
|
|
|
|||||||
| Ending balance |
$ | 256,705 | $ | 201,355 | $ | 149,898 | ||||||
|
|
|
|
|
|
|
|||||||
| Unrecognized tax benefits that would affect the effective tax rate (if recognized) |
$ | 117,455 | $ | 75,223 | $ | 72,152 | ||||||
|
|
|
|
|
|
|
|||||||
For the fiscal year ended August 31, 2018, the additions for tax positions related to current year primarily related to the impacts of the Tax Act and U.S. taxation of certain intercompany transactions. It is reasonably possible that the August 31, 2018 unrecognized tax benefits could decrease during the next 12 months by $106.1 million, primarily related to a taxing authority ruling associated with an internal restructuring and a potential audit settlement associated with intercompany transactions. Both of these tax positions were previously offset with valuation allowances.
For the fiscal year ended August 31, 2017, the additions for tax positions related to current year primarily related to certain non-U.S. net operating loss carry forwards, previously offset with a valuation allowance, that can no longer be recognized due to an internal restructuring.
75
Table of Contents
The Company recognizes interest and penalties related to unrecognized tax benefits in income tax expense. The Company’s accrued interest and penalties were approximately $20.4 million and $27.1 million as of August 31, 2018 and 2017, respectively. The Company recognized interest and penalties of approximately $(6.7) million, $5.2 million and $1.8 million during the fiscal years ended August 31, 2018, 2017 and 2016, respectively.
The Company is no longer subject to U.S. federal and state income tax examinations for fiscal years before August 31, 2009. In major non-U.S. jurisdictions, the Company is no longer subject to income tax examinations for fiscal years before August 31, 2008.
The Internal Revenue Service (“IRS”) completed its field examination of the Company’s tax returns for fiscal years 2009 through 2011 and issued a Revenue Agent’s Report (“RAR”) on May 27, 2015, which was updated on June 22, 2016. The IRS completed its field examination of the Company’s tax returns for fiscal years 2012 through 2014 and issued an RAR on April 19, 2017. The proposed adjustments in the RAR from both examination periods relate primarily to U.S. taxation of certain intercompany transactions. If the IRS ultimately prevails in its positions, the Company’s income tax payment due for the fiscal years 2009 through 2011 and 2012 through 2014 would be approximately $28.6 million and $5.3 million, respectively, after utilization of tax loss carry forwards available through fiscal year 2014. Also, the IRS has proposed interest and penalties with respect to fiscal years 2009 through 2011. The IRS may make similar claims in future audits with respect to these types of transactions. At this time, anticipating the amount of any future IRS proposed adjustments, interest, and penalties is not practicable.
The Company disagrees with the proposed adjustments and intends to vigorously contest these matters through the applicable IRS administrative and judicial procedures, as appropriate. As the final resolution of the proposed adjustments remains uncertain, the Company continues to provide for the uncertain tax positions based on the more likely than not standard. While the resolution of the issues may result in tax liabilities, interest and penalties that are significantly higher than the amounts accrued for these matters, management currently believes that the resolution will not have a material adverse effect on the Company’s financial position, results of operations or cash flows. However, there can be no assurance that management’s beliefs will be realized.
5. Property, Plant and Equipment
Property, plant and equipment consists of the following (in thousands):
| August 31, | ||||||||
| 2018 | 2017 | |||||||
| Land and improvements |
$ | 144,136 | $ | 120,574 | ||||
| Buildings |
849,975 | 804,861 | ||||||
| Leasehold improvements |
1,013,428 | 877,752 | ||||||
| Machinery and equipment |
3,983,025 | 3,680,881 | ||||||
| Furniture, fixtures and office equipment |
192,243 | 178,603 | ||||||
| Computer hardware and software |
601,955 | 583,569 | ||||||
| Transportation equipment |
17,215 | 22,080 | ||||||
| Construction in progress |
42,984 | 85,748 | ||||||
|
|
|
|
|
|||||
| 6,844,961 | 6,354,068 | |||||||
| Less accumulated depreciation and amortization |
3,646,945 | 3,125,390 | ||||||
|
|
|
|
|
|||||
| $ | 3,198,016 | $ | 3,228,678 | |||||
|
|
|
|
|
|||||
Depreciation and maintenance and repair expenses were as follows for the periods indicated (in thousands):
| Fiscal Year Ended August 31, | ||||||||||||
| 2018 | 2017 | 2016 | ||||||||||
| Depreciation expense |
$ | 735,213 | $ | 724,856 | $ | 659,542 | ||||||
| Maintenance and repair expense |
$ | 266,691 | $ | 234,332 | $ | 197,373 | ||||||
As of August 31, 2018 and 2017, the Company had $253.6 million and $242.2 million, respectively, included in accounts payable for the acquisition of property, plant and equipment, which is considered a non-cash investing activity in the Consolidated Statements of Cash Flows.
76
Table of Contents
6. Goodwill and Other Intangible Assets
The Company completed its annual impairment test for goodwill and indefinite-lived intangible assets during the fourth quarter of fiscal year 2018 and determined the fair values of the reporting units and the indefinite-lived intangible assets were substantially in excess of the carrying values and that no impairment existed as of the date of the impairment test.
The following table presents the changes in goodwill allocated to the Company’s reportable segments, Electronics Manufacturing Services (“EMS”) and Diversified Manufacturing Services (“DMS”), during the fiscal years ended August 31, 2018 and 2017 (in thousands):
| EMS | DMS | Total | ||||||||||
| Balance as of August 31, 2016 |
$ | 51,179 | $ | 543,594 | $ | 594,773 | ||||||
| Acquisitions and adjustments |
— | 8,186 | 8,186 | |||||||||
| Change in foreign currency exchange rates |
1,395 | 3,830 | 5,225 | |||||||||
|
|
|
|
|
|
|
|||||||
| Balance as of August 31, 2017 |
52,574 | 555,610 | 608,184 | |||||||||
| Acquisitions and adjustments (1) |
30,763 | (8,186 | ) | 22,577 | ||||||||
| Change in foreign currency exchange rates |
(667 | ) | (2,349 | ) | (3,016 | ) | ||||||
|
|
|
|
|
|
|
|||||||
| Balance as of August 31, 2018 |
$ | 82,670 | $ | 545,075 | $ | 627,745 | ||||||
|
|
|
|
|
|
|
|||||||
| (1) | Includes $8.2 million of goodwill reallocated between DMS and EMS during fiscal year 2018. |
The following table is a summary of the Company’s gross goodwill balances and accumulated impairments as of the periods indicated (in thousands):
| August 31, 2018 | August 31, 2017 | |||||||||||||||
| Gross Carrying Amount |
Accumulated Impairment |
Gross Carrying Amount |
Accumulated Impairment |
|||||||||||||
| Goodwill |
$ | 1,647,567 | $ | 1,019,822 | $ | 1,628,006 | $ | 1,019,822 | ||||||||
77
Table of Contents
The following table presents the Company’s total purchased intangible assets as of August 31, 2018 and 2017 (in thousands):
| Weighted Average Amortization Period (in years) |
August 31, 2018 | August 31, 2017 | ||||||||||||||||||||||||||
| Gross Carrying Amount |
Accumulated Amortization |
Net Carrying Amount |
Gross Carrying Amount |
Accumulated Amortization |
Net Carrying Amount |
|||||||||||||||||||||||
| Contractual agreements and customer relationships |
11 | $ | 289,947 | $ | (153,415 | ) | $ | 136,532 | $ | 265,148 | $ | (132,691 | ) | $ | 132,457 | |||||||||||||
| Intellectual property |
5 | 168,181 | (148,672 | ) | 19,509 | 160,456 | (131,407 | ) | 29,049 | |||||||||||||||||||
| Finite-lived trade names |
Not applicable | 5,091 | (5,091 | ) | — | 5,114 | (5,114 | ) | — | |||||||||||||||||||
| Trade names |
Indefinite | 123,090 | — | 123,090 | 123,090 | — | 123,090 | |||||||||||||||||||||
|
|
|
|
|
|
|
|
|
|
|
|
|
|||||||||||||||||
| Total intangible assets |
9 | $ | 586,309 | $ | (307,178 | ) | $ | 279,131 | $ | 553,808 | $ | (269,212 | ) | $ | 284,596 | |||||||||||||
|
|
|
|
|
|
|
|
|
|
|
|
|
|||||||||||||||||
Intangible asset amortization for fiscal years 2018, 2017 and 2016 was approximately $38.5 million, $35.5 million and $37.1 million, respectively. The estimated future amortization expense is as follows (in thousands):
| Fiscal Year Ended August 31, | ||||
| 2019 |
$ | 30,212 | ||
| 2020 |
26,645 | |||
| 2021 |
18,261 | |||
| 2022 |
17,119 | |||
| 2023 |
14,704 | |||
| Thereafter |
49,100 | |||
|
|
|
|||
| Total |
$ | 156,041 | ||
|
|
|
|||
7. Accrued Expenses
Accrued expenses consist of the following (in thousands):
| August 31, 2018 | August 31, 2017 | |||||||
| Deferred income |
$ | 691,365 | $ | 1,017,144 | ||||
| Accrued compensation and employee benefits |
570,400 | 534,143 | ||||||
| Other accrued expenses |
1,000,979 | 617,428 | ||||||
|
|
|
|
|
|||||
| Accrued expenses |
$ | 2,262,744 | $ | 2,168,715 | ||||
|
|
|
|
|
|||||
8. Notes Payable and Long-Term Debt
Notes payable and long-term debt outstanding as of August 31, 2018 and 2017 are summarized below (in thousands):
| Maturity Date | August 31, 2018 | August 31, 2017 | ||||||||||
| 8.250% Senior Notes(1)(2)(3) |
Mar 15, 2018 | $ | — | $ | 399,506 | |||||||
| 5.625% Senior Notes(1)(2) |
Dec 15, 2020 | 397,995 | 397,104 | |||||||||
| 4.700% Senior Notes(1)(2) |
Sep 15, 2022 | 497,350 | 496,696 | |||||||||
| 4.900% Senior Notes(1) |
Jul 14, 2023 | 298,814 | 298,571 | |||||||||
| 3.950% Senior Notes(1)(2)(3) |
Jan 12, 2028 | 494,208 | — | |||||||||
| Borrowings under credit facilities(4)(5) |
|
Nov 8, 2022 and Aug 24, 2020 |
|
— | — | |||||||
| Borrowings under loans(4)(5) |
|
Nov 8, 2022 and Aug 24, 2020 |
|
830,332 | 458,395 | |||||||
|
|
|
|
|
|||||||||
| Total notes payable and long-term debt |
2,518,699 | 2,050,272 | ||||||||||
| Less current installments of notes payable and long-term debt |
25,197 | 444,255 | ||||||||||
|
|
|
|
|
|||||||||
| Notes payable and long-term debt, less current installments |
$ | 2,493,502 | $ | 1,606,017 | ||||||||
|
|
|
|
|
|||||||||
78
Table of Contents
| (1) | The notes are carried at the principal amount of each note, less any unamortized discount and unamortized debt issuance costs. |
| (2) | The Senior Notes are the Company’s senior unsecured obligations and rank equally with all other existing and future senior unsecured debt obligations. |
| (3) | During the three months ended February 28, 2018, the Company issued $500.0 million of publicly registered 3.950% Senior Notes due 2028 (the “3.950% Senior Notes”). The net proceeds from the offering were used for general corporate purposes, including to redeem $400.0 million of the Company’s outstanding 8.250% Senior Notes due 2018 and pay related costs and a “make-whole” premium. |
| (4) | On November 8, 2017, the Company entered into an amended and restated senior unsecured five-year credit agreement for additional working capital to support the continued growth of the business. The credit agreement provides for: (i) a Revolving Credit Facility in the initial amount of $1.8 billion, which may, subject to the lenders’ discretion, potentially be increased up to $2.3 billion (“the 2017 Revolving Credit Facility”) and (ii) a $500.0 million Term Loan Facility (“the 2017 Term Loan Facility”), collectively “the 2017 Credit Facility.” The 2017 Credit Facility expires on November 8, 2022. The 2017 Revolving Credit Facility is subject to two whole or partial one-year extensions, at the lender’s discretion. Interest and fees on the 2017 Credit Facility advances are based on the Company’s non-credit enhanced long-term senior unsecured debt rating as determined by Standard & Poor’s Ratings Service, Moody’s Investors Service and Fitch Ratings. |
During the fiscal year ended August 31, 2018, the interest rates on the 2017 Revolving Credit Facility ranged from 2.4% to 5.2% and the 2017 Term Loan Facility ranged from 2.6% to 3.5%. Interest is charged at a rate equal to (a) for the 2017 Revolving Credit Facility, either 0.000% to 0.575% above the base rate or 0.975% to 1.575% above the Eurocurrency rate and (b) for the 2017 Term Loan Facility, either 0.125% to 0.875% above the base rate or 1.125% to 1.875% above the Eurocurrency rate. The base rate represents the greatest of: (i) Citibank, N.A.’s prime rate, (ii) 0.50% above the federal funds rate, and (iii) 1.0% above one-month LIBOR, but not less than zero. The Eurocurrency rate represents adjusted LIBOR or adjusted CDOR, as applicable, for the applicable interest period, but not less than zero. Fees include a facility fee based on the revolving credit commitments of the lenders and a letter of credit fee based on the amount of outstanding letters of credit.
| (5) | On August 24, 2018, the Company entered into a senior unsecured two-year credit agreement for additional working capital to support the continued growth of the business. The credit agreement provides for: (i) a Revolving Credit Facility in the initial amount of $150.0 million (“the 2018 Revolving Credit Facility”) and (ii) a $350.0 million Term Loan Facility (“the 2018 Term Loan Facility”), collectively “the 2018 Credit Facility.” The 2018 Credit Facility expires on August 24, 2020. |
During the fiscal year ended August 31, 2018, no draws were made on the 2018 Revolving Credit Facility and $350.00 million was borrowed against the 2018 Term Loan Facility. During the fiscal year ended August 31, 2018 the interest rate on the 2018 Term Loan Facility was 3.1%. Interest is charged at a rate equal to (a) for the 2018 Revolving Credit Facility, either the base rate or 0.9750% above the Eurocurrency rate and (b) for the 2018 Term Loan Facility, either 0.125% above the base rate or 1.125% above the Eurocurrency rate. The base rate represents the greatest of: (i) Mizuho Bank, Ltd.’s prime rate, (ii) 0.50% above the federal funds rate, and (iii) 1.0% above one-month LIBOR, but not less than zero. The Eurocurrency rate represents adjusted LIBOR for the applicable interest period, but not less than zero. Fees include a facility fee based on the revolving credit commitments of the lenders.
Additionally, the Company’s foreign subsidiaries had various additional credit facilities that finance their future growth and any corresponding working capital needs.
As of August 31, 2018, the Company has $2.3 billion in available unused borrowing capacity under its revolving credit facilities.
Debt Maturities
Debt maturities as of August 31, 2018 are as follows (in thousands):
| Fiscal Year Ended August 31, | ||||
| 2019 |
$ | 25,197 | ||
| 2020 |
374,369 | |||
| 2021 |
441,580 | |||
| 2022 |
49,806 | |||
| 2023 |
1,133,353 | |||
| Thereafter |
494,394 | |||
|
|
|
|||
| Total |
$ | 2,518,699 | ||
|
|
|
|||
79
Table of Contents
Debt Covenants
Borrowings under the Company’s debt agreements are subject to various covenants that limit the Company’s ability to: incur additional indebtedness, sell assets, effect mergers and certain transactions, and effect certain transactions with subsidiaries and affiliates. In addition, the 2017 and 2018 Revolving Credit Facilities and the 4.900% Senior Notes contain debt leverage and interest coverage covenants. The Company is also subject to certain covenants requiring the Company to offer to repurchase the 5.625%, 4.700%, 4.900% or 3.950% Senior Notes upon a change of control. As of August 31, 2018 and 2017, the Company was in compliance with its debt covenants.
Fair Value
The estimated fair values of the Company’s publicly traded debt, including the 5.625%, 4.700% and 3.950% Senior Notes, were approximately $415.7 million, $503.5 million and $476.0 million respectively, as of August 31, 2018. The fair value estimates are based upon observable market data (Level 2 criteria). The estimated fair value of the Company’s private debt, the 4.900% Senior Notes, was approximately $306.5 million, as of August 31, 2018. This fair value estimate is based on the Company’s indicative borrowing cost derived from discounted cash flows (Level 3 criteria). The carrying amounts of borrowings under credit facilities and under loans approximates fair value as interest rates on these instruments approximates current market rates.
9. Postretirement and Other Employee Benefits
Postretirement Benefits
The Company has a qualified defined benefit pension plan for employees of Jabil Circuit UK Limited (the “UK plan”). The UK plan, which is closed to new participants, provides benefits based on average employee earnings over a three-year service period preceding retirement and length of employee service. The Company’s policy is to contribute amounts sufficient to meet minimum funding requirements as set forth in UK employee benefit and tax laws plus such additional amounts as are deemed appropriate by the Company.
Additionally, as a result of acquiring various other operations in Europe and Asia, the Company assumed both qualified and unfunded nonqualified retirement benefits covering eligible employees who meet age and service requirements (the “other plans”).
The UK plan and other plans are collectively referred to herein as the “plans.”
80
Table of Contents
Benefit Obligation and Plan Assets
The benefit obligations and plan assets, changes to the benefit obligation and plan assets and the funded status of the plans as of and for the fiscal years ended August 31 are as follows (in thousands):
| Pension | ||||||||
| 2018 | 2017 | |||||||
| Change in projected benefit obligation |
||||||||
| Beginning projected benefit obligation |
$ | 167,714 | $ | 182,278 | ||||
| Service cost |
1,063 | 1,068 | ||||||
| Interest cost |
3,807 | 2,942 | ||||||
| Actuarial (gain) loss |
(6,019 | ) | (10,147 | ) | ||||
| Curtailments gain |
(998 | ) | — | |||||
| Settlements paid from plan assets |
— | (2,133 | ) | |||||
| Total benefits paid |
(6,211 | ) | (6,790 | ) | ||||
| Plan participants’ contributions |
31 | 27 | ||||||
| Amendments |
1,864 | — | ||||||
| Terminations |
— | (106 | ) | |||||
| Effect of conversion to U.S. dollars |
(147 | ) | 575 | |||||
|
|
|
|
|
|||||
| Ending projected benefit obligation |
$ | 161,104 | $ | 167,714 | ||||
|
|
|
|
|
|||||
| Change in plan assets |
||||||||
| Beginning fair value of plan assets |
146,698 | 143,702 | ||||||
| Actual return on plan assets |
8,146 | 2,582 | ||||||
| Settlements paid from plan assets |
— | (2,133 | ) | |||||
| Employer contributions |
1,811 | 6,981 | ||||||
| Benefits paid from plan assets |
(4,758 | ) | (3,759 | ) | ||||
| Plan participants’ contributions |
31 | 27 | ||||||
| Effect of conversion to U.S. dollars |
(213 | ) | (702 | ) | ||||
|
|
|
|
|
|||||
| Ending fair value of plan assets |
$ | 151,715 | $ | 146,698 | ||||
|
|
|
|
|
|||||
| Unfunded status |
$ | (9,389 | ) | $ | (21,016 | ) | ||
|
|
|
|
|
|||||
| Amounts recognized in the Consolidated Balance Sheets |
||||||||
| Accrued benefit liability, current |
$ | 428 | $ | 182 | ||||
| Accrued benefit liability, noncurrent |
$ | 8,961 | $ | 20,834 | ||||
| Accumulated other comprehensive loss (income)(1) |
||||||||
| Actuarial loss, before tax |
$ | 22,387 | $ | 32,247 | ||||
| Prior service cost (credit), before tax |
$ | 719 | $ | (1,185 | ) | |||
| (1) | The Company anticipates amortizing $0.8 million and $0.0 million, before tax, of net actuarial loss and prior service costs balances, respectively, to net periodic cost in fiscal year 2019. |
Net Periodic Benefit Cost
The following table provides information about the net periodic benefit cost for the plans for fiscal years 2018, 2017 and 2016 (in thousands):
| Pension | ||||||||||||
| 2018 | 2017 | 2016 | ||||||||||
| Service cost |
$ | 1,063 | $ | 1,068 | $ | 883 | ||||||
| Interest cost |
3,807 | 2,942 | 4,844 | |||||||||
| Expected long-term return on plan assets |
(5,954 | ) | (4,206 | ) | (5,560 | ) | ||||||
| Recognized actuarial loss |
1,127 | 1,929 | 1,046 | |||||||||
| Amortization of prior service credit |
(88 | ) | (138 | ) | (139 | ) | ||||||
| Net settlement loss |
116 | 1,472 | — | |||||||||
|
|
|
|
|
|
|
|||||||
| Net periodic benefit cost |
$ | 71 | $ | 3,067 | $ | 1,074 | ||||||
|
|
|
|
|
|
|
|||||||
Beginning in the first quarter of fiscal year 2019, the Company will adopt a new accounting standard to improve the presentation of net periodic benefit cost. The Company expects the adoption of this standard to result in reclassifications for the service cost component of net periodic benefit cost from selling, general and administrative expense to cost of revenue and for the other components from selling, general and administrative expense to other expense.
81
Table of Contents
Assumptions
Weighted-average actuarial assumptions used to determine net periodic benefit cost and projected benefit obligation for the plans for the fiscal years 2018, 2017 and 2016 were as follows:
| Pension | ||||||||||||
| 2018 | 2017 | 2016 | ||||||||||
| Net periodic benefit cost: |
||||||||||||
| Expected long-term return on plan assets(1) |
3.8 | % | 3.3 | % | 4.3 | % | ||||||
| Rate of compensation increase |
3.3 | % | 2.7 | % | 2.4 | % | ||||||
| Discount rate |
2.1 | % | 1.9 | % | 2.9 | % | ||||||
| Projected benefit obligation: |
||||||||||||
| Expected long-term return on plan assets |
3.6 | % | 4.0 | % | 3.3 | % | ||||||
| Rate of compensation increase |
4.4 | % | 4.4 | % | 4.1 | % | ||||||
| Discount rate(2) |
2.2 | % | 2.3 | % | 1.7 | % | ||||||
| (1) | The expected return on plan assets assumption used in calculating net periodic benefit cost is based on historical return experience and estimates of future long-term performance with consideration to the expected investment mix of the plan. |
| (2) | The discount rate is used to state expected cash flows relating to future benefits at a present value on the measurement date. This rate represents the market rate for high-quality fixed income investments whose timing would match the cash outflow of retirement benefits. Other assumptions include demographic factors such as retirement, mortality and turnover. |
Plan Assets
The Company has adopted an investment policy for a majority of plan assets, which was set by plan trustees who have the responsibility for making investment decisions related to the plan assets. The plan trustees oversee the investment allocation, including selecting professional investment managers and setting strategic targets. The investment objectives for the assets are (1) to acquire suitable assets that hold the appropriate liquidity in order to generate income and capital growth that, along with new contributions, will meet the cost of current and future benefits under the plan, (2) to limit the risk of the plan assets from failing to meet the plan liabilities over the long-term and (3) to minimize the long-term costs under the plan by maximizing the return on the plan assets.
Investment policies and strategies governing the assets of the plans are designed to achieve investment objectives with prudent risk parameters. Risk management practices include the use of external investment managers; the maintenance of a portfolio diversified by asset class, investment approach and security holdings; and the maintenance of sufficient liquidity to meet benefit obligations as they come due. Within the equity securities class, the investment policy provides for investments in a broad range of publicly traded securities including both domestic and international stocks. Within the debt securities class, the investment policy provides for investments in corporate bonds as well as fixed and variable interest debt instruments. The Company currently expects to achieve a target mix of 35% equity and 65% debt securities in fiscal year 2019.
82
Table of Contents
Fair Value
The fair values of the plan assets held by the Company by asset category are as follows (in thousands):
| August 31, 2018 | August 31, 2017 | |||||||||||||||||||
| Fair Value Hierarchy |
Fair Value | Asset Allocation |
Fair Value | Asset Allocation |
||||||||||||||||
| Asset Category |
||||||||||||||||||||
| Cash and cash equivalents(1) |
Level 1 | $ | 6,682 | 4 | % | $ | 5,760 | 4 | % | |||||||||||
| Equity Securities: |
||||||||||||||||||||
| Global equity securities(2)(3) |
Level 2 | 35,932 | 24 | % | 41,971 | 29 | % | |||||||||||||
| Debt Securities: |
||||||||||||||||||||
| Corporate bonds(3) |
Level 2 | 41,088 | 27 | % | 41,987 | 29 | % | |||||||||||||
| Government bonds(3) |
Level 2 | 51,597 | 34 | % | 41,738 | 28 | % | |||||||||||||
| Other Investments: |
||||||||||||||||||||
| Insurance contracts(4) |
Level 3 | 16,416 | 11 | % | 15,242 | 10 | % | |||||||||||||
|
|
|
|
|
|
|
|
|
|||||||||||||
| Fair value of plan assets |
$ | 151,715 | 100 | % | $ | 146,698 | 100 | % | ||||||||||||
|
|
|
|
|
|
|
|
|
|||||||||||||
| (1) | Carrying value approximates fair value. |
| (2) | Investments in equity securities by companies incorporated, listed or domiciled in developed and/or emerging market countries. |
| (3) | Investments in global equity securities, corporate bonds, government securities and government bonds are valued using the quoted prices of securities with similar characteristics. |
| (4) | Consist of an insurance contract that guarantees the payment of the funded pension entitlements, as well as provides a profit share to the Company. The profit share in this contract is not based on actual investments, but, instead on a notional investment portfolio that is expected to return a pre-defined rate. Insurance contract assets are recorded at fair value and is determined based on the cash surrender value of the insured benefits which is the present value of the guaranteed funded benefits. Insurance contracts are valued using unobservable inputs (Level 3 inputs), primarily by discounting expected future cash flows relating to benefits paid from a notional investment portfolio in order to determine the cash surrender value of the policy. The unobservable inputs consist of estimated future benefits to be paid throughout the duration of the policy and estimated discount rates, which both have an immaterial impact on the fair value estimate of the contract. |
Accumulated Benefit Obligation
The following table provides information for the plans with an accumulated benefit obligation for fiscal years 2018 and 2017 (in thousands):
| August 31, | ||||||||
| 2018 | 2017 | |||||||
| Projected benefit obligation |
$ | 161,104 | $ | 167,714 | ||||
| Accumulated benefit obligation |
$ | 152,380 | $ | 158,971 | ||||
| Fair value of plan assets |
$ | 151,715 | $ | 146,698 | ||||
Cash Flows
The Company expects to make cash contributions between $0.2 million and $0.4 million to its funded pension plans during fiscal year 2019. The estimated future benefit payments, which reflect expected future service, are as follows (in thousands):
| Fiscal Year Ended August 31, |
Amount | |||
| 2019 |
$ | 4,687 | ||
| 2020 |
5,502 | |||
| 2021 |
5,065 | |||
| 2022 |
5,390 | |||
| 2023 |
5,974 | |||
| 2024 through 2028 |
37,466 | |||
83
Table of Contents
Profit Sharing, 401(k) Plan and Defined Contribution Plans
The Company provides retirement benefits to its domestic employees who have completed a 30-day period of service through a 401(k) plan that provides a matching contribution by the Company. The Company also has defined contribution benefit plans for certain of its international employees. The Company contributed approximately $40.5 million, $33.6 million and $33.3 million for defined contribution plans for the fiscal years ended August 31, 2018, 2017 and 2016, respectively.
10. Commitments and Contingencies
Lease Agreements
The Company leases certain facilities under non-cancelable operating leases. Lease agreements may contain lease escalation clauses and purchase or renewal options. The Company recognizes scheduled lease escalation clauses over the course of the applicable lease term on a straight-line basis in the Consolidated Statements of Operations. The future minimum lease payments under non-cancelable operating leases as of August 31, 2018 were as follows (in thousands):
| Fiscal Year Ending August 31, |
Amount | |||
| 2019 |
$ | 126,038 | ||
| 2020 |
97,789 | |||
| 2021 |
81,286 | |||
| 2022 |
66,400 | |||
| 2023 |
49,309 | |||
| Thereafter |
142,089 | |||
|
|
|
|||
| Total minimum lease payments |
$ | 562,911 | ||
|
|
|
|||
Total operating lease expense was approximately $130.2 million, $117.2 million and $120.4 million for fiscal years 2018, 2017 and 2016, respectively.
Legal Proceedings
The Company is party to certain lawsuits in the ordinary course of business. The Company does not believe that these proceedings, individually or in the aggregate, will have a material adverse effect on the Company’s financial position, results of operations or cash flows.
11. Stockholders’ Equity
The Company recognized stock-based compensation expense within selling, general and administrative expense as follows (in thousands):
| Fiscal Year Ended August 31, | ||||||||||||
| 2018 | 2017 | 2016 | ||||||||||
| Restricted stock and stock appreciation rights (“SARS”) |
$ | 84,082 | $ | 42,122 | $ | 52,459 | ||||||
| Employee stock purchase plan |
6,891 | 6,334 | 6,538 | |||||||||
| Other (1) |
7,538 | 88 | — | |||||||||
|
|
|
|
|
|
|
|||||||
| Total |
$ | 98,511 | $ | 48,544 | $ | 58,997 | ||||||
|
|
|
|
|
|
|
|||||||
| (1) | For the fiscal year ended August 31, 2018, represents a one-time cash-settled stock award that vested on November 30, 2017. |
Equity Compensation Plan
The 2011 Stock Award and Incentive Plan (the “2011 Plan”) provides for the grant of restricted stock awards, restricted stock unit awards and other stock-based awards. The maximum aggregate number of shares that may be subject to awards under the 2011 Plan is 23,300,000.
Upon adoption of the 2011 Plan, the 2002 Stock Incentive Plan (the “2002 Plan”) was terminated. For any outstanding awards granted under the 2002 Plan that expire, are canceled or forfeited after the termination of the 2002 Plan, the shares are available for issuance under the 2011 Plan.
84
Table of Contents
Following is a reconciliation of the shares available to be issued under the 2011 Plan as of August 31, 2018:
| Shares Available for Grant | ||||
| Balance as of August 31, 2017 |
12,228,936 | |||
| SARS canceled |
35,439 | |||
| Restricted stock awards forfeited, net of grants(1) |
572,783 | |||
|
|
|
|||
| Balance as of August 31, 2018 |
12,837,158 | |||
|
|
|
|||
| (1) | Represents the maximum number of shares that can be issued based on the achievement of certain performance criteria. |
Stock Appreciation Rights (“SARS”)
The following table summarizes SARS activity from August 31, 2017 through August 31, 2018:
| SARS Outstanding |
Average Intrinsic Value (in thousands) |
Weighted- Average Exercise Price |
Weighted- Average Remaining Contractual Life (years) |
|||||||||||||
| Outstanding as of August 31, 2017 |
319,241 | $ | 3,651 | $ | 19.91 | 2.10 | ||||||||||
| SARS canceled |
(35,439 | ) | $ | 21.56 | ||||||||||||
| SARS exercised |
(127,001 | ) | $ | 21.31 | ||||||||||||
|
|
|
|||||||||||||||
| Outstanding and exercisable as of August 31, 2018 |
156,801 | $ | 1,748 | $ | 18.41 | 3.10 | ||||||||||
|
|
|
|||||||||||||||
Restricted Stock Awards
Certain key employees have been granted time-based, performance-based and market-based restricted stock unit awards. The time-based restricted stock units granted generally vest on a graded vesting schedule over three years. The performance-based restricted stock units generally vest on a cliff vesting schedule over three years and up to a maximum of 150%, depending on the specified performance condition and the level of achievement obtained. The performance-based restricted stock units have a vesting condition that is based upon the Company’s cumulative adjusted core earnings per share during the performance period. The market-based restricted stock units generally vest on a cliff vesting schedule over three years and up to a maximum of 200%, depending on the specified performance condition and the level of achievement obtained. The market-based restricted stock units have a vesting condition that is tied to the Company’s total shareholder return based on the Company’s stock performance in relation to the companies in the Standard and Poor’s (S&P) Super Composite Technology Hardware and Equipment Index excluding the Company.
On October 6, 2017, the Company’s Compensation Committee approved the modification of vesting criteria for certain performance-based restricted stock awards granted in fiscal year 2015. As a result of the modification, 0.8 million awards vested during the first quarter of fiscal year 2018, which resulted in approximately $24.9 million of stock-based compensation expense recognized.
85
Table of Contents
The following table summarizes restricted stock activity from August 31, 2017 through August 31, 2018:
| Shares | Weighted- Average Grant-Date Fair Value |
|||||||
| Outstanding as of August 31, 2017 |
11,652,319 | $ | 22.00 | |||||
| Changes during the period |
||||||||
| Shares granted(1) |
2,751,300 | $ | 29.40 | |||||
| Shares vested |
(2,727,229 | ) | $ | 22.95 | ||||
| Shares forfeited |
(3,324,083 | ) | $ | 19.20 | ||||
|
|
|
|||||||
| Outstanding as of August 31, 2018 |
8,352,307 | $ | 24.34 | |||||
|
|
|
|||||||
| (1) | For those shares granted that are based on the achievement of certain performance criteria, the amount represents the maximum number of shares that can vest. During the fiscal year ended August 31, 2018, the Company awarded approximately 1.4 million time-based restricted stock units, 0.4 million performance-based restricted stock units and 0.4 million market-based restricted stock units based on target performance criteria. |
The following table represents the restricted stock and SARS stock-based compensation information for the periods indicated (in thousands):
| Fiscal Year Ended August 31, | ||||||||||||
| 2018 | 2017 | 2016 | ||||||||||
| Intrinsic value of SARS exercised |
$ | 909 | $ | 5,053 | $ | 506 | ||||||
| Fair value of restricted stock vested |
$ | 62,592 | $ | 44,010 | $ | 34,857 | ||||||
| Tax benefit (expense) for stock compensation expense(1) |
$ | 1,122 | $ | 560 | $ | 991 | ||||||
| Unrecognized stock-based compensation expense — restricted stock |
$ | 41,940 | ||||||||||
| Remaining weighted-average period for restricted stock expense |
1.4 years | |||||||||||
| (1) | Classified as income tax expense within the Consolidated Statements of Operations. |
Employee Stock Purchase Plan
The maximum aggregate number of shares that are available for issuance under the 2011 Employee Stock Purchase Plan (the “ESPP”) is 12,000,000.
Employees are eligible to participate in the ESPP after 90 days of employment with the Company. The ESPP permits eligible employees to purchase common stock through payroll deductions, which may not exceed 10% of an employee’s compensation, as defined in the ESPP, at a price equal to 85% of the fair value of the common stock at the beginning or end of the offering period, whichever is lower. The ESPP is intended to qualify under Section 423 of the Internal Revenue Code. As of August 31, 2018, 4,679,061 shares remained available for issue under the 2011 ESPP.
The fair value of shares issued under the ESPP was estimated on the commencement date of each offering period using the Black-Scholes option pricing model. The following weighted-average assumptions were used in the model for each respective period:
| Fiscal Year Ended August 31, | ||||||||||||
| 2018 | 2017 | 2016 | ||||||||||
| Expected dividend yield |
0.6 | % | 0.8 | % | 0.7 | % | ||||||
| Risk-free interest rate |
1.4 | % | 0.5 | % | 0.3 | % | ||||||
| Expected volatility (1) |
23.0 | % | 33.0 | % | 28.1 | % | ||||||
| Expected life |
0.5 years | 0.5 years | 0.5 years | |||||||||
| (1) | The expected volatility was estimated using the historical volatility derived from the Company’s common stock. |
86
Table of Contents
Dividends
The following table sets forth certain information relating to the Company’s cash dividends declared to common stockholders during fiscal years 2018 and 2017:
| Dividend Declaration Date |
Dividend per Share |
Total of Cash Dividends Declared |
Date of Record for Dividend Payment |
Dividend Cash Payment Date |
||||||||||||||||
| (in thousands, except for per share data) | ||||||||||||||||||||
| Fiscal Year 2018: |
October 19, 2017 | $ | 0.08 | $ | 14,588 | November 15, 2017 | December 1, 2017 | |||||||||||||
| January 25, 2018 | $ | 0.08 | $ | 14,272 | February 15, 2018 | March 1, 2018 | ||||||||||||||
| April 19, 2018 | $ | 0.08 | $ | 13,991 | May 15, 2018 | June 1, 2018 | ||||||||||||||
| July 18, 2018 | $ | 0.08 | $ | 13,677 | August 15, 2018 | September 4, 2018 | ||||||||||||||
| Fiscal Year 2017: |
October 20, 2016 | $ | 0.08 | $ | 15,248 | November 15, 2016 | December 1, 2016 | |||||||||||||
| January 26, 2017 | $ | 0.08 | $ | 15,051 | February 15, 2017 | March 1, 2017 | ||||||||||||||
| April 20, 2017 | $ | 0.08 | $ | 14,840 | May 15, 2017 | June 1, 2017 | ||||||||||||||
| July 20, 2017 | $ | 0.08 | $ | 14,698 | August 15, 2017 | September 1, 2017 | ||||||||||||||
Share Repurchases
During fiscal years 2017 and 2016, the Company’s Board of Directors authorized the repurchase of $450.0 million and $400.0 million, respectively, of the Company’s common stock under share repurchase programs, which were repurchased during fiscal years 2016, 2017 and 2018.
In June 2018, the Board authorized the repurchase of up to $350.0 million of the Company’s common stock (the “2018 Share Repurchase Program”). The 2018 Share Repurchase Program expires on August 31, 2019. As of August 31, 2018, no shares had yet been repurchased under this authorization and $350.0 million remains available under the 2018 Share Repurchase Program.
12. Concentration of Risk and Segment Data
Concentration of Risk
Financial instruments that potentially subject the Company to concentrations of credit risk consist principally of cash and cash equivalents and trade receivables. The Company maintains cash and cash equivalents with various domestic and foreign financial institutions. Deposits held with the financial institutions may exceed the amount of insurance provided on such deposits, but may generally be redeemed upon demand. The Company performs periodic evaluations of the relative credit standing of the financial institutions and attempts to limit exposure with any one institution. For trade receivables, the Company performs ongoing credit evaluations of its customers and generally does not require collateral. The Company maintains an allowance for potential credit losses on trade receivables.
Sales of the Company’s products are concentrated among specific customers. For fiscal year 2018, the Company’s five largest customers accounted for approximately 48% of its net revenue and 80 customers accounted for approximately 90% of its net revenue. As the Company is a provider of manufacturing services and solutions and products are built based on customer specifications, it is impracticable to provide revenues from external customers for each product and service. Sales to the following customer that accounted for 10% or more of the Company’s net revenues, expressed as a percentage of consolidated net revenue, and the percentage of accounts receivable for the customer, were as follows:
| Percentage of Net Revenue Fiscal Year Ended August 31, |
Percentage of Accounts Receivable as of August 31, |
|||||||||||||||||||
| 2018 | 2017 | 2016 | 2018 | 2017 | ||||||||||||||||
| Apple, Inc.(1) |
28 | % | 24 | % | 24 | % | * | * | ||||||||||||
| * | Amount was less than 10% of total. |
| (1) | Sales to this customer were reported in the DMS operating segment. |
87
Table of Contents
The Company procures components from a broad group of suppliers. Some of the products manufactured by the Company require one or more components that are available from only a single source.
Segment Data
Operating segments are defined as components of an enterprise that engage in business activities from which they may earn revenues and incur expenses; for which separate financial information is available; and whose operating results are regularly reviewed by the chief operating decision maker to assess the performance of the individual segment and make decisions about resources to be allocated to the segment.
The Company derives its revenue from providing comprehensive electronics design, production and product management services. The chief operating decision maker evaluates performance and allocates resources on a segment basis. The Company’s operating segments consist of two segments – EMS and DMS, which are also the Company’s reportable segments. The segments are organized based on the economic profiles of the services performed, including manufacturing capabilities, market strategy, margins, return on capital and risk profiles.
The EMS segment is focused around leveraging IT, supply chain design and engineering, technologies largely centered on core electronics, utilizing the Company’s large scale manufacturing infrastructure and the ability to serve a broad range of end markets. The EMS segment is typically lower-margin but high volume business that is produced at a quicker rate (i.e. cycle time) and in higher quantities and includes customers primarily in the automotive and transportation, capital equipment, computing and storage, defense and aerospace, digital home, industrial and energy, networking and telecommunications, point of sale and printing industries.
The DMS segment is focused on providing engineering solutions, with an emphasis on material sciences and technologies. The DMS segment is typically higher-margin business and includes customers primarily in the consumer wearables, healthcare, mobility and packaging industries.
Net revenue for the operating segments is attributed to the segment in which the service is performed. An operating segment’s performance is evaluated based on its pre-tax operating contribution, or segment income. Segment income is defined as net revenue less cost of revenue, segment selling, general and administrative expenses, segment research and development expenses and an allocation of corporate manufacturing expenses and selling, general and administrative expenses. Segment income does not include amortization of intangibles, stock-based compensation expense and related charges, restructuring and related charges, distressed customer charges, acquisition and integration costs, loss on disposal of subsidiaries, settlement of receivables and related charges, impairment of notes receivable and related charges, goodwill impairment charges, business interruption and impairment charges, net, income (loss) from discontinued operations, gain (loss) on sale of discontinued operations, other expense, interest income, interest expense, income tax expense or adjustment for net income (loss) attributable to noncontrolling interests.
Total segment assets are defined as accounts receivable, inventories, net, customer-related property, plant and equipment, intangible assets net of accumulated amortization and goodwill. All other non-segment assets are reviewed on a global basis by management. Transactions between operating segments are generally recorded at amounts that approximate those at which we would transact with third parties.
88
Table of Contents
The following tables set forth operating segment information (in thousands):
| Fiscal Year Ended August 31, | ||||||||||||
| 2018 | 2017 | 2016 | ||||||||||
| Net revenue |
||||||||||||
| EMS |
$ | 12,268,600 | $ | 11,077,622 | $ | 11,029,132 | ||||||
| DMS |
9,826,816 | 7,985,499 | 7,323,954 | |||||||||
|
|
|
|
|
|
|
|||||||
| $ | 22,095,416 | $ | 19,063,121 | $ | 18,353,086 | |||||||
|
|
|
|
|
|
|
|||||||
| Fiscal Year Ended August 31, | ||||||||||||
| 2018 | 2017 | 2016 | ||||||||||
| Segment income and reconciliation of income before tax |
||||||||||||
| EMS |
$ | 451,149 | $ | 436,110 | $ | 373,732 | ||||||
| DMS |
316,998 | 230,893 | 256,588 | |||||||||
|
|
|
|
|
|
|
|||||||
| Total segment income |
$ | 768,147 | $ | 667,003 | $ | 630,320 | ||||||
| Reconciling items: |
||||||||||||
| Amortization of intangibles |
(38,490 | ) | (35,524 | ) | (37,121 | ) | ||||||
| Stock-based compensation expense and related charges |
(98,511 | ) | (48,544 | ) | (58,997 | ) | ||||||
| Restructuring and related charges |
(36,902 | ) | (160,395 | ) | (11,369 | ) | ||||||
| Acquisition and integration costs |
(8,082 | ) | — | — | ||||||||
| Distressed customer charges |
(32,710 | ) | (10,198 | ) | — | |||||||
| Business interruption and impairment charges, net (1) |
(11,299 | ) | — | — | ||||||||
| Loss on disposal of subsidiaries |
— | (2,112 | ) | — | ||||||||
| Other expense |
(37,563 | ) | (28,448 | ) | (8,380 | ) | ||||||
| Interest income |
17,813 | 12,525 | 9,128 | |||||||||
| Interest expense |
(149,002 | ) | (138,074 | ) | (136,536 | ) | ||||||
|
|
|
|
|
|
|
|||||||
| Income before income tax |
$ | 373,401 | $ | 256,233 | $ | 387,045 | ||||||
|
|
|
|
|
|
|
|||||||
| (1) | Charges, net of insurance proceeds of $24.9 million, for the fiscal year ended August 31, 2018 relate to business interruption and asset impairment costs associated with damage from Hurricane Maria, which impacted our operations in Cayey, Puerto Rico, which is classified as a component of cost of revenue and selling, general and administrative expenses in the Consolidated Statements of Operations. |
| August 31, 2018 | August 31, 2017 | |||||||
| Total assets |
||||||||
| EMS |
$ | 3,456,866 | $ | 2,778,820 | ||||
| DMS |
5,378,436 | 5,290,468 | ||||||
| Other non-allocated assets |
3,210,339 | 3,026,707 | ||||||
|
|
|
|
|
|||||
| $ | 12,045,641 | $ | 11,095,995 | |||||
|
|
|
|
|
|||||
89
Table of Contents
The Company operates in 29 countries worldwide. Sales to unaffiliated customers are based on the Company location that maintains the customer relationship and transacts the external sale. The following tables set forth external net revenue, net of intercompany eliminations, and long-lived asset information where individual countries represent a material portion of the total (in thousands):
| Fiscal Year Ended August 31, | ||||||||||||
| 2018 | 2017 | 2016 | ||||||||||
| External net revenue: |
||||||||||||
| Singapore |
$ | 7,193,414 | $ | 5,585,837 | $ | 4,983,711 | ||||||
| China |
4,585,355 | 4,012,950 | 3,873,212 | |||||||||
| Mexico |
3,533,437 | 3,207,059 | 3,043,609 | |||||||||
| Malaysia |
1,389,851 | 1,119,384 | 1,113,456 | |||||||||
| Hungary |
897,033 | 944,448 | 1,130,466 | |||||||||
| Other |
2,651,632 | 2,547,750 | 2,499,241 | |||||||||
|
|
|
|
|
|
|
|||||||
| Foreign source revenue |
20,250,722 | 17,417,428 | 16,643,695 | |||||||||
|
|
|
|
|
|
|
|||||||
| U.S. |
1,844,694 | 1,645,693 | 1,709,391 | |||||||||
|
|
|
|
|
|
|
|||||||
| Total |
$ | 22,095,416 | $ | 19,063,121 | $ | 18,353,086 | ||||||
|
|
|
|
|
|
|
|||||||
| August 31, | ||||||||
| 2018 | 2017 | |||||||
| Long-lived assets: |
||||||||
| China |
$ | 1,770,732 | $ | 1,922,676 | ||||
| Singapore |
191,506 | 204,181 | ||||||
| Mexico |
256,086 | 196,218 | ||||||
| Taiwan |
130,062 | 136,685 | ||||||
| Malaysia |
113,011 | 74,341 | ||||||
| Hungary |
91,063 | 89,814 | ||||||
| Spain |
79,991 | 83,064 | ||||||
| Poland |
60,847 | 55,617 | ||||||
| Other |
334,466 | 343,473 | ||||||
|
|
|
|
|
|||||
| Long-lived assets related to foreign operations |
3,027,764 | 3,106,069 | ||||||
|
|
|
|
|
|||||
| U.S. |
1,077,128 | 1,015,389 | ||||||
|
|
|
|
|
|||||
| Total |
$ | 4,104,892 | $ | 4,121,458 | ||||
|
|
|
|
|
|||||
13. Derivative Financial Instruments and Hedging Activities
The Company is directly and indirectly affected by changes in certain market conditions. These changes in market conditions may adversely impact the Company’s financial performance and are referred to as market risks. The Company, where deemed appropriate, uses derivatives as risk management tools to mitigate the potential impact of certain market risks. The primary market risks managed by the Company through the use of derivative instruments are foreign currency fluctuation risk and interest rate risk.
Foreign Currency Risk Management
Forward contracts are put in place to manage the foreign currency risk associated with the anticipated foreign currency denominated revenues and expenses. A hedging relationship existed with an aggregate notional amount outstanding of $293.4 million and $314.6 million as of August 31, 2018 and 2017, respectively. The related forward foreign exchange contracts have been designated as hedging instruments and are accounted for as cash flow hedges. The forward foreign exchange contract transactions will effectively lock in the value of anticipated foreign currency denominated revenues and expenses against foreign currency fluctuations. The anticipated foreign currency denominated revenues and expenses being hedged are expected to occur between September 3, 2018 and May 31, 2019.
In addition to derivatives that are designated as hedging instruments and qualify for hedge accounting, the Company also enters into forward contracts to economically hedge transactional exposure associated with commitments arising from trade accounts receivable, trade accounts payable, fixed purchase obligations and intercompany transactions denominated in a currency other than the functional currency of the respective operating entity. The aggregate notional amount of these outstanding contracts as of August 31, 2018 and 2017, was $3.4 billion and $2.1 billion, respectively.
90
Table of Contents
The following table presents the fair values of the Company’s derivative instruments located on the Consolidated Balance Sheets utilized for foreign currency risk management purposes as of August 31, 2018 and 2017 (in thousands):
| Fair Values of Derivative Instruments | ||||||||||||||||||||||||
| Asset Derivatives | Liability Derivatives | |||||||||||||||||||||||
| Balance Sheet Location |
Fair Value as of August 31, 2018(1) |
Fair Value as of August 31, 2017(1) |
Balance Sheet Location |
Fair Value as of August 31, 2018(1) |
Fair Value as of August 31, 2017(1) |
|||||||||||||||||||
| Derivatives designated as hedging instruments: |
||||||||||||||||||||||||
| Forward foreign exchange contracts |
|
Prepaid expenses and other current assets |
|
$ | 225 | $ | 8,380 | |
Accrued expenses |
|
$ | 13,364 | $ | 1,408 | ||||||||||
| Derivatives not designated as hedging instruments: |
||||||||||||||||||||||||
| Forward foreign exchange contracts |
|
Prepaid expenses and other current assets |
|
$ | 10,125 | $ | 31,280 | |
Accrued expenses |
|
$ | 46,171 | $ | 9,131 | ||||||||||
| (1) | Classified as Level 2 in the fair-value hierarchy. |
The Company’s forward foreign exchange contracts are measured on a recurring basis at fair value, based on foreign currency spot rates and forward rates quoted by banks or foreign currency dealers.
The gains and losses recognized in earnings due to hedge ineffectiveness and the amount excluded from effectiveness testing were not material for all periods presented and are included as components of net revenue, cost of revenue, selling, general and administrative expense, which are the same line items in which the hedged items are recorded.
During the fiscal year ended August 31, 2018, the Company recognized $29.6 million in foreign currency losses, which was offset by $48.7 million of gains from related forward contracts. Both the foreign currency losses and gains from forward contracts were recognized in cost of revenue. For the fiscal years ended August 31, 2017 and 2016, the amounts were immaterial and were recognized as components of cost of revenue.
Interest Rate Risk Management
The Company periodically enters into interest rate swaps to manage interest rate risk associated with the Company’s borrowings.
Cash Flow Hedges
During the fourth quarter of fiscal year 2018, the Company entered into interest rate swap transactions to hedge the variable interest rate payments for the 2018 Term Loan Facility. In connection with this transaction, the Company pays interest based upon a fixed rate as agreed upon with the respective counterparties and receives variable rate interest payments based on the three-month LIBOR. The interest rate swaps have an aggregate notional amount of $350.0 million and have been designated as hedging instruments and accounted for as cash flow hedges. The interest rate swaps were effective on August 24, 2018 and are scheduled to expire on August 24, 2020. The contracts will be settled with the respective counterparties on a net basis at each settlement date.
During the fourth quarter of fiscal year 2016, the Company entered into interest rate swap transactions to hedge the variable interest rate payments for the 2017 Term Loan Facility. In connection with this transaction, the Company pays interest based upon a fixed rate as agreed upon with the respective counterparties and receives variable rate interest payments based on the one-month LIBOR. The interest rate swaps have an aggregate notional amount of $200.0 million and have been designated as hedging instruments and accounted for as cash flow hedges. The interest rate swaps were effective on September 30, 2016 and are scheduled to expire on June 30, 2019. The contracts will be settled with the respective counterparties on a net basis at each settlement date.
During the fourth quarter of fiscal year 2016, the Company entered into forward interest rate swap transactions to hedge the fixed interest rate payments for an anticipated debt issuance (the 3.950% Senior Notes). The swaps were accounted for as a cash flow hedge and had a notional amount of $200.0 million. Concurrently with the pricing of the 3.950% Senior Notes in the second quarter of fiscal year 2018, the Company settled the swaps. The fair value of the cash received for the swaps at settlement was $17.2 million. The effective portion of the swaps is recorded in the Company’s Consolidated Balance Sheets as a component of AOCI and is amortized as a reduction to interest expense in the Company’s Consolidated Statement of Operations through January 2028. The effective portions of the swaps amortized as a reduction to interest expense during the fiscal year ended August 31, 2018 was not material.
91
Table of Contents
14. Restructuring and Related Charges
Following is a summary of the Company’s restructuring and related charges (in thousands):
| Fiscal Year Ended August 31, | ||||||||||||
| 2018(2) | 2017(2) | 2016(3) | ||||||||||
| Employee severance and benefit costs |
$ | 16,269 | $ | 56,834 | $ | 8,845 | ||||||
| Lease costs |
1,596 | 3,966 | (43 | ) | ||||||||
| Asset write-off costs |
16,264 | 94,346 | 1,170 | |||||||||
| Other related costs |
2,773 | 5,249 | 1,397 | |||||||||
|
|
|
|
|
|
|
|||||||
| Total restructuring and related charges(1) |
$ | 36,902 | $ | 160,395 | $ | 11,369 | ||||||
|
|
|
|
|
|
|
|||||||
| (1) | Includes $16.3 million, $51.3 million and $10.7 million recorded in the EMS segment, $16.6 million, $82.4 million and $0.8 million recorded in the DMS segment and $4.0 million, $26.7 million and $(0.1) million of non-allocated charges for the fiscal years ended August 31, 2018, 2017 and 2016, respectively. Except for asset write-off costs, all restructuring and related charges are cash settled. |
| (2) | Primarily relates to the 2017 Restructuring Plan. |
| (3) | Costs relate to the 2013 Restructuring Plan, which was substantially complete in fiscal year 2017. |
2017 Restructuring Plan
On September 15, 2016, the Company’s Board of Directors formally approved a restructuring plan to better align the Company’s global capacity and administrative support infrastructure to further optimize organizational effectiveness. This action includes headcount reductions across the Company’s selling, general and administrative cost base and capacity realignment in higher cost locations (the “2017 Restructuring Plan”).
Upon completion of the 2017 Restructuring Plan, the Company expects to recognize approximately $195.0 million in restructuring and other related costs. The Company has incurred $186.4 million of costs-to-date as of August 31, 2018. The remaining costs for employee severance and benefit costs, asset write-off costs and other related costs are anticipated to be incurred through the first half of fiscal year 2019.
The table below sets forth the cumulative restructuring and related charges incurred through August 31, 2018 for the 2017 Restructuring Plan (in thousands):
| 2017 Restructuring Plan(1) |
||||
| Employee severance and benefit costs |
$ | 64,420 | ||
| Lease costs |
5,562 | |||
| Asset write-off costs |
110,540 | |||
| Other related costs |
5,892 | |||
|
|
|
|||
| Total restructuring and related charges |
$ | 186,414 | ||
|
|
|
|||
| (1) | Includes $56.8 million allocated to the EMS segment, $99.0 million allocated to the DMS segment and $30.6 million of unallocated costs. |
92
Table of Contents
The tables below summarize the Company’s liability activity, primarily associated with the 2017 Restructuring Plan (in thousands):
| Employee Severance and Benefit Costs |
Lease Costs | Asset Write-off Costs |
Other Related Costs |
Total | ||||||||||||||||
| Balance as of August 31, 2016(1) |
$ | 17,266 | $ | 21 | $ | — | $ | 740 | $ | 18,027 | ||||||||||
| Restructuring related charges |
56,834 | 3,966 | 94,346 | 5,249 | 160,395 | |||||||||||||||
| Asset write-off charge and other non-cash activity |
1,319 | 59 | (94,346 | ) | 65 | (92,903 | ) | |||||||||||||
| Cash payments |
(41,839 | ) | (2,381 | ) | — | (2,911 | ) | (47,131 | ) | |||||||||||
|
|
|
|
|
|
|
|
|
|
|
|||||||||||
| Balance as of August 31, 2017(2) |
33,580 | 1,665 | — | 3,143 | 38,388 | |||||||||||||||
| Restructuring related charges |
16,269 | 1,596 | 16,264 | 2,773 | 36,902 | |||||||||||||||
| Asset write-off charge and other non-cash activity |
(127 | ) | 525 | (16,264 | ) | 25 | (15,841 | ) | ||||||||||||
| Cash payments |
(31,591 | ) | (1,102 | ) | — | (5,419 | ) | (38,112 | ) | |||||||||||
|
|
|
|
|
|
|
|
|
|
|
|||||||||||
| Balance as of August 31, 2018(2) |
$ | 18,131 | $ | 2,684 | $ | — | $ | 522 | $ | 21,337 | ||||||||||
|
|
|
|
|
|
|
|
|
|
|
|||||||||||
| (1) | Relates only to the 2013 Restructuring Plan. |
| (2) | Primarily relates to the 2017 Restructuring Plan. |
15. Business Acquisitions
Fiscal year 2018
Acquisitions
On September 1, 2017, the Company completed the acquisition of True-Tech Corporation (“True-Tech”) for approximately $95.9 million in cash. True-Tech is a manufacturer specializing in aerospace, semiconductor and medical machined components.
The acquisition of True-Tech assets has been accounted for as a business combination using the acquisition method of accounting. Assets acquired of $114.7 million, including $25.9 million in intangible assets and $22.6 million in goodwill, and liabilities assumed of $18.8 million were recorded at their estimated fair values as of the acquisition date. The excess of the purchase price over the fair value of the acquired assets and assumed liabilities was recorded to goodwill and was fully allocated to the EMS segment. The majority of the goodwill is currently expected to be deductible for income tax purposes. The results of operations were included in the Company’s condensed consolidated financial results beginning on September 1, 2017. Pro forma information has not been provided as the acquisition of True-Tech is not deemed to be significant.
Binding offer
On July 18, 2018, the Company submitted a binding offer to form a strategic collaboration with Johnson & Johnson Medical Devices Companies that will significantly expand the Company’s medical device manufacturing portfolio, diversification and capabilities in the DMS segment. The offer has been accepted with respect to the North American sites and is pending applicable consultative processes for sites in Switzerland and Germany. Completion of this transaction, which is subject to regulatory clearance and customary closing conditions, is expected to occur during fiscal years 2019 and 2020.
Fiscal year 2017
Acquisitions
On March 1, 2017, the Company completed the acquisition of Lewis Engineering, which was not deemed to be significant. The acquired business expanded the Company’s capabilities in precision machining, manufacturing and design engineering. The aggregate purchase price of the acquisition totaled approximately $31.4 million in cash.
The acquisition has been accounted for as a business combination using the acquisition method of accounting. Assets acquired of $32.3 million, including $8.2 million in goodwill and $14.6 million in intangible assets, and liabilities assumed of $0.9 million were recorded at their estimated fair values as of the acquisition date. The excess of the purchase price over the fair value of the acquired assets and assumed liabilities of $8.2 million was recorded to goodwill and was fully allocated to the
93
Table of Contents
DMS segment. The majority of the goodwill is currently expected to be deductible for income tax purposes. The Company expensed transaction costs in connection with the acquisition of approximately $0.8 million during the fiscal year ended August 31, 2017. The results of operations of the acquired business were included in the Company’s consolidated financial results beginning on the date of the acquisition. Pro forma information has not been provided as the acquisition is not deemed to be significant.
Fiscal year 2016
Acquisitions
On November 25, 2015, the Company entered into a master purchase agreement for certain assets and liabilities of various legal entities, collectively referred to as “Hanson”. On January 13, 2016, the Company completed the acquisition of the assets for approximately $139.2 million in cash, plus the assumption of certain liabilities of $230.0 million (such liabilities were subsequently paid in February 2016 and classified in our Consolidated Statement of Cash Flows as a component of cash flows from operating activities), with the exception of the real property, which closed on July 7, 2016, for approximately $33.3 million. Hanson is engaged in the business of manufacturing certain parts for customers in the DMS segment. The results of operations were included in the Company’s consolidated financial results beginning on January 13, 2016. Pro forma information has not been provided as the acquisition of Hanson is not deemed to be significant.
During the first quarter of fiscal year 2016, the Company completed two additional acquisitions (Inala Technologies Limited and various legal entities collectively referred to as “Shemer Companies”) which were not deemed to be significant individually or in the aggregate. The acquired businesses expanded the Company’s capabilities in capital equipment, networking and telecommunications, and printing. The aggregate purchase price of these acquisitions totaled approximately $72.3 million in cash. The results of operations of the acquired businesses were included in the Company’s consolidated financial results beginning on the date of the acquisitions. Pro forma information has not been provided as the acquisitions are not deemed to be significant individually or in the aggregate.
16. New Accounting Guidance
Recently Issued Accounting Guidance
During fiscal year 2014, the Financial Accounting Standards Board (“FASB”) issued an accounting standard which will supersede existing revenue recognition guidance under current U.S. GAAP. The new standard is a comprehensive new revenue recognition model that requires a company to recognize revenue to depict the transfer of goods or services to a customer at an amount that reflects the consideration it expects to receive in exchange for those goods or services. The accounting standard is effective for the Company in the first quarter of fiscal year 2019.
The new standard will also impact the Company’s accounting for certain fulfillment costs, which include up-front costs to prepare for manufacturing activities that are expected to be recovered. Under the current accounting standard these costs are typically expensed as incurred. Under the new standard, such up-front costs would be recognized as an asset and amortized on a systematic basis consistent with the pattern of the transfer of the goods to which the asset relates.
The Company currently recognizes the majority of its revenue from contracts with customers at a point in time, which is generally when the goods are shipped to or received by the customer, title and risk of ownership have passed, the price to the buyer is fixed or determinable and collectability is reasonable assured (net of estimated returns). Under the new accounting guidance, the Company will recognize revenue over time as manufacturing services are completed for the majority of its contracts with customers which will result in revenue being recognized earlier than under the historical guidance. Revenue for all other contracts with customers will be recognized at a point in time, upon transfer of control of the product to the customer, which is effectively no change to the Company’s historical current accounting.
The Company will adopt the new guidance under the modified retrospective approach with a cumulative adjustment increasing the opening balance of retained earnings by $30.0 million to $60.0 million, net of tax. Prior periods will not be retrospectively adjusted.
While the Company is substantially complete with the process of quantifying the impacts that will result from applying the new guidance, its assessment will be finalized during the first quarter of fiscal year 2019. The Company has substantially completed the implementation of changes to its processes, policies and internal controls to meet the impact of the new standard and disclosure requirements.
During fiscal year 2016, the FASB issued a new accounting standard to address certain aspects of recognition, measurement, presentation and disclosure of financial instruments. This guidance is effective for the Company beginning in the first quarter of fiscal year 2019, and must be applied by means of a cumulative-effect adjustment to the Consolidated Balance
94
Table of Contents
Sheet as of the beginning of the fiscal year of adoption and applied prospectively to equity investments that exist as of the date of adoption of the standard. The adoption of this standard is not expected to have a material impact on the Company’s Consolidated Financial Statements; however, the impact on future periods will depend on the facts and circumstances of future transactions.
During fiscal year 2016, the FASB issued a new accounting standard revising lease accounting. The new guidance requires organizations to recognize lease assets and lease liabilities on the Consolidated Balance Sheet and disclose key information regarding leasing arrangements. This guidance is effective for the Company beginning in the first quarter of fiscal year 2020. Early application of the new standard is permitted and the standard must be adopted using a modified retrospective approach. In preparation for the adoption, the Company is implementing a new lease accounting system. The adoption of this standard will impact the Company’s Consolidated Balance Sheet. The Company is currently evaluating practical expedients and accounting policy elections, and assessing overall impacts this new standard will have on its Consolidated Financial Statements.
During fiscal year 2016, the FASB issued an accounting standard, which replaces the existing incurred loss impairment methodology with a methodology that reflects expected credit losses and requires consideration of a broader range of reasonable and supportable information to inform credit loss estimates. This guidance is effective for the Company beginning in the first quarter of fiscal year 2021 and early adoption is permitted beginning in the first quarter of fiscal year 2020. This guidance must be applied using a modified retrospective or prospective transition method, depending on the area covered by this accounting standard. The Company is currently assessing the impact this new standard may have on its Consolidated Financial Statements.
During fiscal year 2016, the FASB issued a new accounting standard to address the presentation of certain transactions within the statement of cash flows with the objective of reducing the existing diversity in practice. Adoption of this standard will be required on a retrospective basis and will result in a reclassification of cash flows from operating activities to investing activities in the Company’s Consolidated Statement of Cash Flows for cash receipts for the deferred purchase price receivable on asset-backed securitization transactions. This guidance is effective for the Company beginning in the first quarter of fiscal year 2019. While the Company is still quantifying the impact of this standard, it expects a material increase in cash flow from investing activities with a corresponding decrease to cash flow from operating activities upon adoption of the standard.
During fiscal year 2017, the FASB issued a new accounting standard to improve the accounting for the income tax consequences of intra-entity transfers of assets other than inventory. The new standard eliminates the exception for an intra-entity transfer of an asset other than inventory and requires an entity to recognize the income tax consequences when the transfer occurs. This guidance is effective for the Company beginning in the first quarter of fiscal year 2019. This guidance should be applied on a modified retrospective basis through a cumulative-effect adjustment directly to retained earnings as of the beginning of the period of adoption. The adoption of this standard is not expected to have a material impact on the Company’s Consolidated Financial Statements; however, the impact on future periods will depend on the facts and circumstances of future transactions.
During fiscal year 2017, the FASB issued a new accounting standard which clarifies the scope of accounting for asset derecognition and adds further guidance for recognizing gains and losses from the transfer of non-financial assets in contracts with non-customers. This guidance is effective for the Company beginning in the first quarter of fiscal year 2019 coincident with the new revenue recognition guidance. The adoption of this standard is not expected to have a material impact on the Company’s Consolidated Financial Statements; however, the impact on future periods will depend on the facts and circumstances of future transactions.
During fiscal year 2017, the FASB issued a new accounting standard to improve the financial reporting of hedging relationships to better portray the economic results of an entity’s risk management activities by simplifying the application of hedge accounting and improving the related disclosures in its financial statements. This guidance is effective for the Company beginning in the first quarter of fiscal year 2020, with early adoption permitted. The guidance must be applied using a modified retrospective approach. The adoption of this standard is not expected to have a material impact on the Company’s Consolidated Financial Statements; however, the impact on future periods will depend on the facts and circumstances of future transactions.
During the second quarter of fiscal year 2018, the SEC staff issued SAB 118, which provides guidance on accounting for the tax effects of the Tax Act. SAB 118 provides a measurement period that should not extend beyond one year from the Tax Act enactment date for companies to complete the accounting under ASC 740. In accordance with SAB 118, a company must reflect the income tax effects of those aspects of the Tax Act for which the accounting under ASC 740 is complete. To the extent that a company’s accounting for certain income tax effects of the Tax Act is incomplete, but it is able to determine a reasonable estimate, it must record a provisional estimate in its financial statements. If a company cannot determine a
95
Table of Contents
provisional estimate to be included in the financial statements, it should continue to apply ASC 740 on the basis of the provisions of the tax laws that were in effect immediately before the enactment of the Tax Act. The Company has applied SAB 118, recorded a provisional estimate related to certain effects of the Tax Act, and provided required disclosures in Note 4 – “Income Taxes.”
During the second quarter of fiscal year 2018, the FASB issued a new accounting standard which allows a reclassification from AOCI to retained earnings for stranded tax effects resulting from the Tax Act. This guidance is effective for the Company beginning in the first quarter of fiscal year 2020, with early adoption permitted. The Company is currently assessing the impact this new standard may have on its Consolidated Financial Statements.
During the fourth quarter of fiscal year 2018, the FASB issued a new accounting standard which aligns the requirements for capitalizing implementation costs incurred in a hosting arrangement that is a service contract with the requirements for capitalizing implementation costs incurred to develop or obtain internal-use software. This guidance is effective for the Company beginning in the first quarter of fiscal year 2021, with early adoption permitted. The Company is currently assessing the impact this new standard may have on its Consolidated Financial Statements.
Recently issued accounting guidance not discussed above is not applicable or did not have, or is not expected to have, a material impact to the Company.
Not applicable.
96
Table of Contents
Pursuant to the requirements of Section 13 or 15(d) of the Securities Exchange Act of 1934, the registrant has duly caused this report to be signed on its behalf by the undersigned, thereunto duly authorized.
| JABIL INC. Registrant | ||
| By: | /s/ MARK T. MONDELLO | |
| Mark T. Mondello | ||
| Chief Executive Officer | ||
Date: October 19, 2018
97
Table of Contents
POWER OF ATTORNEY
KNOW ALL THESE PERSONS BY THESE PRESENTS, that each person whose signature appears below constitutes and appoints Mark T. Mondello and Michael Dastoor and each of them, jointly and severally, his or her attorneys-in-fact, each with full power of substitution, for him or her in any and all capacities, to sign any and all amendments to this Annual Report on Form 10-K, and to file the same, with exhibits thereto and other documents in connection therewith, with the Securities and Exchange Commission, hereby ratifying and confirming all that each said attorneys-in-fact or his substitute or substitutes, may do or cause to be done by virtue hereof.
Pursuant to the requirements of the Securities Exchange Act of 1934, this report has been signed below by the following persons on behalf of the registrant and in the capacities and on the dates indicated:
| Signature |
Title |
Date | ||||
| By: | /s/ TIMOTHY L. MAIN Timothy L. Main |
Chairman of the Board of Directors | October 19, 2018 | |||
| By: | /s/ THOMAS A. SANSONE Thomas A. Sansone |
Vice Chairman of the Board of Directors | October 19, 2018 | |||
| By: | /s/ MARK T. MONDELLO Mark T. Mondello |
Chief Executive Officer and Director (Principal Executive Officer) |
October 19, 2018 | |||
| By: | /s/ MICHAEL DASTOOR Michael Dastoor |
Chief Financial Officer (Principal Financial and Accounting Officer) |
October 19, 2018 | |||
| By: | /s/ ANOUSHEH ANSARI Anousheh Ansari |
Director | October 19, 2018 | |||
| By: | /s/ MARTHA F. BROOKS Martha F. Brooks |
Director | October 19, 2018 | |||
| By: | /s/ CHRISTOPHER S. HOLLAND Christopher S. Holland |
Director | October 19, 2018 | |||
| By: | /s/ JOHN C. PLANT John C. Plant |
Director | October 19, 2018 | |||
| By: | /s/ STEVEN A. RAYMUND Steven A. Raymund |
Director | October 19, 2018 | |||
| By: | /s/ DAVID M. STOUT David M. Stout |
Director | October 19, 2018 | |||
98
Table of Contents
JABIL INC. AND SUBSIDIARIES
SCHEDULE OF VALUATION AND QUALIFYING ACCOUNTS
(in thousands)
| Balance at Beginning of Period |
Additions and Adjustments Charged to Costs and Expenses |
Additions/ (Reductions) Charged to Other Accounts |
Write-offs | Balance at End of Period |
||||||||||||||||
| Allowance for uncollectible accounts receivable: |
||||||||||||||||||||
| Fiscal year ended August 31, 2018 |
$ | 14,134 | $ | 12,545 | $ | — | $ | (11,498 | ) | $ | 15,181 | |||||||||
|
|
|
|
|
|
|
|
|
|
|
|||||||||||
| Fiscal year ended August 31, 2017 |
$ | 11,094 | $ | 6,255 | $ | — | $ | (3,215 | ) | $ | 14,134 | |||||||||
|
|
|
|
|
|
|
|
|
|
|
|||||||||||
| Fiscal year ended August 31, 2016 |
$ | 11,663 | $ | 292 | $ | — | $ | (861 | ) | $ | 11,094 | |||||||||
|
|
|
|
|
|
|
|
|
|
|
|||||||||||
| Balance at Beginning of Period |
Additions and Adjustments Charged to Costs and Expenses |
Additions/ (Reductions) Charged to Other Accounts |
Write-offs | Balance at End of Period |
||||||||||||||||
| Reserve for excess and obsolete inventory: |
||||||||||||||||||||
| Fiscal year ended August 31, 2018 |
$ | 46,013 | $ | 35,538 | $ | — | $ | (20,611 | ) | $ | 60,940 | |||||||||
|
|
|
|
|
|
|
|
|
|
|
|||||||||||
| Fiscal year ended August 31, 2017 |
$ | 32,221 | $ | 46,030 | $ | — | $ | (32,238 | ) | $ | 46,013 | |||||||||
|
|
|
|
|
|
|
|
|
|
|
|||||||||||
| Fiscal year ended August 31, 2016 |
$ | 43,477 | $ | 12,145 | $ | — | $ | (23,401 | ) | $ | 32,221 | |||||||||
|
|
|
|
|
|
|
|
|
|
|
|||||||||||
| Balance at Beginning of Period |
Additions Charged to Costs and Expenses(1) |
Additions/ (Reductions) Charged to Other Accounts(2) |
Reductions Charged to Costs and Expenses(3) |
Balance at End of Period |
||||||||||||||||
| Valuation allowance for deferred taxes: |
||||||||||||||||||||
| Fiscal year ended August 31, 2018 |
$ | 285,559 | $ | 18,418 | $ | (886 | ) | $ | (79,604 | ) | $ | 223,487 | ||||||||
|
|
|
|
|
|
|
|
|
|
|
|||||||||||
| Fiscal year ended August 31, 2017 |
$ | 344,828 | $ | 65,300 | $ | (97,203 | ) | $ | (27,366 | ) | $ | 285,559 | ||||||||
|
|
|
|
|
|
|
|
|
|
|
|||||||||||
| Fiscal year ended August 31, 2016 |
$ | 304,820 | $ | 23,891 | $ | 28,238 | $ | (12,121 | ) | $ | 344,828 | |||||||||
|
|
|
|
|
|
|
|
|
|
|
|||||||||||
| (1) | During the fiscal years ended August 31, 2018, 2017 and 2016, the additions charged to costs and expenses primarily relate to the increase of deferred tax assets for sites with existing valuation allowances. |
| (2) | During the fiscal year ended August 31, 2017, the reductions charged to other accounts primarily relate to the decrease of net operating loss carry forwards due to non-U.S. unrecognized tax benefits and a non-U.S. tax audit. During the fiscal year ended August 31, 2016, the additions charged to other accounts primarily related to the recognition of excess tax benefits due to the early adoption of the new accounting guidance for share-based payment transactions. |
| (3) | During the fiscal year ended August 31, 2018, the reductions charged to costs and expenses primarily relate to the decrease of U.S. net operating loss carry forwards and tax credits due to utilization against the one-time transition tax as a result of the Tax Act. During the fiscal year ended August 31, 2017, the reductions charged to costs and expenses primarily relate to the release of certain non-U.S. valuation allowances. |
See accompanying report of independent registered public accounting firm.
99