Attached files
| file | filename |
|---|---|
| 8-K - HANCOCK WHITNEY CORP | hwc-20181016x8k.htm |
| EX-99.1 - HANCOCK WHITNEY CORP | hwc-20181016xex99_1.htm |

Third Quarter 2018Earnings Conference Call 10/17/2018
This presentation contains forward-looking statements within the meaning of section 27A of the Securities Act of 1933, as amended, and section 21E of the Securities Exchange Act of 1934, as amended. Forward-looking statements that we may make include statements regarding balance sheet and revenue growth, the provision for loans losses, loan growth expectations, management’s predictions about charge-offs for loans, including energy-related credits, the impact of changes in oil and gas prices on our energy portfolio, the impact of the transaction with Capital One on our performance and financial condition, including our ability to successfully integrate the businesses, deposit trends, credit quality trends, net interest margin trends, future expense levels, success of revenue-generating initiatives, projected tax rates, future profitability, improvements in expense to revenue (efficiency) ratio, purchase accounting impacts such as accretion levels, increased cybersecurity risks, including potential business disruptions or financial losses, and the financial impact of regulatory requirements and tax reform legislation. Also, any statement that does not describe historical or current facts is a forward-looking statement. These statements often include the words “believes,” “expects,” “anticipates,” “estimates,” “intends,” “plans,” “forecast,” “goals,” “targets,” “initiatives,” “focus,” “potentially,” “probably,” “projects,” “outlook", or similar expressions or future conditional verbs such as “may,” “will,” “should,” “would,” and “could.” Forward-looking statements are based upon the current beliefs and expectations of management and on information currently available to management. Our statements speak as of the date hereof, and we do not assume any obligation to update these statements or to update the reasons why actual results could differ from those contained in such statements in light of new information or future events. Forward-looking statements are subject to significant risks and uncertainties. Any forward-looking statement made in this release is subject to the safe harbor protections set forth in the Private Securities Litigation Reform Act of 1995. Investors are cautioned against placing undue reliance on such statements. Actual results may differ materially from those set forth in the forward looking statements. Additional factors that could cause actual results to differ materially from those described in the forward-looking statements can be found in Part I, “Item 1A. Risk Factors” in our Annual Report on Form 10-K for the year ended December 31, 2017 and in other periodic reports that we file with the SEC. Important cautionary statement about forward-looking statements 2
Non-GAAP Reconciliations & Glossary of Terms Throughout this presentation we may use non-GAAP numbers. The items noted below with an asterisk, "*", are considered non-GAAP. Reconciliations of those non-GAAP results to the comparable GAAP measure are included in the appendix to this presentation. The earnings release, financial tables and supporting slide presentation can be found on the company’s Investor Relations website at hancockwhitney.com/investors. 1Q18 – First Quarter of 20182Q18 – Second Quarter of 20183Q17 – Third Quarter of 20173Q18 – Third Quarter of 20184Q18 – Fourth Quarter of 2018AFS – Available for sale securitiesALLL – Allowance for loan and lease lossesAnnualized – Calculated to reflect a rate based on afull yearBOLI – Bank-owned life insuranceCDI – Core Deposit IntangibleCECL – Current Expected Credit Losses (new accounting standard set for 2020)*Core – Excluding purchase accounting items and nonoperating items*Core NIM – Reported net interest income (TE) excluding total net purchase accounting adjustments, annualized, as a percent of average earning assets*Core Revenue – Net interest income (TE) plus noninterest income excluding purchase accounting adjustments and nonoperating items for both categoriesCSO – Corporate strategic objectiveCurrent Energy Cycle – Refers to the energy cycle beginning in November of 2014 through the most recent quarter endDDA – Noninterest-bearing demands deposit accountsDTA – Deferred Tax AssetE&P – Exploration and Production (Oil & Gas)Efficiency ratio – noninterest expense to total net interest (TE) and noninterest income, excluding amortization of purchased intangibles and nonoperating itemsEOP – End of periodEPS – Earnings per shareFTE – full time equivalentHTM – Held to maturity securitiesIRR – Interest rate riskLinked-quarter (LQ) – current quarter compared to previous quarterLoan Mark – Fair value discount on loans acquired in a business combinationLOB – Line of BusinessLPO – Loan production officeLQ – Linked-quarterLQA – Linked-quarter annualizedM&A – Mergers and acquisitionsMM – Dollars in millionsNII – Net interest income NIM – Net interest margin (TE)NPA – Nonperforming assetsO&G – Oil and gas*Operating – Financial measure excluding nonoperating itemsOperating Leverage – Revenue (TE) less operating expenseORE – Other real estatePAA – Purchase accounting adjustments from business combinations; including loan accretion, offset by any amortization of a bond portfolio premium, amortization of an indemnification asset and amortization of intangiblesPPNR – Pre-provision net revenueRBL – Reserve-based lendingROA – Return on average assetsRR – Risk ratingSBIC – Small Business Investment CompanySNC – Shared National CreditTCE – Tangible common equity ratio (common shareholders’ equity less intangible assets divided by total assets less intangible assets)TCJA – Tax Cuts and Jobs ActTDR – Troubled Debt Restructuring TE – Taxable equivalent (calculated using the current statutory federal tax rate)Trust and Asset Management acquisition – Acquired from Capital One on July 13, 2018Y-o-Y – Year over year 3
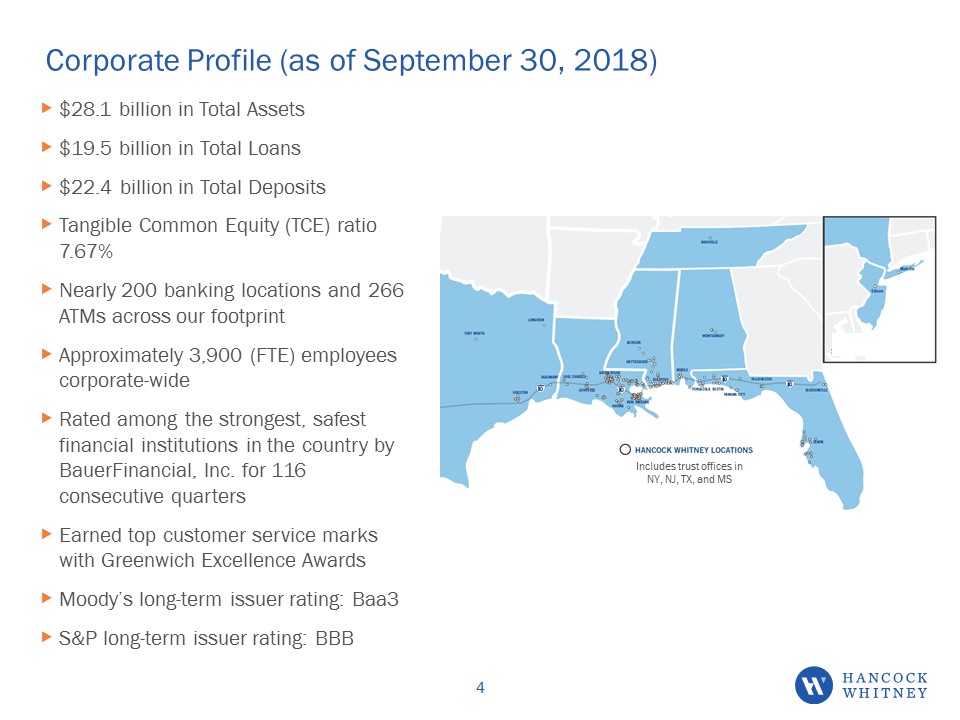
Corporate Profile (as of September 30, 2018) $28.1 billion in Total Assets$19.5 billion in Total Loans$22.4 billion in Total DepositsTangible Common Equity (TCE) ratio 7.67%Nearly 200 banking locations and 266 ATMs across our footprintApproximately 3,900 (FTE) employees corporate-wideRated among the strongest, safest financial institutions in the country by BauerFinancial, Inc. for 116 consecutive quartersEarned top customer service marks with Greenwich Excellence AwardsMoody’s long-term issuer rating: Baa3S&P long-term issuer rating: BBB 4 Includes trust offices in NY, NJ, TX, and MS
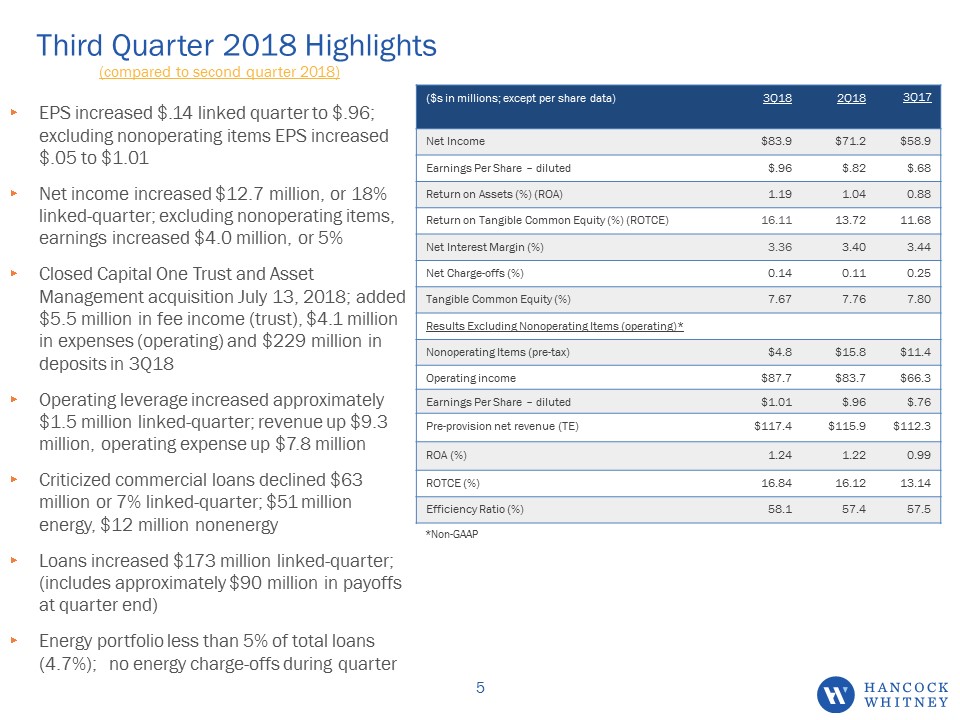
Third Quarter 2018 Highlights (compared to second quarter 2018) EPS increased $.14 linked quarter to $.96; excluding nonoperating items EPS increased $.05 to $1.01 Net income increased $12.7 million, or 18% linked-quarter; excluding nonoperating items, earnings increased $4.0 million, or 5%Closed Capital One Trust and Asset Management acquisition July 13, 2018; added $5.5 million in fee income (trust), $4.1 million in expenses (operating) and $229 million in deposits in 3Q18Operating leverage increased approximately $1.5 million linked-quarter; revenue up $9.3 million, operating expense up $7.8 millionCriticized commercial loans declined $63 million or 7% linked-quarter; $51 million energy, $12 million nonenergyLoans increased $173 million linked-quarter; (includes approximately $90 million in payoffs at quarter end)Energy portfolio less than 5% of total loans (4.7%); no energy charge-offs during quarter ($s in millions; except per share data) 3Q18 2Q18 3Q17 Net Income $83.9 $71.2 $58.9 Earnings Per Share – diluted $.96 $.82 $.68 Return on Assets (%) (ROA) 1.19 1.04 0.88 Return on Tangible Common Equity (%) (ROTCE) 16.11 13.72 11.68 Net Interest Margin (%) 3.36 3.40 3.44 Net Charge-offs (%) 0.14 0.11 0.25 Tangible Common Equity (%) 7.67 7.76 7.80 Results Excluding Nonoperating Items (operating)* Nonoperating Items (pre-tax) $4.8 $15.8 $11.4 Operating income $87.7 $83.7 $66.3 Earnings Per Share – diluted $1.01 $.96 $.76 Pre-provision net revenue (TE) $117.4 $115.9 $112.3 ROA (%) 1.24 1.22 0.99 ROTCE (%) 16.84 16.12 13.14 Efficiency Ratio (%) 58.1 57.4 57.5 *Non-GAAP 5
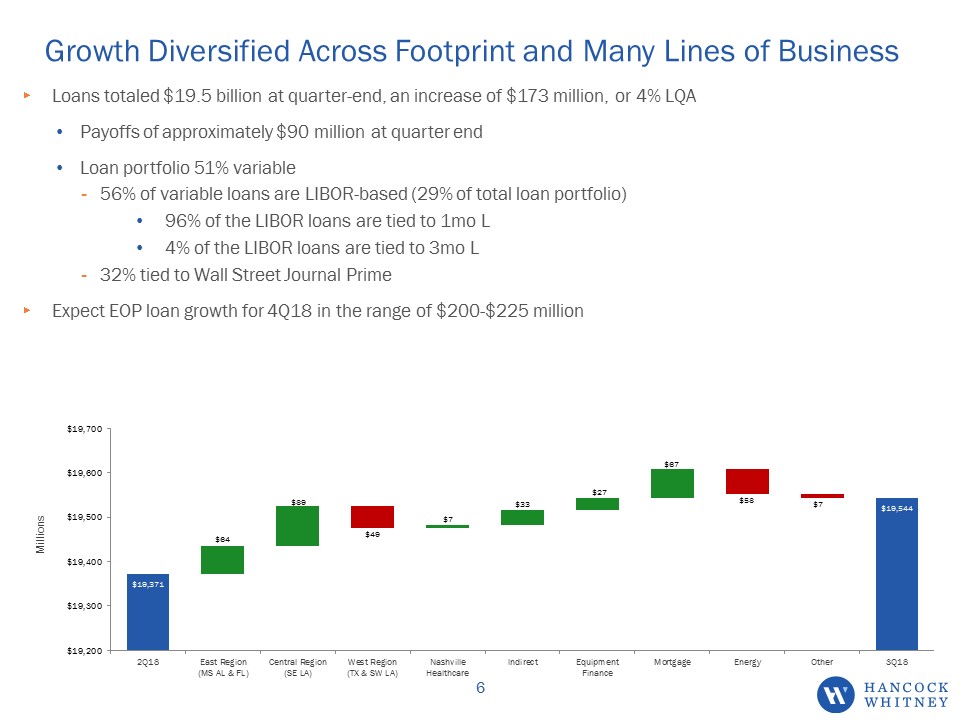
Growth Diversified Across Footprint and Many Lines of Business Loans totaled $19.5 billion at quarter-end, an increase of $173 million, or 4% LQAPayoffs of approximately $90 million at quarter endLoan portfolio 51% variable56% of variable loans are LIBOR-based (29% of total loan portfolio)96% of the LIBOR loans are tied to 1mo L4% of the LIBOR loans are tied to 3mo L32% tied to Wall Street Journal PrimeExpect EOP loan growth for 4Q18 in the range of $200-$225 million 6
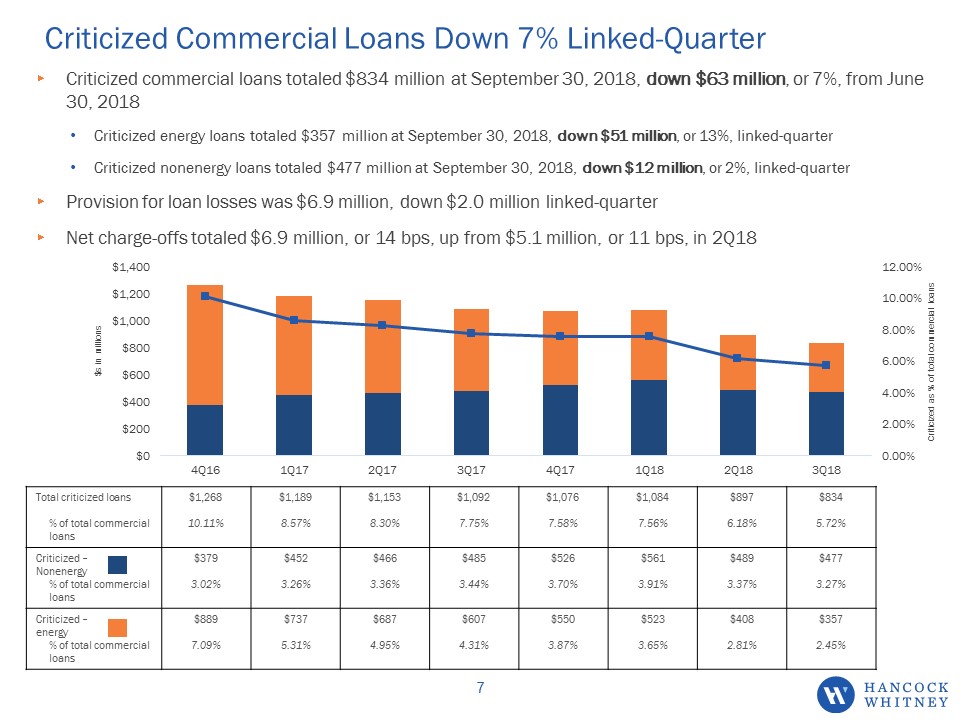
Criticized Commercial Loans Down 7% Linked-Quarter Total criticized loans% of total commercial loans $1,26810.11% $1,1898.57% $1,1538.30% $1,0927.75% $1,0767.58% $1,0847.56% $8976.18% $8345.72% Criticized –Nonenergy% of total commercial loans $3793.02% $4523.26% $4663.36% $4853.44% $5263.70% $5613.91% $4893.37% $4773.27% Criticized – energy% of total commercial loans $8897.09% $7375.31% $6874.95% $6074.31% $5503.87% $5233.65% $4082.81% $3572.45% Criticized commercial loans totaled $834 million at September 30, 2018, down $63 million, or 7%, from June 30, 2018Criticized energy loans totaled $357 million at September 30, 2018, down $51 million, or 13%, linked-quarterCriticized nonenergy loans totaled $477 million at September 30, 2018, down $12 million, or 2%, linked-quarterProvision for loan losses was $6.9 million, down $2.0 million linked-quarterNet charge-offs totaled $6.9 million, or 14 bps, up from $5.1 million, or 11 bps, in 2Q18 7
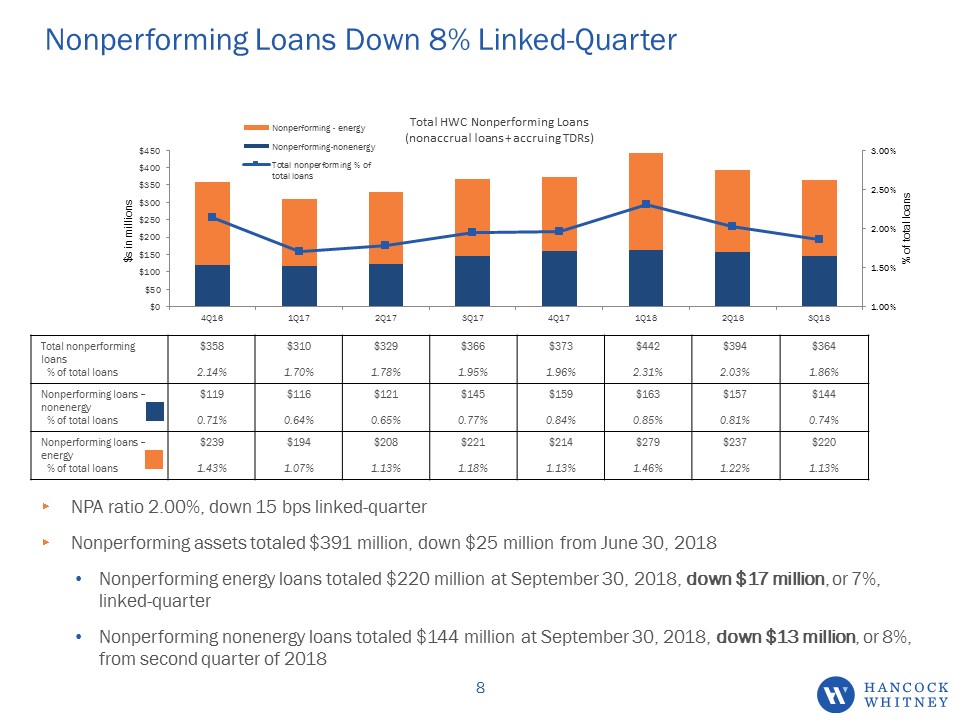
Nonperforming Loans Down 8% Linked-Quarter Total nonperforming loans% of total loans $3582.14% $3101.70% $3291.78% $3661.95% $3731.96% $4422.31% $3942.03% $3641.86% Nonperforming loans – nonenergy% of total loans $1190.71% $1160.64% $1210.65% $1450.77% $1590.84% $1630.85% $1570.81% $1440.74% Nonperforming loans – energy% of total loans $2391.43% $1941.07% $2081.13% $2211.18% $2141.13% $2791.46% $2371.22% $2201.13% Total HWC Nonperforming Loans(nonaccrual loans + accruing TDRs) NPA ratio 2.00%, down 15 bps linked-quarter Nonperforming assets totaled $391 million, down $25 million from June 30, 2018Nonperforming energy loans totaled $220 million at September 30, 2018, down $17 million, or 7%, linked-quarterNonperforming nonenergy loans totaled $144 million at September 30, 2018, down $13 million, or 8%, from second quarter of 2018 8
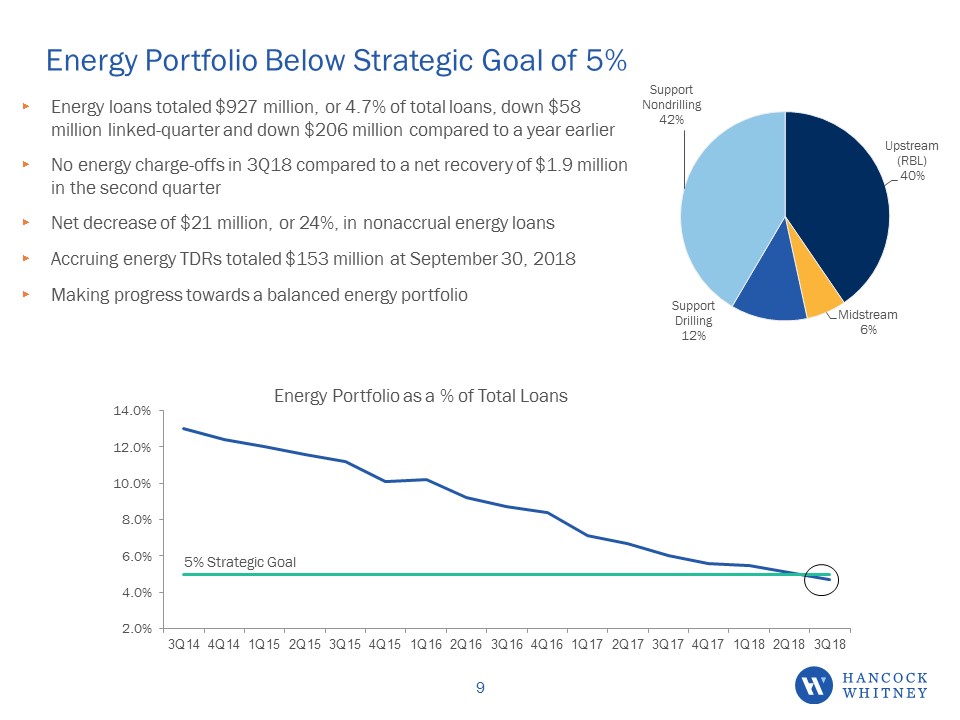
Energy Portfolio Below Strategic Goal of 5% Energy loans totaled $927 million, or 4.7% of total loans, down $58 million linked-quarter and down $206 million compared to a year earlierNo energy charge-offs in 3Q18 compared to a net recovery of $1.9 million in the second quarterNet decrease of $21 million, or 24%, in nonaccrual energy loansAccruing energy TDRs totaled $153 million at September 30, 2018Making progress towards a balanced energy portfolio 9

Energy Reserve Release Offsets Build in Nonenergy Reserves Allowance for loan losses (ALLL) $214.5 million in 3Q18, virtually unchanged linked-quarterALLL for energy credits $50.2 million at September 30, 2018, down $8.8 million from June 30, 2018 Nonenergy ALLL $164.3 million as of September 30, 2018, up $8.8 million from June 30, 2018 Net charge-offs to-date for the current energy cycle (Nov ‘14 – Sep ‘18) total $79 millionManagement continues to believe the current reserve is adequate and estimates that net charge-offs from energy-related credits could approximate up to $95 million over the duration of the cycleWith oil prices approximating $70 a barrel, and continued stabilization in prices, we anticipate the cycle for us could end soon; we believe we are adequately reserved for losses on remaining credits and do not expect a significant provision for any additional issues Total Energy 3Q18 Upstream Midstream Support Drilling Support Nondrilling Total Energy General Reserves $7.6MM $0.7MM $5.8MM $18.0MM $32.1MM Impaired Reserves --- --- $0.5MM $17.6MM $18.1MM Total Energy Allowance $7.6MM $0.7MM $6.3MM $35.6MM $50.2MM Loans $375MM $57MM $110MM $385MM $927MM Total Energy Allowance % 2.03% 1.21% 5.72% 9.25% 5.42% 3Q18 Nonenergy Energy Total General Reserves $147.5MM $32.1MM $179.6MM Impaired Reserves $5.5MM $18.1MM $23.6MM PCI Reserves $11.3MM -- $11.3MM Total Allowance for Credit Losses $164.3MM $50.2MM $214.5MM Loans $18,617MM $927MM $19,544MM Coverage Ratio at 9-30-18 0.88% 5.42% 1.10% Coverage Ratio at 6-30-18 0.85% 5.99% 1.11% 10
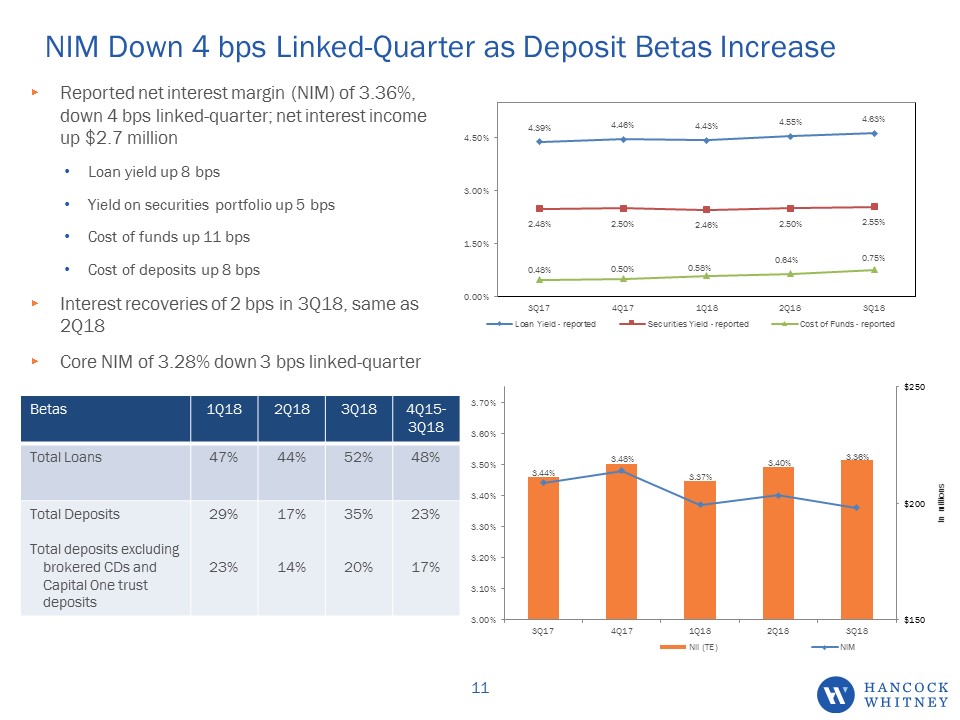
Reported net interest margin (NIM) of 3.36%, down 4 bps linked-quarter; net interest incomeup $2.7 millionLoan yield up 8 bpsYield on securities portfolio up 5 bpsCost of funds up 11 bpsCost of deposits up 8 bpsInterest recoveries of 2 bps in 3Q18, same as 2Q18Core NIM of 3.28% down 3 bps linked-quarter NIM Down 4 bps Linked-Quarter as Deposit Betas Increase Betas 1Q18 2Q18 3Q18 4Q15-3Q18 Total Loans 47% 44% 52% 48% Total DepositsTotal deposits excluding brokered CDs and Capital One trust deposits 29%23% 17%14% 35%20% 23%17% 11

Securities Portfolio Portfolio totaled $6.0 billion, down $126 million, or 2%, linked-quarterYield 2.55%, up 5 bps linked-quarterPremium amortization up $0.1 million linked-quarterUnrealized net loss of $130.7 million on AFS compared to $109.9 million at June 30, 201850% HTM, 50% AFSDuration 4.90 years compared to 4.89 years in 2Q18Balance sheet is asset sensitive over a 2 year period to rising interest rates under various shock scenarios 12
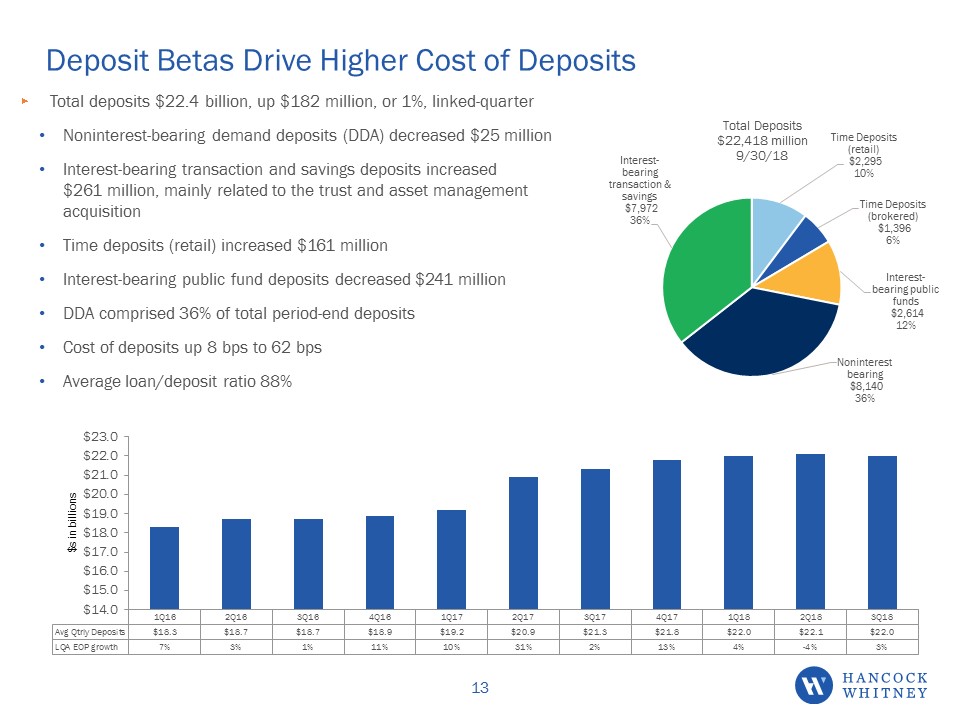
Deposit Betas Drive Higher Cost of Deposits Total deposits $22.4 billion, up $182 million, or 1%, linked-quarterNoninterest-bearing demand deposits (DDA) decreased $25 million Interest-bearing transaction and savings deposits increased $261 million, mainly related to the trust and asset management acquisitionTime deposits (retail) increased $161 millionInterest-bearing public fund deposits decreased $241 millionDDA comprised 36% of total period-end depositsCost of deposits up 8 bps to 62 bpsAverage loan/deposit ratio 88% 13
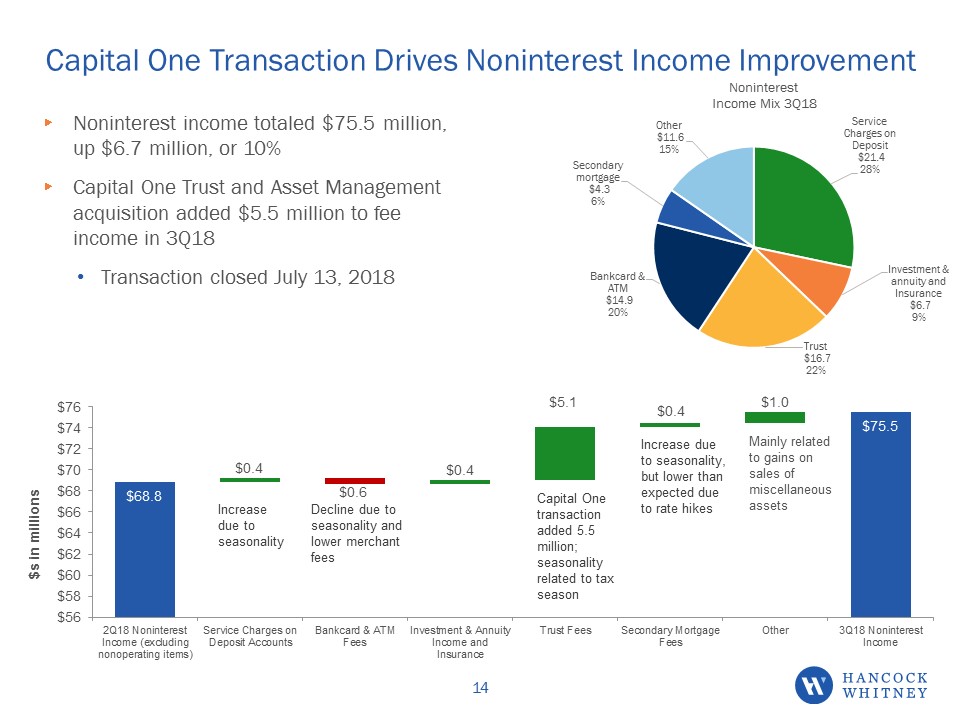
Capital One Transaction Drives Noninterest Income Improvement Noninterest income totaled $75.5 million, up $6.7 million, or 10%Capital One Trust and Asset Management acquisition added $5.5 million to fee income in 3Q18Transaction closed July 13, 2018 14 Increase due to seasonality Decline due to seasonality and lower merchant fees Increase due to seasonality, but lower than expected due to rate hikes
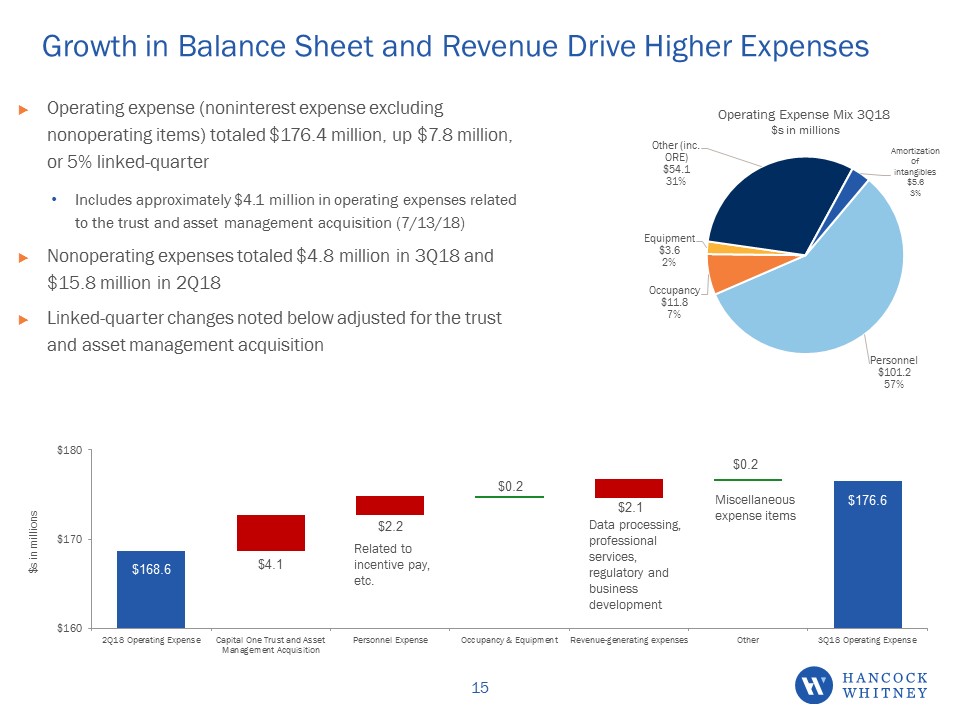
Growth in Balance Sheet and Revenue Drive Higher Expenses Operating expense (noninterest expense excluding nonoperating items) totaled $176.4 million, up $7.8 million, or 5% linked-quarterIncludes approximately $4.1 million in operating expenses related to the trust and asset management acquisition (7/13/18)Nonoperating expenses totaled $4.8 million in 3Q18 and $15.8 million in 2Q18Linked-quarter changes noted below adjusted for the trust and asset management acquisition 15 Related to incentive pay, etc. Data processing, professional services, regulatory and business development Miscellaneous expense items
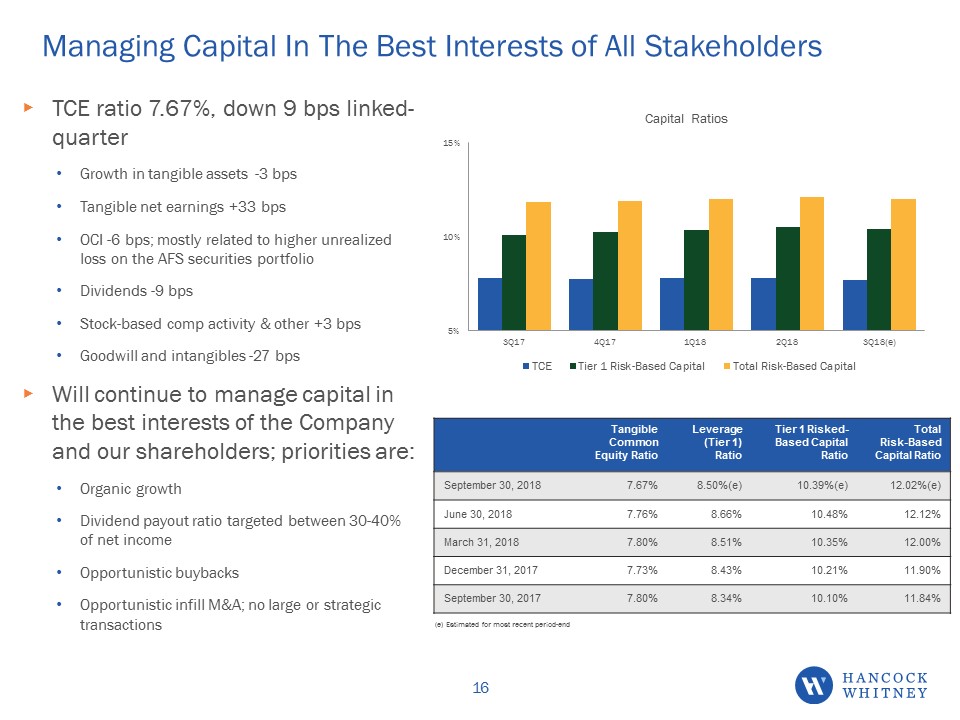
Managing Capital In The Best Interests of All Stakeholders TCE ratio 7.67%, down 9 bps linked-quarterGrowth in tangible assets -3 bpsTangible net earnings +33 bpsOCI -6 bps; mostly related to higher unrealized loss on the AFS securities portfolioDividends -9 bpsStock-based comp activity & other +3 bpsGoodwill and intangibles -27 bpsWill continue to manage capital in the best interests of the Company and our shareholders; priorities are:Organic growthDividend payout ratio targeted between 30-40% of net incomeOpportunistic buybacksOpportunistic infill M&A; no large or strategic transactions Tangible Common Equity Ratio Leverage (Tier 1) Ratio Tier 1 Risked-Based Capital Ratio Total Risk-Based Capital Ratio September 30, 2018 7.67% 8.50%(e) 10.39%(e) 12.02%(e) June 30, 2018 7.76% 8.66% 10.48% 12.12% March 31, 2018 7.80% 8.51% 10.35% 12.00% December 31, 2017 7.73% 8.43% 10.21% 11.90% September 30, 2017 7.80% 8.34% 10.10% 11.84% (e) Estimated for most recent period-end 16
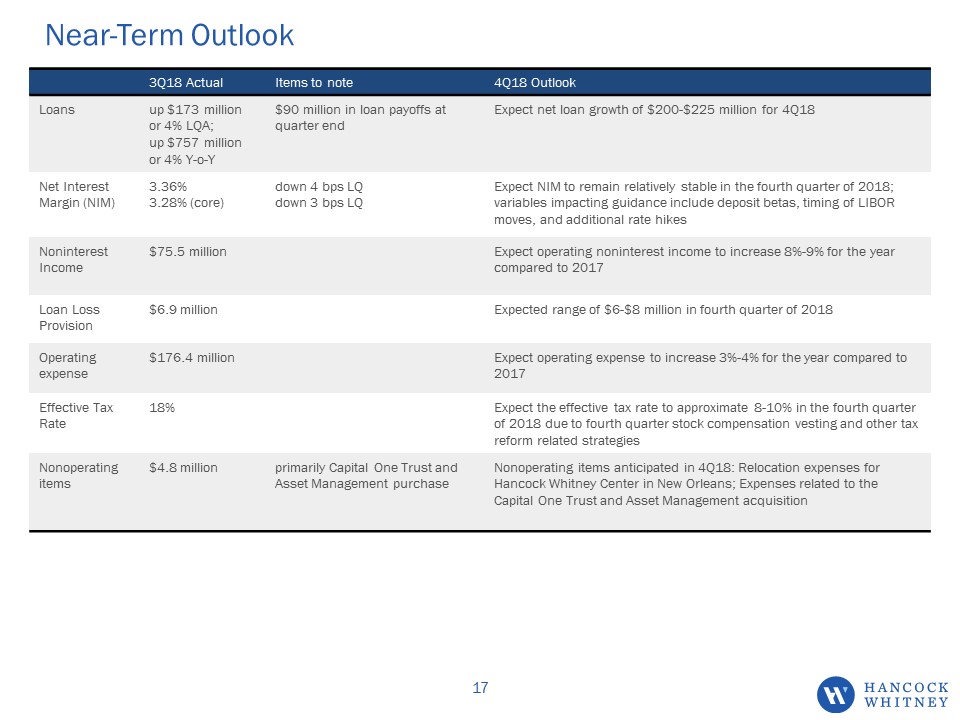
Near-Term Outlook 3Q18 Actual Items to note 4Q18 Outlook Loans up $173 million or 4% LQA; up $757 million or 4% Y-o-Y $90 million in loan payoffs at quarter end Expect net loan growth of $200-$225 million for 4Q18 Net Interest Margin (NIM) 3.36%3.28% (core) down 4 bps LQdown 3 bps LQ Expect NIM to remain relatively stable in the fourth quarter of 2018; variables impacting guidance include deposit betas, timing of LIBOR moves, and additional rate hikes Noninterest Income $75.5 million Expect operating noninterest income to increase 8%-9% for the year compared to 2017 Loan Loss Provision $6.9 million Expected range of $6-$8 million in fourth quarter of 2018 Operating expense $176.4 million Expect operating expense to increase 3%-4% for the year compared to 2017 Effective Tax Rate 18% Expect the effective tax rate to approximate 8-10% in the fourth quarter of 2018 due to fourth quarter stock compensation vesting and other tax reform related strategies Nonoperating items $4.8 million primarily Capital One Trust and Asset Management purchase Nonoperating items anticipated in 4Q18: Relocation expenses for Hancock Whitney Center in New Orleans; Expenses related to the Capital One Trust and Asset Management acquisition 17
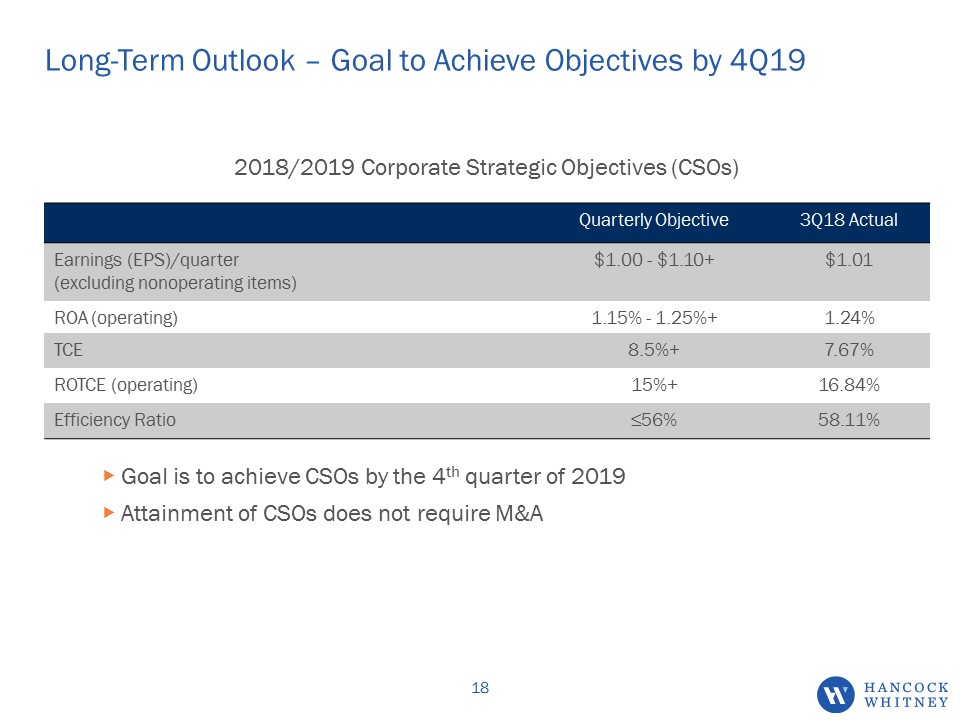
Long-Term Outlook – Goal to Achieve Objectives by 4Q19 Quarterly Objective 3Q18 Actual Earnings (EPS)/quarter (excluding nonoperating items) $1.00 - $1.10+ $1.01 ROA (operating) 1.15% - 1.25%+ 1.24% TCE 8.5%+ 7.67% ROTCE (operating) 15%+ 16.84% Efficiency Ratio ≤56% 58.11% 2018/2019 Corporate Strategic Objectives (CSOs) 18 Goal is to achieve CSOs by the 4th quarter of 2019Attainment of CSOs does not require M&A
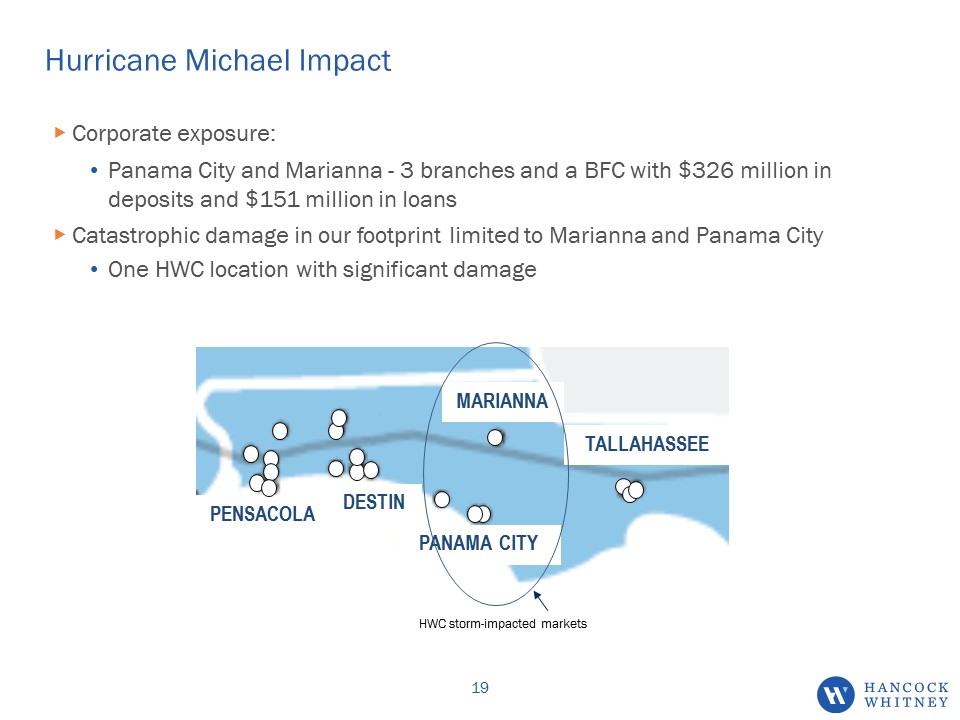
Hurricane Michael Impact 19 Corporate exposure:Panama City and Marianna - 3 branches and a BFC with $326 million in deposits and $151 million in loansCatastrophic damage in our footprint limited to Marianna and Panama CityOne HWC location with significant damage MARIANNA TALLAHASSEE PANAMA CITY PENSACOLA DESTIN HWC storm-impacted markets

Non-GAAP Reconciliations

Operating Earnings & Operating EPS Reconciliations Three Months Ended (in thousands, except per share amounts) 9/30/2018 6/30/2018 3/31/2018 12/31/2017 9/30/2017 Net Income $83,878 $71,177 $72,475 $ 55,449 $58,902 Net income allocated to participating securities (1,544) (1,328) (1,366) (1,104) (1,244) Net income available to common shareholders $82,334 $69,849 $71,109 $54,345 $57,658 Nonoperating items, net of applicable income tax 3,813 12,486 5,782 19,520 7,405 Nonoperating income allocated to participating securities (71) (233) (109) (390) (156) Operating net income available to common shareholders $86,076 $82,102 $76,782 $73,475 $64,907 Weighted average common shares - diluted 85,539 85,483 85,423 85,303 84,980 Earnings per share - diluted $0.96 $0.82 $0.83 $0.64 $0.68 Operating earnings per share - diluted $1.01 $0.96 $0.90 $0.86 $0.76 21
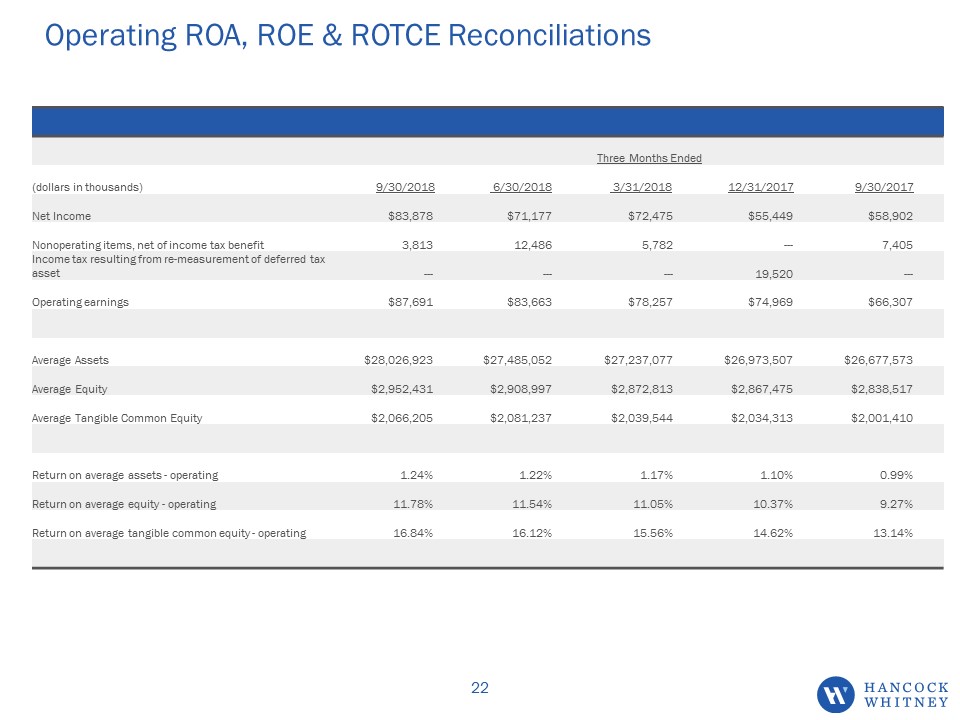
Operating ROA, ROE & ROTCE Reconciliations Three Months Ended (dollars in thousands) 9/30/2018 6/30/2018 3/31/2018 12/31/2017 9/30/2017 Net Income $83,878 $71,177 $72,475 $55,449 $58,902 Nonoperating items, net of income tax benefit 3,813 12,486 5,782 --- 7,405 Income tax resulting from re-measurement of deferred tax asset --- --- --- 19,520 --- Operating earnings $87,691 $83,663 $78,257 $74,969 $66,307 Average Assets $28,026,923 $27,485,052 $27,237,077 $26,973,507 $26,677,573 Average Equity $2,952,431 $2,908,997 $2,872,813 $2,867,475 $2,838,517 Average Tangible Common Equity $2,066,205 $2,081,237 $2,039,544 $2,034,313 $2,001,410 Return on average assets - operating 1.24% 1.22% 1.17% 1.10% 0.99% Return on average equity - operating 11.78% 11.54% 11.05% 10.37% 9.27% Return on average tangible common equity - operating 16.84% 16.12% 15.56% 14.62% 13.14% 22
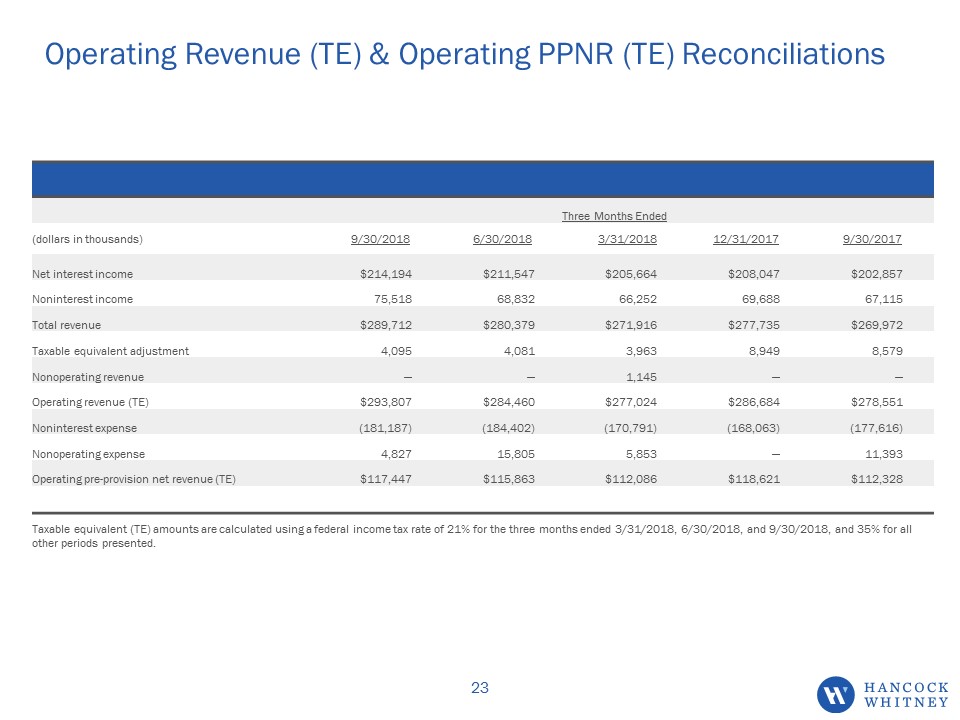
Operating Revenue (TE) & Operating PPNR (TE) Reconciliations Three Months Ended (dollars in thousands) 9/30/2018 6/30/2018 3/31/2018 12/31/2017 9/30/2017 Net interest income $214,194 $211,547 $205,664 $208,047 $202,857 Noninterest income 75,518 68,832 66,252 69,688 67,115 Total revenue $289,712 $280,379 $271,916 $277,735 $269,972 Taxable equivalent adjustment 4,095 4,081 3,963 8,949 8,579 Nonoperating revenue — — 1,145 — — Operating revenue (TE) $293,807 $284,460 $277,024 $286,684 $278,551 Noninterest expense (181,187) (184,402) (170,791) (168,063) (177,616) Nonoperating expense 4,827 15,805 5,853 — 11,393 Operating pre-provision net revenue (TE) $117,447 $115,863 $112,086 $118,621 $112,328 23 Taxable equivalent (TE) amounts are calculated using a federal income tax rate of 21% for the three months ended 3/31/2018, 6/30/2018, and 9/30/2018, and 35% for all other periods presented.
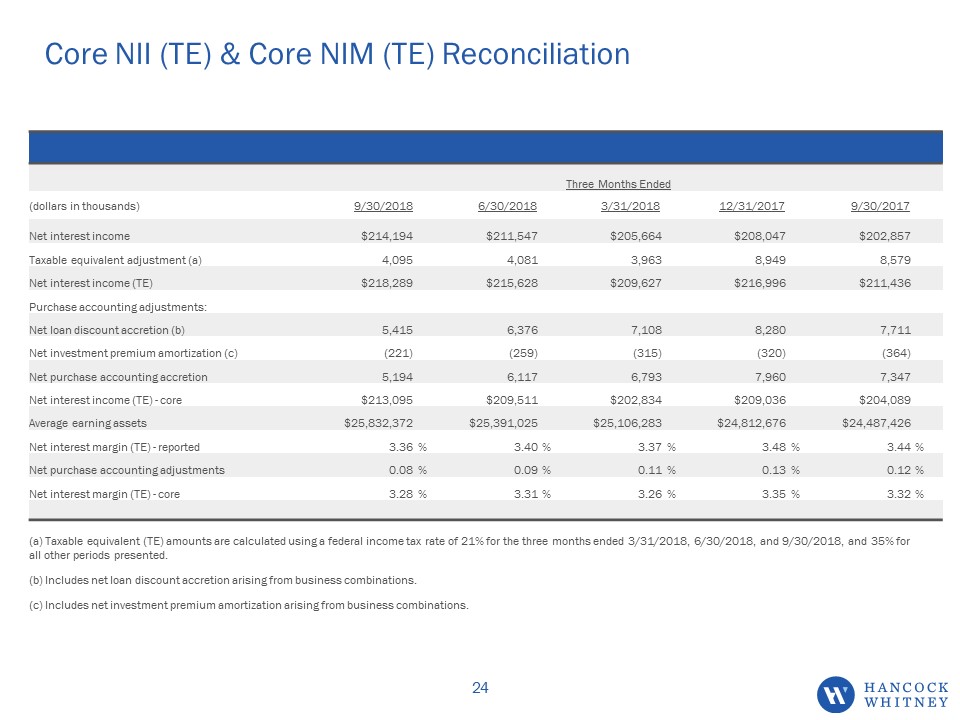
Core NII (TE) & Core NIM (TE) Reconciliation Three Months Ended (dollars in thousands) 9/30/2018 6/30/2018 3/31/2018 12/31/2017 9/30/2017 Net interest income $214,194 $211,547 $205,664 $208,047 $202,857 Taxable equivalent adjustment (a) 4,095 4,081 3,963 8,949 8,579 Net interest income (TE) $218,289 $215,628 $209,627 $216,996 $211,436 Purchase accounting adjustments: Net loan discount accretion (b) 5,415 6,376 7,108 8,280 7,711 Net investment premium amortization (c) (221) (259) (315) (320) (364) Net purchase accounting accretion 5,194 6,117 6,793 7,960 7,347 Net interest income (TE) - core $213,095 $209,511 $202,834 $209,036 $204,089 Average earning assets $25,832,372 $25,391,025 $25,106,283 $24,812,676 $24,487,426 Net interest margin (TE) - reported 3.36 % 3.40 % 3.37 % 3.48 % 3.44 % Net purchase accounting adjustments 0.08 % 0.09 % 0.11 % 0.13 % 0.12 % Net interest margin (TE) - core 3.28 % 3.31 % 3.26 % 3.35 % 3.32 % (a) Taxable equivalent (TE) amounts are calculated using a federal income tax rate of 21% for the three months ended 3/31/2018, 6/30/2018, and 9/30/2018, and 35% for all other periods presented. (b) Includes net loan discount accretion arising from business combinations. (c) Includes net investment premium amortization arising from business combinations. 24

Appendix

Operating Earnings See slides 21-24 for non-GAAP reconciliations 26 3Q17 4Q17 1Q18 2Q18 3Q18 Operating Earnings ($000) 66,307 74,969 78,257 83,663 87,691 Operating EPS $0.76 $0.86 $0.90 $0.96 $1.01 Net Interest Income (TE) ($000) 211,436 216,996 209,627 215,628 218,289 Noninterest Inc excl non-op ($000) 67,115 69,688 67,397 68,832 75,518 Operating Expense excl non-op ($000) 166,223 168,063 164,938 168,597 176,360 Provision ($000) 13,040 14,986 12,253 8,891 6,872
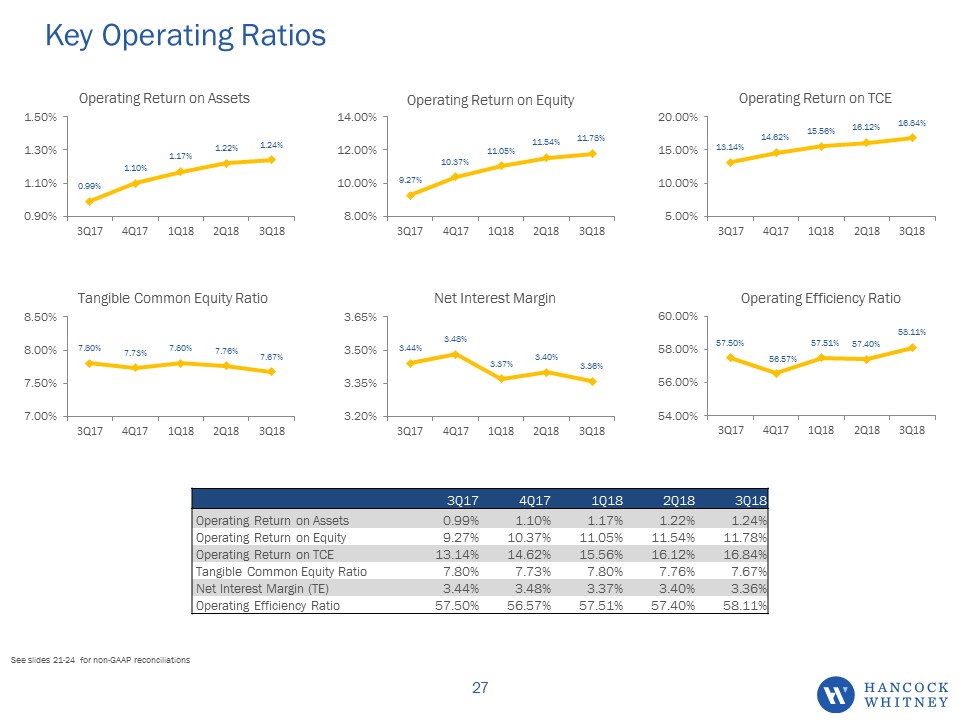
Key Operating Ratios See slides 21-24 for non-GAAP reconciliations 27 3Q17 4Q17 1Q18 2Q18 3Q18 Operating Return on Assets 0.99% 1.10% 1.17% 1.22% 1.24% Operating Return on Equity 9.27% 10.37% 11.05% 11.54% 11.78% Operating Return on TCE 13.14% 14.62% 15.56% 16.12% 16.84% Tangible Common Equity Ratio 7.80% 7.73% 7.80% 7.76% 7.67% Net Interest Margin (TE) 3.44% 3.48% 3.37% 3.40% 3.36% Operating Efficiency Ratio 57.50% 56.57% 57.51% 57.40% 58.11%
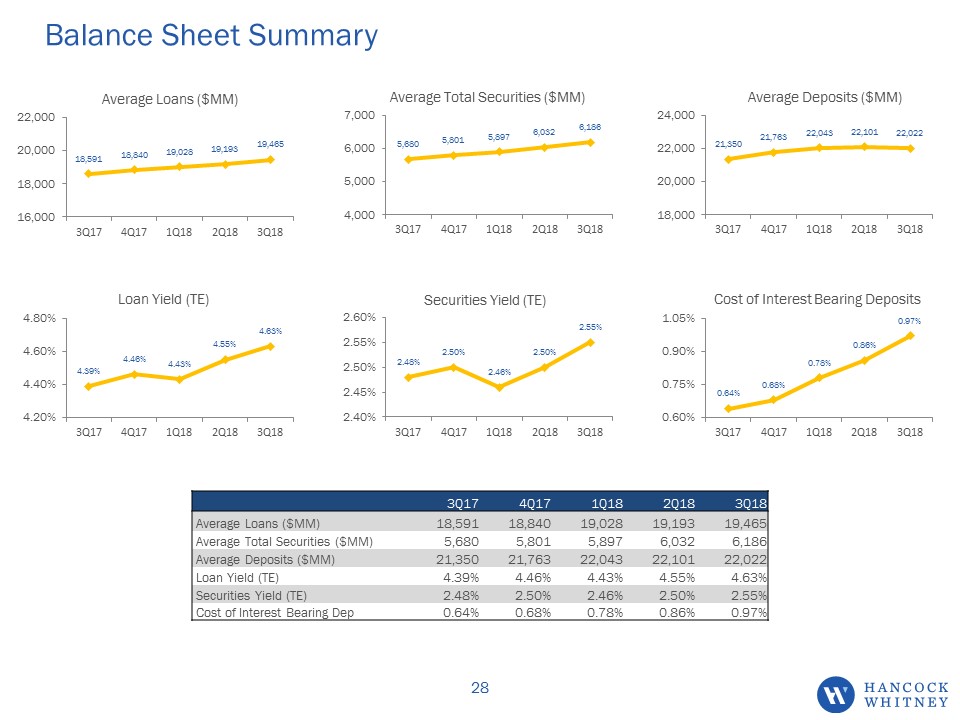
Balance Sheet Summary 28 3Q17 4Q17 1Q18 2Q18 3Q18 Average Loans ($MM) 18,591 18,840 19,028 19,193 19,465 Average Total Securities ($MM) 5,680 5,801 5,897 6,032 6,186 Average Deposits ($MM) 21,350 21,763 22,043 22,101 22,022 Loan Yield (TE) 4.39% 4.46% 4.43% 4.55% 4.63% Securities Yield (TE) 2.48% 2.50% 2.46% 2.50% 2.55% Cost of Interest Bearing Dep 0.64% 0.68% 0.78% 0.86% 0.97%
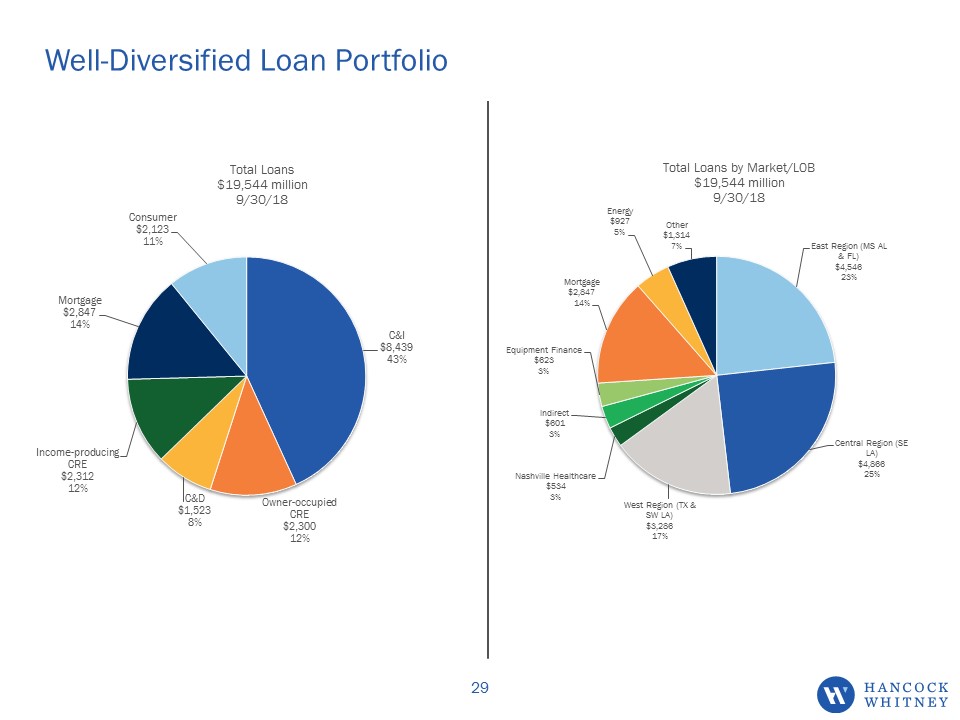
Well-Diversified Loan Portfolio 29
Third Quarter 2018Earnings Conference Call 10/17/2018