Attached files
| file | filename |
|---|---|
| EX-23.1 - EXHIBIT 23.1 - UNITED NATURAL FOODS INC | exhibit231.htm |
| EX-32.2 - EXHIBIT 32.2 - UNITED NATURAL FOODS INC | exhibit32210k.htm |
| EX-32.1 - EXHIBIT 32.1 - UNITED NATURAL FOODS INC | exhibit32110k.htm |
| EX-31.2 - EXHIBIT 31.2 - UNITED NATURAL FOODS INC | exhibit31210k.htm |
| EX-31.1 - EXHIBIT 31.1 - UNITED NATURAL FOODS INC | exhibit31110k.htm |
| EX-21 - EXHIBIT 21 - UNITED NATURAL FOODS INC | exhibit21.htm |
| EX-10.55 - EXHIBIT 10.55 - UNITED NATURAL FOODS INC | exhibit1055ablloanagreement.htm |
| EX-10.54 - EXHIBIT 10.54 - UNITED NATURAL FOODS INC | exhibit10542ndarcommitment.htm |
UNITED STATES
SECURITIES AND EXCHANGE COMMISSION
Washington, D.C. 20549
FORM 10-K
Commission File Number: 001-15723
X | ANNUAL REPORT PURSUANT TO SECTION 13 OR 15(d) OF THE SECURITIES EXCHANGE ACT OF 1934 | |
For the fiscal year ended July 28, 2018 | ||
or | ||
__ | TRANSITION REPORT PURSUANT TO SECTION 13 OR 15(d) OF THE SECURITIES EXCHANGE ACT OF 1934 | |
For the transition period from _______ to _______ | ||

UNITED NATURAL FOODS, INC.
(Exact name of registrant as specified in its charter)
Delaware | 05-0376157 | |
(State or other jurisdiction of incorporation or organization) | (I.R.S. Employer Identification No.) | |
313 Iron Horse Way, Providence, RI 02908 (Address of principal executive offices) (Zip Code) | ||
Registrant's telephone number, including area code: (401) 528-8634 | ||
Securities registered pursuant to Section 12(b) of the Act:
Title of each class | Name of each exchange on which registered | |
Common Stock, par value $0.01 per share | The NASDAQ Stock Market | |
Securities registered pursuant to Section 12(g) of the Act: None
Indicate by check mark if the registrant is a well-known seasoned issuer, as defined in Rule 405 of the Securities Act. Yes X No __
Indicate by check mark if the registrant is not required to file reports pursuant to Section 13 or Section 15(d) of the Act. Yes __ No X
Indicate by check mark whether the registrant (1) has filed all reports required to be filed by Section 13 or 15(d) of the Securities Exchange Act of 1934 during the preceding 12 months (or for such shorter period that the registrant was required to file such reports), and (2) has been subject to such filing requirements for the past 90 days. Yes X No __
Indicate by check mark whether the registrant has submitted electronically, every Interactive Data File required to be submitted pursuant to Rule 405 of Regulation S-T during the preceding 12 months (or for such shorter period that the registrant was required to submit such files). Yes X No __
Indicate by check mark if disclosure of delinquent filers pursuant to Item 405 of Regulation S-K is not contained herein, and will not be contained, to the best of registrant's knowledge, in definitive proxy or information statements incorporated by reference in Part III of this Form 10-K or any amendment to this Form 10-K X
Indicate by check mark whether the registrant is a large accelerated filer, an accelerated filer, a non-accelerated filer, a smaller reporting company, or an emerging growth company. See the definitions of "large accelerated filer," "accelerated filer," "smaller reporting company" and "emerging growth company" in Rule 12b-2 of the Exchange Act.
Large Accelerated Filer X | Accelerated Filer __ | |
Non-accelerated Filer __ | Smaller Reporting Company __ | |
Emerging growth company __ | ||
If an emerging growth company, indicate by check mark if the registrant has elected not to use the extended transition period for complying with any new or revised financial accounting standards provided pursuant to Section 13(a) of the Exchange Act. __ | ||
Indicate by check mark whether the registrant is a shell company (as defined in Rule 12b-2 of the Act). Yes __ No X
The aggregate market value of the common stock held by non-affiliates of the registrant was approximately $2.5 billion based upon the closing price of the registrant's common stock on the Nasdaq Global Select Market® on January 26, 2018. The number of shares of the registrant's common stock, par value $0.01 per share, outstanding as of September 14, 2018 was 50,423,689.
DOCUMENTS INCORPORATED BY REFERENCE
Portions of the registrant's definitive Proxy Statement for the Annual Meeting of Stockholders to be held on December 18, 2018 are incorporated herein by reference into Part III of this Annual Report on Form 10-K.
UNITED NATURAL FOODS, INC.
FORM 10-K
TABLE OF CONTENTS
Section | Page | |||
PART I.
ITEM 1. BUSINESS
Unless otherwise specified, references to "United Natural Foods," "UNFI," "we," "us," "our" or "the Company" in this Annual Report on Form 10-K ("Annual Report" or "Report") mean United Natural Foods, Inc. and all entities included in our consolidated financial statements. See the consolidated financial statements and notes thereto included in "Item 8. Financial Statements and Supplementary Data" of this Report for information regarding our financial performance.
Overview
We are a Delaware corporation based in Providence, Rhode Island, and we conduct business through our various wholly owned subsidiaries. We are a leading distributor based on sales of natural, organic and specialty foods and non-food products in the United States and Canada. We believe that our thirty-three distribution centers, representing approximately 8.8 million square feet of warehouse space, provide us with the largest capacity of any North American-based distributor principally focused on the natural, organic and specialty products industry. The Company has two principal operating divisions: the wholesale division which is comprised of several business units aggregated under the wholesale segment, which is the Company's only reportable segment; and the manufacturing and branded products division.
Since the formation of our predecessor in 1976, we have grown our business both organically and through acquisitions which have expanded our distribution network, product selection and customer base.
Acquisitions
In July 2014, we completed the acquisition of all of the outstanding capital stock of Tony's Fine Foods ("Tony's"), through our wholly-owned subsidiary UNFI West, Inc. ("UNFI West"). With the completion of the transaction, Tony's became a wholly-owned subsidiary and continues to operate as Tony's Fine Foods. Tony's is headquartered in West Sacramento, California and is a leading distributor of perishable food products, including a wide array of specialty protein, cheese, deli, food service and bakery goods to retail and specialty grocers, food service customers and other distribution companies principally located throughout the Western United States, as well as Alaska and Hawaii.
During fiscal 2015, we began shipping customers both center of the store products and an enhanced selection of fresh, perishable products typically located in the perimeter of the store. Our customers utilized both UNFI’s broadline and Tony's perishable offerings, including grocery, refrigerated, protein, specialty cheese and prepared foods. Our customers seek a full spectrum of offerings and we believe that there is significant value in UNFI's position as a leading provider of logistics, distribution and category management for both center store and perimeter products.
In March 2016, the Company acquired certain assets of Global Organic/Specialty Source, Inc. and related affiliates (collectively "Global Organic") through our wholly owned subsidiary Albert's Organics, Inc. ("Albert's"), in a cash transaction for approximately $20.6 million. Global Organic is a distributor of organic fruits, vegetables, juices, milk, eggs, nuts, and coffee located in Sarasota, Florida serving customer locations across the Southeastern United States. Global Organic's operations have been fully integrated into the existing Albert's business in the Southeastern United States.
In March 2016, the Company acquired all of the outstanding equity securities of Nor-Cal Produce, Inc. ("Nor-Cal") and an affiliated entity as well as certain real estate, in a cash transaction for approximately $67.8 million. Nor-Cal is a distributor of conventional and organic produce and other fresh products primarily to independent retailers in Northern California, with primary operations located in West Sacramento, California. Our acquisition of Nor-Cal has aided in our efforts to expand our fresh offering, particularly with conventional produce. Nor-Cal's operations have been combined with the existing Albert's business.
In May 2016, the Company acquired all outstanding equity securities of Haddon House Food Products Inc. ("Haddon") and certain affiliated entities and real estate for total cash consideration of approximately $217.5 million. Haddon is a distributor and merchandiser of natural and organic and gourmet ethnic products throughout the Eastern United States. Haddon has a diverse, multi-channel customer base including supermarkets, gourmet food stores and independent retailers. Our acquisition of Haddon has expanded our gourmet and ethnic product and service offering which we expect to play an important role in our ongoing strategy to build out these product categories. Haddon's operations have been combined with the Company's existing broadline natural, organic and specialty distribution business in the United States.
In August 2016, the Company acquired all of the outstanding equity securities of Gourmet Guru Inc. ("Gourmet Guru") in a cash transaction for approximately $10.0 million. Gourmet Guru is a distributor and merchandiser of fresh and organic food focusing on new and emerging brands. We believe that our acquisition of Gourmet Guru enhances our strength in finding and cultivating
1
emerging fresh and organic brands and further expands our presence in key urban markets. Gourmet Guru's operations have been combined with the Company's existing broadline natural, organic and specialty distribution business in the United States.
The ability to distribute specialty food items (including ethnic, kosher and gourmet products) has accelerated our expansion into a number of high-growth business markets and allowed us to establish immediate market share in the fast-growing specialty foods market. We have now integrated specialty food products and natural and organic specialty non-food items into all of our broadline distribution centers across the United States and Canada. Due to our expansion into specialty foods, over the past several fiscal years we have been awarded new business with a number of supermarkets. We believe our acquisition of Haddon has expanded our capabilities in the specialty category and we have expanded our offerings of specialty products to include those products distributed by Haddon that we did not previously distribute to our customers. We believe that the distribution of these products enhanced our supermarket business channel and that our complementary product lines continue to present opportunities for cross-selling.
On July 25, 2018, the Company entered into an Agreement and Plan of Merger (the "Merger Agreement") pursuant to which we have agreed to acquire all of the outstanding equity securities of SUPERVALU INC. (“SUPERVALU”) for an aggregate purchase price of approximately $2.9 billion (the "Merger"), including the assumption of outstanding debt and liabilities. The transaction has been approved by the boards of directors of both companies and is subject to antitrust approvals, SUPERVALU shareholder approval and other customary closing conditions, and is expected to close in the fourth quarter of calendar year 2018. The proposed acquisition of SUPERVALU is expected to expand the Company’s customer base and exposure across channels, add high-growth perimeter categories such as meat and produce to the Company’s natural and organic products, provide the Company a wider geographic reach and greater scale, and increase efficiencies.
Our Operating Structure
Our operations are generally comprised of two principal operating divisions. These operating divisions are:
• | our wholesale division, which includes: |
◦ | our broadline natural, organic and specialty distribution business in the United States; |
◦ | Tony's, which distributes a wide array of specialty protein, cheese, deli, foodservice and bakery goods, principally throughout the Western United States; |
◦ | Albert's, which distributes organically grown produce and non-produce perishable items within the United States, and includes the operations of Nor-Cal, a distributor of organic and conventional produce and non-produce perishable items principally in Northern California; |
◦ | UNFI Canada, Inc. ("UNFI Canada"), which is our natural, organic and specialty distribution business in Canada; and |
◦ | Select Nutrition, which distributes vitamins, minerals and supplements; and |
• | our manufacturing and branded products division, consisting of: |
◦ | Woodstock Farms Manufacturing, which specializes in importing, roasting, packaging and the distribution of nuts, dried fruit, seeds, trail mixes, granola, natural and organic snack items and confections; and |
◦ | our Blue Marble Brands branded product lines. |
We disposed of our retail business, Earth Origins Market ("Earth Origins"), during fiscal 2018. Beginning in fiscal 2019, the Select Nutrition business will be combined with our broadline operations.
Wholesale Division
In August 2016, we launched an initiative to reorganize our sales structure in the United States. This new structure is regional and our broadline distribution business is now organized into three sales regions— our Atlantic Region, Central Region and Pacific Region. Each region has a president responsible for all our products and services within the territory, including fresh, grocery, wellness, e-commerce, food services, and ethnic gourmet. Territory managers in these regions now sell across our complete lines of products. This change brings us to our customers more frequently with all of our service offerings and we anticipate identifying and taking advantage of sales opportunities that result from our customers having a single point of contact for all of our products and services.
As of our 2018 fiscal year end, our Atlantic Region operated ten distribution centers, our Central Region operated six distribution centers, and our Pacific Region operated twelve distribution centers. Beginning in fiscal 2019, the Company realigned two of its distributions centers previously included in the Atlantic Region to the Pacific Region.
Certain of our distribution centers are shared by multiple operations within our wholesale division.
2
Tony's operates out of four distribution centers located in California and Washington. In addition to the four Tony's facilities, the Company distributes Tony's perishable products from certain of its other broadline distribution centers, including our Aurora, Colorado facility.
Albert's operates out of four distribution centers located throughout the United States.
UNFI Canada distributes natural, organic and specialty products in all of our product categories to all of our customers in Canada. As of our 2018 fiscal year end, UNFI Canada operated four distribution centers.
Through Select Nutrition, we distribute more than 14,000 health and beauty aids, vitamins, minerals and supplements from distribution centers in Pennsylvania and California.
Manufacturing and Branded Products Division
Our subsidiary doing business as Woodstock Farms Manufacturing specializes in importing, roasting, packaging and the distribution of nuts, dried fruit, seeds, trail mixes, granola, natural and organic snack items and confections for our customers and in the Company's branded products. Woodstock Farms Manufacturing sells items manufactured in bulk and through private label packaging arrangements with large health food, supermarket and convenience store chains and independent retailers.
We operate an organic (United States Department of Agriculture ("USDA") and Quality Assurance International ("QAI")) and kosher (Circle K) certified packaging, roasting, and processing facility in New Jersey that is SQF (Safety Quality Food) level 2 certified.
Our Blue Marble Brands portfolio is a collection of 17 organic, non-GMO, clean and specialty food brands representing more than 750 unique retail and food service products sourced from over 30 countries around the globe. Blue Marble Brands defines clean ingredients to be minimally processed foods, using only essential ingredients that contain no artificial colors or flavors. Our Blue Marble Brands products are sold through our wholesale division, third-party distributors and directly to retailers. Our Field Day® brand is primarily sold to customers in our independent channel and is meant to serve as a private label brand for retailers to allow them to compete with supermarket and supernatural chains which often have their own private label store brands.
To maintain our market position and improve our operating efficiencies, we seek to continually:
• | expand our marketing and customer service programs across regions; |
• | expand our national purchasing opportunities; |
• | offer a broader product selection than our competitors; |
• | offer operational excellence with high service levels and a higher percentage of on-time deliveries than our competitors; |
• | centralize general and administrative functions to reduce expenses; |
• | consolidate systems applications among physical locations and regions; |
• | increase our investment in people, facilities, equipment and technology; |
• | integrate administrative and accounting functions; and |
• | reduce the geographic overlap between regions. |
Our continued growth has allowed us to expand our existing facilities and open new facilities in an effort to achieve increasing operating efficiencies.
Our Customers
We serve more than 40,000 customer locations primarily located across the United States and Canada which we classify into four channels:
• | supernatural, which consists of chain accounts that are national in scope and carry greater than 90% natural products, and at this time currently consists solely of Whole Foods Market; |
• | supermarkets, which include accounts that also carry conventional products, and at this time currently include chain accounts, supermarket independents, and gourmet and ethnic specialty stores; |
• | independents, which include single store and chain accounts (excluding supernatural, as defined above), which carry more than 90% natural products and buying clubs of consumer groups joined to buy products; and |
• | other, which includes foodservice, e-commerce and international customers outside of Canada, as well as sales to Amazon.com, Inc. |
We maintain long-standing customer relationships with customers in our supernatural, supermarket and independent channels.
The following were included among our wholesale customers for fiscal 2018:
3
• | Whole Foods Market, the largest supernatural chain in the United States and Canada; and |
• | Other customers, including Natural Grocers, Wegmans, Kroger, Earth Fare, Sprouts Farmers Market, Giant-Carlisle, Stop & Shop, Giant-Landover, Giant Eagle, Hannaford, Harris Teeter, The Fresh Market, Market Basket, Shop-Rite, Publix, Raley's, Lucky's, and Loblaws. |
We have been the primary distributor to Whole Foods Market for more than twenty years. Under the terms of our agreement with Whole Foods Market, we serve as the primary distributor to Whole Foods Market in all of its regions in the United States. Our agreement with Whole Foods Market expires on September 28, 2025. Whole Foods Market is our only customer that represented more than 10% of total net sales in fiscal 2018, and accounted for approximately 37% of our net sales.
During fiscal 2017, our net sales by channel were adjusted to reflect changes in the classification of customer types from acquisitions we consummated in the third and fourth quarters of fiscal 2016 and the first quarter of fiscal 2017. There was no financial statement impact as a result of revising the classification of customer types. The following table lists the percentage of net sales by customer type for the fiscal years ended July 28, 2018, July 29, 2017 and July 30, 2016:
Percentage of Net Sales | |||||||||
Customer Type | 2018 | 2017 | 2016 | ||||||
Supernatural | 37 | % | 33 | % | 35 | % | |||
Supermarkets | 28 | % | 30 | % | 27 | % | |||
Independents | 25 | % | 26 | % | 27 | % | |||
Other | 10 | % | 11 | % | 11 | % | |||
We distribute natural, organic and specialty foods and non-food products to customers located in the United States and Canada, as well as to customers located in other foreign countries. Our total international net sales, including those by UNFI Canada, represented approximately three percent of our net sales in fiscal 2018 and four percent in both fiscal 2017 and fiscal 2016. We believe that our sales outside the United States will expand as we seek to continue to grow our Canadian operations and our foodservice and e-commerce businesses, both of which include customers based outside of the United States.
Our Marketing Services
We offer a variety of marketing services designed to increase sales for our customers and suppliers, including consumer and trade marketing programs, as well as programs to support suppliers in understanding our markets. Trade and consumer marketing programs are supplier-sponsored programs that cater to a broad range of retail formats. These programs are designed to educate consumers, profile suppliers and increase sales for retailers, many of which do not have the resources necessary to conduct such marketing programs independently.
Consumer Marketing Programs
• | Monthly, region-specific, consumer circular programs, with the participating retailers’ imprint featuring products sold by the retailer to its customers. The monthly circular programs are structured to pass through the benefit of our negotiated discounts and advertising allowances to the retailer, and also provide retailers with a physical flyer and shelf tags corresponding to each month's promotions. We also offer a web-based tool which retailers can use to produce highly customized circulars and other marketing materials for their stores called the Customized Marketing Program. |
• | Truck advertising program that allows our suppliers to purchase advertising space on the sides of our hundreds of trailers traveling throughout the United States and Canada, increasing brand exposure to consumers. |
Trade Marketing Programs
• | New item introduction programs showcase a supplier's new items to retailers through trial and discounts. |
• | Customer Portal Advertising that allows our suppliers to advertise directly to retailers using the portal that many retailers use to order product and/or gather product information. |
• | Foodservice options designed to support accounts in that category. |
• | Monthly Specials Catalogs that highlight promotions and new product introductions. |
• | Specialized catalogs for holiday and seasonal products. |
Supplier Marketing Programs
• | ClearVue®, an information sharing program offered to a select group of suppliers designed to improve the transparency of information and drive efficiency within the supply chain. With the availability of in-depth data and tailored reporting tools, participants are able to reduce inventory balances while improving service levels. |
4
• | Supply Chain by ClearVue®, an information sharing program designed to provide heightened transparency to suppliers through demand planning, forecasting and procurement insights. This program offers weekly and monthly reporting enabling suppliers to identify areas of sales growth while pinpointing specific opportunities for achieving greater profits. |
• | Supplier-In-Site (SIS), an information-sharing website that helps our suppliers better understand the independents channel in order to generate mutually beneficial incremental sales in an efficient manner. |
• | Growth incentive programs, supplier-focused high-level sales and marketing support for selected brands, which foster our partnership by building incremental, mutually profitable sales for suppliers and us. |
Periodically, we conduct focus group sessions with certain key retailers and suppliers to ascertain their needs and allow us to better service them. We also provide our customers with:
• | trends reports in the natural and organic industry; |
• | product data information such as best seller lists, store usage reports and catalogs; |
• | assistance with store layout designs; new store design and equipment procurement; |
• | planogramming, shelf and category management support; |
• | in-store signage and promotional materials assistance with planning and setting up product displays; |
• | shelf tags for products; and |
• | a robust customer portal with product information, search and ordering capabilities, reports and publications. |
Our Products
Our extensive selection of natural, organic and specialty foods and non-food products enables us to provide a primary source of supply to a diverse base of customers whose product needs vary significantly. We offer more than 110,000 natural, organic and specialty foods and non-food products, consisting of national, regional and private label brands grouped into six product categories: grocery and general merchandise, produce, perishables and frozen foods, nutritional supplements and sports nutrition, bulk and foodservice products and personal care items. Our branded product lines address certain needs of our customers, including providing a lower-cost label known as Field Day®.
We maintain a comprehensive quality assurance program. All of the products we sell that are represented as "organic" are required to be certified as such by an independent third-party agency. We maintain current certification affidavits on most organic commodities and produce in order to verify the authenticity of the product. Most potential suppliers of organic products are required to provide such third-party certifications to us before they are approved as suppliers.
Organic Certification
Our “Certified Organic Distributor” certification covers all of our broadline distribution centers in the United States, except for facilities acquired in connection with the acquisitions of Tony’s, Haddon, and Nor-Cal. Although not designated as a “Certified Organic Distributor” by QAI, the three Tony’s California locations are certified as Organic by the State of California Department of Public Health Food and Drug Branch, and Nor-Cal is currently registered with the California Department of Food and Agriculture Organic Program as an organic handler. In addition, our Canadian distribution centers in British Columbia and Ontario both hold one of the following organic distributor certifications: QAI, EcoCert Canada or ProCert Canada.
Working Capital
Normal operating fluctuations in working capital balances can result in changes to cash flow from operations presented in our consolidated statements of cash flows that are not necessarily indicative of long-term operating trends. Our working capital needs are generally greater during the months leading up to high sales periods, such as the build up in inventory during the time period leading to the calendar year-end holidays. We typically finance these working capital needs with funds provided by operating activities and available credit through our amended and restated revolving credit facility (the “Existing ABL Facility”) pursuant to our Third Amended and Restated Loan and Security Agreement, dated as of April 29, 2016, by and among the Company, Bank of America, N.A., as administrative agent and the other borrowers, agents and lenders party thereto (the “Existing ABL Loan Agreement”).
Our Suppliers
We purchase our products from more than 9,000 suppliers. The majority of our suppliers are based in the United States and Canada, but we also source products from suppliers throughout Europe, Asia, Central America, South America, Africa and Australia. We believe suppliers of natural and organic products seek to distribute their products through us because we provide access to a large customer base across the United States and Canada, distribute the majority of the suppliers' products and offer a wide variety of marketing programs to our customers to help sell the suppliers' products. Substantially all product categories that we distribute are available from a number of suppliers and, therefore, we are not dependent on any single source of supply for any product
5
category. In addition, although we have exclusive distribution arrangements and support programs with several suppliers, none of our suppliers account for more than 5% of our total purchases in fiscal 2018.
We have positioned ourselves as one of the largest purchasers of organically grown bulk products in the natural and organic products industry by centralizing our purchase of nuts, seeds, grains, flours and dried foods. As a result, we are able to negotiate purchases from suppliers on the basis of volume and other considerations that may include discounted pricing or prompt payment discounts. Furthermore, some of our purchase arrangements include the right of return to the supplier with respect to products that we do not sell in a certain period of time. Each region is responsible for placing its own orders and can select the products that it believes will most appeal to its customers, although each region is able to participate in our company-wide purchasing programs. Our outstanding commitments for the purchase of inventory were approximately $15.9 million as of July 28, 2018.
Our Distribution System
The sites for our distribution centers are chosen to provide direct access to our regional markets. This proximity allows us to reduce our transportation costs relative to those of our competitors that seek to service these customers from locations that are often several hundred miles away. We believe that we incur lower inbound freight expense than our regional competitors because our scale allows us to buy full and partial truckloads of products. Products are delivered to our distribution centers primarily by our fleet of leased trucks, contract carriers and the suppliers themselves. When financially advantageous, we pick up product from suppliers or satellite staging facilities and return it to our distribution centers using our own trucks. Additionally, we generally can redistribute overstocks and inventory imbalances between our distribution centers if needed, which helps to reduce out of stocks and to sell perishable products prior to their expiration date.
The majority of our trucks are leased from a variety of national banks and are maintained by third party national leasing companies such as Ryder Truck Leasing and Penske Truck Leasing, which in some cases maintain facilities on our premises for the maintenance and service of these vehicles as well as facilities where we run our own maintenance shops.
We ship certain orders for supplements or for items that are destined for areas outside of regular delivery routes through United States Postal Service, the United Parcel Service and other independent carriers. Deliveries to areas outside the continental United States and Canada are typically shipped by ocean-going containers on a weekly basis.
Our Focus on Technology
We have made significant investments in distribution, financial, information and warehouse management systems. We continually evaluate and upgrade our management information systems at our regional operations in an effort to make the systems more efficient, cost-effective and responsive to customer needs. These systems include functionality in radio frequency inventory control, pick-to-voice systems, pick-to-light systems, computer-assisted order processing and slot locater/retrieval assignment systems. At most of our receiving docks, warehouse associates attach computer-generated, preprinted locater tags to inbound products. These tags contain the expiration date, locations, quantity, lot number and other information about the products in bar code format. Customer returns are processed by scanning the UPC bar codes. We also employ a management information system that enables us to lower our inbound transportation costs by making optimum use of our own fleet of trucks or by consolidating deliveries into full truckloads. Orders from multiple suppliers and multiple distribution centers are consolidated into single truckloads for efficient use of available vehicle capacity. In addition, we utilize route efficiency software that assists us in developing the most efficient routes for our outbound trucks. As part of our “one company” approach, we are in the process of rolling out a national warehouse management and procurement system to convert our existing facilities into a single warehouse management and supply chain platform ("WMS"). WMS supports our effort to integrate and nationalize processes across the organization and we have successfully implemented the WMS system at fifteen of our facilities. In light of the proposed acquisition of SUPERVALU, we are reevaluating our warehouse management system strategy. However, we continue to be focused on the automation of our new or expanded distribution centers that are at different stages of construction.
Intellectual Property
We do not own or have the right to use any patent, trademark, trade name, license, franchise, or concession, the loss of which would have a material adverse effect on our results of operations or financial condition.
Competition
Our largest competition comes from direct distribution, whereby a customer reaches a product volume level that justifies distribution directly from the manufacturer in order to obtain a lower price. Our major wholesale distribution competitor in both the United States and Canada is KeHE Distributors, LLC ("Kehe"). In addition to its natural and organic products, Kehe distributes specialty food products and markets its own private label program. We also compete in the United States and Canada with numerous smaller regional and local distributors of natural, organic, ethnic, kosher, gourmet and other specialty foods that focus on niche or regional markets, and with national, regional and local distributors of conventional groceries who have significantly expanded their natural
6
and organic product offerings in recent years and companies that distribute to their own retail facilities. Our customers also compete with online retailers and distributors of natural and organic products that seek to sell products directly to customers.
We believe that distributors in the natural and specialty products industries primarily compete on distribution service levels, product quality, depth of inventory selection, price and quality of customer service. We believe that we currently compete effectively with respect to each of these factors.
Government Regulation
Our operations and many of the products that we distribute in the United States are subject to regulation by state and local health departments, the USDA and the United States Food and Drug Administration (the "FDA"), which generally impose standards for product quality and sanitation and are responsible for the administration of bioterrorism legislation. In the United States, our facilities generally are inspected at least once annually by state or federal authorities. For certain product lines, we are also subject to the Federal Meat Inspection Act, the Poultry Products Inspection Act, the Perishable Agricultural Commodities Act, the Packers and Stockyard Act and regulations promulgated by the USDA to interpret and implement these statutory provisions. The USDA imposes standards for product safety, quality and sanitation through the federal meat and poultry inspection program.
The FDA Food Safety Modernization Act ("FSMA"), represents a significant expansion of food safety requirements and FDA food safety authorities and, among other things, requires that the FDA impose comprehensive, prevention-based controls across the food supply chain, further regulates food products imported into the United States, and provides the FDA with mandatory recall authority. The FSMA requires the FDA to undertake numerous rulemakings and to issue numerous guidance documents, as well as reports, plans, standards, notices, and other tasks.
The Surface Transportation Board and the Federal Highway Administration regulate our trucking operations. In addition, interstate motor carrier operations are subject to safety requirements prescribed by the United States Department of Transportation and other relevant federal and state agencies. Such matters as weight and dimension of equipment are also subject to federal and state regulations.
Many of our facilities in the U.S. and in Canada are subject to various environmental protection statutes and regulations, including those relating to the use of water resources and the discharge of wastewater. Further, many of our distribution facilities have ammonia-based refrigeration systems and tanks for the storage of diesel fuel, hydrogen fuel and other petroleum products which are subject to laws regulating such systems and storage tanks. Moreover, in some of our facilities we, or third parties with whom we contract, perform vehicle maintenance. Our policy is to comply with all applicable environmental and safety legal requirements. We are subject to other federal, state, provincial and local provisions relating to the protection of the environment or the discharge of materials; however, these provisions do not materially impact the use or operation of our facilities.
Employees
As of July 28, 2018, we had approximately 10,000 full and part-time employees, 725 of whom (approximately 7.3%) are covered by collective bargaining agreements. The following are the facilities which have collective bargaining agreements and the respective expiration dates of those agreements: Moreno Valley, California (March 2019), Edison, New Jersey (March 2019), Dayville, Connecticut (July 2019), West Sacramento, California (May 2020), Hudson Valley, New York (July 2020), Auburn, Washington (February 2021), Iowa City, Iowa (July 2021) and Concord, Ontario (March 2022). We have in the past been the focus of union-organizing efforts, and we believe it is likely that we will be the focus of similar efforts in the future.
In January 2018, the National Labor Relations Board certified the election results of our driver employees in Gilroy, California to be represented by the Teamsters union. We are in the process of negotiating a collective bargaining agreement with these employees.
Seasonality
Generally, we do not experience any material seasonality. However, our sales and operating results may vary significantly from quarter to quarter due to factors such as changes in our operating expenses, management's ability to execute our operating and growth strategies, personnel changes, demand for our products, supply shortages and general economic conditions.
Available Information
Our internet address is http://www.unfi.com. The contents of our website are not part of this Annual Report, and our internet address is included in this document as an inactive textual reference only. We make our Annual Report, Quarterly Reports on Form 10-Q, Current Reports on Form 8-K and all amendments to those reports filed or furnished pursuant to Section 13(a) or 15(d) of the Securities Exchange Act of 1934, as amended (the "Exchange Act") available free of charge through our website as soon as reasonably practicable after we file such reports with, or furnish such reports to, the Securities and Exchange Commission.
7
ITEM 1A. RISK FACTORS
Our business, financial condition and results of operations are subject to various risks and uncertainties, including those described below and elsewhere in this Annual Report. This section discusses factors that, individually or in the aggregate, we think could cause our actual results to differ materially from expected and historical results. If any of the events described below occurs, our business, financial condition or results of operations could be materially adversely affected and our stock price could decline.
We provide these factors for investors as permitted by the Private Securities Litigation Reform Act of 1995. You should understand that it is not possible to predict or identify all such factors. Consequently, you should not consider the following to be a complete discussion of all potential risks or uncertainties applicable to our business. See "Item 7. Management's Discussion and Analysis of Financial Condition and Results of Operations—Forward-Looking Statements."
We depend heavily on our principal customers and our success is heavily dependent on our principal customers' ability to grow their business.
Whole Foods Market accounted for approximately 37% of our net sales in fiscal 2018. We serve as the primary distributor of natural, organic and specialty non-perishable products, and also distribute certain specialty protein, cheese, deli items and products from health, beauty and supplement categories to Whole Foods Market in all of its regions in the United States under the terms of our distribution agreement which expires on September 28, 2025. Our ability to maintain a close, mutually beneficial relationship with Whole Foods Market, which was acquired by Amazon.com, Inc. in August 2017, is an important element to our continued growth.
The loss or cancellation of business from Whole Foods Market, including from increased self distribution to its own facilities, closures of its stores, reductions in the amount of products that Whole Foods Market sells to its customers, or our failure to comply with the terms of our distribution agreement with Whole Foods Market could materially and adversely affect our business, financial condition or results of operations. Similarly, if Whole Foods Market is not able to grow its business, including as a result of a reduction in the level of discretionary spending by its customers or competition from other retailers or if Whole Foods Market diverts purchases from us beyond minimum amounts it is required to purchase under our distribution agreement, our business, financial condition or results of operations may be materially and adversely affected. Additionally, given the growth acceleration we have experienced in fiscal 2018, if Whole Foods Market were to only purchase the minimum purchase amounts, it would negatively impact our financials results.
In addition to our dependence on Whole Foods Market, we are also dependent upon sales to our supermarket customers. Net sales to these customers accounted for approximately 28% of our total net sales in fiscal 2018. To the extent that customers in this group make decisions to utilize alternative sources of products, whether through other distributors or through self distribution, our business, financial condition or results of operations may be materially and adversely affected.
Our business is a low margin business and our profit margins may decrease due to consolidation in the grocery industry and our focus on sales to the supermarkets channel.
The grocery distribution industry generally is characterized by relatively high volume of sales with relatively low profit margins. The continuing consolidation of retailers in the natural products industry and the growth of supernatural chains may reduce our profit margins in the future as more customers qualify for greater volume discounts, and we experience pricing pressures from suppliers and retailers. Sales to customers within our supernatural and supermarkets channels generate a lower gross margin than do sales to our independents channel customers. Many of these customers, including our largest customer, have agreements with us that include volume discounts. As the amounts these customers purchase from us increase, the price that they pay for the products they purchase is reduced, putting downward pressure on our gross margins on these sales. To compensate for these lower gross margins, we must increase the amount of products we sell or reduce the expenses we incur to service these customers. If we are unable to reduce our expenses as a percentage of net sales, including our expenses related to servicing this lower gross margin business, our business, financial condition or results of operations could be materially and adversely impacted.
We may have difficulty managing our growth.
The growth in the size of our business and operations has placed, and is expected to continue to place, a significant strain on our management. Our future growth may be limited by strong growth by certain of our largest customers or our inability to retain existing customers, make acquisitions, successfully integrate acquired entities or significant new customers, implement information systems initiatives, acquire or timely construct new distribution centers, expand our existing distribution centers, or adequately manage our personnel. Our future growth is limited in part by the size and location of our distribution centers. As we near maximum utilization of a given facility or maximize our processing capacity, operations may be constrained and inefficiencies have been and may be created, which could adversely affect our business, financial condition or results of operations unless the facility is expanded, volume is shifted to another facility or additional processing capacity is added. Conversely, if we add additional facilities, expand existing operations or facilities, or fail to retain existing business, excess capacity may be created. Any excess capacity
8
may also create inefficiencies and adversely affect our business, financial condition or results of operations, including as a result of incurring additional operating costs for these facilities before demand for products to be supplied from these facilities rises to a level sufficient to cover these additional costs. We cannot assure you that we will be able to successfully expand our existing distribution centers or open new distribution centers in new or existing markets if needed to accommodate or facilitate growth. Even if we are able to expand our distribution network, our ability to compete effectively and to manage future growth, if any, will depend on our ability to continue to implement and improve operational, financial and management information systems, including our warehouse management systems, on a timely basis and to expand, train, motivate and manage our work force. We cannot assure you that our existing personnel, systems, procedures and controls will be adequate to support the future growth of our operations. Our inability to manage our growth effectively could have a material adverse effect on our business, financial condition or results of operations.
Our customers generally are not obligated to continue purchasing products from us and larger customers that do have multiyear contracts with us may terminate these contracts early in certain situations or choose not to renew or extend the contract at its expiration.
Many of our customers buy from us under purchase orders, and we generally do not have written agreements with or long-term commitments from these customers for the purchase of products. We cannot assure you that these customers will maintain or increase their sales volumes or orders for the products supplied by us or that we will be able to maintain or add to our existing customer base. Decreases in our volumes or orders for products supplied by us for these customers with whom we do not have a long-term contract may have a material adverse effect on our business, financial condition or results of operations.
We may have contracts with certain of our customers (as is the case with many of our conventional supermarket customers and our supernatural chain customer) that obligate the customer to buy products from us for a particular period of time. Even in this case, the contracts may not require the customer to purchase a minimum amount of products from us or the contracts may afford the customer better pricing in the event that the volume of the customer’s purchases exceeds certain levels. If these customers were to terminate these contracts prior to their scheduled termination, or if we or the customer elected not to renew or extend the term of the contract at its expiration at historical purchase levels, it may have a material adverse effect on our business, financial condition or results of operations, including additional operational expenses to transition out of the business or to adjust our staffing levels to account for the reduction in net sales.
Our operating results are subject to significant fluctuations.
Our operating results may vary significantly from period to period due to:
• | demand for our products, including fluctuations as a result of calendar year-end holidays; |
• | changes in our operating expenses, including fuel and insurance expenses; |
• | management's ability to execute our business and growth strategies; |
• | changes in customer preferences, including levels of enthusiasm for health, fitness and environmental issues; |
• | public perception of the benefits of natural and organic products when compared to similar conventional products; |
• | fluctuation of natural product prices due to competitive pressures; |
• | the addition or loss of significant customers; |
• | personnel changes; |
• | general economic conditions, including inflation; |
• | supply shortages, including a lack of an adequate supply of high-quality livestock or agricultural products due to poor growing conditions, water shortages, natural disasters or otherwise; |
• | volatility in prices of high-quality livestock or agricultural products resulting from poor growing conditions, water shortages, weather, natural disasters or otherwise; |
• | contractual adjustments, disputes, or modifications with our suppliers or customers; |
• | shortage of qualified labor which could potentially increase labor costs, reduce profitability or decrease our ability to effectively serve customers; and |
• | future acquisitions, particularly in periods immediately following the consummation of such acquisition transactions while the operations of the acquired businesses are being integrated into our operations. |
Due to the foregoing factors, we believe that period-to-period comparisons of our operating results may not necessarily be meaningful and that such comparisons cannot be relied upon as indicators of future performance.
9
We have significant competition from a variety of sources.
We operate in competitive markets and our future success will be largely dependent on our ability to provide quality products and services at competitive prices. Bidding for contracts or arrangements with customers, particularly within the supernatural and supermarkets channels, is highly competitive and we may market our services to a particular customer over a long period of time before we are invited to bid. Our competition comes from a variety of sources, including other distributors of natural products as well as specialty grocery and mass market grocery distributors and retail customers that have their own distribution channels. Mass market grocery distributors in recent years have increased their emphasis on natural and organic products and are now competing more directly with us. In addition, many supermarket chains have increased self-distribution of particular items that we sell or have increased their purchases of particular items that we sell directly from suppliers. New competitors are also entering our markets as barriers to entry for new competitors are relatively low. For instance, more natural and organic products are being sold in convenience stores and other mass market retailers than was the case a few years ago and many of these customers are being serviced by conventional distributors or are self-distributing. Some of the mass market grocery distributors with whom we compete may have been in business longer than we have, may have substantially greater financial and other resources than we have and may be better established in their markets. We also face indirect competition as a result of the fact that our customers with physical locations face competition from online retailers and distributors that seek to sell certain of the type of products we sell to our customers directly to consumers. We cannot assure you that our current or potential competitors will not provide products or services comparable or superior to those provided by us or adapt more quickly than we do to evolving industry trends or changing market requirements. It is also possible that alliances among competitors may develop and that competitors may rapidly acquire significant market share or that certain of our customers will increase distribution to their own retail facilities. Increased competition may result in price reductions, reduced gross margins, lost business and loss of market share, any of which could materially and adversely affect our business, financial condition or results of operations.
We cannot provide assurance that we will be able to compete effectively against current and future competitors.
We may not realize the anticipated benefits from our acquisitions, including, in particular, our proposed acquisition of SUPERVALU.
We cannot assure you that our prior acquisitions or our proposed acquisition of SUPERVALU or any future acquisitions will enhance our financial performance. Our ability to achieve the expected benefits of these acquisitions will depend on, among other things, our ability to effectively translate our business strategies into a new set of products, our ability to retain and assimilate the acquired businesses' employees, our ability to retain customers and suppliers on terms similar to those in place with the acquired businesses, our ability to expand the products we offer in many of our markets to include the products distributed by these businesses, our ability to expand into new markets to include markets of the acquired business, the adequacy of our implementation plans, our ability to maintain our financial and internal controls and systems as we expand our operations, the ability of our management to oversee and operate effectively the combined operations and our ability to achieve desired operating efficiencies and sales goals. The integration of the businesses that we acquired might also cause us to incur unforeseen costs, which would lower our future earnings and would prevent us from realizing the expected benefits of these acquisitions. Failure to achieve these anticipated benefits could result in decreases in the amount of expected revenues and diversion of management’s time and energy and could materially and adversely impact our business, financial condition and operating results including, ultimately, a reduction in our stock price.
Our investment in information technology may not result in the anticipated benefits.
In our attempt to reduce operating expenses and increase operating efficiencies, we have invested in the development and implementation of new information technology. We are in the process of rolling out a national warehouse management and procurement system to convert our existing facilities into a single warehouse management and supply chain platform and have completed conversions at fifteen of our facilities. In light of the proposed acquisition of SUPERVALU, we are reevaluating our warehouse management system strategy. However, we currently plan to remain focused on the automation of our new or expanded distribution centers that are at different stages of construction. We may not be able to implement these technological changes in the time frame that we have planned and delays in implementation could negatively impact our business, financial condition or results of operations. In addition, the costs to make these changes may exceed our estimates and will exceed the benefits during the early stages of implementation. Even if we are able to implement the changes in accordance with our current plans, and within our current cost estimates, we may not be able to achieve the expected efficiencies and cost savings from this investment, which could have a material adverse effect on our business, financial condition or results of operations. Moreover, as we implement information technology enhancements, disruptions in our business may be created (including disruption with our customers) which may have a material adverse effect on our business, financial condition or results of operations.
Our business strategy of increasing our sales of fresh, perishable items, which we accelerated with our acquisitions of Tony’s, Global Organic and Nor-Cal, may not produce the results that we expect.
10
A key element of our current growth strategy is to increase the amount of fresh, perishable products that we distribute. We believe that the ability to distribute these products that are typically found in the perimeter of our customers’ stores, in addition to the products we have historically distributed, will differentiate us from our competitors and increase demand for our products. We accelerated this strategy with our acquisitions of Tony’s, Global Organic and Nor-Cal. If we are unable to grow this portion of our business and manage that growth effectively, our business, financial condition and results of operations may be materially and adversely affected.
Failure by us to develop and operate a reliable technology platform could negatively impact our business.
Our ability to decrease costs and increase profits, as well as our ability to serve customers most effectively, depends on the reliability of our technology platform. We use software and other technology systems, among other things, to generate and select orders, to load and route trucks and to monitor and manage our business on a day-to-day basis. Failure to have adequate computer systems across the enterprise and any disruption to these computer systems could adversely impact our customer service, decrease the volume of our business and result in increased costs negatively affecting our business, financial condition or results of operations.
We have experienced losses due to the uncollectability of accounts receivable in the past and could experience increases in such losses in the future if our customers are unable to timely pay their debts to us.
Certain of our customers have from time to time experienced bankruptcy, insolvency and/or an inability to pay their debts to us as they come due. If our customers suffer significant financial difficulty, they may be unable to pay their debts to us timely or at all, which could have a material adverse effect on our business, financial condition or results of operations. It is possible that customers may reject their contractual obligations to us under bankruptcy laws or otherwise. Significant customer bankruptcies could further adversely affect our revenues and increase our operating expenses by requiring larger provisions for bad debt. In addition, even when our contracts with these customers are not rejected, if customers are unable to meet their obligations on a timely basis, it could adversely affect our ability to collect receivables. Further, we may have to negotiate significant discounts and/or extended financing terms with these customers in such a situation, each of which could have a material adverse effect on our business, financial condition or results of operations. During periods of economic weakness, small to medium-sized businesses, like many of our independents channel customers, may be impacted more severely and more quickly than larger businesses. Similarly, these smaller businesses may be more likely to be more severely impacted by events outside of their control, like significant weather events. Consequently, the ability of such businesses to repay their obligations to us may deteriorate, and in some cases this deterioration may occur quickly, which could materially and adversely impact our business, financial condition or results of operations.
Our acquisition strategy may adversely affect our business.
A portion of our past growth has been achieved through acquisitions of, or mergers with, other distributors of natural, organic and specialty products. We also continually evaluate opportunities to acquire other companies. We believe that there are risks related to acquiring companies, including an inability to successfully identify suitable acquisition candidates or consummate such potential acquisitions. To the extent that our future growth includes acquisitions, we cannot assure you that we will not overpay for acquisitions, lose key employees of acquired companies, or fail to achieve potential synergies or expansion into new markets as a result of our acquisitions. Therefore, future acquisitions, if any, may have a material adverse effect on our business, financial condition or results of operations, particularly in periods immediately following the consummation of those transactions while the operations of the acquired business are being integrated with our operations. Achieving the benefits of acquisitions depends on timely, efficient and successful execution of a number of post-acquisition events, including, among other things:
• | maintaining the customer and supplier base; |
• | optimizing delivery routes; |
• | coordinating administrative, distribution and finance functions; and |
• | integrating management information systems and personnel. |
The integration process could divert the attention of management. Any difficulties or problems encountered in the transition process could have a material adverse effect on our business, financial condition or results of operations. In particular, the integration process may temporarily redirect resources previously focused on reducing product cost and operating expenses, resulting in lower gross profits in relation to sales. In addition, the process of combining companies could cause the interruption of, or a loss of momentum and operating profits in, the activities of the respective businesses, which could have an adverse effect on their combined operations.
In connection with acquisitions of businesses in the future, if any, we may decide to consolidate the operations of any acquired businesses with our existing operations or make other changes with respect to the acquired businesses, which could result in special charges or other expenses. Our results of operations also may be adversely affected by expenses we incur in making acquisitions, by amortization of acquisition-related intangible assets with definite lives and by additional depreciation and amortization attributable to acquired assets. Any of the businesses we acquire may also have liabilities or adverse operating issues, including
11
some that we fail to discover before the acquisition, and our indemnity for such liabilities may also be limited. Additionally, our ability to make any future acquisitions may depend upon obtaining additional financing. We may not be able to obtain additional financing on acceptable terms or at all. To the extent that we seek to acquire other businesses in exchange for our common stock, fluctuations in our stock price could have a material adverse effect on our ability to complete acquisitions.
Impairment charges for goodwill or other long-lived assets could adversely affect the Company’s financial condition and results of operations.
We monitor the recoverability of our long-lived assets, such as buildings and equipment, and evaluate their carrying value for impairment whenever events or changes in circumstances indicate that the carrying amount of such assets may not be fully recoverable. We annually review goodwill to determine if impairment has occurred. Additionally, interim reviews are performed whenever events or changes in circumstances indicate that impairment may have occurred. If the testing performed indicates that impairment has occurred, we are required to record a non-cash impairment charge for the difference between the carrying value and fair value of the long-lived assets or the carrying value and fair value of the reporting unit, in the period the determination is made. The testing of long-lived assets and goodwill for impairment requires us to make estimates that are subject to significant assumptions about our future revenue, profitability, cash flows, fair value of assets and liabilities, weighted average cost of capital, as well as other assumptions. Changes in these estimates, or changes in actual performance compared with these estimates, may affect the fair value of long-lived assets or reporting unit, which may result in an impairment charge.
We cannot accurately predict the amount or timing of any impairment of assets. Should the value of long-lived assets or goodwill become impaired, our financial condition and results of operations may be adversely affected.
Our operations are sensitive to economic downturns.
The grocery industry is sensitive to national and regional economic conditions and the demand for the products that we distribute, particularly our specialty products, may be adversely affected from time to time by economic downturns that impact consumer spending, including discretionary spending. Future economic conditions such as employment levels, business conditions, housing starts, interest rates, inflation rates, energy and fuel costs and tax rates could reduce consumer spending or change consumer purchasing habits. Among these changes could be a reduction in the number of natural and organic products that consumers purchase where there are non-organic, which we refer to as conventional, alternatives, given that many natural and organic products, and particularly natural and organic foods, often have higher retail prices than do their conventional counterparts.
Our business may be sensitive to inflationary and deflationary pressures.
Many of our sales are at prices that are based on our product cost plus a percentage markup. As a result, volatile food costs have a direct impact upon our profitability. Prolonged periods of product cost inflation and periods of rapidly increasing inflation may have a negative impact on our profit margins and results of operations to the extent that we are unable to pass on all or a portion of such product cost increases to our customers. In addition, product cost inflation may negatively impact the consumer discretionary spending trends of our customers' customers, which could adversely affect our sales. Conversely, because many of our sales are at prices that are based upon product cost plus a percentage markup, our profit levels may be negatively impacted during periods of product cost deflation even though our gross profit as a percentage of net sales may remain relatively constant. To compensate for lower gross margins, we, in turn, must reduce expenses that we incur to service our customers. If we are unable to reduce our expenses as a percentage of net sales, our business, financial condition or results of operations could be materially and adversely impacted.
Product liability claims could have an adverse effect on our business.
We face an inherent risk of exposure to product liability claims if the products we manufacture or sell cause injury or illness. In addition, meat, seafood, cheese, poultry and other products that we distribute could be subject to recall because they are, or are alleged to be, contaminated, spoiled or inappropriately labeled. Our meat and poultry products may be subject to contamination by disease-producing organisms, or pathogens, such as Listeria monocytogenes, Salmonella and generic E.coli. These pathogens are generally found in the environment, and as a result, there is a risk that they, as a result of food processing, could be present in the meat and poultry products we distribute. These pathogens can also be introduced as a result of improper handling at the consumer level. These risks may be controlled, although not eliminated, by adherence to good manufacturing practices and finished product testing. We have little, if any, control over proper handling before we receive the product or once the product has been shipped to our customers. We may be subject to liability, which could be substantial, because of actual or alleged contamination in products manufactured or sold by us, including products sold by companies before we acquired them. In addition, if we were to manufacture or distribute foods that are or are perceived to be contaminated, any resulting product recalls could have an adverse effect on our business, financial condition, or results of operations. We have, and the companies we have acquired have had, liability insurance with respect to product liability claims. This insurance may not continue to be available at a reasonable cost or at all, and may not be adequate to cover product liability claims against us or against companies we have acquired. We generally
12
seek contractual indemnification from manufacturers, but any such indemnification is limited, as a practical matter, to the creditworthiness of the indemnifying party. If we or any of our acquired companies do not have adequate insurance or contractual indemnification available, product liability claims and costs associated with product recalls, including a loss of business, could have a material adverse effect on our business, financial condition or results of operations.
Changes in consumer eating habits could materially and adversely affect our business, financial condition, or results of operations.
Changes in consumer eating habits away from natural, organic or specialty products could reduce demand for our products. Consumer eating habits could be affected by a number of factors, including changes in attitudes regarding benefits of natural and organic products when compared to similar conventional products or new information regarding the health effects of consuming certain foods. Although there is a growing consumer preference for sustainable, organic and locally grown products, there can be no assurance that such trend will continue. Changing consumer eating habits also occur due to generational shifts. Millennials, the largest demographic group in the U.S. in terms of spend, seek new and different as well as more ethnic menu options and menu innovation, however there can be no assurance that such trend will continue. If consumer eating habits change significantly, we may be required to modify or discontinue sales of certain items in our product portfolio, and we may experience higher costs associated with the implementation of those changes. Additionally if we are not able to effectively respond to changes in consumer perceptions or adapt our product offerings to trends in eating habits, our business, financial condition or results of operations could suffer.
Increased fuel costs may adversely affect our results of operations.
Increased fuel costs may have a negative impact on our results of operations. The high cost of diesel fuel can increase the price we pay for products as well as the costs we incur to deliver products to our customers. These factors, in turn, may negatively impact our net sales, margins, operating expenses and operating results. To manage this risk, we have in the past periodically entered, and may in the future periodically enter, into heating oil derivative contracts to hedge a portion of our projected diesel fuel requirements. Heating crude oil prices have a highly correlated relationship to diesel fuel prices, making these derivatives effective in offsetting changes in the cost of diesel fuel. We are not party to any commodity swap agreements and, as a result, our exposure to volatility in the price of diesel fuel has increased relative to our exposure to volatility in prior periods in which we had outstanding heating oil derivative contracts. We do not enter into fuel hedge contracts for speculative purposes. We have in the past, and may in the future, periodically enter into forward purchase commitments for a portion of our projected monthly diesel fuel requirements at fixed prices. As of July 28, 2018, we had no forward diesel fuel commitments. We also maintain a fuel surcharge program which allows us to pass some of our higher fuel costs through to our customers. We cannot guarantee that we will continue to be able to pass a comparable proportion or any of our higher fuel costs to our customers in the future, which may adversely affect our business, financial condition or results of operations.
Disruption of our distribution network or to the operations of our customers could adversely affect our business.
Damage or disruption to our distribution capabilities due to weather, natural disaster, fire, terrorism, pandemic, strikes, the financial and/or operational instability of key suppliers, or other reasons could impair our ability to distribute our products. To the extent that we are unable, or it is not financially feasible, to mitigate the likelihood or potential impact of such events, or to manage effectively such events if they occur, there could be an adverse effect on our business, financial condition or results of operations.
In addition, such disruptions may reduce the number of consumers who visit our customers’ facilities in any affected areas. Furthermore, such disruption may interrupt or impede access to our customers’ facilities, all of which could have a material adverse effect on our business, financial condition, or results of operations.
The cost of the capital available to us and limitations on our ability to access additional capital may have a material adverse effect on our business, financial condition or results of operations.
Historically, acquisitions and capital expenditures have been a large component of our growth. We anticipate that acquisitions and capital expenditures will continue to be important to our growth in the future. As a result, increases in the cost of capital available to us, which could result from us not being in compliance with fixed charge coverage ratio covenants or other restrictive covenants under our debt agreements, including our Existing ABL Loan Agreement, our Existing Term Loan Agreement (as defined below) and the debt agreements we expect to enter into in connection with the SUPERVALU acquisition, or our inability to access additional capital to finance acquisitions and capital expenditures through borrowed funds could restrict our ability to grow our business organically or through acquisitions, which could have a material adverse effect on our business, financial condition or results of operations.
In addition, our profit margins depend on strategic investment buying initiatives, such as discounted bulk purchases, which require spending significant amounts of working capital up-front to purchase products that we then sell over a multi-month time period. Therefore, increases in the cost of capital available to us or our inability to access additional capital through borrowed funds could
13
restrict our ability to engage in strategic investment buying initiatives, which could reduce our profit margins and have a material adverse effect on our business, financial condition or results of operations.
We expect to substantially increase our level of debt in connection with the proposed acquisition of SUPERVALU which will make us more sensitive to the effects of economic downturns and could adversely affect our business.
In order to finance the proposed acquisition of SUPERVALU, we expect to incur up to $3.50 billion of additional indebtedness, including indebtedness to be incurred to refinance SUPERVALU's existing debt. This increase in our leverage, and any further increase, could have important potential consequences, including, but not limited to:
• | increasing our vulnerability to, and reducing our flexibility to plan for and respond to, general adverse economic and industry conditions and changes in our business and the competitive environment; |
• | requiring the dedication of a substantial portion of our cash flow from operations to the payment of principal of, and interest on, indebtedness, thereby reducing the availability of such cash flow to fund working capital, capital expenditures, acquisitions, share repurchases or other corporate purposes; |
• | increasing our vulnerability to a downgrade of our credit rating, which could adversely affect our cost of funds, liquidity and access to capital markets; |
• | restricting us from making strategic acquisitions or causing us to make non-strategic divestitures; |
• | increasing our exposure to the risk of increased interest rates insofar as current and future borrowings are subject to variable rates of interest; |
• | making it more difficult for us to repay, refinance or satisfy our obligations with respect to our debt; |
• | limiting our ability to borrow additional funds in the future and increasing the cost of any such borrowing; |
• | placing us at a competitive disadvantage compared to competitors with less leverage or better access to capital resources, and |
• | imposing restrictive covenants on our operations, which, if not complied with, could result in an event of default, which in turn, if not cured or waived, could result in the acceleration of the applicable debt, and may result in the acceleration of any other debt to which a cross-acceleration or cross-default provision applies. |
There is no assurance that we will generate cash flow from operations or that future debt or equity financings will be available to us to enable us to pay our indebtedness or to fund other needs. As a result, we may need to refinance all or a portion of our indebtedness on or before maturity. There is no assurance that we will be able to refinance any of our indebtedness on favorable terms, or at all. Any inability to generate sufficient cash flow or refinance our indebtedness on favorable terms could have a material adverse effect on our business, financial condition or results of operations.
Our debt agreements contain restrictive covenants that may limit our operating flexibility.
Our debt agreements, including our Existing ABL Loan Agreement and our Existing Term Loan Agreement (as defined below) contain, and the debt agreements we expect to enter into in connection with the SUPERVALU acquisition will contain, financial covenants and other restrictions that limit our operating flexibility, limit our flexibility in planning for or reacting to changes in our business. These restrictions may prevent us from taking actions that we believe would be in the best interest of our business, and may make it difficult for us to successfully execute our business strategy or effectively compete with companies that are not similarly restricted.
In addition, our Existing ABL Loan Agreement and Existing Term Loan Agreement each require, and the debt agreements we expect to enter into in connection with the SUPERVALU acquisition will require, that we comply with various financial tests and impose certain restrictions on us, including among other things, restrictions on our ability to incur additional indebtedness, create liens on assets, make loans or investments or pay dividends. Failure to comply with these covenants could have a material adverse effect on our business, financial condition or results of operations.
Conditions beyond our control can interrupt our supplies and alter our product costs.
The majority of our suppliers are based in the United States and Canada, but we also source products from suppliers throughout Europe, Asia, Central America, South America, Africa and Australia. For the most part, we do not have long-term contracts with our suppliers committing them to provide products to us. Although our purchasing volume can provide benefits when dealing with suppliers, suppliers may not provide the products needed by us in the quantities and at the prices requested. We are also subject to delays caused by interruption in production and increases in product costs based on conditions outside of our control. These conditions include work slowdowns, work interruptions, strikes or other job actions by employees of suppliers, short-term weather conditions or more prolonged climate change, crop conditions, product recalls, water shortages, transportation interruptions, unavailability of fuel or increases in fuel costs, competitive demands, raw material shortages and natural disasters or other catastrophic events (including, but not limited to food-borne illnesses). As demand for natural and organic products has increased and the distribution channels into which these products are sold have expanded, we have continued to experience higher levels of
14
manufacturer out-of-stocks. These shortages have caused us to incur higher operating expenses due to the cost of moving products around and between our distribution facilities in order to keep our service level high. We cannot be sure when this trend will end or whether it will recur during future years. As the consumer demand for natural and organic products has increased, certain retailers and other producers have entered the market and attempted to buy certain raw materials directly, limiting their availability to be used in certain supplier products. Further, increased frequency or duration of extreme weather conditions could also impair production capabilities, disrupt our supply chain or impact demand for our products, including the specialty protein and cheese products sold by Tony's. For example, until the last two years, weather patterns had resulted in lower than normal levels of precipitation in key agricultural states such as California, impacting the price of water and corresponding prices of food products grown in states facing drought conditions. The impact of sustained droughts is uncertain and could result in volatile input costs. Input costs could increase at any point in time for a large portion of the products that we sell for a prolonged period. Conversely, in years where rainfall levels are abundant product costs, particularly in our perishable and produce businesses, may decline and the results of this product cost deflation could negatively impact our results of operations. Our inability to obtain adequate products as a result of any of the foregoing factors or otherwise could prevent us from fulfilling our obligations to customers, and customers may turn to other distributors. In that case, our business, financial condition or results of operations could be materially and adversely affected.
Changes in relationships with our suppliers may adversely affect our profitability.
We cooperatively engage in a variety of promotional programs with our suppliers. We manage these programs to maintain or improve our margins and increase sales. A reduction or change in promotional spending by our suppliers (including as a result of increased demand for natural and organic products) could have a significant impact on our profitability. We depend heavily on our ability to purchase merchandise in sufficient quantities at competitive prices. We have no assurances of continued supply, pricing, or access to new products and any supplier could at any time change the terms upon which it sells to us or discontinue selling to us.
We are subject to significant governmental regulation.
Our business is highly regulated at the federal, state and local levels and our products and distribution operations require various licenses, permits and approvals. In particular:
• | the products that we distribute in the United States are subject to inspection by the FDA; |
• | our warehouse and distribution centers are subject to inspection by the USDA and state health authorities; and |
• | the United States Department of Transportation and the United States Federal Highway Administration regulate our United States trucking operations. |
Our Canadian operations are similarly subject to extensive regulation, including the English and French dual labeling requirements applicable to products that we distribute in Canada. The loss or revocation of any existing licenses, permits or approvals or the failure to obtain any additional licenses, permits or approvals in new jurisdictions where we intend to do business could have a material adverse effect on our business, financial condition or results of operations. In addition, as a distributor and manufacturer of natural, organic, and specialty foods, we are subject to increasing governmental scrutiny of and public awareness regarding food safety and the sale, packaging and marketing of natural and organic products. Compliance with these laws may impose a significant burden on our operations. Additionally, concern over climate change, including the impact of global warming, has led to significant United States and international legislative and regulatory efforts to limit greenhouse gas emissions. Increased regulation regarding greenhouse gas emissions, especially diesel engine emissions, could impose substantial costs on us. These costs include an increase in the cost of the fuel and other energy we purchase and capital costs associated with updating or replacing our vehicles prematurely. Until the timing, scope and extent of such regulation becomes known, we cannot predict its effect on our results of operations. It is reasonably possible, however, that it could impose material costs on us which we may be unable to pass on to our customers.
The failure to comply with applicable regulatory requirements, including those referred to above and in Item 1. Business—Government Regulation, could result in, among other things, administrative, civil, or criminal penalties or fines, mandatory or voluntary product recalls, warning or other letters, cease and desist orders against operations that are not in compliance, closure of facilities or operations, the loss, revocation, or modification of any existing licenses, permits, registrations, or approvals, or the failure to obtain additional licenses, permits, registrations, or approvals in new jurisdictions where we intend to do business, any of which could have a material adverse effect on our business, financial condition, or results of operations. These laws and regulations may change in the future and we may incur material costs in our efforts to comply with current or future laws and regulations or due to any required product recalls.
In addition, if we fail to comply with applicable laws and regulations or encounter disagreements with respect to our contracts subject to governmental regulations, including those referred to above, we may be subject to investigations, criminal sanctions or civil remedies, including fines, injunctions, prohibitions on exporting, seizures, or debarments from contracting with the U.S. or
15
Canadian governments. The cost of compliance or the consequences of non-compliance, including debarments, could have a material adverse effect on our business, financial condition or results of operations. In addition, governmental units may make changes in the regulatory frameworks within which we operate that may require either the corporation as a whole or individual businesses to incur substantial increases in costs in order to comply with such laws and regulations.
A cybersecurity incident and other technology disruptions could negatively impact our business and our relationships with customers.
We use computers in substantially all aspects of our business operations. We also use mobile devices, social networking and other online activities to connect with our employees, suppliers, business partners and our customers. Such uses give rise to cybersecurity risks, including security breach, espionage, system disruption, theft and inadvertent release of information. Our business involves the storage and transmission of numerous classes of sensitive and/or confidential information and intellectual property, including customers’ and suppliers' personal information, private information about employees, and financial and strategic information about the Company and its business partners. Further, as we pursue our strategy to grow through acquisitions and to pursue new initiatives that improve our operations and cost structure, we are also expanding and improving our information technologies, resulting in a larger technological presence and corresponding exposure to cybersecurity risk. If we fail to assess and identify cybersecurity risks associated with acquisitions and new initiatives, we may become increasingly vulnerable to such risks. Additionally, while we have implemented measures to prevent security breaches and cyber incidents, our preventative measures and incident response efforts may not be entirely effective. The theft, destruction, loss, misappropriation, or release of sensitive and/or confidential information or intellectual property, or interference with our information technology systems or the technology systems of third parties on which we rely, could result in business disruption, negative publicity, brand damage, violation of privacy laws, loss of customers, potential liability and competitive disadvantage all of which could have a material adverse effect on our business, financial condition or results of operations.
We face risks related to labor relations.
As of July 28, 2018, approximately 7.3% of our employees were covered by collective bargaining agreements which expire between March 2019 and March 2022. See "Item 1. Business—Employees" for further detail. If we are not able to renew these agreements or are required to make significant changes to these agreements, our relationship with these employees may become fractured, work stoppages could occur or we may incur additional expenses which could have a material adverse effect on our business, financial condition, or results of operations. We have in the past been the focus of union-organizing efforts, and we believe it is likely that we will be the focus of similar efforts in the future.
As we increase our employee base and broaden our distribution operations to new geographic markets, our increased visibility could result in increased or expanded union-organizing efforts. In the event we are unable to negotiate contract renewals with our union associates, we could be subject to work stoppages. In that event, it would be necessary for us to hire replacement workers to continue to meet our obligations to our customers. The costs to hire replacement workers and employ effective security measures could negatively impact the profitability of any affected facility. Depending on the length of time that we are required to employ replacement workers and security measures these costs could be significant and could have a material adverse effect on our business, financial condition or results of operations.
In January 2018, the National Labor Relations Board certified the election results of our driver employees in Gilroy, California to be represented by the Teamsters union. We are in the process of negotiating a collective bargaining agreement with these employees. The terms of this agreement could cause our expenses at this facility to increase, negatively impacting the results of operations at this facility.
We may fail to establish sufficient insurance reserves and adequately estimate for future workers' compensation and automobile liabilities.
We are primarily self-insured for workers' compensation and general and automobile liability insurance. We believe that our workers' compensation and automobile insurance coverage is customary for businesses of our size and type. However, there are types of losses we may incur that cannot be insured against or that we believe are not commercially reasonable to insure. These losses, should they occur, could have a material adverse effect on our business, financial condition or results of operations. In addition, the cost of workers' compensation insurance and automobile insurance fluctuates based upon our historical trends, market conditions and availability.
Any projection of losses concerning workers' compensation and automobile insurance is subject to a considerable degree of variability. Among the causes of this variability are unpredictable external factors affecting litigation trends, benefit level changes and claim settlement patterns. If actual losses incurred are greater than those anticipated, our reserves may be insufficient and additional costs could be recorded in our consolidated financial statements. If we suffer a substantial loss that is not covered by
16
our self-insurance reserves, the loss and attendant expenses could harm our business, financial condition or results of operations. We have purchased stop loss coverage from third parties, which limits our exposure above the amounts we have self-insured.
Adverse judgments or settlements resulting from legal proceedings in which we may be involved in the normal course of our business could reduce our profits or limit our ability to operate our business.
In the normal course of our business, we are involved in various legal proceedings. The outcome of these proceedings cannot be predicted. If any of these proceedings were to be determined adversely to us or a settlement involving a payment of a material sum of money were to occur, it could materially and adversely affect our results of operations or ability to operate our business. Additionally, we could become the subject of future claims by third parties, including our employees, our investors, or regulators. Any significant adverse judgments or settlements would reduce our profits and could limit our ability to operate our business. Further, we may incur costs related to claims for which we have appropriate third-party indemnity, but such third parties fail to fulfill their contractual obligations.
ITEM 1B. UNRESOLVED STAFF COMMENTS
None.
ITEM 2. PROPERTIES
We maintained thirty-three distribution centers at July 28, 2018 which were utilized by our wholesale segment. These facilities, including offsite storage space, consisted of an aggregate of approximately 8.8 million square feet of storage space, which we believe represents the largest capacity of any distributor within the United States that is principally engaged in the distribution of natural, organic and specialty products.
Set forth below for each of our distribution centers is its location and the expiration of leases as of July 28, 2018 for those distribution centers that we do not own.
17
Location | Square Footage (Approximate in thousands) | Lease Expiration | |||
Atlanta, Georgia* | 304 | Owned | |||
Auburn, California* | 126 | Owned | |||
Auburn, Washington | 323 | August 2019 | |||
Aurora, Colorado | 483 | October 2033 | |||
Burnaby, British Columbia | 41 | December 2022 | |||
Charlotte, North Carolina | 43 | September 2019 | |||
Chesterfield, New Hampshire* | 272 | Owned | |||
Dayville, Connecticut* | 292 | Owned | |||
Gilroy, California | 411 | Owned | |||
Greenwood, Indiana* | 293 | Owned | |||
Howell Township, New Jersey | 387 | Owned | |||
Hudson Valley, New York* | 476 | Owned | |||
Iowa City, Iowa* | 249 | Owned | |||
Lancaster, Texas | 454 | July 2020 | |||
Logan Township, New Jersey | 70 | March 2028 | |||
Montreal, Quebec | 31 | July 2019 | |||
Moreno Valley, California | 596 | July 2023 | |||
Philadelphia, Pennsylvania | 100 | January 2020 | |||
Prescott, Wisconsin | 269 | Owned | |||
Racine, Wisconsin* | 410 | Owned | |||
Richburg, South Carolina | 336 | Owned | |||
Richmond, British Columbia | 96 | August 2022 | |||
Ridgefield, Washington | 30 | September 2019 | |||
Ridgefield, Washington* | 220 | Owned | |||
Rocklin, California* | 439 | Owned | |||
Sarasota, Florida | 641 | July 2022 | |||
Truckee, California | 6 | August 2020 | |||
Vaughan, Ontario | 180 | November 2021 | |||
Vernon, California* | 30 | Owned | |||
West Sacramento, California | 192 | Owned | |||
West Sacramento, California | 85 | Owned | |||
York, Pennsylvania | 650 | May 2020 | |||
Yuba City, California | 224 | September 2021 | |||
*The properties noted above are mortgaged under and encumbered by our Existing Term Loan Agreement initially entered into on August 14, 2014.
During fiscal 2018, we disposed of our Earth Origins retail business. We operate one retail store at our Corporate headquarters in Providence, Rhode Island. We also lease a processing and manufacturing facility in Edison, New Jersey for our manufacturing and branded products division with a lease expiration date of July 31, 2023.
We lease office space in San Francisco, California; Santa Cruz, California; Chesterfield, New Hampshire; Uniondale, New York; Brooklyn, New York; Richmond, Virginia; Wayne, Pennsylvania; Lincoln, Rhode Island, the site of our shared services center; and Providence, Rhode Island, the site of our corporate headquarters. Our leases have been entered into upon terms that we believe to be reasonable and customary.
18
ITEM 3. LEGAL PROCEEDINGS
From time to time, we are involved in routine litigation or other legal proceedings that arise in the ordinary course of our business. There are no pending material legal proceedings to which we are a party or to which our property is subject.
ITEM 4. MINE SAFETY DISCLOSURES
Not applicable.
19
PART II.
ITEM 5. MARKET FOR THE REGISTRANT'S COMMON EQUITY, RELATED STOCKHOLDER MATTERS AND ISSUER PURCHASES OF EQUITY SECURITIES
Our common stock is traded on the Nasdaq Global Select Market® under the symbol "UNFI."
The following table sets forth, for the fiscal periods indicated, the high and low sale prices per share of our common stock on the Nasdaq Global Select Market®:
Fiscal 2018 | High | Low | ||||||
First Quarter | $ | 44.94 | $ | 32.52 | ||||
Second Quarter | 52.69 | 38.04 | ||||||
Third Quarter | 49.81 | 40.88 | ||||||
Fourth Quarter | 47.73 | 32.03 | ||||||
Fiscal 2017 | ||||||||
First Quarter | $ | 50.06 | $ | 38.55 | ||||
Second Quarter | 49.39 | 40.81 | ||||||
Third Quarter | 45.99 | 39.47 | ||||||
Fourth Quarter | 42.38 | 34.60 | ||||||
On July 28, 2018, we had 74 stockholders of record. The number of record holders is not representative of the number of beneficial holders of our common stock because depositories, brokers or other nominees hold many shares.
We have never declared or paid any cash dividends on our capital stock. We anticipate that all of our earnings in the foreseeable future will be retained to finance the continued growth and development of our business, and we have no current intention to pay cash dividends. Our future dividend policy will depend on our earnings, capital requirements and financial condition, requirements of the financing agreements to which we are then a party and other factors considered relevant by our Board of Directors. Additionally, our Existing ABL Loan Agreement and Existing Term Loan Agreement contain, and the debt agreements we expect to enter into in connection with the SUPERVALU acquisition will contain, terms that restrict us from making any cash dividends unless certain conditions and financial tests are met.
Comparative Stock Performance
The graph below compares the cumulative total stockholder return on our common stock for the last five fiscal years with the cumulative total return on (i) an index of Food Distributors and Wholesalers and (ii) The NASDAQ Composite Index. The comparison assumes the investment of $100 on August 3, 2013 in our common stock and in each of the indices and, in each case, assumes reinvestment of all dividends. The stock price performance shown below is not necessarily indicative of future performance.
The index of Food Distributors and Wholesalers includes SUPERVALU, Inc. and SYSCO Corporation.
This performance graph shall not be deemed "soliciting material" or be deemed to be "filed" for purposes of Section 18 of the Exchange Act or otherwise subject to the liabilities under that Section and shall not be deemed to be incorporated by reference into any of our filings under the Securities Act of 1933, as amended (the "Securities Act"), or the Exchange Act.
20
COMPARISION OF 5 YEAR CUMULATIVE TOTAL RETURN*
Among United Natural Foods, Inc., the NASDAQ Composite Index,
and Index of Food Distributors and Wholesalers
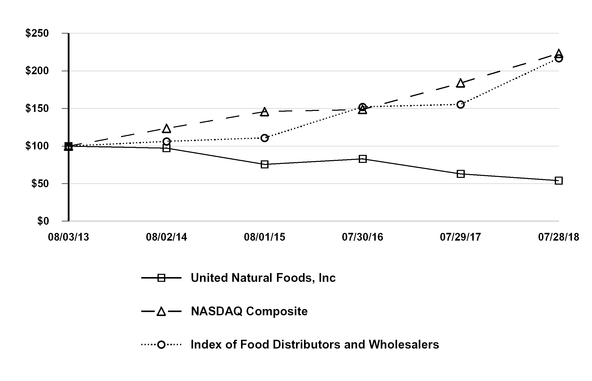
* | $100 invested on 8/3/13 in UNFI common stock or 8/3/13 in the relevant index, including reinvestment of dividends. Index calculated on a month-end basis. |
ITEM 6. SELECTED FINANCIAL DATA
The selected consolidated financial data presented below are derived from our consolidated financial statements, which have been audited by KPMG LLP, our independent registered public accounting firm. The historical results are not necessarily indicative of results to be expected for any future period. The following selected consolidated financial data should be read in conjunction with and is qualified by reference to "Item 7. Management's Discussion and Analysis of Financial Condition and Results of Operations" and our Consolidated Financial Statements and Notes thereto included elsewhere in this Annual Report.
21
Consolidated Statement of Income Data: (1) (2) | July 28, 2018 | July 29, 2017 | July 30, 2016 | August 1, 2015 | August 2, 2014 | |||||||||||||||
(In thousands, except per share data) | ||||||||||||||||||||
Net sales | $ | 10,226,683 | $ | 9,274,471 | $ | 8,470,286 | $ | 8,184,978 | $ | 6,794,447 | ||||||||||
Cost of sales | 8,703,916 | 7,845,550 | 7,190,935 | 6,924,463 | 5,666,802 | |||||||||||||||
Gross profit | 1,522,767 | 1,428,921 | 1,279,351 | 1,260,515 | 1,127,645 | |||||||||||||||
Total operating expenses | 1,295,542 | 1,202,896 | 1,055,242 | 1,018,558 | 916,857 | |||||||||||||||
Operating income | 227,225 | 226,025 | 224,109 | 241,957 | 210,788 | |||||||||||||||
Income before income taxes | 212,745 | 214,423 | 208,222 | 229,769 | 207,408 | |||||||||||||||
Provision for income taxes | 47,075 | 84,268 | 82,456 | 91,035 | 81,926 | |||||||||||||||
Net income | $ | 165,670 | $ | 130,155 | $ | 125,766 | $ | 138,734 | $ | 125,482 | ||||||||||
Basic per share data: | ||||||||||||||||||||
Net income | $ | 3.28 | $ | 2.57 | $ | 2.50 | $ | 2.77 | $ | 2.53 | ||||||||||
Diluted per share data: | ||||||||||||||||||||
Net income | $ | 3.26 | $ | 2.56 | $ | 2.50 | $ | 2.76 | $ | 2.52 | ||||||||||
Consolidated Balance Sheet Data: (2) (3) | ||||||||||||||||||||
Working capital | $ | 1,089,690 | $ | 958,683 | $ | 991,468 | $ | 1,018,437 | $ | 850,006 | ||||||||||
Total assets | 2,964,472 | 2,886,563 | 2,852,155 | 2,540,994 | 2,284,446 | |||||||||||||||
Total long-term debt and capital leases, excluding current portion | 137,709 | 149,863 | 161,739 | 172,949 | 32,510 | |||||||||||||||
Total stockholders' equity | $ | 1,845,955 | $ | 1,681,921 | $ | 1,519,504 | $ | 1,381,088 | $ | 1,238,919 | ||||||||||
(1) | Includes the effect of acquisitions from the respective dates of acquisition. |
(2) | Periods prior to the year ended July 30, 2016 have been restated for immaterial corrections for identified errors in accounting for early payment discounts on inventory purchases. |
(3) | Amounts have been adjusted for the reclassification of debt issuance costs resulting from the Company's early adoption of Accounting Standards Update No. 2015-03, Interest- Imputation of Interest (Subtopic 835-30), in the fourth quarter of fiscal 2016. |
ITEM 7. MANAGEMENT'S DISCUSSION AND ANALYSIS OF FINANCIAL CONDITION AND RESULTS OF OPERATIONS
The following discussion and analysis should be read in conjunction with our consolidated financial statements and the notes thereto appearing elsewhere in this Annual Report.
Forward-Looking Statements
This Annual Report and the documents incorporated by reference in this Annual Report contain forward-looking statements within the meaning of Section 27A of the Securities Act of 1933, as amended (the "Securities Act"), and Section 21E of the Securities Exchange Act of 1934, as amended (the "Exchange Act"), that involve substantial risks and uncertainties. In some cases you can identify these statements by forward-looking words such as "anticipate," "believe," "could," "estimate," "expect," "intend," "may," "plans," "planned," "seek," "should," "will," and "would," or similar words. Statements that contain these words and other statements that are forward-looking in nature should be read carefully because they discuss future expectations, contain projections of future results of operations or of financial positions or state other "forward-looking" information.
Forward-looking statements involve inherent uncertainty and may ultimately prove to be incorrect or false. You are cautioned not to place undue reliance on forward-looking statements. Except as otherwise may be required by law, we undertake no obligation to update or revise forward-looking statements to reflect changed assumptions, the occurrence of unanticipated events or actual operating results. Our actual results could differ materially from those anticipated in these forward-looking statements as a result of various factors, including, but not limited to:
• | our dependence on principal customers; |
22
• | our ability to effectively manage operational expenses due to higher volumes from our single supernatural customer and from supermarkets in light of lower margins from those customers; |
• | the relatively low margins and economic sensitivity of our business; |
• | changes in disposable income levels and consumer spending trends; |
• | our reliance on the continued growth in sales of natural and organic foods and non-food products in comparison to conventional products; |
• | increased competition in our industry as a result of increased distribution of natural, organic and specialty products by conventional grocery distributors and direct distribution of those products by large retailers and online distributors; |
• | the ability to identify and successfully complete acquisitions, including our ability to complete the acquisition of SUPERVALU and to recognize the anticipated benefits of the business combination with SUPERVALU; |
• | our ability to timely and successfully deploy our warehouse management system throughout our distribution centers and our transportation management system across the Company and to achieve the expected efficiencies and cost savings from these efforts; |
• | the addition or loss of significant customers or material changes to our relationships with these customers; |
• | our sensitivity to general economic conditions, including the current economic environment; |
• | our sensitivity to inflationary and deflationary pressures; |
• | volatility in fuel costs; |
• | volatility in foreign exchange rates; |
• | the potential for disruptions in our supply chain by circumstances beyond our control; |
• | the risk of interruption of supplies due to lack of long-term contracts, severe weather, work stoppages or otherwise; |
• | consumer demand for natural and organic products outpacing suppliers’ ability to produce those products and challenges we may experience in obtaining sufficient amounts of products to meet our customers' demands; |
• | moderated supplier promotional activity, including decreased forward buying opportunities; |
• | union-organizing activities that could cause labor relations difficulties and increased costs; |
• | management's allocation of capital and the timing of capital expenditures; and |
• | changes in interpretations, assumptions and expectations regarding the Tax Cuts and Jobs Act ("TCJA"), including additional guidance that may be issued by federal and state taxing authorities. |
This list of risks and uncertainties, however, is only a summary of some of the most important factors that could cause our actual results to differ materially from those anticipated in forward-looking statements and is not intended to be exhaustive. You should carefully review the risks described under "Part I. Item 1A. Risk Factors," as well as any other cautionary language in this Annual Report, as the occurrence of any of these events could have an adverse effect, which may be material, on our business, financial condition or results of operations.
This Annual Report contains forward-looking non-GAAP financial measures associated with the pending SUPERVALU acquisition. These non-GAAP financial measures are not intended to be considered in isolation or as a substitute for any measure prepared in accordance with GAAP. The Company believes that presenting non-GAAP financial measures aids in making period-to-period comparisons and is a meaningful indication of its actual and estimated operating performance. In addition, the Company's management believes that the forward-looking non-GAAP financial measures provide guidance to investors about our pro forma financial expectations for the pending SUPERVALU acquisition. The Company's management utilizes and plans to utilize this non-GAAP financial information to compare the Company's operating performance to comparable periods and to internally prepared projections. We are not able to reconcile these metrics to their most directly comparable forward-looking GAAP financial measures without unreasonable efforts because we are unable to predict with a reasonable degree of certainty the actual impact of purchase accounting, divestitures and restructuring actions. The unavailable information could have a significant impact on our GAAP financial results.
Overview
We are a leading distributor based on sales of natural, organic and specialty foods and non-food products in the United States and Canada. We offer more than 110,000 natural, organic and specialty foods and non-food products, consisting of national, regional and private label brands grouped into six product categories: grocery and general merchandise, produce, perishables and frozen foods, nutritional supplements and sports nutrition, bulk and food service products and personal care items. We serve more than 40,000 customer locations primarily located across the United States and Canada which we classify into one of the following four categories: independents, which include buying clubs; supernatural, which consists solely of Whole Foods Market; supermarkets, which include mass market chains; and other which includes e-commerce, foodservice and international customers outside of Canada, as well as sales to Amazon.com, Inc.
Our operations are generally comprised of two principal operating divisions. These operating divisions are:
• | our wholesale division, which includes: |
23
◦ | our broadline natural, organic and specialty distribution business in the United States; |
◦ | Tony's, which distributes a wide array of specialty protein, cheese, deli, foodservice and bakery goods, principally throughout the Western United States; |
◦ | Albert's, which distributes organically grown produce and non-produce perishable items within the United States, and includes the operations of Nor-Cal, a distributor of organic and conventional produce and non-produce perishable items principally in Northern California; |
◦ | UNFI Canada, Inc. ("UNFI Canada"), which is our natural, organic and specialty distribution business in Canada; and |
◦ | Select Nutrition, which distributes vitamins, minerals and supplements; and |
• | our manufacturing and branded products division, consisting of: |
◦ | Woodstock Farms Manufacturing, which specializes in importing, roasting, packaging and the distribution of nuts, dried fruit, seeds, trail mixes, granola, natural and organic snack items and confections; and |
◦ | our Blue Marble Brands branded product lines. |
During fiscal 2018, we disposed of our retail business, Earth Origins, and recorded restructuring and asset impairment expenses, which includes a loss on the disposition of assets, of approximately $16.1 million during the fiscal year ended July 28, 2018.
Our net sales consist primarily of sales of natural, organic and specialty products to retailers, adjusted for customer volume discounts, returns and allowances. Net sales also consist of amounts charged by us to customers for shipping and handling and fuel surcharges. The principal components of our cost of sales include the amounts paid to suppliers for product sold, plus the cost of transportation necessary to bring the product to, or move product between, our various distribution centers, offset by consideration received from suppliers in connection with the purchase or promotion of the suppliers' products. Cost of sales also includes amounts incurred by us at our manufacturing subsidiary, Woodstock Farms Manufacturing, for inbound transportation costs offset by consideration received from suppliers in connection with the purchase or promotion of the suppliers’ products. Our gross margin may not be comparable to other similar companies within our industry that may include all costs related to their distribution network in their costs of sales rather than as operating expenses. We include purchasing, receiving, selecting and outbound transportation expenses within our operating expenses rather than in our cost of sales. Total operating expenses include salaries and wages, employee benefits, warehousing and delivery, selling, occupancy, insurance, administrative, share-based compensation, depreciation and amortization expense. Other expenses (income) include interest on our outstanding indebtedness, including the financing obligation related to our Aurora, Colorado distribution center and the lease for office space for our corporate headquarters in Providence, Rhode Island, interest income and miscellaneous income and expenses.
In recent years, our sales to existing and new customers have increased through the continued growth of the natural and organic products industry in general; increased market share as a result of our high quality service and a broader product selection, including specialty products; the acquisition of, or merger with, natural and specialty products distributors, the expansion of our existing distribution centers; the construction of new distribution centers; the introduction of new products and the development of our own line of natural and organic branded products. Through these efforts, we believe that we have been able to broaden our geographic penetration, expand our customer base, enhance and diversify our product selections and increase our market share. Our strategic plan is focused on increasing the type of products we distribute to our customers, including perishable products and conventional produce to “build out the store” and cover center of the store, as well as perimeter offerings. As part of our “one company” approach, we are in the process of rolling out a national warehouse management and procurement system to convert our existing facilities into a single warehouse management and supply chain platform ("WMS"). WMS supports our effort to integrate and nationalize processes across the organization. We have successfully implemented the WMS system at fifteen of our facilities. In light of the proposed acquisition of SUPERVALU, we are reevaluating our warehouse management system strategy. However, we continue to be focused on the automation of our new or expanded distribution centers that are at different stages of construction. These steps and others are intended to promote operational efficiencies and improve operating expenses as a percentage of net sales as we attempt to offset the lower gross margins we expect to generate by increased sales to the supernatural and supermarkets channels and as a result of additional competition in our business.
We have been the primary distributor to Whole Foods Market for more than twenty years. We continue to serve as the primary distributor to Whole Foods Market in all of its regions in the United States pursuant to a distribution agreement that expires on September 28, 2025. Following the acquisition of Whole Foods Market by Amazon.com, Inc. in August 2017, our sales to Whole Foods Market increased resulting in year-over-year growth in net sales to this customer in fiscal 2018 of 21.4% compared to fiscal 2017. Whole Foods Market accounted for approximately 37% and 33% of our net sales for the years ended July 28, 2018 and July 29, 2017, respectively.
Our net sales increased from $9.27 billion in fiscal 2017 to $10.23 billion in fiscal 2018. Net income increased from $130.2 million in fiscal 2017 to $165.7 million in fiscal 2018.
24
With favorable trends in consumer confidence and the unemployment rate, we expect continued growth in sales of natural and organic foods and non-food products in fiscal 2019 and positive Company net sales growth of 8.6% to 10.5%. For fiscal 2019, the Company anticipates year-over-year sales growth to continue in the supernatural channel driven primarily by continued demand for better for you products. In addition, barring additional increases in freight or fuel rates, we expect inbound freight headwinds to dissipate in the first half of fiscal 2019 which would result in improved profitability, as reflected in our guidance. We are beginning to see this inbound freight improvement in the first month of fiscal 2019. Finally, the pending SUPERVALU acquisition is expected to have a positive impact on sales in fiscal 2019 as it accelerates the Company’s “build out the store” strategy. The pending SUPERVALU acquisition will also broaden our universe of customers and suppliers, reducing our dependence on any one customer.
In the first full year after the acquisition closes (“Year One”), we expect combined net sales, excluding retail and discontinued operations, to be approximately $24.2 billion to $24.8 billion. Year One Adjusted EBITDA is expected to be $655 million to $675 million. Year One Adjusted EBITDA excludes SUPERVALU’s retail business, impact from discontinued operations, one-time costs and the impact of purchase accounting. In addition, the Year One Adjusted EBITDA projection excludes the benefit of SUPERVALU’s net pension and other post-retirement benefits valued at $38 million for SUPERVALU’s fiscal year 2019.
The projection includes the following items: (1) the winding down of SUPERVALU’s Albertson transition services agreement; (2) share based compensation for the Company and SUPERVALU; (3) retail and other stranded costs; and (4) the additional expense related to SUPERVALU’s recent sale leaseback initiative. In addition, the projection reflects Year One cost synergies, benefits from SUPERVALU’s acquisitions of Unified Grocers, Inc. and Associated Grocers of Florida, Inc, and growth assumptions for the underlying Company and SUPERVALU businesses.
Cost synergies are the primary value driver in this combination. We expect to achieve more than $175 million in cost synergies in the third year after the acquisition closes (“Year Three”) and $185 million in the fourth year after the acquisition closes (“Year Four”). These assumptions exclude growth synergies. Cost synergies will be derived from two primary categories: overhead efficiencies and operational optimization. Our expectation is to achieve 25% of the synergies in Year One, 65% in the following year and 95% by Year Three and 100% by Year Four. As far as costs associated with the transaction and with achieving the synergies, we expect to incur the bulk of these costs in the first two years following the close of the acquisition. We expect approximately $95 million of costs in Year One and $110 million in years two through five, following the closing of the transaction. Lastly, we expect a low double-digit percentage accretion in Adjusted EPS in Year One, excluding one-time costs to achieve synergies and the impact of purchase accounting.
Results of Operations
The following table presents, for the periods indicated, certain income and expense items expressed as a percentage of net sales:
Fiscal year ended | ||||||||||
July 28, 2018 | July 29, 2017 | July 30, 2016 | ||||||||
Net sales | 100.0 | % | 100.0 | % | 100.0 | % | ||||
Cost of sales | 85.1 | % | 84.6 | % | 84.9 | % | ||||
Gross profit | 14.9 | % | 15.4 | % | 15.1 | % | ||||
Operating expenses | 12.5 | % | 12.9 | % | 12.4 | % | ||||
Restructuring and asset impairment expenses | 0.2 | % | 0.1 | % | 0.1 | % | ||||
Total operating expenses | 12.7 | % | 13.0 | % | 12.5 | % | ||||
Operating income | 2.2 | % | 2.4 | % | 2.6 | % | ||||
Other expense (income): | ||||||||||
Interest expense | 0.2 | % | 0.2 | % | 0.2 | % | ||||
Interest income | — | % | — | % | — | % | ||||
Other, net | — | % | (0.1 | )% | — | % | ||||
Total other expense, net | 0.1 | % | * | 0.1 | % | 0.2 | % | |||
Income before income taxes | 2.1 | % | 2.3 | % | 2.5 | % | * | |||
Provision for income taxes | 0.5 | % | 0.9 | % | 1.0 | % | ||||
Net income | 1.6 | % | 1.4 | % | 1.5 | % | ||||
25
* Reflects rounding
Fiscal year ended July 28, 2018 compared to fiscal year ended July 29, 2017
Net Sales
Our net sales for the fiscal year ended July 28, 2018 increased approximately 10.3%, or $952.2 million, to $10.23 billion from $9.27 billion for the fiscal year ended July 29, 2017. Our net sales by customer type for the fiscal years ended July 28, 2018 and July 29, 2017 were as follows (in millions):
Customer Type | 2018 Net Sales | % of Total Net Sales | 2017 Net Sales | % of Total Net Sales | |||||||||||
Supernatural | $ | 3,758 | 37 | % | $ | 3,096 | 33 | % | |||||||
Supermarkets | 2,856 | 28 | % | 2,747 | 30 | % | |||||||||
Independents | 2,573 | 25 | % | 2,427 | 26 | % | |||||||||
Other | 1,039 | 10 | % | 1,004 | 11 | % | |||||||||
Total | $ | 10,227 | * | 100 | % | $ | 9,274 | 100 | % | ||||||
* Total reflects rounding
During fiscal 2017, our net sales by channel were adjusted to reflect changes in the classification of customer types from acquisitions we consummated in the third and fourth quarters of fiscal 2016 and the first quarter of fiscal 2017. There was no financial statement impact as a result of revising the classification of customer types. As a result of this adjustment, net sales to our supermarkets and other channels for the fiscal year ended July 29, 2017 increased approximately $50 million and $2 million, respectively, compared to the previously reported amounts, while net sales to the independents channel for the fiscal year ended July 29, 2017 decreased approximately $52 million compared to the previously reported amounts.
Whole Foods Market is our only supernatural customer, and net sales to Whole Foods Market for the fiscal year ended July 28, 2018 increased by approximately $662 million, or 21.4%, over the prior year and accounted for approximately 37% and 33% of our total net sales for the fiscal years ended July 28, 2018 and July 29, 2017, respectively. The increase in net sales to Whole Foods Market is primarily due to an increase in same store sales following its acquisition by Amazon.com, Inc. in August 2017 coupled with growth in new product categories, most notably the health, beauty and supplement categories. Net sales within our supernatural channel do not include net sales to Amazon.com, Inc. in either the current period or the prior period, as these net sales are reported in our other channel.
Net sales to our supermarkets channel for the fiscal year ended July 28, 2018 increased by approximately $109 million, or 4.0%, from fiscal 2017 and represented approximately 28% and 30% of total net sales in fiscal 2018 and fiscal 2017, respectively. The increase in net sales to supermarkets was primarily driven by growth in our wholesale division, which includes our broadline distribution business.
Net sales to our independents channel increased by approximately $146 million, or 6.0%, during the fiscal year ended July 28, 2018 compared to the fiscal year ended July 29, 2017, and accounted for 25% and 26% of our total net sales in fiscal 2018 and fiscal 2017, respectively. The increase in net sales in this channel is primarily due to growth in our wholesale division, which includes our broadline distribution business.
Other net sales, which include sales to foodservice customers and sales from the United States to other countries, as well as sales through our e-commerce business, branded product lines, retail division, manufacturing division, and our brokerage business, increased by approximately $35 million, or 3.5%, for the fiscal year ended July 28, 2018 over the prior fiscal year and accounted for approximately 10% and 11% of total net sales in fiscal 2018 and fiscal 2017, respectively. The increase in other net sales was primarily driven by growth in our e-commerce business.
Cost of Sales and Gross Profit
Our gross profit increased approximately 6.6%, or $93.8 million, to $1.52 billion for the fiscal year ended July 28, 2018, from $1.43 billion for the fiscal year ended July 29, 2017. Our gross profit as a percentage of net sales was 14.9% for the fiscal year ended July 28, 2018 and 15.4% for the fiscal year ended July 29, 2017. The decrease in gross profit as a percentage of net sales was primarily driven by a shift in customer mix where net sales growth of our largest customer outpaced growth of other customers with higher margin and by an increase in inbound freight costs.
Operating Expenses
26
Our total operating expenses increased approximately 7.7%, or $92.6 million, to $1.30 billion for the fiscal year ended July 28, 2018, from $1.20 billion for the fiscal year ended July 29, 2017. As a percentage of net sales, total operating expenses decreased to approximately 12.7% for the fiscal year ended July 28, 2018, from approximately 13.0% for the fiscal year ended July 29, 2017. The decrease in operating expenses as a percentage of net sales was primarily driven by leveraging of fixed costs on increased net sales. This was partially offset by $16.1 million of restructuring and impairment charges, which includes a $2.7 million loss on the disposition of assets, recorded for our Earth Origins retail business, which was disposed in the fourth quarter of fiscal 2018, increased costs incurred to fulfill the increased demand for our products and approximately $5.0 million of acquisition related costs associated with the pending SUPERVALU acquisition. Total operating expenses also included share-based compensation expense of $25.8 million and $25.7 million for fiscal 2018 and 2017, respectively. For more information, refer to Note 3. "Equity Plans" to our Consolidated Financial Statements included in "Item 8. Financial Statements and Supplementary Data" of this Annual Report.
Operating Income
Reflecting the factors described above, operating income increased approximately 0.5%, or $1.2 million, to $227.2 million for the fiscal year ended July 28, 2018, from $226.0 million for the fiscal year ended July 29, 2017. As a percentage of net sales, operating income was 2.2% and 2.4% for the fiscal years ended July 28, 2018 and July 29, 2017, respectively.
Other Expense (Income)
Other expense, net increased $2.9 million to $14.5 million for the fiscal year ended July 28, 2018, from $11.6 million for the fiscal year ended July 29, 2017. Interest expense for the fiscal year ended July 28, 2018 decreased to $16.5 million from $17.1 million for the fiscal year ended July 29, 2017. The decrease in interest expense was primarily due to a reduction in outstanding debt year-over-year. Interest income was $0.4 million for the fiscal years ended July 28, 2018 and July 29, 2017. Other income for the fiscal year ended July 28, 2018 was $1.5 million, compared to other income of $5.2 million for the fiscal year ended July 29, 2017. Other income for fiscal 2018 was primarily related to positive returns on the Company's equity method investment. Other income for fiscal 2017 was primarily related to a $6.1 million gain recorded during the fourth quarter of fiscal 2017 related to the sale of the Company's stake in Kicking Horse Coffee.
Provision for Income Taxes
Our effective income tax rate was 22.1% and 39.3% for the fiscal years ended July 28, 2018 and July 29, 2017, respectively. The decrease in the effective income tax rate for the fiscal year ended July 28, 2018 was driven by a $15.5 million tax benefit which was recorded as result of the new lower federal tax rate, as well as a net tax benefit of approximately $21.7 million as a result of the impact of the re-measurement of U.S. net deferred tax liabilities at the new lower corporate income tax rate resulting from the Tax Cuts and Jobs Act of 2017 ("TCJA").
Net Income
Reflecting the factors described in more detail above, net income increased $35.5 million to $165.7 million, or $3.26 per diluted share, for the fiscal year ended July 28, 2018, compared to $130.2 million, or $2.56 per diluted share for the fiscal year ended July 29, 2017.
Fiscal year ended July 29, 2017 compared to fiscal year ended July 30, 2016
Net Sales
Our net sales for the fiscal year ended July 29, 2017 increased approximately 9.5%, or $804.2 million, to $9.27 billion from $8.47 billion for the fiscal year ended July 30, 2016. The year-over-year increase in net sales was primarily due to growth in our wholesale segment of $815.0 million. Net sales for fiscal 2017 were positively impacted by acquisitions we consummated in the third and fourth quarters of fiscal 2016 and the first quarter of fiscal 2017 but were negatively impacted by broad based food retail softness, the rationalization of business in conjunction with margin enhancement initiatives and a lack of inflation. Our net sales for the fiscal year ended July 29, 2017 were favorably impacted by moderate price inflation of approximately 1% during the year.
27
Our net sales by customer type for the fiscal years ended July 29, 2017 and July 30, 2016 were as follows (in millions):
Customer Type | 2017 Net Sales | % of Total Net Sales | 2016 Net Sales | % of Total Net Sales | |||||||||||
Supernatural | $ | 3,096 | 33 | % | $ | 2,951 | 35 | % | |||||||
Supermarkets | 2,747 | 30 | % | 2,288 | 27 | % | |||||||||
Independents | 2,427 | 26 | % | 2,291 | 27 | % | |||||||||
Other | 1,004 | 11 | % | 940 | 11 | % | |||||||||
Total | $ | 9,274 | 100 | % | $ | 8,470 | 100 | % | |||||||
During fiscal 2017, our net sales by channel were adjusted to reflect changes in the classification of customer types from acquisitions we consummated in the third and fourth quarters of fiscal 2016 and the first quarter of fiscal 2017. There was no financial statement impact as a result of revising the classification of customer types. As a result of this adjustment, net sales to our supermarkets and other channels for the fiscal year ended July 30, 2016 increased approximately $29 million and $6 million, respectively, compared to the previously reported amounts, while net sales to the independents channel for the fiscal year ended July 30, 2016 decreased approximately $35 million compared to the previously reported amounts.
Whole Foods Market is our only supernatural customer, and net sales to Whole Foods Market for the fiscal year ended July 29, 2017 increased by approximately $145 million or 4.9% over the prior year and accounted for approximately 33% and 35% of our total net sales for the fiscal years ended July 29, 2017 and July 30, 2016, respectively. The increase in net sales to Whole Foods Market was primarily due to new store openings offset in part by lower year over year same store sales at Whole Foods Market.
Net sales to our supermarkets channel for the fiscal year ended July 29, 2017 increased by approximately $459 million, or 20.1% from fiscal 2016 and represented approximately 30% and 27% of total net sales in fiscal 2017 and fiscal 2016, respectively. The increase in net sales to supermarkets was primarily driven by net sales resulting from our acquisition of Haddon in the fourth quarter of fiscal 2016.
Net sales to our independents channel increased by approximately $136 million, or 5.9% during the fiscal year ended July 29, 2017 compared to the fiscal year ended July 30, 2016, and accounted for 26% and 27% of our total net sales in fiscal 2017 and fiscal 2016, respectively. The increase in net sales in this channel was primarily attributable to net sales from our acquisitions during fiscal 2016 and the first quarter of fiscal 2017 as well as growth in our wholesale division, which includes our broadline distribution business.
Other net sales, which included sales to foodservice customers and sales from the United States to other countries, as well as sales through our e-commerce business, branded product lines, retail division, manufacturing division, and our brokerage business, increased by approximately $64 million or 6.8% during the fiscal year ended July 29, 2017 over the prior fiscal year and accounted for approximately 11% of total net sales in both fiscal 2017 and fiscal 2016. The increase in other net sales was attributable to expanded sales to our new and existing foodservice partners and growth in our e-commerce business, as well as net sales resulting from our acquisition of Haddon in the fourth quarter of fiscal 2016.
Cost of Sales and Gross Profit
Our gross profit increased approximately 11.7%, or $149.6 million, to $1.43 billion for the fiscal year ended July 29, 2017, from $1.28 billion for the fiscal year ended July 30, 2016. Our gross profit as a percentage of net sales was 15.4% for the fiscal year ended July 29, 2017 and 15.1% for the fiscal year ended July 30, 2016. The increase in gross profit as a percentage of net sales was primarily driven by margin enhancement initiatives and the favorable impact of acquisitions, partially offset by a lack of inflation and competitive pricing pressure.
Operating Expenses
Our total operating expenses increased approximately 14.0%, or $147.7 million, to $1.20 billion for the fiscal year ended July 29, 2017, from $1.06 billion for the fiscal year ended July 30, 2016. As a percentage of net sales, total operating expenses increased to approximately 13.0% for the fiscal year ended July 29, 2017, from approximately 12.5% for the fiscal year ended July 30, 2016. The increase in total operating expenses was primarily attributable to the acquired businesses, which generally have a higher cost to serve their customers. Additionally, the increase was driven by $6.9 million of restructuring expenses as well as higher depreciation and amortization and incentive and stock-based compensation expense, which was partially offset by costs incurred in fiscal 2016 that did not recur in fiscal 2017, including $1.8 million of bad debt expense related to outstanding receivables for a customer who declared bankruptcy in the first quarter of fiscal 2016, $2.2 million of acquisition related costs and $2.5 million of startup costs related to the Company's Gilroy, California facility. Operating expenses for fiscal 2016 also included $5.6 million in restructuring and asset impairment expense.
28
Total operating expenses for fiscal 2017 include share-based compensation expense of $25.7 million, compared to $15.3 million in fiscal 2016. This increase was primarily due to an increase in performance-based compensation expense related to our long-term incentive plan for members of our executive leadership team. The Company did not record share-based compensation expense related to performance-based share awards in fiscal 2016, as a result of performance measures not being attained at the end of the fiscal year and the resulting forfeiture of these awards.
Operating Income
Operating income increased approximately 0.9%, or $1.9 million, to $226.0 million for the fiscal year ended July 29, 2017, from $224.1 million for the fiscal year ended July 30, 2016. As a percentage of net sales, operating income was 2.4% and 2.6% for the fiscal years ended July 29, 2017 and July 30, 2016, respectively.
Other Expense (Income)
Other expense, net decreased $4.3 million to $11.6 million for the fiscal year ended July 29, 2017, from $15.9 million for the fiscal year ended July 30, 2016. Interest expense for the fiscal year ended July 29, 2017 increased to $17.1 million from $16.3 million for the fiscal year ended July 30, 2016. The increase in interest expense was primarily due to additional borrowings for acquisitions made in the second half of fiscal 2016. Interest income for the fiscal year ended July 29, 2017 decreased to $0.4 million from $1.1 million for the fiscal year ended July 30, 2016. Other income for the fiscal year ended July 29, 2017 was $5.2 million, compared to other expense of $0.7 million for the fiscal year ended July 30, 2016. The increase in other income was primarily driven by a $6.1 million gain recorded during the fourth quarter of fiscal 2017 related to the sale of the Company's stake in Kicking Horse Coffee.
Provision for Income Taxes
Our effective income tax rate was 39.3% and 39.6% for the fiscal years ended July 29, 2017 and July 30, 2016, respectively. The decrease in the effective income tax rate for the fiscal year ended July 29, 2017 was primarily due to the claiming of solar and research and development tax credits that were not available in the prior year.
Net Income
Reflecting the factors described in more detail above, net income increased $4.4 million to $130.2 million, or $2.56 per diluted share, for the fiscal year ended July 29, 2017, compared to $125.8 million, or $2.50 per diluted share for the fiscal year ended July 30, 2016.
Liquidity and Capital Resources
We finance our day to day operations and growth primarily with cash flows from operations, borrowings under our Existing ABL Loan Agreement, operating leases, a capital lease, a finance lease, trade payables and bank indebtedness. In addition, from time to time, we may issue debt securities to finance our operations and acquisitions. During the fiscal quarter ended October 28, 2017, we announced our intent to repurchase up to $200.0 million of shares of our common stock. Purchases under this program will be financed with cash generated from our operations and borrowings under our Existing ABL Loan Agreement.
The Company has estimated an immaterial impact of the mandatory repatriation provision under the TCJA on earnings due to the foreign tax credits available to the Company. The Company has not recorded a tax provision for U.S. tax purposes on UNFI Canada’s profits as it has no assessable profits arising in or derived from the United States and still intends to indefinitely reinvest accumulated earnings in the UNFI Canada operations.
ABL Credit Facility
On April 29, 2016, we entered into the Third Amended and Restated Loan and Security Agreement (the “Existing ABL Loan Agreement”) amending and restating certain terms and provisions of our revolving credit facility (the “Existing ABL Facility”), which increased the maximum borrowings under the Existing ABL Facility and extended the maturity date to April 29, 2021. Up to $850.0 million is available to our U.S. subsidiaries and up to $50.0 million is available to UNFI Canada. After giving effect to the Existing ABL Loan Agreement, the Existing ABL Facility provides an option to increase the U.S. or Canadian revolving commitments by up to an additional $600.0 million in the aggregate (but in not less than $10.0 million increments) subject to certain customary conditions and the lenders committing to provide the increase in funding.
The borrowings of the U.S. portion of the Existing ABL Facility after giving effect to the Existing ABL Loan Agreement, accrued interest, at the base rate plus an applicable margin of 0.25% or LIBOR rate plus an applicable margin of 1.25% for the twelve month period ended April 29, 2017. After this period, the interest on the U.S. borrowings is accrued at the Company's option, at either (i) a base rate (generally defined as the highest of (x) the Bank of America Business Capital prime rate, (y) the average overnight federal funds effective rate plus one-half percent (0.50%) per annum and (z) one-month LIBOR plus one percent (1%)
29
per annum) plus an applicable margin that varies depending on daily average aggregate availability, or (ii) the LIBOR rate plus an applicable margin that varies depending on daily average aggregate availability. The borrowings on the Canadian portion of the Existing ABL Facility accrued interest at the Canadian prime rate plus an applicable margin of 0.25% or a bankers' acceptance equivalent rate plus an applicable margin of 1.25% for the twelve month period ended April 29, 2017. After this period, the borrowings on the Canadian portion of the Existing ABL Facility accrue interest, at the Company's option, at either (i) a Canadian prime rate (generally defined as the highest of (x) 0.50% over 30-day Reuters Canadian Deposit Offering Rate ("CDOR") for bankers' acceptances, (y) the prime rate of Bank of America, N.A.'s Canada branch, and (z) a bankers' acceptance equivalent rate for a one month interest period plus 1.00%) plus an applicable margin that varies depending on daily average aggregate availability, or (ii) a bankers' acceptance equivalent rate of the rate of interest per annum equal to the annual rates applicable to Canadian Dollar bankers' acceptances on the "CDOR Page" of Reuter Monitor Money Rates Service, plus five basis points, and an applicable margin that varies depending on daily average aggregate availability. Unutilized commitments are subject to an annual fee in the amount of 0.30% if the total outstanding borrowings are less than 25% of the aggregate commitments, or a per annum fee of 0.25% if such total outstanding borrowings are 25% or more of the aggregate commitments. The Company is also required to pay a letter of credit fronting fee to each letter of credit issuer equal to 0.125% per annum of the stated amount of each such letter of credit (or such other amount as may be mutually agreed by the borrowers under the facility and the applicable letter of credit issuer), as well as a fee to all lenders equal to the applicable margin for LIBOR or bankers’ acceptance equivalent rate loans, as applicable, times the average daily stated amount of all outstanding letters of credit.
As of July 28, 2018, the Company's borrowing base, which is calculated based on eligible accounts receivable and inventory levels, net of $4.2 million of reserves, was $884.5 million. As of July 28, 2018, the Company had $210.0 million of borrowings outstanding under the Existing ABL Facility and $24.3 million in letter of credit commitments which reduced the Company's available borrowing capacity under the Existing ABL Facility on a dollar for dollar basis. The Company's resulting remaining availability was $650.2 million as of July 28, 2018.
The Existing ABL Facility subjects us to a springing minimum fixed charge coverage ratio (as defined in the Existing ABL Loan Agreement) of 1.0 to 1.0 calculated at the end of each of our fiscal quarters on a rolling four quarter basis when the adjusted aggregate availability (as defined in the Existing ABL Loan Agreement) is less than the greater of (i) $60.0 million and (ii) 10% of the aggregate borrowing base. We were not subject to the fixed charge coverage ratio covenant under the Existing ABL Loan Agreement during the fiscal year ended July 28, 2018.
The Company has pledged the majority of its and its subsidiaries' accounts receivable and inventory to secure its obligations under the Existing ABL Loan Agreement.
In connection with the execution of the Merger Agreement with SUPERVALU, the Company obtained a debt financing commitment on the terms and subject to the conditions set forth in a commitment letter dated July 25, 2018 (the “Commitment Letter”) from Goldman Sachs Bank USA and Goldman Sachs Lending Partners LLC consisting of, among other things, (i) a senior secured asset-based revolving facility (the “New ABL Credit Facility”) in an aggregate principal amount of $2,000 million that will be used to replace the Existing ABL Facility and (ii) a senior secured term loan credit facility (the “New Term Loan Facility”) in an aggregate principal amount of $2,050 million. The Commitment Letter was amended and restated by the Amended and Restated Commitment Letter dated August 7, 2018, from Goldman Sachs Bank USA, Bank of America, N.A. and Merrill Lynch, Pierce, Fenner & Smith Incorporated, and further amended and restated by the Second Amended and Restated Commitment Letter dated August 8, 2018, from Goldman Sachs Bank USA, Bank of America, N.A., Merrill Lynch, Pierce, Fenner & Smith Incorporated, Wells Fargo Bank, National Association, JPMorgan Chase Bank, N.A. and U.S. Bank National Association and as further amended by Amendment No. 1 to Second Amended and Restated Commitment Letter dated September 21, 2018, (the “Amended Commitment Letter”).
On August 30, 2018 (the “Signing Date”), the Company, entered into a Loan Agreement (the “New ABL Loan Agreement”), by and among the Company and United Natural Foods West, Inc. (together with the Company, the “U.S. Borrowers”) and UNFI Canada, Inc. (the “Canadian Borrower” and, together with the U.S. Borrowers, the “Borrowers”), the financial institutions that are parties thereto as lenders (collectively, the “Lenders”), Bank of America, N.A. as administrative agent for the Lenders (the “ABL Administrative Agent”), Bank of America, N.A. (acting through its Canada branch), as Canadian agent for the Lenders (the “Canadian Agent”), and the other parties thereto. As of the Signing Date and as a result of the Company’s entry into the New ABL Loan Agreement, all of the commitments under the Amended Commitment Letter with respect to the Existing ABL Loan Agreement have been terminated and permanently reduced to zero. The commitment with respect to the New Term Loan Facility under the Amended Commitment Letter remain unchanged.
The New ABL Loan Agreement provides for the New ABL Credit Facility (the loans thereunder, the “Loans”), of which up to (i) $1,950.0 million is available to the U.S. Borrowers and (ii) $50.0 million is available to the Canadian Borrower. The New ABL Loan Agreement also provides for (i) a $125.0 million sublimit of availability for letters of credit of which there is a further $5.0 million sublimit for the Canadian Borrower and (ii) a $100.0 million sublimit for short-term borrowings on a swingline basis of which there is a further $3.5 million sublimit for the Canadian Borrower. Under the New ABL Loan Agreement, the Borrowers
30
may, at their option, increase the aggregate amount of the New ABL Credit Facility in an amount of up to $600.0 million (but in not less than $10.0 million increments) without the consent of any Lenders not participating in such increase, subject to certain customary conditions and applicable lenders committing to provide the increase in funding. There is no assurance that additional funding would be available.
The New ABL Credit Facility will be secured by (i) a first-priority lien on all of our and our domestic subsidiaries' accounts receivable, inventory and certain other assets arising therefrom or related thereto (including, without limitation, substantially all of their deposit accounts, collectively, the "ABL Assets") and (ii) a second-priority lien on all of our and our domestic subsidiaries' assets that do not constitute ABL Assets, in each case, subject to customary exceptions and limitations on the date of consummation of the acquisition of SUPERVALU pursuant to the terms of the Merger Agreement (the “Closing Date”).
Availability under the New ABL Credit Facility is subject to a borrowing base (the “Borrowing Base”), which is based on 90% of eligible accounts receivable, plus 90% of eligible credit card receivable, plus 90% of the net orderly liquidation value of eligible inventory, plus 90% of eligible pharmacy receivables, plus certain pharmacy scripts availability of the Borrowers, after adjusting for customary reserves that are subject to the ABL Administrative Agent’s discretion. The aggregate amount of the Loans made and letters of credit issued under the New ABL Credit Facility shall at no time exceed the lesser of the aggregate commitments under the New ABL Credit Facility (currently $2,000.0 million or, if increased at the Borrowers’ option as described above, up to $2,600 million) or the Borrowing Base. To the extent that the Borrowers’ eligible accounts receivable, eligible credit card receivables, eligible inventory, eligible pharmacy receivables and pharmacy scripts availability decline, the Borrowing Base will decrease, and the availability under the New ABL Credit Facility may decrease below $2,000.0 million; provided that, on the Closing Date and until the ninetieth day after the Closing Date, regardless of the calculation of the Borrowing Base on the Closing Date, the Borrowing Base shall be deemed to be no less than $1,500.0 million; provided, further, that if the ABL Administrative Agent receives certain field examinations and appraisals prior to the Closing Date and if the Borrowing Base would, without giving effect to the foregoing proviso, be less than or equal to $1,500.0 million, then the Borrowing Base shall be deemed to be the greater of (x) the Borrowing Base without giving effect to the foregoing proviso and (y) $1,300.0 million on the Closing Date until the ninetieth day after the Closing Date.
The borrowings of the U.S. Borrowers under the New ABL Credit Facility bear interest at rates that, at the Company’s option, can be either: (i) a base rate generally defined as the sum of (x) the highest of (a) the Administrative Agent’s prime rate, (b) the average overnight federal funds effective rate plus one-half percent (0.50%) per annum and (c) one-month LIBOR plus one percent (1%) per annum and (y) an applicable margin or (ii) LIBOR rate generally defined as the sum of (x) the London Interbank Offered Rate (as published on the applicable Reuters screen page, or other commercially available source) and (y) an applicable margin. The initial applicable margin for base rate loans is 0.25%, and the initial applicable margin for LIBOR loans is 1.25%. Commencing on the first day of the calendar month following the ABL Administrative Agent’s receipt of the Company’s financial statements for the fiscal quarter ending on or about October 27, 2018, and quarterly thereafter, the applicable margins for borrowings by the U.S. Borrowers will be subject to adjustment based upon the aggregate availability under the New ABL Credit Facility. Interest on the U.S. Borrowers’ borrowings is payable monthly in arrears for base rate loans and at the end of each interest rate period (but not less often than quarterly) for LIBOR loans. The borrowings of the Canadian Borrower under the New ABL Credit Facility bear interest at rates that, at the Canadian Borrower’s option, can be either: (i) prime rate generally defined as the sum of (x) the highest of (a) 30-day Reuters Canadian Deposit Offering Rate for Canadian dollar bankers’ acceptances plus one-half percent (0.50%) per annum, (b) the prime rate of Bank of America, N.A.’s Canada branch, and (c) a Canadian dollar bankers’ acceptance equivalent rate for a one month interest period plus one percent (1%) per annum and (y) an applicable margin or (ii) a Canadian dollar bankers’ acceptance equivalent rate generally defined as the sum of (x) the rate of interest per annum equal to the annual rates applicable to Canadian Dollar bankers’ acceptances on the “CDOR Page” of Reuter Monitor Money Rates Service, and (y) an applicable margin. This is the exclusive method of interest accrual for loans that are not Canadian swingline loans, Canadian overadvance loans or Canadian protective advances. The initial applicable margin for prime rate loans is 0.25%, and the initial applicable margin for Canadian dollar bankers’ acceptance equivalent rate loans is 1.25%. Commencing on the first day of the calendar month following the ABL Administrative Agent’s receipt of the Company’s financial statements for the fiscal quarter ending on or about October 27, 2018, and quarterly thereafter, the applicable margins for borrowings by the Canadian Borrower will be subject to adjustment based upon the aggregate availability under the New ABL Credit Facility. Interest on the Canadian Borrower’s borrowings is payable monthly in arrears for prime rate loans and at the end of each interest rate period (but not less often than quarterly) for bankers’ acceptance equivalent rate loans. Unutilized commitments under the New ABL Credit Facility are subject to a per annum fee of (i) from and after the Closing Date through and including the first day of the calendar month that is three months following the Closing Date, 0.375% and (ii) thereafter, (x) 0.375% if the total outstandings were less than 25% of the aggregate commitments, or (y) 0.25% if such total outstandings were 25% or more of the aggregate commitments. The Borrowers are also required to pay a letter of credit fronting fee to each letter of credit issuer equal to 0.125% per annum of the amount available to be drawn under each such letter of credit (or such other amount as may be mutually agreed by the Borrowers and the applicable letter of credit issuer), as well as a fee to all lenders equal to the applicable margin for LIBOR or Canadian dollar bankers’ acceptance equivalent rate loans, as applicable, times the average daily amount available to be drawn under all outstanding letters of credit.
31
The obligations of the Lenders to provide Loans under the New ABL Loan Agreement on the Closing Date are subject to a number of customary conditions, including, without limitation, the consummation of the Merger (which must occur by January 25, 2019, subject to extension in certain circumstances pursuant to the terms of Merger Agreement) and execution and delivery by the Borrowers and the guarantors of definitive documentation consistent with the New ABL Loan Agreement and the documentation standards specified therein.
The Company expects to fund its acquisition of SUPERVALU with, among other sources, borrowings under the New ABL Credit Facility. Pursuant to the Amended Commitment Letter, the Company may use the entire amount of the proceeds of the New Term Loan Facility and up to $1,200.0 million (plus an amount necessary to pay certain fees or original issues discount) of the proceeds from the New ABL Credit Facility to finance the Merger and the transaction costs. In addition to funding the acquisition price to acquire SUPERVALU, the Company expects to refinance and repay substantially all of SUPERVALU's existing debt.
Term Loan Facility
On August 14, 2014, we and certain of our subsidiaries entered into a real estate backed term loan agreement as amended by the First Amendment Agreement, dated April 29, 2016, and the Second Amendment Agreement, dated September 1, 2016, the "Existing Term Loan Agreement"). The total initial borrowings under our term loan facility were $150.0 million. We are required to make $2.5 million principal payments quarterly. Under the Existing Term Loan Agreement, we at our option may request the establishment of one or more new term loan commitments in increments of at least $10.0 million, but not to exceed $50.0 million in total, subject to the approval of the Lenders electing to participate in such incremental loans and the satisfaction of the conditions required by the Existing Term Loan Agreement. Proceeds from this Existing Term Loan Agreement were used to pay down borrowings under the Existing ABL Loan Agreement.
Borrowings under the Existing Term Loan Agreement bear interest at rates that, at the Company's option, can be either: (1) a base rate generally defined as the sum of (i) the highest of (x) the administrative agent's prime rate, (y) the average overnight federal funds effective rate plus 0.50% and (z) one-month LIBOR plus one percent (1%) per annum and (ii) a margin of 0.75%; or, (2) a LIBOR rate generally defined as the sum of (i) LIBOR (as published by Reuters or other commercially available source) for one, two, three or six months or, if approved by all affected lenders, nine months (all as selected by the Company), and (ii) a margin of 1.75%. Interest accrued on borrowings under the Existing Term Loan Agreement is payable in arrears. Interest accrued on any LIBOR loan is payable on the last day of the interest period applicable to the loan and, with respect to any LIBOR loan of more than three (3) months, on the last day of every three (3) months of such interest period. Interest accrued on base rate loans is payable on the first day of every month. The Company is also required to pay certain customary fees to the administrative agent. The borrowers’ obligations under the Existing Term Loan Agreement are secured by certain parcels of the borrowers’ real property.
The Existing Term Loan Agreement includes financial covenants that require (i) the ratio of our consolidated EBITDA (as defined in the Existing Term Loan Agreement) minus the unfinanced portion of Capital Expenditures (as defined in the Existing Term Loan Agreement) to our consolidated Fixed Charges (as defined in the Existing Term Loan Agreement) to be at least 1.20 to 1.00 as of the end of any period of four fiscal quarters, (ii) the ratio of our Consolidated Funded Debt (as defined in the Existing Term Loan Agreement) to our EBITDA for the four fiscal quarters most recently ended to be not more than 3.00 to 1.00 as of the end of any fiscal quarter and (iii) the ratio, expressed as a percentage, of our outstanding principal balance under the Loans (as defined in the Existing Term Loan Agreement), divided by the Mortgaged Property Value (as defined in the Existing Term Loan Agreement) to be not more than 75% at any time. As of July 28, 2018, the Company was in compliance with the financial covenants of the Existing Term Loan Agreement.
As of July 28, 2018, the Company had borrowings of $108.8 million, net of debt issuance costs of $1.2 million, under the Existing Term Loan Agreement which is included in “Long-term debt” in the consolidated balance sheet.
On August 22, 2018, the Company notified its lenders that it intends to prepay its borrowings outstanding under the Existing Term Loan Agreement on October 1, 2018, which were approximately $110.0 million as of July 28, 2018. The Existing Term Loan Agreement was previously scheduled to terminate on the earlier of (a) August 14, 2022 and (b) the date that is ninety days prior to the termination date of the Existing ABL Loan Agreement. Concurrently with the prepayment of borrowings outstanding under the Existing Term Loan Agreement, the Company intends to draw on its Existing ABL Loan Agreement in an amount equal to its Existing Term Loan Agreement prepayment amount.
Pursuant to the terms of the Amended Commitment Letter, on the Closing Date, concurrently with the consummation of the Merger, the Company will enter into a new term loan agreement (the “New Term Loan Agreement”) providing for the New Term Loan Facility. Under the terms of the Amended Commitment Letter, the New Term Loan Facility will consist of a $2,050 million senior secured term loan facility. The New Term Loan Facility will have a term of seven years and will be secured by (i) a first-priority lien on all of our and our domestic subsidiaries' assets that do not constitute ABL Assets (defined in the immediately succeeding clause) and (ii) a second-priority lien on all of our and our domestic subsidiaries' accounts receivable, inventory and certain other
32
assets arising therefrom or related thereto (including, without limitation, substantially all of their deposit accounts, collectively, the "ABL Assets"), in each case, subject to customary exceptions and limitations on the Closing Date.
We expect that the New Term Loan Agreement will have customary affirmative and negative covenants and events of default that are generally consistent with our New ABL Loan Agreement. The closing of the New Term Loan Facility will be subject to customary conditions precedent, including the negotiation and execution of final documentation and consummation of the Merger.
Interest Swap Agreements
On January 23, 2015, the Company entered into a forward starting interest rate swap agreement with an effective date of August 3, 2015, which expires in August 2022 concurrent with the scheduled maturity of our Existing Term Loan Agreement. This interest rate swap agreement has a notional amount of $112.5 million and provides for the Company to pay interest for a seven-year period at a fixed rate of 1.795% while receiving interest for the same period at the one-month LIBOR on the same notional principal amount. The interest rate swap agreement has an amortizing notional amount which adjusts down on the dates payments are due on the underlying term loan. The interest rate swap has been entered into as a hedge against LIBOR movements on $112.5 million of the variable rate indebtedness under the Existing Term Loan Agreement at one-month LIBOR plus 1.00% and a margin of 1.50%, thereby fixing our effective rate on the notional amount at 4.295%. The swap agreement qualifies as an “effective” hedge under Accounting Standard Codification ("ASC") 815 Derivatives and Hedging.
On June 7, 2016, the Company entered into two pay fixed and receive floating interest rate swap agreements to effectively fix the underlying variable rate debt on the Existing ABL Loan Agreement. The first agreement has an effective date of June 9, 2016 and expires in June of 2019. This interest rate swap agreement has a notional principal amount of $50.0 million and provides for the Company to pay interest for a three-year period at a fixed annual rate of 0.8725% while receiving interest for the same period at one-month LIBOR on the same notional principal amount. This swap, in conjunction with the Existing ABL Loan Agreement, effectively fixes the interest rate on the $50.0 million notional amount. The second agreement has an effective date of June 9, 2016 and expires concurrent with the scheduled maturity of our Existing ABL Loan Agreement in April of 2021. This interest rate swap agreement has a notional principal amount of $25.0 million and provides for the Company to pay interest for a five-year period at a fixed rate of 1.065% while receiving interest for the same period at one-month LIBOR on the same notional principal amount. This swap, in conjunction with the Existing ABL Loan Agreement, effectively fixes the interest rate on the $25.0 million notional amount. The swap agreement qualifies as an “effective” hedge under Accounting Standard Codification ("ASC") 815 Derivatives and Hedging.
On June 24, 2016, the Company entered into two additional pay fixed and receive floating interest rate swap agreements to effectively fix the underlying variable rate debt on the Existing ABL Loan Agreement. The first agreement has an effective date of July 24, 2016 and expires in June of 2019. This interest rate swap agreement has a notional principal amount of $50.0 million and provides for the Company to pay interest for a three year period at a fixed annual rate of 0.7265% while receiving interest for the same period at one-month LIBOR on the same notional principal amount. This swap, in conjunction with the Existing ABL Loan Agreement, effectively fixes the interest rate on the $50.0 million notional amount. The second agreement has an effective date of July 24, 2016 and expires concurrent with the scheduled maturity of Existing ABL Loan Agreement in April of 2021. This interest rate swap agreement has a notional principal amount of $25.0 million and provides for the Company to pay interest for a five year period at a fixed rate of 0.9260% while receiving interest for the same period at one-month LIBOR on the same notional principal amount. This swap, in conjunction with the Existing ABL Loan Agreement, effectively fixes the interest rate on the $25.0 million notional amount. The swap agreement qualifies as an “effective” hedge under Accounting Standard Codification ("ASC") 815 Derivatives and Hedging.
Our capital expenditures for the 2018 fiscal year were $44.6 million, compared to $56.1 million for fiscal 2017, a decrease of $11.5 million. Excluding the SUPERVALU acquisition, capital expenditures are expected to be 1.5% to 1.7% of net sales, driven by capacity expansion projects. We are committed to these particular capital projects with a strong financial return, with or without the impact of the pending SUPERVALU acquisition. On a combined basis with SUPERVALU and over the long-term, we expect the combined company's capital expenditures, as a percentage of net sales, to be approximately 1.0% of net sales, which excludes capital growth assumptions related to optimizing our capacity and IT spending going forward. We expect to finance requirements with cash generated from operations and borrowings under our New ABL Credit Facility. Our planned capital projects for fiscal 2019 will be focused on the expansion of distribution center capacity in certain geographies and integration efforts related to the pending acquisition of SUPERVALU. Future investments may be financed through long-term debt or borrowings under our New ABL Credit Facility.
Other
Net cash provided by operations was $109.5 million for the fiscal year ended July 28, 2018, a decrease of $171.3 million from the $280.8 million provided by operations for the year ended July 29, 2017. The primary reasons for the net cash provided by operating activities for fiscal 2018 were net income for the year of $165.7 million, which included depreciation and amortization
33
of $87.6 million, and share based compensation expense of $25.8 million, offset by increases in inventory and accounts receivable of $108.8 million and $67.3 million, respectively. Net cash provided by operations of $280.8 million for the year ended July 29, 2017 was primarily due to net income for the year of $130.2 million, which included depreciation and amortization of $86.1 million, and an increase in accounts payable of $90.2 million, offset by an increase in accounts receivable of $38.8 million.
Days in inventory was 48 days at July 28, 2018 and July 29, 2017. Days sales outstanding was 21 at July 28, 2018 and July 29, 2017. Working capital increased by $131.0 million, or 13.7%, to $1.09 billion at July 28, 2018, compared to working capital of $958.7 million at July 29, 2017. This increase was primarily as a result of an increase in inventory to support increased demand for our products.
Net cash used in investing activities decreased approximately $13.0 million to $47.0 million for the fiscal year ended July 28, 2018, compared to $60.0 million for the fiscal year ended July 29, 2017. This decrease was primarily due to a decrease in cash paid for acquisitions of $9.2 million and a $11.5 million decrease in capital spending.
Net cash used in financing activities was $54.0 million for the fiscal year ended July 28, 2018. The net cash used in financing activities was primarily due to repayments of borrowings under our Existing ABL Facility of $569.7 million share repurchases of $24.2 million and repayments of long-term debt of $12.1 million, partially offset by proceeds from borrowings under our Existing ABL Facility of $556.1 million. Net cash used in financing activities was $224.6 million for the fiscal year ended July 29, 2017 and was primarily due to repayments of borrowings under our Existing ABL Facility and long term debt of $418.7 million and $11.5 million, respectively, partially offset by proceeds from borrowings under our Existing ABL Facility of $215.7 million.
From time-to-time we enter into fixed price fuel supply agreements. As of July 28, 2018 and July 29, 2017, we were not a party to any such agreements. We were party to a contract during fiscal 2017, which required us to purchase a total of approximately 6.1 million gallons of diesel fuel at prices ranging from $1.76 to $3.18 per gallon through December 2016. All of these fixed price fuel agreements qualified and were accounted for under the "normal purchase" exception under ASC 815, Derivatives and Hedging as physical deliveries occurred rather than net settlements, and therefore the fuel purchases under these contracts have been expensed as incurred and included within operating expenses.
Critical Accounting Policies and Estimates
The preparation of our consolidated financial statements requires us to make estimates and judgments that affect the reported amounts of assets, liabilities, revenues and expenses, and the related disclosure of contingent assets and liabilities. The Securities and Exchange Commission has defined critical accounting policies as those that are both most important to the portrayal of our financial condition and results and require our most difficult, complex or subjective judgments or estimates. Based on this definition, we believe our critical accounting policies are: (i) determining our reserves for the self-insured portions of our workers' compensation and automobile liabilities, (ii) valuing assets and liabilities acquired in business combinations; (iii) valuing goodwill and intangible assets; and (iv) income taxes. For all financial statement periods presented, there have been no material modifications to the application of these critical accounting policies.
Insurance reserves
We are primarily self-insured for workers' compensation and general and automobile liability insurance. It is our policy to record the self-insured portions of our workers' compensation and automobile liabilities based upon actuarial methods of estimating the future cost of claims and related expenses that have been reported but not settled, and that have been incurred but not yet reported. Any projection of losses concerning workers' compensation and automobile liability is subject to a considerable degree of variability. Among the causes of this variability are unpredictable external factors affecting litigation trends, benefit level changes and claim settlement patterns. If actual claims incurred are greater than those anticipated, our reserves may be insufficient and additional costs could be recorded in our consolidated financial statements. Accruals for workers' compensation and automobile liabilities totaled $25.0 million and $22.8 million as of July 28, 2018 and July 29, 2017, respectively.
Valuation of assets and liabilities acquired in a business combination
We account for acquired businesses using the purchase method of accounting which requires that the assets acquired and liabilities assumed be recorded at the date of the acquisition at their respective estimated fair values. Goodwill represents the excess of cost over the fair value of net assets acquired in a business combination. The judgments made in determining the estimated fair value assigned to each class of assets acquired, as well as the estimated useful life of each asset, can materially impact the net income of the periods subsequent to the acquisition through depreciation and amortization, and in certain instances through impairment charges, if the asset becomes impaired in the future. In determining the estimated fair value for intangible assets, we typically utilize the income approach, which discounts the projected future net cash flow using an appropriate discount rate that reflects the risks associated with such projected future cash flow.
34
Determining the useful life of an intangible asset also requires judgment, as different types of intangible assets will have different useful lives and certain assets may even be considered to have indefinite useful lives. Intangible assets determined to have an indefinite useful life are reassessed periodically based on the expected use of the asset by us, legal or contractual provisions that may affect the useful life or renewal or extension of the asset’s contractual life without substantial cost, and the effects of demand, competition and other economic factors.
Valuation of goodwill and intangible assets
We are required to test goodwill for impairment at least annually, and between annual tests if events occur or circumstances change that would more likely than not reduce the fair value of a reporting unit below its carrying amount. We have elected to perform our annual tests for indications of goodwill impairment as of the first day of the fourth quarter of each fiscal year. We test for goodwill impairment at the reporting unit level, which is at or one level below the operating segment level. As of July 28, 2018, approximately 97.2% of our goodwill is within our wholesale reporting segment. Total goodwill as of July 28, 2018 and July 29, 2017 was $362.5 million and $371.3 million, respectively.
In accordance with Accounting Standards Update ("ASU") No. 2011-08, Testing Goodwill for Impairment, ("ASU 2011-08"), the Company is allowed to perform a qualitative assessment for goodwill impairment unless it believes it is more likely than not that a reporting unit's fair value is less than the carrying value. The thresholds used by the Company for this determination in fiscal 2018 were for any reporting units that (1) have passed their previous quantitative test with a margin of calculated fair value versus carrying value of at least 20%, (2) have had a quantitative test within the past five years, (3) have had no significant changes to their working capital structure, (4) have current year income which is at least 85% of prior year amounts, and (5) present no other factors to be considered as outlined in ASU 2011-08. The Company's reporting units are at or one level below the operating segment level.
For reporting units which do not meet this exclusion, the quantitative goodwill impairment analysis is performed in accordance with ASU No. 2017-04, Intangibles, Goodwill and Other (Topic 350), Simplifying the Test for Goodwill Impairment, (“ASU- 2017-04”), which the Company early adopted as part of its fiscal 2017 annual goodwill impairment test. This analysis involves comparing each reporting unit's estimated fair value to its carrying value, including goodwill. Each reporting unit regularly prepares discrete operating forecasts and uses these forecasts as the basis for the assumptions used in the discounted cash flow analysis. If the estimated fair value of a reporting unit exceeds its carrying value, goodwill is considered not to be impaired and no further testing is required.
During fiscal 2018 the Company recorded a total impairment charge of $7.9 million to goodwill related to its Earth Origins retail business. Refer to Note 1, "Significant Accounting Policies", and Note 5, "Restructuring Activities", to our Consolidated Financial Statements included in "Item 8. Financial Statements and Supplementary Data" of this Annual Report for further detail. The Company performed a qualitative test on its other reporting units during the fourth quarter of fiscal 2018 based on the criteria noted above and determined that a quantitative test was not required.
Intangible assets and other long lived assets with finite lives are tested for impairment whenever events or changes in circumstances indicate that the carrying value may not be recoverable. Cash flows expected to be generated by the related assets are estimated over the asset's useful life based on updated projections. If the evaluation indicates that the carrying amount of the asset may not be recoverable, the potential impairment is measured based on a projected discounted cash flow model. Impairment is measured as the difference between the fair value of the asset and its carrying value.
In accordance with ASU No. 2011-08, the Company is allowed to perform a qualitative assessment for indefinite lived intangible assets unless it believes it is more likely than not that an intangible asset's fair value is less than the carrying value. The thresholds used by the Company for this determination in the fourth quarter of fiscal 2018 were for any intangible assets (or groups of assets) that (1) have passed their previous quantitative test with a margin of calculated fair value versus carrying value of at least 20%, (2) have had a quantitative test performed within the past five years, and (3) have current year income which is at least 85% of the immediately preceding fiscal year's amounts.
As of July 28, 2018, our annual assessment of each of our intangible assets with indefinite lives indicated that no impairment existed. Total indefinite lived intangible assets as of July 28, 2018 and July 29, 2017 were $55.8 million and $55.8 million, respectively. Total finite-lived intangible assets as of July 28, 2018 and July 29, 2017 were $137.4 million and $152.5 million, respectively.
Income Taxes
The Company accounts for income taxes under the asset and liability method. Under the asset and liability method, deferred tax assets and liabilities are recognized for the future tax consequences attributable to differences between the financial statement carrying amounts of existing assets and liabilities and their respective tax bases. Deferred tax assets and liabilities are measured
35
using enacted tax rates expected to apply to taxable income in the years in which those temporary differences are expected to be recovered or settled. The effect on deferred tax assets and liabilities of a change in tax rates is recognized in income in the period that includes the enactment date.
The calculation of the Company's tax liabilities includes addressing uncertainties in the application of complex tax regulations and is based on the financial statement recognition and measurement of a tax position taken or expected to be taken in a tax return. Addressing these uncertainties requires judgment and estimates; however, actual results could differ, and we may be exposed to losses or gains. Our effective tax rate in a given financial statement period could be affected based on favorable or unfavorable tax settlements. Unfavorable tax settlements will generally require the use of cash and may result in an increase to our effective tax rate in the period of resolution. Favorable tax settlements may be recognized as a reduction to our effective tax rate in the period of resolution.
On December 22, 2017, the U.S. government enacted comprehensive tax legislation under the TCJA. The TCJA makes broad and complex changes to the U.S. tax code, including reducing the U.S. federal corporate tax rate from 35 percent to 21 percent, effective January 1, 2018. Shortly after the TCJA was enacted, the Securities and Exchange Commission ("SEC") issued accounting guidance, which provides a one-year measurement period during which a company may complete its accounting for the impacts of the TCJA. To the extent a company’s accounting for certain income tax effects of the TCJA is incomplete, the company may determine a reasonable estimate for those effects and record a provisional estimate in its financial statements. See “Note 12 Income Taxes” for further effects of the new tax legislation on the Company.
Commitments and Contingencies
The following schedule summarizes our contractual obligations and commercial commitments as of July 28, 2018:
Payments Due by Period | |||||||||||||||||||
Total | Less than One Year | 1–3 Years | 3–5 Years | Thereafter | |||||||||||||||
(in thousands) | |||||||||||||||||||
Inventory purchase commitments | $ | 15,873 | $ | 15,873 | $ | — | $ | — | $ | — | |||||||||
Notes payable (1) | 210,000 | — | 210,000 | — | — | ||||||||||||||
Long-term debt (2) | 151,314 | 12,441 | 106,019 | 7,618 | 25,236 | ||||||||||||||
Deferred compensation | 6,708 | 1,147 | 1,725 | 1,487 | 2,349 | ||||||||||||||
Multi-employer plan withdrawal liability | 3,380 | 100 | 220 | 251 | 2,809 | ||||||||||||||
Long-term non-capitalized leases | 231,740 | 64,688 | 89,362 | 46,804 | 30,886 | ||||||||||||||
Total | $ | 619,015 | $ | 94,249 | $ | 407,326 | $ | 56,160 | $ | 61,280 | |||||||||
(1) The notes payable obligations shown reflect the expiration of the Existing ABL Loan Agreement, not necessarily the underlying individual borrowings. Notes payable does not include outstanding letters of credit of approximately $24.3 million at July 28, 2018 or approximately $13.0 million in interest payments (including unused lines fees) projected to be due in future years (less than 1 year – $6.3 million; 1-3 years – $5.5 million; and 3-5 years – $1.2 million) based on the variable rates in effect at July 28, 2018. Variable rates, as well as outstanding principal balances, could change in future periods. See "Liquidity and Capital Resources" above and Note 7 "Notes Payable" to our Consolidated Financial Statements included in "Item 8. Financial Statements and Supplementary Data" of this Annual Report for a discussion of our credit facility.
(2) Long-term debt does not include interest payments projected to be due in future years related to our capital lease obligations and the Existing Term Loan Agreement, which amount to approximately $20.9 million and $10.8 million, respectively (less than 1 year - $6.7 million; 1-3 years - $11.7 million; 3-5 years - $8.5 million; thereafter - $4.8 million). See Note 8 "Long-Term Debt" to our Consolidated Financial Statements included in "Item 8. Financial Statements and Supplementary Data" of this Annual Report for a discussion of our long-term debt.
Included in other liabilities in the consolidated balance sheet at July 28, 2018 are uncertain tax positions including potential interest and penalties of $0.9 million that have been taken or are expected to be taken in various income tax returns. The Company does not know the ultimate resolution of these uncertain tax positions and as such, does not know the ultimate timing of payments related to this liability. Accordingly, these amounts are not included in the table above.
36
Recently Issued Financial Accounting Standards
For a discussion of recently issued financial accounting standards, refer to Note 1, "Significant Accounting Policies," to our Consolidated Financial Statements included in "Item 8. Financial Statements and Supplementary Data" of this Annual Report on for further detail.
ITEM 7A. QUANTITATIVE AND QUALITATIVE DISCLOSURES ABOUT MARKET RISK.
We are exposed to interest rate fluctuations on our borrowings. As more fully described in Note 9 "Fair Value Measurements" to the Consolidated Financial Statements included in "Item 8. Financial Statements and Supplementary Data" of this Annual Report, we have used interest rate swap agreements to modify certain of our variable rate obligations to fixed rate obligations.
At July 28, 2018, we had long-term floating rate debt under the Existing ABL Loan Agreement of $210.0 million and our Existing Term Loan Agreement of $110.0 million, gross of deferred financing costs, and long-term fixed rate debt of $41.3 million, representing 88.6% and 11.4%, respectively, of our long-term borrowings. At July 29, 2017, we had long-term floating rate debt under the Existing ABL Loan Agreement of $223.6 million and our Existing Term Loan Agreement of $120.0 million, gross of deferred financing costs, and long-term fixed rate debt of $43.4 million, representing 88.8% and 11.2%, respectively, of our long-term borrowings. Holding other debt levels constant, a 25 basis point increase in interest rates would change the unrealized fair market value of our fixed rate debt by approximately $0.5 million and $0.6 million for the fiscal years ended July 28, 2018 and July 29, 2017, respectively.
37
ITEM 8. FINANCIAL STATEMENTS AND SUPPLEMENTARY DATA
The financial statements listed below are filed as part of this Annual Report.
INDEX TO FINANCIAL STATEMENTS
United Natural Foods, Inc. and Subsidiaries: | Page | |
38
Report of Independent Registered Public Accounting Firm
The Stockholders and Board of Directors
United Natural Foods, Inc.:
Opinions on the Consolidated Financial Statements and Internal Control Over Financial Reporting
We have audited the accompanying consolidated balance sheets of United Natural Foods, Inc. and subsidiaries (the Company) as of July 28, 2018 and July 29, 2017, the related consolidated statements of income, comprehensive income, stockholders’ equity, and cash flows for each of the years in the three-year period ended July 28, 2018 and the related notes, (collectively the consolidated financial statements). We also have audited the Company’s internal control over financial reporting as of July 28, 2018, based on criteria established in Internal Control - Integrated Framework (2013) issued by the Committee of Sponsoring Organizations of the Treadway Commission (COSO).
In our opinion, the consolidated financial statements referred to above present fairly, in all material respects, the financial position of the Company as of July 28, 2018 and July 29, 2017, and the results of its operations and its cash flows for each of the years in the three-year period ended July 28, 2018, in conformity with U.S. generally accepted accounting principles. Also in our opinion, the Company maintained, in all material respects, effective internal control over financial reporting as of July 28, 2018, based on criteria established in Internal Control - Integrated Framework (2013) issued by the Committee of Sponsoring Organizations of the Treadway Commission.
Basis for Opinions
The Company’s management is responsible for these consolidated financial statements, for maintaining effective internal control over financial reporting, and for its assessment of the effectiveness of internal control over financial reporting, included in the accompanying Management’s Annual Report on Internal Control Over Financial Reporting. Our responsibility is to express an opinion on the Company’s consolidated financial statements and an opinion on the Company’s internal control over financial reporting based on our audits. We are a public accounting firm registered with the Public Company Accounting Oversight Board (United States) (PCAOB) and are required to be independent with respect to the Company in accordance with the U.S. federal securities laws and the applicable rules and regulations of the Securities and Exchange Commission and the PCAOB.
We conducted our audits in accordance with the standards of the PCAOB. Those standards require that we plan and perform the audits to obtain reasonable assurance about whether the consolidated financial statements are free of material misstatement and whether effective internal control over financial reporting was maintained in all material respects. Our audits of the consolidated financial statements included performing procedures to assess the risks of material misstatement of the consolidated financial statements, whether due to error or fraud, and performing procedures that respond to those risks. Such procedures included examining, on a test basis, evidence regarding the amounts and disclosures in the consolidated financial statements. Our audits also included evaluating the accounting principles used and significant estimates made by management, as well as evaluating the overall presentation of the consolidated financial statements. Our audit of internal control over financial reporting included obtaining an understanding of internal control over financial reporting, assessing the risk that a material weakness exists, and testing and evaluating the design and operating effectiveness of internal control based on the assessed risk. Our audits also included performing such other procedures as we considered necessary in the circumstances. We believe that our audits provide a reasonable basis for our opinions.
Definition and Limitations of Internal Control Over Financial Reporting
A company’s internal control over financial reporting is a process designed to provide reasonable assurance regarding the reliability of financial reporting and the preparation of financial statements for external purposes in accordance with generally accepted accounting principles. A company’s internal control over financial reporting includes those policies and procedures that (1) pertain to the maintenance of records that, in reasonable detail, accurately and fairly reflect the transactions and dispositions of the assets of the company; (2) provide reasonable assurance that transactions are recorded as necessary to permit preparation of financial statements in accordance with generally accepted accounting principles, and that receipts and expenditures of the company are being made only in accordance with authorizations of management and directors of the company; and (3) provide reasonable assurance regarding prevention or timely detection of unauthorized acquisition, use, or disposition of the company’s assets that could have a material effect on the financial statements.
Because of its inherent limitations, internal control over financial reporting may not prevent or detect misstatements. Also, projections of any evaluation of effectiveness to future periods are subject to the risk that controls may become inadequate because of changes in conditions, or that the degree of compliance with the policies or procedures may deteriorate.

We have served as the Company’s auditor since 1993.
Providence, Rhode Island
September 24, 2018
39
UNITED NATURAL FOODS, INC. AND SUBSIDIARIES
CONSOLIDATED BALANCE SHEETS
(In thousands, except per share data)
July 28, 2018 | July 29, 2017 | ||||||
ASSETS | |||||||
Current assets: | |||||||
Cash and cash equivalents | $ | 23,315 | $ | 15,414 | |||
Accounts receivable, net of allowance of $15,996 and $13,939, respectively | 579,702 | 525,636 | |||||
Inventories | 1,135,775 | 1,031,690 | |||||
Deferred income taxes | — | 40,635 | |||||
Prepaid expenses and other current assets | 50,122 | 49,295 | |||||
Total current assets | 1,788,914 | 1,662,670 | |||||
Property and equipment, net | 571,146 | 602,090 | |||||
Goodwill | 362,495 | 371,259 | |||||
Intangible assets, net of accumulated amortization of $64,438 and $49,926, respectively | 193,209 | 208,289 | |||||
Other assets | 48,708 | 42,255 | |||||
Total assets | $ | 2,964,472 | $ | 2,886,563 | |||
LIABILITIES AND STOCKHOLDERS' EQUITY | |||||||
Current liabilities: | |||||||
Accounts payable | $ | 517,125 | $ | 534,616 | |||
Accrued expenses and other current liabilities | 169,658 | 157,243 | |||||
Current portion of long-term debt | 12,441 | 12,128 | |||||
Total current liabilities | 699,224 | 703,987 | |||||
Notes payable | 210,000 | 223,612 | |||||
Deferred income taxes | 44,384 | 98,833 | |||||
Other long-term liabilities | 27,200 | 28,347 | |||||
Long-term debt, excluding current portion | 137,709 | 149,863 | |||||
Total liabilities | 1,118,517 | 1,204,642 | |||||
Commitments and contingencies (Note 10) | |||||||
Stockholders' equity: | |||||||
Preferred stock, $0.01 par value, authorized 5,000 shares; none issued or outstanding | — | — | |||||
Common stock, $0.01 par value, authorized 100,000 shares; 51,025 shares issued and 50,411 shares outstanding at July 28, 2018; 50,622 issued and outstanding shares at July 29, 2017 | 510 | 506 | |||||
Additional paid-in capital | 483,623 | 460,011 | |||||
Treasury stock at cost | (24,231 | ) | — | ||||
Accumulated other comprehensive loss | (14,179 | ) | (13,963 | ) | |||
Retained earnings | 1,400,232 | 1,235,367 | |||||
Total stockholders' equity | 1,845,955 | 1,681,921 | |||||
Total liabilities and stockholders' equity | $ | 2,964,472 | $ | 2,886,563 | |||
See accompanying notes to consolidated financial statements.
40
UNITED NATURAL FOODS, INC. AND SUBSIDIARIES
CONSOLIDATED STATEMENTS OF INCOME
(In thousands, except per share data)
Fiscal year ended | |||||||||||
July 28, 2018 | July 29, 2017 | July 30, 2016 | |||||||||
Net sales | $ | 10,226,683 | $ | 9,274,471 | $ | 8,470,286 | |||||
Cost of sales | 8,703,916 | 7,845,550 | 7,190,935 | ||||||||
Gross profit | 1,522,767 | 1,428,921 | 1,279,351 | ||||||||
Operating expenses | 1,279,529 | 1,196,032 | 1,049,690 | ||||||||
Restructuring and asset impairment expenses | 16,013 | 6,864 | 5,552 | ||||||||
Total operating expenses | 1,295,542 | 1,202,896 | 1,055,242 | ||||||||
Operating income | 227,225 | 226,025 | 224,109 | ||||||||
Other expense (income): | |||||||||||
Interest expense | 16,471 | 17,114 | 16,259 | ||||||||
Interest income | (446 | ) | (360 | ) | (1,115 | ) | |||||
Other, net | (1,545 | ) | (5,152 | ) | 743 | ||||||
Total other expense, net | 14,480 | 11,602 | 15,887 | ||||||||
Income before income taxes | 212,745 | 214,423 | 208,222 | ||||||||
Provision for income taxes | 47,075 | 84,268 | 82,456 | ||||||||
Net income | $ | 165,670 | $ | 130,155 | $ | 125,766 | |||||
Basic per share data: | |||||||||||
Net income | $ | 3.28 | $ | 2.57 | $ | 2.50 | |||||
Weighted average basic shares of common stock | 50,530 | 50,570 | 50,313 | ||||||||
Diluted per share data: | |||||||||||
Net income | $ | 3.26 | $ | 2.56 | $ | 2.50 | |||||
Weighted average diluted shares of common stock | 50,837 | 50,775 | 50,399 | ||||||||
See accompanying notes to consolidated financial statements.
41
UNITED NATURAL FOODS, INC. AND SUBSIDIARIES
CONSOLIDATED STATEMENTS OF COMPREHENSIVE INCOME
(In thousands)
Fiscal year ended | |||||||||||
July 28, 2018 | July 29, 2017 | July 30, 2016 | |||||||||
Net income | $ | 165,670 | $ | 130,155 | $ | 125,766 | |||||
Other comprehensive income (loss): | |||||||||||
Foreign currency translation adjustments | (3,791 | ) | 3,537 | 205 | |||||||
Change in fair value of swap agreements, net of tax | 3,575 | 4,879 | (3,141 | ) | |||||||
Total other comprehensive (loss) income | (216 | ) | 8,416 | (2,936 | ) | ||||||
Total comprehensive income | $ | 165,454 | $ | 138,571 | $ | 122,830 | |||||
See accompanying notes to consolidated financial statements.
42
UNITED NATURAL FOODS, INC. AND SUBSIDIARIES
CONSOLIDATED STATEMENTS OF STOCKHOLDERS' EQUITY
Common Stock | Treasury Stock | Additional Paid in Capital | Accumulated Other Comprehensive (Loss) Income | Retained Earnings | Total Stockholders' Equity | ||||||||||||||||||||||||
(In thousands) | Shares | Amount | Shares | Amount | |||||||||||||||||||||||||
Balances at August 1, 2015 | 50,096 | $ | 501 | — | $ | — | $ | 420,584 | $ | (19,443 | ) | $ | 979,446 | $ | 1,381,088 | ||||||||||||||
Stock option exercises and restricted stock vestings, net | 287 | 3 | 291 | 294 | |||||||||||||||||||||||||
Share-based compensation | 15,308 | 15,308 | |||||||||||||||||||||||||||
Share-based compensation / restructuring costs | 67 | 67 | |||||||||||||||||||||||||||
Tax deficit associated with stock plans | (83 | ) | (83 | ) | |||||||||||||||||||||||||
Fair value of swap agreement, net of tax | (3,141 | ) | (3,141 | ) | |||||||||||||||||||||||||
Foreign currency translation | 205 | 205 | |||||||||||||||||||||||||||
Net income | 125,766 | 125,766 | |||||||||||||||||||||||||||
Balances at July 30, 2016 | 50,383 | $ | 504 | — | $ | — | $ | 436,167 | $ | (22,379 | ) | $ | 1,105,212 | $ | 1,519,504 | ||||||||||||||
Stock option exercises and restricted stock vestings, net | 239 | 2 | (1,041 | ) | (1,039 | ) | |||||||||||||||||||||||
Share-based compensation | 25,675 | 25,675 | |||||||||||||||||||||||||||
Share-based compensation / restructuring costs | 530 | 530 | |||||||||||||||||||||||||||
Tax deficit associated with stock plans | (1,320 | ) | (1,320 | ) | |||||||||||||||||||||||||
Fair value of swap agreements, net of tax | 4,879 | 4,879 | |||||||||||||||||||||||||||
Foreign currency translation | 3,537 | 3,537 | |||||||||||||||||||||||||||
Net income | 130,155 | 130,155 | |||||||||||||||||||||||||||
Balances at July 29, 2017 | 50,622 | $ | 506 | — | $ | — | $ | 460,011 | $ | (13,963 | ) | $ | 1,235,367 | $ | 1,681,921 | ||||||||||||||
Cumulative effect of change in accounting principle | 1,314 | (805 | ) | 509 | |||||||||||||||||||||||||
Stock option exercises and restricted stock vestings, net | 403 | 4 | (3,592 | ) | (3,588 | ) | |||||||||||||||||||||||
Share-based compensation | 25,783 | 25,783 | |||||||||||||||||||||||||||
Repurchase of common stock | 615 | (24,231 | ) | (24,231 | ) | ||||||||||||||||||||||||
Share-based compensation / restructuring costs | 107 | 107 | |||||||||||||||||||||||||||
Fair value of swap agreements, net of tax | 3,575 | 3,575 | |||||||||||||||||||||||||||
Foreign currency translation | (3,791 | ) | (3,791 | ) | |||||||||||||||||||||||||
Net income | 165,670 | 165,670 | |||||||||||||||||||||||||||
Balances at July 28, 2018 | 51,025 | $ | 510 | 615 | $ | (24,231 | ) | $ | 483,623 | $ | (14,179 | ) | $ | 1,400,232 | $ | 1,845,955 | |||||||||||||
See accompanying notes to consolidated financial statements.
43
UNITED NATURAL FOODS, INC. AND SUBSIDIARIES
CONSOLIDATED STATEMENTS OF CASH FLOWS
Fiscal year ended | |||||||||||
(In thousands) | July 28, 2018 | July 29, 2017 | July 30, 2016 | ||||||||
CASH FLOWS FROM OPERATING ACTIVITIES: | |||||||||||
Net income | $ | 165,670 | $ | 130,155 | $ | 125,766 | |||||
Adjustments to reconcile net income to net cash provided by operating activities: | |||||||||||
Depreciation and amortization | 87,631 | 86,051 | 71,006 | ||||||||
Deferred income tax (benefit) expense | (14,819 | ) | (1,891 | ) | 12,480 | ||||||
Share-based compensation | 25,783 | 25,675 | 15,308 | ||||||||
Excess tax deficit from share-based payment arrangements | — | 1,320 | 83 | ||||||||
Loss on disposition of assets | 2,820 | 943 | 458 | ||||||||
Restructuring and asset impairment | 3,370 | 640 | 758 | ||||||||
Goodwill impairment | 7,872 | — | — | ||||||||
Gain associated with disposal of investment | (699 | ) | (6,106 | ) | — | ||||||
Change in accounting estimate | (20,909 | ) | — | — | |||||||
Provision for doubtful accounts | 12,006 | 5,728 | 6,426 | ||||||||
Non-cash interest expense (income) | 275 | 175 | (106 | ) | |||||||
Changes in assets and liabilities, net of acquired companies: | |||||||||||
Accounts receivable | (67,283 | ) | (38,757 | ) | 29,417 | ||||||
Inventories | (108,795 | ) | (6,929 | ) | 2,113 | ||||||
Prepaid expenses and other assets | 4,473 | (6,383 | ) | 5,381 | |||||||
Accounts payable | 4,395 | 90,217 | 14,379 | ||||||||
Accrued expenses and other liabilities | 7,682 | (62 | ) | 13,140 | |||||||
Net cash provided by operating activities | 109,472 | 280,776 | 296,609 | ||||||||
CASH FLOWS FROM INVESTING ACTIVITIES: | |||||||||||
Capital expenditures | (44,608 | ) | (56,112 | ) | (41,375 | ) | |||||
Purchases of acquired businesses, net of cash acquired | (39 | ) | (9,207 | ) | (306,724 | ) | |||||
Long-term investment | (3,397 | ) | (2,000 | ) | — | ||||||
Proceeds from disposal of investment | 756 | 9,192 | — | ||||||||
Payment of company owned life insurance premiums | — | (2,000 | ) | (2,925 | ) | ||||||
Proceeds from disposition of assets | 283 | 168 | 109 | ||||||||
Net cash used in investing activities | (47,005 | ) | (59,959 | ) | (350,915 | ) | |||||
CASH FLOWS FROM FINANCING ACTIVITIES: | |||||||||||
Proceeds from borrowings under revolving credit line | 556,061 | 215,662 | 709,972 | ||||||||
Repayments of borrowings under revolving credit line | (569,671 | ) | (418,693 | ) | (646,481 | ) | |||||
Repayments of long-term debt | (12,128 | ) | (11,546 | ) | (11,255 | ) | |||||
Repurchase of common stock | (24,231 | ) | — | — | |||||||
(Decrease) increase in bank overdraft | (434 | ) | (7,445 | ) | 6,063 | ||||||
Proceeds from exercise of stock options | 975 | 274 | 2,011 | ||||||||
Payment of employee restricted stock tax withholdings | (4,563 | ) | (1,313 | ) | (1,717 | ) | |||||
Excess tax deficit from share-based payment arrangements | — | (1,320 | ) | (83 | ) | ||||||
Capitalized debt issuance costs | — | (180 | ) | (2,164 | ) | ||||||
Net cash (used in) provided by financing activities | (53,991 | ) | (224,561 | ) | 56,346 | ||||||
Effect of exchange rate changes on cash and cash equivalents | (575 | ) | 565 | (827 | ) | ||||||
NET INCREASE (DECREASE) IN CASH AND CASH EQUIVALENTS | 7,901 | (3,179 | ) | 1,213 | |||||||
Cash and cash equivalents at beginning of period | 15,414 | 18,593 | 17,380 | ||||||||
Cash and cash equivalents at end of period | $ | 23,315 | $ | 15,414 | $ | 18,593 | |||||
Supplemental disclosures of cash flow information: | |||||||||||
Cash paid for interest | $ | 16,471 | $ | 17,115 | $ | 16,696 | |||||
Cash paid for federal and state income taxes, net of refunds | $ | 64,042 | $ | 78,984 | $ | 67,028 | |||||
See accompanying notes to consolidated financial statements.
44
UNITED NATURAL FOODS, INC.
NOTES TO CONSOLIDATED FINANCIAL STATEMENTS
1. | SIGNIFICANT ACCOUNTING POLICIES |
Nature of Business
United Natural Foods, Inc. and its subsidiaries (the "Company") is a leading distributor of natural, organic and specialty products. The Company sells its products primarily throughout the United States and Canada.
Basis of Presentation
The accompanying consolidated financial statements include the accounts of the Company and its wholly-owned subsidiaries. All significant intercompany transactions and balances have been eliminated in consolidation. Certain prior year amounts have been reclassified to conform to the current year's presentation.
The fiscal year of the Company ends on the Saturday closest to July 31. Fiscal 2018, 2017 and 2016 ended on July 28, 2018, July 29, 2017 and July 30, 2016, respectively. Fiscal 2018, 2017 and 2016 contained 52 weeks. Each of the Company's interim quarters within fiscal 2018 and fiscal 2017 consisted of 13 weeks.
Net sales consist primarily of sales of natural, organic and specialty products to retailers, adjusted for customer volume discounts, returns and allowances. Net sales also include amounts charged by the Company to customers for shipping and handling, and fuel surcharges. The principal components of cost of sales include the amounts paid to suppliers for product sold, plus the cost of transportation necessary to bring the product to the Company's distribution facilities, offset by consideration received from suppliers in connection with the purchase or promotion of the suppliers' products. Cost of sales also includes amounts incurred by the Company's manufacturing subsidiary, United Natural Trading LLC, which does business as Woodstock Farms Manufacturing, for inbound transportation costs and depreciation for manufacturing equipment, offset by consideration received from suppliers in connection with the purchase or promotion of the suppliers' products. Operating expenses include salaries and wages, employee benefits, warehousing and delivery, selling, occupancy, insurance, administrative, share-based compensation, depreciation, and amortization expense. The Company disposed of its retail division in fiscal 2018. Other expense (income) includes interest on outstanding indebtedness, interest income and miscellaneous income and expenses.
Use of Estimates
The preparation of consolidated financial statements in conformity with accounting principles generally accepted in the United States of America requires management to make estimates and assumptions that affect amounts reported therein. Due to the inherent uncertainty involved in making estimates, actual results reported in future periods may be based on amounts that differ from those estimates.
During the first quarter of fiscal 2018, the Company opened its shared services center which established a centralized processing function for certain of its legal entities. As a result of the growth in net sales and inventory in fiscal 2018, the changes in processing, and the resulting increase in the Company’s estimate of its accrual for inventory purchases, the Company initiated a review of its supplier invoicing processes and undertook a review of its estimate of its accrual for inventory purchases.
The Company typically generates purchase orders to initiate the procurement process for the products it sells, and orders are subsequently fulfilled by suppliers and delivered to the Company. In certain situations, inventory purchased by the Company may be delivered to the Company prior to the supplier sending the Company an associated invoice. When the Company receives inventory from a supplier before the supplier invoice is received, the Company customarily accrues for liabilities associated with this received but not invoiced inventory as its accrual for inventory purchases. During the 13 and 39-week periods ended April 28, 2018 the Company experienced an increased volume in its accrual for inventory purchases. When the Company receives a supplier invoice subsequent to a period end, the invoice is reconciled to the accrual for inventory purchases account. Due to the large volumes of orders and SKUs, and pricing and quantity differences between the supplier invoice and the Company’s records, at times only a portion of the accrual for inventory purchases is able to be matched to the supplier invoice. Historically, the Company relieved any unresolved and partially matched amounts in its accrual for inventory purchases when such amounts were substantially matched or aged past twelve months as it was determined that a liability was no longer considered probable at that point.
In the third quarter of fiscal 2018, the Company finalized its analysis and review of its accrual for inventory purchases, including a historical data analysis of unmatched and partially matched amounts that were aged greater than twelve months and the ultimate resolution of such aged accruals. Based on its analysis, the Company determined that it could reasonably estimate the outcome of its partially matched supplier invoices upon receipt of such invoice rather than when the amount was aged greater than twelve
45
months and a liability was no longer considered probable. As a result of this change in estimate, accounts payable was reduced by $20.9 million, resulting in an increase to net income of $13.9 million, or $0.27 per diluted share, for both the 13 and the 39-weeks ended April 28, 2018.
Cash Equivalents
Cash equivalents consist of highly liquid investments with original maturities of three months or less.
Inventories and Cost of Sales
Inventories consist primarily of finished goods and are stated at the lower of cost or market, with cost being determined using the first-in, first-out (FIFO) method. Allowances received from suppliers are recorded as reductions in cost of sales upon the sale of the related products.
Property and Equipment
Property and equipment are stated at cost less accumulated depreciation and amortization. Equipment under capital leases is stated at the lower of the present value of minimum lease payments at the inception of the lease or the fair value of the asset. Property and equipment includes the non-cash expenditures made by the landlord for the Aurora, Colorado distribution center in addition to office space utilized as the Company's Corporate headquarters in Providence, Rhode Island as the lease qualifies for capital lease treatment pursuant to Financial Accounting Standards Board ("FASB") Accounting Standards Codification ("ASC") 840, Leases. Property and equipment also includes accumulated depreciation with respect to these items. Refer to Note 8, "Long-Term Debt", for additional information.
Applicable interest charges incurred during the construction of new facilities may be capitalized as one of the elements of cost and are amortized over the assets' estimated useful lives. The Company capitalized $0.4 million of interest during the fiscal year ended July 30, 2016 related to the construction of the Company's distribution center in Gilroy, California which began operations in February 2016. The Company did not capitalize interest during the fiscal years ended July 28, 2018 and July 29, 2017.
Property and equipment consisted of the following at July 28, 2018 and July 29, 2017:
Original Estimated Useful Lives (Years) | 2018 | 2017 | |||||||
(In thousands, except years) | |||||||||
Land | $ | 52,929 | $ | 52,989 | |||||
Buildings and improvements | 20-40 | 446,665 | 396,733 | ||||||
Leasehold improvements | 5-20 | 106,014 | 138,466 | ||||||
Warehouse equipment | 3-30 | 185,669 | 173,591 | ||||||
Office equipment | 3-10 | 85,734 | 95,794 | ||||||
Computer software | 3-7 | 155,329 | 147,647 | ||||||
Motor vehicles | 3-7 | 4,884 | 4,657 | ||||||
Construction in progress | 22,105 | 17,968 | |||||||
1,059,329 | 1,027,845 | ||||||||
Less accumulated depreciation and amortization | 488,183 | 425,755 | |||||||
Net property and equipment | $ | 571,146 | $ | 602,090 | |||||
Depreciation expense amounted to $71.5 million, $69.8 million and $61.1 million for the fiscal years ended July 28, 2018, July 29, 2017 and July 30, 2016, respectively.
Income Taxes
The Company accounts for income taxes under the asset and liability method. Under the asset and liability method, deferred tax assets and liabilities are recognized for the future tax consequences attributable to differences between the financial statement carrying amounts of existing assets and liabilities and their respective tax bases. Deferred tax assets and liabilities are measured using enacted tax rates expected to apply to taxable income in the years in which those temporary differences are expected to be recovered or settled. The effect on deferred tax assets and liabilities of a change in tax rates is recognized in income in the period that includes the enactment date.
46
We record liabilities to address uncertain tax positions we have taken in previously filed tax returns or that we expect to take in a future tax return. The determination for required liabilities is based upon an analysis of each individual tax position, taking into consideration whether it is more likely than not that our tax position, based on technical merits, will be sustained upon examination. For those positions for which we conclude it is more likely than not it will be sustained, we recognize the largest amount of tax benefit that is greater than 50% likely of being realized upon ultimate settlement with the taxing authority. The difference between the amount recognized and the total tax position is recorded as a liability. The ultimate resolution of these tax positions may be greater or less than the liabilities recorded.
Long-Lived Assets
Management reviews long-lived assets, including definite-lived intangible assets, for indicators of impairment whenever events or changes in circumstances indicate that the carrying value of the assets may not be recoverable. Cash flows expected to be generated by the related assets are estimated over the assets' useful lives based on updated projections. If the evaluation indicates that the carrying amount of an asset may not be recoverable, the potential impairment is measured based on a fair value discounted cash flow model.
Goodwill and Intangible Assets
We account for acquired businesses using the purchase method of accounting which requires that the assets acquired and liabilities assumed be recorded at the date of the acquisition at their respective estimated fair values. Goodwill represents the excess of cost over the fair value of net assets acquired in a business combination. In determining the estimated fair value for intangible assets, we typically utilize the income approach, which discounts the projected future net cash flow using an appropriate discount rate that reflects the risks associated with such projected future cash flow. Refer to Note 2, "Acquisitions", for further detail on the valuation of goodwill and intangible assets related to specific acquisitions.
Goodwill and other intangible assets with indefinite lives are not amortized. Intangible assets with definite lives are amortized on a straight-line basis over the following lives:
Customer relationships | 7-20 years | |
Non-competition agreements | 1-10 years | |
Trademarks and tradenames | 4-10 years | |
Goodwill is assigned to the reporting units that are expected to benefit from the synergies of the business combination that generated the goodwill. Approximately 97.2% of the Company's goodwill is within its wholesale reporting segment as of July 28, 2018. The Company is required to test goodwill for impairment at least annually, and between annual tests if events occur or circumstances change that would more likely than not reduce the fair value of a reporting unit below its carrying amount. The Company has elected to perform its annual assessment for indications of goodwill impairment as of the first day of the fourth quarter of each fiscal year.
In accordance with Accounting Standards Update ("ASU") No. 2011-08, Testing Goodwill for Impairment, ("ASU 2011-08") the Company is allowed to perform a qualitative assessment for goodwill impairment unless it believes it is more likely than not that a reporting unit's fair value is less than the carrying value. The thresholds used by the Company for this determination in fiscal 2018 were for any reporting units that (1) have passed their previous quantitative test with a margin of calculated fair value versus carrying value of at least 20%, (2) have had a quantitative test within the past five years, (3) have had no significant changes to their working capital structure, (4) have current year income which is at least 85% of prior year amounts, and (5) present no other factors to be considered as outlined in ASU 2011-08. The Company's reporting units are at or one level below the operating segment level.
In accordance with accounting Standards Update (“ASU”) No. 2017-04, Intangibles, Goodwill and Other (Topic 350), Simplifying the Test for Goodwill Impairment, (“ASU- 2017-04”), which the Company early adopted as part of its fiscal 2017 annual goodwill impairment test, the Company is no longer required to perform a hypothetical purchase price allocation to measure goodwill impairment. Instead, impairment is measured using the difference between the carrying amount and the fair value of the reporting unit.
During the second quarter of fiscal 2018, the Company made the decision to close three under-performing stores related to its Earth Origins Market ("Earth Origins") retail business. This decision coupled with the decline in results in the first half of fiscal 2018 and the future outlook as a result of competitive pressure, the Company determined that a goodwill impairment analysis should be performed based on the assertion that it was more likely than not that the fair value of the reporting unit was below its
47
carrying amount. As a result of the analysis, performed in accordance with ASU 2017-04, the Company recorded a total impairment charge of $7.9 million to goodwill. Refer to Note 5, "Restructuring Activities", for additional information.
The Company performed a qualitative test on its other reporting units as of the first day of the fourth quarter of fiscal 2018 based on the criteria noted above and determined that a quantitative test was not required.
Intangible assets with indefinite lives are tested for impairment at least annually as of the first day of the fourth fiscal quarter and if events occur or circumstances change that would indicate that the value of the asset may be impaired. Impairment is measured as the difference between the fair value of the asset and its carrying value.
In accordance with ASU No. 2011-08, the Company is allowed to perform a qualitative assessment for indefinite lived intangible assets unless it believes it is more likely than not that an intangible asset's fair value is less than the carrying value. The thresholds used by the Company for this determination as of the first day of the fourth quarter of fiscal 2018 were for any intangible assets (or groups of assets) that (1) have passed their previous quantitative test with a margin of calculated fair value versus carrying value of at least 20%, (2) have had a quantitative test performed within the past five years, and (3) the component that the asset relates to has current year income which is at least 85% of the immediately preceding fiscal year's amounts. The Company's indefinite lived intangible assets are comprised of its branded product line asset group and a Tony's Fine Foods ("Tony's") tradename. During fiscal 2018, the Company performed its annual qualitative assessment of its indefinite lived intangible assets and based on the criteria noted above, it was determined that a quantitative analysis was required on its Tony's tradename. Based on the results of its quantitative test performed, the Company determined that the carrying value was in excess of its fair value and no impairment existed.
The changes in the carrying amount of goodwill and the amount allocated by reportable segment for the years presented are as follows (in thousands):
Wholesale | Other | Total | |||||||||
Goodwill as of July 30, 2016 | $ | 348,143 | $ | 18,025 | $ | 366,168 | |||||
Goodwill from prior fiscal year business combinations | 10,102 | — | 10,102 | ||||||||
Contingent consideration for prior year business combinations | (6,093 | ) | — | (6,093 | ) | ||||||
Change in foreign exchange rates | 1,082 | — | 1,082 | ||||||||
Goodwill as of July 29, 2017 | $ | 353,234 | $ | 18,025 | $ | 371,259 | |||||
Impairment | — | (7,872 | ) | (7,872 | ) | ||||||
Goodwill adjustment for prior fiscal year business combinations | 220 | — | 220 | ||||||||
Change in foreign exchange rates | (1,112 | ) | — | (1,112 | ) | ||||||
Goodwill as of July 28, 2018 | $ | 352,342 | $ | 10,153 | $ | 362,495 | |||||
The following table presents the detail of the Company's other intangible assets (in thousands):
July 28, 2018 | July 29, 2017 | ||||||||||||||||||||||
Gross Carrying Amount | Accumulated Amortization | Net | Gross Carrying Amount | Accumulated Amortization | Net | ||||||||||||||||||
Amortizing intangible assets: | |||||||||||||||||||||||
Customer relationships | $ | 197,246 | $ | 61,543 | $ | 135,703 | $ | 197,852 | $ | 48,044 | $ | 149,808 | |||||||||||
Non-compete agreements | 2,900 | 1,914 | 986 | 2,900 | 1,334 | 1,566 | |||||||||||||||||
Trademarks and tradenames | 1,700 | 981 | 719 | 1,700 | 548 | 1,152 | |||||||||||||||||
Total amortizing intangible assets | 201,846 | 64,438 | 137,408 | 202,452 | 49,926 | 152,526 | |||||||||||||||||
Indefinite lived intangible assets: | |||||||||||||||||||||||
Trademarks and tradenames | 55,801 | — | 55,801 | 55,763 | — | 55,763 | |||||||||||||||||
Total | $ | 257,647 | $ | 64,438 | $ | 193,209 | $ | 258,215 | $ | 49,926 | $ | 208,289 | |||||||||||
Amortization expense was $15.0 million, $15.2 million and $8.9 million for the fiscal years ended July 28, 2018, July 29, 2017 and July 30, 2016, respectively. The estimated future amortization expense for each of the next five fiscal years and thereafter on definite lived intangible assets existing as of July 28, 2018 is shown below:
48
Fiscal Year: | (In thousands) | ||
2019 | $ | 15,147 | |
2020 | 14,520 | ||
2021 | 13,622 | ||
2022 | 12,337 | ||
2023 | 12,845 | ||
2023 and thereafter | 68,937 | ||
$ | 137,408 | ||
Investments
The Company has long term investments in unconsolidated entities which it accounts for using either the cost method or the equity method of accounting. Investments in which the Company cannot exercise significant influence over the operating and financial policies of the investee are recorded at their historical cost. Investments where the Company has the ability to exercise significant influence over the investee are accounted for using the equity method, with income or loss attributable to the Company from the investee adjusting the carrying value of the investment and recorded in the Company’s consolidated statements of income. The Company's cost and equity method investments are evaluated for other than temporary impairment in accordance with ASC 320 Investments — Debt and Equity Securities. The carrying values of both cost and equity method investments were not material as of July 28, 2018 and July 29, 2017, either individually or in the aggregate, and are included within "Other Assets" in the Company’s consolidated balance sheets. Income attributable to the Company from investments accounted for using the equity method was not material for the fiscal years ended July 28, 2018, July 29, 2017 and July 30, 2016 and is recorded in “Other, net,” within "Other expense (income)," in the Company's consolidated statements of income.
On May 24, 2017, the Company sold its stake in Kicking Horse Coffee, a Canadian roaster and marketer of organic and fair trade coffee, which was accounted for using the cost method of accounting. As a result of the sale, the Company recognized a pre-tax gain of $6.1 million, which is included in “Other, net” in the consolidated statements of income.
Revenue Recognition and Concentration of Credit Risk
The Company records revenue upon delivery of products. Revenues are recorded net of applicable sales discounts and estimated sales returns. Sales incentives provided to customers are accounted for as reductions in revenue as the related revenue is recorded. The Company's sales are primarily to customers located throughout the United States and Canada.
Whole Foods Market, Inc. was the Company's largest customer in each fiscal year presented. Whole Foods Market, Inc. accounted for approximately 37%, 33% and 35% of the Company's net sales for the fiscal years ended July 28, 2018, July 29, 2017 and July 30, 2016, respectively. There were no other customers that individually generated 10% or more of the Company's net sales during those periods.
Accounts Receivable and Related Allowance for Doubtful Accounts
Accounts receivable primarily consist of trade receivables from customers and receivables from suppliers in connection with the purchase or promotion of the suppliers' products. The Company analyzes customer creditworthiness, accounts receivable balances, payment history, payment terms and historical bad debt levels when evaluating the adequacy of its allowance for doubtful accounts. In instances where a reserve has been recorded for a particular customer, future sales to the customer are conducted using either cash-on-delivery terms, or the account is closely monitored so that as agreed upon payments are received, orders are released; a failure to pay results in held or canceled orders.
Fair Value of Financial Instruments
The carrying amounts of the Company's financial instruments including cash and cash equivalents, accounts receivable, accounts payable and certain accrued expenses approximate fair value due to the short-term nature of these instruments.
The following estimated fair value amounts have been determined by the Company using available market information and appropriate valuation methodologies. Refer to Note 9, "Fair Value Measurements", for additional information regarding the fair value hierarchy. The fair value of notes payable and long-term debt are based on the instruments' interest rate, terms, maturity date and collateral, if any, in comparison to the Company's incremental borrowing rate for similar financial instruments. However, considerable judgment is required in interpreting market data to develop the estimates of fair value. Accordingly, the estimates presented herein are not necessarily indicative of the amounts that the Company could realize in a current market exchange.
49
July 28, 2018 | July 29, 2017 | ||||||||||||||
Carrying Value | Fair Value | Carrying Value | Fair Value | ||||||||||||
(In thousands) | |||||||||||||||
Assets: | |||||||||||||||
Cash and cash equivalents | $ | 23,315 | $ | 23,315 | $ | 15,414 | $ | 15,414 | |||||||
Accounts receivable | 579,702 | 579,702 | 525,636 | 525,636 | |||||||||||
Notes receivable | 1,930 | 1,930 | 2,359 | 2,359 | |||||||||||
Liabilities: | |||||||||||||||
Accounts payable | 517,125 | 517,125 | 534,616 | 534,616 | |||||||||||
Notes payable | 210,000 | 210,000 | 223,612 | 223,612 | |||||||||||
Long-term debt, including current portion | 150,150 | 155,317 | 161,991 | 169,058 | |||||||||||
Share-Based Compensation
The Company accounts for its share-based compensation in accordance with ASC 718, Stock Compensation. The Company has four share-based employee compensation plans, which are described more fully in Note 3, "Equity Plans". Share-based compensation consists of stock options, restricted stock units and performance units. The grant date closing price per share of the Company's stock is used to estimate the fair value of restricted stock units. Stock options are granted at exercise prices equal to the fair market value of the Company's stock at the dates of grant. The Company recognizes share-based compensation expense on a straight-line basis over the requisite service period of the individual grants. The Company's President, Chief Executive Officer and Chairman and its other executive officers or members of senior management have been granted performance units which vest, when and if earned, in accordance with the terms of the related performance unit award agreements. The Company recognizes share-based compensation expense based on the target number of shares of common stock and the Company’s stock price on the date of grant and subsequently adjusts expense based on actual and forecasted performance compared to planned targets.
Earnings Per Share
Basic earnings per share is calculated by dividing net income by the weighted average number of common shares outstanding during the period. Diluted earnings per share is calculated by adding the dilutive potential common shares to the weighted average number of common shares that were outstanding during the period. For purposes of the diluted earnings per share calculation, outstanding stock options, restricted stock units and performance-based awards, if applicable, are considered common stock equivalents, using the treasury stock method. A reconciliation of the weighted average number of shares outstanding used in the computation of the basic and diluted earnings per share for all periods presented follows:
Fiscal year ended | |||||||||||
July 28, 2018 | July 29, 2017 | July 30, 2016 | |||||||||
(In thousands, except per share data) | |||||||||||
Basic weighted average shares outstanding | 50,530 | 50,570 | 50,313 | ||||||||
Net effect of dilutive common stock equivalents based upon the treasury stock method | 307 | 205 | 86 | ||||||||
Diluted weighted average shares outstanding | 50,837 | 50,775 | 50,399 | ||||||||
Potential anti-dilutive share-based payment awards excluded from the computation above | 93 | 44 | 84 | ||||||||
Net income | $ | 165,670 | $ | 130,155 | $ | 125,766 | |||||
Basic earnings per share | $ | 3.28 | $ | 2.57 | $ | 2.50 | |||||
Diluted earnings per share | $ | 3.26 | $ | 2.56 | $ | 2.50 | |||||
Treasury Stock
The Company records the repurchase of shares of common stock at cost based on the settlement date of the transaction. These shares are classified as treasury stock, which is a reduction to stockholders’ equity. Treasury stock is included in authorized and issued shares but excluded from outstanding shares.
50
On October 6, 2017, the Company announced that its Board of Directors authorized a share repurchase program for up to $200.0 million of the Company’s outstanding common stock. The repurchase program is scheduled to expire upon the Company’s repurchase of shares of the Company’s common stock having an aggregate purchase price of $200.0 million. The Company repurchased 614,660 shares of its common stock at an aggregate cost of $24.2 million in the fiscal year ended July 28, 2018.
Comprehensive Income (Loss)
Comprehensive income (loss) is reported in accordance with ASU No. 2013-02, and includes net income and the change in other comprehensive income (loss). Other comprehensive income (loss) is comprised of the net change in fair value of derivative instruments designated as cash flow hedges, as well as foreign currency translation related to the translation of UNFI Canada, Inc. ("UNFI Canada") from the functional currency of Canadian dollars to U.S. dollar reporting currency. For all periods presented, the Company displays comprehensive income (loss) and its components in the consolidated statements of comprehensive income.
Derivative Financial Instruments
The Company is exposed to market risks arising from changes in interest rates, fuel costs, and with the operation of UNFI Canada, foreign currency exchange rates. The Company uses derivatives principally in the management of interest rate and fuel price exposure. From time to time the Company may use contracts to hedge transactions in foreign currency. The Company does not utilize derivatives that contain leverage features. For derivative transactions accounted for as hedges, on the date the Company enters into the derivative transaction, the exposure is identified. The Company formally documents all relationships between hedging instruments and hedged items, as well as its risk-management objective and strategy for undertaking the hedge transaction. In this documentation, the Company specifically identifies the asset, liability, firm commitment, forecasted transaction, or net investment that has been designated as the hedged item and states how the hedging instrument is expected to reduce the risks related to the hedged item. The Company measures effectiveness of its hedging relationships both at hedge inception and on an ongoing basis as needed.
Shipping and Handling Fees and Costs
The Company includes shipping and handling fees billed to customers in net sales. Shipping and handling costs associated with inbound freight are generally recorded in cost of sales, whereas shipping and handling costs for selecting, quality assurance, and outbound transportation are recorded in operating expenses. Outbound shipping and handling costs totaled $582.9 million, $517.2 million and $467.5 million for the fiscal years ended July 28, 2018, July 29, 2017 and July 30, 2016, respectively.
Reserves for Self-Insurance
The Company is primarily self-insured for workers' compensation and general and automobile liability insurance. It is the Company's policy to record the self-insured portion of workers' compensation and automobile liabilities based upon actuarial methods to estimate the future cost of claims and related expenses that have been reported but not settled, and that have been incurred but not yet reported.
Operating Lease Expenses
The Company records lease expense via the straight-line method. For leases with step rent provisions whereby the rental payments increase over the life of the lease, and for leases where the Company receives rent-free periods, the Company recognizes expense based on a straight-line basis based on the total minimum lease payments to be made over the expected lease term.
Recently Issued Accounting Pronouncements
In June 2018, the Financial Accounting Standards Board (“FASB”) issued Accounting Standards Update (“ASU”) 2018-07, Improvements to Nonemployee Share-Based Payment Accounting, which more closely aligns the accounting for employee and nonemployee shared-based payments. This ASU is effective for public business entities for annual and interim periods in fiscal years beginning after December 15, 2018, which for the Company will be the first quarter of the fiscal year ending August 1, 2020, with early adoption permitted. The Company does not believe this guidance will have a material effect on its consolidated financial statements.
In February 2018, the FASB issued ASU 2018-02, Reclassification of Certain Tax Effects from Accumulated Other Comprehensive Income, which allows a reclassification from accumulated other comprehensive income to retained earnings for stranded tax effects resulting from the Tax Cuts and Jobs Act of 2017. This ASU is effective for all entities for annual and interim periods in fiscal years beginning after December 15, 2018, which for the Company will be the first quarter of the fiscal year ending August 1, 2020, with early adoption permitted. The Company is currently reviewing the provisions of the new standard and evaluating its impact on the Company's consolidated financial statements.
51
In December 2017, the United States ("U.S.") government enacted comprehensive tax legislation commonly referred to as the Tax Cuts and Jobs Act of 2017 (the “TCJA”). The Securities and Exchange Commission ("SEC ") staff issued Staff Accounting Bulletin No. 118, Income Tax Accounting Implications of the Tax Cut and Jobs Act ("SAB 118"), which provides guidance on accounting for the tax effects of the TCJA. Refer to Note 12, "Income Taxes", for disclosure regarding the Company’s implementation of SAB 118.
In August 2017, the FASB issued ASU 2017-12, Derivatives and Hedging (Topic 815): Targeted Improvements to Accounting for Hedging Activities, which changes the recognition and presentation requirements of hedge accounting, including eliminating the requirement to separately measure and report hedge ineffectiveness and presenting all items that affect earnings in the same income statement line item as the hedged item. The ASU also provides new alternatives for applying hedge accounting to additional hedging strategies, measuring the hedged item in fair value hedges of interest rate risk, reducing the cost and complexity of applying hedge accounting by easing the requirements for effectiveness testing, hedge documentation and application of the critical terms match method and reducing the risk of a material error correction if a company applies the shortcut method inappropriately. This ASU is effective for public companies in fiscal years beginning after December 15, 2018, with early adoption permitted. The Company early adopted the guidance in this ASU in the fourth quarter of fiscal 2018, with no impact to its financial position, results of operations, or cash flows. The Company’s hedging activities, which consist of its interest rate swaps designated as cash flow hedges, are described in further detail in Note 9. "Fair Value Measurements".
In January 2017, the FASB issued ASU No. 2017-04, Intangibles, Goodwill and Other (Topic 350): Simplifying the Test for Goodwill Impairment. This ASU no longer requires a hypothetical purchase price allocation to measure goodwill impairment. Instead, impairment is measured using the difference between the carrying amount and fair value of the reporting unit. The ASU is effective for public companies with interim periods and fiscal years beginning after December 15, 2019, which for the Company is the first quarter of the fiscal year ending July 31, 2021, with early adoption permitted. The Company early adopted this ASU in connection with its annual goodwill impairment test performed in the fourth quarter of fiscal 2017. Refer to "(i) Goodwill and Intangible Assets" in this note for further information.
In October 2016, the FASB issued ASU No. 2016-16, Income Taxes (Topic 740): Intra-Entity Transfers of Assets Other Than Inventory ("ASU 2016-16"), which requires the recognition of the income tax consequences of an intra-entity transfer of an asset, other than inventory, when the transfer occurs. This ASU is required for public companies with interim periods and fiscal years beginning after December 15, 2017 which for the Company will be the first quarter of the fiscal year ending August 3, 2019. The Company does not believe this guidance will have a material effect on its consolidated financial statements.
In August 2016, the FASB issued ASU 2016-15, Statement of Cash Flows (Topic 230): Classification of Certain Cash Receipts and Cash Payments, to address eight specific cash flow issues with the objective of reducing the existing diversity in practice. The eight specific issues are (1) Debt Prepayment or Debt Extinguishment Costs; (2) Settlement of Zero-Coupon Debt Instruments or Other Debt Instruments with Coupon Interest Rates That Are Insignificant in Relation to the Effective Interest Rate of the Borrowing; (3) Contingent Consideration Payments Made after a Businesses Combination; (4) Proceeds from the Settlement of Insurance Claims; (5) Proceeds from the Settlement of Corporate-Owned Life Insurance Policies, including Bank-Owned Life Insurance Policies; (6) Distributions Received from Equity Method Investees; (7) Beneficial Interests in Securitization Transactions; and (8) Separately Identifiable Cash and Application of the Predominance Principle. The ASU is effective for public companies with interim and fiscal years beginning after December 15, 2018, which for the Company will be the first quarter of the fiscal year ending August 1, 2020. The Company is in the process of evaluating the impact that this new guidance will have on the Company's consolidated financial statements.
In March 2016, the FASB issued ASU 2016-09, Compensation - Stock Compensation (Topic 718): Improvements to Employee Share-Based Payment Accounting, which is intended to improve the accounting for share-based payment transactions as part of the FASB's simplification initiative. This ASU has changed aspects of accounting for share-based payment award transactions including accounting for income taxes, the classification of excess tax benefits and the classification of employee taxes paid when shares are withheld for tax-withholding purposes on the consolidated statement of cash flows, forfeitures, and minimum statutory tax withholding requirements. The Company adopted the new standard in the first quarter of fiscal 2018. Accordingly, the Company accounts for excess tax benefits or tax deficiencies related to share-based payments in its provision for income taxes as opposed to additional paid-in capital. The Company recognized an income tax expense related to tax deficiencies for share-based payments for the fiscal year ended July 28, 2018 of $1.1 million. For fiscal 2017 and 2016, the result would have increased income tax expense by $1.3 million and $0.1 million, respectively. In addition, the Company elected to account for forfeitures as they occur and recorded a cumulative adjustment to retained earnings and additional paid-in capital as of July 30, 2017, the first day of fiscal 2018, of approximately $0.8 million and $1.3 million, respectively.
In February 2016, the FASB issued ASU No. 2016-2, Leases (Topic 842). The objective of this ASU is to establish the principles that lessees and lessors shall apply to report useful information to users of financial statements about the amount, timing, and
52
uncertainty of cash flows arising from a lease. Lessees are permitted to make an accounting policy election to not recognize the asset and liability for leases with a term of twelve months or less. In addition, this ASU expands the disclosure requirements of lease arrangements. This ASU will require the Company to recognize most current operating lease obligations as right-of-use assets with a corresponding liability based on the present value of future operating leases, which the Company believes will result in a significant impact to its consolidated balance sheets. Information about the amounts and timing of our undiscounted future lease payments can be found in Note 10. "Commitments and Contingencies" in these consolidated financial statements. Lessees and lessors will use a modified retrospective transition approach, which includes a number of practical expedients. The ASU is effective for public companies with interim and annual periods in fiscal years beginning after December 15, 2018, which for the Company will be the first quarter of the fiscal year ending August 1, 2020, with early adoption permitted. The Company expects to adopt this standard in the first quarter of fiscal 2020 and has begun an initial assessment plan to determine the impacts of this ASU on the Company’s consolidated financial statements and any necessary changes to our systems, accounting policies, and processes and controls.
In November 2015, the FASB issued ASU No. 2015-17, Balance Sheet Classification of Deferred Taxes, which requires entities with a classified balance sheet to present all deferred tax assets and liabilities as noncurrent. The new pronouncement is effective for public companies with annual periods, and interim periods within those periods, beginning after December 15, 2016, which for the Company was the first quarter of the fiscal 2018. Early adoption at the beginning of an interim or annual period is permitted. The Company adopted this guidance on a prospective basis in the first quarter of fiscal 2018 and it resulted in a reclassification from current deferred income tax assets to noncurrent deferred income tax liabilities of $40.6 million. All future adjustments will be reported as noncurrent.
In May 2014, the FASB issued ASU No. 2014-09, Revenue from Contracts with Customers, (Topic 606), which has been updated by multiple amending ASUs and supersedes existing revenue recognition requirements. The core principle of the new guidance is that an entity will recognize revenue to depict the transfer of promised goods or services to customers in an amount that reflects the consideration to which the entity expects to be entitled in exchange for those goods or services. Additionally, the ASU requires new, enhanced quantitative and qualitative disclosures related to the nature, amount, timing and uncertainty of revenue and cash flows arising from contracts with customers. The collective guidance is effective for public companies with annual periods, and interim periods within those periods, beginning after December 15, 2017, which for the Company will be the first quarter of the fiscal year ending August 3, 2019. The new standard permits either of the following adoption methods: (i) a full retrospective application with restatement of each period presented in the financial statements with the option to elect certain practical expedients, or (ii) a retrospective application with the cumulative effect of adopting the guidance recognized as of the date of initial application (“modified retrospective method”).
The Company completed its assessment of the new standard in the fourth quarter of fiscal 2018, and has adopted this new guidance in the first quarter of fiscal 2019 using the modified retrospective method, with no significant financial statement impact. The Company’s assessment work consisted of scoping of revenue streams, reviewing contracts with customers, and documenting the accounting analysis and conclusions of the impacts of the ASU on the Company’s wholesale distribution and other segments. The primary impact of adopting the new standard, contained within the wholesale distribution segment, is related to the sale of certain private label products for which revenue will be recognized over time under the new standard as opposed to at a point in time under the Company’s current policies. The effect of adopting this change resulted in an immaterial increase to Retained earnings, which was recorded in first quarter of fiscal 2019. Beginning in the first quarter of fiscal 2019, the Company will comply with enhanced revenue disclosure requirements, which will include expanded disclosure of relevant information about contracts with customers, disaggregated revenue, information on contract assets and liabilities, as well as other items requiring significant judgment and estimates used to recognize revenue.
2. | ACQUISITIONS |
Wholesale Segment - Wholesale Distribution Acquisitions
Global Organic/Specialty Source, Inc. On March 7, 2016, the Company acquired certain assets of Global Organic/Specialty Source Inc. and related affiliates (collectively "Global Organic") through its wholly owned subsidiary Albert's Organics, Inc. ("Albert's"). Global Organic is a distributor of organic fruits, vegetables, juices, milk, eggs, nuts, and coffee located in Sarasota, Florida serving customer locations across the Southeastern United States. Total cash consideration related to this acquisition was approximately $20.6 million. The fair value of identifiable intangible assets acquired was determined by using an income approach. The identifiable intangible asset recorded consisted of customer lists of $7.4 million, which are being amortized on a straight-line basis over an estimated useful life of approximately ten years.
Nor-Cal Produce, Inc. On March 31, 2016 the Company acquired all of the outstanding stock of Nor-Cal Produce, Inc. ("Nor-Cal") and an affiliated entity as well as certain real estate. Nor-Cal is a distributor of conventional and organic produce and other
53
fresh products in Northern California, with primary operations located in West Sacramento, California. Total cash consideration related to this acquisition was approximately $67.8 million.
The fair value of the identifiable intangible assets acquired was determined by using an income approach. The identifiable intangible assets include customer lists of $30.3 million, a tradename with an estimated fair value of $1.0 million, and a non-compete with an estimated fair value of $0.5 million, which are being amortized on a straight-line basis over estimated useful lives of approximately thirteen years, five years and five years, respectively. Significant assumptions utilized in the income approach were based on company-specific information and projections, which are not observable in the market and are thus considered Level 3 measurements as defined by authoritative guidance. The goodwill of $36.5 million represents the future economic benefits expected to arise that could not be individually identified and separately recognized. During the second quarter of fiscal 2017, the Company recorded a $2.9 million adjustment to the opening balance sheet which decreased goodwill and deferred income tax liabilities. During the third quarter of fiscal 2017, the Company recorded a $0.1 million adjustment, which decreased goodwill and liabilities, and completed the final net working capital adjustment resulting in cash received of $0.8 million by the Company, which also decreased goodwill and the total purchase price. The Company finalized its purchase accounting during the third quarter of fiscal 2017. Net sales attributed to Nor-Cal from the date of acquisition through the fiscal year ended July 29, 2017 were $51.4 million.
The following table summarizes the consideration paid for the acquisition and the amounts of assets acquired and liabilities assumed as of the acquisition date:
(in thousands) | Final Opening Balance Sheet | |||
Accounts receivable | $ | 8,483 | ||
Inventories | 1,902 | |||
Property and equipment | 10,029 | |||
Other assets | 125 | |||
Customer relationships | 30,300 | |||
Tradename | 1,000 | |||
Non-compete | 500 | |||
Goodwill | 36,517 | |||
Total assets | $ | 88,856 | ||
Liabilities | 21,073 | |||
Total purchase price | $ | 67,783 | ||
Haddon House Food Products, Inc. On May 13, 2016 the Company acquired all outstanding equity securities of Haddon House Food Products, Inc. (“Haddon”) and certain affiliated entities and real estate. Haddon is a distributor and merchandiser of natural and organic and gourmet ethnic products throughout the Eastern United States. Haddon has a diverse, multi-channel customer base including supermarkets, gourmet food stores and independent retailers. Total cash consideration related to this acquisition was approximately $217.5 million.
The value of the identifiable intangible assets acquired was determined by using an income approach. The identifiable intangible assets include customer relationships with an estimated fair value of $62.7 million, the Haddon tradename with an estimated fair value of $0.7 million, non-compete agreements with an estimated fair value of $0.7 million, and a trademark asset related to Haddon-owned branded product lines with an estimated fair value of $2.0 million. The customer relationship intangible asset is currently being amortized on a straight-line basis over an estimated useful life of approximately thirteen years, the Haddon tradename is being amortized over an estimated useful life of approximately three years, the non-compete agreements that the Company received from the owners of Haddon are being amortized over the five-year term of the agreements, and the Haddon trademark asset associated with its branded product lines is estimated to have an indefinite useful life. Significant assumptions utilized in the income approach were based on company-specific and market participant information and projections, which are not observable in the market and are thus considered Level 3 measurements as defined by authoritative guidance. The goodwill of $43.6 million represents the future economic benefits expected to arise that could not be individually identified and separately recognized. Net sales attributed to Haddon from the date of acquisition through the fiscal year ended July 29, 2017 were $100.4 million.
During the second quarter of fiscal 2017, the Company recorded a reduction to goodwill of approximately $1.6 million related to a net working capital adjustment. During the fourth quarter of fiscal 2017, the Company finalized its purchase accounting related
54
to the Haddon acquisition. The following table summarizes the consideration paid for the acquisition and the amounts of assets acquired and liabilities assumed as of the acquisition date:
(in thousands) | Final Opening Balance Sheet | |||
Accounts receivable | $ | 40,134 | ||
Other receivable | 3,621 | |||
Inventories | 46,440 | |||
Prepaid expenses and other current assets | 1,744 | |||
Property and equipment | 54,501 | |||
Other assets | 280 | |||
Customer relationships | 62,700 | |||
Tradename | 700 | |||
Non-compete | 700 | |||
Other intangible assets | 2,000 | |||
Goodwill | 43,585 | |||
Total assets | $ | 256,405 | ||
Liabilities | 38,910 | |||
Total purchase price | $ | 217,495 | ||
Gourmet Guru, Inc. On August 10, 2016, the Company acquired all of the outstanding equity securities of Gourmet Guru, Inc. ("Gourmet Guru"). Gourmet Guru is a distributor and merchandiser of fresh and organic food focusing on new and emerging brands. Total cash consideration related to this acquisition was approximately $10.0 million, subject to certain customary post-closing adjustments. The fair value of identifiable intangible assets acquired was determined by using an income approach. The identifiable intangible asset recorded based on a provisional valuation consisted of customer lists of $1.0 million, which are being amortized on a straight-line basis over an estimated useful life of approximately 2 years. During the first quarter of fiscal 2018, in finalizing the purchase accounting related to the Gourmet Guru acquisition, the Company recorded an increase to goodwill of approximately $0.2 million with a decrease to prepaid expenses. The goodwill of $10.3 million represents the future economic benefits expected to arise that could not be individually identified and separately recognized.
Cash paid for Global Organic, Nor-Cal, Haddon and Gourmet Guru was financed through borrowings under the Company’s Existing ABL Loan Agreement. Acquisition costs have been expensed as incurred within "operating expenses" in the consolidated statements of income. Acquisition costs related to these acquisitions were de minimis for the year ended July 29, 2017 and $2.1 million for the year ended July 30, 2016. The results of the acquired businesses' operations have been included in the consolidated financial statements since the applicable date of acquisitions. Operations for these acquisitions have been combined with the Company's existing wholesale distribution business and therefore results are not separable from the rest of the wholesale distribution business. The Company has not furnished pro forma financial information relating to these acquisitions as such information is not material to the Company's financial results.
Acquisition of SUPERVALU, INC.
On July 25, 2018, the Company entered into an Agreement and Plan of Merger pursuant to which we have agreed to acquire all of the outstanding equity securities of SUPERVALU INC. (“SUPERVALU”) for an aggregate purchase price of approximately $2.9 billion including the assumption of outstanding debt and liabilities. The transaction has been approved by the boards of directors of both companies and is subject to antitrust approvals, SUPERVALU shareholder approval and other customary closing conditions, and is expected to close in the fourth quarter of calendar year 2018. The proposed acquisition of SUPERVALU is expected to expand the Company’s customer base and exposure across channels, add high-growth perimeter categories such as meat and produce to the Company’s natural and organic products, provide the Company a wider geographic reach and greater scale, and increase efficiencies.
3. | EQUITY PLANS |
The Company has three equity incentive plans: the 2002 Stock Incentive Plan (the "2002 Plan"), the 2004 Equity Incentive Plan, as amended (the "2004 Plan"), and the 2012 Equity Incentive Plan, as amended and restated (the "2012 Plan") (collectively, the
55
"Plans"). Prior to the expiration of the applicable plan, these shares may be used to issue stock options, restricted stock, restricted stock units or performance based awards to employees, officers, directors and others. The maximum term of all incentive and non-statutory stock options or share awards granted under the Plans is 4 years. There were 2,800,000 shares authorized for grant under the 2002 Plan and 1,250,000 shares authorized for grant under the 2012 Plan, which was amended in fiscal 2016 and further amended in fiscal 2018 to increase shares available for issuance by 2,000,000 and 1,800,000 shares, respectively. As of July 28, 2018, 2,676,949 shares were available for grant under the 2012 Plan. The authorization for new grants under the 2002 Plan and 2004 Plan has expired.
The Company recognized total share-based compensation expense of $25.8 million for the fiscal year ended July 28, 2018, compared to $25.7 million and $15.3 million for the fiscal years ended July 29, 2017 and July 30, 2016, respectively. The total income tax benefit for share-based compensation arrangements was $6.5 million, $10.0 million, and $6.1 million, for the fiscal years ended July 28, 2018, July 29, 2017 and July 30, 2016, respectively.
Share-based compensation expense related to performance-based share awards was $5.6 million and $9.0 million for the fiscal years ended July 28, 2018 and July 29, 2017, respectively. For the fiscal year ended July 30, 2016, the Company did not record share-based compensation expense related to performance-based share awards, including compensation expense related to performance units with vestings tied to the Company's performance in fiscal 2016, as a result of performance measures not being attained at the end of the fiscal year and the resulting forfeiture of these awards.
Vesting requirements for awards under the Plans are generally at the discretion of the Company's Board of Directors, or the Compensation Committee thereof, and for time vesting awards are typically four equal annual installments for employees and two equal installments for non-employee directors with the first installment on the date of grant and the second installment on the six month anniversary of the grant date. As of July 28, 2018, there was $36.0 million of total unrecognized compensation cost related to outstanding share-based compensation arrangements (including stock options, restricted stock units and performance-based restricted stock units). This cost is expected to be recognized over a weighted-average period of 2.3 years.
Restricted Stock Units
The fair value of restricted stock units and performance share units are determined based on the number of units granted and the quoted price of the Company's common stock as of the grant date. The following summary presents information regarding restricted stock units and performance units under the Plans as of July 28, 2018 and changes during the fiscal year then ended:
Number of Shares | Weighted Average Grant-Date Fair Value | |||||
Outstanding at July 29, 2017 | 1,270,111 | $ | 44.56 | |||
Granted | 716,952 | $ | 40.06 | |||
Vested | (434,730 | ) | $ | 47.24 | ||
Forfeited | (207,731 | ) | $ | 41.38 | ||
Outstanding at July 28, 2018 | 1,344,602 | $ | 41.78 | |||
The total intrinsic value of restricted stock units vested was $12.4 million, $10.5 million and $12.3 million during the fiscal years ended July 28, 2018, July 29, 2017 and July 30, 2016, respectively.
During fiscal 2018, the Company granted 109,100 performance share units to its executives (subject to the issuance of 109,100 additional shares if the Company's performance exceeds specified targeted levels) with a weighted average grant-date fair value of $39.74. All of the performance units are tied to the Company's performance in the fiscal year ending August 3, 2019.
During fiscal 2017, the Company granted 397,242 performance share units to its executives (subject to the issuance of 221,242 additional shares if the Company's performance exceeds specified targeted levels) with a weighted average grant-date fair value of $40.82 tied to the Company's performance in fiscal years 2017, 2018 and 2019. As of the fiscal year ended July 29, 2017, 150,396 of these performance share units vested, based on the Company's earnings per diluted share, adjusted EBITDA, and adjusted ROIC with an estimated intrinsic value of approximately $5.7 million using the Company's stock price as of July 28, 2017. As of the fiscal year ended July 28, 2018, 111,860 performance units vested based on the Company's earnings per diluted share, adjusted EBITDA, and adjusted ROIC with an intrinsic value of approximately $3.6 million using the Company stock price as of July 27, 2018. As of July 28, 2018, there are 75,000 performance share units outstanding that are tied to the Company's performance in the fiscal year ending August 3, 2019.
No performance share units vested during the fiscal year ended July 30, 2016.
56
Stock Options
The fair value of stock option grants was estimated at the date of grant using the Black-Scholes option pricing model. Black-Scholes utilizes assumptions related to volatility, the risk-free interest rate, the dividend yield and expected life. Expected volatilities utilized in the model are based on the historical volatility of the Company's stock price. The risk-free interest rate is derived from the U.S. Treasury yield curve in effect at the time of grant. The model incorporates exercise and post-vesting forfeiture assumptions based on an analysis of historical data. The expected term is derived from historical information and other factors.
The Company did not grant stock options in fiscal 2018 or 2017. The following summary presents the weighted average assumptions used for stock options granted in fiscal 2016:
Fiscal year ended | |||
July 30, 2016 | |||
Expected volatility | 27.5 | % | |
Dividend yield | — | % | |
Risk free interest rate | 1.3 | % | |
Expected term (in years) | 4.0 | ||
The following summary presents information regarding outstanding stock options as of July 28, 2018 and changes during the fiscal year then ended with regard to options under the Plans:
Number of Options | Weighted Average Exercise Price | Weighted Average Remaining Contractual Term | Aggregate Intrinsic Value | |||||||||
Outstanding at beginning of year | 328,689 | $ | 49.52 | |||||||||
Exercised | (37,012 | ) | $ | 26.34 | ||||||||
Outstanding at end of year | 291,677 | $ | 52.46 | 4.4 years | $ | 200,391 | ||||||
Exercisable at end of year | 262,235 | $ | 51.92 | 4.2 years | $ | 200,391 | ||||||
The weighted average grant-date fair value of options granted during the fiscal year ended July 30, 2016 was $15.59. The aggregate intrinsic value of options exercised during the fiscal years ended July 28, 2018, July 29, 2017, and July 30, 2016, was $0.7 million, $0.1 million and $2.6 million, respectively.
4. | ALLOWANCE FOR DOUBTFUL ACCOUNTS AND NOTES RECEIVABLE |
The allowance for doubtful accounts and notes receivable consists of the following:
Fiscal year ended | ||||||||||||
July 28, 2018 | July 29, 2017 | July 30, 2016 | ||||||||||
(In thousands) | ||||||||||||
Balance at beginning of year | $ | 14,509 | $ | 11,230 | $ | 8,493 | ||||||
Additions charged to costs and expenses | 12,006 | 5,728 | 6,426 | |||||||||
Deductions | (10,519 | ) | (2,449 | ) | (3,689 | ) | ||||||
Balance at end of year | $ | 15,996 | $ | 14,509 | $ | 11,230 | ||||||
5. | RESTRUCTURING ACTIVITIES |
Fiscal 2018 Earth Origins Market
During the fiscal year ended July 28, 2018, the Company recorded restructuring and asset impairment expenses of approximately $16.1 million, including a loss on the disposition of assets of approximately $2.7 million, related to the Company's Earth Origins retail business. During the second quarter of fiscal 2018 the Company made the decision to close three non-core, under-performing stores of its total twelve stores. Based on this decision, coupled with the decline in results in the first half of fiscal 2018 and the future outlook as a result of competitive pressure, the Company determined that both a test for recoverability of long-lived assets
57
and a goodwill impairment analysis should be performed. The determination of the need for a goodwill analysis was based on the assertion that it was more likely than not that the fair value of the reporting unit was below its carrying amount. As a result of both these analyses, the Company recorded a total impairment charge of $3.4 million on long-lived assets and $7.9 million to goodwill, respectively, during the second quarter of fiscal 2018. During the fourth quarter the Company disposed of its retail business. The Company recorded restructuring costs of $2.2 million during fiscal 2018.
The following is a summary of the restructuring costs the Company recorded related to Earth Origins in fiscal 2018, the payments and other adjustments related to these costs and the remaining liability as of July 28, 2018 (in thousands):
Restructuring Costs Recorded in Fiscal 2018 | Payments and Other Adjustments | Restructuring Cost Liability as of July 28, 2018 | ||||||||||
Severance and other employee separation and transition costs | $ | 819 | (436 | ) | $ | 383 | ||||||
Early lease termination and facility closing costs | 1,400 | (1,400 | ) | — | ||||||||
Total | $ | 2,219 | $ | (1,836 | ) | $ | 383 | |||||
Restructuring and impairment expenses recorded related to Earth Origins are reflected in the Company's "Other" segment.
Fiscal 2017 Cost Saving and Efficiency Initiatives.
During fiscal 2017, the Company announced a restructuring program in conjunction with various cost saving and efficiency initiatives, including the planned opening of a shared services center. The Company recorded total restructuring costs of $6.9 million during the fiscal year ended July 29, 2017, of which $6.6 million was primarily related to severance and other employee separation and transition costs and $0.3 million was due to an early lease termination and facility closing costs for its Gourmet Guru facility in Bronx, New York. During fiscal 2018 the Company performed an analysis on the remaining restructuring cost liability and as a result, recorded a benefit of $0.1 million which is reflected in "payments and other adjustments" in the table below.
The following is a summary of the restructuring costs the Company recorded in fiscal 2017, as well as the remaining liability as of July 28, 2018 (in thousands):
Restructuring Costs Recorded in Fiscal 2017 | Payments and Other Adjustments | Restructuring Cost Liability as of July 28, 2018 | ||||||||||
Severance and other employee separation and transition costs | $ | 6,606 | $ | (5,905 | ) | $ | 701 | |||||
Early lease termination and facility closing costs | 258 | (258 | ) | — | ||||||||
Total | $ | 6,864 | $ | (6,163 | ) | $ | 701 | |||||
Fiscal 2016 Cost-Saving Measures.
During the fourth quarter of fiscal 2015, the Company announced that its contract as a distributor to Albertsons Companies, Inc., which includes the Albertsons, Safeway and Eastern Supermarket chains, would terminate on September 20, 2015 rather than upon the original contract end date of July 31, 2016. During fiscal 2016, the Company implemented Company-wide cost-saving measures in response to this lost business which resulted in total restructuring costs of $4.4 million, all of which was recorded during the first half of fiscal 2016. There were no additional costs recorded related to these cost-savings initiatives in fiscal 2016. These initiatives resulted in a reduction of employees across the Company, the majority of which were terminated during the first quarter of fiscal 2016. The total work-force reduction charge of $3.4 million recorded during fiscal 2016 was primarily related to severance and fringe benefits. In addition to workforce reduction charges, the Company recorded $0.9 million during fiscal 2016 for costs due to an early lease termination and facility closure and operational transfer costs associated with these initiatives.
Earth Origins Market. During the fourth quarter of fiscal 2016, the Company recorded restructuring and impairment charges of $0.8 million related to the Company's Earth Origins retail business. The Company made the decision during the fourth quarter of fiscal 2016 to close two of its stores, one store located in Florida and the other located in Maryland, which resulted in restructuring costs of $0.5 million primarily related to severance and closure costs. The stores were closed during the first quarter of fiscal 2017. In addition, the Company recorded a total impairment charge of $0.3 million during fiscal 2016 on long-lived assets.
58
Canadian facility closure. During fiscal 2015, the Company ceased operations at its Canadian facility located in Scotstown, Quebec which was acquired in 2010. In connection with this closure, the Company recognized an impairment of $0.6 million during the first quarter of fiscal 2015 representing the remaining unamortized balance of an intangible asset. During the second quarter of fiscal 2015, the Company recognized a restructuring charge of $0.2 million in connection with this closure. Additionally, during the second quarter of fiscal 2016, the Company recognized an additional impairment charge of $0.4 million related to the long lived assets at the facility.
The following is a summary of the restructuring costs the Company recorded in fiscal 2016 related to the termination of its distribution arrangement with a large customer, the closing of two of its Earth Origins stores and the closing of a Canadian facility. The remaining liability as of the fiscal year ended July 29, 2017 was de minimis.
(in thousands) | Restructuring Costs Recorded in Fiscal 2016 | ||
Cost saving measures: | |||
Severance | $ | 3,443 | |
Early lease termination and facility closing costs | 368 | ||
Operational transfer costs | 570 | ||
Earth Origins: | |||
Severance | 41 | ||
Store closing costs | 443 | ||
Total | $ | 4,865 | |
The following is a summary of the impairment costs the Company recorded in fiscal 2016:
(in thousands) | Impairment Costs | ||
Canadian facility closure | $ | 413 | |
Earth Origins store | 274 | ||
Total | $ | 687 | |
6. | ACCRUED EXPENSES AND OTHER CURRENT LIABILITIES |
Accrued expenses and other current liabilities as of July 28, 2018 and July 29, 2017 consisted of the following:
(in thousands) | July 28, 2018 | July 29, 2017 | |||||
Accrued salaries and employee benefits | $ | 66,132 | $ | 63,937 | |||
Workers' compensation and automobile liabilities | 24,975 | 22,774 | |||||
Interest rate swap liability | — | 308 | |||||
Other | 78,551 | 70,224 | |||||
Total accrued expenses and other current liabilities | $ | 169,658 | $ | 157,243 | |||
7. | NOTES PAYABLE |
On April 29, 2016, the Company entered into the Third Amended and Restated Loan and Security Agreement (the "Existing ABL Loan Agreement") amending and restating certain terms and provisions of its revolving credit facility (the "Existing ABL Facility") which increased the maximum borrowings under the Existing ABL Facility and extended the maturity date to April 29, 2021. Up to $850.0 million is available to the Company's U.S. subsidiaries and up to $50.0 million is available to UNFI Canada. After giving effect to the Existing ABL Loan Agreement, the Existing ABL Facility provides an option to increase the U.S. or Canadian revolving commitments by up to an additional $600.0 million in the aggregate (but in not less than $10.0 million increments) subject to certain customary conditions and the lenders committing to provide the increase in funding.
The borrowings of the U.S. portion of the Existing ABL Facility, after giving effect to the Existing ABL Loan Agreement, accrued interest, at the base rate plus an applicable margin of 0.25% or LIBOR rate plus an applicable margin of 1.25% for the twelve month period ended April 29, 2017. After this period, the interest on the U.S. borrowings is accrued at the Company's option, at
59
either (i) a base rate (generally defined as the highest of (x) the Bank of America Business Capital prime rate, (y) the average overnight federal funds effective rate plus one-half percent (0.50%) per annum and (z) one-month LIBOR plus one percent (1%) per annum) plus an applicable margin that varies depending on daily average aggregate availability, or (ii) the LIBOR rate plus an applicable margin that varies depending on daily average aggregate availability. The borrowings on the Canadian portion of the Existing ABL Facility accrued interest at the Canadian prime rate plus an applicable margin of 0.25% or a bankers' acceptance equivalent rate plus an applicable margin of 1.25% for the twelve month period ended April 29, 2017. After this period, the borrowings on the Canadian portion of the Existing ABL Facility accrue interest, at the Company's option, at either (i) a Canadian prime rate (generally defined as the highest of (x) 0.50% over 30-day Reuters Canadian Deposit Offering Rate ("CDOR") for bankers' acceptances, (y) the prime rate of Bank of America, N.A.'s Canada branch, and (z) a bankers' acceptance equivalent rate for a one month interest period plus 1.00%) plus an applicable margin that varies depending on daily average aggregate availability, or (ii) a bankers' acceptance equivalent rate of the rate of interest per annum equal to the annual rates applicable to Canadian Dollar bankers' acceptances on the "CDOR Page" of Reuter Monitor Money Rates Service, plus five basis points, and an applicable margin that varies depending on daily average aggregate availability. Unutilized commitments are subject to an annual fee in the amount of 0.30% if the total outstanding borrowings are less than 25% of the aggregate commitments, or a per annum fee of 0.25% if such total outstanding borrowings are 25% or more of the aggregate commitments. The Company is also required to pay a letter of credit fronting fee to each letter of credit issuer equal to 0.125% per annum of the stated amount of each such letter of credit (or such other amount as may be mutually agreed by the borrowers under the Existing ABL Facility and the applicable letter of credit issuer), as well as a fee to all lenders equal to the applicable margin for LIBOR or bankers’ acceptance equivalent rate loans, as applicable, times the average daily stated amount of all outstanding letters of credit.
As of July 28, 2018, the Company's borrowing base, which is calculated based on eligible accounts receivable and inventory levels, net of $4.2 million of reserves, was $884.5 million. As of July 28, 2018, the Company had $210.0 million of borrowings outstanding under the Company's Existing ABL Facility and $24.3 million in letter of credit commitments which reduced the Company's available borrowing capacity under the Existing ABL Facility on a dollar for dollar basis. The Company's resulting remaining availability was $650.2 million as of July 28, 2018.
The Existing ABL Facility subjects the Company to a springing minimum fixed charge coverage ratio (as defined in the Existing ABL Loan Agreement) of 1.0 to 1.0 calculated at the end of each of our fiscal quarters on a rolling four quarter basis when the adjusted aggregate availability (as defined in the Existing ABL Loan Agreement) is less than the greater of (i) $60.0 million and (ii) 10% of the aggregate borrowing base. The Company was not subject to the fixed charge coverage ratio covenant under the Existing ABL Loan Agreement during the fiscal year ended July 28, 2018.
The Company has pledged the majority of its and its subsidiaries' accounts receivable and inventory for its obligations under the Existing ABL Facility.
8.LONG-TERM DEBT
On August 14, 2014, the Company and certain of its subsidiaries entered into a real estate backed term loan agreement (as amended by the First Amendment Agreement, dated April 29, 2016, and the Second Amendment Agreement, dated September 1, 2016, the "Existing Term Loan Agreement"). The total initial borrowings under our term loan facility were $150.0 million. The Company is required to make $2.5 million principal payments quarterly. Under the Existing Term Loan Agreement, the Company at its option may request the establishment of one or more new term loan commitments in increments of at least $10.0 million, but not to exceed $50.0 million in total, subject to the approval of the lenders electing to participate in such incremental loans and the satisfaction of the conditions required by the Existing Term Loan Agreement. Proceeds from this Existing Term Loan Agreement were used to pay down borrowings under the Existing ABL Loan Agreement.
Borrowings under the Existing Term Loan Agreement bear interest at rates that, at the Company's option, can be either: (1) a base rate generally defined as the sum of (i) the highest of (x) the administrative agent's prime rate, (y) the average overnight federal funds effective rate plus 0.50% and (z) one-month LIBOR plus one percent (1%) per annum and (ii) a margin of 0.75%; or, (2) a LIBOR rate generally defined as the sum of (i) LIBOR (as published by Reuters or other commercially available sources) for one, two, three or six months or, if approved by all affected lenders, nine months (all as selected by the Company), and (ii) a margin of 1.75%. Interest accrued on borrowings under the Existing Term Loan Agreement is payable in arrears. Interest accrued on any LIBOR loan is payable on the last day of the interest period applicable to the loan and, with respect to any LIBOR loan of more than three (3) months, on the last day of every three (3) months of such interest period. Interest accrued on base rate loans is payable on the first day of every month. The Company is also required to pay certain customary fees to the administrative agent. The borrowers' obligations under the Existing Term Loan Agreement are secured by certain parcels of the borrowers' real property.
The Existing Term Loan Agreement includes financial covenants that require (i) the ratio of the Company’s consolidated EBITDA (as defined in the Existing Term Loan Agreement) minus the unfinanced portion of Capital Expenditures (as defined in the Existing Term Loan Agreement) to the Company’s consolidated Fixed Charges (as defined in the Existing Term Loan Agreement) to be at least 1.20 to 1.00 as of the end of any period of four fiscal quarters, (ii) the ratio of the Company’s Consolidated Funded Debt (as
60
defined in the Existing Term Loan Agreement) to the Company’s EBITDA for the four fiscal quarters most recently ended to be not more than 3.00 to 1.00 as of the end of any fiscal quarter and (iii) the ratio, expressed as a percentage, of the Company’s outstanding principal balance under the Loans (as defined in the Existing Term Loan Agreement), divided by the Mortgaged Property Value (as defined in the Existing Term Loan Agreement) to be not more than 75% at any time. As of July 28, 2018, the Company was in compliance with the financial covenants of its Existing Term Loan Agreement.
On August 22, 2018, the Company notified its lenders that it intends to prepay its borrowings outstanding under its Existing Term Loan Agreement on October 1, 2018, which were approximately $110.0 million as of July 28, 2018. The Existing Term Loan Agreement was previously scheduled to terminate on the earlier of (a) August 14, 2022 and (b) the date that is ninety days prior to the termination date of the Existing ABL Loan Agreement. Concurrently with the prepayment of borrowings outstanding under the Existing Term Loan Agreement, the Company intends to draw on its Existing ABL Loan Agreement in an amount equal to its Existing Term Loan Agreement prepayment amount.
During the fiscal year ended August 1, 2015, the Company entered into an amendment to an existing lease agreement for the office space utilized as the Company's corporate headquarters in Providence, Rhode Island. The amendment provides for additional office space to be utilized by the Company and extends the lease term for an additional 10 years. The lease qualifies for capital lease treatment pursuant to ASC 840, Leases, and the estimated fair value of the building was originally recorded on the consolidated balance sheet with the capital lease obligation included in long-term debt. A portion of each lease payment reduces the amount of the lease obligation, and a portion is recorded as interest expense at an effective rate of approximately 12.05%.
During the fiscal year ended July 28, 2012, the Company entered into a lease agreement for a new distribution facility in Aurora, Colorado. At the conclusion of the fiscal year ended August 3, 2013, actual construction costs exceeded the construction allowance as defined by the lease agreement, and therefore, the Company determined it met the criteria for continuing involvement pursuant to FASB ASC 840, Leases, and applied the financing method to account for this transaction during the fourth quarter fiscal 2013. Under the financing method, the book value of the distribution facility and related accumulated depreciation remains on the consolidated balance sheet. The construction allowance is recorded as a financing obligation in "Long-term debt." A portion of each lease payment reduces the amount of the financing obligation, and a portion is recorded as interest expense at an effective rate of approximately 7.32%.
As of July 28, 2018 and July 29, 2017, the Company's long-term debt consisted of the following:
July 28, 2018 | July 29, 2017 | ||||||
(In thousands) | |||||||
Financing obligation, due monthly, and maturing in October 2028 at an effective interest rate of 7.32% | $ | 29,118 | $ | 30,368 | |||
Capital lease, Providence, Rhode Island corporate headquarters, due monthly, and maturing in April 2025 at an effective interest rate of 12.05% | 12,196 | 13,074 | |||||
Existing Term Loan Agreement, due quarterly (1) | 108,836 | 118,549 | |||||
$ | 150,150 | $ | 161,991 | ||||
Less: current installments | 12,441 | 12,128 | |||||
Long-term debt, excluding current installments | $ | 137,709 | $ | 149,863 | |||
(1) Existing Term Loan Agreement balance is shown net of debt issuance costs of $1.2 million and $1.5 million as of July 28, 2018 and July 29, 2017, respectively, due to the Company's adoption of ASU No. 2015-03 in the fourth quarter of fiscal 2016.
Aggregate maturities of long-term debt for the next five years and thereafter are as follows at July 28, 2018:
Year | (In thousands) | |||
2019 | $ | 12,441 | ||
2020 | 12,816 | |||
2021 | 93,203 | |||
2022 | 3,552 | |||
2023 | 4,066 | |||
2024 and thereafter | 25,236 | |||
$ | 151,314 | |||
61
9. | FAIR VALUE MEASUREMENTS |
The Company utilizes ASC 820, Fair Value Measurements and Disclosures ("ASC 820"), for financial assets and liabilities and for non-financial assets and liabilities that are recognized or disclosed at fair value on at least an annual basis. ASC 820 defines fair value as the price that would be received from selling an asset or paid to transfer a liability in an orderly transaction between market participants at the measurement date. When determining the fair value measurements for assets and liabilities required or permitted to be recorded at fair value, the Company considers the principal or most advantageous market in which it would transact and considers assumptions that market participants would use when pricing the asset or liability, such as inherent risk, transfer restrictions, and risk of nonperformance. ASC 820 establishes a fair value hierarchy that requires an entity to maximize the use of observable inputs and minimize the use of unobservable inputs when measuring fair value. ASC 820 establishes three levels of inputs that may be used to measure fair value:
• | Level 1 Inputs—Unadjusted quoted prices in active markets for identical assets or liabilities. |
• | Level 2 Inputs—Inputs other than quoted prices included in Level 1 that are either directly or indirectly observable through correlation with market data. These include quoted prices for similar assets or liabilities in active markets; quoted prices for identical or similar assets or liabilities in markets that are not active; and inputs to valuation models or other pricing methodologies that do not require significant judgment because the inputs used in the model, such as interest rates and volatility, can be corroborated by readily observable market data. |
• | Level 3 Inputs—One or more significant inputs that are unobservable and supported by little or no market activity, and that reflect the use of significant management judgment. Level 3 assets and liabilities include those whose fair value measurements are determined using pricing models, discounted cash flow methodologies or similar valuation techniques, and significant management judgment or estimation. |
Hedging of Interest Rate Risk
The Company manages its debt portfolio with interest rate swaps to achieve an overall desired position of fixed and floating rates. Details of outstanding swap agreements as of July 28, 2018, which are all pay fixed and receive floating, are as follows:
Swap Maturity | Notional Value (in millions) | Pay Fixed Rate | Receive Floating Rate | Floating Rate Reset Terms | |||||||
June 9, 2019 | $ | 50.0 | 0.8725 | % | One-Month LIBOR | Monthly | |||||
June 24, 2019 | $ | 50.0 | 0.7265 | % | One-Month LIBOR | Monthly | |||||
April 29, 2021 | $ | 25.0 | 1.0650 | % | One-Month LIBOR | Monthly | |||||
April 29, 2021 | $ | 25.0 | 0.9260 | % | One-Month LIBOR | Monthly | |||||
August 3, 2022 | $ | 112.5 | 1.7950 | % | One-Month LIBOR | Monthly | |||||
Interest rate swap agreements are entered into for periods consistent with related underlying exposures and do not constitute positions independent of those exposures. The Company’s interest rate swap agreements are designated as cash flow hedges at July 28, 2018.
The Company performs an initial quantitative assessment of hedge effectiveness using the “Hypothetical Derivative Method” described in ASC 815 in the period in which the hedging transaction is entered into. Under this method, the Company assesses the effectiveness of each hedging relationship by comparing the changes in cash flows of the derivative hedging instrument with the changes in cash flows of the designated hedged transactions. In future reporting periods the Company performs a qualitative analysis for quarterly prospective and retrospective assessments of hedge effectiveness. The Company also monitors the risk of counterparty default on an ongoing basis and noted that the counterparties are reputable financial institutions. The entire change in the fair value of the derivative is initially reported in other comprehensive income (outside of earnings) and subsequently reclassified to earnings in interest expense when the hedged transactions affect earnings.
The location and amount of gains or losses recognized in the Consolidated Statements of Income for cash flow hedging relationships for each of the periods, presented on a pretax basis, are as follows:
62
Fiscal Year Ended | ||||||||||||
July 28, 2018 | July 29, 2017 | July 30, 2016 | ||||||||||
(In thousands) | Interest Expense | Interest Expense | Interest Expense | |||||||||
Total amounts of income and expense line items presented in the consolidated results of operations in which the effects of cash flow hedges are recorded | $ | 16,471 | $ | 17,114 | $ | 16,259 | ||||||
Gain or (loss) on cash flow hedging relationships: | ||||||||||||
Gain or (loss) reclassified from Comprehensive Income into income | 827 | (1,462 | ) | (2,082 | ) | |||||||
Financial Instruments
The following table provides the fair value hierarchy for financial assets and liabilities measured on a recurring basis as of July 28, 2018 and July 29, 2017:
Fair Value at July 28, 2018 | Fair Value at July 29, 2017 | |||||||||||||||||||
(In thousands) | Level 1 | Level 2 | Level 3 | Level 1 | Level 2 | Level 3 | ||||||||||||||
Prepaid Expenses and Other Current Assets: | ||||||||||||||||||||
Interest Rate Swap | — | $ | 1,459 | — | — | — | — | |||||||||||||
Other Assets: | ||||||||||||||||||||
Interest Rate Swap | — | 5,860 | — | $ | 2,491 | — | ||||||||||||||
Accrued Expenses and Other Current Liabilities: | ||||||||||||||||||||
Interest Rate Swap | — | — | — | — | (308 | ) | — | |||||||||||||
The fair value of the Company's other financial instruments including accounts receivable, notes receivable, accounts payable and certain accrued expenses are derived using Level 2 inputs and approximate carrying amounts due to the short-term nature of these instruments. The fair value of notes payable approximate carrying amounts as they are variable rate instruments. The carrying amount of notes payable approximates fair value as interest rates on the Existing ABL Facility approximates current market rates (level 2 criteria).
The following estimated fair value amounts have been determined by the Company using available market information and appropriate valuation methodologies taking into account the instruments' interest rate, terms, maturity date and collateral, if any, in comparison to the Company's incremental borrowing rate for similar financial instruments and are therefore deemed Level 2 inputs. However, considerable judgment is required in interpreting market data to develop the estimates of fair value. Accordingly, the estimates presented herein are not necessarily indicative of the amounts that the Company could realize in a current market exchange.
July 28, 2018 | July 29, 2017 | |||||||||||||||
(In thousands) | Carrying Value | Fair Value | Carrying Value | Fair Value | ||||||||||||
Liabilities | ||||||||||||||||
Long term debt, including current portion | $ | 150,150 | $ | 155,317 | $ | 161,991 | $ | 169,058 | ||||||||
Fuel Supply Agreements
From time to time the Company is a party to fixed price fuel supply agreements. During the fiscal year ended July 28, 2018, the Company did not enter in any such agreements. During the fiscal year ended July 29, 2017, the Company entered into several agreements which required it to purchase a portion of its diesel fuel each month at fixed prices through December 2016. These fixed price fuel agreements qualify for the "normal purchase" exception under ASC 815; therefore, the fuel purchases under these contracts are expensed as incurred and included within operating expenses.
10. | COMMITMENTS AND CONTINGENCIES |
The Company leases various facilities and equipment under operating lease agreements with varying terms. Most of the leases contain renewal options and purchase options at several specific dates throughout the terms of the leases.
63
Rent and other lease expense for the fiscal years ended July 28, 2018, July 29, 2017 and July 30, 2016 totaled approximately $80.0 million, $74.9 million and $65.4 million, respectively.
Future minimum annual fixed payments required under non-cancelable operating leases having an original term of more than one year as of July 28, 2018 are as follows:
Fiscal Year | (In thousands) | |||
2019 | $ | 64,688 | ||
2020 | 52,841 | |||
2021 | 36,521 | |||
2022 | 27,375 | |||
2023 | 19,429 | |||
2024 and thereafter | 30,886 | |||
$ | 231,740 | |||
As of July 28, 2018, outstanding commitments for the purchase of inventory were approximately $15.9 million. The Company had outstanding letters of credit of approximately $24.3 million at July 28, 2018. The Company did not have any outstanding commitments for the purchase of diesel fuel as of July 28, 2018.
As of July 28, 2018, the Company had a withdrawal liability related to one of its multi-employer plans of approximately $3.4 million.
The Company may from time to time be involved in various claims and legal actions arising in the ordinary course of business. In the opinion of management, amounts accrued, as well as the total amount of reasonably possible losses with respect to such matters, individually and in the aggregate, are not deemed to be material to the Company's consolidated financial position or results of operations. Legal expenses incurred in connection with claims and legal actions are expensed as incurred.
11. | RETIREMENT PLANS |
Defined Contribution Retirement Plan
The Company has a defined contribution retirement plan under Section 401(k) of the Internal Revenue Code, the United Natural Foods, Inc. Retirement Plan (the "Retirement Plan"). In order to become a participant in the Retirement Plan, employees must meet certain eligibility requirements as described in the Retirement Plan document. In addition to amounts contributed to the Retirement Plan by employees, the Company makes contributions to the Retirement Plan on behalf of the employees. The Company's contributions to its Retirement Plan were approximately $11.6 million, $10.1 million, and $7.3 million for the fiscal years ended July 28, 2018, July 29, 2017 and July 30, 2016, respectively.
Multi-employer plans
The Company contributes to two multi-employer plans for certain of its associates that are represented by unions, none of which are individually significant to the Company's consolidated financial statements. The Company made contributions of approximately $0.5 million during the fiscal year ended July 28, 2018. As of the fiscal year ended July 29, 2017, the Company had withdrawn from a third plan, the present value of which is reflected in the consolidated balance sheet. As of July 28, 2018, the withdrawal liability was approximately $3.4 million. Withdrawal payments made during fiscal 2018 were de minimis.
Deferred Compensation and Supplemental Retirement Plans
The Company's non-employee directors and certain of its employees are eligible to participate in the United Natural Foods Deferred Compensation Plan and the United Natural Foods Deferred Stock Plan (collectively the "Deferral Plans"). The Deferral Plans are nonqualified deferred compensation plans which are administered by the Compensation Committee of the Company's Board of Directors. The Deferral Plans were established to provide participants with the opportunity to defer the receipt of all or a portion of their compensation to a non-qualified retirement plan in amounts greater than the amount permitted to be deferred under the Company's 401(k) Plan. The Company believes that this is an appropriate benefit because (i) it operates to place employees and non-employee directors in the same position as other employees who are not affected by Internal Revenue Code limits placed on plans such as the Company's 401(k) Plan; (ii) does not substantially increase the Company's financial obligations to its employees and directors (there are no employer matching contributions, only a crediting of deemed earnings); and (iii) provides additional incentives to the Company's employees and directors, since amounts set aside by the employees and directors are subject to the claims of the Company's creditors until paid. Under the Deferral Plans, only the payment of the compensation earned by the participant is deferred and there is no deferral of the expense in the Company's consolidated financial statements related to the
64
participants' earnings; the Company records the related compensation expense in the year in which the compensation is earned by the participants.
Under the Deferred Stock Plan, which was frozen to new deferrals effective January 1, 2007, each eligible participant could elect to defer between 0% and 100% of restricted stock awards granted during the election calendar year. Effective January 1, 2007, each participant may elect to defer up to 100% of their restricted share unit awards, performance shares and performance units under the Deferred Compensation Plan. Under the Deferred Compensation Plan, each participant may also elect to defer a minimum of $1,000 and a maximum of 90% of base salary and 100% of director fees, employee bonuses and commissions, as applicable, earned by the participants for the calendar year. Participants' cash-derived deferrals accrue earnings and appreciation based on the performance of mutual funds selected by the participant. The value of equity-based awards deferred under the Deferral Plans are based upon the performance of the Company's common stock.
The Millbrook Deferred Compensation Plan and the Millbrook Supplemental Retirement Plan were assumed by the Company as part of an acquisition during fiscal 2008. Deferred compensation relates to a compensation arrangement implemented in 1984 by a predecessor of the acquired company in the form of a non-qualified defined benefit plan and a supplemental retirement plan which permitted former officers and certain management employees, at the time, to defer portions of their compensation to earn specified maximum benefits upon retirement. The future obligations, which are fixed in accordance with the plans, have been recorded at a discount rate of 5.7%. These plans do not allow new participants, and there are no active employees subject to these plans.
At July 28, 2018, total future obligations including interest, assuming commencement of payments at an individual's retirement age, as defined under the deferred compensation arrangement, were as follows:
Fiscal Year | (In thousands) | |||
2019 | $ | 1,147 | ||
2020 | 940 | |||
2021 | 785 | |||
2022 | 766 | |||
2023 | 721 | |||
2024 and thereafter | 2,349 | |||
$ | 6,708 | |||
In an effort to provide for the benefits associated with the Deferral Plans and the Millbrook Deferred Compensation Plan, the Company owns whole-life insurance contracts on the plan participants. The cash surrender value of these policies included in "Other Assets" in the consolidated balance sheets was $22.9 million and $21.5 million at July 28, 2018 and July 29, 2017, respectively. The changes in the cash surrender value of these policies are recorded as a gain or loss in "Other, net" within "Other expense (income)," in the Company's consolidated statements of income.
12. | INCOME TAXES |
For the fiscal year ended July 28, 2018, income (loss) before income taxes consists of $205.3 million from U.S. operations and $7.4 million from foreign operations. For the fiscal year ended July 29, 2017, income before income taxes consists of $211.5 million from U.S. operations and $2.9 million from foreign operations. For the fiscal year ended July 30, 2016, income before income taxes consists of $208.8 million from U.S. operations and ($0.6) million from foreign operations.
65
Total federal and state income tax (benefit) expense consists of the following:
Current | Deferred | Total | |||||||||
(In thousands) | |||||||||||
Fiscal year ended July 28, 2018 | |||||||||||
U.S. Federal | $ | 46,210 | $ | (16,648 | ) | $ | 29,562 | ||||
State & Local | 13,310 | 1,878 | 15,188 | ||||||||
Foreign | 2,374 | (49 | ) | 2,325 | |||||||
$ | 61,894 | $ | (14,819 | ) | $ | 47,075 | |||||
Fiscal year ended July 29, 2017 | |||||||||||
U.S. Federal | $ | 70,669 | $ | (1,874 | ) | $ | 68,795 | ||||
State & Local | 14,653 | (82 | ) | 14,571 | |||||||
Foreign | 837 | 65 | 902 | ||||||||
$ | 86,159 | $ | (1,891 | ) | $ | 84,268 | |||||
Fiscal year ended July 30, 2016 | |||||||||||
U.S. Federal | $ | 57,157 | $ | 11,383 | $ | 68,540 | |||||
State & Local | 12,718 | 1,310 | 14,028 | ||||||||
Foreign | 101 | (213 | ) | (112 | ) | ||||||
$ | 69,976 | $ | 12,480 | $ | 82,456 | ||||||
Total income tax expense (benefit) was different than the amounts computed by applying the statutory federal income tax rate to income before income taxes because of the following:
Fiscal year ended | |||||||||||
July 28, 2018 | July 29, 2017 | July 30, 2016 | |||||||||
(In thousands) | |||||||||||
Computed "expected" tax expense | $ | 57,359 | $ | 75,048 | $ | 72,878 | |||||
State and local income tax, net of Federal income tax benefit | 10,501 | 9,694 | 9,412 | ||||||||
Non-deductible expenses | 955 | 1,951 | 1,549 | ||||||||
Tax effect of share-based compensation | 149 | 29 | 86 | ||||||||
General business credits | (552 | ) | (915 | ) | (135 | ) | |||||
Impacts related to the TCJA | (21,719 | ) | — | — | |||||||
Other, net | 382 | (1,539 | ) | (1,334 | ) | ||||||
Total income tax expense | $ | 47,075 | $ | 84,268 | $ | 82,456 | |||||
The income tax expense (benefit) for the years ended July 28, 2018, July 29, 2017 and July 30, 2016 was allocated as follows:
July 28, 2018 | July 29, 2017 | July 30, 2016 | |||||||||
(In thousands) | |||||||||||
Income tax expense | $ | 47,075 | $ | 84,268 | $ | 82,456 | |||||
Stockholders' equity, difference between compensation expense for tax purposes and amounts recognized for financial statement purposes | — | 1,320 | 83 | ||||||||
Other comprehensive income | 1,561 | 3,222 | (2,050 | ) | |||||||
$ | 48,636 | $ | 88,810 | $ | 80,489 | ||||||
66
The tax effects of temporary differences that give rise to significant portions of the net deferred tax assets and deferred tax liabilities at July 28, 2018 and July 29, 2017 are presented below:
July 28, 2018 | July 29, 2017 | ||||||
(In thousands) | |||||||
Deferred tax assets: | |||||||
Inventories, principally due to additional costs inventoried for tax purposes | $ | 7,265 | $ | 9,416 | |||
Compensation and benefits related | 25,740 | 35,482 | |||||
Accounts receivable, principally due to allowances for uncollectible accounts | 4,269 | 5,639 | |||||
Accrued expenses | 119 | 4,466 | |||||
Net operating loss carryforwards | 482 | 940 | |||||
Foreign tax credits | 445 | — | |||||
Other deferred tax assets | 117 | — | |||||
Total gross deferred tax assets | 38,437 | 55,943 | |||||
Less valuation allowance | (445 | ) | — | ||||
Net deferred tax assets | $ | 37,992 | $ | 55,943 | |||
Deferred tax liabilities: | |||||||
Plant and equipment, principally due to differences in depreciation | $ | 39,978 | $ | 59,414 | |||
Intangible assets | 36,544 | 53,633 | |||||
Interest rate swap agreements | 2,000 | 876 | |||||
Accrued expenses | 3,854 | — | |||||
Other | — | 218 | |||||
Total deferred tax liabilities | 82,376 | 114,141 | |||||
Net deferred tax liabilities | $ | (44,384 | ) | $ | (58,198 | ) | |
Current deferred income tax assets | $ | — | $ | 40,635 | |||
Non-current deferred income tax liabilities | (44,384 | ) | (98,833 | ) | |||
$ | (44,384 | ) | $ | (58,198 | ) | ||
New tax legislation, the TCJA, was enacted on December 22, 2017. ASC 740, Accounting for Income Taxes, requires companies to recognize the effect of tax law changes in the period of enactment even though the effective date for most TCJA provisions is for tax years beginning after December 31, 2017.
Given the significance of the legislation, the SEC staff issued SAB 118, which allows registrants to record provisional amounts concerning TCJA impacts during a one year “measurement period” similar to that used when accounting for business combinations. The measurement period is deemed to have ended earlier when the registrant has obtained, prepared and analyzed the information necessary to finalize its accounting. During the measurement period, impacts of the law are expected to be recorded at the time a reasonable estimate for all or a portion of the effects can be made, and provisional amounts can be recognized and adjusted as information becomes available, prepared or analyzed.
SAB 118 summarizes a process to be applied at each reporting period to account for and qualitatively disclose: (1) the effects of the change in tax law for which accounting is complete; (2) provisional amounts (or adjustments to provisional amounts) for the effects of the tax law where accounting is not complete, but that a reasonable estimate has been determined; and (3) a reasonable estimate cannot yet be made and therefore taxes are reflected in accordance with the law prior to the enactment of the TCJA.
Provisional estimates have been recorded for the estimated impact of the TCJA based on information that is currently available to the Company. These provisional estimates are comprised of the one-time mandatory repatriation transition tax. The repatriation transition tax is expected to have an immaterial impact because of foreign tax credits available to the Company. As the Company completes its analysis of the TCJA, changes may be made to provisional estimates, and such changes will be reflected in the period in which the related adjustments are made.
In assessing the need to establish a valuation reserve for the recoverability of deferred tax assets, the Company considers whether it is more likely than not that some portion or all of the deferred tax assets will not be realized. The Company considers relevant
67
evidence, both positive and negative, to determine the need for a valuation allowance. Information evaluated includes the Company's financial position and results of operations for the current and preceding years, the availability of deferred tax liabilities and tax carrybacks, as well as an evaluation of currently available information about future years.
At July 28, 2018, the Company had net operating loss carryforwards of approximately $2.3 million for federal income tax purposes. The federal carryforwards are subject to an annual limitation of approximately $0.3 million under Internal Revenue Code Section 382. The carryforwards expire at various times between fiscal years 2019 and 2027. As of July 28, 2018, the Company has sufficient taxable income in the federal carryback period and anticipates sufficient future taxable income over the periods in which the net operating losses can be utilized. The Company also has the availability of future reversals of taxable temporary differences that are expected to generate taxable income in the future. Therefore, the ultimate realization of net operating losses federal and state tax purposes appears more likely than not at July 28, 2018 and correspondingly no valuation allowance has been established.
The retained earnings of the Company's non-U.S. subsidiary that are subject to deemed repatriation and taxation under the TCJA are $13.3 million at July 28, 2018. The Company utilized U.S. foreign tax credits to offset the deemed repatriation tax of $2.1 million. Further, we have established a deferred tax asset for the excess U.S. foreign tax credits of $0.4 million. Such credits are offset by a valuation allowance. The Company considers these unremitted earnings to be indefinitely reinvested; therefore, we have not provided a deferred tax liability for any residual tax that may be due upon repatriation of these earnings.
The Company and its subsidiaries file income tax returns in the United States federal jurisdiction and in various state jurisdictions. UNFI Canada files income tax returns in Canada and certain of its provinces. U.S. federal income tax examination years prior to fiscal 2015 have either statutorily or administratively been closed with the Internal Revenue Service, and with limited exception, the fiscal tax years that remain subject to examination by state jurisdictions range from the Company's fiscal 2014 to fiscal 2017.
The Company records interest and penalties related to unrecognized tax benefits as a component of income tax expense. The unrecognized tax benefit in the consolidated statements of income was de minimis for the fiscal years ended July 28, 2018, July 29, 2017, and July 30, 2016.
13. | BUSINESS SEGMENTS |
The Company has several business units within the wholesale segment, which is the Company's only reportable segment. These business units have similar products and services, customer channels, distribution methods and historical margins. The wholesale segment is engaged in the distribution of natural, organic and specialty foods, produce and related products in the United States and Canada. The Company has additional operating segments that do not meet the quantitative thresholds for reportable segments and are therefore aggregated under the caption of "Other." "Other" includes a retail business, which was disposed in fiscal 2018, which engaged in the sale of natural foods and related products to the general public through retail storefronts on the east coast of the United States, a manufacturing business, which engages in importing, roasting, packaging and distributing of nuts, dried fruit, seeds, trail mixes, granola, natural and organic snack items and confections, the Company's branded product lines, and the Company's brokerage business, which markets various products on behalf of food suppliers directly and exclusively to the Company's customers. "Other" also includes certain corporate operating expenses that are not allocated to business units, which include, among other expenses, stock based compensation, and salaries, retainers, and other related expenses of certain officers and all directors. Non-operating expenses that are not allocated to the business units are under the caption of "Unallocated Expenses." The Company does not record its revenues for financial reporting purposes by product group, and it is therefore impracticable for the Company to report them accordingly. The Company has long-lived assets of $25.0 million held in Canada as of July 28, 2018.
The following table reflects business segment information for the periods indicated (in thousands):
68
Wholesale | Other | Eliminations | Unallocated (Income)/ Expenses | Consolidated | |||||||||||||||
(In thousands) | |||||||||||||||||||
Fiscal year ended July 28, 2018 | |||||||||||||||||||
Net sales | $ | 10,169,840 | $ | 228,465 | $ | (171,622 | ) | $ | — | $ | 10,226,683 | ||||||||
Restructuring and asset impairment expenses | 67 | 15,946 | — | — | 16,013 | ||||||||||||||
Operating income (loss) | 260,363 | (36,563 | ) | 3,425 | — | 227,225 | |||||||||||||
Interest expense | — | — | — | 16,471 | 16,471 | ||||||||||||||
Interest income | — | — | — | (446 | ) | (446 | ) | ||||||||||||
Other, net | — | — | — | (1,545 | ) | (1,545 | ) | ||||||||||||
Income before income taxes | 212,745 | ||||||||||||||||||
Depreciation and amortization | 85,388 | 2,243 | — | — | 87,631 | ||||||||||||||
Capital expenditures | 43,402 | 1,206 | — | — | 44,608 | ||||||||||||||
Goodwill | 352,342 | 10,153 | — | — | 362,495 | ||||||||||||||
Total assets | 2,811,948 | 189,312 | (36,788 | ) | — | 2,964,472 | |||||||||||||
Fiscal year ended July 29, 2017 | |||||||||||||||||||
Net sales | 9,210,815 | 232,192 | (168,536 | ) | — | 9,274,471 | |||||||||||||
Restructuring and asset impairment expenses | 2,922 | 3,942 | — | — | 6,864 | ||||||||||||||
Operating income (loss) | 247,419 | (21,857 | ) | 463 | — | 226,025 | |||||||||||||
Interest expense | — | — | — | 17,114 | 17,114 | ||||||||||||||
Interest income | — | — | — | (360 | ) | (360 | ) | ||||||||||||
Other, net | — | — | — | (5,152 | ) | (5,152 | ) | ||||||||||||
Income before income taxes | 214,423 | ||||||||||||||||||
Depreciation and amortization | 83,063 | 2,988 | — | — | 86,051 | ||||||||||||||
Capital expenditures | 53,328 | 2,784 | — | — | 56,112 | ||||||||||||||
Goodwill | 353,234 | 18,025 | — | — | 371,259 | ||||||||||||||
Total assets | 2,724,069 | 203,154 | (40,660 | ) | — | 2,886,563 | |||||||||||||
Fiscal year ended July 30, 2016 | |||||||||||||||||||
Net sales | 8,395,821 | 238,691 | (164,226 | ) | — | 8,470,286 | |||||||||||||
Restructuring and asset impairment expenses | 2,811 | 2,741 | — | — | 5,552 | ||||||||||||||
Operating income (loss) | 228,476 | (3,488 | ) | (879 | ) | — | 224,109 | ||||||||||||
Interest expense | — | — | — | 16,259 | 16,259 | ||||||||||||||
Interest income | — | — | — | (1,115 | ) | (1,115 | ) | ||||||||||||
Other, net | — | — | — | 743 | 743 | ||||||||||||||
Income before income taxes | 208,222 | ||||||||||||||||||
Depreciation and amortization | 68,278 | 2,728 | — | — | 71,006 | ||||||||||||||
Capital expenditures | 39,464 | 1,911 | — | — | 41,375 | ||||||||||||||
Goodwill | 348,143 | 18,025 | — | — | 366,168 | ||||||||||||||
Total assets | 2,672,620 | 201,603 | (22,068 | ) | — | 2,852,155 | |||||||||||||
69
14. | QUARTERLY FINANCIAL DATA (UNAUDITED) |
The following table sets forth certain key interim financial information for the fiscal years ended July 28, 2018 and July 29, 2017:
First Quarter | Second Quarter | Third Quarter | Fourth Quarter | Full Year | ||||||||||||||||
(In thousands except per share data) | ||||||||||||||||||||
2018 | ||||||||||||||||||||
Net sales | $ | 2,457,545 | $ | 2,528,011 | $ | 2,648,879 | $ | 2,592,248 | $ | 10,226,683 | ||||||||||
Gross profit | 367,216 | 371,522 | 408,087 | 375,942 | 1,522,767 | |||||||||||||||
Income before income taxes | 52,394 | 36,485 | 77,834 | 46,032 | 212,745 | |||||||||||||||
Net income | 30,505 | 50,486 | 51,891 | 32,788 | 165,670 | |||||||||||||||
Per common share income | ||||||||||||||||||||
Basic: | $ | 0.60 | $ | 1.00 | $ | 1.03 | $ | 0.65 | $ | 3.28 | ||||||||||
Diluted: | $ | 0.60 | $ | 0.99 | $ | 1.02 | $ | 0.64 | $ | 3.26 | * | |||||||||
Weighted average basic | ||||||||||||||||||||
Shares outstanding | 50,817 | 50,449 | 50,424 | 50,431 | 50,530 | |||||||||||||||
Weighted average diluted | ||||||||||||||||||||
Shares outstanding | 50,957 | 50,741 | 50,751 | 50,901 | 50,837 | |||||||||||||||
Market Price | ||||||||||||||||||||
High | $ | 44.94 | $ | 52.69 | $ | 49.81 | $ | 47.73 | $ | 52.69 | ||||||||||
Low | $ | 32.52 | $ | 38.04 | $ | 40.88 | $ | 32.03 | $ | 32.03 | ||||||||||
* Includes rounding
First Quarter | Second Quarter | Third Quarter | Fourth Quarter | Full Year | ||||||||||||||||
(In thousands except per share data) | ||||||||||||||||||||
2017 | ||||||||||||||||||||
Net sales | $ | 2,278,364 | $ | 2,285,518 | $ | 2,369,556 | $ | 2,341,033 | $ | 9,274,471 | ||||||||||
Gross profit | 349,016 | 344,945 | 366,361 | 368,599 | 1,428,921 | |||||||||||||||
Income before income taxes | 48,533 | 42,028 | 60,325 | 63,537 | 214,423 | |||||||||||||||
Net income | 29,217 | 25,482 | 36,587 | 38,869 | 130,155 | |||||||||||||||
Per common share income | ||||||||||||||||||||
Basic: | $ | 0.58 | $ | 0.50 | $ | 0.72 | $ | 0.77 | $ | 2.57 | ||||||||||
Diluted: | $ | 0.58 | $ | 0.50 | $ | 0.72 | $ | 0.76 | $ | 2.56 | ||||||||||
Weighted average basic | ||||||||||||||||||||
Shares outstanding | 50,475 | 50,587 | 50,601 | 50,617 | 50,570 | |||||||||||||||
Weighted average diluted | ||||||||||||||||||||
Shares outstanding | 50,599 | 50,755 | 50,801 | 50,947 | 50,775 | |||||||||||||||
Market Price | ||||||||||||||||||||
High | $ | 50.06 | $ | 49.39 | $ | 45.99 | $ | 42.38 | $ | 50.06 | ||||||||||
Low | $ | 38.55 | $ | 40.81 | $ | 39.47 | $ | 34.60 | $ | 34.60 | ||||||||||
15. SUBSEQUENT EVENTS
ABL Loan Agreement
On August 30, 2018 (the "Signing Date”), the Company, entered into a Loan Agreement (the “New ABL Loan Agreement”), by and among the Company and United Natural Foods West, Inc. (together with the Company, the “U.S. Borrowers”), and UNFI Canada, Inc. (the “Canadian Borrower” and, together with the U.S. Borrowers, the “Borrowers”), the financial institutions that
70
are parties thereto as lenders (collectively, the “Lenders”), Bank of America, N.A. as administrative agent for the Lenders (the “ABL Administrative Agent”), Bank of America, N.A. (acting through its Canada branch), as Canadian agent for the Lenders (the “Canadian Agent”), and the other parties thereto. As of the Signing Date and as a result of the Company’s entry into the New ABL Loan Agreement, all of the commitments under the Amended Commitment Letter with respect to the Existing ABL Loan Agreement have been terminated and permanently reduced to zero. The commitment with respect to the New Term Loan Facility under the Amended Commitment Letter remained unchanged.
The New ABL Loan Agreement provides for the New ABL Credit Facility (the loans thereunder, the “Loans”), of which up to (i) $1,950.0 million is available to the U.S. Borrowers and (ii) $50.0 million is available to the Canadian Borrower. The New ABL Loan Agreement also provides for (i) a $125.0 million sublimit of availability for letters of credit of which there is a further $5.0 million sublimit for the Canadian Borrower and (ii) a $100.0 million sublimit for short-term borrowings on a swingline basis of which there is a further $3.5 million sublimit for the Canadian Borrower. Under the New ABL Loan Agreement, the Borrowers may, at their option, increase the aggregate amount of the New ABL Credit Facility in an amount of up to $600.0 million (but in not less than $10.0 million increments) without the consent of any Lenders not participating in such increase, subject to certain customary conditions and applicable Lenders committing to provide the increase in funding. There can be no assurance that additional funding would be available.
The obligations of the Lenders to provide Loans under the New ABL Loan Agreement on the Closing Date are subject to a number of customary conditions, including, without limitation, the consummation of the Merger (which must occur by January 25, 2019, subject to extension in certain circumstances pursuant to the terms of Merger Agreement) and execution and delivery by the borrowers and the guarantors of definitive documentation consistent with the New ABL Loan Agreement and the documentation standards specified therein.
Existing Term Loan Agreement Prepayment
On August 22, 2018, the Company notified its lenders that it intends to prepay its borrowings outstanding under its real estate backed term loan agreement, dated August 14, 2014 (as amended by the First Amendment Agreement, dated April 29, 2016, and the Second Amendment Agreement, dated September 1, 2016, the "Existing Term Loan Agreement") on October 1, 2018, which were approximately $110.0 million as of July 28, 2018. The Existing Term Loan Agreement was previously scheduled to terminate on the earlier of (a) August 14, 2022 and (b) the date that is ninety days prior to the termination date of the Existing ABL Loan Agreement. Concurrently with the prepayment of borrowings outstanding under the Existing Term Loan Agreement, the Company intends to draw on its Existing ABL Loan Agreement in an amount equal to its Existing Term Loan Agreement prepayment amount.
ITEM 9. CHANGES IN AND DISAGREEMENTS WITH ACCOUNTANTS ON ACCOUNTING AND FINANCIAL DISCLOSURE
Not applicable.
ITEM 9A. CONTROLS AND PROCEDURES
Evaluation of Disclosure Controls and Procedures.
We carried out an evaluation, under the supervision and with the participation of our Chief Executive Officer and Chief Financial Officer, of the effectiveness of the design and operation of our disclosure controls and procedures (as defined in Rules 13a-15(e) and 15d-15(e) of the Exchange Act) as of the end of the period covered by this Annual Report (the "Evaluation Date"). Based on this evaluation, our Chief Executive Officer and Chief Financial Officer concluded that, as of the Evaluation Date, our disclosure controls and procedures were effective.
Management's Annual Report on Internal Control Over Financial Reporting.
Our management is responsible for establishing and maintaining adequate internal control over financial reporting. Internal control over financial reporting is defined in Rules 13a-15(f) or 15d-15(f) promulgated under the Exchange Act as a process designed by, or under the supervision of, our principal executive and principal financial officers and effected by our Board of Directors, management and other personnel, to provide reasonable assurance regarding the reliability of financial reporting and the preparation of financial statements for external purposes in accordance with generally accepted accounting principles and includes those policies and procedures that:
• | Pertain to the maintenance of records that in reasonable detail accurately and fairly reflect the transactions and dispositions of our assets; |
• | Provide reasonable assurance that transactions are recorded as necessary to permit preparation of financial statements in accordance with generally accepted accounting principles, and that receipts and expenditures are being made only in accordance with authorizations of our management and directors; and |
71
• | Provide reasonable assurance regarding prevention or timely detection of unauthorized acquisition, use or disposition of our assets that could have a material effect on the financial statements. |
Because of its inherent limitations, internal control over financial reporting may not prevent or detect misstatements. Projections of any evaluation of effectiveness to future periods are subject to the risk that controls may become inadequate because of changes in conditions, or that the degree of compliance with the policies or procedures may deteriorate.
Our management, including our Chief Executive Officer and Chief Financial Officer, assessed the effectiveness of our internal control over financial reporting as of July 28, 2018. In making this assessment, our management used the criteria set forth by the Committee of Sponsoring Organizations of the Treadway Commission (COSO) in the Internal Control-Integrated Framework (2013 framework). Based on its assessment, our management concluded that, as of July 28, 2018, our internal control over financial reporting was effective based on those criteria at the reasonable assurance level.
Report of the Independent Registered Public Accounting Firm.
The effectiveness of our internal control over financial reporting as of July 28, 2018 has been audited by KPMG LLP, an independent registered public accounting firm, as stated in its attestation report which is included in "Item 8. Financial Statements and Supplementary Data" of this Annual Report.
Changes in Internal Controls Over Financial Reporting
No change in our internal control over financial reporting (as such term is defined in Exchange Act Rule 13a-15(f)or 15d-15(f)) occurred during the fiscal quarter ended July 28, 2018 that materially affected, or is reasonably likely to materially affect, our internal control over financial reporting.
ITEM 9B. OTHER INFORMATION
None.
72
PART III.
ITEM 10. DIRECTORS, EXECUTIVE OFFICERS AND CORPORATE GOVERNANCE
The information required by this item will be contained, in part, in our Definitive Proxy Statement on Schedule 14A for our Annual Meeting of Stockholders to be held on December 18, 2018 (the "2018 Proxy Statement") under the captions "Directors and Nominees for Director," "Executive Officers of the Company," "Section 16(a) Beneficial Ownership Reporting Compliance," and "Committees of the Board of Directors—Audit Committee" and is incorporated herein by this reference.
We have adopted a code of conduct and ethics that applies to our Chief Executive Officer, Chief Financial Officer, and employees within our finance, operations, and sales departments. Our code of conduct and ethics is publicly available on our website at www.unfi.com and is available free of charge by writing to United Natural Foods, Inc., 313 Iron Horse Way, Providence, Rhode Island 02908, Attn: Investor Relations. We intend to make any legally required disclosures regarding amendments to, or waivers of, the provisions of the code of conduct and ethics on our website at www.unfi.com. Please note that our website address is provided as an inactive textual reference only.
ITEM 11. EXECUTIVE COMPENSATION
The information required by this item will be contained in the 2018 Proxy Statement under the captions "Non-employee Director Compensation," "Executive Compensation", "Compensation Discussion and Analysis", Executive Compensation Tables," "Potential Payments Upon Termination or Change-in-Control," "CEO Pay Ratio," "Risk Oversight," "Compensation Risk," "Compensation Committee Interlocks and Insider Participation" and "Report of the Compensation Committee" and is incorporated herein by this reference.
ITEM 12. SECURITY OWNERSHIP OF CERTAIN BENEFICIAL OWNERS AND MANAGEMENT AND RELATED STOCKHOLDER MATTERS
The information required by this item will be contained, in part, in the 2018 Proxy Statement under the caption "Stock Ownership of Certain Beneficial Owners and Management", and is incorporated herein by this reference.
The following table provides certain information with respect to equity awards under our equity compensation plans as of July 28, 2018.
Plan Category | Number of securities to be issued upon exercise of outstanding options, warrants and rights | Weighted-average exercise price of outstanding options | Number of securities remaining available for future issuance under equity compensation plans (excluding securities reflected in the second column) | ||||||||
Plans approved by stockholders | 1,636,279 | (1) | $ | 52.46 | (1) | 2,676,949 | (2) | ||||
Plans not approved by stockholders | 87,083 | (3) | — | (3) | — | ||||||
Total | 1,723,362 | $ | 52.46 | 2,676,949 | |||||||
(1) | Includes 1,148,175 restricted stock units under the 2012 Plan, 162,910 performance-based restricted stock units under the 2012 Plan and 130,457 stock options under the 2012 Plan, 33,517 restricted stock units under the 2004 Plan, 80,070 stock options under the 2004 Plan and 81,150 stock options under the 2002 Plan. Restricted stock units and performance stock units do not have an exercise price because their value is dependent upon continued employment over a period of time or the achievement of certain performance goals, and are to be settled for shares of common stock. Accordingly, they have been disregarded for purposes of computing the weighted-average exercise price. |
(2) | All shares were available for issuance under the 2012 Plan. The 2012 Plan authorizes grants in the form of stock options, stock appreciation rights, restricted stock, restricted stock units, performance shares, performance units or a combination thereof but includes limits on the number of awards that may be issued in the form of restricted shares or units. The number of shares remaining available for future issuances assumes that, with respect to outstanding performance-based restricted stock units, the vesting criteria will be achieved at the target level. |
(3) | Consists of phantom stock units outstanding under the United Natural Foods Inc. Deferred Compensation Plan. See Note 11 "Retirement Plans" to our Consolidated Financial Statements included in "Item 8. Financial Statements and Supplementary Data" of this Annual Report for more information. Phantom stock units do not have an exercise price because the units may be settled only for shares of common stock on a one-for-one basis at a future date as outlined in the plan. |
ITEM 13. CERTAIN RELATIONSHIPS AND RELATED TRANSACTIONS, AND DIRECTOR INDEPENDENCE
73
The information required by this item will be contained in the 2018 Proxy Statement under the captions "Certain Relationships and Related Transactions" and "Director Independence" and is incorporated herein by this reference.
ITEM 14. PRINCIPAL ACCOUNTANT FEES AND SERVICES
The information required by this item will be contained in the 2018 Proxy Statement under the captions "Fees Paid to KPMG LLP" and “Policy on Audit Committee Pre-Approval of Audit and Permissible Non-Audit Services,” and is incorporated herein by this reference.
74
PART IV.
ITEM 15. EXHIBITS AND FINANCIAL STATEMENT SCHEDULES
(a) | Documents filed as a part of this Annual Report. |
1.Financial Statements. The Financial Statements listed in the Index to Financial Statements in Item 8 hereof are filed as part of this Annual Report.
2.Financial Statement Schedules. All schedules have been omitted because they are either not required or the information required is included in our consolidated financial statements or the notes thereto included in Item 8 hereof.
3.Exhibits. The Exhibits listed in the Exhibit Index immediately preceding such Exhibits are filed as part of this Annual Report.
ITEM 16. FORM 10-K SUMMARY
None.
75
EXHIBIT INDEX
Exhibit No. | Description | |
2.1 | ||
3.1 | ||
3.2 | ||
4.1 | ||
10.1** | ||
10.2** | ||
10.3** | ||
10.4** | ||
10.5** | ||
76
Exhibit No. | Description | |
10.6** | ||
10.7** | ||
10.8** | ||
10.9** | ||
10.10** | ||
10.11** | ||
10.12** | ||
10.13** | ||
10.14** | ||
10.15** | ||
77
Exhibit No. | Description | |
10.16** | ||
10.17** | ||
10.18** | ||
10.19** | ||
10.20** | ||
10.21** | ||
10.22** | ||
10.23** | ||
10.24** | ||
10.25 | ||
10.26 | ||
78
Exhibit No. | Description | |
10.27 | ||
10.28** | ||
10.29** | ||
10.30** | ||
10.31** | ||
10.32 | ||
10.33+ | ||
10.34+ | ||
10.35+ | ||
10.36+ | ||
10.37 | ||
10.38** | ||
79
Exhibit No. | Description | |
10.39 | ||
10.40 | ||
10.41 | ||
10.42 | ||
10.43 | ||
10.44** | ||
10.45** | ||
10.46** | ||
10.47** | ||
10.48** | ||
10.49** | ||
10.50** | ||
10.51** | ||
10.52** | ||
10.53** | ||
10.54* | ||
10.55* + | ||
21* | ||
23.1* | ||
31.1* | ||
31.2* | ||
32.1* | ||
32.2* | ||
80
Exhibit No. | Description | |
101* | The following materials from the United Natural Foods, Inc.'s Annual Report on Form 10-K for the fiscal year ended July 28, 2018, formatted in XBRL (eXtensible Business Reporting Language): (i) Consolidated Balance Sheets, (ii) Consolidated Statements of Income, (iii) Consolidated Statements of Comprehensive Income, (iv) Consolidated Statement of Stockholders' Equity, (v) Consolidated Statements of Cash Flows, and (vi) Notes to Consolidated Financial Statements. | |
* Filed herewith.
** Denotes a management contract or compensatory plan or arrangement.
+ Confidential treatment has been requested and granted with respect to certain portions of this exhibit pursuant to Rule 24b-2 of the Securities Exchange Act of 1934, as amended. Omitted portions have been filed separately with the United States Securities and Exchange Commission.
81
SIGNATURES
Pursuant to the requirements of Section 13 or 15 (d) of the Securities Exchange Act of 1934, the registrant has duly caused this report to be signed on its behalf by the undersigned thereunto duly authorized.
UNITED NATURAL FOODS, INC. | ||
/s/ MICHAEL P. ZECHMEISTER | ||
Michael P. Zechmeister Chief Financial Officer (Principal Financial and Accounting Officer) | ||
Dated: September 24, 2018 | ||
Pursuant to the requirements of the Securities Exchange Act of 1934, this report has been signed below by the following persons on behalf of the registrant and in the capacities and on the dates indicated.
Name | Title | Date | ||
/s/ STEVEN L. SPINNER | President, Chief Executive Officer and Chairman (Principal Executive Officer) | September 24, 2018 | ||
Steven L. Spinner | ||||
/s/ MICHAEL P. ZECHMEISTER | Chief Financial Officer (Principal Financial and Accounting Officer) | September 24, 2018 | ||
Michael P. Zechmeister | ||||
/s/ ERIC F. ARTZ | Director | September 24, 2018 | ||
Eric F. Artz | ||||
/s/ ANN TORRE BATES | Director | September 24, 2018 | ||
Ann Torre Bates | ||||
/s/ DENISE M. CLARK | Director | September 24, 2018 | ||
Denise M. Clark | ||||
/s/ DAPHNE J. DUFRESNE | Director | September 24, 2018 | ||
Daphne J. Dufresne | ||||
/s/ MICHAEL S. FUNK | Director | September 24, 2018 | ||
Michael S. Funk | ||||
/s/ JAMES P. HEFFERNAN | Director | September 24, 2018 | ||
James P. Heffernan | ||||
/s/ PETER A. ROY | Director | September 24, 2018 | ||
Peter A. Roy | ||||
82