Attached files
| file | filename |
|---|---|
| EX-32.1 - CERTIFICATION PURSUANT TO THE SARBANES-OXLEY ACT OF 2002 - FONAR CORP | fonar_exhibit-32.htm |
| EX-31.1 - CERTIFICATION - FONAR CORP | fonar_exhibit-31.htm |
| EX-23 - INDEPENDENT REGISTERED PUBLIC ACCOUNTING FIRMS CONSENT - FONAR CORP | fonar_exhibit-23.htm |
| EX-21.1 - SUBSIDIARIES OF THE REGISTRANT - FONAR CORP | fonar_exhibit-21.htm |
![]()
SECURITIES AND EXCHANGE COMMISSION
WASHINGTON, D.C. 20549
_____________________
FORM 10-K
_____________________
[X] ANNUAL REPORT PURSUANT TO SECTION 13 OR 15(d) OF THE SECURITIES EXCHANGE ACT OF 1934
For the fiscal year ended June 30, 2018
OR
[ ] TRANSITION REPORT PURSUANT TO SECTION 13 OR 15(d) OF THE SECURITIES AND
EXCHANGE ACT OF 1934
For the transition period from _____________ to _____________
Commission File No. 0-10248
___________________________
| FONAR CORPORATION |
| (Exact name of registrant as specified in its charter) |
| DELAWARE | 11-2464137 | |
| (State of incorporation) | (IRS Employer Identification Number) | |
| 110 Marcus Drive, Melville, New York | 11747 | |
| (Address of principal executive offices) | (Zip Code) |
| (631) 694-2929 | ||
(Registrant's telephone number, including area code)
|
____________________________________________________
Securities registered pursuant to Section 12(b) of the Act:
Common Stock, par value $.0001 per share
Securities registered pursuant to Section 12(g) of the Act:
None
_________________________________________________________________________
Indicate by check mark if the registrant is a well-known seasoned issuer, as defined in Rule 405 of the Securities Act. Yes ____ No __X__
Indicate by check mark if the registrant is not required to file reports pursuant to Section 13 or Section 15(d) of the Act. Yes ____ No __X__
Indicate by check mark whether the registrant (1) has filed all reports required to be filed by Section 13 or 15(d) of the Securities Exchange Act of 1934 during the preceding 12 months (or for such shorter period that the registrant was required to file such reports), and (2) has been subject to such filing requirements for the past 90 days. Yes ___X___ No _______
| 1 |
FONAR CORPORATION AND SUBSIDIARIES
Indicate by check mark whether the registrant (1) has submitted electronically and posted on its corporate Web site, if any, every Interactive Data File required to be submitted and posted pursuant to Rule 405 of Regulation S-T (Section 232.405 of this chapter) during the preceding 12 months (or for such shorter period that the registrant was required to submit and post such files). Yes ___X____ No ______
Indicate by check mark if disclosure of delinquent filers, pursuant to Item 405 of Regulation S-K, §229.405 of this Chapter, is not contained, and will not be contained, to the best of the registrant’s knowledge, in definitive proxy or information statements incorporated by reference in Part III of this 10-K or any amendment to the Form 10-K. [X]
Indicate by check mark whether the registrant is a large accelerated filer, an accelerated filer, a non-accelerated filer, a smaller reporting company, or an emerging growth company. See the definitions of “large accelerated filer,” “accelerated filer,” “smaller reporting company,”and "emerging growth company" in Rule 12b-2 of the Exchange Act.
| Large accelerated filer | [ ] | Accelerated filer | [X] | ||
| Non-accelerated filer | [ ] | (Do not check if smaller reporting company) | Smaller reporting company | [ ] | |
| Emerging growth company | [ ] | ||||
If an emerging growth company, indicate by check mark if the registrant has elected not to use the extended transition period for complying with any new or revised financial accounting standards provided pursuant to Section 13(a) of the Exchange Act. ____
Indicate by check mark whether the registrant is a shell company (as defined in Rule 12b-2 of the Exchange Act). Yes ____ No __X__
The aggregate market value of the shares of Common Stock held by non-affiliates as of December 29, 2017 based on the closing price of $24.35 per share on such date as reported on the NASDAQ System, was approximately $152.6 million. The other outstanding classes do not have a readily determinable market value.
As of September 10, 2018, 6,357,482 shares of Common Stock, 146 shares of Class B Common Stock, 382,513 shares of Class C Common Stock and 313,438 shares of Class A Non-voting Preferred Stock of the registrant were outstanding.
DOCUMENTS INCORPORATED BY REFERENCE
None
| 2 |
FONAR CORPORATION AND SUBSIDIARIES
FORM 10-K ITEMS
PART I
GENERAL
Fonar Corporation, sometimes referred to as the "Company" or "Fonar", is a Delaware corporation which was incorporated on July 17, 1978. Our address is 110 Marcus Drive, Melville, New York 11747 and our telephone number is 631-694-2929. Fonar also maintains a website at www.fonar.com. Fonar provides copies of its filings with the Securities and Exchange Commission on Forms 10-K, 10-Q and 8-K and amendments to these reports to stockholders on request.
We conduct our business in two segments. Our medical equipment segment is conducted directly through Fonar. Our physician management and diagnostic services segment is conducted through our subsidiary Health Management Company of America (“HMCA”), also called Health Diagnostics Management, LLC. HMCA provides management services, administrative services, billing and collection services, office space, equipment, repair, maintenance service, and clerical and other non-medical personnel to medical providers engaged in diagnostic imaging. In addition to acting as a management company, HMCA owns and operates four diagnostic imaging facilities in Florida, where the corporate practice of medicine is permitted.
| 3 |
FONAR CORPORATION AND SUBSIDIARIES
We restructured the corporate organization of our physician and diagnostic services management segment of our business effective July 1, 2015. Imperial Management Services, LLC (“Imperial”), a subsidiary which owned the assets used in the business of its parent, Health Management Corporation of America (which is wholly-owned by Fonar), transferred those assets to Health Diagnostics Management, LLC (“HDM”), which is another subsidiary of Health Management Corporation of America. As a result, going forward our physician and diagnostic management business will be conducted entirely through HDM, which is operating under the assumed name Health Management Company of America.
Fonar is engaged in the business of designing, manufacturing, selling and servicing magnetic resonance imaging scanners, also referred to as "MRI" or "MR" scanners, which utilize MRI technology for the detection and diagnosis of human disease, abnormalities, other medical conditions and injuries. Fonar’s founders built the first MRI scanner in 1977 and Fonar introduced the first commercial MRI scanner in 1980. Fonar is also the originator of the iron-core non-superconductive and permanent magnet MRI technology.
Fonar’s iron frame technology made Fonar the originator of "open" MRI scanners. We introduced the first "open" MRI in 1980. Since that time we have concentrated on further application of our “open” MRI, introducing most recently the Upright® Multi-Position™” MRI scanner (also referred to as the “Upright®” or “Stand-Up®” MRI scanner) and the Fonar 360™ MRI scanner. The Fonar 360™ MRI is not presently being marketed.
See Note 16 to the Consolidated Financial Statements for separate financial information regarding our medical equipment and physician and diagnostic management services segments.
FORWARD LOOKING STATEMENTS.
Certain statements made in this Annual Report on Form 10-K are "forward-looking statements", within the meaning of the Private Securities Litigation Reform Act of 1995, regarding the plans and objectives of Management for future operations. Such statements involve known and unknown risks, uncertainties and other factors that may cause our actual results, performance or achievements to be materially different from any future results, performance or achievements expressed or implied by such forward-looking statements. These forward-looking statements are based on current expectations that involve numerous risks and uncertainties. Our plans and objectives are based, in part, on assumptions involving the expansion of business. These assumptions involve judgments with respect to, among other things, future economic, competitive and market conditions and future business decisions, all of which are difficult or impossible to predict accurately and many of which are beyond our control. Although we believe that our assumptions underlying the forward-looking statements are reasonable, any of the assumptions could prove inaccurate and, therefore, there can be no assurance that the forward-looking statements included in this Annual Report will prove to be accurate. In light of the significant uncertainties inherent in our forward-looking statements, the inclusion of such information should not be regarded as a representation by us or any other person that our objectives and plans will be achieved.
THE UPRIGHT® MRI SCANNER
The Upright® MRI scanner is the product we are presently promoting. The Upright® MRI (also known as the “Stand-Up® MRI”) is a “whole-body” MRI, meaning it can be used to scan any part of the body. Unlike conventional recumbent MRI scanners, the Upright® MRI permits MRI scans to be made in the weight-bearing state. The Upright® MRI allows patients to be scanned while standing, sitting, bending or lying down. This means that an abnormality or injury, such as a slipped disk, may be scanned in a weight-bearing posture, which more often than not is the position in which patients experience pain. An adjustable bed allows patients to stand, sit or lie on their backs, sides or stomachs. The Upright® MRI is by design a non-claustrophobic MRI scanner. We have introduced the name “Upright®” as an alternative to “Stand-Up®” because of the multiplicity of positions in which the patient may be scanned where the patient is not standing.
HMCA manages a total of 26 MRI scanning facilities, four of which are owned by subsidiaries of HMCA. Nineteen facilities are located in New York and seven are located in Florida. (The four facilities owned by HMCA subsidiaries are in Florida, where the corporate practice of medicine is permitted.) Twenty-four facilities are equipped with Upright® MRI scanners. We believe that the utilization of Fonar Upright® MRI scanning systems, which are produced under the protection of our patents, have been a significant factor in the increased patient volume of the scanning facilities.
| 4 |
FONAR CORPORATION AND SUBSIDIARIES
MEDICAL EQUIPMENT SEGMENT
PRODUCTS
The Fonar Upright® MRI is a weight-bearing whole-body open MRI system which enables positional MRI (pMRI®) applications. Operating at a magnetic field strength of 0.6 Tesla, the scanner is a powerful, diagnostically versatile and cost-effective open MRI that provides a broad range of clinical capabilities and a complete set of imaging protocols. Patients can be scanned standing, bending, sitting, upright at an intermediate angle and in the conventional recumbent position. This multi-positional MRI system accommodates an unrestricted range of motion for flexion, extension, lateral bending, and rotation studies of the cervical (upper) and lumbar (lower) spine. Previously difficult patient scanning positions can be achieved and compared using the system’s MRI-compatible, three-dimensional, motorized patient handling system. The system’s lift and tilt functions deliver the targeted anatomical region to the center of the magnet. True image orientation is assured, regardless of the rotation angle, via computer read-back of the table’s position.
There is considerable evidence that the weight-bearing Upright® MRI provides medical benefits not duplicated by any other MRI scanner because patient positioning plays a critical role in detecting clinically significant pathology.
For instance, the Fonar Upright® technology has demonstrated its key value on patients with the Arnold-Chiari Syndrome, which is believed to affect 200,000 to 500,000 Americans. In this syndrome, brain stem compression and subsequent severe neurological symptoms occur in these patients, when because of weakness in the support tissues within the skull, the brain stem descends and is compressed and entrapped at the base of the skull in the foramen magnum, which is the circular bony opening at the base of the skull where the spinal cord exits the skull. The brain structures “entrapped” in Chiari Syndrome are the lowest lying structures of the brain, the tonsils of the cerebellum. The Chiari Syndrome is therefore alternately named Cerebellar Tonsillar Ectopia (CTE) indicating the displacement (ectopia) of these Cerebellar tonsils in this syndrome. Classic symptoms of the Chiari Syndrome include the “drop attack,” where the patient unexpectedly experiences an explosive rush or nervous discharge at the base of the brain which rushes down the body to the extremities, causing the patient to collapse in a temporary neuromuscular paralysis; this subsides when the patient is lying down. Conventional lie-down MRI scanners cannot make an adequate evaluation of the pathology since the patient’s pathology is most visible and the symptoms are most acute when the patient is scanned in the upright weight-bearing position.
A publication in the Journal “Brain Injury” (Brain Injury 2010, 24 (7-8) 988-994) of 1,200 neck pain patients reported that the fallen cerebellar tonsils of the brain (CTE) were missed 75% of the time when the patient was scanned only in the recumbent position. It is critical to have an image of the patient in an upright position so that the neurosurgeons can fully evaluate the extent of the brain stem and choose the most appropriate surgical approach for the operative repair.
The study was published by 10 authors from distinguished universities in the United States and around the world. The study reported that Cerebellar Tonsillar Ectopia Herniation (CTE) was missed 75% of the time when the patient was scanned lying down instead of upright. At the current rate of 1,000,000 automobile whiplash injuries in the U.S. per year, 600,000 patients each year would have the pathology responsible for their symptoms go undetected if they were examined solely in a conventional recumbent-only MRI.
The Upright® MRI has also demonstrated its value for patients suffering from scoliosis. Scoliosis patients have been typically subjected to routine x-ray exams for years and must be imaged upright for an adequate evaluation of their scoliosis. Because the patient must be standing for the exam, an x-ray machine has been the only modality that could provide that service. The Upright® MRI is the only MRI scanner that allows the patient to stand during the MRI exam. Fonar has developed a new RF receiver and scanning protocol that for the first time allows scoliosis patients to obtain diagnostic pictures of their spines without the risks of x-rays. A study by the National Cancer Institute (2000) of 5,466 women with scoliosis reported a 70% increase in breast cancer resulting from 24.7 chest x-rays these patients received on the average in the course of their scoliosis treatment.
| 5 |
FONAR CORPORATION AND SUBSIDIARIES
Other important new applications are Upright® imaging of the pelvic floor and abdomen to image prolapses and inguinal hernias. Fonar has also developed the first non-invasive method to image the prostate: the patient simply sits on a flat, seat-like coil.
The Upright® MRI is also the world’s most non-claustrophobic whole-body MRI scanner. Patients can simply walk into the magnet, stand or sit for their scans and then walk out. The magnet’s front-open and top-open design provides an unprecedented degree of comfort because there is nothing in front of the patient’s face except a large (42”) flat-screen TV that is mounted on the wall. The default position for the bed is a tilt back of six degrees that minimizes patient motion. Special RF receiver coil fixtures, a patient seat, Velcro straps, and transpolar stabilizing bars are also used to keep the patient comfortable and motionless throughout the scanning process.
Full-range-of-motion studies of the joints in a multiple of directions are possible, an especially promising feature for sports injuries. Full range of motion cines, or movies, of the lumbar spine can also be achieved under full body weight.
Fonar created the high-field open MRI market segment. The Fonar Upright® MRI operates at a significantly higher magnetic field strength than the 0.2-0.35 Tesla open MRIs that preceded it, and, therefore, benefits from more of the MRI image-producing signal needed to make high-quality MRI images.
Fonar maximizes image quality through an optimal combination of image signal to noise (S/N) and contrast-to noise (C/N) ratios. Technical improvements incorporated into the scanner design include increased image processing speed, high-S/N Organ Specific(TM) RF receiver coils, high performance front-end electronics featuring high-speed, wide-dynamic-range analog-to-digital conversion and a miniaturized ultra-low-noise pre-amplifier, high-speed automatic tuning, bandwidth-optimized pulse sequences, multi-bandwidth sequences, and off-center FOV imaging capability.
In addition to the signal-to-noise ratio, however, a major determinant of image quality that must be considered is contrast, the quality that enables reading physicians to clearly distinguish adjacent, and sometimes minute, anatomical structures from their surroundings. This quality is measured by contrast-to-noise ratios (C/N). Unlike S/N, which increases with increasing field strength, relaxometry studies have shown that C/N peaks in the mid-field range and actually falls off precipitously at higher field strengths. The Upright® MRI scanners operate squarely in the optimum C/N range.
FONAR’s scanners are equipped with a variety of software features which enhance versatility and diagnostic capability. For example, SMART™ scanning allows for same-scan customization of multi-slice scans, each slice with its own thickness, resolution, angle and position. This is an important feature for scanning parts of the body that include small-structure sub-regions requiring finer slice parameters. There is also Multi-Angle Oblique™ (MAO) imaging, and oblique imaging.
During fiscal 2018, sales of our Upright® MRI scanners accounted for approximately 0.5% of our total revenues and 0.4% of our medical equipment revenues, as compared to 0.9% of total revenues and 6.4% of medical equipment revenues in fiscal 2017, and 1.1% of our total revenues and 7.7% of medical equipment revenues in fiscal 2016.
FONAR’s principal selling, marketing and advertising efforts have been focused on the Upright® MRI, which we believe is a particularly unique product, being the only MRI scanner which is both open and allows for weight-bearing imaging. We expect to continue our focus on the Upright® MRI in the immediate future.
The materials and components used in the manufacture of our products (circuit boards, computer hardware components, electrical components, steel and plastic) are generally available at competitive prices. We have not had difficulty acquiring such materials.
| 6 |
FONAR CORPORATION AND SUBSIDIARIES
PRODUCT MARKETING
The principal markets for the Company's scanners are private diagnostic imaging centers and hospitals.
We use internal and independent manufacturer’s representatives for domestic and foreign markets. None of Fonar’s competitors are entitled to make the Fonar Upright® MRI scanner.
Fonar’s Website includes interactive product information for interested customers.
Fonar’s marketing strategy has been designed to reach key purchasing decision makers with information concerning the Upright® MRI. This has led to many inquiries and to some sales of the Upright® MRI scanner and is intended to increase Fonar’s presence in the medical market. Fonar focuses on four target audiences: neurosurgeons, orthopaedic surgeons, radiologists and physicians in general.
| 1) | Neurosurgeons and Orthopaedic Surgeons: These are the surgeons who can most benefit from the superior diagnostic benefits of the Fonar Upright® MRI with its Multi-Position® MRI diagnostic ability. |
| 2) | Radiologists: These physicians can now offer a new modality to their referring physicians. |
| 3) | All Physicians: The vast number of doctors who send patients for MRI’s need to be aware of the diagnostic advantages of the Fonar Upright® Multi-Position™. |
Our advertising for Fonar and HMCA re-enforces the unique value provided by Fonar MRI scanners. We have increased internet awareness of our product by driving patient traffic to the Upright® scanning centers we manage via the Fonar website (www.fonar.com) as well as by creating Websites for each HMCA location. These websites give prospective customers of Upright® MRI scanners a view of operating Upright® MRI centers and highlight the benefits of using an Upright® MRI scanner. The success of HMCA-managed sites not only increases management fees to HMCA but encourages new sales for Fonar as well. A complete list of the sites managed by HMCA can be found at HMCA’s website, hmca.com.
SERVICE AND UPGRADES FOR MRI SCANNERS
Our customer base of installed scanners has been and will continue to be an additional source of income, independent of direct sales.
Income is generated from the installed base in two principal areas, namely, service and upgrades. Service and maintenance revenues from our external installed base were approximately $9.6 million in fiscal 2017 and $9.2 million in fiscal 2018. Our objective is to maintain service revenues at present levels or better, based on the longevity of the technology, and the refurbishments and upgrades which keep the scanners competitive with the latest techniques.
We also anticipate that our scanners will result in upgrades income in future fiscal years. The potential for upgrades income, originates in the versatility and productivity of the Upright® Imaging technology. New medical uses for MRI technology are constantly being discovered and are anticipated for the Upright® Imaging technology as well. New features can often be added to the scanner by the implementation of little more than versatile new software packages, which when coupled with hardware upgrades can add years of useful life to the scanner.
| 7 |
FONAR CORPORATION AND SUBSIDIARIES
RESEARCH AND DEVELOPMENT
During the fiscal year ended June 30, 2018, we incurred expenditures of $1,755,747, none of which were capitalized, on research and development, as compared to $1,480,670, none of which were capitalized, during the fiscal year ended June 30, 2017.
Research and development activities have focused principally on software improvements to the user interface of the MRI scanner. The Windows-based Sympulse™ platform controls all of the functions of the Upright® scanner except those of the versatile, multi-position patient table. Separate, dedicated, motion-control software is used to maneuver the Upright® bed, and development of this software is ongoing as well.
While software improvements to the user interface are important in their own right, significant value is added to the MRI scanner by the modification of existing protocols for examining various parts of the body, and the development of new protocols that utilize new underlying capabilities of the pulse sequence software. Over time, FONAR users have become accustomed to the steady improvement in the recommended clinical protocols that accompany new software releases. More significantly, in recent years we have seen increasing adoption of FONAR-recommended clinical protocols over those developed on site. This is a testament to the superior image quality they produce in attractively short scan times.
The development of clinically practical scan protocols and software depends on close contact between research and development scientists and engineers, and end users. That close contact is facilitated in part by the relationship with HMCA and the scanning centers. In addition to that collaboration, R&D staff have pursued a variety of novel and Upright® MRI-specific research projects. It is anticipated that these will ultimately lead to new applications that are made available to existing customers as upgrade add-ons to their machines. For example, phase-contrast imaging techniques originally developed for angiography have recently been applied to cerebro-spinal fluid (CSF) flow. Analysis of CSF flow in upright and recumbent postures may prove to be of significant value in the evaluation of a variety of disorders.
BACKLOG
Our backlog of unfilled orders at September 5, 2018 was approximately $692,000, as compared to $735,000 at September 13, 2017. It is expected that the existing backlog of orders will be filled within the 2018 fiscal year.
PATENTS AND LICENSE
We currently have numerous patents in effect which relate to the technology and components of our MRI scanners. We believe that these patents, and the know-how we have developed, are material to our business.
One of our patents, issued in the name of Dr. Damadian and licensed to Fonar, was United States patent No. 3,789,832, Apparatus and Method for Detecting Cancer in Tissue, also referred to in this report as the "1974 Patent". The 1974 Patent was the first MRI patent issued by the United States Patent Office. The development of our MRI scanners has been based upon the 1974 Patent, and we believe that the 1974 Patent was the first of its kind to utilize MR to scan the human body and to detect cancer. The 1974 Patent was extended beyond its original 17-year term and expired in February, 1992.
We have significantly enhanced our patent position within the industry and now possesses a substantial patent portfolio which provides us, under the aegis of United States patent law, "the exclusive right to make, use and sell" many of the scanner features which Fonar pioneered and which are now incorporated in most MRI scanners sold by the industry. As of June 30, 2018, 209 patents had been issued to Fonar, and approximately 20 patents were pending. A number of Fonar’s existing patents specifically relate to protecting Fonar’s position in the Upright MRI market. The patents further enhance Dr. Damadian's pioneer patent, the 1974 Patent, that initiated the MRI industry and provided the original invention of MRI scanning. The terms of the patents in Fonar’s portfolio extend to various times.
We also have patent cross-licensing agreements with other MRI manufacturers. We have not licensed, however, any technology relating to Upright® MRI scanning.
| 8 |
FONAR CORPORATION AND SUBSIDIARIES
PRODUCT COMPETITION
MRI SCANNERS
MRI takes advantage of the nuclear magnetic resonance signal elicited from the body's tissues and the exceptional sensitivity of this signal for detecting disease discovered by Fonar. Much of the serious disease of the body occurs in the soft tissue of vital organs. The maximum contrast available by x-ray with which to discriminate disease is 4%. Brain cancers differ from surrounding healthy brain by only 1.6% while the contrast in the brain by MRI is 25 times greater at 40%. X-ray contrasts among the body’s soft tissues are maximally 4%. Their contrast by MRI is 32.5 times greater (130%).
The soft tissue contrasts with which to distinguish cancers on images by MRI are up to 180%. In the case of cancer these contrasts can be even more marked making cancers readily visible and detectable anywhere in the body. This is because the nuclear resonance signals from the body's normal soft tissue vital organs, as discovered in the original publication that founded MRI, differ so dramatically from each other (e.g. small intestine 257 milliseconds, brain 595 milliseconds). Liver cancer and healthy liver signals differ by 180% for example.
A majority of the MRI scanners in use in hospitals and outpatient facilities and at mobile sites in the United States are based on high field (1.5 - 3.0 Tesla) air core superconducting magnet technology.
The remainder, described as Open MRIs, are recumbent-only machines based on Fonar’s original iron-frame vertical magnetic field magnet design. These systems have been manufactured and sold by many of our largest competitors over the years. They generally operate at low field strengths (0.2 - 0.35 Tesla). Their prevalence in the marketplace has led to the perception of the medical community that Open MRIs are useful only for anxious and claustrophobic patients, that the Open MRI’s image quality is poor, and that the scan times are long. Recently our competitors have introduced higher field strength Open MRI products (0.5 – 1.2 Tesla). Significantly better imaging performance (especially at 1.2 T) compared to the low field strength systems, is beginning to change that perception. However, Fonar continues to maintain its competitive advantage at 0.6 Tesla due to our front-open non-claustrophobic configuration in which there is nothing in front of the patient’s face, and our unique ability to scan patients in weight-bearing positions that is sometimes more consequential than a small increase in the image resolution and decrease in scan time. It is also noteworthy that our horizontal transaxial magnetic field allows the Upright MRI, in contrast to the recumbent-only Open MRIs, to use the same flat planar-style radiofrequency receiver coil as the high-field MRI systems to image the lumbar and thoracic spine.
One of the Upright MRI’s big competitive advantages is that it is dramatically different from the Open MRI in several important ways:
The Upright MRI does something clinically valuable that the high-field MRI machines cannot do (i.e. positional imaging, weight-bearing imaging).
Although the patient can extend his arms and possibly see out the sides while recumbent in an Open MRI, there is still a large intimidating magnet pole very close to and directly in front of the patient’s face. The Upright MRI allows the patient to look directly out of the scanner and view a large flatscreen TV.
The Upright MRI uses the same configuration RF receiver coil as a high-field MRI system to image the spine. Open MRIs cannot do this. (This is because of the rule in MRI that the axis of symmetry of the RF receiver coil should be perpendicular to the direction of the main magnetic field). The upright patient sits comfortably with his back against a flat (“planar”) RF receiver coil in our horizontal transaxial magnetic field. In contrast, the vertical magnetic field in the recumbent-only Open MRI precludes the use of this type of receiver coil.
| 9 |
FONAR CORPORATION AND SUBSIDIARIES
Relative to the high-field systems, the Upright MRI has two major competitive advantages:
Sometimes patient positioning is more consequential than a small increase in the image resolution and decrease in the scan time. As it is critical for physicians to not “miss” anything in the images, they recognize that the position-dependent pathology visualized with the Upright MRI will be invisible (“missed”) if their patients are scanned at a higher field strength.
Image artifacts arising from metal implants such as surgical screws are diminished with the 0.6 Tesla Upright MRI compared to those from the high-field MRIs. It is well known that such artifacts get smaller as the MRI magnet’s field strength is reduced, so the anatomy adjacent to implanted hardware will be less obscured with the Upright MRI. This is particularly valuable for surgeons referring their postoperative patients for diagnostic imaging studies.
Fonar faces competition within the MRI industry from such firms as General Electric Company, Philips N.V., Toshiba Corporation, Hitachi Corporation and Siemens A.G. Most competitors have marketing and financial resources more substantial than those available to us. They have in the past, and may in the future, heavily discount the sales price of their scanners. Such competitors sell both high field air core superconducting MRI scanners and iron frame products. Fonar’s original iron frame design, ultimately imitated by Fonar’s competitors to duplicate Fonar’s origination of “Open” MRI magnets, gave rise to current patent protected Upright® MRI technology with the result that Fonar today is the unique and only supplier of the highest field MRI magnets (0.6 Tesla) that are not superconducting, do not use liquid helium and are not therefore susceptible to severe consequences and downtime cause by a system quench.
The iron frame, because it controls the magnetic lines of force and places them where wanted and removes them from where not wanted, provides a more versatile magnet design than is possible with air core magnets. Air core magnets contain no iron but consist entirely of turns of current carrying wire.
Fonar expects to be the leader in weight-bearing and positional MRI for providing dynamic visualization of body parts including the spine and extremities.
OTHER IMAGING MODALITIES
Fonar’s MRI scanners also compete with other diagnostic imaging systems, all of which are based upon the ability of energy waves to penetrate human tissue and to be detected by either photographic film or electronic devices for presentation of an image on a display monitor. Three different kinds of energy waves - X-ray, gamma and sound - are used in medical imaging techniques which compete with MRI medical scanning, the first two of which involve exposing the patient to potentially harmful radiation. These other imaging modalities compete with MRI products on the basis of specific applications.
X-rays are the most common energy source used in imaging the body and are employed in three imaging modalities:
| 1. | Conventional X-ray systems, the oldest method of imaging, are typically used to image bones and teeth. The image resolution of adjacent structures that have high contrast, such as bone adjacent to soft tissue, is excellent, while the discrimination between soft tissue organs is poor because of the nearly equivalent penetration of x-rays. |
| 2. | Computerized Tomography, also referred to as "CT", systems couple computers to x-ray instruments to produce cross-sectional images of particular large organs or areas of the body. The CT scanner addresses the need for images, not available by conventional radiography, that display anatomic relationships spatially. However, CT images are generally limited to the transverse plane and cannot readily be obtained in the two other planes, sagittal and coronal. Improved picture resolution is available at the expense of increased exposure to x-rays from multiple projections. Furthermore, the pictures obtained by this method are computer reconstructions of a series of projections and, once diseased tissue has been detected, CT scanning cannot be focused for more detailed pictorial analysis or obtain a chemical analysis. |
| 10 |
FONAR CORPORATION AND SUBSIDIARIES
| 3. | Digital radiography systems add computer image processing capability to conventional x-ray systems. Digital radiography can be used in a number of diagnostic procedures which provide continuous imaging of a particular area with enhanced image quality and reduced patient exposure to radiation. |
Nuclear medicine systems, which are based upon the detection of gamma radiation generated by radioactive pharmaceuticals introduced into the body, are used to provide information concerning soft tissue and internal body organs and particularly to examine organ function over time.
Ultrasound systems emit, detect and process high frequency sound waves reflected from organ boundaries and tissue interfaces to generate images of soft tissue and internal body organs. Although the images are substantially less detailed than those obtainable with x-ray methods, ultrasound is generally considered harmless and therefore has found particular use in imaging the pregnant uterus.
X-ray machines, ultrasound machines, digital radiography systems and nuclear medicine compete with the MRI scanners by offering significantly lower price and space requirements. However, Fonar believes that the utility of the images produced by its MRI scanners is generally superior to the utility of the images produced by those other methodologies.
GOVERNMENT REGULATION
FDA Regulation
The Food and Drug Administration in accordance with Title 21 of the Code of Federal Regulations regulates the manufacturing and marketing of Fonar’s MRI scanners. The regulations can be classified as either pre-market or post-market. The pre-market requirements include obtaining marketing clearance, proper device labeling, establishment registration and device listing. Once the products are on the market, Fonar must comply with post-market surveillance controls. These requirements include the Quality Systems Regulation, or “QSR”, also known as Current Good Manufacturing Practices or CGMPs, and Medical Device Reporting, also referred to as MDR regulations. The QSR is a quality assurance requirement that covers the design, packaging, labeling and manufacturing of a medical device. The MDR regulation is an adverse event-reporting program.
Classes of Products
Under the Medical Device Amendments of 1976 to the Federal Food, Drug and Cosmetic Act, all medical devices are classified by the FDA into one of three classes. A Class I device is subject only to general controls, such as labeling requirements and manufacturing practices; a Class II device must comply with certain performance standards established by the FDA; and a Class III device must obtain pre-market approval from the FDA prior to commercial marketing. Fonar’s products are Class II devices. Class II devices are subject to "General Controls"; General Controls include:
| 1. | Establishment registration of companies which are required to register under 21 CFR Part 807.20, such as manufacturers, distributors, re-packagers and re-labelers. |
| 2. | Medical device listing with FDA of devices to be marketed. |
| 11 |
| . |
FONAR CORPORATION AND SUBSIDIARIES
| 3. | Manufacturing devices in accordance with the Current Good Manufacturing Practices Quality System Regulation in 21 CFR Part 820. |
| 4. | Labeling devices in accordance with labeling regulations in 21 CFR Part 801 or 809. |
| 5. | Submission of a Premarket Notification, pursuant to 510(k), before marketing a device. |
In addition to complying with general controls, Class II devices are also subject to special controls. Special controls may include special labeling requirements, guidance documents, mandatory performance standards and post-market surveillance.
On October 3, 2000 Fonar received FDA clearance for the Upright® MRI under the name “Indomitable”.
Premarketing Submission
Each person who wants to market Class I, II and some III devices intended for human use in the U.S. must submit a 510(k) to FDA at least 90 days before marketing unless the device is exempt from 510(k) requirements. A 510(k) is a pre-marketing submission made to FDA to demonstrate that the device to be marketed is as safe and effective, that is, substantially equivalent, SE, to a legally marketed device that is not subject to pre-market approval, PMA. Applicants must compare their 510(k) device to one or more similar devices currently on the U.S. market and make and support their substantial equivalency claims.
The FDA is committed to a 90-day clearance after submission of a 510(k), provided the 510(k) is complete and there is no need to submit additional information or data.
The 510(k) is essentially a brief statement and description of the product. As Fonar’s scanner products are Class II products, there are no pre-market data requirements.
An investigational device exemption, also referred to as IDE, allows the investigational device to be used in a clinical study pending FDA clearance in order to collect safety and effectiveness data required to support the Premarket Approval, also referred to as PMA, application or a Premarket Notification pursuant to 510(k), submission to the FDA. Clinical studies are most often conducted to support a PMA.
For the most part, however, we have not found it necessary to utilize IDE’s. The standard 90 day clearance for our new MRI scanner products classified as Class II products makes the IDE unnecessary, particularly in view of the time and effort involved in compiling the information necessary to support an IDE.
Quality System Regulation
The Quality Management System is applicable to the design, manufacture, administration of installation and servicing of magnetic resonance imaging scanner systems. The FDA has authority to conduct detailed inspections of manufacturing plants, to establish Good Manufacturing Practices which must be followed in the manufacture of medical devices, to require periodic reporting of product defects and to prohibit the exportation of medical devices that do not comply with the law.
| 12 |
FONAR CORPORATION AND SUBSIDIARIES
Medical Device Reporting Regulation
Manufacturers must report all MDR reportable events to the FDA. Each manufacturer must review and evaluate all complaints to determine whether the complaint represents an event which is required to be reported to FDA. Section 820.3(b) of the Quality Systems regulation defines a complaint as, "any written, electronic or oral communication that alleges deficiencies related to the identity, quality, durability, reliability, safety, effectiveness, or performance of a device after it is released for distribution."
A report is required when a manufacturer becomes aware of information that reasonably suggests that one of their marketed devices has or may have caused or contributed to a death, serious injury, or has malfunctioned and that the device or a similar device marketed by the manufacturer would be likely to cause or contribute to a death or serious injury if the malfunction were to recur.
Malfunctions are not reportable if they are not likely to result in a death, serious injury or other significant adverse event experience.
A malfunction which is or can be corrected during routine service or device maintenance still must be reported if the recurrence of the malfunction is likely to cause or contribute to a death or serious injury if it were to recur.
We have established and maintained written procedures for implementation of the MDR regulation. These procedures include internal systems that:
provide for timely and effective identification, communication and evaluation of adverse events;
provide a standardized review process and procedures for determining whether or not an event is reportable; and
provide procedures to insure the timely transmission of complete reports.
These procedures also include documentation and record keeping requirements for:
information that was evaluated to determine if an event was reportable;
all medical device reports and information submitted to the FDA;
any information that was evaluated during preparation of annual certification reports; and
systems that ensure access to information that facilitates timely follow up and inspection by FDA.
FDA Enforcement
FDA may take the following actions to enforce the MDR regulation:
FDA-Initiated or Voluntary Recalls
| 13 |
FONAR CORPORATION AND SUBSIDIARIES
Recalls are regulatory actions that remove a hazardous, potentially hazardous, or a misbranded product from the marketplace. Recalls are also used to convey additional information to the user concerning the safe use of the product. Either FDA or the manufacturer can initiate recalls.
There are three classifications, i.e., I, II, or III, assigned by the Food and Drug Administration to a particular product recall to indicate the relative degree of health hazard presented by the product being recalled.
Class I
Is a situation in which there is a reasonable probability that the use of, or exposure to, a violative product will cause serious adverse health consequences or death.
Class II
Is a situation in which use of, or exposure to, a violative product may cause temporary or medically reversible adverse health consequences or where the probability of serious adverse health consequences is remote.
Class III
Is a situation in which use of, or exposure to, a violative product is not likely to cause adverse health consequences.
Fonar has initiated six voluntary recalls. Five of the recalls were Class II and one was Class III. The recalls involved making minor corrections to the product in the field. Frequently, corrections which are made at the site of the device are called field corrections as opposed to recalls.
Civil Money Penalties
The FDA, after an appropriate hearing, may impose civil money penalties for violations of the FD&C Act that relate to medical devices. In determining the amount of a civil penalty, FDA will take into account the nature, circumstances, extent, and gravity of the violations, the violator's ability to pay, the effect on the violator's ability to continue to do business, and any history of prior violations.
Warning Letters
FDA issues written communications to a firm, indicating that the firm may incur more severe sanctions if the violations described in the letter are not corrected. Warning letters are issued to cause prompt correction of violations that pose a hazard to health or that involve economic deception. The FDA generally issues the letters before pursuing more severe sanctions.
Seizure
seizure is a civil court action against a specific quantity of goods which enables the FDA to remove these goods from commercial channels. After seizure, no one may tamper with the goods except by permission of the court. The court usually gives the owner or claimant of the seized merchandise approximately 30 days to decide a course of action. If they take no action, the court will recommend disposal of the goods. If the owner decides to contest the government's charges, the court will schedule the case for trial. A third option allows the owner of the goods to request permission of the court to bring the goods into compliance with the law. The owner of the goods is required to provide a bond or, security deposit, to assure that they will perform the orders of the court, and the owner must pay for FDA supervision of any activities by the company to bring the goods into compliance.
Citation
A citation is a formal warning to a firm of intent to prosecute the firm if violations of the FD&C Act are not corrected. It provides the firm an opportunity to convince FDA not to prosecute.
| 14 |
FONAR CORPORATION AND SUBSIDIARIES
Injunction
An injunction is a civil action filed by FDA against an individual or company. Usually, FDA files an injunction to stop a company from continuing to manufacture, package or distribute products that are in violation of the law.
Prosecution
Prosecution is a criminal action filed by FDA against a company or individual charging violation of the law for past practices.
Foreign and Export Regulation
We obtain approvals as necessary in connection with the sales of our products in foreign countries. In some cases, FDA approval has been sufficient for foreign sales as well. Our standard practice has been to require either the distributor or the customer to obtain any such foreign approvals or licenses which may be required.
Legally marketed devices that comply with the requirements of the Food Drug & Cosmetic Act require a Certificate to Foreign Government issued by the FDA for export. Other devices that do not meet the requirements of the FD&C Act but comply with the laws of a foreign government require a Certificate of Exportability issued by the FDA. All products which we sell have FDA clearance and would fall into the first category.
Foreign governments have differing requirements concerning the import of medical devices into their respective jurisdictions. The European Union, also referred to as EU, has some essential requirements described in the EU’s Medical Device Directive, also referred to as MDD. In order to export to one of these countries, we must meet the essential requirements of the MDD and any additional requirements of the importing country. The essential requirements are similar to some of the requirements mandated by the FDA. In addition the MDD requires that we enlist a Notified Body to examine and assess our documentation, a Technical Construction File, and verify that the product has been manufactured in conformity with the documentation. The notified body must carry out or arrange for the inspections and tests necessary to verify that the product complies with the essential requirements of the MDD, including safety performance and Electromagnetic Compatibility, also referred to as EMC. Also required is a Quality System, ISO-9001, assessment by the Notified Body. We were approved for ISO 9001 certification for its
Quality Management System in April, 1999.
We received clearance to sell the Upright® MRI scanners in the EU in May, 2002.
Other countries require that their own testing laboratories perform an evaluation of our devices. This requires that we must bring the foreign agency’s personnel to the USA to perform the evaluation at our expense before exporting.
Some countries, including many in Latin America and Africa, have very few regulatory requirements, beyond FDA clearance.
To date, Fonar has been able to comply with all foreign regulatory requirements applicable to its export sales.
PHYSICIAN AND DIAGNOSTIC SERVICES MANAGEMENT BUSINESS
In 2011, Health Management Corporation of America (HMCA) transferred its business and assets to Imperial management Services, LLC (“Imperial”), a New York limited liability company, in connection with raising capital from investors. HMCA maintained a majority interest in Imperial. The assets continued to be used in our business of managing diagnostic imaging centers.
| 15 |
FONAR CORPORATION AND SUBSIDIARIES
Through an agreement dated March 6, 2013, HMCA acquired another business engaged in the management and, in the case of four sites located in Florida, the ownership, of diagnostic imaging facilities. The purchase was made through a new limited liability company, Health Diagnostics Management, LLC (“HDM”), which raised part of the capital necessary for the acquisition from investors. (HDM did not take over the operation of the four Florida sites until April, 2013.)
On July 1, 2015, the corporate organization was restructured under HDM.
On June 30, 2016, the Company purchased 100% of the equity in Turnkey Services of New York, LLC and 100% of the equity in TK2 Equipment Management, LLC. Turnkey Services of New York, LLC and TK2 Equipment Management, LLC, both by way of several operating leases, had provided the Company with ancillary diagnostic imaging equipment to our managed (and in the case of four Florida sites, owned) MRI facilities.
As a result of acquisitions, restructuring and re-acquisitions of interest held by investors as of July 1, 2016, HDM now is owned by Health Management Corporation of America (70%) and investors (30%).
HDM now operates under the assumed name “Health Management Company of America” (“HMCA”).
The combined business (HDM, Imperial and Health Management Corporation of America) will be referred to as “HMCA” for all periods before and after July 1, 2015, unless otherwise indicated.
HMCA provides comprehensive non-medical management services to diagnostic imaging facilities. These services include development, administration, leasing of office space, facilities, equipment, provision of supplies, staffing, training and supervision of non-medical personnel, credentialing, accounting, billing and collection, assistance with compliance matters and the development and implementation of practice growth and marketing strategies.
As of August 1, 2018, HMCA managed a total of 26 MRI centers. For the 2018 fiscal year, the revenues HMCA recognized from the MRI facilities had increased to $71.7 million, and for the 2017 fiscal year the revenues were increased to $66.8 million. Four of these facilities in Florida are owned by HMCA subsidiaries.
HMCA GROWTH STRATEGY
HMCA’s growth strategy focuses on upgrading and expanding the existing facilities it manages and expanding the number of facilities it manages for its clients, including new sites. In connection with improving the performance of the facilities, we have added high field MRI scanners, extremity scanners and x-ray machines to the Upright® MRI scanner at certain of the sites where such additional diagnostic imaging modalities are expected to produce the greatest return.
PHYSICIAN AND DIAGNOSTIC MANAGEMENT SERVICES
HMCA’s services to the facilities it manages encompass substantially all of their business operations. Each facility is controlled, however, not by HMCA, but by the physician owner, or in the case of the four Florida sites owned by HMCA subsidiaries, by the medical director, and all medical services are performed by physicians and other medical personnel under the physician-owner’s supervision. HMCA is the management company and performs services of a non-medical nature. These services include:
1. Offices and Equipment. HMCA identifies, negotiates leases for and/or provides office space and equipment to its clients. This includes technologically sophisticated medical equipment. HMCA also provides improvements to leaseholds, assistance in site selection and advice on improving, updating, expanding and adapting to new technology.
2. Personnel. HMCA staffs all the non-medical positions of its clients with its own employees, eliminating the client's need to interview, train and manage non-medical employees. HMCA processes the necessary tax, insurance and other documentation relating to employees.
| 16 |
FONAR CORPORATION AND SUBSIDIARIES
3. Administrative. HMCA assists in the scheduling of patient appointments, purchasing of office and medical supplies and equipment and handling of reporting, accounting, processing and filing systems. It prepares and files the physician portions of complex applications to enable its clients to participate in managed care programs and to qualify for insurance reimbursement. HMCA assists the clients to implement programs and procedures to ensure full and timely regulatory compliance and appropriate cost reimbursement under no-fault insurance and Workers' Compensation guidelines, as well as compliance with other applicable governmental requirements and regulations, including HIPAA and other privacy requirements.
4. Billing and Collections. HMCA is responsible for the billing and collection of revenues from third-party payors including those governed by No-Fault and Workers' Compensation statutes. HMCA is presently using a third party to perform its billing and collection services for its clients’ No-Fault and Workers’ Compensation scanning business.
5. Cost Saving Programs. Based on available volume discounts, HMCA seeks to assist in obtaining favorable pricing for office and medical supplies, medical imaging film, equipment, contrast agents, such as gadolinuim, and other inventory for its clients.
6. Diagnostic Imaging and Ancillary Services. HMCA can offer access to diagnostic imaging equipment through diagnostic imaging facilities it manages. The Company is expanding the ancillary services offered in its network to include x-rays, and other MRI equipment such as high-field (1.5 or 3.0 Tesla magnet strength) MRI scanners and extremity MRI scanners.
7. Marketing Strategies. HMCA is responsible for developing and proposing marketing plans for its clients.
8. Expansion Plans. HMCA assists the clients in developing expansion plans including the opening of new or replacement facilities where appropriate.
HMCA’s objective is to free physicians from as many non-medical duties as is practicable, allowing physicians to spend less time on business and administrative matters and more time practicing medicine.
The exceptions to this general model of operation are four of the facilities acquired by HMCA from Health Diagnostics, LLC in April, 2013 in Florida. These Florida facilities are owned by limited liability companies which, as our subsidiaries, conduct their operations directly and bill and collect their fees from the patients and third party payors.
The facilities enter into contracts with third party payors, including managed care companies. None of HMCA’s clients, however, participate in any capitated plans or other risk sharing arrangements. Capitated plans are those HMO programs where the provider is paid a flat monthly fee per patient.
The management fees payable by the facilities to HMCA are flat monthly fees. In fiscal 2017, the aggregate amount of management fees was $3,926,536 per month. In fiscal 2018, the aggregate amount of management fees was $4,061,255 per month.
Fees under the management agreements are subject to adjustment by mutual agreement on an annual basis.
Dr. Damadian owns three HMCA-managed MRI facilities in Florida. The fees for these three sites in Florida owned by Dr. Damadian are flat monthly fees which are subject to adjustment by mutual agreement on an annual basis. In fiscal 2018, the aggregate monthly amount of management fees payable to HMCA by these sites was $748,907.
The Florida facilities owned by HMCA subsidiaries directly bill their patients or the patients’ insurance carriers. Patient fees net of provision for bad debt were $21,268,885 in fiscal 2018.
| 17 |
FONAR CORPORATION AND SUBSIDIARIES
HMCA contracts with an outside billing company (located in Melville, New York) to perform billing and collection for their clients’ No-Fault and Workers’ Compensation business. The fixed monthly fees were $85,000 for HMCA in fiscal 2017 and fiscal 2018.
HMCA MARKETING
HMCA's marketing strategy is to expand the business and improve the facilities which it manages. HMCA is seeking to increase the number of locations of those facilities where market conditions are promising and to promote growth of our clients' and Florida subsidiaries’ patient volume and revenue.
DIAGNOSTIC IMAGING FACILITIES
Diagnostic imaging facilities managed or owned by HMCA provide diagnostic imaging services to patients referred by physicians. The facilities are operated in a manner which eliminates the admission and other administrative inconveniences of in-hospital diagnostic imaging services. Imaging services are performed in an outpatient setting by trained medical technologists under the direction of physicians. Following diagnostic procedures, the images are reviewed by the interpreting physicians who prepare reports of these tests and their findings. Reports for the New York facilities are transcribed by HMCA personnel and reports for the Florida facilities are outsourced to professional transcription services.
HMCA develops marketing programs and educational programs in an effort to establish and maintain referring physician relationships for our clients and Florida subsidiaries and to maximize reimbursement yields. HMCA also directs its marketing and educational efforts to managed care providers.
Managed care providers are an important factor in the diagnostic imaging industry. To further its position, HMCA is seeking to expand the imaging modalities offered at its managed and owned diagnostic imaging facilities. Three facilities in New York and four facilities in Florida have two or more MRI scanners. One facility in New York and two in Florida also perform x-rays. An additional MRI scanner is also being added to the Tallahassee, Florida site and should be completed by December 2018.
REIMBURSEMENT
Facilities managed or owned by HMCA receive reimbursements for their services through Medicare, Medicaid, managed care, private commercial insurance, third party administrators, Workers’ Compensation, No-Fault and other insurance.
Medicare
The Medicare program provides reimbursement for hospitalization, physician, diagnostic and certain other services to eligible persons 65 years of age and over and certain other individuals. Providers are paid by the federal government in accordance with regulations promulgated by the Department of Health and Human Services, HSS, and generally accept the payment with nominal deductible and co-insurance amounts required to be paid by the service recipient, as payment in full. Hospital inpatient services are reimbursed under a prospective payment system. Hospitals receive a specific prospective payment for inpatient treatment services based upon the diagnosis of the patient.
Under Medicare’s prospective payment system for hospital outpatient services, or OPPS, a hospital is paid for outpatient services on a rate per service basis that varies according to the ambulatory payment classification group, or APC, to which the service is assigned rather than on a hospital’s costs. Each year the Centers for Medicare and Medicaid Services, or CMS, publishes new APC rates that are determined in accordance with the promulgated methodology.
| 18 |
FONAR CORPORATION AND SUBSIDIARIES
Services provided in non-hospital based freestanding facilities are paid under the Medicare Physician Fee Schedule, or MPFS. All of HMCA’s clients are presently in this category. The MPFS is updated on an annual basis and sometimes modified more frequently.
Healthcare Reform Legislation
Healthcare reform legislation enacted in the first quarter of 2010 by the Patient Protection and Affordable Care Act or PPACA, specifically requires the U.S. Department of Health and Human Services, in computing physician practice expense relative value units, to increase the equipment utilization factor for advanced diagnostic imaging services (such as MRI, CT and PET) from a presumed utilization rate of 50% to 65% for 2010 through 2012, 70% in 2013, and 75% thereafter. Excluded from the adjustment are low-technology imaging modalities such as ultrasound, X-ray and fluoroscopy. The Health Care and Education Reconciliation Act of 2010 (H.R. 4872) or Reconciliation Act, which was approved by the President on March 30, 2010, amends the provision for higher presumed utilization of advanced diagnostic imaging services to a presumed rate of 75%. These changes may result in decreased revenue for the services performed by our clients for Medicare beneficiaries. Other changes in reimbursement for services rendered by Medicare Advantage plans may also reduce the revenues for services rendered to Medicare Advantage enrollees.
We have experienced reimbursement reductions for radiology services provided to Medicare beneficiaries, including reductions pursuant to the Deficit Reduction Act, or DRA.
The DRA, which became effective in 2007, set reimbursement for the technical component for imaging services (excluding diagnostic and screening mammography) in non-hospital based freestanding facilities at the lesser of OPPS or the MPFS.
In addition to the foregoing changes to the usage assumptions, CMS’ 2010 regulatory changes to the MPFS also included a downward adjustment to services primarily involving the technical component rather than the physician work component, by adjusting downward malpractice payments for these services. These adjustments have been phased in over a four year period. For our fiscal year ended June 30, 2018, Medicare revenues represented approximately 4.4% of the revenues for HMCA’s clients and subsidiaries as compared to 4.8% for the fiscal year ended June 30, 2017. In January, 2014 additional reductions in Medicare reimbursement were adopted, and New York State is expected to propose reducing Workers’ Compensation reimbursements.
Because of the many variables involved, we are unable to predict how the legislative mandates contained in PPACA will be implemented, in their complete and final form, whether any additional changes to PPACA or regulations (including interpretations), will occur in the future, or what effect any other future legislation or regulation would have on our business. Many commercial insurance companies, however, tie their reimbursement rates to the government reimbursement levels.
Medicaid
The Medicaid program is a jointly-funded federal and state program providing coverage for low-income persons. In addition to federally-mandated basic services, the services offered and reimbursement methods vary from state to state. In many states, Medicaid reimbursement is patterned after the Medicare program; however, an increasing number of states have established or are establishing payment methodologies intended to provide healthcare services to Medicaid patients through managed care arrangements. In fiscal 2018, approximately 0.15% of the revenues of HMCA’s clients were attributable to Medicaid, as compared to 0.19% in fiscal 2017. Four of the Florida facilities (those owned by HMCA subsidiaries) do not participate in Medicaid.
| 19 |
FONAR CORPORATION AND SUBSIDIARIES
Managed Care and Private Insurance.
Health Maintenance Organizations, or HMO’s, Preferred Provider Organizations, or PPOs, and other managed care organizations attempt to control the cost of healthcare services by a variety of measures, including imposing lower payment rates, preauthorization requirements, limiting services and mandating less costly treatment alternatives. Managed care contracting is competitive and reimbursement schedules in many cases can be at or below Medicare reimbursement levels. Some managed care organizations have reduced or otherwise limited, and other managed care organizations may reduce or otherwise limit, reimbursement in response to reductions in government reimbursement. These reductions could have an adverse impact on our financial condition and results of operations. These reductions have been, and any future reductions may be, similar to the reimbursement reductions proposed by CMS, Congress and the current federal government administration.
HMCA COMPETITION
The physician and diagnostic management services field is highly competitive. A number of large hospitals have acquired medical practices and this trend may continue. HMCA expects that more competition will develop. Many competitors have greater financial and other resources than HMCA.
With respect to the diagnostic imaging facilities managed by HMCA, the outpatient diagnostic imaging industry is highly competitive. Competition focuses primarily on attracting physician referrals at the local market level and increasing referrals through relationships with managed care organizations, as well as emphasizing to potential referral sources the advantages of Upright® MRI scanning. HMCA believes that principal competitors for the diagnostic imaging centers are hospitals and independent or management company-owned imaging centers. Competitive factors include quality and timeliness of test results, ability to develop and maintain relationships with managed care organizations and referring physicians, type and quality of equipment, facility location, convenience of scheduling and availability of patient appointment times. HMCA believes that it will be able to effectively meet the competition in the outpatient diagnostic imaging industry with the Fonar Upright® MRI scanners and strategically placed high field MRI scanners at its facilities.
GOVERNMENT REGULATION APPLICABLE TO HMCA
FEDERAL REGULATION
The healthcare industry is highly regulated and changes in laws and regulations can be significant. Changes in the law or new interpretation of existing laws can have a material effect on our permissible activities, the relative costs associated with doing business and the amount of reimbursement by government and other third-party payors.
Federal False Claims Act
The federal False Claims Act and, in particular, the False Claims Act’s “qui tam” or “whistleblower” provisions allow a private individual to bring actions in the name of the government alleging that a defendant has made false claims for payment from federal funds. After the individual has initiated the lawsuit the government must decide whether to intervene in the lawsuit and to become the primary prosecutor. If the government declines to join the lawsuit, the individual may choose to pursue the case alone, although the government must be kept apprised of the progress of the lawsuit, and may intervene later. Whether or not the federal government intervenes in the case, it will receive the majority of any recovery.
When an entity is determined to have violated the federal False Claims Act, it must pay three times the actual damages sustained by the government, plus mandatory civil penalties for each separate false claim and the government’s attorneys’ fees. Liability arises when an entity knowingly submits, or causes someone else to submit, a false claim for reimbursement to the federal government. The False Claims Act defines the term “knowingly” broadly, though simple negligence will not give rise to liability under the False Claims Act. Examples of the other actions which may lead to liability under the False Claims Act:
| 20 |
FONAR CORPORATION AND SUBSIDIARIES
Failure to comply with the many technical billing requirements applicable to our Medicare and Medicaid business.
Failure to comply with the prohibition against billing for services ordered or supervised by a physician who is excluded from any federal healthcare program, or the prohibition against employing or contracting with any person or entity excluded from any federal healthcare program.
Failure to comply with the Medicare physician supervision requirements for the services we provide, or the Medicare documentation requirements concerning physician supervision.
The Fraud Enforcement and Recovery Act of 2009 expanded the scope of the False Claims Act by, among other things, broadening protections for whistleblowers and creating liability for knowingly retaining a government overpayment, acting in deliberate ignorance of a government overpayment or acting in reckless disregard of a government overpayment. The recently enacted healthcare reform bills in the form of the Patient Protection and Affordable Care Act, as amended by the Health Care and Education Reconciliation Act of 2010 (collectively, “PPACA”) expanded on changes made by the 2009 Fraud Enforcement and Recovery Act with regard to such “reverse false claims.” Under PPACA, the knowing failure to report and return an overpayment within 60 days of identifying the overpayment or by the date a corresponding cost report is due, whichever is later, constitutes a violation of the False Claims Act. HMCA and its clients have never been sued under the False Claims Act and believe they are in compliance with the law.
Stark Law
Under the federal Self-Referral Law, also referred to as the "Stark Law", which is applicable to Medicare and Medicaid patients, and the self-referral laws of various States, certain health practitioners, including physicians, chiropractors and podiatrists, are prohibited from referring their patients for the provision of designated health services, including diagnostic imaging and physical therapy services, to any entity with which they or their immediate family members have a financial relationship, unless the referral fits within one of the specific exceptions in the statutes or regulations. The federal government has taken the position that a violation of the federal Stark Law is also a violation of the Federal False Claims Act. Statutory exceptions under the Stark Law include, among others, direct physician services, in-office ancillary services rendered within a group practice, space and equipment rental and services rendered to enrollees of certain prepaid health plans. Some of these exceptions are also available under the State self-referral laws. HMCA believes that it and its clients are in compliance with these laws.
Anti-kickback Regulation
We are subject to federal and state laws which govern financial and other arrangements between healthcare providers. These include the federal anti-kickback statute which, among other things, prohibits the knowing and willful solicitation, offer, payment or receipt of any remuneration, direct or indirect, in cash or in kind, in return for or to induce the referral of patients for items or services covered by Medicare, Medicaid and certain other governmental health programs. Under PPACA, knowledge of the anti-kickback statute or the specific intent to violate the law is not required. Violation of the anti-kickback statute may result in civil or criminal penalties and exclusion from the Medicare, Medicaid and other federal healthcare programs, and according to PPACA, now provides a basis for liability under the False Claims Act. In addition, it is possible that private parties may file “qui tam” actions based on claims resulting from relationships that violate the anti-kickback statute, seeking significant financial rewards. Many states have enacted similar statutes, which are not limited to items and services paid for under Medicare or a federally funded healthcare program. Neither HMCA nor its clients engage in this practice.
In fiscal 2018, approximately 4.4% of the revenues of HMCA’s clients were attributable to Medicare and 0.15% were attributable to Medicaid. In fiscal 2017, approximately 5% of the revenues of HMCA’s clients were attributable to Medicare and 0.19% were attributable to Medicaid.
| 21 |
FONAR CORPORATION AND SUBSIDIARIES
Deficit Reduction Act (DRA)
On February 8, 2006, the President signed into law the DRA. Effective January 1, 2007, the DRA provides that Medicare reimbursement for the technical component for imaging services (excluding diagnostic and screening mammography) performed in freestanding facilities will be capped. Payment is the lesser of the Medicare Physician Fee Schedule or the Hospital Outpatient Prospective Payment System (OPPS) rates. Implementation of these reimbursement reductions contained in the DRA has had an adverse effect on our business. We have been able to counter this effect by increasing scan volumes at our owned and managed sites, through our vigorous marketing efforts installing additional equipment, and reducing our operating expenses.
The DRA also codified the reduction in reimbursement for multiple images on contiguous body parts previously announced by CMS, the agency responsible for administering the Medicare program. In November 2005, CMS announced that it would pay 100% of the technical component of the higher priced imaging procedure and 50% of the technical component of each additional imaging procedure for imaging procedures involving contiguous body parts within a family of codes when performed in the same session. CMS had indicated that it would phase in this 50% rate reduction over two years, so that the reduction was 25% for each additional imaging procedure in 2006 and another 25% reduction in 2007. However, for services furnished on or after July 1, 2010, the PPACA requires the full 50% reduction to be implemented.
Health Insurance Portability and Accountability Act
Congress enacted the Health Insurance Portability and Accountability Act of 1996, or HIPAA, in part, to combat healthcare fraud and to protect the privacy and security of patients’ individually identifiable healthcare information. HIPAA, among other things, amends existing crimes and criminal penalties for Medicare fraud and enacts new federal healthcare fraud crimes, including actions affecting non-government healthcare benefit program by means of false or fraudulent representations in connection with the delivery of healthcare services is subject to a fine or imprisonment, or potentially both. In addition, HIPAA authorizes the imposition of civil money penalties against entities that employ or enter into contracts with excluded Medicare or Medicaid program participants if such entities provide services to federal health program beneficiaries. A finding of liability under HIPAA could have a material adverse effect on our business, financial condition and results of operations.
Further, HIPAA requires healthcare providers and their business associates to maintain the privacy and security of individually identifiable protected health information (“PHI”). HIPAA imposes federal standards for electronic transactions, for the security of electronic health information and for protecting the privacy of PHI. The Health Information Technology for Economic and Clinical Health Act of 2009 (“HITECH”), signed into law on February 17, 2009, dramatically expanded, among other things, (1) the scope of HIPAA to now apply directly to “business associates,” or independent contractors who receive or obtain PHI in connection with providing a service to a covered entity, (2) substantive security and privacy obligations, including new federal security breach notification requirements to affected individuals, DHHS and prominent media outlets, of certain breaches of unsecured PHI, (3) restrictions on marketing communications and a prohibition on covered entities or business associates from receiving remuneration in exchange for PHI, and (4) the civil and criminal penalties that may be imposed for HIPAA violations, increasing the annual cap in penalties from $25,000 to $1.5 million per occurrence. In 2013 additional legal requirements were adopted to provide further protection for PHI.
| 22 |
FONAR CORPORATION AND SUBSIDIARIES
In addition, many states have enacted comparable privacy and security statues or regulations that, in some cases, are most stringent than HIPAA requirements. In those cases it may be necessary to modify our operations and procedures to comply with the more stringent state laws, which may entail significant and costly changes for us. We believe that we are in compliance with such state laws and regulations. However, if we fail to comply with applicable state laws and regulations, we could be subject to additional sanctions.
We believe that we are in compliance with the current HIPAA requirements, as amended by HITECH, together with other legislation and regulations, and comparable state laws, but we anticipate that we may encounter certain costs associated with future compliance. Moreover, we cannot guarantee that enforcement agencies or courts will not make interpretations of the HIPAA standards that are inconsistent with ours, or the interpretations of our contracted radiology practices or their affiliated physicians. A finding of liability under the HIPAA standards may result in significant criminal and civil penalties. Noncompliance also may result in exclusion from participation in government programs, including Medicare and Medicaid. These actions could have a material adverse effect on our business, financial condition, and results of operations.
Civil Money Penalty Law and Other Federal Statutes
The Civil Money Penalty, or CMP, law covers a variety of practices. It provides a means of administrative enforcement of the anti-kickback statute, and prohibits false claims, claims for medically unnecessary services, violations of Medicare participating provider or assignment agreements and other practices. The statute gives the Office of Inspector General of the HHS the power to seek substantial civil fines, exclusion and other sanctions against providers or others who violate the CMP prohibitions.
In addition, in 1996, Congress created a new federal crime: healthcare fraud and false statements relating to healthcare matters. The healthcare fraud statute prohibits knowingly and willfully executing a scheme to defraud any healthcare benefit program, including private payors. A violation of this statute is a felony and may result in fines, imprisonment or exclusion from government sponsored programs such as the Medicare and Medicaid programs.
Certificates of Need
Some states require hospitals and certain other healthcare facilities and providers to obtain a certificate of need, or CON, or similar regulatory approval prior to establishing certain healthcare operations or services, incurring certain capital projects and/or the acquisition of major medical equipment including MRI and PET/CT systems. We are not operating in any such states.
Patient Protection and Affordable Care Act
On March 23, 2010, President Obama signed into law healthcare reform legislation in the form of PPACA. The implementation of this law will likely have a profound impact on the healthcare industry. Most of the provisions of PPACA are being phased in over time and can be conceptualized as a broad framework not only to provide health insurance coverage to millions of Americans, but to fundamentally change the delivery of care by bringing together elements of health information technology, evidence-based medicine, chronic disease management, medical “homes,” care collaboration and shared financial risk in a way that will accelerate industry adoption and change. There are also many provisions addressing cost containment, reductions of Medicare and other payments and heightened compliance requirements and additional penalties, which will create further challenges for providers.
| 23 |
FONAR CORPORATION AND SUBSIDIARIES
State Regulation
In addition to the federal self-referral law and federal Anti-kickback statute, many States, including those in which HMCA and its clients operate, have their own versions of self-referral and anti-kickback laws. These laws are not limited in their applicability, as are the federal laws, to specific programs. HMCA believes that it and its clients are in compliance with these laws.
Various States prohibit business corporations from practicing medicine. Various States, including New York, also prohibit the sharing of professional fees or fee splitting. Consequently, in New York HMCA leases space and equipment to clients and provides clients with a range of non-medical administrative and managerial services for agreed upon fees. Under Florida law a business entity can bill patients and third party payors directly if that entity is properly licensed through AHCA. Four of the seven facilities in Florida are licensed healthcare clinics through AHCA.
HMCA’s clients and subsidiaries generate revenue from patients covered by no-fault insurance and workers' compensation programs. For the fiscal year ended June 30, 2018 approximately 56.8% of our clients’ receipts were from patients covered by no-fault insurance and approximately 8.3% of our client’s receipts were from patients covered by workers’ compensation programs. For the fiscal year ended June 30, 2017, approximately 54.5% of HMCA’s clients’ receipts were from patients covered by no-fault insurance and approximately 8.0% of HMCA’s clients’ receipts were from patients covered by workers’ compensation programs. The foregoing numbers do not include payments from third party administrators. In the event that changes in these laws alter the fee structures or methods of providing service, or impose additional or different requirements, HMCA could be required to modify its business practices and services in ways that could be more costly to HMCA or in ways that decrease the revenues which HMCA receives from its clients.
Compliance Program
We maintain a program to monitor compliance with federal and state laws and regulations applicable to the healthcare entities. We have a compliance officer who is charged with implementing and supervising our compliance program, which includes the adoption of (i) Standards of Conduct for our employees and affiliates and (ii) a process that specifies how employees, affiliates and others may report regulatory or ethical concerns to our compliance officer. We believe that our compliance program meets the relevant standards provided by the Office of Inspector General of the Department of Health and Human Services.
An important part of our compliance program consists of conducting periodic audits of various aspects of our operations and that of the contracted radiology practices. We also conduct mandatory educational programs designed to familiarize our employees with the regulatory requirements and specific elements of our compliance program.
HMCA believes that it and its clients are in compliance with applicable Federal, State and local laws. HMCA does not believe that such laws will have any adverse material effect on its business.
EMPLOYEES
Fonar and HMCA had approximately 525 employees as of September 5, 2018. This total number included 12 in production, 27 in customer support, 10 in research and development, 9 in information technology, 63 in marketing and sales, 37 Florida technologists, 59 in billing and collections, 1 in field services and 307 in various administrative positions. Approximately 301 employees were employed at the MRI facilities managed or owned by HMCA, primarily in administrative positions.
An investment in our securities is subject to various risks, the most significant of which are summarized below.
| 24 |
FONAR CORPORATION AND SUBSIDIARIES
1. Reduced Reimbursement Rates. Most of our revenues are derived from our scanning center business conducted by HMCA. We are experiencing lower reimbursement rates from Medicare, other government programs and private insurance companies. To date, we have been able to counter the impact of these reductions by increasing our volume of scans and reducing our operating expenses, thereby maintaining profitability in this business segment. There is, however, no assurance that we will be able to continue to do so.
2. Demand for MRI Scanners. The reduced reimbursement rates also affects our sales of MRI scanners negatively. With lower revenue projections, prospective customers would demand lower prices for scanners. Although the reduced reimbursements may not affect foreign demand, a lower number of sales in the aggregate could reduce economies of scale and consequently, profit margins.
3. Manufacturing Competition. Many if not most of our competing scanner manufacturers have significantly greater financial resources, production capacity, and other resources than we do. Such competitors would include General Electric, Siemens, Hitachi and Phillips. Although Fonar is the only company which can manufacture and sell the unique Stand-Up® (Upright®) MRI scanner, potential customers must be convinced that the purchase of a Fonar scanner is their best choice. We believe that with time, that objective will be reached, particularly with customers scanning patients having neck, back, knee and various orthopedic issues who would benefit from being scanned in weight-bearing positions.
4. Dependence on Referrals. HMCA derives substantially all of its revenue, directly or indirectly, from fees charged for the diagnostic imaging services performed at the facilities. We depend on referrals of patients from unaffiliated physicians and other third parties to the facilities we manage or own for the services we perform. If these physicians and other third parties were to reduce the number of patients they refer or discontinue referring patients, scan volumes could decrease, which would reduce our net revenue and operating margins.
5. Pressure to Control Healthcare Costs. One of the principal objectives of health maintenance organizations and preferred provider organizations is to control the cost of healthcare services. Healthcare providers participating in managed care plans may be required to refer diagnostic imaging tests to certain providers depending on the plan in which a covered patient is enrolled. In addition, managed care contracting has become very competitive. The expansion of health maintenance organizations, preferred provider organizations and other managed care organizations within New York or Florida could have a negative impact on the utilization and pricing of services performed at the facilities HMCA manages or owns to the extent these organizations exert control over patients’ access to diagnostic imaging services, selections of the provider of such services and reimbursement rates for those services.
6. Scanning Facility Competition. The market for diagnostic imaging services is highly competitive. The facilities we manage or own compete for patients on the basis of reputation, location and the quality of diagnostic imaging services. Groups of radiologists, established hospitals, clinics and other independent organizations that own and operate imaging equipment are the principal competitors.
7. Eligibility Changes to Insurance Programs. Due to potential decreased availability of healthcare through private employers, the number of patients who are uninsured or participate in governmental programs may increase. Healthcare reform legislation will increase the participation of individuals in the Medicaid program in states that elect to participate in the expanded Medicaid coverage. A shift in payor mix from managed care and other private payors to government payors or an increase in the number of uninsured patients may result in a reduction in the rates of reimbursement or an increase in uncollectible receivables or uncompensated care, with a corresponding decrease in net revenue. Policies now being offered under various insurance plans are expected to reduce demand for MRI scans as they become less affordable. Changes in the eligibility requirements for governmental programs such as the Medicaid program and state decisions on whether to participate in the expansion of such programs also could increase the number of patients who participate in such programs and the number of uninsured patients. Even for those patients who remain in private insurance plans, changes to those plans could increase patient financial responsibility, resulting in a greater risk of uncollectible receivables. These factors and events could have a material adverse effect on our business, financial condition, and results of operations.
| 25 |
FONAR CORPORATION AND SUBSIDIARIES
8, Proposed Changes to New York Workers’ Compensation Benefits. A proposal was published by the New York State Workers’ Compensation Board (“NYSWCB”) in 2014 to change the fee schedule for Workers’ Compensation payments. Initially, the fees proposed would be set at approximately 130% of the Medicare fees. This would reduce fees for the most commonly billed radiology procedures by approximately 60%. Further, since the Workers’ Compensation fees are coupled with the New York State No Fault Program, radiology providers would suffer similar reductions for No-Fault fees. We and the HMCA clients wrote to the NYSWCB to argue against this proposal, and other affected parties commented as well. Since then, no further action has been taken by the NYSWCB to advance the 2014 proposal. On the contrary, the NYSWCB recently established an overall statewide fee increase for all provider types for services performed on or after October 1, 2018. There can be no assurance, however, that the NYSWCB will not modify their present position, or if they elect to do so, the extent to which the NYSWCB would do so. A significant reduction in Workers’ Compensation and No-Fault fees could have a material adverse impact on our business while an increase would further improve financial results.
9. Possible changes in Florida Insurance Law. A bill has been introduced into the Florida legislature, whose goal is to eliminate the no-fault system and the requirement that motorists carry personal injury protection, commonly referred to as “PIP”. In March of 2018, however, a Florida senate subcommittee rejected a bill to repeal PIP. Future efforts to repeal PIP, however, may be successful. Currently, drivers and passengers get car damages and PIP, paid for up to $10,000, no matter who is at fault in an accident. Drivers have to pay an additional cost to insurance companies to pay for bodily injuries, which covers them if they are at fault. While PIP is required, coverage for bodily injury is not. The insurance industry is pushing to scrap PIP and instead mandate all motorists to carry coverage that includes a minimum of $25,000 bodily injury if they are at fault. Eliminating PIP would mean that the $10,000 drivers now get paid toward medical costs through their insurers might not be there for them to pay for injured drivers. Importantly, payments would be reduced by approximately 60% due to claims being paid at commercial rates or through legal settlements instead of at the presently prevailing PIP fee schedule. This would negatively impact our seven diagnostic imaging facilities (both those we own and those we manage) with more unpaid bills, lower reimbursement rates and elongated waiting times.
10. Federal and state privacy and information security laws. We must comply with numerous federal and state laws and regulations governing the collection, dissemination, access, use, security and privacy of PHI, including HIPAA and its implementing privacy and security regulations, as amended by the federal HITECH Act and collectively referred to as HIPAA. If we fail to comply with applicable privacy and security laws, regulations and standards, properly maintain the integrity of our data, protect our proprietary rights to our systems, or defend against cybersecurity attacks, our business, reputation, results of operations, financial position and cash flows could be materially and adversely affected. Information security risks have significantly increased in recent years in part because of the proliferation of new technologies, the use of the internet and telecommunications technologies to conduct our operations, and the increased sophistication and activities of organized crime, hackers, terrorists and other external parties, including foreign state agents. Our operations rely on the secure processing, transmission and storage of confidential, proprietary and other information in our computer systems and networks.
11. Changes in Domestic and Worldwide Economic Conditions. We are subject to risk arising from adverse changes in general domestic and global economic conditions, including recession or economic slowdown and disruption of credit markets. Turbulence and uncertainty in the United States and international markets and economies may adversely affect our liquidity, financial condition, revenues, profitability and business operations generally.
ITEM 1B. UNRESOLVED STAFF COMMENTS - None.
Fonar and HMCA currently lease approximately 78,000 square feet of office and plant space at its principal offices in Melville, New York. The term of the lease runs through November, 2026. Management believes that the premises will be adequate for its current needs. HMCA also maintains office space for the Facilities owned by its subsidiaries in Florida and for its clients at the clients’ sites in New York and Florida under leases having various terms. HMCA owns the building for the client’s premises in Tallahassee, Florida. The Company received approval from the Suffolk County IDA on February 29, 2016 of a 50% property tax abatement, valued at $440,000, over a 10 year period commencing January, 2017.
| 26 |
FONAR CORPORATION AND SUBSIDIARIES
Matt Malek Madison v. Fonar Corporation, United States District Court, Northern District of California, was commenced by plaintiff on August 27, 2007 to recover a down payment for a scanner in the amount of $300,000, with interest. The plaintiff sought costs of suit and attorney’s fees as well. Fonar answered the complaint and sued the plaintiff for breach of contract in the amount of $450,000. Although down payments are usually expressly non-refundable in Fonar’s quotations and agreements, in this case, the quotation contemplated the sale of four scanners, and provided that the deposit would be refundable with interest, if the customer were unable to find suitable locations in the San Francisco Bay area. The issue was whether the customer made a good faith effort to find locations; Fonar’s position was that the customer did not. The case went to trial before a judge; the parties submitted post-trial briefs, and judgment was awarded to the plaintiff. Fonar appealed the trial court’s decision, but on January 31, 2012, the U.S. Court of Appeals for the 9th Circuit affirmed the lower court’s decision awarding the plaintiff the $300,000 deposit with prejudgment interest from July 1, 2006. Fonar sought to have the Court of Appeals reconsider the decision en banc, (by all or a larger number of the judges on the Circuit Court of Appeals), but this was not granted. After no action being taken by the plaintiff for several years, on June 30, 2016 Fonar received a letter from plaintiff’s attorney seeking payment of the judgment. The plaintiff has agreed to accept the sum of $300,000 in full satisfaction of the judgment, which amount was paid in October, 2016.
Shapiro v. Fonar Corporation, New York Supreme Court, Suffolk County. Previously, Fonar and Dr. Shapiro had settled an action commenced in Nassau County under the same name. The amount remaining payable under the settlement agreement according to Fonar’s records is $258,400, but the payment and timing of the payment was dependent on obtaining an order for an Upright® MRI Scanner for Fonar and the making of installment payments thereunder by the customer. Briefly stated, the balance of $258,400 was not yet due. Dr. Shapiro claimed that Fonar was in breach of the settlement agreement. Following settlement negotiations, Fonar agreed to pay Dr. Shapiro the sum of $258,400 in installments with interest.
ITEM 4. MINE SAFETY DISCLOSURES. Not Applicable
PART II
ITEM 5. MARKET FOR REGISTRANT'S COMMON EQUITY AND RELATED STOCKHOLDER MATTERS
Our Common Stock is traded in the Nasdaq SmallCap market under the National Association of Securities Dealers Automated Quotation System, also referred to as "NASDAQ", under the symbol FONR. The following table sets forth the high and low trades reported in NASDAQ System for the periods shown.
| Fiscal Quarter | High | Low | |||||||||||||||
| January | — | March | 2016 | $ | 18.27 | $ | 12.76 | ||||||||||
| April | — | June | 2016 | $ | 21.95 | $ | 13.65 | ||||||||||
| July | — | September | 2016 | $ | 23.90 | $ | 19.10 | ||||||||||
| October | — | December | 2016 | $ | 21.01 | $ | 15.70 | ||||||||||
| January | — | March | 2017 | $ | 20.85 | $ | 17.30 | ||||||||||
| April | — | June | 2017 | $ | 29.40 | $ | 17.20 | ||||||||||
| July | — | September | 2017 | $ | 31.90 | $ | 25.31 | ||||||||||
| October | — | December | 2017 | $ | 33.75 | $ | 21.10 | ||||||||||
| January | — | March | 2018 | $ | 29.95 | $ | 22.15 | ||||||||||
| April | — | June | 2018 | $ | 30.10 | $ | 25.31 | ||||||||||
| July | — | September 11 | 2018 | $ | 28.80 | $ | 23.70 | ||||||||||
| 27 |
FONAR CORPORATION AND SUBSIDIARIES
The following graph compares the annual change in the Company’s cumulative total shareholder return on its Common Stock during a period commencing on June 30, 2013 and ending on June 30, 2018 (as measured by dividing (i) the sum of (A) the cumulative amount of dividends for the measurement period, assuming dividend reinvestment and (B) the difference between the Company’s share price at the end and the beginning of the measurement period; by (ii) the share price at the beginning of the measurement period) with the cumulative total return of each of: (a) the CRSP Composite Total Return Index for Nasdaq (“Nasdaq”); (b) the CRSP Total Return Index for Nasdaq Medical Equipment Manufacturers (“Nas-MED”); and (c) the CRSP Total Return Index for Nasdaq Healthcare companies (“Nas-Hea.”) during such period, assuming a $100 investment on June 30, 2013. The stock price performance on the graph below is not necessarily indicative of future price performance.
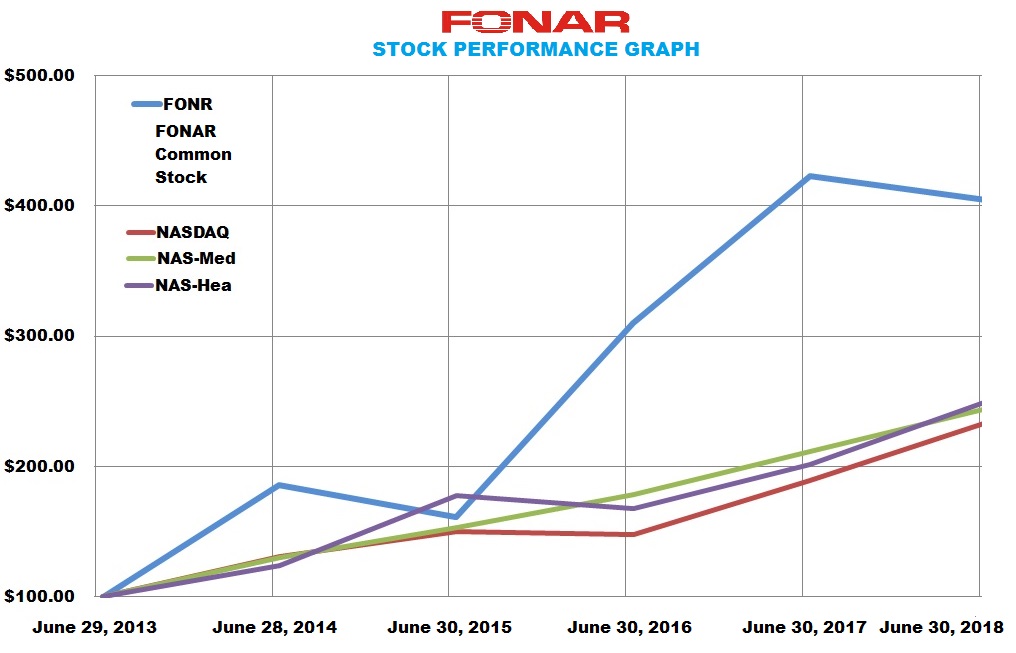
Relative Dollar Values
| FONAR Common Stock | 6/29/2013 | 6/28/2014 | 6/30/2015 | 6/30/2016 | 6/30/2017 | 6/30/2018 | ||||||||||||||||||
| FONR | $ | 100.00 | 185.98 | 161.28 | 310.37 | 423.03 | 404.74 | |||||||||||||||||
| NASDAQ | $ | 100.00 | 131.17 | 150.1 | 147.56 | 189.34 | 234.02 | |||||||||||||||||
| NAS-Med | $ | 100.00 | 130.18 | 153.47 | 178.47 | 211.8 | 244.63 | |||||||||||||||||
| NAS-Hea | $ | 100.00 | 124.03 | 177.66 | 168.09 | 201.55 | 249.93 | |||||||||||||||||
| 28 |
ITEM 6. SELECTED FINANCIAL DATA.
The following selected consolidated financial data has been extracted from our consolidated financial statements for the five years ended June 30, 2018. This consolidated selected financial data should be read in conjunction with our consolidated financial statements and the related notes included in Item 8 of this form.
As of and For the Periods Ended June 30,
| As of and For the Periods Ended June 30, | 2018 | 2017 | 2016 | 2015 | 2014 | |||||||||||||||
| STATEMENT OF OPERATIONS | ||||||||||||||||||||
| Revenues | $ | 81,515,994 | $ | 78,036,586 | $ | 73,368,210 | $ | 69,050,996 | $ | 68,505,477 | ||||||||||
| Cost of revenues | $ | 41,950,770 | $ | 38,052,425 | $ | 38,870,898 | $ | 38,404,281 | $ | 37,247,449 | ||||||||||
| Research and Development Expenses | $ | 1,755,747 | $ | 1,480,670 | $ | 1,631,846 | $ | 1,812,398 | $ | 1,760,821 | ||||||||||
| Net Income | $ | 25,452,185 | $ | 23,678,798 | $ | 18,795,517 | $ | 15,430,383 | $ | 13,396,769 | ||||||||||
| Basic Net Income per common share | $ | 3.16 | $ | 2.98 | $ | 2.43 | $ | 2.00 | $ | 1.62 | ||||||||||
| Diluted Net Income per common share | $ | 3.10 | $ | 2.92 | $ | 2.38 | $ | 1.95 | $ | 1.58 | ||||||||||
| Basic weighted average number of shares outstanding | 6,287,510 | 6,161,599 | 6,050,893 | 6,050,632 | 6,009,822 | |||||||||||||||
| Diluted Weighted average number of shares outstanding | 6,415,014 | 6,289,103 | 6,178,397 | 6,178,136 | 6,137,326 | |||||||||||||||
| BALANCE SHEET DATA | ||||||||||||||||||||
| Working capital | 52,497,840 | 39,177,703 | $ | 24,946,326 | $ | 24,828,161 | $ | 21,898,699 | ||||||||||||
| Total Assets | $ | 118,310,945 | $ | 98,762,566 | $ | 84,887,606 | $ | 76,492,077 | $ | 76,789,843 | ||||||||||
| Long-term debt and obligations under capital leases | $ | 306,035 | $ | 336,761 | $ | 2,059,236 | $ | 5,699,302 | $ | 8,481,830 | ||||||||||
| Stockholder’s equity | $ | 102,234,471 | $ | 82,909,953 | $ | 60,776,307 | $ | 50,783,513 | $ | 45,906,592 | ||||||||||
ITEM 7. MANAGEMENT'S DISCUSSION AND ANALYSIS OF FINANCIAL CONDITION AND RESULTS OF OPERATION.
INTRODUCTION.
Fonar was formed in 1978 to engage in the business of designing, manufacturing and selling MRI scanners. HMCA, a subsidiary of Fonar, provides management services to diagnostic imaging facilities.
Fonar's principal MRI product is its Stand-Up® MRI (also called Upright® MRI) scanner. The Stand-Up® MRI allows patients to be scanned for the first time under weight-bearing conditions. The Stand-Up® MRI is the only MRI capable of producing images in the weight-bearing state.
| 29 |
FONAR CORPORATION AND SUBSIDIARIES
At 0.6 Tesla field strength, the Upright® MRI is among the highest field open MRI scanners in the industry, offering non-claustrophobic MRI together with high-field image quality. Fonar’s open MRI scanners were the first high field strength open MRI scanners in the industry.
HMCA generates revenues from providing comprehensive management services, including development, administration, accounting, billing and collection services, together with office space, medical equipment, supplies and non-medical personnel to its clients. Revenues are in the form of fees which are earned under contracts with HMCA’s clients except for its three Florida subsidiaries which engage in the practice of medicine, and bill and collect fees from patients, insurers and other third party payors directly.
For the fiscal years ended June 30, 2018 and June 30, 2017 11.0% and 10.5%, respectively, of total revenues were derived from contracts with facilities owned by Dr. Raymond V. Damadian, the President and principal stockholder of Fonar. The agreements with these MRI facilities are for one-year terms which renew automatically on an annual basis, unless terminated. The fees for these sites, which are located in Florida, are flat monthly fees.
For services for which Medicare is billed directly, the sites are paid under the Medicare Physician Fee Schedule, which is updated on an annual basis. Under the Medicare statutory formula, payments under the Physician Fee Schedule would have decreased for the past several years if Congress failed to intervene.
Many private payors use the Medicare Physician Fee Schedule to determine their own reimbursement rates.
Critical Accounting Policies
Our discussion and analysis of financial condition and results of operations are based on our consolidated financial statements that were prepared in accordance with U.S. generally accepted accounting principles, or GAAP. Management makes estimates and assumptions when preparing financial statements. These estimates and assumptions affect various matters, including:
Our reported amounts of assets and liabilities in our consolidated balance sheets at the dates of the financial statements;
Our disclosure of contingent assets and liabilities at the dates of the financial statements; and
Our reported amounts of net revenue and expenses in our consolidated statements of operations during the reporting periods.
These estimates involve judgments with respect to numerous factors that are difficult to predict and are beyond management’s control. As a result, actual amounts could differ materially from these estimates.
The Securities and Exchange Commission defines critical accounting estimates as those that are both most important to the portrayal of a company’s financial condition and results of operations and require management’s most difficult, subjective or complex judgment, often as a result of the need to make estimates about the effect of matters that are inherently uncertain and may change in subsequent periods. In the notes to our consolidated financial statements, we discuss our significant accounting policies.
We believe the following critical accounting policies affect our more significant judgments and estimates used in the preparation of our consolidated financial statements. We recognize revenue and related costs of revenue from sales contracts for our MRI scanners and major upgrades, under the percentage-of-completion method. Under this method, we recognize revenue and related costs of revenue, as each sub-assembly is completed. Amounts received in advance of our commencement of production are recorded as customer advances.
| 30 |
FONAR CORPORATION AND SUBSIDIARIES
We continuously, qualitatively and quantitatively evaluate the realizability (including both positive and negative evidence) of the net deferred tax assets and assess the valuation allowance periodically. Our evaluation considers the financial condition of the Company and both the business conditions and regulatory environment of the industry. If future taxable income or other factors are not consistent with our expectations, an adjustment to our allowance for net deferred tax assets may be required. For net deferred tax assets we consider estimates of future taxable income, including tax planning strategies, in determining whether our net deferred tax assets are more likely than not to be realized. Our ability to project future taxable income may be significantly affected by our ability to determine the impact of regulatory changes which could adversely affect our future profits. As a result, the benefits of our net operating loss carry forwards could expire before they are fully utilized.
At June 30, 2018, the deferred tax asset was valued at $22,689,011. At June 30, 2017, the net deferred tax asset was valued at $17,861,777.
For the year ended June 30, 2018, the Company recorded income tax benefits associated with changes to the net deferred income tax assets of $4,827,234 and also the benefits associated with an AMT Carryforward Tax Credit of $1,200,000, available as a cash refund. These income tax benefits were precipitated in combination by both the Tax Cuts and Jobs Act enacted in December, 2017, which decreased the corporate income tax rate from 35% to 21%, effective January 1, 2018, and the continued strength of the business.
We depreciate our long-lived assets over their estimated economic useful lives with the exception of leasehold improvements where we use the shorter of the assets useful lives or the lease term of the facility for which these assets are associated.
The Company provides for medical receivables that could become uncollectible by establishing an allowance for doubtful accounts in order to adjust medical receivables to estimated net realizable value. In evaluating the collectability of medical receivables, the Company considers a number of factors, including the age of the account, historical collection experiences, payor type, current economic conditions and other relevant factors. There are various factors that impact collection trends, such as payor mix, changes in the economy, increase burden on copayments to be made by patients with insurance and business practices related to collection efforts. These factors continuously change and can have an impact on collection trends and the estimation process.
We amortize our intangible assets, including patents, and capitalized software development costs, over the shorter of the contractual/legal life or the estimated economic life. Our amortization life for patents and capitalized software development costs is 15 to 17 years and 5 years, respectively. Our amortization of the non-competition agreements entered into with certain individuals in connection with the HDM transaction are depreciated over seven years, and customer relationships are amortized over 20 years.
Goodwill is recorded as a result of business combinations. Management evaluates goodwill, at a minimum, on an annual basis and whenever events and changes in circumstances suggest that the carrying amount may not be recoverable. Impairment of goodwill is tested by comparing the reporting unit’s carrying amount, including goodwill, to the fair value of the reporting unit. The fair value of a reporting unit is estimated using a combination of the income or discounted cash flows approach and the market approach, which uses comparable market data. If the carrying amount of the reporting unit exceeds its fair value, goodwill is considered impaired and a second step is performed to measure the amount of impairment loss, if any. Based on our test for goodwill impairment, we noted no impairment related to goodwill. However, if estimates or the related assumptions change in the future, we may be required to record impairment charges to reduce the carrying amount of goodwill.
We periodically assess the recoverability of long-lived assets, including property and equipment, intangibles and management agreements, when there are indications of potential impairment, based on estimates of undiscounted future cash flows. The amount of impairment is calculated by comparing anticipated discounted future cash flows with the carrying value of the related asset. In performing this analysis, management considers such factors as current results, trends, and future prospects, in addition to other economic factors.
| 31 |
FONAR CORPORATION AND SUBSIDIARIES
In May 2014, the FASB issued ASU No. 2014-09, Revenue from Contracts with Customers, (Topic 606). ASU 2014-09 requires an entity to recognize as revenue the amount that reflects the consideration which it expects to be entitled in exchange for goods and services as it transfers control to its customers. It also requires more detailed disclosures to enable users of the financial statements to understand the nature, amount, timing and uncertainty of revenue and cash flows arising from contracts with customers. The Company earns revenue from the sale of scanners, maintenance contracts, product upgrades, patient services and management fees. Under the new guidance, the reporting for patient services revenue will be reported differently. All other streams of revenue will not be impacted by the new guidance. The primary change for healthcare providers under the new guidance relates to revenue generated from patient services, with patient responsibility for payment. Under the new guidance, the Company is required to report an implicit price concession (both initially and for the subsequent changes in estimates) as a reduction of revenues as opposed to bad debt expense as a component of operating expenses. The Company will record any changes in expectation of collection amounts due to patient specific events that suggests that the patient no longer has the ability and intent to pay the amount due through the bad debt expense, as that is more indicative of a change in the customer’s credit worthiness as opposed to change in the transaction price.
The new standard supersedes most current revenue guidance, including industry-specific guidance. The guidance became effective for the Company on July 1, 2018 and as part of adopting the standard, the Company identified revenue streams of like contracts to allow for ease of implementation. The Company used primarily a portfolio approach to apply the new model to classes of customers with similar characteristics. The impact of adopting the new standard on our total revenue; and income from operations is not material. While the adoption of ASU 2014-09 will impact the presentation of net operating revenues in our Consolidated Statements of Operations and will impact certain disclosures, it will not materially impact our financial position, results of operations or cash flows. There was no cumulative effect of a change in accounting principle recorded related to the adoption of ASU 2014-09 on July 1, 2018.
RESULTS OF OPERATIONS. FISCAL 2018 COMPARED TO FISCAL 2017
In fiscal 2018, we recognized net income of $25.5 million on revenues of $81.5 million, as compared to net income of $23.7 million on revenues of $78.0 million for fiscal 2017. This represents an increase in revenues of 4.5%. Patient fee revenue net of contractual allowances increased by 7.7%. Total costs and expenses increased by 4.9%. Our consolidated operating results improved by $600,000 to an operating income of $19.7 million for fiscal 2018 as compared to operating income of $19.1 million for fiscal 2017.
Discussion of Operating Results of Medical Equipment Segment
Fiscal 2018 Compared to Fiscal 2017
Revenues attributable to our medical equipment segment decreased by 12.3% to $9.8 million in fiscal 2018 from $11.2 million in fiscal 2017, with product sales revenues decreasing by 61.7% from $1.6 million in fiscal 2017 to $603,000 in fiscal 2018. Service revenue decreased from $9.6 million in fiscal 2017 to $9.2 million in fiscal 2018.
The Upright® MRI is unique in that it permits MRI scans to be performed on patients upright in the weight-bearing state and in multiple positions that correlate with symptoms.
We believe that one of our principal challenges in achieving greater market penetration is attributable to the better name recognition and larger sales forces of our larger competitors such as General Electric, Siemens, Hitachi, Philips and Toshiba and the ability of some of our competitors to offer attractive financing terms through affiliates, such as G.E. Capital.
In addition, lower reimbursement rates have reduced the demand for our MRI products, resulting in lower sales volumes. As a result of fewer sales, service revenues have decreased since as older scanners are taken out of service, there are fewer new scanners available to sign service contracts.
| 32 |
FONAR CORPORATION AND SUBSIDIARIES
The operating results for the medical equipment segment increased from an operating loss of $2.3 million in fiscal 2017 to an operating loss of $3.0 million in fiscal 2018. The losses are attributable most significantly to the fact that costs increased by a greater amount than revenues.
We recognized revenues of $43,000 from the sale of our Upright® MRI scanners in fiscal 2018, while in fiscal 2017, we recognized revenues of $714,000 from the sale of Upright® MRI scanners.
Research and development expenses, increased to $1.8 million in fiscal 2018 from $1.5 million in fiscal 2017. Our expenses for fiscal 2018 represented continued research and development of Fonar’s scanners, Fonar’s new hardware and software product, Sympulse® and new surface coils to be used with the Upright® MRI scanner.
Discussion of Operating Results of Physician and Diagnostic Services Management Segment.
Fiscal 2018 Compared to Fiscal 2017
Revenues attributable to the Company's physician and diagnostic services management segment, HMCA, increased by 7.3% to $71.7 million in fiscal 2018 from $66.8 million in fiscal 2017. The increase in revenues was due to $1.0 million of patient fees (net of contractual allowances and discounts less provision for bad debts) from patient and third party payors recognized by four of the facilities in Florida. One of these locations added additional medical equipment which allowed it to increase volume coupled with an increase in management and other fees of $5.0 million.
Cost of revenues as a percentage of the related revenues for our physician and diagnostic services management segment increased from $34.1 million or 51.0% of related revenues for the year ended June 30, 2017 to $37.9 million, or 52.0% of related revenues for the year ended June 30, 2018. The revenues increased more than the costs relating to these revenues.
Operating results of this segment increased from operating income of $21.4 million in fiscal 2017 to operating income of $22.7 million in fiscal 2018. We believe that our efforts to expand and improve the operation of our physician and diagnostic services management segment are directly responsible for the profitability of this segment and our company as a whole.
Discussion of Certain Consolidated Results of Operations
Fiscal 2018 Compared to Fiscal 2017
Interest and investment income increased in 2018 compared to 2017. We recognized interest income of $262,569 in 2018 as compared to $193,141 in fiscal 2017, representing a increase of 35.9%.
Interest expense of $160,074 was recognized in fiscal 2018, as compared to interest expense recovery of $28,299 in fiscal 2017. This was due to additional principal payments being made to retire our debt.
While revenue increased by 4.5%, selling, general and administrative expenses decreased by 6.6% to $18.1 million in fiscal 2018 from $19.4 million in fiscal 2017.
The compensatory element of stock issuances decreased from approximately $2,397,276 in fiscal 2017 to $0 in fiscal 2018, reflecting a decrease in Fonar’s use of its stock bonus plans.
| 33 |
FONAR CORPORATION AND SUBSIDIARIES
A recovery of bad debts of $614,680 in fiscal 2018, as compared to a provision for bad debts of $477,577 in fiscal 2017, reflected an increase in reserves for certain indebtedness and some bad debt recoveries in fiscal 2018 by our physician and diagnostic services management segment. In addition in fiscal 2018, the Company recorded a provision for bad debts for patient fee revenue of $17.9 million for the MRI facilities in Florida which bill patients and third party payors directly. The three Florida sites managed by HMCA jointly and severally guaranteed the payment of their management fees to HMCA, further securing HMCA’s management fee receivables.
Revenue from service and repair fees decreased from $9.6 million in fiscal 2017 to $9.2 million in fiscal 2018.
Continuing our tradition as the originator of MRI, we remain committed to maintaining our position as the leading innovator of the industry through investing in research and development. In fiscal 2018 we continued our investment in the development of our new MRI scanners, together with software and upgrades, with an investment of $1,755,747 in research and development, none of which was capitalized, as compared to $1,480,670, none of which was capitalized, in fiscal 2017. The research and development expenses were approximately 17.8% of revenues attributable to our medical equipment segment and 2.1% of total revenues in 2018, and 13.21% of medical equipment segment revenues and 1.9% of total revenues in fiscal 2017. This represented a 18.6% decrease in research and development expenditures in fiscal 2018 as compared to fiscal 2017.
For the physician and diagnostic services management segment, HMCA, revenues increased, from $66.8 million in fiscal 2017 to $71.7 million in fiscal 2018. This is primarily attributable to an increase in patient scans resulting from our marketing efforts.
For the fiscal year 2018 the Company recorded an income tax benefit, net of $4.9 million compared with $5.0 million for 2017. The income tax benefits is attributable to the expected tax benefits associated with the projected realization and utilization of our net operating losses in future periods. The Company has recorded a deferred tax asset of $22.7 million as of June 30, 2018, primarily relating to the tax benefits from the net operating loss carry forwards available to offset future taxable income. The utilization of these tax benefits is dependent on the Company generating future taxable income. The Company is projecting to generate taxable income in future periods, although they cannot accurately anticipate the full impact of the adoption or repeal of healthcare regulations, including changes in MRI scanning reimbursement rates, which could impact operations.
RESULTS OF OPERATIONS. FISCAL 2017 COMPARED TO FISCAL 2016
In fiscal 2017, we recognized net income of $23.7 million on revenues of $78.0 million, as compared to net income of $18.8 million on revenues of $73.4 million for fiscal 2016. Our consolidated operating results improved by $4.5 million to an operating income of $19.1 million for fiscal 2017 as compared to an operating income of $14.4 million for fiscal 2016.
Discussion of Operating Results of Medical Equipment Segment
Fiscal 2017 Compared to Fiscal 2016
Revenues attributable to our medical equipment segment increased by 4.0% to $11.2 million in fiscal 2017 from $10.8 million in fiscal 2016, with product sales revenues increasing by 23.1% from $1.3 million in fiscal 2016 to $1.6 million in fiscal 2017. Service revenue increased from $9.5 million in fiscal 2016 to $9.6 million in fiscal 2017.
Product sales to unrelated parties decreased by 23.1% in fiscal 2017 from $1.3 million in fiscal 2016 to $1.6 million in fiscal 2017. There were no product sales to related parties in fiscal 2017 or 2016.
The operating results for the medical equipment segment decreased from loss of $1.9 million in fiscal 2016 to an operating loss of $2.3 million in fiscal 2017. This decrease was attributable most significantly to the fact that costs increased and the revenues decreased.
| 34 |
FONAR CORPORATION AND SUBSIDIARIES
We recognized revenues of $714,000 from the sale of our Upright® MRI scanners in fiscal 2017, while in fiscal 2016, we recognized revenues of $834,000 from the sale of Upright® MRI scanners.
Research and development expenses, decreased to $1.5 million in fiscal 2017 from $1.6 million in fiscal 2016. Our research and development expenses represented continued research and development of our scanners, our new hardware and software product, Sympulse® and new surface coils to be used with the Upright® MRI scanner.
Discussion of Operating Results of Physician and Diagnostic Services Management Segment.
Fiscal 2017 Compared to Fiscal 2016
Revenues attributable to the Company's physician and diagnostic services management segment, HMCA, increased by 6.8% to $66.8 million in fiscal 2017 from $62.6 million in fiscal 2016. The increase in revenues was primarily due to including $1.8 million of patient fees (net of contractual allowances and discounts less provision for bad debts) from patient and third party payors recognized by four of the facilities in Florida.
Cost of revenues as a percentage of the related revenues for our physician and diagnostic services management segment decreased from $35.4 million or 56.6% of related revenues for the year ended June 30, 2016 to $34.1 million, or 51.0% of related revenues for the year ended June 30, 2017.
Operating results of this segment increased from operating income of $16.3 million in fiscal 2016 to operating income of $21.4 million in fiscal 2017. We believe that our efforts to expand and improve the operation of our physician and diagnostic services management segment are directly responsible for the profitability of this segment and our company as a whole.
Discussion of Certain Consolidated Results of Operations
Fiscal 2017 Compared to Fiscal 2016
Interest and investment income decreased in 2017 compared to 2016. We recognized interest income of $193,141 in 2017 as compared to $224,263 in fiscal 2016, representing a decrease of 13.9%.
Interest expense recovery of $28,299 was recognized in fiscal 2017, as compared to $262,193 in fiscal 2016.
While revenue increased by 6.4%, selling, general and administrative expenses increased by 4.8% to $19.4 million in fiscal 2017 from $18.5 million in fiscal 2016.
The compensatory element of stock issuances decreased from $2,006 in fiscal 2016 to $2,397,276 in fiscal 2017, reflecting a decrease in Fonar’s use of its stock bonus plans to pay employees and others.
The higher provision for bad debts of $477,577 in fiscal 2017 as compared to $202,000 in fiscal 2016, reflected an increase in reserves for certain indebtedness in fiscal 2017 by our physician and diagnostic services management segment. In addition in fiscal 2017, the Company recorded a provision for bad debts for patient fee revenue of $16.2 million for the four MRI facilities in Florida which bill patients and third party payors directly. The three Florida sites managed by HMCA jointly and severally guaranteed the payment of their management fees to HMCA, further securing HMCA’s management fee receivables.
For the fiscal year 2017 the Company recorded an income tax benefit of $5.0 million compared with $4.3 million for 2016. The income tax benefit is attributable to the income tax benefits associated with the increase in the deferred tax asset for the years then ended. The Company recorded a deferred tax asset of $17.9 million as of June 30, 2017 relating to the tax benefits resulting from the net operating loss carry forwards available to be offset in the future.
| 35 |
FONAR CORPORATION AND SUBSIDIARIES
Revenue from service and repair fees increased from $9.5 million in fiscal 2016 to $9.6 million in fiscal 2017.
In fiscal 2017 we continued our investment in the development of our new MRI scanners, together with software and upgrades, with an investment of $1,480,670 in research and development, none of which was capitalized, as compared to $1,631,846, none of which was capitalized, in fiscal 2016. The research and development expenditures were approximately 13.2% of revenues attributable to our medical equipment segment and 1.9% of total revenues in 2017, and 15.1% of medical equipment segment revenues and 2.2% of total revenues in fiscal 2016. This represented a 9.3% decrease in research and development expenditures in fiscal 2017 as compared to fiscal 2016.
We have been taking steps to improve HMCA revenues by our marketing efforts, which focus on the unique capability of our Upright® MRI scanners to scan patients in different positions. We have also been increasing the number of health insurance plans in which our clients participate.
Our management fees are dependent on collection by our clients of fees from reimbursements from Medicare, Medicaid, private insurance, no fault and workers’ compensation carriers, self–pay and other third-party payors. The health care industry is experiencing the effects of the federal and state governments’ trend toward cost containment, as governments and other third-party payors seek to impose lower reimbursement and utilization rates and negotiate reduced payment schedules with providers. The cost-containment measures, consolidated with the increasing influence of managed-care payors and competition for patients, have resulted in reduced rates of reimbursement for services provided by our clients from time to time. Our future revenues and results of operations may be adversely impacted by future reductions in reimbursement rates.
Certain third-party payors have proposed and implemented changes in the methods and rates of reimbursement that have had the effect of substantially decreasing reimbursement for diagnostic imaging services that HMCA’s clients provide. To the extent reimbursement from third-party payors is reduced, it will likely have an adverse impact on the rates they pay us, as they would need to reduce the management fees they pay HMCA to offset such decreased reimbursement rates. Furthermore, many commercial health care insurance arrangements are changing, so that individuals bear greater financial responsibility through high deductible plans, co-insurance and higher co-payments, which may result in patients delaying or foregoing medical procedures. More frequently, however, patients are scanned and we experience difficulty in collecting deductibles and co-payments. We expect that any further changes to the rates or methods of reimbursement for services, which reduce the reimbursement per scan of our clients may partially offset the increases in scan volume we are working to achieve for our clients, and indirectly will result in a decline in our revenues. We have offset reimbursement cuts by increasing capacity at existing sites and by acquiring new centers. While there can be no assurance we will be able to continue this in the future, we are continuously on the lookout for growth opportunities.
On March 23, 2010, President Obama signed into law healthcare reform legislation in the form of the Patient Protection and Affordable Care Act, or PPACA. Healthcare cost containment, reductions of Medicare and other payments, and increased regulation will present additional challenges for healthcare providers. We are unable to predict the full impact of PPACA, or the possible amendment or repeal and replacement of PPACA. It may, however, adversely affect the revenues or the profitability of either or both our medical equipment segment and physician and diagnostic services management segment.
In addition, the use of radiology benefit managers, or RBM’s has increased in recent years. It is common practice for health insurance carriers to contract with RBMs to manage utilization of diagnostic imaging procedures for their insureds. In many cases, this leads to lower utilization of imaging procedures based on a determination of medical necessity. The efficacy of RBMs is still a highly controversial topic. We cannot predict whether the healthcare legislation or the use of RBMs will negatively impact our business, but it is possible that our financial position and results of operations could be negatively affected.
| 36 |
FONAR CORPORATION AND SUBSIDIARIES
LIQUIDITY AND CAPITAL RESOURCES
Cash, and cash equivalents increased by 93.6% from $10.1 million at June 30, 2017 to $19.6 million at June 30, 2018.
Cash provided by operating activities for fiscal 2018 approximated $18.7 million. Cash provided by operating activities was attributable to the net income of $25.5 million, depreciation and amortization of $3.9 million, which was offset by the deferred income tax benefit of $4.9 million and the increase in accounts, medical and management fee receivables of $4.3 million.
Cash used in investing activities for fiscal 2018 approximated $2.9 million. The use of cash from investing activities was attributable to purchases of property and equipment of $2.8 million, costs of acquisitions of $58,000, and costs of patents of $109,000.
Cash used by financing activities for fiscal 2018 approximated $6.3 million. The principal uses of cash in financing activities included the repayment of loans and capital lease obligations of $172,000 million, and distributions to non-controlling interests of $6.1 million.
Total liabilities increased by 1.4% during fiscal 2018, from approximately $15.9 million at June 30, 2017 to approximately $16.1 million at June 30, 2018.
As at June 30, 2018, our obligations included approximately $3.6 million in various state sales taxes, inclusive of penalties and interest. The Company is in the process of negotiating settlements of these obligations.
At June 30, 2018, we had working capital of approximately $52.5 million as compared to working capital of $39.2 million at June 30, 2017, and stockholders’ equity of $102.2 million at June 30, 2018 as compared to stockholders’ equity of $82.9 million at June 30, 2017. For the year ended June 30, 2018, we realized a net income of $25.5 million.
Our principal sources of liquidity are derived from revenues.
Our business plan includes a program for manufacturing and selling our Upright® MRI scanners. In addition, we are enhancing our revenue by participating in the physician and diagnostic services management business through our subsidiary, HMCA and have upgraded the facilities which it manages, most significantly by the replacement of the original MRI scanners with new Upright® MRI scanners. Presently, 24 of the 26 MRI facilities managed by HMCA, are equipped with Upright® MRI scanners. We have also intensified our marketing activities through the hiring of additional marketers for HMCA’s clients.
Our business plan also calls for a continuing emphasis on providing our customers with enhanced equipment service and maintenance capabilities and delivering state-of-the-art, innovative and high quality equipment upgrades at competitive prices. Fees for on-going service and maintenance from our installed base of scanners were $9.6 million for the year ended June 30, 2017 and $9.3 million for the year ended June 30, 2018.
In order to promote profitability and to reduce demands on our cash and other liquid reserves, we maintain an aggressive program of cost cutting. Previously, these measures included consolidating HMCA’s office space with Fonar’s office space and reducing the size of our workforce, compensation and benefits. We continue to reduce and contain expenses across the board. The cost reductions are intended to enable us to withstand periods of low volumes of MRI scanner sales, by keeping expenditures at levels which can be supported by service revenues and HMCA revenues.
Current economic credit conditions have contributed to a slower than optimal business environment. Given liquidity and credit constraints in the markets, our business may suffer, should the credit markets not improve in the near future. The direct impact of these conditions is not fully known.
| 37 |
FONAR CORPORATION AND SUBSIDIARIES
Revenues from HMCA have been the principal reason for our profitability, and we have so far been able to maintain and increase such revenues by increasing the number of scans being performed by the sites we manage and those we own, notwithstanding reductions in reimbursement rates from third party payors. The likelihood and effect of any subsequent reductions is not fully known.
Capital expenditures for fiscal 2018 approximated $2.9 million. Capitalized patent costs were approximately $109,000 Purchases of property and equipment were approximately $2.8 million.
Fonar has not committed to making capital expenditures in the 2019 fiscal year, except for acquiring an additional scanner to place at the Tallahassee site and providing a new scanner to replace the scanner at the Miami site.
The Company believes that its business plan has been responsible for the past four consecutive fiscal years of profitability (fiscal 2018, fiscal 2017, fiscal 2016 and fiscal 2015) and that its capital resources will be adequate to support operations at current levels through June 30, 2019.
ITEM 7A. QUALITATIVE AND QUANTITATIVE DISCLOSURES ABOUT MARKET
RISK
The Company does not have any investments in marketable securities, foreign currencies, mutual funds, certificates of deposit or other fixed rate instruments. All of our funds are in cash accounts or money market accounts which are liquid.
All of our revenue, expense and capital purchasing activities are transacted in United States dollars.
See Note 10 to the consolidated Financial Statements for information on long-term debt.
| 38 |
FONAR CORPORATION AND SUBSIDIARIES
ITEM 8.
INDEX TO CONSOLIDATED FINANCIAL STATEMENTS
| Page No. | ||||
| REPORT OF INDEPENDENT REGISTERED PUBLIC ACCOUNTING FIRM | 40 | |||
| CONSOLIDATED BALANCE SHEETS | ||||
| At June 30, 2018 and 2017 | 41 | |||
| CONSOLIDATED STATEMENTS OF INCOME | ||||
| For the Years Ended June 30, 2018, 2017 and 2016 | 44 | |||
| CONSOLIDATED STATEMENTS OF STOCKHOLDERS' EQUITY | ||||
| For the Years Ended June 30, 2018, 2017 and 2016 | 46 | |||
| CONSOLIDATED STATEMENTS OF CASH FLOWS | ||||
| For the Years Ended June 30, 2018, 2017 and 2016 | 49 | |||
| NOTES TO CONSOLIDATED FINANCIAL STATEMENTS | 51 | |||
| 39 |
REPORT OF INDEPENDENT REGISTERED PUBLIC ACCOUNTING FIRM
To the Board of Directors and Stockholders of
FONAR Corporation and Subsidiaries
Opinion on the Financial Statements
We have audited the accompanying consolidated balance sheets of FONAR Corporation and Subsidiaries (the “Company”) as of June 30, 2018 and 2017, the related consolidated statements of income, stockholders’ equity and cash flows for each of the three years in the period ended June 30, 2018, and the related notes (collectively referred to as the “financial statements”). In our opinion, the financial statements present fairly, in all material respects, the financial position of the Company as of June 30, 2018 and 2017, and the consolidated results of its operations and its cash flows for each of the three years in the three year period ended June 30, 2018, in conformity with accounting principles generally accepted in the United States of America.
We also have audited, in accordance with the standards of the Public Company Accounting Oversight Board (United States) ("PCAOB"), the Company's internal control over financial reporting as of June 30, 2018, based on the criteria established in Internal Control - Integrated Framework issued by the Committee of Sponsoring Organizations of the Treadway Commission (COSO) in 2013 and our report dated September 20, 2018, expressed an unqualified opinion on the effectiveness of the Company’s internal control over financial reporting.
Basis for Opinion
These financial statements are the responsibility of the Company's management. Our responsibility is to express an opinion on the Company's financial statements based on our audits. We are a public accounting firm registered with the PCAOB and are required to be independent with respect to the Company in accordance with the U.S. federal securities laws and the applicable rules and regulations of the Securities and Exchange Commission and the PCAOB.
We conducted our audits in accordance with the standards of the PCAOB. Those standards require that we plan and perform the audits to obtain reasonable assurance about whether the financial statements are free of material misstatement, whether due to error or fraud. Our audits included performing procedures to assess the risks of material misstatement of the financial statements, whether due to error or fraud, and performing procedures that respond to those risks. Such procedures included examining, on a test basis, evidence regarding the amounts and disclosures in the financial statements. Our audits also included evaluating the accounting principles used and significant estimates made by management, as well as evaluating the overall presentation of the financial statements. We believe that our audits provide a reasonable basis for our opinion.
/s/ Marcum LLP
We have served as the Company’s auditor since 1990, such date takes into account the merger of Tabb, Conigliaro and McGann, P.C. (“Tabb”) into another firm in approximately 2001 and the former partners of Tabb joining Marcum LLP in 2002.
Marcum LLP
New York, New York
September 20, 2018
| 40 |
FONAR CORPORATION AND SUBSIDIARIES
CONSOLIDATED BALANCE SHEETS
ASSETS
| June 30, | ||||||||
| 2018 | 2017 | |||||||
| Current Assets: | ||||||||
| Cash and cash equivalents | $ | 19,633,742 | $ | 10,139,621 | ||||
| Accounts receivable – net of allowances for doubtful accounts of $190,244 at June 30, 2018 and 2017 | 3,813,576 | 4,321,760 | ||||||
| Medical receivables –net of allowances for doubtful accounts of $22,727,698 and $19,853,318 at June 30, 2018 and 2017, respectively | 13,350,772 | 11,744,704 | ||||||
| Management and other fees receivable – net of allowances for doubtful accounts of $10,983,022 and $12,859,750 at June 30, 2018 and 2017, respectively | 21,863,431 | 18,593,894 | ||||||
| Management and other fees receivable – related party medical practices – net of allowances for doubtful accounts of $1,711,385 and $582,001 at June 30, 2018 and 2017, respectively | 5,535,096 | 4,959,598 | ||||||
| Costs and estimated earnings in excess of billings on uncompleted contracts | 86,638 | 736,061 | ||||||
| Inventories | 1,431,380 | 1,624,262 | ||||||
| Prepaid expenses and other current assets | 1,349,907 | 1,293,806 | ||||||
| Total Current Assets | 67,064,542 | 53,413,706 | ||||||
| Income taxes receivable | 1,200,000 | — | ||||||
| Deferred income tax asset | 22,689,011 | 17,861,777 | ||||||
| Property and Equipment – Net | 16,492,278 | 16,462,504 | ||||||
| Goodwill | 3,985,397 | 3,927,123 | ||||||
| Other Intangible Assets – Net | 5,601,656 | 6,644,504 | ||||||
| Other Assets | 1,278,061 | 452,952 | ||||||
| Total Assets | $ | 118,310,945 | $ | 98,762,566 | ||||
See accompanying notes to consolidated financial statements.
| 41 |
FONAR CORPORATION AND SUBSIDIARIES
CONSOLIDATED BALANCE SHEETS
LIABILITIES
| June 30, | ||||||||
| 2018 | 2017 | |||||||
| Current Liabilities: | ||||||||
| Current portion of long-term debt and capital leases | $ | 38,332 | $ | 180,090 | ||||
| Accounts payable | 1,300,250 | 1,423,217 | ||||||
| Other current liabilities | 8,177,995 | 7,203,278 | ||||||
| Unearned revenue on service contracts | 4,191,930 | 4,641,534 | ||||||
| Customer deposits | 858,195 | 787,884 | ||||||
| Total Current Liabilities | 14,566,702 | 14,236,003 | ||||||
| Long-Term Liabilities: | ||||||||
| Deferred income tax liability | 239,011 | 331,527 | ||||||
| Due to related party medical practices | 227,543 | 227,543 | ||||||
| Long-term debt and capital leases, less current portion | 306,035 | 336,761 | ||||||
| Other liabilities | 737,183 | 720,779 | ||||||
| Total Long-Term Liabilities | 1,509,772 | 1,616,610 | ||||||
| Total Liabilities | 16,076,474 | 15,852,613 | ||||||
Commitments, Contingencies and Other Matters
See accompanying notes to consolidated financial statements.
| 42 |
FONAR CORPORATION AND SUBSIDIARIES
CONSOLIDATED BALANCE SHEETS
STOCKHOLDERS' EQUITY
| June 30, | ||||||||
| 2018 | 2017 | |||||||
| Stockholders' Equity: | ||||||||
| Class A non-voting preferred stock $.0001 par value; 453,000 shares authorized at June 30, 2018 and 2017, 313,438 issued and outstanding at June 30, 2018 and 2017 | $ | 31 | $ | 31 | ||||
| Preferred stock $.001 par value; 567,000 shares authorized at June 30, 2018 and 2017, issued and outstanding – none | — | — | ||||||
| Common stock $.0001 par value; 8,500,000 shares authorized at June 30, 2018 and 2017, 6,299,154 issued at June 30, 2018 and 2017; 6,287,511 outstanding at June 30, 2018 and 2017 | 630 | 630 | ||||||
| Class B convertible common stock (10 votes per share) $.0001 par value; 227,000 shares authorized at June 30, 2018 and 2017, 146 issued and outstanding at June 30, 2018 and 2017 | — | — | ||||||
| Class C common stock (25 votes per share) $.0001 par value; 567,000 shares authorized at June 30, 2018 and 2017, 382,513 issued and outstanding at June 30, 2018 and 2017 | 38 | 38 | ||||||
| Paid-in capital in excess of par value | 179,131,780 | 179,131,780 | ||||||
| Accumulated deficit | (79,772,587 | ) | (101,003,389 | ) | ||||
| Notes receivable from employee stockholders | (9,213 | ) | (16,546 | ) | ||||
| Treasury stock, at cost – 11,643 shares of common stock at June 30, 2018 and 2017 | (675,390 | ) | (675,390 | ) | ||||
| Total Fonar Corporation’s Stockholders’ Equity | 98,675,289 | 77,437,154 | ||||||
| Noncontrolling interests | 3,559,182 | 5,472,799 | ||||||
| Total Stockholders' Equity | 102,234,471 | 82,909,953 | ||||||
| Total Liabilities and Stockholders' Equity | $ | 118,310,945 | $ | 98,762,566 | ||||
See accompanying notes to consolidated financial statements.
| 43 |
FONAR CORPORATION AND SUBSIDIARIES
CONSOLIDATED STATEMENTS OF INCOME
| For the Years Ended June 30, | ||||||||||||
| 2018 | 2017 | 2016 | ||||||||||
| Revenues | ||||||||||||
| Product sales – net | $ | 602,541 | $ | 1,572,148 | $ | 1,276,882 | ||||||
| Service and repair fees – net | 9,124,728 | 9,537,040 | 9,396,736 | |||||||||
| Service and repair fees – related parties – net | 110,000 | 110,000 | 110,000 | |||||||||
| Patient fee revenue, net of contractual allowances and discounts | 39,165,413 | 36,400,600 | 32,985,809 | |||||||||
| Provision for bad debts for patient fee | (17,896,528 | ) | (16,171,434 | ) | (14,539,786 | ) | ||||||
| Management and other fees – net | 41,422,958 | 38,361,514 | 36,633,230 | |||||||||
| Management and other fees – related party medical practices – net | 8,986,882 | 8,226,718 | 7,505,339 | |||||||||
| Total Revenues – Net | 81,515,994 | 78,036,586 | 73,368,210 | |||||||||
| Costs and Expenses | ||||||||||||
| Costs related to product sales | 751,221 | 931,501 | 1,254,328 | |||||||||
| Costs related to service and repair fees | 3,212,527 | 2,996,736 | 2,148,143 | |||||||||
| Costs related to service and repair fees – related parties | 38,728 | 34,564 | 25,147 | |||||||||
| Costs related to patient fee revenue | 10,256,951 | 8,987,673 | 9,418,935 | |||||||||
| Costs related to management and other fees | 22,778,202 | 20,828,581 | 21,949,583 | |||||||||
| Costs related to management and other fees – related party medical practices | 4,913,141 | 4,273,370 | 4,074,762 | |||||||||
| Research and development | 1,755,747 | 1,480,670 | 1,631,846 | |||||||||
| Selling, general and administrative, inclusive of compensatory element of stock issuances of $0, $2,397,276 and $2,006 for the years ended June 30, 2018, 2017 and 2016, respectively | 18,125,266 | 19,407,411 | 18,509,850 | |||||||||
| Total Costs and Expenses | 61,831,783 | 58,940,506 | 59,012,594 | |||||||||
| Income from Operations | 19,684,211 | 19,096,080 | 14,355,616 | |||||||||
| Other Income and (Expenses): | ||||||||||||
| Interest expense | (160,074 | ) | 28,299 | (262,193 | ) | |||||||
| Investment income | 262,569 | 193,141 | 224,263 | |||||||||
| Other (expense) income – net | (4,271 | ) | (1,156 | ) | 190,560 | |||||||
| Income before benefit for income taxes and noncontrolling interests | 19,782,435 | 19,316,364 | 14,508,246 | |||||||||
| Benefit for Income Taxes | 5,669,750 | 4,362,434 | 4,287,271 | |||||||||
| Net Income | $ | 25,452,185 | $ | 23,678,798 | $ | 18,795,517 | ||||||
| Net Income – Noncontrolling Interests | (4,221,383 | ) | (4,058,177 | ) | (3,070,892 | ) | ||||||
| Net Income – Attributable to FONAR | $ | 21,230,802 | $ | 19,620,621 | $ | 15,724,625 | ||||||
See accompanying notes to consolidated financial statements.
| 44 |
FONAR CORPORATION AND SUBSIDIARIES
CONSOLIDATED STATEMENTS OF INCOME (Continued)
| For the Years Ended June 30, | ||||||||||||
| 2018 | 2017 | 2016 | ||||||||||
| Net Income Available to Common Stockholders | $ | 19,899,823 | $ | 18,390,586 | $ | 14,702,834 | ||||||
| Net Income Available to Class A Non-Voting Preferred Stockholders | $ | 992,005 | $ | 916,769 | $ | 761,561 | ||||||
| Net Income Available to Class C Common Stockholders | $ | 338,974 | $ | 313,266 | $ | 260,230 | ||||||
| Basic Net Income Per Common Share Available to Common Stockholders | $ | 3.16 | $ | 2.98 | $ | 2.43 | ||||||
| Diluted Net Income Per Common Share Available to Common Stockholders | $ | 3.10 | $ | 2.92 | $ | 2.38 | ||||||
| Basic and Diluted Income Per Share – Class C Common | $ | 0.89 | $ | 0.82 | $ | 0.68 | ||||||
| Weighted Average Basic Shares Outstanding – Common Stockholders | 6,287,510 | 6,161,599 | 6,050,893 | |||||||||
| Weighted Average Diluted Shares Outstanding – Common Stockholders | 6,415,014 | 6,289,103 | 6,178,397 | |||||||||
| Weighted Average Basic and Diluted Shares Outstanding – Class C Common | 382,513 | 382,513 | 382,513 | |||||||||
See accompanying notes to consolidated financial statements.
| 45 |
FONAR CORPORATION AND SUBSIDIARIES
CONSOLIDATED STATEMENTS OF STOCKHOLDERS' EQUITY
FOR THE YEARS ENDED JUNE 30, 2018, 2017 AND 2016
| Class A Non-Voting Preferred | Common Shares | Stock Amount | Class C Common Stock | |||||||||||||
| Balance - June 30, 2015 | $ | 31 | 6,050,840 | $ | 607 | $ | 38 | |||||||||
| Net income | — | — | — | — | ||||||||||||
| Stock issued to employees under stock bonus plans | — | 146 | — | — | ||||||||||||
| Payments on notes receivable from employee stockholders | — | — | — | — | ||||||||||||
| Stock option exercised | — | 180 | — | — | ||||||||||||
| Redemption of noncontrolling interests | — | — | — | — | ||||||||||||
| Distributions to noncontrolling interests | — | — | — | — | ||||||||||||
| Balance - June 30, 2016 | $ | 31 | 6,051,166 | $ | 607 | $ | 38 | |||||||||
| Net income | — | — | — | — | ||||||||||||
| Stock issued to employees under stock bonus plans | — | 193,221 | 19 | — | ||||||||||||
| Payments on notes receivable from employee stockholders | — | — | — | — | ||||||||||||
| Issuance of stock for acquistion | — | 42,884 | 4 | — | ||||||||||||
| Distributions to noncontrolling interests | — | — | — | — | ||||||||||||
| Stock option exercised | — | 240 | — | — | ||||||||||||
| Balance - June 30, 2017 | $ | 31 | 6,287,511 | $ | 630 | $ | 38 | |||||||||
| Net income | — | — | — | — | ||||||||||||
| Payments on notes receivable from employee stockholders | — | — | — | — | ||||||||||||
| Distributions to noncontrolling interests | — | — | — | — | ||||||||||||
| Balance - June 30, 2018 | $ | 31 | 6,287,511 | $ | 630 | $ | 38 | |||||||||
See accompanying notes to consolidated financial statements.
| 46 |
FONAR CORPORATION AND SUBSIDIARIES
CONSOLIDATED STATEMENTS OF STOCKHOLDERS' EQUITY
FOR THE YEARS ENDED JUNE 30, 2018, 2017 AND 2016
| Paid-in Capital in Excess of Par Value | Accumulated Deficit | Notes Receivable From Employee Stockholders | ||||||||||
| Balance - June 30, 2015 | $ | 175,447,586 | $ | (136,348,635 | ) | $ | (31,495 | ) | ||||
| Net income | — | 15,724,625 | — | |||||||||
| Stock issued to employees under stock bonus plans | 2,006 | — | — | |||||||||
| Payments on notes receivable from employee stockholders | — | — | 7,616 | |||||||||
| Stock option exercised | 1,755 | — | — | |||||||||
| Redemption of noncontrolling interests | (1,749,012 | ) | — | |||||||||
| Distributions to noncontrolling interests | — | — | — | |||||||||
| Balance - June 30, 2016 | $ | 173,702,335 | $ | (120,624,010 | ) | $ | (23,879 | ) | ||||
| Net income | — | 19,620,621 | — | |||||||||
| Stock issued to employees under stock bonus plans | 4,636,559 | — | — | |||||||||
| Payments on notes receivable from employee stockholders | — | — | 7,333 | |||||||||
| Issuance of stock for acquisition | 791,206 | — | — | |||||||||
| Distributions to noncontrolling interests | — | — | ||||||||||
| Stock option exercised | 1,680 | — | — | |||||||||
| Balance - June 30, 2017 | $ | 179,131,780 | $ | (101,003,389 | ) | $ | (16,546 | ) | ||||
| Net income | — | 21,230,802 | — | |||||||||
| Payments on notes receivable from employee stockholders | — | — | 7,333 | |||||||||
| Distributions to noncontrolling interests | — | — | — | |||||||||
| Balance - June 30, 2018 | $ | 179,131,780 | $ | (79,772,587 | ) | $ | (9,213 | ) | ||||
See accompanying notes to consolidated financial statements.
| 47 |
FONAR CORPORATION AND SUBSIDIARIES
CONSOLIDATED STATEMENTS OF STOCKHOLDERS' EQUITY
FOR THE YEARS ENDED JUNE 30, 2018, 2017 AND 2016
| Treasury Stock | Noncontrolling Interests | Total | ||||||||||
| Balance - June 30, 2015 | $ | (675,390 | ) | $ | 12,390,771 | $ | 50,783,513 | |||||
| Net income | — | 3,070,892 | 18,795,517 | |||||||||
| Stock issued to employees under stock bonus plans | — | — | 2,006 | |||||||||
| Payments on notes receivable from employee stockholders | — | — | 7,616 | |||||||||
| Stock option exercised | — | — | 1,755 | |||||||||
| Redemption of noncontrolling interests | — | (1,155,988 | ) | (2,905,000 | ) | |||||||
| Distributions to noncontrolling interests | — | (5,909,100 | ) | (5,909,100 | ) | |||||||
| Balance - June 30, 2016 | $ | (675,390 | ) | $ | 8,396,575 | $ | 60,776,307 | |||||
| Net income | — | 4,058,177 | 23,678,798 | |||||||||
| Stock issued to employees under stock bonus plans | — | — | 4,636,578 | |||||||||
| Payments on notes receivable from employee stockholders | — | — | 7,333 | |||||||||
| Issuance of stock for acquistion | — | — | 791,210 | |||||||||
| Distributions to noncontrolling interests | (6,981,953 | ) | (6,981,953 | ) | ||||||||
| Stock option exercised | — | — | 1,680 | |||||||||
| Balance - June 30, 2017 | $ | (675,390 | ) | $ | 5,472,799 | $ | 82,909,953 | |||||
| Net income | — | 4,221,383 | 25,452,185 | |||||||||
| Payments on notes receivable from employee stockholders | — | — | 7,333 | |||||||||
| Distributions to noncontrolling interests | — | (6,135,000 | ) | (6,135,000 | ) | |||||||
| Balance - June 30, 2018 | $ | (675,390 | ) | $ | 3,559,182 | $ | 102,234,471 | |||||
See accompanying notes to consolidated financial statements.
| 48 |
FONAR CORPORATION AND SUBSIDIARIES
CONSOLIDATED STATEMENTS OF CASH FLOWS
| For the Years Ended June 30, | ||||||||||||
| 2018 | 2017 | 2016 | ||||||||||
| CASH FLOWS FROM OPERATING ACTIVITIES | ||||||||||||
| Net Income | $ | 25,452,185 | $ | 23,678,798 | $ | 18,795,517 | ||||||
| Adjustments to reconcile net income to net cash provided by operating activities: | ||||||||||||
| Depreciation and amortization | 3,899,851 | 3,533,564 | 3,297,289 | |||||||||
| Abandoned patents or software written off | — | — | 88,796 | |||||||||
| Provision for bad debts | (614,680 | ) | 477,577 | (201,949 | ) | |||||||
| Deferred income tax benefit – net | (4,919,750 | ) | (4,969,669 | ) | (4,647,767 | ) | ||||||
| Income tax receivable | (1,200,000 | ) | — | — | ||||||||
| Gain on acquisition | — | — | (192,999 | ) | ||||||||
| Compensatory element of stock issuances | — | 2,397,276 | 2,006 | |||||||||
| Stock issued for costs and expenses | — | 2,239,302 | — | |||||||||
| Stock option exercised | — | 1,680 | 1,755 | |||||||||
| (Increase) decrease in operating assets, net: | ||||||||||||
| Accounts, medical and management fee receivables | (4,328,239 | ) | (5,899,611 | ) | (3,557,507 | ) | ||||||
| Notes receivable | (894,665 | ) | 11,511 | 28,280 | ||||||||
| Costs and estimated earnings in excess of billings on uncompleted contracts | 649,423 | (736,061 | ) | 681,660 | ||||||||
| Inventories | 192,882 | 450,038 | 117,549 | |||||||||
| Prepaid expenses and other current assets | (1,553 | ) | (513,507 | ) | 72,718 | |||||||
| Other assets | 15,008 | 254,721 | 18,054 | |||||||||
| Increase (decrease) in operating liabilities, net: | ||||||||||||
| Accounts payable | (122,967 | ) | 168,733 | (527,957 | ) | |||||||
| Other current liabilities | 525,113 | (3,660,895 | ) | 3,065,673 | ||||||||
| Customer advances | 70,311 | (410,855 | ) | (739,074 | ) | |||||||
| Billings in excess of costs and estimated earnings on uncompleted contracts | — | (206,623 | ) | 64,406 | ||||||||
| Other liabilities | 16,404 | 8,783 | 242,798 | |||||||||
| Due to related party medical practices | — | (17,498 | ) | 8,121 | ||||||||
| NET CASH PROVIDED BY OPERATING ACTIVITIES | 18,739,323 | 16,807,264 | 16,617,369 | |||||||||
See accompanying notes to consolidated financial statements.
| 49 |
FONAR CORPORATION AND SUBSIDIARIES
CONSOLIDATED STATEMENTS OF CASH FLOWS
| For the Years Ended June 30, | ||||||||||||
| 2018 | 2017 | 2016 | ||||||||||
| CASH FLOWS FROM INVESTING ACTIVITIES | ||||||||||||
| Purchases of property and equipment | (2,777,948 | ) | (2,851,158 | ) | (712,216 | ) | ||||||
| Cost of acquisition | (58,274 | ) | (1,312,769 | ) | (4,223,567 | ) | ||||||
| Cost of patents | (108,829 | ) | (155,156 | ) | (113,072 | ) | ||||||
| NET CASH USED IN INVESTING ACTIVITIES | (2,945,051 | ) | (4,319,083 | ) | (5,048,855 | ) | ||||||
| CASH
FLOWS FROM FINANCING ACTIVITIES: | ||||||||||||
| Repayment of borrowings and capital lease obligations | (172,484 | ) | (3,990,078 | ) | (3,682,519 | ) | ||||||
| Repayment of notes receivable from employee stockholders | 7,333 | 7,333 | 7,616 | |||||||||
| Distributions to noncontrolling interests | (6,135,000 | ) | (6,981,953 | ) | (5,909,100 | ) | ||||||
| Redemption of noncontrolling interests | — | — | (2,905,000 | ) | ||||||||
| Proceeds received from acquisition -net | — | 87,829 | — | |||||||||
| NET CASH USED IN FINANCING ACTIVITIES | (6,300,151 | ) | (10,876,869 | ) | (12,489,003 | ) | ||||||
| NET INCREASE (DECREASE) IN CASH AND CASH EQUIVALENTS | 9,494,121 | 1,611,312 | (920,489 | ) | ||||||||
| CASH AND CASH EQUIVALENTS – BEGINNING OF YEAR | 10,139,621 | 8,528,309 | 9,448,798 | |||||||||
| CASH AND CASH EQUIVALENTS – END OF YEAR | $ | 19,633,742 | $ | 10,139,621 | $ | 8,528,309 | ||||||
See accompanying notes to consolidated financial statements.
| 50 |
FONAR CORPORATION AND SUBSIDIARIES
NOTES TO CONSOLIDATED FINANCIAL STATEMENTS
JUNE 30, 2018, 2017 and 2016
NOTE 1 - DESCRIPTION OF BUSINESS AND LIQUIDITY AND CAPITAL RESOURCES
Description of Business
FONAR Corporation (the “Company” or “FONAR”) is a Delaware corporation, which was incorporated on July 17, 1978. FONAR is engaged in the research, development, production and marketing of medical scanning equipment, which uses principles of Magnetic Resonance Imaging ("MRI") for the detection and diagnosis of human diseases. In addition to deriving revenues from the direct sale of MRI equipment, revenue is also generated from our installed-base of customers through our service and upgrade programs.
FONAR, through its wholly-owned subsidiary Health Management Corporation of America ("HMCA") provides comprehensive management services to diagnostic imaging facilities. The services provided by the Company include development, administration, leasing of office space, facilities and medical equipment, provision of supplies, staffing and supervision of non-medical personnel, legal services, accounting, billing and collection and the development and implementation of practice growth and marketing strategies.
On June 30, 2016, the Company purchased 100% of the equity in Turnkey Services of New York, LLC and 100% of the equity in TK2 Equipment Management, LLC. Turnkey Service of New York, LLC and TK2 Equipment Management, LLC. These entities had provided the Company with ancillary diagnostic imaging equipment (under operating leases) to our managed MRI facilities. The Company paid $4,223,567 to acquire these two entities with net assets at fair value of $2,861,506.
On July 1, 2015, the Company restructured the corporate organization of the management of diagnostic imaging centers segment of our business. The reorganization was structured to more completely integrate the operations of Health Management Corporation of America and HDM. Imperial contributed all of its assets (which were utilized in the business of Health Management Corporation of America) to HDM and received a 24.2% interest in HDM. Health Management Corporation of America retained a direct ownership interest of 45.8% in HDM, and the original investors in HDM retained a 30.0% ownership interest in the newly expanded HDM. The entire management of diagnostic imaging centers business segment is now being conducted by HDM.
NOTE 2 - SUMMARY OF SIGNIFICANT ACCOUNTING POLICIES
Principles of Consolidation
The consolidated financial statements include the accounts of FONAR Corporation, its majority and wholly-owned subsidiaries and partnerships. The operating activities of subsidiaries are included in the accompanying consolidated statements from the date of acquisition. All significant intercompany accounts and transactions have been eliminated in consolidation.
| 51 |
FONAR CORPORATION AND SUBSIDIARIES
NOTES TO CONSOLIDATED FINANCIAL STATEMENTS
JUNE 30, 2018, 2017 and 2016
NOTE 2 - SUMMARY OF SIGNIFICANT ACCOUNTING POLICIES (Continued)
Use of Estimates
The preparation of the consolidated financial statements in conformity with accounting principles generally accepted in the United States requires management to make estimates and assumptions that affect the reported amounts of assets and liabilities and disclosure of contingent assets and liabilities in the consolidated financial statements and accompanying notes. The most significant estimates relate to receivable allowances, intangible assets, income taxes and related tax asset valuation allowances, useful lives of property and equipment, contingencies, revenue recognition and the assessment of litigation. In addition, healthcare industry reforms and reimbursement practices will continue to impact the Company's operations and the determination of contractual and other allowance estimates. Actual results could differ from those estimates.
Inventories
Inventories consist of purchased parts, components and supplies, as well as work-in-process, and are stated at the lower of cost, determined on the first-in, first-out method, or market.
Property and Equipment
Property and equipment procured in the normal course of business is stated at cost. Property and equipment purchased in connection with an acquisition is stated at its estimated fair value, generally based on an appraisal. Property and equipment is being depreciated for financial accounting purposes using the straight-line method over their estimated useful lives. Leasehold improvements are being amortized over the shorter of the useful life or the remaining lease term. Upon retirement or other disposition of these assets, the cost and related accumulated depreciation of these assets are removed from the accounts and the resulting gains or losses are reflected in the results of operations. Expenses for maintenance and repairs are charged to operations. Renewals and betterments are capitalized. Maintenance and repair expenses totaled approximately $1,451,000, $1,116,000 and $1,113,000 for the years ended June 30, 2018, 2017 and 2016, respectively. The estimated useful lives in years are generally as follows:
| Diagnostic equipment | 5–13 | |||
| Research, development and demonstration equipment | 3-7 | |||
| Machinery and equipment | 2-7 | |||
| Furniture and fixtures | 3-9 | |||
| Leasehold improvements | 2–10 | |||
| Building | 28 |
Long-Lived Assets
The Company periodically assesses the recoverability of long-lived assets, including property and equipment and intangibles, other than goodwill, when there are indications of potential impairment, based on estimates of undiscounted future cash flows. The amount of impairment is calculated by comparing anticipated discounted future cash flows with the carrying value of the related asset. In performing this analysis, management considers such factors as current results, trends, and future prospects, in addition to other economic factors.
| 52 |
FONAR CORPORATION AND SUBSIDIARIES
NOTES TO CONSOLIDATED FINANCIAL STATEMENTS
JUNE 30, 2018, 2017 and 2016
NOTE 2 - SUMMARY OF SIGNIFICANT ACCOUNTING POLICIES (Continued)
Deferred Rent
Rent expense is recorded on the straight-line method based on the total minimum rent payments required over the term of the lease. The cumulative difference between the lease expense recorded under this method and the contractual lease payment terms is recorded as deferred rent.
Other Intangible Assets
1) Capitalized Software Development Costs
Capitalization of software development costs begins upon the establishment of technological feasibility. Technological feasibility for the Company’s computer software is generally based upon achievement of a detail program design free of high risk development issues and the completion of research and development on the product hardware in which it is to be used. The establishment of technological feasibility and the ongoing assessment of recoverability of capitalized computer software development costs require considerable judgment by management with respect to certain external factors, including, but not limited to, technological feasibility, anticipated future gross revenue, estimated economic life and changes in software and hardware technology. Prior to reaching technological feasibility those costs are expensed as incurred and included in research and development.
Amortization of capitalized software development costs commences when the related products become available for general release to customers. Amortization is provided on a product by product basis. The annual amortization is the greater of the amount computed using (a) the ratio that current gross revenue for a product bears to the total of current and anticipated future gross revenue for that product, or (b) the straight-line method over the remaining estimated economic life of the product.
The Company periodically performs reviews of the recoverability of such capitalized software development costs. At the time a determination is made that capitalized amounts are not recoverable, based on the estimated cash flows to be generated from the applicable software, any remaining capitalized amounts are written off.
2) Patents and Copyrights
Amortization is calculated on the straight-line basis over 15 years.
3) Non-Competition Agreements
The non-competition agreements are being amortized on the straight line basis over the length of the agreement (7 years).
4) Customer Relationships
Amortization is calculated on the straight line basis over 20 years.
| 53 |
FONAR CORPORATION AND SUBSIDIARIES
NOTES TO CONSOLIDATED FINANCIAL STATEMENTS
JUNE 30, 2018, 2017 and 2016
NOTE 2 - SUMMARY OF SIGNIFICANT ACCOUNTING POLICIES (Continued)
Goodwill
Generally accepted accounting principles in the United States require the Company to perform a goodwill impairment test annually and more frequently when negative conditions or a triggering event arises. Impairment of goodwill is tested at the reporting unit level by comparing the reporting unit’s carrying amount, including goodwill to the fair value of the reporting unit. If the carrying amount of the reporting unit exceeds its fair value, goodwill is considered potentially impaired and a second step is performed to measure the amount of impairment loss, if any.
Acquired assets and assumed liabilities
Pursuant to ASC No. 805-10-25, if the initial accounting for a business combination is incomplete by the end of the reporting period in which the combination occurs, but during the allowed measurement period not to exceed one year from the acquisition date, the Company adjusts the provisional amounts recognized at the acquisition date by means of adjusting the amount recognized for goodwill.
Revenue Recognition
Revenue on sales contracts for scanners, included in “product sales” in the accompanying consolidated statements of operations, is recognized under the percentage-of-completion method in accordance with FASB ASC 605-35, “Revenue Recognition – Construction-Type and Production-Type Contracts”. The Company manufactures its scanners under specific contracts that provide for progress payments. Production and installation take approximately three to six months.
Revenue on scanner service contracts is recognized on the straight-line method over the related contract period, usually one year.
Revenue from product sales (upgrades and supplies) is recognized upon shipment.
Revenue under management contracts is recognized based upon contractual agreements for management services rendered by the Company primarily under various long-term agreements with various medical providers (the "PCs"). As of June 30, 2018, the Company has twenty two management agreements of which three are with PC’s owned by Raymond V. Damadian, M.D., Chairman of the Board of FONAR (“the Related medical practices”) and nineteen are with PC’s, which are all located in the state of New York (“the New York PC’s”), owned by two unrelated radiologists. The contractual fees for services rendered to the PCs consists of fixed monthly fees per diagnostic imaging facility ranging from approximately $66,000 to $439,000. All fees are re-negotiable at the anniversary of the agreements and each year thereafter. Revenue under lease contracts is recognized based upon contractual agreements for the leasing of medical equipment primarily under long term contracts to various unrelated PC’s. All fees are re-negotiable at the anniversary of the agreements and each year thereafter.
Patient fee revenue, net of contractual allowance and discounts, consist of net patient fees received from insurance companies, third party payors (including federal and state agencies under Medicare and Medicaid programs), hospitals and patients themselves based mainly upon established contractual billing rates, less allowances for contractual adjustments and discounts. Patient fee revenue is recorded in the period in which services are provided.
| 54 |
FONAR CORPORATION AND SUBSIDIARIES
NOTES TO CONSOLIDATED FINANCIAL STATEMENTS
JUNE 30, 2018, 2017 and 2016
NOTE 2 - SUMMARY OF SIGNIFICANT ACCOUNTING POLICIES (Continued)
Revenue Recognition (Continued)
The Company’s patient fee revenues, net of contractual allowances and discounts less the provision for bad debts for the years ended June 30, 2018, 2017 and 2016 are summarized in the following table.
| For the Year Ended June 30, | ||||||||||||
| 2018 | 2017 | 2016 | ||||||||||
| Commercial Insurance/ Managed Care | $ | 4,729,514 | $ | 4,904,892 | $ | 4,659,322 | ||||||
| Medicare/Medicaid | 1,233,078 | 1,274,436 | 1,182,552 | |||||||||
| Workers' Compensation/Personal Injury | 25,358,543 | 23,240,829 | 20,888,856 | |||||||||
| Other | 7,844,278 | 6,980,443 | 6,255,079 | |||||||||
| Patient Fee Revenue, net of contractual allowances and discounts | 39,165,413 | 36,400,600 | 32,985,809 | |||||||||
| Provision for Bad Debts | (17,896,528 | ) | (16,171,434 | ) | (14,539,786 | ) | ||||||
| Net Patient Fee Revenue | $ | 21,268,885 | $ | 20,229,166 | $ | 18,446,023 | ||||||
Allowance for Doubtful Accounts – Patient Fee
The Company provides for medical receivables that could become uncollectible by establishing an allowance for doubtful accounts in order to adjust medical receivables to estimated net realizable value. In evaluating the collectability of medical receivables, the Company considers a number of factors, including the age of the account, historical collection experiences, payor type, current economic conditions and other relevant factors. There are various factors that impact collection trends, such as payor mix, changes in the economy, increased burden on copayments to be made by patients with insurance and business practices related to collection efforts. These factors continuously change and can have an impact on collection trends and the estimation process.
Research and Development Costs
Research and development costs are charged to expense as incurred. The costs of equipment that are acquired or constructed for research and development activities, and have alternative future uses (either in research and development, marketing or production), are classified as property and equipment and depreciated over their estimated useful lives.
Advertising Costs
Advertising costs are expensed as incurred. Advertising expense approximated $607,000, $531,000 and $535,000 for the years ended June 30, 2018, 2017 and 2016, respectively.
Shipping Costs
The Company’s shipping and handling costs are included in revenue from product sales and the related expense included in costs related to product sales is $9,370, $8,224 and $11,077 for the years ended June 30, 2018, 2017 and 2016, respectively.
| 55 |
FONAR CORPORATION AND SUBSIDIARIES
NOTES TO CONSOLIDATED FINANCIAL STATEMENTS
JUNE 30, 2018, 2017 and 2016
NOTE 2 - SUMMARY OF SIGNIFICANT ACCOUNTING POLICIES (Continued)
Income Taxes
Deferred tax assets and liabilities are determined based on the difference between the financial statement carrying amounts and tax basis of assets and liabilities using enacted tax rates in effect in the years in which the differences are expected to reverse.
Customer Advances
Cash advances and progress payments received on sales orders are reflected as customer advances until such time as revenue recognition occurs.
Earnings Per Share
Basic earnings per share (“EPS”) is computed by dividing net income available to common stockholders by the weighted average number of shares of common stock outstanding during the period. In accordance with ASC topic 260-10, “Participating Securities and the Two-Class Method”, the Company used the Two-Class method for calculating basic earnings per share and applied the if converted method in calculating diluted earnings per share for the years ended June 30, 2018, 2017 and 2016.
Diluted EPS reflects the potential dilution from the exercise or conversion of all dilutive securities into common stock based on the average market price of common shares outstanding during the period. For the years ended June 30, 2018, 2017 and 2016, diluted EPS for common shareholders includes 127,504 shares upon conversion of Class C Common.
| June 30, 2018 | ||||||||||||
| Basic | Total | Common Stock | Class C Common Stock | |||||||||
| Numerator: | ||||||||||||
| Net income available to common stockholders | $ | 21,230,802 | $ | 19,899,823 | $ | 338,974 | ||||||
| Denominator: | ||||||||||||
| Weighted average shares outstanding | 6,287,510 | 6,287,510 | 382,513 | |||||||||
| Basic income per common share | $ | 3.38 | $ | 3.16 | $ | 0.89 | ||||||
| Diluted | ||||||||||||
| Denominator: | ||||||||||||
| Weighted average shares outstanding | 6,287,510 | 382,513 | ||||||||||
| Class C Common Stock | 127,504 | — | ||||||||||
| Total Denominator for diluted earnings per share | 6,415,014 | 382,513 | ||||||||||
| Diluted income per common share | $ | 3.10 | $ | 0.89 | ||||||||
| 56 |
FONAR CORPORATION AND SUBSIDIARIES
NOTES TO CONSOLIDATED FINANCIAL STATEMENTS
JUNE 30, 2018, 2017 and 2016
NOTE 2 – SUMMARY OF SIGNIFICANT ACCOUNTING POLICIES (Continued)
Earnings Per Share (Continued)
| June 30, 2017 | ||||||||||||
| Basic | Total | Common Stock | Class C Common Stock | |||||||||
| Numerator: | ||||||||||||
| Net income available to common stockholders | $ | 19,620,621 | $ | 18,390,586 | $ | 313,266 | ||||||
| Denominator: | ||||||||||||
| Weighted average shares outstanding | 6,161,599 | 6,161,599 | 382,513 | |||||||||
| Basic income per common share | $ | 3.18 | $ | 2.98 | $ | 0.82 | ||||||
| Diluted | ||||||||||||
| Denominator: | ||||||||||||
| Weighted average shares outstanding | 6,161,599 | 382,513 | ||||||||||
| Class C Common Stock | 127,504 | — | ||||||||||
| Total Denominator for diluted earnings per share | 6,289,103 | 382,513 | ||||||||||
| Diluted income per common share | $ | 2.92 | $ | 0.82 | ||||||||
| June 30, 2016 | ||||||||||||
| Basic | Total | Common Stock | Class C Common Stock | |||||||||
| Numerator: | ||||||||||||
| Net income available to common stockholders | $ | 15,724,625 | $ | 14,702,834 | $ | 260,230 | ||||||
| Denominator: | ||||||||||||
| Weighted average shares outstanding | 6,050,893 | 6,050,893 | 382,513 | |||||||||
| Basic income per common share | $ | 2.60 | $ | 2.43 | $ | 0.68 | ||||||
| Diluted | ||||||||||||
| Denominator: | ||||||||||||
| Weighted average shares outstanding | 6,050,893 | 382,513 | ||||||||||
| Class C Common Stock | 127,504 | — | ||||||||||
| Total Denominator for diluted earnings per share | 6,178,397 | 382,513 | ||||||||||
| Diluted income per common share | $ | 2.38 | $ | 0.68 | ||||||||
| 57 |
FONAR CORPORATION AND SUBSIDIARIES
NOTES TO CONSOLIDATED FINANCIAL STATEMENTS
JUNE 30, 2018, 2017 and 2016
NOTE 2 - SUMMARY OF SIGNIFICANT ACCOUNTING POLICIES (Continued)
Cash and Cash Equivalents
The Company considers all short-term highly liquid investments with a maturity of three months or less when purchased to be cash equivalents.
Concentration of Credit Risk
Cash: The Company maintains its cash and cash equivalents with various financial institutions, which exceed federally insured limits throughout the year. At June 30, 2018, the Company had cash on deposit of approximately $17,478,000 in excess of federally insured limits of $250,000.
Related Parties: Net revenues from related parties accounted for approximately 11%, 11% and 10% of the consolidated net revenues for the years ended June 30, 2018, 2017 and 2016, respectively. Net management fee receivables from the related party medical practices accounted for approximately 12%, 13% and 12% of the consolidated accounts receivable for the years ended June 30, 2018, 2017 and 2016, respectively.
See Note 3 regarding the Company’s concentrations in the healthcare industry.
Fair Value of Financial Instruments
The financial statements include various estimated fair value information at June 30, 2018 and 2017, as required by ASC topic 820, "Disclosures about Fair Value of Financial Instruments". Such information, which pertains to the Company's financial instruments, is based on the requirements set forth in that Statement and does not purport to represent the aggregate net fair value to the Company.
The following methods and assumptions were used to estimate the fair value of each class of financial instruments for which it is practicable to estimate that value:
Cash and cash equivalents: The carrying amount approximates fair value because of the short-term maturity of those instruments.
Receivable and accounts payable: The carrying amounts approximate fair value because of the short maturity of those instruments.
Notes receivable: The carrying amount approximates fair value because the discounted present value of the cash flow generated by the parties approximates the carrying value of the amounts due to the Company.
Long-term debt and notes payable: The carrying amounts of debt and notes payable approximate fair value due to the length of the maturities, the interest rates being tied to market indices and/or due to the interest rates not being significantly different from the current market rates available to the Company.
All of the Company's financial instruments are held for purposes other than trading.
| 58 |
FONAR CORPORATION AND SUBSIDIARIES
NOTES TO CONSOLIDATED FINANCIAL STATEMENTS
JUNE 30, 2018, 2017 and 2016
NOTE 2 - SUMMARY OF SIGNIFICANT ACCOUNTING POLICIES (Continued)
Recent Accounting Pronouncements
In May 2014, the FASB issued ASU No. 2014-09, Revenue from Contracts with Customers, (Topic 606). ASU 2014-09 requires an entity to recognize as revenue the amount that reflects the consideration which it expects to be entitled in exchange for goods and services as it transfers control to its customers. It also requires more detailed disclosures to enable users of the financial statements to understand the nature, amount, timing and uncertainty of revenue and cash flows arising from contracts with customers. The Company earns revenue from the sale of scanners, maintenance contracts, product upgrades, patient services and management fees. Under the new guidance, the reporting for patient services revenue will be reported differently. All other streams of revenue will not be impacted by the new guidance. The primary change for healthcare providers under the new guidance relates to revenue generated from patient services, with patient responsibility for payment. Under the new guidance, the Company is required to report an implicit price concession (both initially and for the subsequent changes in estimates) as a reduction of revenues as opposed to bad debt expense as a component of operating expenses. The Company will record any changes in expectation of collection amounts due to patient specific events that suggests that the patient no longer has the ability and intent to pay the amount due through the bad debt expense, as that is more indicative of a change in the customer’s credit worthiness as opposed to change in the transaction price.
The new standard supersedes most current revenue guidance, including industry-specific guidance. The guidance became effective for the Company on July 1, 2018 and as part of adopting the standard, the Company identified revenue streams of like contracts to allow for ease of implementation. The Company used primarily a portfolio approach to apply the new model to classes of customers with similar characteristics. The impact of adopting the new standard on our total revenue; and income from operations is not material. While the adoption of ASU 2014-09 will impact the presentation of net operating revenues in our Consolidated Statements of Operations and will impact certain disclosures, it will not materially impact our financial position, results of operations or cash flows. There was no cumulative effect of a change in accounting principle recorded related to the adoption of ASU 2014-09 on July 1, 2018.
In January 2017, the FASB issued Accounting Standards Update (“ASU”) 2017-04, Intangibles – Goodwill and Other (Topic 350). The amendments in this update simplify the test for goodwill impairment by eliminating Step 2 from the impairment test, which required the entity to perform procedures to determine the fair value at the impairment testing date of its assets and liabilities following the procedure that would be required in determining fair value of assets acquired and liabilities assumed in a business combination. The amendments in this update are effective for public companies for annual or any interim goodwill impairment tests in fiscal years beginning after December 15, 2019. We are evaluating the impact of adopting this guidance on our Consolidated Financial Statements.
In January 2017, the FASB issued ASU 2017-01, Business Combinations (Topic 805); Clarifying the Definition of a Business. The amendments in this update clarify the definition of a business to help companies evaluate whether transactions should be accounted for as acquisitions or disposals of assets or businesses. The amendments in this update are effective for public companies for annual periods beginning after December 15, 2017, including interim periods within those periods. We are evaluating the impact of adopting this guidance on our Consolidated Financial Statements.
In March 2016, the FASB issued ASU No. 2016-09, “Compensation-Stock Compensation (Topic 718): Improvements to Employee Share-Based Payment Accounting”. This update includes provisions intended to simplify various aspects of accounting for share-based compensation. ASU No. 2016-09 will take effect for public companies for the annual periods beginning after December 15, 2016. The Company has adopted ASU No. 2016-09. Our adoption of ASU No. 2016-09 did not have an impact on the Company’s financial statements.
| 59 |
FONAR CORPORATION AND SUBSIDIARIES
NOTES TO CONSOLIDATED FINANCIAL STATEMENTS
JUNE 30, 2018, 2017 and 2016
NOTE 2 - SUMMARY OF SIGNIFICANT ACCOUNTING POLICIES (Continued)
Recent Accounting Pronouncements (Continued)
During February 2016, FAS issued ASU 2016-02, Leases (Topic 842). The new standard requires lessees to apply a dual approach, classifying leases as either finance or operating leases based upon the principle of whether or not the lease is effectively a financed purchase by the lessee. This classification will determine whether lease expense is recognized based on an effective interest method or on a straight-line basis over the term of the lease. A lessee is also required to record a right-of-use asset and a lease liability for all leases with a term of greater than 12 months regardless of their classification. Lease with a term of 12 months or less will be accounted for similar to existing guidance for operating leases. The new guidance will be effective for annual reporting periods beginning after December 15, 2018, including interim periods within that reporting period and is applied retrospectively. Early adoption is permitted. The Company is currently in the process of assessing the impact the adoption of this guidance will have on the Company’s consolidated financial statements.
In July 2015, the FASB issued Accounting Standards Update No. 2015-11, “Simplifying the Measurement of Inventory” (“ASU 2015-11”). ASU 2015-11 requires an entity to measure inventory at the lower of cost and net realizable value. Net realizable value is the estimated selling prices in the ordinary course of business, less reasonably predictable costs of completion, disposal, and transportation. Subsequent measurement is unchanged for inventory measured using last-in, first-out (“LIFO”) or the retail inventory method. It is effective for annual reporting periods beginning after December 15, 2016. The Company has adopted ASU 2015-11. Our adoption of ASU 2015-11 did not have an impact on the Company’s financial statements.
FASB, the Emerging Issues Task Force and the SEC have issued certain other accounting standards, updates, and regulations as of June 30, 2018 that will become effective in subsequent periods; however, management does not believe that any of those updates would have significantly affected our financial accounting measures or disclosures had they been in effect during 2018 or 2017, and it does not believe that any of those pronouncements will have a significant impact on our consolidated financial statements at the time they become effective.
Reclassifications
Certain prior year amounts have been reclassified to conform to the current year presentation. The reclassifications did not have any effect on reported net income for any periods presented.
NOTE 3 – ACCOUNTS RECEIVABLE, MEDICAL RECEIVABLE AND MANAGEMENT AND OTHER FEES RECEIVABLE
Accounts Receivable
Credit risk with respect to the Company’s accounts receivable related to product sales and service and repair fees is limited due to the customer advances received prior to the commencement of work performed and the billing of amounts to customers as sub-assemblies are completed. Service and repair fees are billed on a monthly or quarterly basis and the Company does not continue providing these services if accounts receivable become past due. The Company controls credit risk with respect to accounts receivable from service and repair fees through its credit evaluation process, credit limits, monitoring procedures and reasonably short collection terms. The Company performs ongoing credit authorizations before a product sales contract is entered into or service and repair fees are provided.
| 60 |
FONAR CORPORATION AND SUBSIDIARIES
NOTES TO CONSOLIDATED FINANCIAL STATEMENTS
JUNE 30, 2018, 2017 and 2016
NOTE 3 – ACCOUNTS RECEIVABLE, MEDICAL RECEIVABLE AND MANAGEMENT AND OTHER FEES RECEIVABLE (Continued)
Medical Receivable
Medical receivables are due under fee-for-service contracts from third party payors, such as hospitals, government sponsored healthcare programs, patient’s legal counsel and directly from patients. Substantially all the revenue relates to patients residing in Florida. The carrying amount of the medical receivable is reduced by an allowance that reflects management’s best estimate of the amounts that will not be collected. The Company continuously monitors collections from its clients and maintains an allowance for bad debts based upon the Company’s historical collection experience. The Company determines allowances for contractual adjustments and uncollectible accounts based on specific agings, specific payor collection issues that have been identified and based on payor classifications and historical experience at each site.
Management and Other Fees Receivable
The Company’s receivables from the related and non-related professional corporations (“PCs”) substantially consist of fees outstanding under management agreements. Payment of the outstanding fees is dependent on collection by the PCs of fees from third party medical reimbursement organizations, principally insurance companies and health management organizations.
Payment of the management fee receivables from the PC’s may be impaired by the inability of the PC’s to collect in a timely manner their medical fees from the third party payors, particularly insurance carriers covering automobile no-fault and workers compensation claims due to longer payment cycles and rigorous informational requirements and certain other disallowed claims. Approximately 65%, 62% and 59%, respectively, of the PCs’ 2018, 2017 and 2016 net revenues were derived from no-fault and personal injury protection claims. The Company considers the aging of its accounts receivable in determining the amount of allowance for doubtful accounts. The Company generally takes all legally available steps to collect its receivables. Credit losses associated with the receivables are provided for in the consolidated financial statements and have historically been within management's expectations.
Net revenues from management and other fees charged to the related party medical practices accounted for approximately 11%, 11% and 10%, of the consolidated net revenues for the years ended June 30, 2018, 2017 and 2016, respectively.
Tallahassee Magnetic Resonance Imaging, PA, Stand Up MRI of Boca Raton, PA and Stand Up MRI & Diagnostic Center, PA (all related party medical practices) entered into a guaranty agreement, pursuant to which they cross guaranteed all management fees which are payable to the Company, which have arisen under each individual management agreement.
The following table sets forth the number of our facilities for the years ended June 30, 2018, 2017 and 2016.
| For The Year Ended June 30, | ||||||||||||
| 2018 | 2017 | 2016 | ||||||||||
| Total Facilities Owned or Managed (at Beginning of Year) | 26 | 25 | 24 | |||||||||
| Facilities Added by: | ||||||||||||
| Acquisition | — | 1 | 1 | |||||||||
| Internal development | — | — | — | |||||||||
| Managed Facilities Closed | — | — | — | |||||||||
| Total Facilities Owned or Managed (at End of Year) | 26 | 26 | 25 | |||||||||
| 61 |
FONAR CORPORATION AND SUBSIDIARIES
NOTES TO CONSOLIDATED FINANCIAL STATEMENTS
JUNE 30, 2018, 2017 and 2016
NOTE 4 - COSTS AND ESTIMATED EARNINGS ON UNCOMPLETED CONTRACTS
Information relating to uncompleted contracts as of June 30, 2018 and 2017 is as follows:
| As of June 30, | ||||||||
| 2018 | 2017 | |||||||
| Costs incurred on uncompleted contracts | $ | 448,437 | $ | 1,030,675 | ||||
| Estimated earnings | 309,248 | 999,433 | ||||||
| 757,685 | 2,030,108 | |||||||
| Less: Billings to date | 671,047 | 1,294,047 | ||||||
| $ | 86,638 | $ | 736,061 | |||||
NOTE 5 – INVENTORIES
Inventories included in the accompanying consolidated balance sheets consist of:
| As of June 30, | ||||||||
| 2018 | 2017 | |||||||
| Purchased parts, components and supplies | $ | 1,312,299 | $ | 1,430,901 | ||||
| Work-in-process | 119,081 | 193,361 | ||||||
| $ | 1,431,380 | $ | 1,624,262 | |||||
| 62 |
FONAR CORPORATION AND SUBSIDIARIES
NOTES TO CONSOLIDATED FINANCIAL STATEMENTS
JUNE 30, 2018, 2017 and 2016
NOTE 6 - PROPERTY AND EQUIPMENT
Property and equipment, at cost, less accumulated depreciation and amortization, at June 30, 2018 and 2017, is comprised of:
| As of June 30, | ||||||||
| 2018 | 2017 | |||||||
| Diagnostic equipment | $ | 24,296,957 | $ | 22,356,565 | ||||
| Research, development and demonstration equipment | 2,987,531 | 2,749,753 | ||||||
| Machinery and equipment | 2,069,055 | 2,069,055 | ||||||
| Furniture and fixtures | 3,036,539 | 3,000,316 | ||||||
| Leasehold improvements | 7,165,035 | 6,601,480 | ||||||
| Building | 939,614 | 939,614 | ||||||
| 40,494,731 | 37,716,783 | |||||||
| Less: Accumulated depreciation and amortization | 24,002,453 | 21,254,279 | ||||||
| $ | 16,492,278 | $ | 16,462,504 | |||||
Depreciation and amortization of property and equipment for the years ended June 30, 2018, 2017 and 2016 was $2,748,174, $2,303,554 and $2,042,211, respectively.
During the year ended June 30, 2017, the Company has retired assets that were fully depreciated with a cost and accumulated depreciation basis of $1,849,409.
NOTE 7 - OTHER INTANGIBLE ASSETS
Other intangible assets, net of accumulated amortization, at June 30, 2018 and 2017 are comprised of:
| As of June 30, | ||||||||
| 2018 | 2017 | |||||||
| Capitalized software development costs | $ | 7,004,847 | $ | 7,004,847 | ||||
| Patents and copyrights | 4,835,806 | 4,726,977 | ||||||
| Non-competition agreements | 4,100,000 | 4,100,000 | ||||||
| Customer relationships | 3,800,000 | 3,800,000 | ||||||
| 19,740,653 | 19,631,824 | |||||||
| Less: Accumulated amortization | 14,138,997 | 12,987,320 | ||||||
| $ | 5,601,656 | $ | 6,644,504 | |||||
| 63 |
FONAR CORPORATION AND SUBSIDIARIES
NOTES TO CONSOLIDATED FINANCIAL STATEMENTS
JUNE 30, 2018, 2017 and 2016
NOTE 7 - OTHER INTANGIBLE ASSETS (Continued)
Information related to the above intangible assets for the years ended June 30, 2018, 2017 and 2016 is as follows:
| As of June 30, | ||||||||||||
| 2018 | 2017 | 2016 | ||||||||||
| Balance – Beginning of Year | $ | 6,644,504 | $ | 7,719,358 | $ | 8,950,160 | ||||||
| Amounts capitalized | 108,829 | 155,156 | 113,072 | |||||||||
| Software or patents written off | — | — | (88,796 | ) | ||||||||
| Amortization | (1,151,677 | ) | (1,230,010 | ) | (1,255,078 | ) | ||||||
| Balance – End of Year | $ | 5,601,656 | $ | 6,644,504 | $ | 7,719,358 | ||||||
Amortization of patents and copyrights for the years ended June 30, 2018, 2017 and 2016 amounted to $202,630, $194,296 and $187,553, respectively.
Amortization of capitalized software development costs for the years ended June 30, 2018, 2017 and 2016 was $173,333, $260,000 and $291,810, respectively.
Amortization of non-competition agreements for the years ended June 30, 2018, 2017 and 2016 amounted to $585,714, $585,714 and $585,714, respectively.
Amortization of customer relationships for the years ended June 30, 2018, 2017 and 2016 amounted to $190,000, $190,000 and $190,000, respectively.
The estimated amortization of other intangible assets for the five years ending June 30, 2023 and thereafter is as follows:
| For the Years Ending June 30, | Total | Patents and Copyrights | Non-
competition | Customer Relationships | ||||||||||||||
| 2019 | $ | 980,284 | $ | 204,570 | $ | 585,714 | $ | 190,000 | ||||||||||
| 2020 | 783,072 | 202,595 | 390,477 | 190,000 | ||||||||||||||
| 2021 | 393,102 | 203,102 | — | 190,000 | ||||||||||||||
| 2022 | 391,713 | 201,713 | — | 190,000 | ||||||||||||||
| 2023 | 387,103 | 197,103 | — | 190,000 | ||||||||||||||
| Thereafter | 2,666,382 | 829,715 | — | 1,836,667 | ||||||||||||||
| $ | 5,601,656 | $ | 1,838,798 | $ | 976,191 | $ | 2,786,667 | |||||||||||
The weighted average amortization period for other intangible assets is 11.1 years and they have no expected residual value.
| 64 |
FONAR CORPORATION AND SUBSIDIARIES
NOTES TO CONSOLIDATED FINANCIAL STATEMENTS
JUNE 30, 2018, 2017 and 2016
NOTE 8 - CAPITAL STOCK
Common Stock
Cash dividends payable on the common stock shall, in all cases, be on a per share basis, one hundred twenty percent (120%) of the cash dividend payable on shares of Class B common stock and three hundred sixty percent (360%) of the cash dividend payable on a share of Class C common stock.
Class B Common Stock
Class B common stock is convertible into shares of common stock on a one-for-one basis. Class B common stock has 10 votes per share. There were 146 of such shares outstanding at June 30, 2018, 2017 and 2016, respectively.
Class C Common Stock
On April 3, 1995, the stockholders ratified a proposal creating a new Class C common stock and authorized the exchange offering of three shares of Class C common stock for each share of the Company's outstanding Class B common stock. The Class C common stock has 25 votes per share, as compared to 10 votes per share for the Class B common stock and one vote per share for the common stock. The Class C common stock was offered on a three-for-one basis to the holders of the Class B common stock. Although having greater voting power, each share of Class C common stock has only one-third of the rights of a share of Class B common stock to dividends and distributions. Class C common stock is convertible into shares of common stock on a three-for-one basis.
Class A Non-Voting Preferred Stock
On April 3, 1995, the stockholders ratified a proposal consisting of the creation of a new class of Class A non-voting preferred stock with special dividend rights and the declaration of a stock dividend on the Company's common stock consisting of one share of Class A non-voting preferred stock for every five shares of common stock. The stock dividend was payable to holders of common stock on October 20, 1995. Class A non-voting preferred stock issued pursuant to such stock dividend approximates 313,000 shares.
The Class A non-voting preferred stock is entitled to a special dividend equal to 3-1/4% of first $10 million, 4-1/2% of next $20 million and 5-1/2% on amounts in excess of $30 million of the amount of any cash awards or settlements received by the Company in connection with the enforcement of five of the Company's patents in its patent lawsuits, less the revised special dividend payable on the common stock with respect to one of the Company's patents.
The Class A non-voting preferred stock participates on an equal per share basis with the common stock in any dividends declared and ranks equally with the common stock on distribution rights, liquidation rights and other rights and preferences (other than the voting rights).
Stock Bonus Plans
On April 23, 2010, the Board approved the 2010 Stock Bonus Plan. The plan entitles the Company to reserve 2,000,000 shares of common stock. On August 10, 2010, the Company filed Form S-8 to register the 2,000,000 shares. As of June 30, 2018, 716,876 shares of common stock of FONAR were available for future grant under this plan. For the years ended June 30, 2018, 2017 and 2016, 0, 193,461 and 146 shares were issued respectively.
| 65 |
FONAR CORPORATION AND SUBSIDIARIES
NOTES TO CONSOLIDATED FINANCIAL STATEMENTS
JUNE 30, 2018, 2017 and 2016
NOTE 8 - CAPITAL STOCK (Continued)
Options
The Company had stock option plans, which provide for the awarding of incentive and non-qualified stock options to employees, directors and consultants who may contribute to the success of the Company. The options granted vest either immediately or ratably over a period of time from the date of grant, typically three or four years, at a price determined by the Board of Directors or a committee of the Board of Directors, generally the fair value of the Company's common stock at the date of grant. The options must be exercised within ten years from the date of grant.
NOTE 9 – CONTROLLING AND NONCONTROLLING INTERESTS
On February 13, 2013 the Company entered into an agreement with outside investors to acquire a 50.5% controlling interest in a newly formed limited liability company, Health Diagnostics Management LLC (HDM). According to the February 13, 2013 LLC operating agreement of HDM there are two classes of members; Class A members and one Class B member. The Class A members have an ownership interest of 49.5% of HDM. The Class B member (HMCA) has an ownership of 50.5% of HDM. On all matters on which members may vote every member is entitled to cast the percentage of votes equal to their percentage of ownership interest. Profits and losses on all items of income, gain or loss, deductions or other allocations of the Company will be allocated among the members in the same proportions as their membership interests in the Company bear to all the Class A and Class B membership interests of the Company in the aggregate outstanding. All of the depreciation and amortization of the assets of the Company will be allocated solely to the Class A members, unless and until their interests have been redeemed by the Company in full pursuant to the provisions of the operating agreement. The Company contributed $20,200,000 to HDM and the group of outside investors contributed $19,800,000 for its non-controlling membership interest.
On March 5, 2013 HDM purchased from Health Diagnostics, LLC (“HD”) and certain of its subsidiaries, a business managing twelve (12) Stand-Up MRI Centers and two (2) other scanning centers located in the States of New York and Florida for a total purchase price (including consideration of $1.5 million to outside investors) aggregating $35.9 million. Concurrently with the acquisition, HDM entered into several consulting and non-competition agreements for a consideration of $4.1 million. The acquisition was accounted for using the purchase method in accordance with ASC 805, “Business Combinations”. The Company recognized and measured goodwill as of the acquisition date, as the excess of the fair value of the consideration paid over the fair value of the identified net assets acquired.
On January 8, 2015, the Company purchased 20% of the Class A members ownership interest at a cost of $4,971,094. The Company has a 60.4% ownership interest in HDM after this transaction.
| 66 |
FONAR CORPORATION AND SUBSIDIARIES
NOTES TO CONSOLIDATED FINANCIAL STATEMENTS
JUNE 30, 2018, 2017 and 2016
NOTE 9 – CONTROLLING AND NONCONTROLLNG INTERESTS (Continued)
Amount of each class of HDM members’ equity as of June 30, 2018, 2017 and 2016
| June 30, 2018 | June 30, 2017 | June 30, 2016 | ||||||||||||||||||||||
| Class A Members | Class B Member | Class A Members | Class B Member | Class A Members | Class B Member | |||||||||||||||||||
| Opening Members’ Equity | $ | 5,472,799 | $ | 27,988,982 | $ | 8,396,575 | $ | 23,314,842 | $ | 10,752,169 | $ | 22,043,621 | ||||||||||||
| Share of Net Income | 4,221,383 | 18,101,940 | 4,058,177 | 16,947,624 | 2,886,006 | 13,229,621 | ||||||||||||||||||
| Distributions | (6,135,000 | ) | (14,315,000 | ) | (6,981,953 | ) | (12,273,484 | ) | (5,241,600 | ) | (11,958,400 | ) | ||||||||||||
| Ending Members’ Equity | $ | 3,559,182 | $ | 31,775,922 | $ | 5,472,799 | $ | 27,988,982 | $ | 8,396,575 | $ | 23,314,842 | ||||||||||||
On May 2, 2011, the Company completed a private placement of equity and succeeded in raising $6,000,000. The offering consisted of Preferred Class A membership interests in a newly formed limited liability company, Imperial Management Services, LLC (“Imperial”). The Class B membership interests in Imperial, all of which were retained by the Company’s subsidiary, HMCA, hold a 75% equity interest in Imperial. The Class A membership interests are entitled to receive a dividend of 18% per annum of their cash capital contribution of $6,000,000. HMCA contributed all of its assets, together with its liabilities, to Imperial as HMCA’s capital contribution. The Imperial operating agreement provides for the Class A members to receive priority distributions until their original capital contributions are returned. Dividends are payable quarterly beginning August 1, 2011. On May 2, 2016, May 1, 2015 and on May 1, 2014, the Company returned a portion of the Class A Members capital contribution in the amount of $1,125,000, $1,125,000 and $1,125,100, respectively. As of June 30, 2016, the Company’s subsidiary, HMCA, now owns approximately 100% interest in Imperial Management Services.
Amount of each class of Imperial members’ equity as of June 30, 2016
| June 30, 2016 | ||||||||
| Class A Members | Class B Member | |||||||
| Opening Members’ Equity | $ | 1,279,446 | $ | 15,000,446 | ||||
| Share of Net Income | — | — | ||||||
| Distributions | (202,500 | ) | — | |||||
| Buyout | 48,054 | |||||||
| Redemption | (1,125,000 | ) | — | |||||
| Ending Members’ Equity | $ | — | $ | 15,000,446 | ||||
The Company has a 50% controlling interest in an entity which the Company consolidates, that provides management services to a diagnostic center in the New York Metropolitan area. The center began operations during January 2012. On June 30, 2016, the Company purchased the remaining 50% interest in the entity making it a wholly owned subsidiary for the Company. The Company paid $1,780,000 to acquire this additional ownership interest.
| 67 |
FONAR CORPORATION AND SUBSIDIARIES
NOTES TO CONSOLIDATED FINANCIAL STATEMENTS
JUNE 30, 2018, 2017 and 2016
NOTE 10 - LONG-TERM DEBT, NOTES PAYABLE AND CAPITAL LEASES
Long-term debt, notes payable and capital leases consist of the following:
| 2018 | 2017 | |||||||
| Note payable requiring monthly payments of interest at a rate of 7% until May 2009 followed by 240 monthly payments of $4,472 through October 2026. The loan is collateralized by a building with a net book value of $515,834 as of June 30, 2018. | $ | 336,781 | $ | 365,406 | ||||
| The revolving credit note was extended to September 2018. The Company can prepay the loan in whole or part in multiples of $100,000 at any time without penalty. The note bears interest at a rate of 4% per annum and is payable monthly. The loan is collateralized by substantially all of the Company’s assets. The loan also contains certain financial covenants that must be met on a periodic basis. The note was paid in full September 2, 2014. The Company still has the ability to draw down on the line. | — | — | ||||||
| Note payable requiring 12 consecutive interest only payments commencing at the inception of the loan followed by 48 consecutive monthly payments, commencing May 1, 2014. The note bears interest at a rate of 4.75% per annum and is payable monthly. The loan is collateralized by substantially all of the Company’s assets. The loan also contains certain financial covenants that must be met on a periodic basis. | — | 143,676 | ||||||
| Other (including capital leases for property and equipment). | 7,586 | 7,769 | ||||||
| 344,367 | 516,851 | |||||||
| Less: Current portion | 38,332 | 180,090 | ||||||
| $ | 306,035 | $ | 336,761 | |||||
The maturities of long-term debt over the next five years and thereafter are as follows:
| Years Ending June 30, | ||||||
| 2019 | $ | 38,332 | ||||
| 2020 | 32,944 | |||||
| 2021 | 35,416 | |||||
| 2022 | 38,013 | |||||
| 2023 | 40,820 | |||||
| Thereafter | 158,842 | |||||
| $ | 344,367 | |||||
| 68 |
FONAR CORPORATION AND SUBSIDIARIES
NOTES TO CONSOLIDATED FINANCIAL STATEMENTS
JUNE 30, 2018, 2017 and 2016
NOTE 11 - INCOME TAXES
ASC topic 740 prescribes a recognition threshold and a measurement attribute for the financial statement recognition and measurement of tax positions taken or expected to be taken in a corporate tax return. For those benefits to be recognized, a tax position must be more-likely-than-not to be sustained upon examination by taxing authorities. Differences between tax positions taken or expected to be taken in a tax return and the benefit recognized and measured pursuant to the interpretation are referred to as unrecognized benefits. A liability is recognized (or amount of net operating loss carryforward or amount of tax refundable is reduced) for an unrecognized tax benefit because it represents an enterprise’s potential future obligation to the taxing authority for a tax position that was not recognized as a result of applying the provisions of ASC topic 740. The Company believes there are no uncertain tax positions in prior years tax filings and therefore it has not recorded a liability for unrecognized tax benefits.
In accordance with ASC topic 740, interest costs related to unrecognized tax benefits are required to be calculated (if applicable) and would be classified as “Interest expense, net. Penalties if incurred would be recognized as a component of “Selling, general and administrative” expenses.
The Company files corporate income tax returns in the United States (federal) and in various state and local jurisdictions. In most instances, the Company is no longer subject to federal, state and local income tax examinations by tax authorities for years prior to 2014.
The Company has recorded a deferred tax asset of $22,689,011 and a deferred tax liability of $239,011 as of June 30, 2018, primarily relating to its net operating loss carryforwards of approximately $82,662,000 available to offset future taxable income through 2030. The net operating losses begin to expire in 2021 for federal tax and state income tax purposes.
Future ownership changes as determined under Section 382 of the Internal Revenue code could further limit the utilization of net operating loss carryforwards. As of June 30, 2018, no such changes in ownership have occurred.
The ultimate realization of deferred tax assets is dependent on the generation of future taxable income during the periods in which temporary differences become deductible or when such net operating losses can be utilized. The Company considers projected future taxable income, the regulatory environment of the industry, and tax planning strategies in making this assessment. At present, the Company believes that it is more likely than not that the benefits from certain deferred tax asset carryforwards, will not all be fully realized. In recognition of this inherent risk, a valuation allowance was established for the partial value of the deferred tax asset, (principally related to research and development tax credits and allowance for doubtful accounts).
A valuation allowance will be maintained until sufficient positive evidence exists to support the reversal of the remainder of the valuation.
The valuation allowance for deferred tax assets decreased during the year ended June 30, 2018, by approximately $27,600,000, of which $16,000,000 was the result of the revalued deferred tax assets due to the Tax Cuts and Jobs Act and the benefits expected to be realized from the usage of net operating losses given the Company’s current and projected profitable operations. The valuation allowance decreased by approximately $11,131,000 during the year ended June 30, 2017.
| 69 |
FONAR CORPORATION AND SUBSIDIARIES
NOTES TO CONSOLIDATED FINANCIAL STATEMENTS
JUNE 30, 2018, 2017 and 2016
NOTE 11 - INCOME TAXES (Continued)
Components of the benefit for income taxes are as follows:
| Years Ended June 30, | ||||||||||||
| 2018 | 2017 | 2016 | ||||||||||
| Current: | ||||||||||||
| Federal | $ | 185,000 | $ | 250,000 | $ | 360,496 | ||||||
| State | 265,000 | 357,235 | — | |||||||||
| Federal deferred taxes | (4,132,590 | ) | (4,552,702 | ) | (4,368,901 | ) | ||||||
| State deferred taxes | (787,160 | ) | (416,967 | ) | (278,866 | ) | ||||||
| AMT Credits | (1,200,000 | ) | — | — | ||||||||
| $ | (5,669,750 | ) | $ | (4,362,434 | ) | $ | (4,287,271 | ) | ||||
A reconciliation of the federal statutory income tax rate to the Company's effective tax rate as reported is as follows:
| Years Ended June 30, | ||||||||||||
| 2018 | 2017 | 2016 | ||||||||||
| Taxes at federal statutory rate | 27.7 | % | 35.0 | % | 35.0 | % | ||||||
| State and local income taxes (benefit), net of federal benefit | 4.0 | % | 4.0 | % | 6.0 | % | ||||||
| Permanent differences | 0.1 | % | 0.1 | % | 0.2 | % | ||||||
| Tax Cuts and Jobs Act Rate Change | (33.9 | )% | (0.0 | )% | (0.0 | )% | ||||||
| Decrease in the valuation allowance | (24.5 | )% | (73.0 | )% | (89.8 | )% | ||||||
| AMT Credits | (8.5 | )% | (0.0 | )% | (0.0 | )% | ||||||
| True ups | (2.8 | )% | 5.0 | % | (0.0 | )% | ||||||
| Effective income tax rate | (37.9 | )% | (28.9 | )% | (48.6 | )% | ||||||
The Tax Cuts and Jobs Act was signed into law on December 22, 2017 and makes numerous changes to the Internal Revenue Code. Among other changes, the Act reduces the US corporate income tax rate to 21% effective January 1, 2018. Because the Act became effective mid-way through the Company’s tax year, the Company will have a US statutory income tax rate of 27.7% for the fiscal 2018 and will have a 21% statutory income tax rate for fiscal years thereafter.
Under ASC740, Accounting for Income Taxes, the enactment of the Tax Act also requires companies, to recognize the effects of changes in tax laws and rates on deferred tax assets and liabilities and the retroactive effects of changes in tax laws in the period in which the new legislation is enacted. The Company’s gross deferred tax assets and liabilities we revalued from 35% to 21%. Deferred tax assets of $46.2 million (as of the enactment effective date) were revalued to approximately $30.2 million with a corresponding decrease to the Company’s valuation allowance.
As of June 30, 2018, the Company has net operating loss (“NOL”) carryforwards of approximately $82,662,000 that will be available to offset future taxable income. The utilization of certain of the NOLs is limited by separate return limitation year rules pursuant to Section 1502 of the Internal Revenue Code.
| 70 |
FONAR CORPORATION AND SUBSIDIARIES
NOTES TO CONSOLIDATED FINANCIAL STATEMENTS
JUNE 30, 2018, 2017 and 2016
NOTE 11 - INCOME TAXES (Continued)
The Company has, for federal income tax purposes, research and development tax credit carryforwards aggregating $4,257,000. However, the realization of these credits may be limited as a result of expiring prior to their utilization. These credits can only be applied after all net operating losses have been used. As such, the Company has established a valuation reserve for anticipated unused credits of $3,130,000.
Also at June 30, 2018, the Company has $1,200,000 in alternative minimum tax credit carryovers. In connection with tax reform, these credits have been eliminated. Tax reform allows for corporations to carryover such unused tax credits to offset regular tax or apply for a cash refund. As of June 30, 2018, the Company recorded an income tax receivable for expected cash refunds. The Company anticipates receiving its first installment of reimbursement of $600,000 with the filiing of its June 30, 2019 income tax return to be filed in fiscal 2020.
In addition, for New York State income tax purposes, the Company has tax credit carryforwards aggregating approximately $1,134,000 which, are accounted for under the flow-through method. The utilization of these credits is also expected to be limited.
Significant components of the Company's deferred tax assets and liabilities at June 30, 2018 and 2017 are as follows:
| June 30, | ||||||||
| 2018 | 2017 | |||||||
| Deferred tax assets: | ||||||||
| Allowance for doubtful accounts | $ | 3,262,504 | $ | 6,255,976 | ||||
| Non-deductible accruals | 752,595 | 273,435 | ||||||
| Net operating carryforwards | 20,665,597 | 39,330,708 | ||||||
| Tax credits | 4,330,769 | 5,744,086 | ||||||
| Inventory | 55,514 | 130,430 | ||||||
| Property and equipment and depreciation | 213,781 | 298,426 | ||||||
| 29,280,760 | 52,033,061 | |||||||
| Valuation allowance | (6,591,749 | ) | (34,171,284 | ) | ||||
| Total deferred tax assets | 22,689,011 | 17,861,777 | ||||||
| Intangibles | (239,011 | ) | (331,527 | ) | ||||
| Total deferred tax liabilities | (239,011 | ) | (331,527 | ) | ||||
| Net deferred tax asset | $ | 22,450,000 | $ | 17,530,250 | ||||
| 71 |
FONAR CORPORATION AND SUBSIDIARIES
NOTES TO CONSOLIDATED FINANCIAL STATEMENTS
JUNE 30, 2018, 2017 and 2016
NOTE 12 - OTHER CURRENT LIABILITIES
Included in other current liabilities are the following:
| June 30, | ||||||||
| 2018 | 2017 | |||||||
| Accrued salaries, commissions and payroll taxes | $ | 3,438,087 | $ | 1,138,545 | ||||
| Litigation accruals | 145,029 | 145,029 | ||||||
| Sales tax payable | 2,092,403 | 2,282,042 | ||||||
| Legal and other professional fees | 119,262 | 295,570 | ||||||
| Accounting fees | 125,000 | 153,750 | ||||||
| Self-funded health insurance reserve | 79,129 | 92,397 | ||||||
| Accrued interest and penalty | 1,497,429 | 2,341,667 | ||||||
| Other | 681,656 | 754,278 | ||||||
| $ | 8,177,995 | $ | 7,203,278 | |||||
NOTE 13 - COMMITMENTS AND CONTINGENCIES
Leases
The Company rents its operating facilities and certain equipment, pursuant to operating lease agreements expiring at various dates through November 2026. The leases for certain facilities contain escalation clauses relating to increases in real property taxes as well as certain maintenance costs.
Future minimum operating lease commitments consisted of the following at June 30, 2018:
| Year
Ending June 30, | Facilities
And Equipment (Operating Lease) | |||||
| 2019 | $ | 4,283,452 | ||||
| 2020 | 3,644,287 | |||||
| 2021 | 3,261,226 | |||||
| 2022 | 2,433,479 | |||||
| 2023 | 2,001,906 | |||||
| Thereafter | 5,462,651 | |||||
| Total minimum obligations | $ | 21,087,001 | ||||
Rent expense for operating leases approximated $4,762,000, $4,505,000 and $4,222,000, for the years ended June 30, 2018, 2017 and 2016, respectively.
The Company received approval from the Suffolk County IDA on February 29, 2016 of a 50% property tax abatement, valued at $440,000, over a 10 year period commencing January 2017.
| 72 |
FONAR CORPORATION AND SUBSIDIARIES
NOTES TO CONSOLIDATED FINANCIAL STATEMENTS
JUNE 30, 2018, 2017 and 2016
NOTE 13 - COMMITMENTS AND CONTINGENCIES (Continued)
Employee Benefit Plans
The Company has a non-contributory 401(k) Plan (the “401(k) Plan”). The 401(k) Plan covers all non-union employees who are at least 21 years of age with no minimum service requirements. There were no employer contributions to the Plan for the years ended June 30, 2018, 2017 and 2016.
The stockholders of the Company approved the 2000 Employee Stock Purchase Plan (“ESPP”) at the Company’s annual stockholders’ meeting in April 2000. The ESPP provides for eligible employees to acquire common stock of the Company at a discount, not to exceed 15%. This plan has not been put into effect as of June 30, 2018.
Stipulation Agreements
The Company has entered into stipulation agreements with a number of its creditors that in the aggregate total $193,979, which is included in other current liabilities and other liabilities on the Company’s balance sheet as of June 30, 2018. The monthly payments total $15,859.
Litigation
The Company is subject to legal proceedings and claims arising from the ordinary course of its business, including personal injury, customer contract and employment claims. In the opinion of management, the aggregate liability, if any, with respect to such actions, will not have a material adverse effect on the consolidated financial position or results of operations of the Company.
Matt Malek Madison v. Fonar Corporation, United States District Court, Northern District of California, was commenced by plaintiff on August 27, 2007 to recover a down payment for a scanner in the amount of $300,000, with interest. The plaintiff sought costs of suit and attorney’s fees as well. The Company answered the complaint and sued the plaintiff for breach of contract in the amount of $450,000. Although down payments are usually expressly non-refundable in the Company’s quotations and agreements, in this case, the quotation contemplated the sale of four scanners, and provided that the deposit would be refundable with interest, if the customer were unable to find suitable locations in the San Francisco Bay area. The issue was whether the customer made a good faith effort to find locations; the Company’s position was that the customer did not. The case went to trial before a judge; the parties submitted post-trial briefs, and judgment was awarded to the plaintiff. The Company appealed the trial court’s decision, but on January 31, 2012, the U.S. Court of Appeals for the 9th Circuit affirmed the lower court’s decision awarding the plaintiff the $300,000 deposit with prejudgment interest from July 1, 2006. The Company sought to have the Court of Appeals reconsider the decision en banc, (by all or a larger number of the judges on the Circuit Court of Appeals), but this was not granted. During October 2016, the Company settled with the plaintiff for $300,000.
Shapiro v. Fonar Corporation, New York Supreme Court, Suffolk County. Previously, The Company and Dr. Shapiro had settled an action commenced in Nassau County under the same name. The amount remaining payable under the settlement agreement according to the Company’s records is $258,400, but the payment and timing of the payment was dependent on obtaining an order for an Upright® MRI Scanner for the Company and the making of installment payments thereunder by the customer. Briefly stated, the balance of $258,400 was and is not yet due. Dr. Shapiro claims that the Company was in breach of the settlement agreement and seeks payment of no less than $307,000 plus interest and attorneys’ fees. The Company believes it has scrupulously observed the terms of the settlement agreement and that Dr. Shapiro’s claims are without merit. The Company answered the Complaint and is now in discovery. The case was settled for $258,400 plus interest on February 18, 2016.
| 73 |
FONAR CORPORATION AND SUBSIDIARIES
NOTES TO CONSOLIDATED FINANCIAL STATEMENTS
JUNE 30, 2018, 2017 and 2016
NOTE 13 - COMMITMENTS AND CONTINGENCIES (Continued)
Other Matters
The Company is also delinquent in filing sales tax returns for certain states, for which the Company has transacted business. The Company has recorded tax obligations of approximately $2,092,000 plus interest and penalties of approximately $1,452,000. The Company is in the process of determining its regulatory requirements in order to become compliant.
The Company maintains a self-funded health insurance program with a stop-loss umbrella policy with a third party insurer to limit the maximum potential liability for individual claims to $100,000 per person and for a maximum potential claim liability based on member enrollment. With respect to this program, the Company considers historical and projected medical utilization data when estimating its health insurance program liability and related expense. As of June 30, 2018 and 2017, the Company had approximately $79,000 and $92,000, respectively, in reserve for its self-funded health insurance programs. The reserves are included in “Other current liabilities” in the consolidated balance sheets.
The Company regularly analyzes its reserves for incurred but not reported claims, and for reported but not paid claims related to its reinsurance and self-funded insurance programs. The Company believes its reserves are adequate. However, significant judgment is involved in assessing these reserves such as assessing historical paid claims, average lags between the claims’ incurred date, reported dates and paid dates, and the frequency and severity of claims. There may be differences between actual settlement amounts and recorded reserves and any resulting adjustments are included in expense once a probable amount is known. There were no significant adjustments recorded in the years covered by this report.
NOTE 14 - SUPPLEMENTAL CASH FLOW INFORMATION
During the years ended June 30, 2018, 2017 and 2016, the Company paid $44,767, $162,022 and $356,106 for interest, respectively.
During the years ended June 30, 2018, 2017 and 2016, the Company paid $345,000, $739,889 and $360,496 for income taxes, respectively.
During the year ended June 30, 2017, the Company issued 106,600 shares of common stock for costs and expenses totaling $2,239,292.
| 74 |
FONAR CORPORATION AND SUBSIDIARIES
NOTES TO CONSOLIDATED FINANCIAL STATEMENTS
JUNE 30, 2018, 2017 and 2016
NOTE 15 – DUE TO RELATED PARTY MEDICAL PRACTICES
In June 2009, an entity owned by the Company’s Chairman of the Board, Tallahassee Scanning Services PA, sold its Upright® MRI scanning system to the Company for $550,000 in exchange for 35 monthly payments of $18,769 to be made over a three year period, commencing October 18, 2009 including interest at a rate of 10.41% per annum. The Company used this scanning system to fulfill a sales order with an unrelated customer. The unpaid balance of as of June 30, 2018 and 2017 was $134,880.
Other Related Party Transactions
The CEO and President of the Company is a minority owner of a billing company, which performs billing and collection services with respect to No-Fault and Workers’ Compensation claims of the Company’s clients. The monthly fee charged to the Company is $85,000. On June 1, 2017, the Company also entered into a one year renewable agreement to provide IT services to the billing company for a monthly fee of $23,884. The agreement was renewed on June 1, 2018 for another year.
Bensonhurst MRI Limited Partnership, in which the CEO and President of the Company holds an interest, is party to an agreement with the Company for the service and maintenance of its Upright MRI Scanner for a price of $110,000 per annum.
A limited liability company of which the CEO and President of the Company is an owner also had a 1.375% interest in Yonkers Diagnostic Management, LLC, a 4.5% interest in Turnkey Services of New York, LLC and a 4.3% interest in TK2 Equipment Management, LLC. Entities in which the Executive Vice President and COO and his family had an interest had a 0.75% in Yonkers and a 5.9% in TK2 Equipment Management . The Company acquired these entities, or the portion thereof not already owned by the Company, through a series of merger transactions for $1,780,000 in the case of Yonkers, $1,147,715 in the case of Turnkey Services and $3,075,852 in the case of TK2 Equipment Management.
A company of which the CEO and President of the Company is an owner and a company in which the Executive Vice President and COO has an interest also hold a 1.7% and 2.8% interest, respectively, in Turnkey Management of Great Neck, LLC, an entity for which the Company performed management services. The Company acquired this through a merger transaction for $1,312,766.
A company in which the CEO and President of the Company is an owner, also had a 14.967% interest in Imperial’s Class A membership interests and has a 6.06% interest in Health Management Company of America’s Class A membership interests. A company in which the Executive Vice President and COO and his family have an interest, had a 12.917% interest in Imperial’s Class A membership interests and has a 2.5% interest in Health Management Company of America’s Class A membership interests. The Company repurchased Imperial’s outstanding Class A memberships on May 1, 2016. An entity of a son of the Company’s Chairman of the Board and CEO and President of the Company received $179,000 for its interests and the Executive Vice President and COO company received $105,000 for its interests.
| 75 |
FONAR CORPORATION AND SUBSIDIARIES
NOTES TO CONSOLIDATED FINANCIAL STATEMENTS
JUNE 30, 2018, 2017 and 2016
NOTE 16 - SEGMENT AND RELATED INFORMATION
The Company provides segment data in accordance with the provisions of ASC topic 280, “Disclosures about Segments of an Enterprise and Related Information”.
The Company operates in two industry segments - manufacturing and the servicing of medical equipment and management of diagnostic imaging centers.
The accounting policies of the segments are the same as those described in the summary of significant accounting policies. All intersegment sales are market-based. The Company evaluates performance based on income or loss from operations.
Summarized financial information concerning the Company’s reportable segments is shown in the following table:
| Manufacturing and Servicing of Medical Equipment | Management of Diagnostic Imaging Centers | Totals | ||||||||||
| Fiscal 2018: | ||||||||||||
| Net revenues from external customers | $ | 9,837,269 | $ | 71,678,725 | $ | 81,515,994 | ||||||
| Intersegment net revenues * | $ | 901,250 | $ | — | $ | 901,250 | ||||||
| (Loss) Income from operations | $ | (2,982,778 | ) | $ | 22,666,989 | $ | 19,684,211 | |||||
| Depreciation and amortization | $ | 353,307 | $ | 3,546,544 | $ | 3,899,851 | ||||||
| Compensatory element of stock issuances | $ | — | $ | — | $ | — | ||||||
| Total identifiable assets | $ | 32,364,298 | $ | 85,946,647 | $ | 118,310,945 | ||||||
| Capital expenditures | $ | 346,608 | $ | 2,540,169 | $ | 2,886,777 | ||||||
| Fiscal 2017: | ||||||||||||
| Net revenues from external customers | $ | 11,219,188 | $ | 66,817,398 | $ | 78,036,586 | ||||||
| Intersegment net revenues * | $ | 1,200,000 | $ | — | $ | 1,200,000 | ||||||
| (Loss) Income from operations | $ | (2,292,312 | ) | $ | 21,388,392 | $ | 19,096,080 | |||||
| Depreciation and amortization | $ | 324,550 | $ | 3,209,014 | $ | 3,533,564 | ||||||
| Compensatory element of stock issuances | $ | 2,397,276 | $ | — | $ | 2,397,276 | ||||||
| Total identifiable assets | $ | 29,103,809 | $ | 69,658,676 | $ | 98,762,566 | ||||||
| Capital expenditures | $ | 212,983 | $ | 2,793,331 | $ | 3,006,314 | ||||||
| Fiscal 2016: | ||||||||||||
| Net revenues from external customers | $ | 10,783,618 | $ | 62,584,592 | $ | 73,368,210 | ||||||
| Intersegment net revenues * | $ | 2,140,000 | $ | — | $ | 2,140,000 | ||||||
| (Loss) Income from operations | $ | (1,979,497 | ) | $ | 16,335,113 | $ | 14,355,616 | |||||
| Depreciation and amortization | $ | 320,843 | $ | 2,976,446 | $ | 3,297,289 | ||||||
| Compensatory element of stock issuances | $ | 2,006 | $ | — | $ | 2,006 | ||||||
| Total identifiable assets | $ | 28,241,501 | $ | 56,646,105 | $ | 84,887,606 | ||||||
| Capital expenditures | $ | 437,695 | $ | 387,593 | $ | 825,288 | ||||||
* Amounts eliminated in consolidation
| 76 |
FONAR CORPORATION AND SUBSIDIARIES
NOTES TO CONSOLIDATED FINANCIAL STATEMENTS
JUNE 30, 2018, 2017 and 2016
NOTE 16 - SEGMENT AND RELATED INFORMATION (Continued)
Export Product Sales
The Company’s areas of operations are principally in the United States. The Company had export sales of medical equipment amounting to 41.5%, 55.9% and 19.6% of product sales revenues to third parties for the years ended June 30, 2018, 2017 and 2016, respectively.
The foreign product sales, as a percentage of product sales to unrelated parties, were made to customers in the following countries:
| For the Years Ended June 30, | ||||||||||||
| 2018 | 2017 | 2016 | ||||||||||
| United Arab Emirates | 7.1 | % | 45.4 | % | -% | |||||||
| Switzerland | — | — | — | |||||||||
| Canada | — | — | 0.3 | |||||||||
| England | 29.9 | 4.8 | 18.5 | |||||||||
| Germany | 4.5 | — | .6 | |||||||||
| Puerto Rico | — | 5.7 | .2 | |||||||||
| 41.5 | % | 55.9 | % | 19.6 | % | |||||||
Foreign Service and Repair Fees
The Company’s areas of service and repair are principally in the United States. The Company had foreign revenues of service and repair of medical equipment amounting to 5.0%, 4.6% and 5.8% of consolidated net service and repair fees for the years ended June 30, 2018, 2017 and 2016, respectively. Foreign service and repair fees, as a percentage of total service and repair fees, were provided principally to the following countries:
| For the Years Ended June 30, | ||||||||||||
| 2018 | 2017 | 2016 | ||||||||||
| Spain | -% | -% | 0.3 | % | ||||||||
| Puerto Rico | 1.5 | 1.2 | 1.5 | |||||||||
| Switzerland | 0.2 | 0.2 | 0.3 | |||||||||
| Germany | 1.3 | 1.4 | 1.5 | |||||||||
| England | 0.6 | 0.5 | 0.5 | |||||||||
| United Arab Emirates | 0.3 | — | — | |||||||||
| Canada | — | 0.1 | 0.3 | |||||||||
| Greece | 0.2 | 0.2 | 0.2 | |||||||||
| Australia | 0.9 | 1.0 | 1.2 | |||||||||
| 5.0 | % | 4.6 | % | 5.8 | % | |||||||
The Company does not have any material assets outside of the United States.
| 77 |
FONAR CORPORATION AND SUBSIDIARIES
NOTES TO CONSOLIDATED FINANCIAL STATEMENTS
JUNE 30, 2018, 2017 and 2016
NOTE 17 – ALLOWANCE FOR DOUBTFUL ACCOUNTS
The following represents a summary of allowance for doubtful accounts for the years ended June 30, 2018, 2017 and 2016, respectively:
| Description | Balance June 30, 2017 | Additions (1) | Deductions | Balance June 30, 2018 | ||||||||||||
| Accounts receivable | $ | 190,244 | $ | — | $ | — | $ | 190,244 | ||||||||
| Management and other fees receivable | 12,859,750 | (1,744,064 | ) | 132,664 | 10,983,022 | |||||||||||
| Management and other fees receivable - related medical practices | 582,001 | 1,129,384 | — | 1,711,385 | ||||||||||||
| Medical receivables | 19,853,318 | 17,896,528 | 15,022,148 | 22,727,698 | ||||||||||||
| Description | Balance June 30, 2016 | Additions | Deductions | Balance June 30, 2017 | ||||||||||||
| Accounts receivables | $ | 284,279 | $ | — | $ | 94,035 | $ | 190,244 | ||||||||
| Management and other fees receivable | 13,553,005 | (104,424 | ) | 588,831 | 12,859,750 | |||||||||||
| Management and other fees receivable - related medical practices | 392,505 | 582,001 | 392,505 | 582,001 | ||||||||||||
| Medical receivables | 17,451,782 | 16,171,434 | 12,547,160 | 19,853,318 | ||||||||||||
| Description | Balance June 30, 2015 | Additions | Deductions | Balance June 30, 2016 | ||||||||||||
| Accounts receivables | $ | 362,362 | $ | — | $ | 78,083 | $ | 284,279 | ||||||||
| Management and other fees receivable | 12,879,149 | 673,856 | — | 13,553,005 | ||||||||||||
| Management and other fees receivable - related medical practices | 403,047 | — | 10,542 | 392,505 | ||||||||||||
| Medical receivables | 15,459,156 | 14,539,786 | 12,547,160 | 17,451,782 | ||||||||||||
(1) Included in provision for bad debts.
| 78 |
FONAR CORPORATION AND SUBSIDIARIES
NOTES TO CONSOLIDATED FINANCIAL STATEMENTS
JUNE 30, 2018, 2017 and 2016
NOTE 18 - QUARTERLY FINANCIAL DATA (UNAUDITED)
(000’s omitted, except per share data)
| September 30, 2017 | December 31, 2017 | March 31, 2018 | June 30, 2018 | Total | ||||||||||||||||
| Total Revenues – Net | $ | 19,334 | $ | 20,168 | $ | 20,979 | $ | 21,035 | $ | 81,516 | ||||||||||
| Total Costs and Expenses | 14,549 | 14,358 | 16,577 | 16,348 | 61,832 | |||||||||||||||
| Net Income | 4,601 | 5,240 | 4,262 | 11,349 | 25,452 | |||||||||||||||
| Basic Net Income Per Common Share Available to Common Stockholders | $ | 0.55 | $ | 0.62 | $ | 0.52 | $ | 1.47 | $ | 3.16 | ||||||||||
| Diluted Net Income Per Common Share Available to Common Stockholders | $ | 0.54 | $ | 0.61 | $ | 0.51 | $ | 1.44 | $ | 3.10 | ||||||||||
| September 30, 2016 | December 31, 2016 | March 31, 2017 | June 30, 2017 | Total | ||||||||||||||||
| Total Revenues – Net | $ | 18,734 | $ | 18,403 | $ | 20,008 | $ | 20,892 | $ | 78,037 | ||||||||||
| Total Costs and Expenses | 13,981 | 13,794 | 14,006 | 17,160 | 58,941 | |||||||||||||||
| Net Income | 4,500 | 4,934 | 7,122 | 7,123 | 23,679 | |||||||||||||||
| Basic Net Income Per Common Share Available to Common Stockholders | $ | 0.55 | $ | 0.64 | $ | 0.90 | $ | 0.89 | $ | 2.98 | ||||||||||
| Diluted Net Income Per Common Share Available to Common Stockholders | $ | 0.54 | $ | 0.63 | $ | 0.88 | $ | 0.87 | $ | 2.92 | ||||||||||
| 79 |
FONAR CORPORATION AND SUBSIDIARIES
NOTES TO CONSOLIDATED FINANCIAL STATEMENTS
JUNE 30, 2018, 2017 and 2016
NOTE 19 – BUSINESS COMBINATIONS
Acquisitions
On June 15, 2017, the Company purchased 100% interest in Turnkey Equipment Management of Great Neck, LLC. The consideration and net assets acquired is as follows:
| Cash Paid | $ | 1,312,769 | ||
| Security deposit | 23,775 | |||
| Total Consideration | 1,336,544 | |||
| Net assets at Fair Value | 731,582 | |||
| Goodwill | $ | 604,962 |
On March 20, 2017, the Company purchased 100% interest in Radwell Leasing LLC and Radwell LLC. The net assets acquired and consideration is as follows:
| Diagnostic Equipment | $ | 544,375 | ||
| Leasehold Improvements | 126,237 | |||
| Total Net Assets Acquired | $ | 670,612 |
| Stock issued as consideration | $ | 791,210 | ||
| Less cash received - Net | (120,598 | ) | ||
| Total Consideration | $ | 670,612 |
On June 30, 2016, the Company purchased 100% interest in TK2 Equipment Management, LLC and Turnkey Services of New York, LLC. The consideration and net assets acquired is as follows:
| Cash Paid | $ | 4,223,567 | ||
| Net assets at Fair Value | 2,861,507 | |||
| Goodwill | $ | 1,555,060 |
| 80 |
FONAR CORPORATION AND SUBSIDIARIES
NOTES TO CONSOLIDATED FINANCIAL STATEMENTS
JUNE 30, 2018, 2017 and 2016
NOTE 19 – BUSINESS COMBINATIONS (Continued)
Pro forma Results
The following unaudited pro forma results of operations for the twelve months ended June 30, 2016 assumes that the TK2 Equipment Management LLC and Turnkey Services of New York LLC acquisitions were made at the beginning of the year prior to acquisition. The unaudited pro forma information does not purport to be indicative of the results that would have been obtained if the acquisitions had actually occurred at the beginning of the year prior to acquisition, nor of the results that may be reported in the future. The results of operations of Radwell Leasing LLC, Radwell LLC and Turnkey Equipment of Great Neck LLC were diminutive and did not affect the proforma results of operations.
| Year ended June 30, 2016 | ||||
| Total Revenues – Net | $ | 73,368,210 | ||
| Net Income - Controlling Interests | $ | 16,088,263 | ||
| Net Income Available to Common Stockholders | $ | 15,042,842 | ||
| Net Income Available to Class A Non-Voting Preferred Stockholders | $ | 779,173 | ||
| Net Income Available to Class C Common Stockholders | $ | 266,248 | ||
| Basic Net Income Per Common Share Available to Common Stockholders | $ | 2.49 | ||
| Diluted Net Income Per Common Share Available to Common Stockholders | $ | 2.43 | ||
| Basic and Diluted Income Per Share - Common C | $ | 0.70 | ||
| Weighted Average Basic Shares Outstanding | 6,050,893 | |||
| Weighted Average Diluted Shares Outstanding | 6,178,397 | |||
| Weighted Average Basic and Diluted Shares Outstanding - Class C Common | 382,513 | |||
NOTE 20 – SUBSEQUENT EVENTS
The Company evaluates events that have occurred after the balance sheet date, but before the consolidated financial statements are issued.
Subsequent to June 30, 2018, the Company issued 64,416 shares of common stock as payment of approximately $1.8 million in other current liabilities.
| 81 |
FONAR CORPORATION AND SUBSIDIARIES
ITEM 9. CHANGES IN AND DISAGREEMENTS WITH ACCOUNTANTS ON ACCOUNTING AND FINANCIAL DISCLOSURE.
There have been no disagreements with our independent registered public accounting firm or other matters requiring disclosure under Regulation S-K, Item 304(b).
ITEM 9A. CONTROLS AND PROCEDURES
Evaluation of Disclosure Controls and Procedures
We maintain a system of disclosure controls and procedures (as defined in the Rules 13a-15(e) and 15(d)-15(e) under the Securities Exchange Act of 1934, as amended (the “Exchange Act”)) that is designed to ensure that information required to be disclosed in our Exchange Act reports is recorded, processed, summarized and reported within the time periods specified in the Securities and Exchange Commission’s rules and forms, and that such information is accumulated and communicated to our management, including our Principal Executive Officer and Principal Financial Officer, as appropriate, to allow timely decisions regarding required disclosures.
Under the supervision and with the participation of our management, including our Principal Executive Officer and Principal Financial Officer, we conducted an evaluation of our disclosure controls and procedures pursuant to Rule 13a-15 under the Exchange Act. Based upon the foregoing evaluation, our Principal Executive Officer and our Principal Financial Officer concluded that as of June 30, 2018 our disclosure controls and procedures were effective at the reasonable assurance level.
Changes in Internal Control over Financial Reporting
There have not been any changes in our internal control over financial reporting (as such term is defined in Rules 13a-15(f) and 15d-15(f) under the Exchange Act) during the fourth fiscal quarter to which this report relates that materially affected, or are reasonably likely to materially affect, our internal control over financial reporting.
Report of Management on Internal Control over Financial Reporting
Our management is responsible for establishing and maintaining adequate internal control over financial reporting (as such term is defined in Rules 13a-15(f) and 15d-15(f) under the Exchange Act). Under the supervision and with the participation of management, including our Principal Executive Officer and Principal Financial Officer, we conducted an evaluation of the effectiveness of our internal control over financial reporting based on criteria established in Internal Control—Integrated Framework issued by the Committee of Sponsoring Organizations of the Treadway Commission (2013 framework) issued by the Committee of Sponsoring Organizations of the Treadway Commission. Based on our evaluation, our management concluded that our internal control over financial reporting was effective as of June 30, 2018.
Our independent registered public accounting firm, Marcum LLP, has audited the effectiveness of our internal control over financial reporting as of June 30, 2018, as stated in their report which is included in the Financial Statement Schedules of this Annual Report on Form 10-K.
Limitations on Effectiveness of Controls and Procedures
Our management, including our Principal Executive Officer and Principal Financial Officer, does not expect that our disclosure controls and procedures or our internal control over financial reporting will prevent or detect all errors and all fraud. A control system, no matter how well-designed and operated, can provide only reasonable, not absolute, assurance that the control system’s objectives will be met. The design of a control system must reflect the fact that there are resource constraints, and the benefits of controls must be considered relative to their costs. Further, because of the inherent limitations in all control systems, no evaluation of controls can provide absolute assurance that misstatements due to error or fraud will not occur or that all control issues and instances of fraud, if any, have been detected. The design of any system of controls is based in part on certain assumptions about the likelihood of future events, and there can be no assurance that any design will succeed in achieving its stated goals under all potential future conditions. Projections of any evaluation of the effectiveness of controls to future periods are subject to risks. Over time, controls may become inadequate because of changes in conditions or deterioration in the degree of compliance with policies or procedures.
| 82 |
REPORT OF INDEPENDENT REGISTERED PUBLIC ACCOUNTING FIRM ON INTERNAL CONTROL OVER FINANCIAL REPORTING
To the Board of Directors and Stockholders of
FONAR Corporation and Subsidiaries
Opinion on Internal Control over Financial Reporting
We have audited FONAR Corporation and Subsidiaries' (the “Company”) internal control over financial reporting as of June 30, 2018, based on criteria established in Internal Control-Integrated Framework (2013) issued by the Committee of Sponsoring Organizations of the Treadway Commission. In our opinion, the Company maintained, in all material respects, effective internal control over financial reporting as of June 30, 2018, based on criteria established in Internal Control – Integrated Framework (2013) issued by the Committee of Sponsoring Organizations of the Treadway Commission.
We have also audited, in accordance with the standards of the Public Company Accounting Oversight Board (United States) (“PCAOB”), the consolidated balance sheets as of June 30, 2018 and 2017, and the related consolidated statements of income, shareholders’ equity, and cash flows for each of the three years in the period ended June 30, 2018 of the Company and our report dated September 20, 2018 expressed an unqualified opinion on those financial statements.
Basis for Opinion
The Company's management is responsible for maintaining effective internal control over financial reporting, and for its assessment of the effectiveness of internal control over financial reporting, included in the accompanying “Management Annual Report on Internal Control over Financial Reporting”. Our responsibility is to express an opinion on the Company's internal control over financial reporting based on our audit. We are a public accounting firm registered with the PCAOB and are required to be independent with respect to the Company in accordance with the U.S. federal securities laws and the applicable rules and regulations of the Securities and Exchange Commission and the PCAOB.
We conducted our audit in accordance with the standards of the PCAOB. Those standards require that we plan and perform the audit to obtain reasonable assurance about whether effective internal control over financial reporting was maintained in all material respects. Our audit of internal control over financial reporting included obtaining an understanding of internal control over financial reporting, assessing the risk that a material weakness exists, and testing and evaluating the design and operating effectiveness of internal control based on the assessed risk. Our audit also included performing such other procedures as we considered necessary in the circumstances. We believe that our audit provides a reasonable basis for our opinion.
| 83 |
Definition and Limitations of Internal Control over Financial Reporting
A company’s internal control over financial reporting is a process designed to provide reasonable assurance regarding the reliability of financial reporting and the preparation of financial statements for external purposes in accordance with generally accepted accounting principles. A company's internal control over financial reporting includes those policies and procedures that (1) pertain to the maintenance of records that, in reasonable detail, accurately and fairly reflect the transactions and dispositions of the assets of the company; (2) provide reasonable assurance that transactions are recorded as necessary to permit preparation of financial statements in accordance with generally accepted accounting principles, and that receipts and expenditures of the company are being made only in accordance with authorizations of management and directors of the company; and (3) provide reasonable assurance regarding prevention or timely detection of unauthorized acquisition, use, or disposition of the company’s assets that could have a material effect on the financial statements.
Because of the inherent limitations, internal control over financial reporting may not prevent or detect misstatements. Also, projections of any evaluation of effectiveness to future periods are subject to the risk that controls may become inadequate because of changes in conditions, or that degree of compliance with the policies or procedures may deteriorate.
/s/ Marcum LLP
Marcum llp
New York, New York
September 20, 2018
| 84 |
FONAR CORPORATION AND SUBSIDIARIES
None.
PART III
ITEM 10. DIRECTORS AND EXECUTIVE OFFICERS OF THE REGISTRANT.
Directors serve from the date of their election until the next annual meeting of stockholders and until their successors are elected and qualify. With the exception of Dr. Raymond V. Damadian, who does not receive any fees for serving as a director, each director receives $20,000 per annum for his or her service as a director. Officers serve at the discretion of the Board of Directors.
A majority of our board of directors is composed of independent directors: Robert J. Janoff, Charles N. O’Data and Ronald G. Lehman. The outside directors also serve as the members of the audit committee, which is a standing committee of the board of directors having a charter describing its responsibilities. Mr. O’Data has been designated as the audit committee financial expert. His relevant experience is described in his biographical information.
We have adopted a code of ethics applicable to, among other personnel, our principal executive officer, principal financial officer, controllers and persons performing similar functions. The code is designed to deter wrongdoing and to promote: 1. honest and ethical conduct, including the ethical handling of actual or apparent conflicts of interest between personal and professional relationships; 2. full, fair, accurate, timely and understandable disclosure in reports and documents that we file or submit to the Securities and Exchange Commission and in other public communications we make; 3. compliance with applicable governmental laws, rules and regulations; 4. the prompt internal reporting of violations of the code to an appropriate person or persons identified in the code and 5. accountability for adherence to the code. We will provide a copy of the code to any person who requests a copy. A person may request a copy by writing to Fonar Corporation, 110 Marcus Drive, Melville, New York 11747, to the attention of the Legal Department or Investor Relations.
The officers and directors of the Company are set forth below:
Pursuant to the requirements of the Securities Exchange Act of 1934, this report has been signed below by the following persons on behalf of the registrant and in the capacities and on the dates indicated.
| Raymond V. Damadian | 82 | Chairman of the Board of Directors, Director, Principal Financial Officer, Treasurer | ||||
| Timothy R. Damadian | 54 | President, Chief Executive Officer | ||||
| Luciano B. Bonanni | 63 | Executive Vice President and Chief Operating Officer | ||||
| Claudette J.V. Chan | 80 | Director | ||||
| Robert J. Janoff | 91 | Director | ||||
| Charles N. O'Data | 82 | Director | ||||
| Ronald G. Lehman | 42 | Director |
| 85 |
FONAR CORPORATION AND SUBSIDIARIES
Raymond V. Damadian, M.D. has been the Chairman of the Board since its inception in 1978 and Treasurer since February, 2001. Up until February 11, 2016, Dr. Damadian also served as the President and Chief Executive Officer of Fonar. Dr. Damadian was employed by the State University of New York, Downstate Medical Center, New York, as an Associate Professor of Biophysics and Associate Professor of Internal Medicine from 1967 until September 1979. He received an M.D. degree in 1960 from Albert Einstein College of Medicine, New York, and a B.S. degree in mathematics from the University of Wisconsin in 1956. In addition, Dr. Damadian conducted post-graduate work at Harvard University, where he studied extensively in the fields of physics, mathematics and electronics. Dr. Damadian is the author of numerous articles and books on the nuclear magnetic resonance effect in human tissue, which is the theoretical basis for the Fonar MRI scanners. He is a 1988 recipient of the National Medal of Technology. In 1989 he was inducted into the National Inventors Hall of Fame, for his contributions in conceiving and developing the application of magnetic resonance technology to medical applications including whole body scanning and diagnostic imaging. Dr. Damadian is the President, Treasurer and director of Health Management Corporation of America (“HMCA”), a Manager of Imperial Management Services, LLC (“Imperial”) and a Manager of Health Diagnostics Management, LLC (“HDM”) which three entities are subsidiaries of Fonar.
Timothy Damadian has been the President and Chief Executive Officer of Fonar since February 11, 2016. From 2010 to 2016 he served as an independent consultant, with a focus on the Company’s MRI facility management business. Timothy Damadian began his career at Fonar in 1985, installing MRI scanners and components for Fonar customers. Over the course of the following 16 years, he held positions of increasing authority, eventually becoming Vice President of Operations. In 1997, Timothy Damadian was appointed President of the newly formed Health Management Corporation of America (HMCA), a wholly-owned subsidiary of Fonar that was formed to manage medical and diagnostic imaging offices. In 2001, Timothy Damadian left Fonar to form Integrity Healthcare Management, Inc., a diagnostic imaging management company that would eventually manage 11 MRI scanning centers in New York and Florida. The company was a success and was sold to Health Diagnostics, LLC in 2007. Mr. Damadian returned to Fonar as a consultant in 2010. He also serves as a Manager of Imperial Management Services, LLC and a Manager of Health Diagnostics Management, LLC, which are subsidiaries of HMCA.
Luciano B. Bonanni has served as Chief Operating Officer (COO) and Executive Vice President (EVP) for Fonar Corporation since June 27, 2016. Prior to his appointment as COO, Mr. Bonanni had served the Company as Vice President since 1989, during which time he oversaw general operations, research and development, manufacturing, service, sales, finance, accounting and regulatory compliance. Prior to 1989, Mr. Bonanni held the title of Vice President of Production and Engineering from the time of Fonar’s initial public offering in 1981. Mr. Bonanni joined the Company as an electrical engineer in 1978. He holds a Bachelor of Electrical Engineering degree from Manhattan College.
Claudette J.V. Chan has been a Director of Fonar since October 1987 and Secretary of Fonar since January 2008. Mrs. Chan was employed from 1992 through 1997 by Raymond V. Damadian, M.D. MR Scanning Centers Management Company and since 1997 by HMCA, as "site inspector," in which capacity she is responsible for supervising and implementing standard procedures and policies for MRI scanning centers. From 1989 to 1994 Mrs. Chan was employed by St. Matthew's and St. Timothy's Neighborhood Center, Inc., as the director of volunteers in the "Meals on Wheels" program, a program which cares for the elderly. From approximately 1983 to 1989, Mrs. Chan was President of the Claudette Penot Collection, a retail mail-order business specializing in women's apparel and gifts. Mrs. Chan practiced and taught in the field of nursing until 1973, when her son was born. She received a bachelor of science degree in nursing from Cornell University in 1960. Mrs. Chan is the sister of Raymond V. Damadian.
Robert J. Janoff has been a Director of Fonar since February 1989. Mr. Janoff has been a self-employed New York State licensed private investigator for more than thirty-five years and was a Senior Adjustor in Empire Insurance Group for more than 15 years until retiring from that position on July 1, 1997. Mr. Janoff also served, from June 1985 to June 1991, as President of Action Data Management Strategies, Ltd., a supplier of computer programs for use by insurance companies. Mr. Janoff was a member of the Board of Directors of Harmony Heights of Oyster Bay, New York for over 25 years, which is a nonprofit residential school for girls with learning disabilities.
| 86 |
FONAR CORPORATION AND SUBSIDIARIES
Charles N. O'Data has been a Director of Fonar since February 1998. From 1961 to 1997, Mr. O'Data was the Vice President for Development for Geneva College, a liberal arts college located in western Pennsylvania. In that capacity, he acted as the College's chief investment officer. His responsibilities included management of the College's endowment fund and fund raising. In July 1997, Mr. O'Data retired from Geneva College after 36 years of service to assume a position of National Sales Executive for SC Johnson Company's Professional Markets Group, a unit of SC Johnson Wax, and specialized in healthcare and education sales, a position he held until the spring of 1999. In his capacity with SC Johnson he was responsible for sales to the nation’s three largest Group Purchasing Organizations which included some 4,000 hospitals. Mr. O'Data presently acts as an independent financial consultant to various entities. Mr. O'Data served on the board of The Medical Center, Beaver, Pennsylvania, now a part of Heritage Valley Health System, a 500 bed acute care facility, for 26 years, three as its Chair. Mr. O’Data also served on the board of Amerinet, a shared-services and group purchasing organization covering seven states. He founded The Beaver County Foundation, a Community Foundation, in 1992, and serves as its President. Mr. O'Data is listed as a finance associate in the Middle States Association, Commission on Higher Education. The commission is the formal accrediting body for higher education in the eastern region of the country. In this capacity he evaluates the financial aspects of educational organizations. Mr. O’Data is a graduate of Geneva College, where he received a B.S. degree in Economics in 1958.
Ronald G. Lehman has been a Director of Fonar since April, 2012, when he was unanimously appointed by the remaining four Directors to fill the vacancy resulting from the death of former Director Robert Djerejian. From October, 2009 to the present, Mr. Lehman has served as Managing Director of Investment Banking with Bruderman Brothers, LLC, a private New York-based broker-dealer registered with the Securities and Exchange Commission and which is a member of the Financial Industry Regulatory Authority (FINRA) and the Securities Investor Protection Corporation (SIPC). Mr. Lehman directly manages all facets of the firm’s transaction processes, from deal origination, to sourcing capital, to negotiating deal structures, through documentation and closing. The firm provides buy and sell-side advisory, capital raising, and consulting services to lower middle-market companies. Mr. Lehman specializes in advising healthcare services companies and has recently completed several recapitalizations in the industry. He also participates in the firm’s merchant banking investments and oversees many of these assignments. From May, 2008 to October, 2009, Mr. Lehman served as Senior Vice President of Acquisitions at Health Diagnostics, LLC, where he managed the company’s acquisition and corporate finance activities. From March, 2000 to May, 2008, Mr. Lehman worked for various Bruderman entities as a buy and sell-side advisor and as a principal in several private equity transactions. From September, 1998 to March, 2000, Mr. Lehman worked at Deutsche Bank Securities, Inc. and last held the position of Associate in their Global Custody Group. Mr. Lehman graduated from Columbia University with a B.A. in 1998.
| 87 |
ITEM 11. EXECUTIVE COMPENSATION.
With the exception of the Chief Executive Officer and the Chairman of the Board of Directors, the compensation of the Company's executive officers is based on a combination of salary and bonuses based on performance. The Chairman of the Board’s compensation consists of a salary. The Chief Executive Officer and the Chairman of the Board have no understandings with the Company with respect to bonuses, options or other incentives; they are not subject to our general policy later discussed.
The Board of Directors does not have a compensation Committee. Dr. Raymond V. Damadian, Chairman of the Board, controls over 50% of the voting power of our capital stock. Dr. Damadian is both an executive officer and a member of the Board of Directors. Dr. Damadian, the Chief Executive Officer and the Chief Operating Officer, participate in the determination of compensation for the Company’s management and other employees.
The Board of Directors has established an audit committee. The members of the committee are Robert J. Janoff, Charles N. O'Data and Ronald G. Lehman.
Our compensation policy includes a combination of salary, commissions, bonuses, stock bonuses and stock options, designed to incentivize our employees. There is no universal plan applicable to all of our employees. The fixed and variable components of our employees’ compensation tend to be individualized, based on a combination of the employees’ performance, responsibilities and position, our assessment of how best to motivate a person in such a position and the needs and preferences of the particular employees, as negotiated between employees and their supervisors or management.
There is set forth in the following Summary Compensation Table the compensation provided by us during fiscal 2018, 2017 and 2016 to our Principal Executive Officer, and our acting Principal Financial Officer. There is set forth in the following Outstanding Equity Awards Table and Director Compensation Table the required information.
I. SUMMARY COMPENSATION TABLE
| Name
and All Other Principal Position | Year | Salary ($) | Cash
Bonuses ($) | Stock
Awards ($) | Total Compensation | |||||||||||||||
| (a) | (b) | (c) | (d) | (e) | (f) | |||||||||||||||
| Timothy R. Damadian | 2018 | $ | 0 | $ | 155,800 | $ | 0 | $ | 155,800 | |||||||||||
| President, Principal | 2017 | $ | 0 | $ | 0 | $ | 305,800 | $ | 305,000 | |||||||||||
| Executive Officer | 2016 | $ | 0 | $ | 0 | $ | 314,850 | $ | 314,850 | |||||||||||
| Raymond V. Damadian | 2018 | $ | 153,095 | $ | 305,800 | $ | 0 | $ | 458,895 | |||||||||||
| Chairman of the Board, | 2017 | $ | 158,983 | $ | 0 | $ | 305,800 | $ | 464,783 | |||||||||||
| PFO | 2016 | $ | 89,657 | $ | 0 | $ | 314,850 | $ | 404,507 | |||||||||||
| Luciano Bonanni | 2018 | $ | 145,672 | $ | 0 | $ | 152,900 | $ | 298,572 | |||||||||||
| Chief Operating Officer and | 2017 | $ | 149,378 | $ | 0 | $ | 305,800 | $ | 455,178 | |||||||||||
| Executive Vice President | 2016 | $ | 140,280 | $ | 0 | $ | 314,850 | $ | 455,130 | |||||||||||
| 88 |
FONAR CORPORATION AND SUBSIDIARIES
II. OUTSTANDING EQUITY AWARDS AT FISCAL YEAR-END
| Name | Number Of Securities Underlying Unexercised Options (#) Exercisable | Option
Exercise Price ($) | Option
Exercise Expiration Date | |||||||
| (a) | (b) | (c) | ||||||||
| Timothy R. Damadian, President and Principal Executive Officer | 0 | 0 | N/A | |||||||
| Raymond V. Damadian, Chairman of the Board, Treasurer and Principal Financial Officer | 0 | 0 | N/A | |||||||
| Luciano Bonanni, Chief Operating Officer and Executive Vice President | 0 | 0 | N/A | |||||||
III. DIRECTOR COMPENSATION
| Name | Fees
Earned or Paid in Cash ($) | Total
($) | ||||||
| Raymond V. Damadian | $ | 0 | $ | 0 | ||||
| Claudette J.V. Chan | $ | 20,000 | $ | 20,000 | ||||
| Robert J. Janoff | $ | 20,000 | $ | 20,000 | ||||
| Charles N. O’Data | $ | 20,000 | $ | 20,000 | ||||
| Ronald G. Lehman | $ | 20,000 | $ | 20,000 | ||||
EMPLOYEE COMPENSATION PLANS
Fonar’s 2005 Incentive Stock Option Plan, adopted on February 15, 2005, was intended to qualify as an incentive stock option plan under Section 422A of the Internal Revenue code of 1954, as amended. The Plan permits the issuance of stock options covering an aggregate of 80,000 shares of common stock of Fonar. The options issued have an exercise price equal to the fair market value of the underlying stock on the date the option is granted, are non-transferable, are exercisable for a period not exceeding ten years, and expire upon the voluntary termination of employment. The Plan terminated on February 14, 2015.
Fonar adopted its 2010 Stock Bonus Plan, on June 28, 2010. This Plan permits Fonar to issue an aggregate of 2,000,000 shares of common stock of Fonar as bonus or compensation. As of June 30, 2018, 716,876 shares were available for issuance.
| 89 |
FONAR CORPORATION AND SUBSIDIARIES
ITEM 12. SECURITY OWNERSHIP OF CERTAIN BENEFICIAL OWNERS AND MANAGEMENT.
The following table sets forth the number and percentage of shares of Fonar’s securities held by each director, by each person known by us to own in excess of five percent of Fonar’s voting securities and by all officers and directors as a group as of September 10, 2018.
| Name and Address of Beneficial Owner (1) | Shares Beneficially Owned | Percent of Class | ||||||
| Raymond V. Damadian, M.D. | ||||||||
| c/o Fonar Corporation, Melville, New York | ||||||||
| Director and Treasurer | ||||||||
| 5% + Stockholder | ||||||||
| Common Stock | 124,702 | 1.96 | % | |||||
| Class C Stock | 382,447 | 99.98 | % | |||||
| Class A Preferred | 19,093 | 6.09 | % | |||||
| Timothy R. Damadian, | ||||||||
| President and Chief Executive Officer | ||||||||
| Common Stock | 38,000 | * | ||||||
| Class A Preferred | 800 | * | ||||||
| Luciano B. Bonanni, | ||||||||
| Executive Vice President | ||||||||
| And Chief Operating Officer | ||||||||
| Common Stock | 34,205 | * | ||||||
| Class A Preferred | 1,285 | * | ||||||
| Claudette Chan | ||||||||
| Director and Secretary | ||||||||
| Common Stock | 106 | * | ||||||
| Class A Preferred | 32 | * | ||||||
| Robert J. Janoff | ||||||||
| Director | ||||||||
| Common Stock | 0 | * | ||||||
| Class A Preferred | 0 | * | ||||||
| Charles N. O'Data | ||||||||
| Director | ||||||||
| Common Stock | 658 | * | ||||||
| Ronald G. Lehman | ||||||||
| Director | ||||||||
| Common Stock | 950 | * | ||||||
| All Officers and Directors | ||||||||
| as a Group (7 persons) | ||||||||
| Common Stock | 197,669 | 3.11 | % | |||||
| Class C Stock | 382,368 | 99.98 | % | |||||
| Class A Preferred | 21,289 | 6.79 | % | |||||
___________________________
* Less than one percent
___________________________
1. Address provided for each beneficial owner owning more than five percent of the voting securities of Fonar.
| 90 |
FONAR CORPORATION AND SUBSIDIARIES
ITEM 13. CERTAIN RELATIONSHIPS AND RELATED TRANSACTIONS.
Pursuant to HMCA’s management agreements with its clients, HMCA provides comprehensive non-medical management and administrative services, including billing and collection of accounts, payroll and accounts payable processing, office facilities, supplies and utilities. Under the management agreements, HMCA also provides service for the Fonar Upright® MRI scanners through Fonar. In total, as of September 5, 2018, 22 of our clients had management agreements with HMCA. Four sites in Florida are owned and operated directly by HMCA subsidiaries.
The fees charged under the management agreements are flat fees charged on a monthly basis. These fees ranged from $66,000 to $439,000 per month in fiscal 2018.
Dr. Raymond Damadian, the Chairman of the Board and principal stockholder of the Company, owns three of the imaging facilities in Florida managed by HMCA. The facilities owned by Dr. Damadian in Florida pay HMCA flat rate monthly fees ranging from $187,936 to $322,636 per month. These fees are renegotiable on an annual basis.
During the fiscal years ended June 30, 2018, June 30, 2017 and June 30, 2016, the net revenues received by HMCA from the imaging facilities owned by Dr. Damadian were approximately $9.0 million, $8.2 million and $7.5 million respectively.
Dr. Damadian owns a .75% interest in Health Management Company of America’s Class A membership interests. Dr. Damadian is also a Manager of Health Management Company of America.
Timothy Damadian, the President and Chief Executive Officer of Fonar, is one of the owners of a billing company, which performs billing and collection services for HMCA with respect to No-Fault and Workers’ Compensation claims of HMCA’s clients. The monthly fee charged to HMCA is $85,000. On June 1, 2017, the Company also entered into a one year renewable agreement to provide IT services to the billing company for a monthly fee of $23,884. Timothy Damadian is also a Manager of Health Management Company of America. The agreement was renewed on June 1, 2018.
A limited liability company of which Timothy Damadian is an owner also had a 1.375% interest in Yonkers Diagnostic Management, LLC, a 4.5% interest in Turnkey Services of New York, LLC and a 4.3% interest in TK2 Equipment Management, LLC. Entities in which Mr. Bonanni and his family had an interest had a 0.75% in Yonkers and a 5.9% in TK2 Equipment Management. During fiscal 2017 HMCA acquired these entities, or the portion thereof not already owned by HMCA, through a series of merger transactions for $1,780,000 in the case of Yonkers, $1,147,715 in the case of Turnkey Services and $3,075,852 in the case of TK2 Equipment Management.
A company of which Timothy Damdian is an owner and a company in which Mr. Bonanni has an interest also held a 1.7% and 2.8% interest, respectively, in Turnkey Management of Great Neck, LLC, a company for which HMCA performed services. During Fiscal 2017, Turnkey Management of Great Neck, LLC was acquired by the Company through a merger transaction for $1,312,766.
Ronald Lehman, a Director of Fonar, holds a .0378% interest in Health Management Company of America’s Class A membership interests.
Claudette J.V. Chan, a Director and the Secretary of Fonar, owns a .0378% interest in Health Management Company of America’s Class A Membership interests.
| 91 |
FONAR CORPORATION AND SUBSIDIARIES
ITEM 14. PRINCIPAL ACCOUNTING FEES AND SERVICES.
Audit Fees
The aggregate fees billed by Marcum LLP for the audit of our annual consolidated financial statements for the fiscal year ended June 30, 2018 and the reviews of the financial statements included in our Forms 10-Q for the fiscal year ended June 30, 2018 were $416,500.
The aggregate fees billed by Marcum LLP for the audit of our annual financial statements for the fiscal year ended June 30, 2017 and the reviews of the financial statements included in our Forms 10-Q for the fiscal year ended June 30, 2017 were $447,000.
Audit Related Fees
No fees were billed by Marcum LLP for the fiscal years ended June 30, 2018 or June 30, 2017 for services related to the Audit or review of our financial statements that are not included under the caption “Audit Fees”.
No fees were billed by Marcum LLP for the fiscal years ended June 30, 2018 or June 30, 2017 for designing, operating, supervising or implementing any of our financial information systems or any hardware or software systems for our financial information.
Tax Fees
No fees were billed by Marcum LLP for tax compliance, tax advice and tax planning in the fiscal year ended June 30, 2018.
No fees billed by Marcum LLP for tax compliance, tax advice and tax planning in the fiscal year ended June 30, 2017.
All Other Fees
No fees were billed by Marcum LLP for any other services during the fiscal years ended June 30, 2018 and June 30, 2017.
Since January 1, 2003, the audit committee has adopted policies and procedures for pre-approving all non-audit work performed by the auditors. Specifically, the committee must pre-approve the use of the auditors for all such services. The audit committee has pre-approved all non-audit work since that time and in making its determination has considered whether the provision of such services was compatible with the independence of the auditors.
Our audit committee believes that the provision by Marcum LLP of services in addition to audit services in fiscal 2018 and 2017 were compatible with maintaining their independence.
PART IV
| 92 |
FONAR CORPORATION AND SUBSIDIARIES
ITEM 15. EXHIBITS, FINANCIAL STATEMENT SCHEDULES, AND REPORTS ON FORM 8-K.
a) FINANCIAL STATEMENTS AND SCHEDULES
The following consolidated financial statements are included in Part II, Item 8.
Report of Independent Registered Public Accounting Firm
Consolidated Balance Sheets as at June 30, 2017 and 2016.
Consolidated Statements of Income for the Years Ended June 30, 2017, 2016 and 2015.
Consolidated Statements of Stockholders' Equity for the Years Ended June 30, 2017, 2016 and 2015.
Consolidated
Statements of Cash Flows for the Years Ended June 30, 2017, 2016 and 2015.
Notes to Consolidated Financial Statements.
Information required by schedules called for under Regulation S-X is either not applicable or is included in the consolidated financial statements or notes to the financial statements.
b) REPORTS ON FORM 8-K
c) EXHIBITS
3.1 Certificate of Incorporation, as amended, of the Registrant incorporated by reference to Exhibit 3.1 to the Registrant's registration statement on Form S-1,Commission File No. 33-13365.
3.5 By-Laws, as amended, of the Registrant incorporated by reference to Exhibit 3.2 to the Registrant's registration statement on Form S-1, Commission File No. 33-13365.
4.1 Specimen Common Stock Certificate incorporated by reference to Exhibit 4.1 to the Registrant's registration statement on Form S-1, Commission File No. 33-13365.
4.2 Specimen Class B Common Stock Certificate incorporated by reference to Exhibit 4.2 to the Registrant's registration statement on Form S-1, Commission File No. 33-13365.
10.1 License Agreement between the Registrant and Raymond V. Damadian incorporated by reference to Exhibit 10 (e) to Form 10-K for the fiscal year ended June 30, 1983, Commission File No. 0-10248.
| 93 |
FONAR CORPORATION AND SUBSIDIARIES
10.12 Modification to Operating Agreement for Health Diagnostics Management, LLC. See Exhibits.
21.1 Subsidiaries of the Registrant. See Exhibits.
23.1 Independent Registered Public Accounting Firm’s Report. See Exhibits.
31.1 Section 302 Certification. See Exhibits.
32.1 Section 906 Certification. See Exhibits.
| 94 |
FONAR CORPORATION AND SUBSIDIARIES
SIGNATURES
Pursuant to the requirements of Section 13 or 15 (d) of the Securities Exchange Act of 1934, the registrant has duly caused this report to be signed on its behalf by the undersigned, thereunto duly authorized.
FONAR CORPORATION
| Dated: September 20, 2018 | ||
By: /s/ Timothy R. Damadian Timothy R. Damadian, President and Principal Executive Officer | ||
By:/s/ Raymond V. Damadian Raymond V. Damadian, Principal Financial Officer, Chairman of the Board and Treasurer |
Pursuant to the requirements of the Securities Exchange Act of 1934, this report has been signed below by the following persons on behalf of the registrant and in the capacities and on the dates indicated.
| Signature | Title | Date | ||
| /s/ Raymond V. Damadian Raymond V. Damadian | Chairman of the Board of Directors, Director, Principal Financial Officer, Treasurer | September 20, 2018 | ||
| /s/ Claudette J.V. Chan Claudette J.V. Chan | Director | September 20, 2018 | ||
/s/ Robert J. Janoff Robert J. Janoff |
Director | September 20, 2018 | ||
/s/ Charles N. O'Data Charles N. O'Data |
Director | September 20, 2018 | ||
/s/ Ronald G. Lehman Ronald G. Lehman |
Director | September 20, 2018 |
| 95 |