Attached files
| file | filename |
|---|---|
| EX-32.1 - EXHIBIT 32.1 - Guidewire Software, Inc. | gwre-7312018x10kex321.htm |
| EX-31.2 - EXHIBIT 31.2 - Guidewire Software, Inc. | gwre-7312018x10kex312.htm |
| EX-31.1 - EXHIBIT 31.1 - Guidewire Software, Inc. | gwre-7312018x10kex311.htm |
| EX-23.1 - EXHIBIT 23.1 - Guidewire Software, Inc. | gwre-7312018x10kex231.htm |
| EX-21.1 - EXHIBIT 21.1 - Guidewire Software, Inc. | gwre-7312018x10kex211.htm |
| EX-10.11 - EXHIBIT 10.11 - Guidewire Software, Inc. | hqleasebaymeadowsex1011.htm |
UNITED STATES
SECURITIES AND EXCHANGE COMMISSION
Washington, D.C. 20549
________________________________________
FORM 10-K
________________________________________
(Mark one)
x ANNUAL REPORT PURSUANT TO SECTION 13 OR 15(d) OF THE SECURITIES EXCHANGE ACT OF 1934
For the fiscal year ended July 31, 2018
OR
¨ TRANSITION REPORT PURSUANT TO SECTION 13 OR 15(d) OF THE SECURITIES EXCHANGE ACT OF 1934
For the transition period from to .
Commission file number: 001-35394
________________________________________
Guidewire Software, Inc.
(Exact name of registrant as specified in its charter)
________________________________________
Delaware | 36-4468504 | |
(State or other jurisdiction of Incorporation or organization) | (I.R.S. Employer Identification No.) | |
1001 E. Hillsdale Blvd., Suite 800 Foster City, California, 94404
(Address of principal executive offices, including zip code)
(650) 357-9100
(Registrant’s telephone number, including area code)
________________________________________
Securities registered pursuant to Section 12(b) of the Act:
(Title of class) | (Name of exchange on which registered) | |
Common Stock, $0.0001 par value | New York Stock Exchange | |
Securities registered pursuant to Section 12(g) of the Act:
None
_______________________________________
Indicate by check mark if the registrant is a well-known seasoned issuer, as defined in Rule 405 of the Securities Act. Yes x No ¨
Indicate by check mark whether the registrant is not required to file reports pursuant to Section 13 or Section 15(d) of the Act. Yes ¨ No x
Indicate by check mark whether the registrant (1) has filed all reports required to be filed by Section 13 or 15(d) of the Securities Exchange Act of 1934 during the preceding 12 months (or for such shorter period that the registrant was required to file such reports), and (2) has been subject to such filing requirements for the past 90 days. Yes x No ¨
Indicate by check mark whether the registrant has submitted electronically and posted on its corporate Website, if any, every Interactive Data File required to be submitted and posted pursuant to Rule 405 of Regulation S-T (§232.405 of this chapter) during the preceding 12 months (or for such shorter period that the registrant was required to submit and post such files). Yes x No ¨
Indicate by check mark if disclosure of delinquent filers pursuant to Item 405 of Regulation S-K (§232.405 of this chapter) is not contained herein, and will not be contained, to the best of the registrant’s knowledge, in definitive proxy or information statements incorporated by reference in Part III of this Form 10-K or in any amendment to this Form 10-K. x
Indicate by check mark whether the registrant is a large accelerated filer, an accelerated filer, a non-accelerated filer or a smaller reporting company. See definition of “large accelerated filer,” “accelerated filer” and “smaller reporting company” in Rule 12b-2 of the Exchange Act.
Large accelerated filer | x | Accelerated filer | ¨ | |||
Non-accelerated filer | ¨ (Do not check if a smaller reporting company) | Smaller reporting company | ¨ | |||
Emerging growth company | ¨ | |||||
If an emerging growth company, indicate by check mark if the registrant has elected not to use the extended transition period for complying with any new or revised financial accounting standards provided pursuant to Section 13(a) of the Exchange Act. ¨
Indicate by check mark whether the registrant is a shell company (as defined in Rule 12b-2 of the Exchange Act). Yes ¨ No x
The aggregate market value of common stock held by non-affiliates of the registrant, computed by reference to the closing price at which the common stock was sold on January 31, 2018, the last business day of the registrant’s most recently completed second fiscal quarter, as reported on the New York Stock Exchange, was approximately $3.4 billion. Shares of common stock held by each executive officer, director and holder of 5% or more of the outstanding common stock have been excluded in that such persons may be deemed to be affiliates. This determination of affiliate status does not reflect a determination that such persons are affiliates of the registrant for any other purpose.
On August 31, 2018, the registrant had 80,608,319 shares of common stock outstanding.
DOCUMENTS INCORPORATED BY REFERENCE
Portions of the registrant’s definitive Proxy Statement relating to its 2018 Annual Meeting of Stockholders are incorporated by reference into Part III of this Annual Report on Form 10-K where indicated. Such Proxy Statement will be filed with the U.S. Securities and Exchange Commission within 120 days after the end of the fiscal year to which this report relates.
Guidewire Software, Inc.
Table of Contents
Item 1. | ||
Item 1A. | ||
Item 1B. | ||
Item 2. | ||
Item 3. | ||
Item 4. | ||
Item 5. | ||
Item 6. | ||
Item 7. | ||
Item 7A. | ||
Item 8. | ||
Item 9. | ||
Item 9A. | ||
Item 9B. | ||
Item 10. | ||
Item 11. | ||
Item 12. | ||
Item 13. | ||
Item 14. | ||
Item 15. | ||
i
FORWARD-LOOKING STATEMENTS
The sections titled “Business” and “Management’s Discussion and Analysis of Financial Condition and Results of Operations,” as well as other parts of this Annual Report on Form 10-K and certain information incorporated herein by reference contain forward-looking statements within the meaning of the Securities Act of 1933 and the Securities Exchange Act of 1934, which are subject to risks and uncertainties. The forward-looking statements may include statements concerning, among other things, our business strategy (including anticipated trends and developments in, and management plans for, our business and the markets in which we operate), financial results, results of operations, revenue, gross margins, operating expenses, products, projected costs and capital expenditures, research and development programs, sales and marketing initiatives and competition. In some cases, you can identify these statements by forward-looking words, such as “will,” “may,” “might,” “should,” “could,” “estimate,” “expect,” “suggest,” “believe,” “anticipate,” “intend,” “plan” and “continue,” the negative or plural of these words and other comparable terminology. Actual events or results may differ materially from those expressed or implied by these statements due to various factors, including but not limited to the matters discussed below, in the section titled “Item 1A. Risk Factors,” and elsewhere in this Annual Report on Form 10-K. Examples of forward-looking statements include statements regarding:
• | growth prospects of the property & casualty (“P&C”) insurance industry and our company; |
• | the developing market for subscription services and uncertainties attendant on emerging sales and delivery models; |
• | trends in future sales, including the mix of licensing and subscription models and seasonality; |
• | our competitive environment and changes thereto; |
• | competitive attributes of our software applications and delivery models; |
• | challenges to further increase sales outside of the United States; |
• | our research and development investment and efforts; |
• | expenses to be incurred, and benefits to be achieved, from our acquisitions; |
• | our gross and operating margins and factors that affect such margins; |
• | our provision for tax liabilities and other critical accounting estimates; |
• | the impact of new accounting standards and any contractual changes we have made in anticipation of such changes; |
• | our exposure to market risks, including geographical and political events that may negatively impact our customers; and |
• | our ability to satisfy future liquidity requirements. |
Forward-looking statements are not guarantees of future performance and involve risks and uncertainties. The forward-looking statements contained in this Annual Report on Form 10-K are based on information available to us as of the filing date of this Annual Report on Form 10-K and our current expectations about future events, which are inherently subject to change and involve risks and uncertainties. You should not place undue reliance on these forward-looking statements.
We do not undertake any obligation to update any forward-looking statements in this report or in any of our other communications, except as required by law. All such forward-looking statements should be read as of the time the statements were made and with the recognition that these forward-looking statements may not be complete or accurate at a later date.
_________________________________________________________
Unless the context requires otherwise, we are referring to Guidewire Software, Inc. together with its subsidiaries when we use the terms “Guidewire,” the “Company,” “we,” “our” or “us.”
ii
Item 1. | Business |
Overview
We provide a technology platform, composed of software, services, and a partner ecosystem, for the global Property and Casualty (“P&C”) insurance industry.
Guidewire InsurancePlatformTM applications support core operations, data management and analytics, and digital engagement that can be deployed in the cloud or on-premise, and are connected to numerous data sources and third-party applications. Our applications are designed to work together to strengthen our customers’ ability to adapt and succeed in a rapidly changing market. Guidewire InsuranceSuite™ and Guidewire InsuranceNowTM provide core transactional systems of record that support the entire insurance lifecycle, including product definition, distribution, underwriting, policy-holder services, and claims management. Guidewire InsuranceSuite is a highly-configurable and scalable system primarily comprised of three applications (PolicyCenter, BillingCenter, and ClaimCenter) that can be licensed separately or together and can be deployed on-premise or in the cloud. Guidewire InsuranceNow is a cloud-based system that offers policy, billing, and claims management functionality to insurers that prefer an all-in-one solution. Our data and analytics applications enable insurers to manage data more effectively, gain insights into their business, and underwrite new and evolving risks. Our digital engagement applications enable digital sales, omni-channel service and enhanced claims experiences for policyholders, agents, vendor partners and field personnel. To support P&C insurers globally, we have localized, and will continue to localize, our software for use in a variety of international regulatory, language, and currency environments.
Guidewire delivers Software-as-a-Service (SaaS) subscriptions via Guidewire Cloud™. Guidewire’s cloud products enable insurers to focus on business agility while transferring undifferentiating IT responsibilities to Guidewire, in exchange for a subscription fee. All Guidewire products are available via Guidewire Cloud with a number of products only available via Guidewire Cloud.
Our customers range from some of the largest global insurance carriers or their subsidiaries, such as Aviva, AXA, and Zurich to predominantly national carriers such as Basler Versicherung (Switzerland), Direct Line Group (U.K.), Farmers Insurance (U.S.), IAG (Australia), MS&AD (Japan), Nationwide (U.S.), PZU (Poland) and San Cristobal Seguros S.A. (Argentina) and carriers that serve specific states and/or regions such as Automobile Club of Southern California (California), Canadian Automobile Association Insurance Company (Ontario), Kentucky Farm Bureau (Kentucky), and Vermont Mutual Insurance Group (Vermont).
Our customer engagement is led by our direct sales team and supported by our system integrator (“SI”) partners. We maintain and continue to grow our sales and marketing efforts globally, and maintain regional sales centers in the Americas, Europe, and Asia.
We began our principal business operations in 2001. To date, we have generated a substantial majority of our software license fees through license agreements that generally have a term of at least two years. We generally price our licenses based on the amount of direct written premiums (“DWP”) that will be managed by our solutions. Our term licenses for both recurring term license and maintenance fees are typically invoiced annually in advance or, in certain cases, quarterly. Term licenses that are greater than one year generally include extended payment terms. We also generate cloud-based revenue (also referred to as “subscriptions”). Currently, these subscriptions may be for terms greater than two years, and we anticipate that a majority of these arrangements will be billed annually or quarterly in advance, although in some instances additional fees may be assessed in arrears as customers increase their DWP. Revenue derived from these subscriptions is recognized ratably over the contractual term beginning after the subscription is effectively provisioned, which is the date our software service is made available to customers. We anticipate that subscription revenue will increase as a percentage of total revenue as we develop and bring to market more cloud-based solutions to meet increasing industry demand. Services revenue is primarily derived from implementation and training services performed for our customers. Substantially all of our services revenue is billed on a time and materials basis.
Industry Background
The P&C insurance industry is large, fragmented, highly regulated, and complex. It is also highly competitive, with carriers competing primarily on the following factors: product differentiation, pricing options, customer service, marketing and advertising, affiliate programs and channel strategies.
P&C insurers continue to actively modernize the transactional systems that support the key functional areas of P&C insurance: product definition, underwriting and policy administration, claims management and billing. Product definition specifies the insurance coverage, pricing, and financial and legal terms of insurance policies. Underwriting and policy administration includes collecting information from potential policyholders, determining appropriate coverages and terms, pricing policies, issuing policies and updating and maintaining policies over their lifetimes. Claims management includes loss intake, investigation and evaluation
1
of incidents, settlement negotiation, vendor management, litigation management and payment processing. Billing includes policyholder invoicing, payment collection, agent commission calculation and disbursement. We believe insurers that adopt modern infrastructures can enhance customer experience, operate more efficiently and introduce innovative products more rapidly.
We believe the P&C industry is experiencing accelerating change in how insurers engage with, sell to, and manage relationships with individual and business customers. Today, P&C insurers are striving to respond to significant changes in their competitive marketplace and the character of the risks they underwrite. The most significant changes include:
• | a rise in customer expectations for digital, omni-channel interaction; |
• | a growth in demand for personalized products and services; |
• | an increase in technology-driven changes in vehicular risk; |
• | demand for coverage of “21st century risks” such as terrorism, cybersecurity and reputational risk; |
• | advances in the use of data to better market to and engage with customers, price policies and manage claims; |
• | development of opportunities to compete or partner with non-traditional players that offer disruptive technology-based value propositions; and |
• | the introduction and leveraging of new technologies, such as drones, artificial intelligence, the “Internet of Things” and blockchain technology. |
In response to these challenges and opportunities, we believe that the P&C insurance industry is entering a phase of increasing investment in technology, characterized by a moderated pace of core modernization programs, and growing adoption of new digital engagement and data analytics offerings.
While each insurer may have different goals and priorities when pursuing new IT investments, there are several major themes that we believe guide these investments:
• | Legacy Modernization. A significant portion of the market continues to rely on legacy systems. We believe new claims, policy management, and billing systems will continue to be adopted as insurers that rely on legacy systems seek to gain operating efficiencies, expand into new markets and lines of business, and introduce new digital and data offerings. |
• | New Digital Engagement Models. We believe that insurers will need to provide a more intuitive, digital user experience to reduce the risk of customer dissatisfaction and loss. Investment in digital user experience will allow insurers to deepen their engagement with customers and transition from passive and transactional customer interactions to active and advisory relationships. This transition will require investments in software products that are designed to model user journeys and enable more frequent, informed and dynamic interactions between insurers and their customers. We believe these efforts can improve financial performance for insurers through increased lead conversions and lower customer churn. |
• | Smarter Decision-Making. Insurers are seeking to explore, visualize, and analyze operational and third-party data to optimize decision-making across the insurance lifecycle. We believe that such predictive analytical solutions are most effective when they provide predictive scores and other analytical insights to insurers’ employees as they perform their underwriting and claims management activities. |
Insurers may also apply data and machine learning to automate certain tasks whenever possible, thereby enabling efficiencies, such as straight-through processing, that lessen the burden on subject matter experts.
• | Innovation. Insurers are under pressure to innovate across their product lifecycle in order to grow their business and improve service quality. Examples of focus areas include creating products to target under-insured risks such as cyber, supply chain disruption, and reputational and partnering with InsurTech providers to streamline operations and improve service to policyholders and agents. |
• | Cloud-Delivered Solutions. We believe that increased recognition of the compelling economic benefits of deploying software solutions on public infrastructure combined with reduced concerns about the security and reliability of such platforms will cause more insurers to consider cloud-deployed solutions. Insurers benefit from an optimized division of labor and risk, allowing third parties to manage their infrastructure as they focus on competitively differentiating activities. |
Products
Guidewire InsurancePlatform is designed to offer insurers the ability to adapt and succeed in meeting these challenges and capitalize on new opportunities. We believe that the proliferation of modern back-office infrastructures has significantly increased the ability of insurers to utilize new solutions to grow revenue, reduce costs and losses, improve pricing and engage more deeply and in more intuitive ways with a customer base that is increasingly comfortable with mobile and automated forms of self-service and communication. We anticipate that we will continue to invest in research and development and strategic investments so that we may further assist insurers in reaching their business goals.
2
Core Operational Platforms
We offer two core operational platforms: Guidewire InsuranceSuite and Guidewire InsuranceNow.
Guidewire InsuranceSuite
Guidewire InsuranceSuite is comprised of three primary applications: PolicyCenter, BillingCenter, and ClaimCenter. We offer several add-on products designed to work seamlessly with these primary applications. InsuranceSuite is built on a unified technology platform that provides enhanced functionality and a common data model across applications, available on-premise and via the Guidewire Cloud.
Guidewire PolicyCenter is our flexible underwriting and policy administration application that serves as a comprehensive system-of-record supporting the entire policy lifecycle, including product definition, underwriting, quoting, binding, issuances, endorsements, audits, cancellations and renewals. Guidewire BillingCenter automates the billing lifecycle, enables the design of a wide variety of billing and payment plans, manages agent commissions, and integrates with external payment systems. Guidewire ClaimCenter offers end-to-end claims lifecycle management, including product definition, distribution, underwriting, policy holder services, and claims management.
Guidewire InsuranceNow
Guidewire InsuranceNow is a cloud-based platform for P&C insurers that offers policy, billing, and claims management functionality to insurers that prefer to subscribe to a cloud-based, all-in-one solution. Guidewire InsuranceNow is only offered in the cloud, and is currently only available in the United States, though we intend to introduce it to select international markets in the future.
Guidewire InsuranceSuite: Add-on Applications
We offer a number of additional add-on applications for Guidewire InsuranceSuite.
Guidewire Underwriting Management
Guidewire Underwriting Management is a cloud-based, integrated business application designed for commercial and specialty line insurers to drive premium growth and profit from better underwriting. This feature-rich workstation delivers straight-through processing, exception-based underwriting, real-time collaboration, and knowledge management in one integrated solution. Guidewire Underwriting Management is typically sold alongside Guidewire PolicyCenter, although it functions with other policy administration systems as well.
Guidewire Rating Management
Guidewire Rating Management enables P&C insurers to manage the pricing of their insurance products.
Guidewire Reinsurance Management
Guidewire Reinsurance Management enables P&C insurers to use rules-based logic to execute their reinsurance strategy through their underwriting and claims processes.
Guidewire Client Data Management
Guidewire Client Data Management helps P&C insurers capitalize on customer information more coherently, overcoming traditional siloed practices that impair efficiency and customer service.
Guidewire Product Content Management
Guidewire Product Content Management provides software tools and standards-based, line-of-business templates to enable insurers to more rapidly introduce and modify products by reducing product configuration and maintenance efforts. Any such product introduction or modification must connect to and incorporate regulatory or industry-standard data and content, such as ISO content.
Guidewire AppReader
Guidewire AppReader is a submission intake management solution that enables P&C insurers to process Association for Cooperative Operations Research and Development (“ACORD”) forms faster and more accurately than with manual processes or traditional upload solutions. AppReader is available for both Guidewire Underwriting Management and Guidewire PolicyCenter.
Guidewire London Market Messaging
Guidewire London Market Messaging provides a message-processing and action framework with enhanced configuration to manage claims and settlement messages covering the Lloyd’s of London market and the London Company Market, as well as subscription business multi-currency reserving. Guidewire London Market Messaging is a specialized add-on for Guidewire ClaimCenter customers.
3
Data Management and Analytics
We offer a variety of applications that allow insurers to consolidate, explore and analyze the data that is generated from their own operations and the data they capture from third-party sources.
Guidewire DataHub
Guidewire DataHub is an operational data store that unifies, standardizes and stores data from the patchwork of an insurer’s systems as well as from external sources. DataHub enables carriers to accelerate legacy system replacement.
Guidewire InfoCenter
Guidewire InfoCenter is a business intelligence warehouse for P&C insurers which provides information in easy-to-use formats for business intelligence, analysis and enhanced decision making. With InfoCenter, customers gain flexible operational insights as well as the ability to optimize their business.
Guidewire Live Analytics
Guidewire Live Analytics is a cloud analytics platform that streams data from core systems and other sources into a scalable data infrastructure to enable smart business decisions. Guidewire Live Analytics applications are designed to complement Guidewire’s operational systems, combining data from many different sources, core systems, anonymized benchmarks, and third-party data to enable real-time exploration and visualization for more precise decision-making. Guidewire Live Analytics applications include: Explore, Claim Canvas, Compare, and Spotlight.
Guidewire Predictive Analytics
Guidewire Predictive Analytics is a cloud-based tool which allows insurers to make data-driven decisions throughout the insurance lifecycle. By building predictive models from multiple data sets, analyzing model output, and deploying predictive models, insurers can realize significant reductions in loss ratio and expenses.
Guidewire Cyence Risk Analytics
Guidewire Cyence Risk Analytics is a cloud-native economic cyber risk modeling solution built to help the insurance industry quantify cyber risk exposures. It enables insurers to manage portfolio exposure accumulations and develop new products. Through a process called “data listening”, Guidewire Cyence Risk Analytics collects technical and behavioral data from a variety of sources, including public data, open-source data, proprietary data, and third-party data.
Digital Engagement
Guidewire Digital Engagement Applications
Our Digital Engagement Applications enable insurers to provide digital experiences to customers, agents, vendors and field personnel through their device of choice. As consumers increasingly use self-service functions on the Internet and on mobile devices, we believe that many of them prefer to interact with their insurance providers digitally and they expect to have consistent and efficient transactional experience through multiple channels, whether online, in-person or by phone. Our Digital Engagement applications also benefit agents and brokers who are seeking to automate business processes with insurers to improve customer service and productivity.
Technology
Our applications are designed to assist P&C insurers to grow their business, improve customer and agent engagement, lower operating costs and improve decision making. We have increased the scope of Guidewire InsurancePlatform through internal development and acquisitions. This growing scope has required greater investment in the development of application interfaces and shared services necessary to unify the operations and user experience across our applications. To meet the anticipated increased demand for cloud-delivered solutions, we have increased investments to leverage the growing number of technology services provided by on-demand infrastructure vendors such as Amazon with AWS and Microsoft with Azure. The shift to cloud-delivered solutions has also required significant focus in improving our ability to manage and operate our applications since our cloud-based deployments, unlike our on-premise implementations, shift many operational responsibilities to us. Finally, we continue to improve the scalability of our applications, which are required to perform millions of complex transactions that must balance on a daily basis. This accuracy must be maintained not only during normal business operations, but also during extraordinary events such as catastrophes, which may result in extremely high transaction volume in a short period of time.
Services
Implementation Services
4
We provide implementation and integration services to help our customers realize the benefits of our software products and subscription services. Our implementation teams assist customers in building implementation plans, integrating our software with their existing systems and defining business rules and specific requirements unique to each customer and installation. We also partner with leading system integration consulting firms, certified on our software, to achieve scalable, cost-effective implementations for our customers.
Guidewire Production Services
Customers that contract with us for a cloud-based version of any Guidewire InsurancePlatform application receive access to our software, 24x7 technical management, monitoring and, in some cases, version upgrades. Customers may also receive additional services, such as defect fixes, regulatory updates, and minor platform delivery enhancements.
Customers
We market and sell our products to a wide variety of global P&C insurers ranging from some of the largest global insurers to national and regional carriers. We believe strong customer relationships are a key driver of our success given the long-term nature of our customer engagements and importance of customer references for new sales. We focus on developing and maintaining our customer relationships through customer service and account management. As of July 31, 2018, we had approximately 380 customers using one or more of our products in 39 countries.
Strategic Relationships
We have extensive relationships with system integration, consulting, and industry partners. Our network of partners has expanded as interest in and adoption of our products has grown. We encourage our partners to co-market, pursue joint sales initiatives and drive broader adoption of our technology, helping us grow our business more efficiently and enabling us to focus our engineering resources on continued innovation and further enhancement of our solutions.
As part of our PartnerConnect alliance program, we have a community of Solution Partners developing integration accelerators that enable their on-premise and cloud-based software solutions to interoperate with our products. As of July 31, 2018, more than 85 of these partner-developed integrations have been validated by us and awarded Ready for Guidewire branding. Guidewire Marketplace provides our customers with an online forum to learn about and download Ready for Guidewire integration accelerators for use with our products. These accelerators help customers reduce implementation risk and effort, and lower the total cost of implementation and operation. We anticipate expanding the reach of Guidewire Marketplace.
Sales and Marketing
Consistent with our industry focus and the mission-critical needs our products address, our sales and marketing efforts are tailored to communicate effectively to senior executives within the P&C industry. Our sales, marketing, and executive teams work together to cultivate long-term relationships with current and prospective customers in each of the geographies in which we are active.
Our direct sales team serves as both our exclusive sales channel and our account management function and is organized by geographic region across the Americas, EMEA, and APAC. We augment our sales professionals with a presales team possessing insurance domain and technical expertise, who engage customers in sessions to understand their specific business needs and then represent our products through demonstrations tailored to address those needs.
Our marketing team supports sales with competitive analysis and sales tools, while investing to strengthen our brand name and reputation. We participate at industry conferences, are published frequently in the industry press and have active relationships with all of the major industry analysts. We also host Connections, our annual user conference where customers both participate in and deliver presentations on a wide range of Guidewire and insurance technology topics. We invite potential customers and partners to our user conference, as we believe customer references are a key component of driving new sales. Our strong relationships with leading system integrators enhance our direct sales through co-marketing efforts and by providing additional market validation of the distinctiveness and quality of our offerings.
Research and Development
Our research and development efforts focus on enhancing our products to meet the increasingly complex requirements of P&C insurers by broadening the capabilities and delivery options of Guidewire InsurancePlatform and its associated applications. These efforts are intended to help our customers improve their operations; drive greater digital engagement with their customers, agents and brokers; and gather, store and analyze data to improve business decisions. We also invest significantly in developing the product definitions and integrations necessary to have our applications meet the market requirements of each country or state in which we sell our software. This market-segment specific functionality must be updated regularly in order to stay current with
5
regulatory changes in each market. We rely on a multi-national engineering team, which has grown organically and through acquisitions.
Competition
The software market that caters to the P&C insurance industry is highly competitive and fragmented. Increased spending by carriers on software solutions and the emergence of new platforms that have broadened from core system modernization to new digital engagement and data and analytics solutions, have generated significant interest among investors and entrepreneurs. Increased capital allows market participants to adopt more aggressive go-to-market strategies, improve existing products, introduce new ones, and consolidate with other vendors. This market is also subject to changing technology preferences, shifting customer needs and the introduction of new cloud-delivered models. This creates an environment of increasing competition. Our current and future competitors vary in size and in the breadth and scope of the products and services they offer. Our current competitors include, but are not limited to:
Internally developed software | Many large insurance companies have sufficient IT resources to maintain and augment their own proprietary internal systems, or to consider developing new custom systems; | |
Technology services firms | Firms such as DXC Technology, NTT Data, and Tata Consultancy Services Limited offer software and systems or develop custom, proprietary solutions for the P&C insurance industry; | |
P&C insurance software vendors | Vendors such as 1insurer (formerly Innovation Group), CodeObjects, Duck Creek, eBaoTech Corporation, EIS Group, Fadata AD, FINEOS, Insurity, Inc., Keylane/Quinity, Majesco, OneShield, Inc., Patriot Technology Solutions, Prima Solutions, RGI, Sapiens International Corporation, StoneRiver, Inc., and TIA Technology A/S provide software solutions that are specifically designed to meet the needs of P&C insurers; and | |
Horizontal software vendors | Vendors such as Pegasystems Inc. and SAP AG offer software that can be customized to address the needs of P&C insurers. | |
Competitive factors in our industry depend on the product being offered, and the size, geographic market, and line of business of potential customers. The principal competitive factors include product functionality, performance, customer references, total cost of ownership, solution completeness, implementation track record, and in-depth knowledge of the P&C insurance industry. We typically compete favorably on the basis of these factors in most geographies.
As we expand our product portfolio, we may begin to compete with software and service providers we have not previously competed against. For example, companies such as Verisk, SAS, IBM and Towers Watson offer data and analytics tools that may, in time, be more competitive than our offerings. Some of these potential competitors may also acquire companies which offer P&C insurance software.
Intellectual Property
The software industry is characterized by the existence of a large number of patents and frequent claims and related litigation regarding patent and other intellectual property rights. Our success and ability to compete depend in part upon our ability to protect our proprietary technology, to establish and adequately protect our intellectual property rights, and to protect against third-party claims and litigation related to intellectual property. To accomplish these objectives, we rely on a combination of patent, trademark, copyright, and trade secret laws in the United States and other jurisdictions, as well as license agreements and other contractual protections. We own or have pending a significant number of patents and patent applications, which generally apply to our software. Our owned patents have expiration dates starting in 2025. We also rely on several registered and unregistered trademarks, as well as pending applications for such registrations, in order to protect our brand both in the United States and internationally.
Employees
As of July 31, 2018, we had 2,292 employees, including 838 in professional services, 121 in technical support and licensing operations, 749 in research and development, 329 in sales and marketing, and 255 in general and administrative roles. As of July 31, 2018, we had 1,466 employees in the United States and 826 employees internationally. Our employees in the United States are not represented by a labor union, however, in certain foreign locations, there are workers’ councils that represent our employees. We have not experienced any work stoppages and we consider our relations with our employees to be good.
Information about Segment and Geographic Revenue
6
Information about segment and geographic revenue is set forth in Note 11 of the Notes to Consolidated Financial Statements under Item 8 of this Annual Report on Form 10-K.
Seasonality
We have historically experienced seasonal variations in our license and other revenue as a result of increased customer orders in our second and fourth fiscal quarters. We generally see a modest increase in orders in our second fiscal quarter, which is the quarter ending January 31, due to customer buying patterns. We also see increased orders in our fourth fiscal quarter, which is the quarter ending July 31, due to efforts by our sales team to achieve annual incentives. This seasonal pattern, however, may be absent in any given year. For example, the timing of a small number of large transactions or the entry into term license agreements with a term of more than two years may be sufficient to disrupt seasonal revenue trends. Additionally, the adoption of Accounting Standards Codification 606 - Revenue from Contracts with Customers (“ASC 606”) will also heighten the seasonal impact on our new term licenses that are multi-year in nature with more revenue recognized upfront upon delivery of our software. On an annual basis, our maintenance revenue which is recognized ratably, may also be impacted in the event that seasonal patterns change significantly. During fiscal years in which subscriptions increase as a percentage of total sales, the revenue we can recognize in such fiscal year will be reduced, deferred revenue will increase, and our reported revenue growth will be adversely affected due to the ratable nature of these arrangements. The seasonal nature of our sales and the concentration of such sales in our fourth fiscal quarter magnifies this impact.
Our services revenue is also subject to seasonal fluctuations, though to a lesser degree than our license revenue. Our services revenue is impacted by the number of billable days in a given fiscal quarter. The fiscal quarter ended January 31 usually has fewer billable days due to the impact of the Thanksgiving, Christmas and New Year’s holidays. The fiscal quarter ended July 31 usually has fewer billable days due to the impact of vacation times taken by our professional staff. Because we pay our services professionals the same amounts throughout the year, our gross margins on our services revenue is usually lower in these quarters. This seasonal pattern, however, may be absent in any given year.
WHERE YOU CAN FIND MORE INFORMATION
The following filings are available to view and download free of charge on our investor relations website after we file them with the Securities and Exchange Commission (“SEC”): Annual Report on Form 10-K, Quarterly Reports on Form 10-Q, Current Reports on Form 8-K and our Proxy Statement for our annual meeting of stockholders. Our website is located at www.guidewire.com, and our investor relations website is located at http://ir.guidewire.com/. We also provide a link to the section of the SEC’s website at www.sec.gov that has all of our public filings, including periodic reports, proxy statements and other information. Further, a copy of this Annual Report on Form 10-K is located at the SEC’s Public Reference Room at 100 F Street, NE, Washington, D.C. 20549. Information on the operation of the Public Reference Room can be obtained by calling the SEC at 1-800-SEC-0330.
We webcast our earnings calls and certain events we participate in or host with members of the investment community on our investor relations website. Additionally, we provide notifications of news or announcements regarding our financial performance, including SEC filings, investor events, press and earnings releases as part of our investor relations website. Investors and others can receive notifications of new information posted on our investor relations website in real time by signing up for email alerts and RSS feeds. Further corporate governance information, including our governance guidelines and code of business conduct and ethics, is also available on our investor relations website under the heading “Corporate Governance.” The contents of our websites are not intended to be incorporated by reference into this Annual Report on Form 10-K or in any other report or document we file with the SEC, and any references to our websites are intended to be inactive textual references only.
7
Table of Contents
Item 1A. | Risk Factors |
A description of the risks and uncertainties associated with our business is set forth below. You should carefully consider such risks and uncertainties, together with the other information contained in this report, and in our other public filings. If any of such risks and uncertainties actually occurs, our business, financial condition or results of operations could differ materially from the plans, projections and other forward-looking statements included in the section titled “Management’s Discussion and Analysis of Financial Condition and Results of Operations” and elsewhere in this report and in our other public filings. In addition, if any of the following risks and uncertainties, or if any other risks and uncertainties, actually occurs, our business, financial condition or results of operations could be harmed substantially, which could cause the market price of our stock to decline, perhaps significantly.
Risks Related to our Business
We may experience significant quarterly and annual fluctuations in our results of operations due to a number of factors.
Our quarterly and annual results of operations may fluctuate significantly due to a variety of factors, many of which are outside of our control. This variability may lead to volatility in our stock price as investors and research analysts respond to quarterly fluctuations. In addition, comparing our results of operations on a period-to-period basis, particularly on a sequential quarterly basis, may not be meaningful. You should not rely on our past results as an indication of our future performance.
Factors that may affect our results of operations include:
• | the ability to attract new domestic and international customers and the timing of new orders and revenue recognition for new and prior year orders; |
• | seasonal buying patterns of our customers; |
• | the proportion and timing of subscription sales as opposed to term software licenses, and the variations in revenue recognition between the two contract types; |
• | changes in contract durations of term software licenses; |
• | introduction of new cloud-based, or the increase of existing, licensing models that feature ratable revenue recognition; |
• | our ability to develop and achieve market adoption of cloud-based services; |
• | increases in cloud-related development and services costs; |
• | erosion in services margins or significant fluctuations in services revenue caused by changing customer demand; |
• | our ability to realize expected benefits from our acquisitions; |
• | the lengthy and variable nature of our product implementation cycles; |
• | future accounting pronouncements or changes in accounting rules or our accounting policies. |
• | volatility in the sales of our products and the execution timing of new and renewal agreements within such periods; |
• | our ability to increase sales to and renew agreements with our existing customers, particularly larger customers; |
• | the structure of our licensing contracts, including delayed payment or acceptance terms and escalating payments, including fluctuations in perpetual licenses from period to period; |
• | our ability to enter into contracts on favorable terms, including terms related to price, payment timing and product delivery with customers and prospects that possess substantial negotiating leverage and procurement expertise; |
• | the incurrence of penalties for failing to meet certain contractual obligations, including service levels and implementation times; |
• | reductions in our customers’ budgets for information technology purchases and delays in their purchasing cycles; |
• | variations in the amount of policies sold by our customers, where pricing to such customers is based on the direct written premium that is managed by our solutions; |
• | the timing of hiring personnel and employee related expenses; |
• | the impact of a recession or any other adverse global economic conditions on our business, including trade tariffs and other uncertainties that may cause a delay in entering into or a failure to enter into significant customer agreements; |
• | fluctuations in foreign currency exchange rates; and |
• | unanticipated trade sanctions and other restrictions that may impede our ability to sell internationally. |
The foregoing factors are difficult to forecast, and these, as well as other factors, could materially adversely affect our quarterly and annual results of operations. Further, in light of the transition to ASC 606 for revenue recognition, our recent changes to the length of license agreements, and our increased cloud-based subscription services, among other ongoing changes to our business, it is challenging to forecast our quarterly and annual results. We believe our ability to adjust spending quickly enough
8
to compensate for a revenue shortfall is very limited and our inability to do so could magnify the adverse impact of such revenue shortfall on our results of operations. If we fail to achieve our quarterly forecasts, if our forecasts fall below the expectations of investors or research analysts, or if our actual results fail to meet the expectations of investors or research analysts, our stock price may decline.
Seasonal sales patterns and other variations related to our revenue recognition may cause significant fluctuations in our results of operations and cash flows and may prevent us from achieving our quarterly or annual forecasts, which may cause our stock price to decline.
We have signed a higher percentage of software license orders in the second and fourth quarters of each fiscal year. We generally see increased orders in our second fiscal quarter, which is the quarter ended January 31, due to customer buying patterns, and our sales are typically greatest in the fourth fiscal quarter due to efforts by our sales team to achieve annual incentives. As a result, a significantly higher percentage of our annual license revenue has historically been recognized in our second and fourth fiscal quarters. Since a substantial majority of our license revenue has annual renewals after the initial term of the contract, we expect to continue to experience this seasonality effect in subsequent years. Further, the adoption of ASC 606 for revenue recognition will heighten the seasonal impact on our new term licenses that are multi-year in nature with more revenue recognized upfront upon delivery of our software. However, we currently anticipate that sales of subscription services will increase as a percentage of new and total yearly sales. Subscriptions are recognized ratably over the term of the agreement after provisioning of the software, which may take as many as 90 days for our more complex implementations. Over time, this may reduce the impact of our historic seasonality, but in the near term the introduction of proportionally more subscription services into our revenue stream, together with their delayed and ratable recognition, will likely impact quarter over quarter and year over year revenue growth comparisons. The concentration of sales in the fourth fiscal quarter, including sales of subscription services, may exacerbate this effect.
Our quarterly growth in license revenue also may not match up to new orders we receive in a given quarter, which could mask the impact of seasonal variations. This mismatch is primarily due to the following reasons:
• | for the initial year of a multi-year term license, revenue recognition may not occur in the period when the order is placed due to certain revenue recognition criteria not being met; |
• | we may enter into license agreements with future product delivery requirements or specified terms for product upgrades or functionality, which may require us to delay revenue recognition for the initial period; |
• | our term licenses may include payment terms that escalate every year and may be modest in the first year; and |
• | our subscription arrangements are recognized ratably and only a portion of the revenue from an order is recognized in the same fiscal period of the order. |
Additionally, seasonal patterns may be affected by the timing of particularly large transactions. For example, in fiscal year 2017, we achieved higher revenue growth in the third fiscal quarter than in the fourth fiscal quarter due to the effects of a single large contract that was entered into in the third fiscal quarter.
Our revenue may fluctuate versus comparable prior periods or prior quarters within the same fiscal year based on the terms of the agreements and the timing of new orders executed in the quarter. Our ability to renew existing contracts for multiple year terms versus annual automatic renewals may also impact revenue recognition.
We generally charge annual software license fees for our multi-year term licenses and price our licenses based on the amount of direct written premiums (“DWP”) that will be managed by our solutions. However, in certain circumstances, our customers desire the ability to purchase our products on a perpetual license basis, resulting in an acceleration of revenue recognition. Milestone payments in a perpetual license order also cause seasonal variations. Our perpetual license revenue is not necessarily consistent from period to period. In addition, a few of our multi-year term licenses provide the customer with the option to purchase a perpetual license at the end of the initial contract term, which we refer to as a perpetual buyout right. The mix of our contract terms for our licenses and the exercise of perpetual buyout rights at the end of the initial contract term by our customers may lead to variability in our revenue. Increases in perpetual license sales and exercises of perpetual buyout rights by our customers may affect our ability to show consistent growth in license revenue in subsequent periods. Reductions in perpetual licenses in future periods could cause adverse period-to-period comparisons of our financial results.
Seasonal and other variations related to our revenue recognition may cause significant fluctuations in our results of operations and cash flows, may make it challenging for an investor to predict our performance on a quarterly basis and may prevent us from achieving our quarterly or annual forecasts or meeting or exceeding the expectations of research analysts or investors, which in turn may cause our stock price to decline.
9
We have relied and expect to continue to rely on orders from a relatively small number of customers in the P&C insurance industry for a substantial portion of our revenue, and the loss of any of these customers would significantly harm our business, results of operations and financial condition.
Our revenue is dependent on orders from customers in the P&C insurance industry, which may be adversely affected by economic, environmental and world political conditions. A relatively small number of customers have historically accounted for a significant portion of our revenue. While the composition of our individual top customers will vary from year to year, in fiscal years 2018, 2017 and 2016, our ten largest customers accounted for 31%, 27% and 27% of our revenue, respectively. Customers for this metric are measured at the parent corporation level, while our total customer count is measured at the purchasing entity level. While we expect this reliance to decrease over time, we expect that we will continue to depend upon a relatively small number of customers for a significant portion of our revenue for the foreseeable future. As a result, if we fail to successfully sell our products and services to one or more of these anticipated customers in any particular period or fail to identify additional potential customers or such customers purchase fewer of our products or services, defer or cancel orders, fail to renew their license or subscription agreements or otherwise terminate their relationship with us, our business, results of operations and financial condition would be harmed. Additionally, if our sales to one or more of these anticipated customers in any particular period are ratable in nature, or if we fail to achieve the required performance or acceptance criteria for one or more of these relatively small number of customers, our quarterly and annual results of operations may fluctuate significantly.
If we are required to, and fail to, successfully manage any changes to our business model, including the transition of our products to cloud offerings, our results of operations could be harmed.
To address demand trends in the P&C insurance industry, we now offer customers the use of our software products through a cloud-based offering in addition to our on-premises offering. This adjustment to our business model requires a considerable investment of technical, financial, legal and sales resources. Our software and cloud services involve the storage and transmission of data, including in some cases, personal data, and security breaches could result in the loss of this information, which in turn could result in litigation, breach of contract claims, indemnity obligations and other liabilities for us. Our transition to cloud offerings will continue to divert resources and increase costs, especially in cost of license and other revenue, in any given period. Such investments may not improve our long-term growth and results of operations. Further, the increase in some costs associated with our cloud services, such as the cost of public infrastructure, may be difficult to predict over time, especially in light of our lack of historical experience with the costs of delivering cloud-based versions of our applications. Our subscription contracts also contain penalty clauses, for matters such as failing to meet stipulated service levels, which represent new risks we are not accustomed to managing. Should these penalties be triggered, our results of operations may be adversely affected. Furthermore, we may assume greater responsibilities for implementation related services during this transition. As a result, we may face risks associated with new and complex implementations, the cost of which may differ from original estimates. As with our stated history, the consequences in such circumstances could include: monetary credits for current or future service engagements, reduced fees for additional product sales, and a customer’s refusal to pay their contractually-obligated subscription or service fees.
We expect the revenue we would recognize under our cloud-based subscription model to be recognized ratably over the term of the contract. The transition to ratable revenue recognition may reduce license revenue we otherwise would have recognized in those periods in which the portion of our revenue attributable to ratable subscription contracts grows. This effect on recognized revenue may be magnified in any fiscal year due to the concentration of our orders in the fourth fiscal quarter. A combination of increased costs and delayed recognition of revenue would adversely impact our gross and operating margins during those periods.
In addition, market acceptance of our cloud-based offerings may be affected by a variety of factors, including but not limited to: price, security, reliability, performance, customer preference, public concerns regarding privacy and the enactment of restrictive laws or regulations. We are in the early stages of re-architecting our existing products and developing new products in an effort to offer customers greater choices on how they consume our software. As our business practices in this area develop and evolve over time, we may be required to revise the subscription agreements we initially develop in connection with this transition, which may result in revised terms and conditions that impact how we recognize revenue and the costs and risks associated with these offerings. Whether our product development efforts or business model transition will prove successful and accomplish our business objectives is subject to numerous uncertainties and risks, including but not limited to: customer demand, our ability to further develop and scale infrastructure, our ability to include functionality and usability in such offerings that address customer requirements, tax and accounting implications, and our costs. In addition, the metrics we and our investors use to gauge the status of our business model transition may evolve over the course of the transition as significant trends emerge. It may be difficult, therefore, to accurately determine the impact of this transition on our business on a contemporaneous basis, or to clearly communicate the appropriate metrics to our investors. If we are unable to successfully establish these new cloud offerings and navigate our business model transition in light of the foregoing risks and uncertainties, our reputation could suffer and our results of operations could be harmed, which may cause our stock price to decline.
Increases in services revenue as a percentage of total revenue or lower services margins could adversely affect our overall gross margins and profitability.
10
Our services revenue was 41%, 34% and 34% of total revenue for each of fiscal years 2018, 2017 and 2016, respectively. Our services revenue produces lower gross margins than our license revenue. The gross margin of our services revenue was 8%, 7% and 8% for fiscal years 2018, 2017 and 2016, respectively, while the gross margin for license revenue was 89%, 94% and 97% for fiscal years 2018, 2017 and 2016, respectively. An increase in the percentage of total revenue represented by services revenue, like we experienced in fiscal year 2018 due to acquisitions and the recognition of revenue on certain cloud-based implementations that were completed in prior years, or lower services margins could reduce our overall gross margins and operating margins. Such a trend can be the result of several factors, some of which may be beyond our control, including increased customer demand for our service team involvement in new products and services, the rates we charge for our services, our ability to bill our customers for all time incurred to complete a project, and the extent to which system integrators are willing and able to provide services directly to customers. Erosion in our services margins would also adversely affect our gross and operating margins. Services margins may erode for a period of time as we work to grow our business and overall revenue; for instance, services margins may erode if we hire and train additional services personnel to support new products including cloud-based services, if we require additional service personnel to support entry into new markets, or if we require additional personnel on unexpectedly difficult projects to ensure customer success, perhaps without commensurate compensation.
Services margins may also decline if we are required to defer services revenue in connection with an engagement. This may happen for a number of reasons, including if there is a specific product deliverable associated with a broader services engagement. In these situations, we would defer only the direct costs associated with the engagement. Deferring all revenue but only direct costs will reduce margins. In fiscal year 2017, for example, we deferred a significant amount of revenue and direct costs associated with one project, which reduced margins and reported services revenue during fiscal year 2017, and increased margins and services revenue during fiscal year 2018 when certain amounts of this deferred revenue were recognized.
Assertions by third parties of infringement or other violation by us of their intellectual property rights could result in significant costs and substantially harm our business and results of operations.
The software industry is characterized by the existence of a large number of patents and frequent claims and related litigation regarding patents and other intellectual property rights. In particular, leading companies in the software industry own large numbers of patents, copyrights, trademarks and trade secrets, which they may use to assert claims against us. From time to time, third parties holding such intellectual property rights, including leading companies, competitors, patent holding companies and/or non-practicing entities, may assert patent, copyright, trademark or other intellectual property claims against us, our customers and partners, and those from whom we license technology and intellectual property.
Although we believe that our products and services do not infringe upon the intellectual property rights of third parties, we cannot assure that third parties will not assert infringement or misappropriation claims against us with respect to current or future products or services, or that any such assertions will not require us to enter into royalty arrangements or result in costly litigation, or result in us being unable to use certain intellectual property. We cannot assure that we are not infringing or otherwise violating any third-party intellectual property rights. Infringement assertions from third parties may involve patent holding companies or other patent owners who have no relevant product revenue, and therefore our own issued and pending patents may provide little or no deterrence to these patent owners in bringing intellectual property rights claims against us.
If we are forced to defend against any infringement or misappropriation claims, whether they are with or without merit, are settled out of court, or are determined in our favor, we may be required to expend significant time and financial resources on the defense of such claims. Furthermore, an adverse outcome of a dispute may require us to pay damages, potentially including treble damages and attorneys’ fees, if we are found to have willfully infringed a party’s intellectual property; cease making, licensing or using our products or services that are alleged to infringe or misappropriate the intellectual property of others; expend additional development resources to redesign our products or services; enter into potentially unfavorable royalty or license agreements in order to obtain the right to use necessary technologies or works; and to indemnify our partners, customers, and other third parties. Any of these events could seriously harm our business, results of operations and financial condition.
We may expand through acquisitions or partnerships with other companies, which may divert our management’s attention and result in unexpected operating and technology integration difficulties, increased costs and dilution to our stockholders.
Our business strategy includes the potential acquisition of shares or assets of companies with software, technologies or businesses complementary to ours. Our strategy also includes alliances with such companies. For example, in March 2016, we acquired EagleEye Analytics Inc., a provider of cloud-based predictive analytics products designed for P&C insurers; in August 2016, we acquired FirstBest Systems, Inc., a provider of an underwriting management system for P&C insurers; in February 2017, we acquired ISCS, Inc., a provider of a cloud-based, all-in-one platform that offers policy, billing, and claims management functionality for P&C insurers; and in November 2017, we acquired Cyence, a Software-as-a-Service company that applies data science and risk analytics to enable P&C insurers to underwrite “21st century risks” such as terrorism, cybersecurity, and reputational risk. Each of these acquisitions was initially dilutive to earnings. Acquisitions and alliances may result in unforeseen operating
11
difficulties and expenditures and may not result in the benefits anticipated by such corporate activity. In particular, we may fail to assimilate or integrate the businesses, technologies, services, products, personnel or operations of the acquired companies, retain key personnel necessary to favorably execute the combined companies’ business plan, or retain existing customers or sell acquired products to new customers. Acquisitions and alliances may also disrupt our ongoing business, divert our resources and require significant management attention that would otherwise be available for ongoing development of our current business. In addition, we may be required to make additional capital investments or undertake remediation efforts to ensure the success of our acquisitions, which may reduce the benefits of such acquisitions. We also may be required to use a substantial amount of our cash or issue debt or equity securities to complete an acquisition or realize the potential of an alliance, which could deplete our cash reserves and/or dilute our existing stockholders. Following an acquisition or the establishment of an alliance offering new products, we may be required to defer the recognition of revenue that we receive from the sale of products that we acquired or that result from the alliance, or from the sale of a bundle of products that includes such new products. In addition, our ability to maintain favorable pricing of new products may be challenging if we bundle such products with sales of existing products. A delay in the recognition of revenue from sales of acquired or alliance products, or reduced pricing due to bundled sales, may cause fluctuations in our quarterly financial results, may adversely affect our operating margins and may reduce the benefits of such acquisitions or alliances.
Additionally, competition within the software industry for acquisitions of businesses, technologies and assets has been, and may continue to be, intense. As such, even if we are able to identify an acquisition that we would like to pursue, the target may be acquired by another strategic buyer or financial buyer such as a private equity firm, or we may otherwise not be able to complete the acquisition on commercially reasonable terms, if at all. Moreover, in addition to our failure to realize the anticipated benefits of any acquisition, including our revenue or return on investment assumptions, we may be exposed to unknown liabilities or impairment charges as a result of acquisitions we do complete.
We face intense competition in our market, which could negatively impact our business, results of operations and financial condition and cause our market share to decline.
The market for our software and services is intensely competitive. The competitors we face in any sale may change depending on, among other things, the line of business purchasing the software, the application being sold, the geography in which we are operating and the size of the insurance carrier to which we are selling. For example, we are more likely to face competition from small independent firms when addressing the needs of small insurers. These competitors may compete on the basis of price, the time and cost required for software implementation, custom development, or unique product features or functions. Outside of the United States, we are more likely to compete against vendors that may differentiate themselves based on local advantages in language, market knowledge and pre-built content applicable to that jurisdiction. We also compete with vendors of horizontal software products that may be customized to address needs of the P&C insurance industry.
Additionally, many of our prospective customers operate firmly entrenched legacy systems, some of which have been in operation for decades. Our implementation cycles may be lengthy, variable and require the investment of significant time and expense by our customers. These expenses and associated operating risks attendant on any significant process of re-engineering and technology implementation exercise, may cause customers to prefer maintaining legacy systems. Also, maintaining these legacy systems may be so time consuming and costly for our customers that they do not have adequate resources to devote to the purchase and implementation of our products. We also compete against technology consulting firms that either helped create such legacy systems or may own, in full or in part, subsidiaries that develop software and systems for the P&C insurance industry.
As we expand our product portfolio, we may begin to compete with software and service providers we have not competed against previously. Such potential competitors offer data and analytics tools that may, in time, become more competitive with our offerings.
We expect the intensity of competition to remain high in the future, as the amount of capital invested in current and potential competitors has increased significantly in recent years, and this may lead to improved product or sales capabilities, which in turn could lead to new or expanded partnerships with systems integrators. Continuing intense competition could result in increased pricing pressure, increased sales and marketing expenses, and greater investments in research and development, each of which could negatively impact our profitability. In addition, the failure to increase, or the loss of market share, would harm our business, results of operations, financial condition and/or future prospects. Our larger current and potential competitors may be able to devote greater resources to the development, promotion and sale of their products than we can devote to ours, which could allow them to respond more quickly than we can to new technologies and changes in customer needs, thus leading to their wider market acceptance. We may not be able to compete effectively and competitive pressures may prevent us from acquiring and maintaining the customer base necessary for us to increase our revenue and profitability.
In addition, our industry is evolving rapidly and we anticipate the market for cloud-based solutions will become increasingly competitive. If our current and potential customers move a greater proportion of their data and computational needs to the cloud, new competitors may emerge that offer services either comparable or better suited than ours to address the demand for such cloud-based solutions, which could reduce demand for our offerings. To compete effectively we will likely be required to increase our
12
investment in research and development, as well as the personnel and third-party services required to improve reliability and lower the cost of delivery of our cloud-based solutions. This may increase our costs more than we anticipate and may adversely impact our results of operations.
Our current and potential competitors may also establish cooperative relationships among themselves or with third parties to further enhance their resources and offerings. Current or potential competitors may be acquired by other vendors or third parties with greater available resources. As a result of such acquisitions, our current or potential competitors might be more able than we are to adapt quickly to new technologies and customer needs, to devote greater resources to the promotion or sale of their products and services, to initiate or withstand substantial price competition, or to take advantage of emerging opportunities by developing and expanding their product and service offerings more quickly than we can. Additionally, they may hold larger portfolios of patents and other intellectual property rights as a result of such relationships or acquisitions. If we are unable to compete effectively with these evolving competitors for market share, our business, results of operations and financial condition could be materially and adversely affected.
If our products or cloud-based services experience data security breaches, and there is unauthorized access to our customers’ data, we may lose current or future customers and our reputation and business may be harmed.
If our security measures are breached or unauthorized access to customer data is otherwise obtained, our products may be perceived as not being secure, customers may reduce the use of or stop using our products, and we may incur significant liabilities. Our software and cloud services involve the storage and transmission of data, including in some cases, personal data, and security breaches could result in the loss of this information, which in turn could result in litigation, breach of contract claims, indemnity obligations and other liability for our company. While we have taken steps to protect the confidential information to which we have access, including confidential information we may obtain through our customer support services or customer usage of our cloud-based services, our security measures could be breached. We rely on third-party technology and systems for a variety of services, including, without limitation, encryption and authentication technology, employee email, content delivery to customers, back-office support and other functions, and our ability to control or prevent breaches of any of these systems may be beyond our control. Because techniques used to obtain unauthorized access or sabotage systems change frequently and generally are not identified until they are launched against a target, we may be unable to anticipate these techniques or to implement adequate preventative measures. Although we have developed systems and processes that are designed to protect customer information and prevent data loss and other security breaches, including systems and processes designed to reduce the impact of a security breach at a third-party vendor, such measures cannot provide absolute security. Any or all of these issues could negatively impact our ability to attract new customers or to increase engagement by existing customers, could cause existing customers to elect not to renew their term licenses or subscription agreements, or could subject us to third-party lawsuits, regulatory fines or other action or liability, thereby adversely affecting our results of operations.
The nature of our business requires the application of complex revenue and expense recognition rules that require management to make estimates and assumptions. Additionally, the current legislative and regulatory environment affecting United States Generally Accepted Accounting Principles ("GAAP") is uncertain and significant changes in current principles could affect our financial statements going forward.
The preparation of financial statements in conformity with GAAP requires management to make estimates and assumptions that affect the amounts reported in the consolidated financial statements. We base our estimates on historical experience and on various other assumptions that we believe to be reasonable under the circumstances, the results of which form the basis for making judgments about the carrying values of assets, liabilities, equity, revenue and expenses that are not readily apparent from other sources.
While we believe that our financial statements have been prepared in accordance with accounting principles generally accepted in the United States, we cannot predict the impact of future changes to accounting principles or our accounting policies on our financial statements going forward. In addition, were we to change our critical accounting estimates, including the timing of recognition of license revenue and other revenue sources, our reported revenue and results of operations could be significantly impacted.
The accounting rules and regulations that we must comply with are complex. Additionally, the Financial Accounting Standards Board (the "FASB") and the Securities and Exchange Commission have focused on the integrity of financial reporting, and many companies' accounting policies are being subject to heightened scrutiny by regulators and the public. Further, the accounting rules and regulations are continually changing in ways that could materially impact our financial statements.
The FASB issued ASC 606, accounting guidance on revenue recognition, that became effective for us on August 1, 2018. The standard permits the use of either the full retrospective or modified retrospective method. We selected the modified retrospective method. While we continue to finalize the impact this guidance will have on our financial condition and results of operations, any change in how we recognize revenue can have a significant impact on our quarterly or annual financial results from operations.
13
In order to reduce the risk of financial statement volatility, we revised our contracting practices primarily by shortening the initial non-refundable term of our licenses. If we are unsuccessful in adapting our business to the requirements of the new revenue standard, or if changes to our go-to-market strategy create new risks, then we may experience greater volatility in our quarterly and annual results, which may cause our stock price to decline. In addition to greater volatility, the application of this new standard may result in a material adverse effect on our recognized revenue and net income, despite no change in associated cash flows on the date of adoption. Further, under ASC 606, more judgment and estimates will be required within the revenue recognition process than are required under existing GAAP. We currently anticipate that this standard could create volatility in our reported revenue and results of operations, which could negatively impact our stock price.
We have implemented a new enterprise resource planning system as well as other accounting and sales IT systems. If these new systems prove ineffective, or if we experience issues with the transition from our current systems, we may be unable to timely or accurately prepare financial reports, or invoice and collect from our customers.
In fiscal year 2017, we began the process of implementing a new enterprise resource planning (“ERP”) system and other accounting systems, including a new revenue reporting system in advance of the adoption of ASC 606 in fiscal year 2019. These systems are critical for accurately maintaining books and records and preparing our financial statements. We have completed the transition to our new ERP system and have begun using the new revenue reporting system at the beginning of fiscal year 2019. While we have invested significant amounts, including for additional personnel and third party consultants, to implement these systems, we cannot assure you that we will not experience difficulties following the transition. Any errors in our new ERP system could adversely affect our operations, including our ability to accurately report our financial results in a timely manner, file our quarterly or annual reports with the SEC, and invoice and collect from our customers, each of which may harm our operations and reduce investor confidence. Data integrity problems or other issues may be discovered even though the transition is complete which, if not corrected, could impact our business, reputation or results of operations. If we encounter unforeseen difficulties with our new ERP and revenue systems, there will be additional demands on our management team and our business, operations and results of operations could be adversely affected.
Our customers may defer or forego purchases of our products or services in the event of weakened global economic conditions, political transitions, and industry consolidation.
General worldwide economic conditions remain unstable. Prolonged economic uncertainties or downturns could harm our business operations or financial results. For example, the decision by referendum to withdraw the United Kingdom (U.K.) from the European Union (“Brexit”) in June 2016 caused significant volatility in global stock markets and fluctuations in currency exchange rates and the impending Brexit has arguably caused and may continue to cause delays in purchasing decisions by our potential and current customers affected by this transition. The results of this referendum, or other global events such as the recent imposition of various trade tariffs, may continue to create global economic uncertainty not only in the U.K., but in other regions in which we have significant operations. These conditions make it difficult for our customers and us to forecast and plan future business activities accurately, and they could cause our customers to reevaluate their decision to purchase our products, which could delay and lengthen our sales cycles or result in cancellations of planned purchases. Furthermore, during challenging economic times our customers may face issues in gaining timely access to sufficient credit, which could result in an impairment of their ability to make timely payments to us. If that were to occur, we may not receive amounts owed to us and may be required to record an allowance for doubtful accounts, which would adversely affect our financial results. A substantial downturn in the P&C insurance industry may cause firms to react to worsening conditions by reducing their capital expenditures, reducing their spending on information technology, delaying or canceling information technology projects, or seek to lower their costs by renegotiating vendor contracts. Negative or worsening conditions in the general economy both in the United States and abroad, including conditions resulting from financial and credit market fluctuations, could cause a decrease in corporate spending on enterprise software in general, and in the insurance industry specifically, and negatively affect the rate of growth of our business.
The increased pace of consolidation in the P&C insurance industry may result in reduced overall spending on our products. Acquisitions of customers can delay or cancel sales cycles and because we cannot predict the timing or duration of such acquisitions, our results of operations could be materially impacted by the change in the industry.
Factors outside of our control including but not limited to natural catastrophes and terrorism may adversely impact the P&C insurance industry, preventing us from expanding or maintaining our existing customer base and increasing our revenue.
Our customers are P&C insurers which have experienced, and will likely experience in the future, losses from catastrophes or terrorism that may adversely impact their businesses. Catastrophes can be caused by various events, including, without limitation, hurricanes, tsunamis, floods, windstorms, earthquakes, hail, tornadoes, explosions, severe weather and fires. Global warming trends are contributing to an increase in erratic weather patterns globally and intensifying the impact of certain types of catastrophes. Moreover, acts of terrorism or war could cause disruptions to our business or our customers’ businesses or the economy as a whole.
14
The risks associated with natural catastrophes and terrorism are inherently unpredictable, and it is difficult to forecast the timing of such events or estimate the amount of losses they will generate. In both 2017 and 2018, for example, parts of the United States suffered extensive damage due to multiple hurricanes and fires. We anticipate the combined effect of those losses on P&C insurers to be very large. Such losses and losses due to future events may adversely impact our current or potential customers, which may prevent us from maintaining or expanding our customer base and increasing our revenue as such events may cause customers to postpone purchases of new offerings and professional service engagements or to discontinue existing projects.
Our sales and implementation cycles are lengthy and variable, depend upon factors outside our control, and could cause us to expend significant time and resources prior to generating revenue.
The typical sales cycle for our products and services is lengthy and unpredictable, requires pre-purchase evaluation by a significant number of employees in our customers’ organizations, and often involves a significant operational decision by our customers. Our sales efforts involve educating our customers about the use and benefits of our products, including the technical capabilities of our products and the potential cost savings achievable by organizations deploying our products. Customers typically undertake a significant evaluation process, which frequently involves not only our products, but also those of our competitors and can result in a lengthy sales cycle. We spend substantial time, effort and money in our sales efforts without any assurance that our efforts will produce sales. Even if we succeed at completing a sale, we may be unable to predict the size of an initial license until very late in the sales cycle. In addition, we sometimes commit to include specific functions in our base product offering at the request of a customer or group of customers and are unable to recognize license revenue until the specific functions have been added to our products. Providing this additional functionality may be time consuming and may involve factors that are outside of our control. Customers may also insist that we commit to certain time frames in which systems built around our products will be operational, or that once implemented our products will be able to meet certain operational requirements. Our ability to meet such timeframes and requirements may involve factors that are outside of our control, and failure to meet such timeframes and requirements could result in us incurring penalties, costs and/or additional resource commitments, which would adversely affect our business and results of operations.
The implementation and testing of our products by our customers typically lasts 6 to 24 months or longer and unexpected implementation delays and difficulties can occur. Implementing our products typically involves integration with our customers’ and third-party’s systems, as well as adding customer and third-party data to our platform. This can be complex, time consuming and expensive for our customers and can result in delays in the implementation and deployment of our products. Failing to meet the expectations of our customers for the implementation of our products could result in a loss of customers and negative publicity about us and our products and services. Such failure could result from deficiencies in our product capabilities or inadequate service engagements by us, our system integrator partners or our customers’ employees, the latter two of which are beyond our direct control. The consequences of such failure could include, and have included: monetary credits for current or future service engagements, reduced fees for additional product sales or upon renewals of existing licenses, and a customer’s refusal to pay their contractually-obligated license, maintenance or service fees. In addition, time-consuming implementations may also increase the amount of services personnel we must allocate to each customer, thereby increasing our costs and adversely affecting our business, results of operations and financial condition.
If we are unable to continue the successful development of our global direct sales force and the expansion of our relationships with our strategic partners, sales of our products and services will suffer and our growth could be slower than we project.
We believe that our future growth will depend on the continued recruiting, retention and training of our global direct sales force and their ability to obtain new customers, both large and small P&C insurers, and to manage our existing customer base. Our ability to achieve significant growth in revenue in the future will depend, in large part, on our success in recruiting, training and retaining a sufficient number of global direct sales personnel. New hires require significant training and may, in some cases, take more than a year before becoming productive, if at all. If we are unable to hire and develop sufficient numbers of productive global direct sales personnel, sales of our products and services will suffer and our growth will be impeded.
We believe our future growth also will depend on the retention and expansion of successful relationships with system integrators, including with system integrators that will focus on products we may acquire in the future. Our system integrators as channel partners help us reach additional customers. Our growth in revenue, particularly in international markets, will be influenced by the development and maintenance of this indirect sales channel which, in some cases, may require the establishment of effective relationships with regional systems integrators. Although we have established relationships with some of the leading system integrators, our products and services may compete directly against products and services that such leading system integrators support or market. We are unable to control the quantity or quality of resources that our system integrator partners commit to implementing our products, or the quality or timeliness of such implementation. If our partners do not commit sufficient or qualified resources to these activities, our customers will be less satisfied, be less supportive with references, or may require the investment of our resources at discounted rates. These, and other failures by our partners to successfully implement our products, will have an adverse effect on our business and our results of operations could fail to grow in line with our projections.
15
Our large customers have substantial negotiating leverage, which may require that we agree to terms and conditions that result in increased cost of sales, decreased revenue and lower average selling prices and gross margins, all of which could harm our results of operations.
Some of our customers include the world’s largest P&C insurers. These customers have significant bargaining power when negotiating new licenses or subscriptions, or renewals of existing agreements, and have the ability to buy similar products from other vendors or develop such systems internally. These customers have and may continue to seek advantageous pricing and other commercial terms and may require us to develop additional features in the products we sell to them. We have been required to, and may continue to be required to, reduce the average selling price of our products in response to these pressures. If we are unable to avoid reducing our average selling prices, our results of operations could be harmed.
Failure of any of our established products or services to satisfy customer demands or to maintain market acceptance would harm our business, results of operations, financial condition and growth prospects.
We derive a significant majority of our revenue and cash flows from our established product offerings, including InsuranceSuite, InsuranceNow and our Digital and Data Products. We expect to continue to derive a substantial portion of our revenue from these sources. As such, continued market acceptance of these products is critical to our growth and success. Demand for our products is affected by a number of factors, some of which are beyond our control, including the successful implementation of our products, the timing of development and release of new products by us and our competitors, technological advances which reduce the appeal of our products, and the growth or contraction in the worldwide market for technological solutions for the P&C insurance industry. If we are unable to continue to meet customer demands, to achieve and maintain a technological advantage over competitors, or to maintain market acceptance of our products, our business, results of operations, financial condition and growth prospects may be adversely affected.
Our business depends on customers renewing and expanding their license, maintenance and subscription contracts for our products. A decline in our customer renewals and expansions could harm our future results of operations.
Our customers have no obligation to renew their term licenses or subscriptions after their contract period expires, and these licenses and subscriptions, if renewed, may be done so on less favorable terms. Moreover, under certain circumstances, our customers have the right to cancel their licenses or subscriptions before they expire. We may not accurately predict future trends in customer renewals. In addition, our perpetual license customers have no obligation to renew their maintenance arrangements after the expiration of the initial contractual period. Our customers’ renewal rates may fluctuate or decline because of several factors, including their satisfaction or dissatisfaction with our products and services, the prices of our products and services, the prices of products and services offered by our competitors or reductions in our customers’ spending levels due to the macroeconomic environment or other factors, or the sale of their operations to a buyer that is not a current customer.
Also, in some cases, our customers have a right to exercise a perpetual buyout of their term licenses at the end of the initial contract term, which if exercised would eliminate future term license payments. If our customers do not renew their term licenses or subscriptions for our solutions or renew on less favorable terms, our revenue may decline or grow more slowly than expected and our profitability may be harmed.
If we are unable to develop, introduce and market new and enhanced versions of our products, we may be put at a competitive disadvantage.
Our success depends on our continued ability to develop, introduce and market new and enhanced versions of our products to meet evolving customer requirements. Because some of our products are complex and require rigorous testing, development cycles can be lengthy, taking us multiple years to develop and introduce new products or provide updates to our existing products. Additionally, market conditions may dictate that we change the technology platform underlying our existing products or that new products be developed on different technology platforms, potentially adding material time and expense to our development cycles. The nature of these development cycles may cause us to experience delays between the time we incur expenses associated with research and development and the time we generate revenue, if any, from such expenses.
If we fail to develop new products or enhancements to our existing products, our business could be adversely affected, especially if our competitors are able to introduce products with enhanced functionality. It is critical to our success for us to anticipate changes in technology, industry standards and customer requirements and to successfully introduce new, enhanced and competitive products to meet our customers’ and prospective customers’ needs on a timely basis. We have invested and intend to increase investments in research and development to meet these challenges. Revenue may not be sufficient to support the future product development that is required for us to remain competitive. If we fail to develop products in a timely manner that are competitive in technology and price or develop products that fail to meet customer demands, our market share will decline and our business and results of operations could be harmed.
16
Real or perceived errors or failures in our products or implementation services may affect our reputation, cause us to lose customers and reduce sales which may harm our business and results of operations and subject us to liability for breach of warranty claims.
Because we offer complex products, undetected errors or failures may exist or occur, especially when products are first introduced or when new versions are released. Our products are often installed and used in large-scale computing environments with different operating systems, system management software and equipment and networking configurations, which may cause errors or failures in our products or may expose undetected errors, failures or bugs in our products. Despite testing by us, we may not identify all errors, failures or bugs in new products or releases until after commencement of commercial sales or installation. In the past, we have discovered software errors, failures and bugs in some of our product offerings after their introduction.
We provide our customers with upfront estimates regarding the duration, resources and costs associated with the implementation of our products. Failure to meet these upfront estimates and the expectations of our customers could result from our product capabilities or service engagements performed by us, our system integrator partners or our customers’ employees, the latter two of which are beyond our direct control. The consequences could include, and have included: monetary credits for current or future service engagements, reduced fees for additional product sales, and a customer’s refusal to pay their contractually-obligated license, maintenance or service fees. In addition, time-consuming implementations may also increase the amount of services personnel we must allocate to each customer, thereby increasing our costs and adversely affecting our business, results of operations and financial condition.
The license and support of our software creates the risk of significant liability claims against us. Our license and subscription agreements with our customers contain provisions designed to limit our exposure to potential liability claims. It is possible, however, that the limitation of liability provisions contained in such agreements may not be enforced as a result of international, federal, state and local laws or ordinances or unfavorable judicial decisions. Breach of warranty or damage liability, or injunctive relief resulting from such claims, could harm our results of operations and financial condition.
Failure to protect our intellectual property could substantially harm our business and results of operations.
Our success depends in part on our ability to enforce and defend our intellectual property rights. We rely upon a combination of trademark, trade secret, copyright, patent and unfair competition laws, as well as license agreements and other contractual provisions, to do so.
We have filed, and may in the future file, patent applications related to certain of our innovations. We do not know whether those patent applications will result in the issuance of a patent or whether the examination process will require us to narrow our claims. In addition, we may not receive competitive advantages from the rights granted under our patents and other intellectual property. Our existing patents and any patents granted to us or that we otherwise acquire in the future, may be contested, circumvented or invalidated, and we may not be able to prevent third parties from infringing these patents. Therefore, the extent of the protection afforded by these patents cannot be predicted with certainty. In addition, given the costs, effort, risks and downside of obtaining patent protection, including the requirement to ultimately disclose the invention to the public, we may choose not to seek patent protection for certain innovations; however, such patent protection could later prove to be important to our business.
We also rely on several registered and unregistered trademarks to protect our brand. Nevertheless, competitors may adopt service names similar to ours, or purchase our trademarks and confusingly similar terms as keywords in Internet search engine advertising programs, thereby impeding our ability to build brand identity and possibly leading to confusion in the marketplace. In addition, there could be potential trade name or trademark infringement claims brought by owners of other registered trademarks or trademarks that incorporate variations of our trademarks. Any claims or customer confusion related to our trademarks could damage our reputation and brand and substantially harm our business and results of operations.
We attempt to protect our intellectual property, technology, and confidential information by generally requiring our employees and consultants to enter into confidentiality and assignment of inventions agreements and third parties to enter into nondisclosure agreements, all of which offer only limited protection. These agreements may not effectively prevent unauthorized use or disclosure of our confidential information, intellectual property or technology and may not provide an adequate remedy in the event of unauthorized use or disclosure of our confidential information, intellectual property or technology. Despite our efforts to protect our confidential information, intellectual property, and technology, unauthorized third parties may gain access to our confidential proprietary information, develop and market products or services similar to ours, or use trademarks similar to ours, any of which could materially harm our business and results of operations. In addition, others may independently discover our trade secrets and confidential information, and in such cases, we could not assert any trade secret rights against such parties. Existing United States federal, state and international intellectual property laws offer only limited protection. The laws of some foreign countries do not protect our intellectual property rights to as great an extent as the laws of the United States, and many foreign countries do not enforce these laws as diligently as governmental agencies and private parties in the United States. Moreover, policing our intellectual property rights is difficult, costly and may not always be effective.
17
From time to time, legal action by us may be necessary to enforce our patents and other intellectual property rights, to protect our trade secrets, to determine the validity and scope of the intellectual property rights of others or to defend against claims of infringement or invalidity. Such litigation could result in substantial costs and diversion of resources and could negatively affect our business, reputation, results of operations and financial condition. If we are unable to protect our technology and to adequately maintain and protect our intellectual property rights, we may find ourselves at a competitive disadvantage to others who need not incur the additional expense, time and effort required to create the innovative products that have enabled us to be successful to date.
We may be obligated to disclose our proprietary source code to our customers, which may limit our ability to protect our intellectual property and could reduce the renewals of our support and maintenance services.
Our software license agreements typically contain provisions permitting the customer to become a party to, or a beneficiary of, a source code escrow agreement under which we place the proprietary source code for our applicable products in escrow with a third party. Under these escrow agreements, the source code to the applicable product may be released to the customer, typically for its use to maintain, modify and enhance the product, upon the occurrence of specified events, such as our filing for bankruptcy, discontinuance of our maintenance services and breaching our representations, warranties or covenants of our agreements with our customers. Additionally, in some cases, customers have the right to request access to our source code upon demand. Some of our customers have obtained the source code for certain of our products by exercising this right, and others may do so in the future.
Disclosing the content of our source code may limit the intellectual property protection we can obtain or maintain for that source code or the products containing that source code and may facilitate intellectual property infringement claims against us. It also could permit a customer to which a product’s source code is disclosed to support and maintain that software product without being required to purchase our support or maintenance services. Each of these could harm our business, results of operations and financial condition.
We and our customers rely on technology and intellectual property of third-parties, the loss of which could limit the functionality of our products and disrupt our business.
We use technology and intellectual property licensed from unaffiliated third-parties in certain of our products, and we may license additional third-party technology and intellectual property in the future. Any errors or defects in this third-party technology and intellectual property could result in errors that could harm our brand and business. In addition, licensed technology and intellectual property may not continue to be available on commercially reasonable terms, or at all. The loss of the right to license and distribute this third-party technology could limit the functionality of our products and might require us to redesign our products.
Some of our services and technologies may use “open source” software, which may restrict how we use or distribute our services or require that we release the source code of certain products subject to those licenses.
Some of our services and technologies may incorporate software licensed under so-called “open source” licenses. In addition to risks related to license requirements, usage of open source software can lead to greater risks than use of third-party commercial software, as open source licensors generally do not provide warranties or controls on origin of the software. Additionally, some open source licenses require that source code subject to the license be made available to the public and that any modifications or derivative works to open source software continue to be licensed under open source licenses. These open source licenses typically mandate that proprietary software, when combined in specific ways with open source software, become subject to the open source license. If we combine our proprietary software in such ways with open source software, we could be required to release the source code of our proprietary software.
We take steps to ensure that our proprietary software is not combined with, and does not incorporate, open source software in ways that would require our proprietary software to be subject to many of the restrictions in an open source license. However, few courts have interpreted open source licenses, and the manner in which these licenses may be interpreted and enforced is therefore subject to some uncertainty. Additionally, we rely on hundreds of software programmers to design our proprietary technologies, and although we take steps to prevent our programmers from including objectionable open source software in the technologies and software code that they design, write and modify, we do not exercise complete control over the development efforts of our programmers and we cannot be certain that our programmers have not incorporated such open source software into our proprietary products and technologies or that they will not do so in the future. In the event that portions of our proprietary technology are determined to be subject to an open source license, we could be required to publicly release the affected portions of our source code, re-engineer all or a portion of our technologies, or otherwise be limited in the licensing of our technologies, each of which could reduce or eliminate the value of our services and technologies and materially and adversely affect our business, results of operations and prospects.
18
Incorrect or improper use of our products or our failure to properly train customers on how to utilize our products could result in customer dissatisfaction and negatively affect our business, results of operations, financial condition and growth prospects.
Our products are complex and are deployed in a wide variety of network environments. The proper use of our products requires training of the customer. If our products are not used correctly or as intended, inadequate performance may result. Our products may also be intentionally misused or abused by customers or their employees or third parties who are able to access or use our products. Because our customers rely on our products, services and maintenance support to manage a wide range of operations, the incorrect or improper use of our products, our failure to properly train customers on how to efficiently and effectively use our products, or our failure to properly provide maintenance services to our customers may result in negative publicity or legal claims against us. Also, as we continue to expand our customer base, any failure by us to properly provide these services will likely result in lost opportunities for follow-on sales of our products and services.
In addition, if there is substantial turnover of customer personnel responsible for use of our products, or if customer personnel are not well trained in the use of our products, customers may defer the deployment of our products, may deploy them in a more limited manner than originally anticipated or may not deploy them at all. Further, if there is substantial turnover of the customer personnel responsible for use of our products, our ability to make additional sales may be substantially limited.
Our ability to sell our products is highly dependent on the quality of our professional services and technical support services and the support of our system integration providers, and the failure of us or our system integration providers to offer high-quality professional services or technical support services could damage our reputation and adversely affect our ability to sell our products and services to new customers and renew agreements with our existing customers.
If we or our system integration providers do not effectively assist our customers in deploying our products, succeed in helping our customers quickly resolve post-deployment issues, and provide effective ongoing support, our ability to sell additional products and services to existing customers would be adversely affected and our reputation with potential customers could be damaged. Once our products are deployed and integrated with our customers’ existing information technology investments and data, our customers may depend on our technical support services and/or the support of system integrators or internal resources to resolve any issues relating to our products. High-quality support is critical for the continued successful marketing and sale of our products. In addition, as we continue to expand our operations internationally, our support organization will face additional challenges, including those associated with delivering support, training and documentation in languages other than English. Many enterprise customers require higher levels of support than smaller customers. If we fail to meet the requirements of our larger customers, it may be more difficult to sell additional products and services to these customers, a key group for the growth of our revenue and profitability. In addition, as we further expand our products to include a cloud-based offering, our professional services and support organization will face new challenges, including hiring, training and integrating a large number of new professional services personnel with experience in delivering high-quality support for cloud-based offerings. Alleviating any of these problems could require significant expenditures which could adversely affect our growth prospects. Further, as we continue to rely on system integrators to provide deployment and on-going services, our ability to ensure a high level of quality in addressing customer issues is diminished. Our failure to maintain high-quality implementation and support services, or to ensure that system integrators provide the same, could have a material adverse effect on our business, results of operations, financial condition and growth prospects.
If we are unable to retain our personnel and hire and integrate additional skilled personnel, we may be unable to achieve our goals and our business will suffer.
Our future success depends upon our ability to continue to attract, train, integrate and retain highly skilled employees, particularly those on our management team, including Marcus Ryu, one of our co-founders and our current president and chief executive officer, and our sales and marketing personnel, professional services personnel and software engineers. Our inability to attract and retain qualified personnel, or delays in hiring required personnel, may seriously harm our business, results of operations and financial condition. If U.S. immigration policy related to skilled foreign workers were materially adjusted, such a change could hamper our efforts to hire highly skilled foreign employees, including highly specialized engineers, which would adversely impact our business.
Any one of our executive officers and other key employees could terminate his or her relationship with us at any time. The loss of any member of our senior management team could significantly delay or prevent us from achieving our business and/or development objectives, and could materially harm our business.
We face competition for qualified individuals from numerous software and other technology companies. Competition for qualified personnel is particularly intense in the San Francisco Bay Area, where our headquarters are located, though we also face significant competition in all of our domestic and foreign development centers. Further, significant amounts of time and resources are required to train technical, sales, services and other personnel. We may incur significant costs to attract, train and retain such
19
personnel, and we may lose new employees to our competitors or other technology companies before we realize the benefit of our investment after recruiting and training them.
Also, to the extent that we hire personnel from competitors, we may be subject to allegations that such personnel have been improperly solicited or have divulged proprietary or other confidential information. In addition, we have a limited number of sales people and the loss of several sales people within a short period of time could have a negative impact on our sales efforts. We may be unable to attract and retain suitably qualified individuals who are capable of meeting our growing technical, operational and managerial requirements, or we may be required to pay increased compensation in order to do so.
Our ability to expand geographically depends, in large part, on our ability to attract, retain and integrate managers to lead the local business and employees with the appropriate skills. Similarly, our profitability depends on our ability to effectively utilize personnel with the right mix of skills and experience to perform services for our clients, including our ability to transition employees to new assignments on a timely basis. If we are unable to effectively deploy our employees globally on a timely basis to fulfill the needs of our clients, our reputation could suffer and our ability to attract new clients may be harmed.
Because of the technical nature of our products and services and the dynamic market in which we compete, any failure to attract, integrate and retain qualified direct sales, professional services and product development personnel, as well as our contract workers, could harm our ability to generate sales or successfully develop new products and consulting services and enhancements of existing products.
Failure to manage our expanding operations effectively could harm our business.
We have experienced consistent growth and expect to continue to expand our operations, including the number of employees and the locations and scope of our international operations. This expansion has placed, and will continue to place, a significant strain on our operational and financial resources and our personnel. To manage our anticipated future operational expansion effectively, we must continue to maintain and may need to enhance our information technology infrastructure, financial and accounting systems and controls and manage expanded operations and employees in geographically distributed locations. For example, we have recently implemented a new ERP system. Our growth could require significant capital expenditures and may divert financial resources from other projects, such as the development of new products. If we increase the size of our organization without experiencing an increase in sales of our products and services, we will experience reductions in our gross and operating margins and net income. If we are unable to effectively manage our expanding operations, our expenses may increase more than expected, our revenue could decline or grow more slowly than expected and we may be unable to implement our business strategy.
Our international sales and operations subject us to additional risks that can adversely affect our business, results of operations and financial condition.
We sell our products and services to customers located outside the United States, and we are continuing to expand our international operations as part of our growth strategy. In fiscal years 2018, 2017 and 2016, $244.1 million, $213.1 million and $193.5 million of our revenue, respectively, was derived from outside of the United States. Our current international operations and our plans to expand our international operations subject us to a variety of risks, including:
• | increased management, travel, infrastructure and legal compliance costs associated with having multiple international operations; |
• | unique terms and conditions in contract negotiations imposed by customers in foreign countries; |
• | longer payment cycles and difficulties in enforcing contracts and collecting accounts receivable; |
• | the need to localize our products and licensing and subscription programs for international customers; |
• | lack of familiarity with and unexpected changes in foreign regulatory requirements; |
• | increased exposure to fluctuations in currency exchange rates; |
• | highly inflationary international economies, such as Argentina; |
• | the burdens and costs of complying with a wide variety of foreign laws and legal standards; |
• | compliance with the U.S. Foreign Corrupt Practices Act of 1977, as amended (“FCPA”), the U.K. Bribery Act and other anti-corruption regulations, particularly in emerging market countries; |
• | compliance by international staff with accounting practices generally accepted in the United States, including adherence to our accounting policies and internal controls; |
• | import and export license requirements, tariffs, taxes and other trade barriers; |
• | increased financial accounting and reporting burdens and complexities; |
• | weaker protection of intellectual property rights in some countries; |
• | multiple and possibly overlapping tax regimes; |
• | government sanctions that may interfere with our ability to sell into particular countries, such as Russia; and |
• | political, social and economic instability abroad, terrorist attacks and security concerns in general. |
20
As we continue to expand our business globally, our success will depend, in large part, on our ability to anticipate and effectively manage these and other risks associated with our international operations. Any of these risks could harm our international operations and reduce our international sales, adversely affecting our business, results of operations, financial condition and growth prospects.
Our revenue, results of operations and cash flows are subject to fluctuations due to changes in foreign currency exchange rates, particularly changes in the Canadian dollar, Australian dollar, Euro, British Pound, Japanese Yen, Polish Zloty, Brazilian Real, Malaysian Ringgit, and Argentine Peso.
The volatility of exchange rates depends on many factors that we cannot forecast with reliable accuracy. Although we believe our operating activities act as a natural hedge for a substantial portion of our foreign currency exposure at the cash flow or operating income level because we typically collect revenue and incur costs in the currency of the location in which we provide our applications and services, our contracts with our customers are long-term in nature so it is difficult to predict if our operating activities will provide a natural hedge in the future. In addition, because our contracts are characterized by large annual payments, significant fluctuations in foreign currency exchange rates that coincide with annual payments may affect our revenue or financial results in such quarter. Our results of operations may also be impacted by transaction gains or losses related to revaluing certain current asset and liability balances that are denominated in currencies other than the functional currency of the entities in which they are recorded. Moreover, significant and unforeseen changes in foreign currency exchange rates may cause us to fail to achieve our stated projections for revenue and operating income, which could have an adverse effect on our stock price. For example, in fiscal year 2018, the Argentine economy became highly inflationary; however, our new Argentina entity has had minimal activity through July 31, 2018. We will continue to experience fluctuations in foreign currency exchange rates, which, if material, may harm our revenue or results of operations.
Privacy concerns could result in regulatory changes and impose additional costs and liabilities on us, limit our use of information, and adversely affect our business.
Our current and predominant business model does not significantly collect and transfer personal information from our customers to us, however, as adoption of our cloud-based services occurs, the amount of customer data we manage, hold and/or collect will increase significantly. In addition, a limited number of our product solutions may collect, process, store, and use transaction-level data aggregated across insurers using our common data model. We anticipate that over time we will expand the use and collection of personal information as greater amounts of such personal information may be transferred from our customers to us and we recognize that personal privacy has become a significant issue in the United States, Europe, and many other jurisdictions where we operate. Many federal, state, and foreign legislatures and government agencies have imposed or are considering imposing restrictions and requirements about the collection, use, and disclosure of personal information.
Changes to laws or regulations affecting privacy could impose additional costs and liabilities on us and could limit our use of such information to add value for customers. If we were required to change our business activities or revise or eliminate services, or to implement burdensome compliance measures, our business and results of operations could be harmed. In addition, we may be subject to fines, penalties, and potential litigation if we fail to comply with applicable privacy and/or data security laws, regulations, standards and other requirements. The costs of compliance with and other burdens imposed by privacy-related laws, regulations and standards may limit the use and adoption of our product solutions and reduce overall demand.
Furthermore, concerns regarding data privacy and/or security may cause our customers’ customers to resist providing the data and information necessary to allow our customers to use our product solutions effectively. Even the perception that the privacy and/or security of personal information is not satisfactorily managed, or does not meet applicable legal, regulatory and other requirements, could inhibit sales of our products or services, and could limit adoption of our solutions, resulting in a negative impact on our sales and results from operations.
Privacy concerns in the European Union are evolving and we may face fines and other penalties if we fail to comply with these evolving standards, and compliance with these standards may increase our expenses and adversely affect our business and results of operations.
In the European Community, Directive 95/46/EC (the “Directive”) has required European Union member states to implement data protection laws to meet the strict privacy requirements of the Directive, which has resulted in changes in previously accepted practices.
Among other changes, European Union (the “EU”) Commission has formally adopted a new mechanism for the transfer of personal data from the EU to the United States, branded the “EU-US Privacy Shield” (“Privacy Shield”). We are currently certified with the U.S. Department of Commerce (“DOC”) to comply with the Privacy Shield Framework, however, companies will continue to face uncertainty to the extent they operate in both jurisdictions and transfer any Personal Data between the two. If we are investigated by a European data protection authority and found to be out of compliance, we could face fines and other penalties.
21
Any such investigation or charges by European data protection authorities could have a negative effect on our existing business and on our ability to attract and retain new customers.
While we will continue to undertake efforts to conform to current regulatory obligations and evolving best practices, we may be unsuccessful in conforming to means of transferring Personal Data from the European Economic Area (“EEA”). We may also experience hesitancy, reluctance, or refusal by European or multi-national customers to continue to use some of our services due to the potential risk exposure of Personal Data transfers and the current data protection obligations imposed on them by certain data protection authorities. Such customers may also view any alternative approaches to the transfer of any Personal Data as being too costly, too burdensome, or otherwise objectionable, and therefore may decide not to do business with us if the transfer of Personal Data is a necessary requirement.
Though our current and predominant business model does not significantly collect and transfer personal information from our customers to us, the potential transition to more cloud-based services, and the current data protection landscape in the EU may subject us to greater risk of potential inquiries and/or enforcement actions. We may find it necessary to establish alternative systems to maintain Personal Data originating from the EU in the EEA, which may involve substantial expense and may cause us to need to divert resources from other aspects of our business, all of which may adversely affect our results from operations. Further, any inability to adequately address privacy concerns in connection with our cloud-based services, or comply with applicable privacy or data protection laws, regulations and policies, could result in additional cost and liability to us, and adversely affect our ability to offer cloud-based services.
Anticipated further evolution of EU regulations on this topic may increase substantially the penalties to which we could be subject in the event of any non-compliance. We may incur substantial expense in complying with the new obligations to be imposed by new regulations and we may be required to make significant changes to our software applications and expanding business operations, all of which may adversely affect our results of operations.
If we fail to maintain effective internal control over financial reporting in the future, the accuracy and timing of our financial reporting may be adversely affected.
Preparing our consolidated financial statements involves a number of complex manual and automated processes, which are dependent upon individual data input or review and require significant management judgment. One or more of these processes may result in errors that may not be detected and could result in a material misstatement of our consolidated financial statements. The Sarbanes-Oxley Act of 2002 (the “Sarbanes-Oxley Act”) requires, among other things, that as a publicly-traded company we disclose whether our internal control over financial reporting and disclosure controls and procedures are effective.
If a material misstatement occurs in the future, we may fail to meet our future reporting obligations. For example, we may fail to file periodic reports in a timely manner or may need to restate our financial results, either of which may cause the price of our common stock to decline. Any failure of our internal controls could also adversely affect the results of the periodic management evaluations and annual independent registered public accounting firm attestation reports regarding the effectiveness of our internal control over financial reporting that are required under Section 404 of the Sarbanes-Oxley Act. Effective internal controls are necessary for us to produce reliable financial reports and are important to helping prevent financial fraud. Furthermore, transition in enterprise resource planning or other major operational systems could impact the timely generation of our financial statements. In fiscal year 2017, we began implementing a new financial management system, as well as applications to help us manage the recognition of our revenue under a new standard, which changes several of our procedures and controls. If as a result of implementing this new system or otherwise, we cannot provide timely reliable financial reports, our business and results of operations could be harmed, investors could lose confidence in our reported financial information, and the trading price of our stock could drop significantly.
If tax laws change or we experience adverse outcomes resulting from examination of our income tax returns, it could adversely affect our results of operations.
We are subject to federal, state and local income taxes in the United States and in foreign jurisdictions. Our future effective tax rates and the value of our deferred tax assets could be adversely affected by changes in tax laws, including impacts of the recently enacted Tax Cuts and Jobs Act, the consequences of which have not yet been fully determined. In addition, we are subject to the examination of our income tax returns by the Internal Revenue Service and other tax authorities. We regularly assess the likelihood of adverse outcomes resulting from such examinations to determine the adequacy of our provision for income taxes. Significant judgment is required in determining our worldwide provision for income taxes. Although we believe we have made appropriate provisions for taxes in the jurisdictions in which we operate, changes in the tax laws or challenges from tax authorities under existing tax laws could adversely affect our business, financial condition and results of operations.
22
We may not be able to obtain capital when desired on favorable terms, if at all, and we may not be able to obtain capital or complete acquisitions through the use of equity without dilution to our stockholders.
We may need additional financing to execute on our current or future business strategies, including to develop new or enhance existing products and services, acquire businesses and technologies, or otherwise to respond to competitive pressures.
If we raise additional funds through the issuance of equity or convertible debt securities, the percentage ownership of our stockholders could be significantly diluted, and newly-issued securities may have rights, preferences or privileges senior to those of existing stockholders. If we accumulate additional funds through debt financing, a substantial portion of our operating cash flow may be dedicated to the payment of principal and interest on such indebtedness, thus limiting funds available for our business activities. We cannot assure you that additional financing will be available on terms favorable to us, or at all. If adequate funds are not available or are not available on acceptable terms, when we desire them, our ability to fund our operations, take advantage of unanticipated opportunities, develop or enhance our products and services, or otherwise respond to competitive pressures would be significantly limited. Any of these factors could harm our results of operations.
Our business is subject to the risks of earthquakes, fire, floods and other natural catastrophic events, and to interruption by man-made problems such as computer viruses.
Our corporate headquarters and the majority of our operations are located in the San Francisco Bay Area, a region known for seismic activity. A significant natural disaster, such as an earthquake, tsunami, fire or a flood, could have a material adverse impact on our business, results of operations and financial condition. In addition, our information technology systems are vulnerable to computer viruses, break-ins and similar disruptions from unauthorized tampering. To the extent that such disruptions result in delays or cancellations of customer orders or collections, or the deployment of our products, our business, results of operations and financial condition would be adversely affected.
Our stock price may be volatile, which could result in securities class action litigation against us.
The market price of our common stock could be subject to wide fluctuations in response to, among other things, the risk factors described in this report, and other factors beyond our control, such as fluctuations in the valuation of companies perceived by investors to be comparable to us and research analyst coverage about our business.
Furthermore, the stock markets have experienced price and volume fluctuations that have affected and continue to affect the market prices of equity securities of many companies. These fluctuations often have been unrelated or disproportionate to the operating performance of those companies. These broad market and industry fluctuations, as well as general economic, political and market conditions, such as recessions, interest rate changes or international currency fluctuations, have and may continue to affect the market price of our common stock.
In the past, many companies that have experienced volatility in the market price of their stock have been subject to securities class action litigation. We may become the target of this type of litigation in the future. Securities litigation against us could result in substantial costs and divert our management’s attention from other business concerns, which could seriously harm our business.
We currently do not intend to pay dividends on our common stock and, consequently, your only opportunity to achieve a return on your investment is if the price of our common stock appreciates.
We currently do not plan to declare dividends on shares of our common stock in the foreseeable future. Consequently, the only opportunity to achieve a return on investment in our company will be if the market price of our common stock appreciates and shares are sold at a profit.
Certain provisions of our certificate of incorporation and bylaws and of Delaware law could prevent a takeover that stockholders consider favorable and could also reduce the market price of our stock.
Our amended and restated certificate of incorporation and our amended and restated bylaws contain provisions that could delay or prevent a merger, acquisition or other change in control that stockholders may consider favorable, including transactions in which stockholders might otherwise receive a premium for their shares. These provisions may also prevent or delay attempts by stockholders to replace or remove our current management or members of our board of directors. These provisions include:
• | providing for a classified board of directors with staggered three-year terms, which could delay the ability of stockholders to change the membership of a majority of our board of directors; |
• | not providing for cumulative voting in the election of directors, which limits the ability of minority stockholders to elect director candidates; |
• | authorizing our board of directors to issue, without stockholder approval, preferred stock rights senior to those of common stock, which could be used to significantly dilute the ownership of a hostile acquirer; |
23
• | prohibiting stockholder action by written consent, which forces stockholder action to be taken at an annual or special meeting of our stockholders; |
• | limiting the persons who may call special meetings of stockholders, which could delay the ability of our stockholders to force consideration of a proposal or to take action, including the removal of directors; and |
• | requiring advance notification of stockholder nominations and proposals, which may discourage or deter a potential acquirer from conducting a solicitation of proxies to elect the acquirer’s own slate of directors or otherwise attempting to obtain control of us. |
The affirmative vote of the holders of at least 66 2/3% of our shares of capital stock entitled to vote is generally necessary to amend or repeal the above provisions that are contained in our amended and restated certificate of incorporation. Also, absent approval of our board of directors, our amended and restated bylaws may only be amended or repealed by the affirmative vote of the holders of at least 50% of our shares of capital stock entitled to vote.
In addition, we are subject to the provisions of Section 203 of the Delaware General Corporation Law. These provisions may prohibit large stockholders, in particular those owning 15% or more of our outstanding common stock, from engaging in certain business combinations without approval of substantially all of our stockholders for a certain period of time.
These and other provisions in our amended and restated certificate of incorporation, our amended and restated bylaws and under Delaware law could discourage potential takeover attempts, reduce the price that investors might be willing to pay for shares of our common stock in the future and result in the market price being lower than it would be without these provisions.
Risks Related to Our Indebtedness
Servicing our indebtedness requires a significant amount of cash. We may not have sufficient cash flow from our business to pay our substantial indebtedness, and we may not have the ability to raise the funds necessary to settle for cash conversions of the 2025 Notes or to repurchase the 2025 Notes upon a fundamental change, which could adversely affect our business and results of operations.
As of July 31, 2018, we had outstanding an aggregate principal amount of $400.0 million of our 1.25% convertible senior notes due 2025 (the “2025 Notes”). Our indebtedness may increase our vulnerability to any generally adverse economic and industry conditions, and we and our subsidiaries may, subject to the limitations in the terms of our existing and future indebtedness, incur additional debt, secure existing or future debt or recapitalize our debt. If we incur additional indebtedness, the risks related to our business and our ability to service or repay our indebtedness would increase.
Pursuant to their terms, holders may convert their 2025 Notes at their option prior to the scheduled maturities of their 2025 Notes under certain circumstances. Upon conversion of the 2025 Notes, unless we elect to deliver solely shares of our common stock to settle such conversion (other than paying cash in lieu of delivering any fractional share), we will be obligated to make cash payments. In addition, holders of our 2025 Notes will have the right to require us to repurchase their 2025 Notes upon the occurrence of a fundamental change (as defined in the Indenture) at a repurchase price equal to 100% of the principal amount of the 2025 Notes to be repurchased, plus accrued and unpaid interest, if any, to, but not including, the fundamental change purchase date. Although it is our intention and we currently expect to have the ability to settle the 2025 Notes in cash, there is a risk that we may not have enough available cash or be able to obtain financing at the time we are required to make repurchases of 2025 Notes surrendered therefor or 2025 Notes being converted. In addition, our ability to make payments may be limited by law, by regulatory authority or by agreements governing our future indebtedness. Our failure to repurchase 2025 Notes at a time when the repurchase is required by the Indenture or to pay any cash payable on future conversions of the 2025 Notes as required by such Indenture would constitute a default under such Indenture. A default under the Indenture or the fundamental change itself could also lead to a default under agreements governing our future indebtedness. If the repayment of the related indebtedness were to be accelerated after any applicable notice or grace periods, we may not have sufficient funds to repay the indebtedness and repurchase the 2025 Notes or make cash payments upon conversions thereof.
Our ability to make scheduled payments of the principal and interest on our indebtedness when due or to make payments upon conversion or repurchase demands with respect to our 2025 Notes, or to refinance our indebtedness as we may need or desire, depends on our future performance, which is subject to economic, financial, competitive and other factors beyond our control. Our business may not continue to generate cash flow from operations in the future sufficient to satisfy our obligations under our existing indebtedness, and any future indebtedness we may incur, and to make necessary capital expenditures. If we are unable to generate such cash flow, we may be required to adopt one or more alternatives, such as reducing or delaying investments or capital expenditures, selling assets, refinancing or obtaining additional equity capital on terms that may be onerous or highly dilutive. Our ability to refinance existing or future indebtedness will depend on the capital markets and our financial condition at such time. We may not be able to engage in any of these activities or engage in these activities on desirable terms or at all, which could result
24
in a default on our existing or future indebtedness and have a material adverse effect on our business, results of operations and financial condition.
The conditional conversion feature of the 2025 Notes, if triggered, may adversely affect our financial condition and operating results.
In the event the conditional conversion feature of the notes is triggered, holders of our 2025 Notes will be entitled to convert the 2025 Notes at any time during specified periods at their option. If one or more holders elect to convert their 2025 Notes, unless we elect to satisfy our conversion obligation by delivering solely shares of our common stock (other than paying cash in lieu of delivering any fractional share), we would be required to settle a portion or all of our conversion obligation through the payment of cash, which could adversely affect our liquidity. In addition, even if holders do not elect to convert their 2025 Notes, we could be required under applicable accounting rules to reclassify all or a portion of the outstanding principal of the notes as a current rather than long-term liability, which would result in a material reduction of our net working capital.
Transactions relating to our 2025 Notes may affect the value of our common stock.
The conversion of some or all of the 2025 Notes would dilute the ownership interests of existing stockholders to the extent we satisfy our conversion obligation by delivering shares of our common stock upon any conversion of such 2025 Notes. Our 2025 Notes may become in the future convertible at the option of their holders under certain circumstances. If holders of our 2025 Notes elect to convert their notes, we may settle our conversion obligation by delivering to them a significant number of shares of our common stock, which would cause dilution to our existing stockholders.
In connection with the issuance of the 2025 Notes, we entered into capped call transactions with certain financial institutions (the “option counterparties”). The capped call transactions are expected generally to reduce the potential dilution to our common stock upon any conversion of the notes and/or offset any cash payments we are required to make in excess of the principal amount of converted notes, as the case may be, with such reduction and/or offset subject to a cap.
From time to time, the option counterparties or their respective affiliates may modify their hedge positions by entering into or unwinding various derivative transactions with respect to our common stock and/or purchasing or selling our common stock or other securities of ours in secondary market transactions prior to the maturity of the 2025 Notes. This activity could cause a decrease in the market price of our common stock.
The accounting method for convertible debt securities that may be settled in cash, such as the 2025 Notes, could have a material effect on our reported financial results.
Under FASB Accounting Standards Codification 470-20 (“ASC 470-20”), Debt with Conversion and Other Options, an entity must separately account for the liability and equity components of convertible debt instruments (such as the 2025 Notes) that may be settled entirely or partially in cash upon conversion in a manner that reflects the issuer’s economic interest cost. ASC 470-20 requires the value of the conversion option of the 2025 Notes, representing the equity component, to be recorded as additional paid-in capital within stockholders’ equity in our consolidated balance sheet as an original issue discount to the 2025 Notes, which reduces their initial carrying value. The carrying value of the 2025 Notes, net of the discount recorded, will be accreted up to the principal amount of the notes from the issuance date until maturity, which will result in non-cash charges to interest expense in our consolidated statement of operations. Accordingly, we will report lower net income or higher net loss in our financial results because ASC 470-20 requires interest to include both the current period’s accretion of the debt discount and the instrument’s coupon interest, which could adversely affect our reported or future financial results, the trading price of our common stock and the trading price of the 2025 Notes.
In addition, under certain circumstances, convertible debt instruments (such as the 2025 Notes) that may be settled entirely or partly in cash are currently accounted for utilizing the treasury stock method, the effect of which is that the shares issuable upon conversion of the 2025 Notes are not included in the calculation of diluted earnings per share except to the extent that the conversion value of the 2025 Notes exceeds their principal amount. Under the treasury stock method, for diluted earnings per share purposes, the transaction is accounted for as if the number of shares of common stock that would be necessary to settle such excess, if we elected to settle such excess in shares, are issued. If we are unable to use the treasury stock method in accounting for the shares issuable upon conversion of the 2025 Notes, then our diluted earnings per share would be adversely affected.
We are subject to counterparty risk with respect to the capped call transactions.
The option counterparties are financial institutions, and we will be subject to the risk that any or all of them might default under the capped call transactions. Our exposure to the credit risk of the option counterparties will not be secured by any collateral. Past global economic conditions have resulted in the actual or perceived failure or financial difficulties of many financial institutions. If an option counterparty becomes subject to insolvency proceedings, we will become an unsecured
25
creditor in those proceedings with a claim equal to our exposure at that time under the capped call transactions with such option counterparty. Our exposure will depend on many factors but, generally, an increase in our exposure will be correlated to an increase in the market price and in the volatility of our common stock. In addition, upon a default by an option counterparty, we may suffer adverse tax consequences and more dilution than we currently anticipate with respect to our common stock. We can provide no assurances as to the financial stability or viability of the option counterparties.
26
Item 1B. | Unresolved Staff Comments |
Not applicable.
Item 2. | Properties |
Our corporate headquarters are located in Foster City, California, where we currently have a seven year lease for 97,674 square feet of space that commenced on August 1, 2012. As of July 31, 2018, we also lease facilities for our distributed sales, services and development centers, including in Bedford, Massachusetts; Birmingham, Alabama; Columbia, South Carolina; Edina, Minnesota; Exton, Pennsylvania; San Diego, California; San Jose, California; San Mateo, California; Dublin, Ireland; Krakow, Poland; London, United Kingdom; Madrid, Spain; Mississauga, Canada; Paris, France; Sydney, Australia; and Tokyo, Japan.
We believe that our facilities are suitable to meet our current needs, including our recently leased future headquarters in San Mateo, California for 179,496 square feet of space, which we intend to move into in mid-2019. We intend to expand our facilities or add new facilities as we add employees and enter new geographic markets, and we believe that suitable additional or alternative space will be available as needed to accommodate any such growth. However, we expect to incur additional expenses in connection with such new or expanded facilities, including our corporate headquarters.
Item 3. | Legal Proceedings |
From time to time we are involved in legal proceedings that arise in the ordinary course of our business. Any such proceedings, whether meritorious or not, could be time consuming, costly, and result in the diversion of significant operational resources or management time.
Although the outcomes of legal proceedings are inherently difficult to predict, we are not currently involved in any legal proceeding in which the outcome, in our judgment based on information currently available, is likely to have a material adverse effect on our business or financial position.
Item 4. | Mine Safety Disclosures |
Not applicable.
27
Item 5. | Market for Registrant’s Common Equity, Related Stockholder Matters and Issuer Purchases of Equity |
Securities
Our common stock is listed on the New York Stock Exchange (“NYSE”) under the symbol “GWRE”. The following table sets forth the high and low sales price per share of our common stock as reported on the NYSE for the periods indicated:
Fiscal Year 2018 | Fiscal Year 2017 | ||||||||||||||
High | Low | High | Low | ||||||||||||
First Quarter | $ | 81.46 | $ | 67.89 | $ | 63.90 | $ | 57.45 | |||||||
Second Quarter | $ | 83.52 | $ | 70.06 | $ | 58.92 | $ | 49.33 | |||||||
Third Quarter | $ | 92.65 | $ | 72.51 | $ | 61.72 | $ | 52.31 | |||||||
Fourth Quarter | $ | 96.19 | $ | 83.70 | $ | 72.81 | $ | 60.50 | |||||||
On July 31, 2018, the last reported sale price of our common stock on the New York Stock Exchange was $86.20 per share. As of July 31, 2018, we had 56 holders of record of our common stock. The actual number of stockholders is greater than this number of record holders, and includes stockholders who are beneficial owners, but whose shares are held in street name by brokers and other nominees. This number of holders of record also does not include stockholders whose shares may be held in trust by other entities.
We have never declared or paid, and do not anticipate declaring or paying, any cash dividends on our capital stock. Any future determination as to the declaration and payment of dividends, if any, will be at the discretion of our board of directors and will depend on then existing conditions, including our financial condition, operating results, contractual restrictions, capital requirements, business prospects and other factors our board of directors may deem relevant.
Performance Graph
This performance graph shall not be deemed “soliciting material” or to be “filed” with the Securities and Exchange Commission for purposes of Section 18 of the Securities Exchange Act of 1934, as amended (“the Exchange Act”) or otherwise subject to the liabilities under that Section, and shall not be deemed to be incorporated by reference into any of our filings under the Securities Act of 1933, as amended (the “Securities Act”) or the Exchange Act.
28
The following graph shows a comparison of the cumulative total return for our common stock, the NASDAQ Composite-Total Return Index, Zacks Computer Software Services Total Return Index, and S&P Software & Services Select Industry Index for the period from July 31, 2013 through July 31, 2018. Such returns are based on historical results and are not intended to suggest future performance. Data for the NASDAQ Composite Total Return Index, Zacks Computer Software Services Total Return Index, and S&P Software & Services Select Industry Index assume reinvestment of dividends.
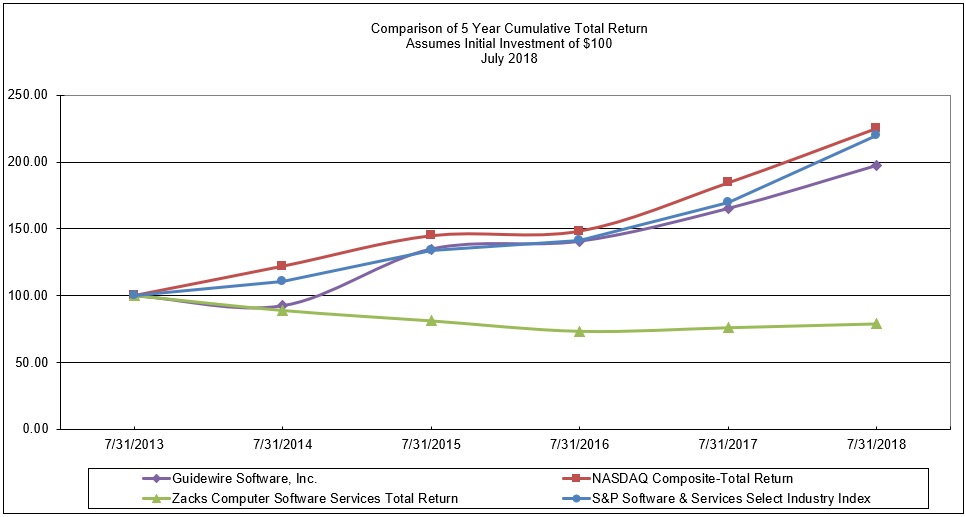
7/31/2013 | 7/31/2014 | 7/31/2015 | 7/31/2016 | 7/31/2017 | 7/31/2018 | |||||||||||||
Guidewire Software, Inc. | $ | 100.00 | $ | 92.55 | $ | 134.94 | $ | 140.77 | $ | 165.25 | $ | 197.40 | ||||||
NASDAQ Composite-Total Return | $ | 100.00 | $ | 122.00 | $ | 144.83 | $ | 148.24 | $ | 184.43 | $ | 225.25 | ||||||
Zacks Computer Software Services Total Return | $ | 100.00 | $ | 88.85 | $ | 81.15 | $ | 73.39 | $ | 76.05 | $ | 78.90 | ||||||
S&P Software & Services Select Industry Index | $ | 100.00 | $ | 111.03 | $ | 133.79 | $ | 141.70 | $ | 170.09 | $ | 219.95 | ||||||
Unregistered Sales of Equity Securities and Use of Proceeds
Issuer Purchases of Equity Securities
There were no repurchases of shares of our common stock made during the three months and the fiscal year ended July 31, 2018.
29
PART II
Item 6. | Selected Financial Data |
SELECTED CONSOLIDATED FINANCIAL DATA
The following tables set forth selected financial data as of and for the last five fiscal years. This selected financial data should be read in conjunction with our historical financial statements, including the notes thereto, and “Management’s Discussion and Analysis of Financial Condition and Results of Operations,” included elsewhere in this report.
Fiscal years ended July 31, | |||||||||||||||||||
2018 | 2017 | 2016 | 2015 | 2014 | |||||||||||||||
(in thousands, except share and per share data) | |||||||||||||||||||
Total revenue | $ | 661,067 | $ | 514,284 | $ | 424,446 | $ | 380,537 | $ | 350,246 | |||||||||
Total cost of revenue | 296,707 | 191,559 | 151,834 | 147,184 | 148,947 | ||||||||||||||
Total gross profit | 364,360 | 322,725 | 272,612 | 233,353 | 201,299 | ||||||||||||||
Income (loss) from operations | (7,330 | ) | 26,612 | 16,437 | 16,493 | 18,422 | |||||||||||||
Net income (loss) | $ | (19,665 | ) | $ | 21,224 | $ | 14,976 | $ | 9,885 | $ | 14,721 | ||||||||
Net income (loss) per share: | |||||||||||||||||||
Basic | $ | (0.25 | ) | $ | 0.29 | $ | 0.21 | $ | 0.14 | $ | 0.22 | ||||||||
Diluted | $ | (0.25 | ) | $ | 0.28 | $ | 0.20 | $ | 0.14 | $ | 0.21 | ||||||||
Shares used in computing net income (loss) per share: | |||||||||||||||||||
Basic | 77,709,592 | 73,994,577 | 72,026,694 | 70,075,908 | 65,748,896 | ||||||||||||||
Diluted | 77,709,592 | 75,328,343 | 73,765,960 | 72,314,433 | 69,112,733 | ||||||||||||||
As of July 31, | |||||||||||||||||||
2018 | 2017 | 2016 | 2015 | 2014 | |||||||||||||||
(in thousands) | |||||||||||||||||||
Cash, cash equivalents and investments | $ | 1,258,100 | $ | 687,788 | $ | 735,802 | $ | 677,752 | $ | 647,781 | |||||||||
Working capital | $ | 997,319 | $ | 515,624 | $ | 588,589 | $ | 557,235 | $ | 421,044 | |||||||||
Total assets | $ | 1,978,592 | $ | 1,078,901 | $ | 916,178 | $ | 799,947 | $ | 757,227 | |||||||||
Total stockholders’ equity | $ | 1,423,744 | $ | 893,281 | $ | 783,935 | $ | 689,388 | $ | 650,686 | |||||||||
30
Item 7. | Management’s Discussion and Analysis of Financial Condition and Results of Operations |
The following discussion and analysis should be read in conjunction with our consolidated financial statements and related notes thereto included in Item 8 and the Risk Factors included in Item 1A of Part I of this Annual Report on Form 10-K. All information presented herein is based on our fiscal calendar. Unless otherwise stated, references in this report to particular years or quarters refer to our fiscal years ended in July and the associated quarters of those fiscal years. We assume no obligation to revise or update any forward-looking statements for any reason, except as required by law.
Overview
We provide a technology platform, composed of software, services, and a partner ecosystem, for the global Property and Casualty (“P&C”) insurance industry.
Guidewire InsurancePlatformTM consists of cloud and on-premise applications to support core operations, data management and analytics, and digital engagement, and is connected to numerous data sources and third-party applications. Our applications are designed to work together to strengthen our customers’ ability to adapt and succeed in a rapidly changing market. Guidewire InsuranceSuite™ and Guidewire InsuranceNowTM provide core transactional systems of record supporting the entire insurance lifecycle, including product definition, distribution, underwriting, policy holder services and claims management. Guidewire InsuranceSuite is a highly configurable and scalable system comprised primarily of three applications (PolicyCenter, BillingCenter, and ClaimCenter) that can be licensed separately or together and can be deployed on-premise or in the cloud. Guidewire InsuranceNow is a cloud-based system that offers policy, billing, and claims management functionality to insurers that prefer an all-in-one solution. Our data and analytics applications enable insurers to manage data more effectively and gain insights into their business and underwrite new and evolving risks. Our digital engagement applications enable digital sales, omni-channel service and enhanced claims experiences for policyholders, agents, vendor partners and field personnel. To support P&C insurers globally, we have localized, and will continue to localize, our software for use in a variety of international regulatory, language and currency environments.
We sell our products to a wide variety of global P&C insurers, ranging from some of the largest global insurance carriers or their subsidiaries to national and regional carriers. Our customer engagement is led by our direct sales model and supported by our system integrator (“SI”) partners. We maintain and continue to grow our sales and marketing efforts globally, and maintain regional sales centers in the Americas, Europe and Asia. Strong customer relationships are a key driver of our success given the long-term nature of our engagements and the importance of customer references for new sales. We continue to focus on deepening our customer relationships through continued successful product implementations, robust product support, strategic engagement on new products and technologies, and ongoing account management.
Our sales cycles for new and existing customers remain protracted as customers are deliberate and the decision making and product evaluation process is long. These evaluation periods can extend further if the customer purchases multiple products or assesses the benefits of a cloud-based subscription in addition to our more traditional on-premises licensing models. Sales to new customers also involve extensive customer due diligence and reference checks. We must earn credibility with each successful implementation as we expand our sales operations, market products that have been acquired or newly introduced, and expand the ways we deliver our software. The success of our sales efforts relies on continued improvements and enhancements to our current products, the introduction of new products, and the continued development of relevant local content and the automated tools that we believe are optimal for updating that content.
To date, we have primarily licensed our software under term license contracts. We generally price our licenses based on the amount of direct written premiums (“DWP”) that will be managed by our solutions. Our term licenses for both recurring term license and maintenance fees are typically invoiced annually in advance or, in certain cases, quarterly. Term licenses that are greater than one year generally include extended payment terms. We assess whether a fee is fixed or determinable at the outset of the arrangement, primarily based on the payment terms associated with the transaction. For term licenses with extended payment terms entered into prior to August 1, 2018, term license fees are not considered to be fixed and determinable until they become due or payment is received, resulting in a deferral of the related revenue until this revenue recognition criteria is met, assuming all other revenue recognition criteria are satisfied. In preparing for our adoption of the new revenue recognition standard which will result in a majority of our term licenses being recognized as revenue upon delivery of the software rather than as payments are received or become due, we began revising our contracting practices in fiscal year 2017 by selling our term licenses with an initial two-year committed term and optional annual renewals. We also began a program to amend existing long-term contracts to the same committed term of two-years with optional annual renewals. A small portion of our revenue is derived from perpetual licenses, for which license revenue is recognized upon delivery of the software, provided that all revenue recognition criteria have been met.
31
We also offer subscriptions to our cloud-based services. Currently, these subscriptions may be for terms greater than two years, and we anticipate that a majority of these arrangements will be billed annually or quarterly in advance, although in some instances additional fees may be assessed in arrears as customers increase their DWP. Revenue derived from these subscriptions is recognized ratably over the contractual term beginning after the subscription is effectively provisioned, which is the date our software service is made available to customers. We anticipate that sales of subscriptions will increase as a percentage of annual sales as we sell more cloud-based services. As a result of the ratable recognition of revenue associated with subscriptions, a significant shift from term licenses to subscriptions may adversely affect our reported revenue growth. As this relatively new sales model matures, we may decide to change certain terms for future orders to remain competitive or otherwise meet market demands.
To extend our technology leadership in the global market, we continue to invest in research and development to enhance and improve our current products, introduce new products, and cost-effectively deploy our products in the cloud. Continued investment in product innovation is critical as we seek to assist our customers achieve their goals, maintain our competitive advantage, grow our revenue, expand internationally, and meet evolving customer demands. In certain cases, we will also acquire skills and technologies to accelerate our time to market for new products and solutions.
Our track record of success with customers and their implementations is central to maintaining our strong competitive position. We rely on our services teams and SI partners to meet our customers’ implementation needs. Our services organization is comprised of on-site, near-shore, and off-shore technical experts. The services organization seeks to ensure that teams with the right combination of product and language skills are utilized in the most efficient way. Our partnerships with leading SIs allows us to increase efficiency and scale while reducing customer implementation costs. Our extensive relationships with SIs and industry partners have strengthened and expanded in line with the interest in and adoption of our products. We encourage our partners to co-market, pursue joint sales initiatives, and drive broader adoption of our technology, helping us grow our business more efficiently. We continue to grow our services organization and invest time and resources in increasing the number of qualified consultants employed by our SI partners, develop relationships with new SIs in existing and new markets, and ensure that all partners are ready to assist with implementing our products.
We face a number of risks in the execution of our strategy including risks related to expanding to new markets, managing lengthy sales cycles, competing effectively in the global market, relying on sales to a relatively small number of large customers, developing new or acquiring existing products successfully, migrating a portion of our business to a more ratable revenue recognition model as we bring to market more cloud-based solutions, and increasing the overall adoption of our products. In response to these and other risks we might face, we continue to invest in many areas of our business. Our investments in sales and marketing align with our goal of winning new customers in both existing and new markets, and enable us to maintain a persistent, consultative relationship with our existing customers. Our investments in product development are designed to meet the evolving needs of our customers. Our investments in services are designed to ensure customer success, both with on-premise and cloud-based solutions.
Acquisitions
On November 1, 2017, we completed the acquisition of Cyence, Inc. (“Cyence”), for an aggregate consideration of approximately $260.3 million, including cash of approximately $146.6 million and equity consideration valued at approximately $113.7 million of newly issued Guidewire common stock and options, net of certain adjustments. Through the acquisition we gained a cloud-based data listening and risk analytics technology that enables the P&C insurance industry to grow by underwriting new and evolving risks, such as cyber risk, that have gone underinsured or uninsured. This acquisition was accounted for as a business combination. The results of Cyence’s operations have been included in our results of operations since November 1, 2017, the date of acquisition.
In February 2017, we completed the acquisition of ISCS, Inc. (“ISCS”), for cash consideration, net of certain adjustments, of approximately $154.9 million. Through the acquisition we gained a cloud-based, all-in-one transactional platform that combines policy, billing, and claims management functionality for P&C insurers. Re-branded InsuranceNow, this platform enhances our ability to serve P&C insurers that have less complex businesses, require the functionality of a suite, and prefer cloud-based delivery. We will continue to invest in this platform, improving its scalability and performance, reducing its cost to implement and deliver, adapting it for international markets, and integrating it with our data and analytics and digital products. The results of ISCS’s operations have been included in our results of operations since February 16, 2017, the date of acquisition.
In August 2016, we added Guidewire Underwriting Management through the acquisition of FirstBest, a provider of underwriting management systems and related applications to P&C insurers, for total consideration of approximately $37.8 million. We believe that, over time, this acquisition will allow us to expand our insurance platform by providing insurers in the United States and Canada that write complex commercial, specialty, and workers’ compensation lines greater support for their risk assessment and decision-making processes. The results of FirstBest’s operations have been included in our results of operations since August 31, 2016, the date of acquisition.
32
Seasonality
We have historically experienced seasonal variations in our license and other revenue as a result of increased customer orders in our second and fourth fiscal quarters. We generally see a modest increase in orders in our second fiscal quarter, which is the quarter ending January 31, due to customer buying patterns. We also see increased orders in our fourth fiscal quarter, which is the quarter ending July 31, due to efforts by our sales team to achieve annual incentives. This seasonal pattern, however, may be absent in any given year. For example, the timing of a small number of large transactions or the entry into term license agreements with a term of more than two years may be sufficient to disrupt seasonal revenue trends. Additionally, the adoption of ASC 606 will also heighten the seasonal impact on our new term licenses that are multi-year in nature with more revenue recognized upfront upon delivery of our software. On an annual basis, our maintenance revenue which is recognized ratably, may also be impacted in the event that seasonal patterns change significantly. During fiscal years in which subscriptions increase as a percentage of total sales, the revenue we can recognize in such fiscal year will be reduced, deferred revenue will increase, and our reported revenue growth will be adversely affected due to the ratable nature of these arrangements. The seasonal nature of our sales and the concentration of such sales in our fourth fiscal quarter magnifies this impact.
Our services revenue is also subject to seasonal fluctuations, though to a lesser degree than our license revenue. Our services revenue is impacted by the number of billable days in a given fiscal quarter. The fiscal quarter ended January 31 usually has fewer billable days due to the impact of the Thanksgiving, Christmas and New Year’s holidays. The fiscal quarter ended July 31 usually has fewer billable days due to the impact of vacation times taken by our professional staff. Because we pay our services professionals the same amounts throughout the year, our gross margins on our services revenue is usually lower in these quarters. This seasonal pattern, however, may be absent in any given year.
Public Offerings
On March 13, 2018, we closed a public offering of 2,628,571 shares of our common stock, including the underwriters’ exercise in full of their option to purchase additional shares of our common stock. The public offering price of the shares sold in the offering was $87.50 per share. Our stockholders did not sell any shares in this public offering. Concurrently, we offered and sold $400.0 million aggregate principal amount of our 1.25% Convertible Senior Notes due 2025, including the underwriters’ exercise in full of their option to purchase additional Convertible Senior Notes. Net of issuance costs, we received net proceeds of approximately $220.9 million related to the common stock offering and $387.2 million related to the convertible note offering.
Key Business Metrics
We use certain key metrics to evaluate and manage our business, including rolling four-quarter recurring revenue from term licenses and total maintenance. In addition, we present selected GAAP and non-GAAP financial metrics, including operating cash flows and capital expenditures that we use internally to manage the business and that we believe are useful for investors.
Four-Quarter Recurring Revenue
We measure four-quarter recurring revenue by adding the total term license and other revenue and total maintenance revenue recognized under GAAP in the preceding four quarters ended in the stated period. This metric excludes perpetual license revenue, revenue from perpetual buyout rights and services revenue. This metric has allowed us to better understand the trends in our recurring revenue because it typically reduces the variations in any particular quarter caused by seasonality, the effects of the annual invoicing of our term licenses and certain effects of contractual provisions that may accelerate or delay revenue recognition. This metric applies revenue recognition rules under GAAP and does not substitute individually tailored revenue recognition and measurement methods. With our transition to more subscription-based contracts and our adoption of new revenue recognition rules effective on August 1, 2018, this metric will become less indicative of our future revenue trends and will not be disclosed in future quarters. Our four-quarter recurring revenue for the last nine quarters was:
Four quarters ended | |||||||||||||||||||||||||||||||||||
July 31, 2018 | April 30, 2018 | January 31, 2018 | October 31, 2017 | July 31, 2017 | April 30, 2017 | January 31, 2017 | October 31, 2016 | July 31, 2016 | |||||||||||||||||||||||||||
(in thousands, unaudited) | |||||||||||||||||||||||||||||||||||
Term license revenue | $ | 303,964 | $ | 258,954 | $ | 272,328 | $ | 253,792 | $ | 258,322 | $ | 237,919 | $ | 220,494 | $ | 210,278 | $ | 208,430 | |||||||||||||||||
Total maintenance revenue | 77,337 | 75,460 | 73,568 | 71,041 | 68,643 | 66,958 | 64,776 | 62,451 | 59,931 | ||||||||||||||||||||||||||
Total four-quarter recurring revenue | $ | 381,301 | $ | 334,414 | $ | 345,896 | $ | 324,833 | $ | 326,965 | $ | 304,877 | $ | 285,270 | $ | 272,729 | $ | 268,361 | |||||||||||||||||
33
Operating Cash Flows and Capital Expenditures
We monitor our cash flows from operating activities and used for capital expenditures, as a key measure of our overall business performance, which enables us to analyze our financial performance without the effects of certain non-cash items such as depreciation and amortization and stock-based compensation expenses. Additionally, operating cash flows takes into account the impact of changes in deferred revenue, which reflects the receipt of cash payment for products before they are recognized as revenue. Our operating cash flows are significantly impacted by the timing of invoicing and collections of accounts receivable, the size of our annual bonus payment, as well as payments of payroll and other taxes. As a result, our operating cash flows fluctuate significantly on a year-over-year basis. Cash provided by our operations were $140.5 million, $137.2 million, and $99.9 million for fiscal years 2018, 2017 and 2016, respectively. Additionally, cash flows used for capital expenditures were $12.0 million, $6.7 million, and $7.1 million for fiscal years 2018, 2017, and 2016, respectively. Our capital expenditures consisted of purchases of property and equipment, most of which was computer hardware, software, capitalized software development costs, and leasehold improvements. For a further discussion of our operating cash flows, see “Liquidity and Capital Resources-Cash Flows”.
Critical Accounting Policies and Estimates
Our consolidated financial statements are prepared in conformity with generally accepted accounting principles in the United States of America (“U.S. GAAP”). Accounting policies, methods and estimates are an integral part of the preparation of our consolidated financial statements in accordance with U.S. GAAP and, in part, are based upon management’s current judgments. Those judgments are normally based on knowledge and experience with regard to past and current events and assumptions about future events. Certain accounting policies, methods and estimates are particularly sensitive because of their significance to our consolidated financial statements and because of the possibility that future events affecting them may differ markedly from management’s current judgments. While there are a number of significant accounting policies, methods and estimates affecting our consolidated financial statements which are described in Note 1 “The Company and a Summary of Significant Accounting Policies” to our consolidated financial statements, areas that are particularly significant include:
• | Revenue recognition policies; and |
• | Business combinations. |
Revenue Recognition
We enter into arrangements to deliver multiple products or services (multiple-elements). For a substantial majority of our sales, we apply software revenue recognition rules and allocate the total revenue among elements based on vendor-specific objective evidence (“VSOE”) of the fair value of each element. We recognize revenue on a net basis excluding indirect taxes, such as sales tax and value added tax, collected from customers and remitted to government authorities.
Revenue is derived from three sources:
(i) | License fees, related to term (or time-based) licenses, cloud-based subscriptions (also referred to as “subscriptions”), and perpetual software licenses; |
(ii) | Maintenance fees associated with term or perpetual licenses relate to email and phone support, bug fixes and unspecified software updates, and upgrades released when, and if, available during the maintenance term; and |
(iii) | Services fees from professional services related to implementation of our software, reimbursable travel, and training provided to our customers. |
VSOE of fair value does not exist for our software licenses. Therefore, we allocate revenue to software licenses using the residual method. Under the residual method, the amount recognized for license fees is the difference between the total fixed and determinable fees and the VSOE of fair value for the undelivered elements under the arrangement.
The VSOE of fair value for elements of an arrangement is based upon the normal pricing and discounting practices for those elements when sold separately. VSOE of fair value for maintenance is established using the stated maintenance renewal rate in the customer’s contract. For term licenses with duration of one year or less, no VSOE of fair value for maintenance exists. VSOE of fair value for services is established if a substantial majority of historical stand-alone selling prices for a service fall within a reasonably narrow price range.
If the undelivered elements are all service elements and VSOE of fair value does not exist for one or more service element, the total arrangement fee is recognized ratably over the longest service period starting at software delivery, assuming all the related services have been made available to the customer.
34
Our subscription revenue is generally recognized ratably over the term of the arrangement, typically at the point in time our provisioning process has been completed and access has been made available to the customer.
As noted above, we generally invoice fees for licenses and maintenance to our customers in annual or, in certain cases, quarterly installments payable in advance. The fees related to maintenance are recognized over the period the maintenance is provided.
Substantially all of our professional services engagements are billed on a time and materials basis and are typically not considered essential to the functionality of the software. The related revenue and costs are recognized in the period incurred. In select situations, we will contract our professional services on a fixed fee basis, where we generally recognize services revenue on a proportional performance basis as the performance obligations are completed.
When professional services are sold with a license arrangement we evaluate whether those services are essential to the functionality of the software. In the limited cases where professional services are deemed to be essential to the functionality of the software and separate accounting for the services is not permitted, the arrangement is accounted for using contract accounting until the essential services are complete.
Deferred revenue represent amounts that are billed to or collected from creditworthy customers for which one or more of the revenue recognition criteria has not been met. The deferred revenue balance does not represent the total contract value of annual or multi-year, non-cancellable arrangements.
Effective August 1, 2018, we have adopted ASU No. 2014-09, “Revenue from Contracts with Customers (ASC 606)”. Under this new accounting standard, our revenue in the future will be recognized differently than in the past. For example, our term licenses require payments to be made annually or quarterly in advance and are subject to extended payment terms. Currently under ASC 605, revenue associated with term software licenses are recognized in the earlier of the period in which the payments are due or are actually made. Under ASC 606, we will be required to recognize the revenue under term licenses not when payments are made or due, but when control of the software license is transferred to the customer, which occurs at or near the time a contract with a customer is executed. As a result, under ASC 606, contractually obligated payments allocated to the software license under a term license that we reasonably expect to collect would be recognized upon delivery.
Business Combinations
Accounting for business combinations requires us to make significant estimates and assumptions, especially at the acquisition date with respect to the valuation of the tangible and intangible assets acquired and liabilities assumed. We use our best estimates and assumptions to accurately assign fair value to the tangible and intangible assets acquired and liabilities assumed at the acquisition date. Goodwill is calculated as the difference between the acquisition-date fair value of the consideration transferred and the values assigned to the assets acquired and liabilities assumed. Examples of critical estimates in valuing certain of the intangible assets and goodwill we have acquired include but are not limited to: future expected cash flows from subscription and support contracts, professional services contracts, other customer contracts and acquired developed technologies; the acquired company’s existing customer and partner relationship, as well as assumptions about the period of time the acquired intangible assets will continue to be used in our offerings; uncertain tax positions and tax related valuation allowances assumed, if any; and discount rates.
Our estimates of fair value are based upon assumptions believed to be reasonable, but which are inherently uncertain and subject to refinement and, as a result, actual results may differ from estimates. During the measurement period, which may be up to one year from the acquisition date, if new information is obtained about facts and circumstances that existed as of the acquisition date, we may record adjustments to the fair value of these assets and liabilities, with the corresponding offset to goodwill. Upon the conclusion of the measurement period or final determination of the fair value of assets acquired and liabilities assumed, whichever comes first, any subsequent adjustments are recorded to our consolidated statements of operations.
Recent Accounting Pronouncements
See Note 1 “The Company and Summary of Significant Accounting Policies” in the Notes to the Consolidated Financial Statements in Item 8 of Part II of this Annual Report on Form 10-K, for a full description of recent accounting pronouncements, including the expected dates of adoption, which is incorporated herein by reference.
35
Results of Operations
The following table sets forth our results of operations for the years presented. The data has been derived from the Consolidated Financial Statements contained in this Annual Report on Form 10-K which, in the opinion of our management, reflect all adjustments, consisting only of normal recurring adjustments, necessary to fairly present the financial position and results of operations for the years presented. The operating results for any period should not be considered indicative of results for any future period.
Fiscal years ended July 31, | ||||||||||||||||||||
2018 | As a % of Total Revenue | 2017 | As a % of Total Revenue | 2016 | As a % of Total Revenue | |||||||||||||||
(in thousands except percentages) | ||||||||||||||||||||
Revenue: | ||||||||||||||||||||
License and other | $ | 315,776 | 47 | % | $ | 271,462 | 53 | % | $ | 219,751 | 52 | % | ||||||||
Maintenance | 77,337 | 12 | 68,643 | 13 | 59,931 | 14 | ||||||||||||||
Services | 267,954 | 41 | 174,179 | 34 | 144,764 | 34 | ||||||||||||||
Total revenue | 661,067 | 100 | 514,284 | 100 | 424,446 | 100 | ||||||||||||||
Cost of revenue: | ||||||||||||||||||||
License and other | 35,452 | 5 | 17,046 | 3 | 7,184 | 2 | ||||||||||||||
Maintenance | 14,783 | 2 | 13,397 | 3 | 11,547 | 3 | ||||||||||||||
Services | 246,472 | 38 | 161,116 | 31 | 133,103 | 31 | ||||||||||||||
Total cost of revenue | 296,707 | 45 | 191,559 | 37 | 151,834 | 36 | ||||||||||||||
Gross profit: | ||||||||||||||||||||
License and other | 280,324 | 42 | 254,416 | 50 | 212,567 | 50 | ||||||||||||||
Maintenance | 62,554 | 10 | 55,246 | 10 | 48,384 | 11 | ||||||||||||||
Services | 21,482 | 3 | 13,063 | 3 | 11,661 | 3 | ||||||||||||||
Total gross profit | 364,360 | 55 | 322,725 | 63 | 272,612 | 64 | ||||||||||||||
Operating expenses: | ||||||||||||||||||||
Research and development | 171,657 | 26 | 130,323 | 26 | 112,496 | 26 | ||||||||||||||
Sales and marketing | 124,117 | 19 | 109,239 | 21 | 92,765 | 22 | ||||||||||||||
General and administrative | 75,916 | 11 | 56,551 | 11 | 50,914 | 12 | ||||||||||||||
Total operating expenses | 371,690 | 56 | 296,113 | 58 | 256,175 | 60 | ||||||||||||||
Income (loss) from operations | (7,330 | ) | (1 | ) | 26,612 | 5 | 16,437 | 4 | ||||||||||||
Interest income | 13,281 | 2 | 5,867 | 1 | 4,850 | 1 | ||||||||||||||
Interest expense | (6,442 | ) | (1 | ) | (13 | ) | — | — | — | |||||||||||
Other income (expense), net | 509 | — | 811 | — | (505 | ) | — | |||||||||||||
Income before provision for income taxes | 18 | — | 33,277 | 6 | 20,782 | 5 | ||||||||||||||
Provision for income taxes | 19,683 | 3 | 12,053 | 2 | 5,806 | 1 | ||||||||||||||
Net income (loss) | $ | (19,665 | ) | (3 | )% | $ | 21,224 | 4 | % | $ | 14,976 | 4 | % | |||||||
Comparison of the Fiscal Years Ended July 31, 2018 and 2017
Revenue
We derive our revenue primarily from licensing our software applications, providing maintenance support, and delivering professional services. Additionally, a small but growing portion of our revenue is derived from subscriptions of our cloud-delivered software.
We adopted ASU No. 2014-09, “Revenue from Contracts with Customers (ASC 606)” effective August 1, 2018, the beginning of our fiscal year 2019. Refer to Note 1 of the Notes to Consolidated Financial Statements included in Item 8 of this Form 10-K for further details on our evaluation of the potential impact of ASC 606 as well as a description of our accounting policy related to revenue recognition.
Licenses and Other
36
A substantial majority of our license and other revenue consists of term license fees. We also recognize revenue from sales of cloud-based subscriptions and perpetual licenses. Our term license revenue is primarily generated through annual license fees that recur during the term of the contract. Since fiscal year 2017, a majority of our term licenses have been sold with a two year committed term with optional annual renewals. Under existing accounting guidance that is effective through July 31, 2018, term license revenue is generally recognized upon the earlier of when payment is due or cash is received from our customers as a result of extended payment terms in the contract. Under ASC 606 which is effective beginning in our fiscal year 2019, term license revenue will generally be fully recognized upon delivery of the software, which accelerates the timing of revenue recognition compared to existing guidance.
Subscription revenue is recognized ratably over the term of the arrangement, beginning at the point in time our provisioning process has been completed and access has been made available to the customer. The initial term of such arrangements can range up to five years or more as they are not generally limited to a two year initial term like our term software licenses. Subscription agreements also contain optional annual renewals commencing upon the expiration of the initial contract term.
In a limited number of cases, we license our software on a perpetual basis or our term licenses provide the customer with the option to purchase a perpetual license at the end of the initial contract term, which we refer to as a perpetual buyout right. Perpetual license revenue is generally recognized upon delivery.
We generally price our software based on the amount of direct written premiums, or DWP, that will be managed by our software. A majority of our term license customers are billed either annually or quarterly in advance, and we currently bill our cloud-based subscription customers similarly. We invoice our perpetual license customers either in full at contract signing or on an installment basis.
Maintenance
Our maintenance revenue is generally recognized over the committed maintenance term. Our maintenance fees are typically priced as a fixed percentage of the associated license fees. We invoice a substantial majority of our customers annually in advance.
Services
Our services revenue is primarily derived from implementation services performed for our customers, reimbursable travel expenses and training fees. A substantial majority of our services engagements generate revenue on a time and materials basis and revenue is recognized upon delivery of our services.
Fiscal years ended July 31, | ||||||||||||||||||||
2018 | 2017 | Change | ||||||||||||||||||
% of total | % of total | |||||||||||||||||||
Amount | revenue | Amount | revenue | ($) | (%) | |||||||||||||||
(in thousands, except percentages) | ||||||||||||||||||||
Revenue: | ||||||||||||||||||||
License and other | $ | 315,776 | 47 | % | $ | 271,462 | 53 | % | $ | 44,314 | 16 | % | ||||||||
Maintenance | 77,337 | 12 | 68,643 | 13 | 8,694 | 13 | ||||||||||||||
Services | 267,954 | 41 | 174,179 | 34 | 93,775 | 54 | ||||||||||||||
Total revenue | $ | 661,067 | 100 | % | $ | 514,284 | 100 | % | $ | 146,783 | 29 | % | ||||||||
License and Other Revenue
Our license and other revenue primarily consists of term license revenue, and, to a lesser extent, subscriptions and perpetual licenses. In certain periods prior to August 1, 2018, our reported license revenue was positively impacted by early receipt of payments due in future periods and negatively impacted by early payments received in preceding periods. Effective with our adoption of ASC 606 on August 1, 2018, license revenue under term licenses will be recognized upon delivery for the entire initial term rather than annually upon the earlier of receipt or when the payment is due. While term licenses remain our predominant licensing model, we anticipate subscriptions to grow as a percentage of annual sales in future periods. Due to the ratable recognition of subscription revenue, growth in subscription revenue will lag behind the growth of subscription sales and will impact the comparative growth of our reported revenue.
37
Fiscal years ended July 31, | ||||||||||||||||||||
2018 | 2017 | Change | ||||||||||||||||||
% of license and other | % of license and other | |||||||||||||||||||
Amount | revenue | Amount | revenue | ($) | (%) | |||||||||||||||
(In thousands, except percentages) | ||||||||||||||||||||
License and other revenue: | ||||||||||||||||||||
Term and other | $ | 303,963 | 96 | % | $ | 258,322 | 95 | % | $ | 45,641 | 18 | % | ||||||||
Perpetual | 11,813 | 4 | 13,140 | 5 | (1,327 | ) | (10 | ) | ||||||||||||
Total license and other revenue | $ | 315,776 | 100 | % | $ | 271,462 | 100 | % | $ | 44,314 | 16 | % | ||||||||
The $45.6 million increase in our term and other revenue was primarily driven by net increases in revenue resulting from the timing of invoices from new and existing customers that affected revenue recognition, escalating annual fees from existing orders, recently acquired customers, and increased adoption of most subscription offerings in our InsurancePlatform, including InsuranceSuite, data and analytics, and digital engagement applications.
Perpetual license revenue accounted for approximately 4% of total license and other revenue. We anticipate that revenue from the sale and delivery of perpetual licenses will continue to represent a small percentage of our total license and other revenue. Nevertheless, we expect perpetual license revenue to remain volatile across quarters due to the large amount of perpetual revenue that may be generated from a single customer order.
In the fourth quarter of our fiscal year 2018, we recognized approximately $0.3 million of revenue as a result of payments received in advance of due dates which were to occur in the following fiscal year, compared to approximately $6.1 million of early payments received in the fourth fiscal quarter of 2017. The net impact of early payments to license and other revenue was approximately $5.8 million less in fiscal year 2018. In future periods under the new revenue recognition guidance effective August 1, 2018, the timing of payments received will not affect the timing of revenue on term licenses.
Maintenance Revenue
The $8.7 million increase in our maintenance revenue reflects our growing term customer base. Subscription arrangements include maintenance as part of the subscription service and are not priced or reported separately. As a result, an increase in the mix of subscription orders in the future will reduce the growth in maintenance revenue.
Services Revenue
The $93.8 million increase in our services revenue was primarily driven by a net increase of $62.0 million in billings from new and existing customer engagements performed during fiscal year 2018, and $26.4 million in professional services billings relating to engagements from our recently acquired products and services.
Services revenue for fiscal years 2017 and 2016 excluded $12.6 million and $5.1 million, respectively, of services billings deferred in such years which were associated with our work for our customer, MetLife, in connection with its implementation of InsuranceSuite Cloud. In May 2017, all services were completed and accepted and we began to recognize the previously deferred revenue and costs ratably over a term of approximately two years from the acceptance date. In fiscal years 2018 and 2017, $10.7 million and $2.7 million was recognized related to this project, respectively.
Historically, we have relied on our network of third-party SI partners to facilitate new sales and implementations of our products. We believe this model will continue to serve us well and we intend, in the future, to continue to expand our network of SI partners and the number of trained consultants with whom we work.
While not essential to the functionality of the cloud-delivered subscription software, for a period of time implementations of InsuranceNow or InsuranceSuite Cloud may require greater levels of participation by our services professionals than is currently necessary for on-premise versions of our products. With respect to InsuranceSuite Cloud, our obligation to manage the platform in production requires us to have a greater familiarity with its configuration and integrations. As a result, we intend to control implementation work until effective processes have been established to reduce any risk we face in managing a production environment for a system we have not implemented. At the time of acquisition, ISCS had few third-party resources to assist with implementations of InsuranceNow. While we are actively qualifying and training consultants from existing and new partners to assist with such implementations, we have taken, and for the foreseeable future we expect to take, primary responsibility for InsuranceNow implementations.
As we gain experience with the deployment and maintenance of cloud solutions, we intend to leverage our SI partners more effectively and, over time, replicate more closely the necessary effort associated with on-premise implementations. However, we anticipate service revenue to maintain at current levels as a percentage of total revenue in fiscal year 2019.
38
We also expect modestly higher levels of variability in our service revenue. As we continue to expand into new markets and new product categories, we have, and we expect to, enter into contracts that may require us to delay the recognition of service revenue and associated costs until we are able to meet certain contractual obligations, including customer acceptance criteria or the delivery of new products. This has in the past, and may in the future, result in volatility in our reported services revenue and cost of revenue.
Deferred Revenue
As of July 31, | ||||||||||||||
2018 | 2017 | Change | ||||||||||||
Amount | Amount | ($) | (%) | |||||||||||
(In thousands, except percentages) | ||||||||||||||
Deferred revenue: | ||||||||||||||
Deferred license and other revenue | $ | 43,672 | 23,727 | $ | 19,945 | 84 | % | |||||||
Deferred maintenance revenue | 54,554 | 47,727 | 6,827 | 14 | ||||||||||
Deferred services revenue | 39,670 | 39,681 | (11 | ) | — | |||||||||
Total deferred revenue | $ | 137,896 | $ | 111,135 | $ | 26,761 | 24 | % | ||||||
Deferred License and Other Revenue
The $19.9 million increase in deferred license and other revenue was a result of an $11.8 million increase due to term license billings related to new and existing contracts that will be recognized ratably, primarily related to annual renewals of term licenses, as well as an $8.1 million increase in subscription contracts, primarily as a result of the acquisition of Cyence.
Deferred Maintenance Revenue
The $6.8 million increase in deferred maintenance revenue was primarily driven by the timing of the recognition of revenue in excess of new billings, and reflects the seasonal nature of our billings of maintenance revenue. Additionally, subscription arrangements include maintenance as part of the subscription service and are not priced or reported separately. As a result, an increase in the mix of subscription orders in the future will reduce the growth in maintenance revenue and may impact the growth in deferred maintenance revenue.
Deferred Services Revenue
Deferred services revenue remained relatively flat as the amount of new services billings which are being deferred were offset by the recognition of previously deferred billings that were recognized upon completion or going live of the projects. These projects mainly consisted of ongoing InsuranceNow implementations related to acquired contracts.
Deferred services revenue at July 31, 2018 and 2017 included $7.0 million and $17.7 million of services revenue associated with MetLife’s implementation of InsuranceSuite Cloud that was deferred as a result of our agreement to develop specific functionality. We began to recognize these previously deferred revenue and costs ratably over an approximate term of two years beginning in May 2017, when the project was completed.
Generally, our deferred revenue consists only of amounts that have been invoiced, but not yet recognized as revenue. As a result, deferred revenue and change in deferred revenue represent incomplete measures of the strength of our business and are not necessarily indicative of our future performance. However, the transition to a greater mix of subscription orders will likely result in higher deferred revenue.
Cost of Revenue and Gross Profit
Our total cost of revenue and gross profit are variable and depend on the type of revenue earned in each period.
Our cost of license and other revenue primarily consists of headcount and related employee costs for our production services employees, cloud infrastructure costs, amortization of our acquired intangible assets, and royalty fees paid to third parties. Our cost of maintenance revenue consists of headcount and related employee costs for our technical support team. Our cost of services revenue primarily consists of headcount and related employee costs for our professional service employees and contractors and travel-related costs. In the instances where we have primary responsibility for the delivery of services, subcontractor fees are expensed as cost of service. In each case, personnel costs include stock-based compensation and allocated overhead.
We allocate overhead such as IT support, information security, facility, and other administrative costs to all functional departments based on headcount. As such, general overhead expenses are reflected in cost of revenue and each functional operating expense.
39
Fiscal years ended July 31, | ||||||||||||||||||||
2018 | 2017 | Change | ||||||||||||||||||
Amount | % of total revenue | Amount | % of total revenue | ($) | (%) | |||||||||||||||
(In thousands, except percentages) | ||||||||||||||||||||
Cost of revenue: | ||||||||||||||||||||
License and other | $ | 35,452 | 5 | % | $ | 17,046 | 3 | % | $ | 18,406 | 108 | % | ||||||||
Maintenance | 14,783 | 2 | 13,397 | 3 | 1,386 | 10 | ||||||||||||||
Services | 246,472 | 38 | 161,116 | 31 | 85,356 | 53 | ||||||||||||||
Total cost of revenue | $ | 296,707 | 45 | % | $ | 191,559 | 37 | % | $ | 105,148 | 55 | % | ||||||||
Includes stock-based compensation of: | ||||||||||||||||||||
Cost of license and other revenue | $ | 1,002 | $ | 373 | $ | 629 | ||||||||||||||
Cost of maintenance revenue | 1,886 | 1,694 | 192 | |||||||||||||||||
Cost of services revenue | 21,856 | 18,622 | 3,234 | |||||||||||||||||
Total | $ | 24,744 | $ | 20,689 | $ | 4,055 | ||||||||||||||
The $18.4 million increase in our cost of license and other revenue was primarily attributable to increases of $10.0 million related to the amortization of acquired intangible assets, and $5.9 million related to increased headcount related expenses and cloud infrastructure costs incurred in order to support the growth of our subscription and cloud offerings. We anticipate higher cost of license and other revenue as we continue to invest in our cloud operations.
Cost of maintenance revenue increased by $1.4 million primarily due to the increase in staff required to support our term and perpetual license customers.
Our cost of services revenue increased by $85.4 million due to new and existing customer engagements relating to the implementation of InsuranceNow and InsuranceSuite Cloud, which in aggregate resulted in increases in headcount related expenses of $57.4 million, increases in expenses for billable third-party consultants and sub-contractors of $20.4 million, and $7.4 million associated with an engagement to deliver services in 2019 for which no additional revenue will be generated.
Cost of services revenue for fiscal year 2017 was partially offset by net deferrals of $8.7 million of implementation costs related to our customer, MetLife, in connection with its implementation of InsuranceSuite Cloud. In May 2017, all services were completed and accepted and we began to recognize those previously deferred costs ratably over a term of approximately two years from the acceptance date. In fiscal years 2018 and 2017, $5.2 million and $1.2 million of cost was recognized related to this project, respectively.
We had 838 professional service employees and 121 technical support and licensing operations employees at July 31, 2018 compared to 730 professional services employees and 95 technical support and licensing operations employees at July 31, 2017.
Gross Profit
Fiscal years ended July 31, | ||||||||||||||||||||
2018 | 2017 | Change | ||||||||||||||||||
Amount | margin % | Amount | margin % | ($) | (%) | |||||||||||||||
(In thousands, except percentages) | ||||||||||||||||||||
Gross profit: | ||||||||||||||||||||
License and other | $ | 280,324 | 89 | % | $ | 254,416 | 94 | % | $ | 25,908 | 10 | % | ||||||||
Maintenance | 62,554 | 81 | 55,246 | 80 | 7,308 | 13 | ||||||||||||||
Services | 21,482 | 8 | 13,063 | 7 | 8,419 | 64 | ||||||||||||||
Total gross profit | $ | 364,360 | 55 | % | $ | 322,725 | 63 | % | $ | 41,635 | 13 | % | ||||||||
Our gross margin decreased to 55% for fiscal year 2018, as compared to 63% for fiscal year 2017, primarily due to changes in the mix between higher gross margin license and other revenue and lower gross margin services revenue in addition to lower license and other margins. The decline in our license and other margin is primarily attributable to the increase in our costs associated with amortization of acquired intangible assets, headcount, and cloud infrastructure costs incurred in order to support the growth of our subscription and cloud operations. These decreases were partially offset by slightly improved services margins compared to the same period a year ago.
40
We intend to continue to invest in our cloud operations as our subscription revenue increases, which will impact license and other margins. Finally, we also anticipate that our costs associated with the amortization of intangible assets will continue to contribute to lower margins.
Operating Expenses
Our operating expenses consist of research and development, sales and marketing, and general and administrative expenses. The largest components of our operating expenses are compensation and benefit expenses for our employees, including stock-based awards and, to a lesser extent, professional services, and allocated general overhead expenses. We allocate overhead such as IT support, information security, facility, and other administrative costs to all functional departments based on headcount. As a result, general overhead expenses are reflected in cost of revenue and each functional operating expense.
Fiscal years ended July 31, | ||||||||||||||||||||
2018 | 2017 | Change | ||||||||||||||||||
% of total | % of total | |||||||||||||||||||
Amount | revenue | Amount | revenue | ($) | (%) | |||||||||||||||
(In thousands, except percentages) | ||||||||||||||||||||
Operating expenses: | ||||||||||||||||||||
Research and development | $ | 171,657 | 26 | % | $ | 130,323 | 26 | % | $ | 41,334 | 32 | % | ||||||||
Sales and marketing | 124,117 | 19 | 109,239 | 21 | 14,878 | 14 | ||||||||||||||
General and administrative | 75,916 | 11 | 56,551 | 11 | 19,365 | 34 | ||||||||||||||
Total operating expenses | $ | 371,690 | 56 | % | $ | 296,113 | 58 | % | $ | 75,577 | 26 | % | ||||||||
Includes stock-based compensation of: | ||||||||||||||||||||
Research and development | $ | 25,440 | $ | 18,123 | $ | 7,317 | ||||||||||||||
Sales and marketing | 18,387 | 16,663 | 1,724 | |||||||||||||||||
General and administrative | 21,043 | 16,319 | 4,724 | |||||||||||||||||
Total | $ | 64,870 | $ | 51,105 | $ | 13,765 | ||||||||||||||
Research and Development
Our research and development expenses primarily consist of costs incurred for compensation and benefit expenses for our technical staff, including stock-based awards and allocated overhead, as well as professional services costs.
The $41.3 million increase in research and development expenses was primarily due to increases in our headcount and related employee expenses of $43.4 million, partially offset by the capitalization of internal-use software development costs of $2.9 million during fiscal year 2018, related to the development of new cloud-based technology applications.
Our research and development headcount was 749 as of July 31, 2018 compared with 581 as of July 31, 2017. The increase in headcount reflects our continued investment in the development of our products, and includes 71 employees gained through our Cyence acquisition.
We expect our research and development expenses to continue to increase in absolute dollars as we continue to hire in research and development, and continue to dedicate internal resources to develop, improve, and expand the functionality of our solutions. Research and development expenses may also increase if we pursue additional acquisitions.
Sales and Marketing
Our sales and marketing expenses primarily consist of costs incurred for compensation and benefit expenses for our sales and marketing employees, including stock-based awards, commissions and allocated overhead. It also includes travel expenses, professional services for marketing activities, and amortization of certain acquired intangibles.
The $14.9 million increase in sales and marketing expenses was primarily due to the net increases in headcount and related employee expenses of $8.1 million and increased amortization expense associated with recently acquired intangible assets of $5.4 million.
Our sales and marketing headcount was 329 as of July 31, 2018 compared with 298 as of July 31, 2017.
We expect our sales and marketing expenses to continue to increase in absolute dollars as we continue to invest in sales and marketing activities to support our business growth and objectives.
41
General and Administrative
Our general and administrative expenses consist primarily of compensation and benefit expenses, including stock-based awards, as well as professional services, and allocated overhead costs related to our executive, finance, human resources, information technology, corporate development, and legal functions.
The $19.4 million increase in our general and administrative expenses was primarily attributable to $9.7 million of costs associated with the acquisition of Cyence and costs related to the investment in our corporate infrastructure, including fees associated with a new global finance enterprise resource planning system and other costs associated with the adoption of new accounting standards and to support our growth, and $9.5 million increased costs for our headcount and related employee expenses.
Our general and administrative headcount was 255 as of July 31, 2018 compared with 189 as of July 31, 2017. The increase in headcount was required to support the growth of our business.
We expect that our general and administrative expenses will increase in absolute dollars as we continue to invest in personnel and corporate infrastructure and systems required to support our strategic initiatives, the growth of our business, and our compliance and reporting obligations.
Other Income (Expense)
Fiscal years ended July 31, | ||||||||||||||
2018 | 2017 | Change | ||||||||||||
Amount | Amount | ($) | (%) | |||||||||||
(In thousands, except percentages) | ||||||||||||||
Interest income | $ | 13,281 | $ | 5,867 | $ | 7,414 | 126 | % | ||||||
Interest expense | $ | (6,442 | ) | $ | (13 | ) | $ | (6,429 | ) | 49,454 | % | |||
Other income | $ | 509 | $ | 811 | $ | (302 | ) | (37 | )% | |||||
Interest Income
Interest income represents interest earned on our cash, cash equivalents, and investments.
Interest income increased by $7.4 million for fiscal year 2018. The increase in our interest income is associated with the increase in our investment portfolio primarily as a result of proceeds of approximately $220.9 million related to the common stock offering and $387.2 million related to the convertible note offering in March 2018 and, to a lesser extent, higher yields on our cash equivalents and investments.
Interest Expense
Interest expense represents interest expense associated with the $400.0 million aggregate principal amount of our Convertible Senior Notes that were issued in March 2018.
Interest expense was $6.4 million for fiscal year 2018 primarily due the non-cash interest expense of $4.5 million related to the amortization of debt discount and issuance costs, and stated interest of $1.9 million associated with the Convertible Senior Notes issued in March 2018.
Other Income (Expense), Net
Other income (expense), net consists primarily of foreign exchange gains and losses resulting from fluctuations in foreign exchange rates on receivables and payables denominated in currencies other than the U.S. dollar.
Other income decreased by $0.3 million, as compared to the prior fiscal year. We realized a net currency exchange gain of $0.5 million in fiscal year 2018 as compared to a net currency exchange gain of $0.8 million in fiscal year 2017 as a result of less favorable exchange rate movements for transactions denominated in the British Pound, Euro, Australian Dollar, Canadian Dollar, Japanese Yen, Brazilian Real, Malaysian Ringgit, and Argentine Peso.
Provision for Income Taxes
We are subject to taxes in the United States as well as other tax jurisdictions or countries in which we conduct business. Earnings from our non-U.S. activities are subject to local country income tax and may be subject to current U.S. income tax.
42
Fiscal years ended July 31, | ||||||||||||||
2018 | 2017 | Change | ||||||||||||
Amount | Amount | ($) | (%) | |||||||||||
(In thousands, except percentages) | ||||||||||||||
Provision for income taxes | $ | 19,683 | $ | 12,053 | $ | 7,630 | 63 | % | ||||||
Effective tax rate | * | 36 | % | |||||||||||
* not meaningful
We recognized an income tax provision of $19.7 million for fiscal year 2018 compared to $12.1 million for fiscal year 2017, which was primarily due to the increase in tax due to the remeasurement of U.S. deferred taxes as a result of the Tax Act, and permanent differences for non-deductible executive compensation and acquisition-related expenses offset by tax benefits related to research and development credits and excess tax benefits. The effective tax rate of 109,350% for fiscal year 2018, differs from the statutory U.S. Federal income tax rate of 26.9% mainly due to the remeasurement of U.S. deferred taxes as a result of the Tax Act, changes in valuation allowance, and permanent differences for stock-based compensation, including excess tax benefits, research and development credits, the tax rate differences between the United States and foreign countries, foreign withholding taxes, certain non-deductible expenses including executive compensation, and acquisition-related expenses.
Comparison of the Fiscal Years Ended July 31, 2017 and 2016
Revenue
Fiscal years ended July 31, | ||||||||||||||||||||
2017 | 2016 | Change | ||||||||||||||||||
% of total revenue | % of total revenue | |||||||||||||||||||
Amount | Amount | ($) | (%) | |||||||||||||||||
(in thousands, except percentages) | ||||||||||||||||||||
Revenue: | ||||||||||||||||||||
License and other | $ | 271,462 | 53 | % | $ | 219,751 | 52 | % | $ | 51,711 | 24 | % | ||||||||
Maintenance | 68,643 | 13 | 59,931 | 14 | 8,712 | 15 | ||||||||||||||
Services | 174,179 | 34 | 144,764 | 34 | 29,415 | 20 | ||||||||||||||
Total revenue | $ | 514,284 | 100 | % | $ | 424,446 | 100 | % | $ | 89,838 | 21 | % | ||||||||
License and Other Revenue
The $51.7 million increase in our license and other revenue was primarily driven by increased adoption of most offerings in our InsurancePlatform, including InsuranceSuite, data and analytics and digital engagement applications.
Fiscal years ended July 31, | ||||||||||||||||||||
2017 | 2016 | Change | ||||||||||||||||||
% of license revenue | % of license revenue | |||||||||||||||||||
Amount | Amount | ($) | (%) | |||||||||||||||||
(In thousands, except percentages) | ||||||||||||||||||||
License and other revenue: | ||||||||||||||||||||
Term and other | $ | 258,322 | 95 | % | $ | 208,430 | 95 | % | $ | 49,892 | 24 | % | ||||||||
Perpetual | 13,140 | 5 | 11,321 | 5 | 1,819 | 16 | ||||||||||||||
Total license and other revenue | $ | 271,462 | 100 | % | $ | 219,751 | 100 | % | $ | 51,711 | 24 | % | ||||||||
The $49.9 million increase in our term and other revenue was primarily driven by term licenses with new and existing customers, and net increases in revenue of $7.4 million resulting from the timing of invoices and corresponding due dates, payments received in advance of corresponding due dates, and other contractual terms that affected revenue recognition from existing orders.
Perpetual license revenue accounted for approximately 5% of total license and other revenue.
In the fourth fiscal quarter of fiscal year 2017, we recognized approximately $6.1 million of revenue as a result of payments received in that fiscal year in advance of due dates which fell in the following fiscal year, resulting in approximately $3.4 million of net benefit to revenue of early payments recognized in fiscal year 2017. Similarly, in the fourth quarter of fiscal year 2016, we recognized approximately $2.7 million of revenue as a result of early payments received in advance of due dates which were in fiscal year 2017. For the fiscal year 2016, the net benefit to revenue of early payments was approximately $2.7 million.
43
Maintenance Revenue
The $8.7 million increase in our maintenance revenue reflects our growing customer base and increased term and perpetual license revenue.
Services Revenue
The $29.4 million increase in our services revenue was primarily driven by a net increase in billings from new and existing customer engagements performed during fiscal year 2017 and included $17.8 million in billings associated with engagements from our recently acquired products and services.
Services revenue for fiscal years 2017 and 2016 excluded $12.6 million and $5.1 million, respectively, of services billings deferred in such years which were associated with our work for our customer, MetLife, in connection with its implementation of Guidewire InsuranceSuite Cloud. All services revenue and direct services costs were deferred on this project, as part of our agreement to develop new digital portal functionality in conjunction with that implementation. In May 2017, all services were completed and accepted and we began to recognize those previously deferred revenue and costs ratably over a term of approximately two years from the acceptance date.
Deferred Revenue
As of July 31, | ||||||||||||||
2017 | 2016 | Change | ||||||||||||
Amount | Amount | ($) | (%) | |||||||||||
(In thousands, except percentages) | ||||||||||||||
Deferred revenue: | ||||||||||||||
Deferred license and other revenue | $ | 23,727 | $ | 19,841 | $ | 3,886 | 20 | % | ||||||
Deferred maintenance revenue | 47,727 | 38,928 | 8,799 | 23 | ||||||||||
Deferred services revenue | 39,681 | 11,246 | 28,435 | 253 | ||||||||||
Total deferred revenue | $ | 111,135 | $ | 70,015 | $ | 41,120 | 59 | % | ||||||
Deferred License and Other Revenue
The $3.9 million increase in deferred license and other revenue was primarily due to the combined net impact from increases in deferrals of amounts associated with subscription contracts that are recognized on a ratable basis, increases in license billings related to new contracts executed during fiscal year 2017 which will be recognized when contractual obligations are met, partially offset by the recognition of billings recognized based on timing of payments and upon meeting certain contractual obligations.
Deferred Maintenance Revenue
The $8.8 million increase in deferred maintenance revenue was primarily driven by the combined net impact of increased billings during the fiscal year that was partially offset by revenue recognized from new and existing orders.
Deferred Services Revenue
Deferred services revenue was $39.7 million as of July 31, 2017, which included $17.7 million of service revenue associated with MetLife’s implementation of InsuranceSuite Cloud that was deferred as a result of our agreement to develop specific functionality. We began to recognize the previously deferred revenue and costs ratably over an approximate term of two years beginning in May 2017, when the project was completed.
The $28.4 million increase in deferred services revenue was primarily driven by a $12.6 million increase in deferred service billings related to the MetLife implementation in fiscal year 2017 and a $11.7 million increase in deferred services billings associated with ongoing InsuranceNow implementations related to acquired contracts which are being deferred until customer acceptance and then recognized ratably over the remaining contract term.
44
Cost of Revenue and Gross Profit
Fiscal years ended July 31, | ||||||||||||||||||
2017 | 2016 | Change | ||||||||||||||||
Amount | % of total revenue | Amount | % of total revenue | ($) | (%) | |||||||||||||
(In thousands, except percentages) | ||||||||||||||||||
Cost of revenue: | ||||||||||||||||||
License and other | $ | 17,046 | 3 | % | $ | 7,184 | 2 | % | $ | 9,862 | 137 | % | ||||||
Maintenance | 13,397 | 3 | 11,547 | 3 | 1,850 | 16 | ||||||||||||
Services | 161,116 | 31 | 133,103 | 31 | 28,013 | 21 | ||||||||||||
Total cost of revenue | $ | 191,559 | 37 | % | $ | 151,834 | 36 | % | $ | 39,725 | 26 | % | ||||||
Includes stock-based compensation of: | ||||||||||||||||||
Cost of license and other revenue | $ | 373 | $ | 433 | $ | (60 | ) | |||||||||||
Cost of maintenance revenue | 1,694 | 1,491 | 203 | |||||||||||||||
Cost of services revenue | 18,622 | 17,878 | 744 | |||||||||||||||
Total | $ | 20,689 | $ | 19,802 | $ | 887 | ||||||||||||
The $39.7 million increase in cost of revenue was driven, in part, by an increase of $9.9 million in our costs of license and other revenue. The increase in our cost of license and other revenue was primarily attributable to increases of $7.5 million related to the amortization of acquired intangible assets and $2.2 million related to increased headcount and related expenses as we grew our subscription and cloud operations staff.
Cost of maintenance revenue increased by $1.9 million due primarily to increases in headcount and related expenses and increases from consulting expenses.
Cost of services revenue increased by $28.0 million primarily as a result of a $25.4 million increase in our compensation and related headcount expenses, and a $13.8 million increase in our costs for billable third-party consultants and sub-contractors and related expenses, partially offset by net deferrals of $11.8 million of implementation costs related to MetLife’s implementation of InsuranceSuite Cloud and implementation costs associated with acquired ISCS customers for which associated revenue is being deferred until the projects go live. All services delivered to MetLife in connection with InsuranceSuite Cloud were completed and accepted in May 2017. As a result, beginning in May 2017, we began to recognize previously deferred costs ratably over approximately two years from the acceptance date.
We had 730 professional service employees and 95 technical support and licensing operations employees at July 31, 2017 compared to 573 professional services employees and 69 technical support and licensing operations employees at July 31, 2016. The increase in employees included the 128 professional service, technical support and licensing operations employees hired on a permanent basis as part of the ISCS acquisition that we completed on February 16, 2017.
Fiscal years ended July 31, | ||||||||||||||||||||
2017 | 2016 | Change | ||||||||||||||||||
Amount | margin % | Amount | margin % | ($) | (%) | |||||||||||||||
(In thousands, except percentages) | ||||||||||||||||||||
Gross profit: | ||||||||||||||||||||
License and other | $ | 254,416 | 94 | % | $ | 212,567 | 97 | % | $ | 41,849 | 20 | % | ||||||||
Maintenance | 55,246 | 80 | 48,384 | 81 | 6,862 | 14 | ||||||||||||||
Services | 13,063 | 7 | 11,661 | 8 | 1,402 | 12 | ||||||||||||||
Total gross profit | $ | 322,725 | 63 | % | $ | 272,612 | 64 | % | $ | 50,113 | 18 | % | ||||||||
Our gross margin decreased to 63% for fiscal year 2017, as compared to 64% for fiscal year 2016, primarily due to growing costs associated with license and other revenue as we invest more in our emerging cloud business. In addition, the decrease in our gross margin was also attributable to the effect from implementation for MetLife of InsuranceSuite Cloud.
45
Operating Expenses
Fiscal years ended July 31, | ||||||||||||||||||||
2017 | 2016 | Change | ||||||||||||||||||
% of total | % of total | |||||||||||||||||||
Amount | revenue | Amount | revenue | ($) | (%) | |||||||||||||||
(In thousands, except percentages) | ||||||||||||||||||||
Operating expenses: | ||||||||||||||||||||
Research and development | $ | 130,323 | 26 | % | $ | 112,496 | 26 | % | $ | 17,827 | 16 | % | ||||||||
Sales and marketing | 109,239 | 21 | 92,765 | 22 | 16,474 | 18 | ||||||||||||||
General and administrative | 56,551 | 11 | 50,914 | 12 | 5,637 | 11 | ||||||||||||||
Total operating expenses | $ | 296,113 | 58 | % | $ | 256,175 | 60 | % | $ | 39,938 | 16 | % | ||||||||
Includes stock-based compensation of: | ||||||||||||||||||||
Research and development | $ | 18,123 | $ | 15,555 | $ | 2,568 | ||||||||||||||
Sales and marketing | 16,663 | 15,090 | 1,573 | |||||||||||||||||
General and administrative | 16,319 | 15,684 | 635 | |||||||||||||||||
Total | $ | 51,105 | $ | 46,329 | $ | 4,776 | ||||||||||||||
Research and Development
The $17.8 million increase in research and development expenses was primarily due to increased compensation and related headcount expenses of $19.6 million, which was partially offset by the capitalization of internal use software development costs of $1.1 million, during both the third and fourth quarters of our fiscal year 2017, related to the development of a new cloud-based technology application. Our research and development headcount was 581 as of July 31, 2017 compared with 464 as of July 31, 2016. The increase in headcount reflects our continued investment in all applications that comprise the Guidewire InsurancePlatform and related content, and includes 58 employees gained through our acquisitions.
Sales and Marketing
The $16.5 million increase in sales and marketing expenses was primarily due to increased compensation and related headcount expenses of $12.2 million, increased sales commissions of $2.4 million and increases in our expense from the amortization of acquired intangible assets of $2.3 million. The increase in our compensation and related headcount expenses was a result of our continued investment in sales and marketing personnel and activities required to support our business growth and objectives. The increase in our commission expenses was a result of increases in our sales and bookings. The increase in the amortization expense from acquired intangible assets is primarily related to our acquisitions of First Best and ISCS, Inc., in the first and third quarters of our fiscal year 2017. Our sales and marketing headcount was 298 as of July 31, 2017 compared with 267 as of July 31, 2016. The increase in headcount was required to support the growth in our revenue base.
General and Administrative
The $5.6 million increase in general and administrative expenses was primarily due to increased expenses from third-party consultation and professional services of $3.4 million and increases in our compensation and related headcount expenses of $2.2 million. The increases in these costs were primarily a result of our continued investment in our corporate infrastructure and support services and include fees associated with our implementation costs for a new accounting software application, and to a lesser extent, increased costs for third-party consultants and professional services resulting from the acquisitions of First Best and ISCS. Inc. in the first and third quarters of our fiscal year 2017. Our general and administrative headcount was 189 as of July 31, 2017 compared with 163 as of July 31, 2016. The increase in headcount was required to support the growth of our business.
Other Income (Expenses)
Fiscal years ended July 31, | ||||||||||||||
2017 | 2016 | Change | ||||||||||||
Amount | Amount | ($) | (%) | |||||||||||
(In thousands, except percentages) | ||||||||||||||
Interest income | $ | 5,867 | $ | 4,850 | $ | 1,017 | 21 | % | ||||||
Interest expense | $ | (13 | ) | $ | — | $ | (13 | ) | 100 | % | ||||
Other income (expenses), net | $ | 811 | $ | (505 | ) | $ | 1,316 | (261 | )% | |||||
46
Interest Income
Interest income increased by $1.0 million for fiscal year 2017 primarily due to higher yields on our cash equivalents and investments.
Other Income (Expense), Net
Other income (expense), net increased by $1.3 million, as compared to the prior fiscal year as we realized a net currency exchange gain of $0.8 million resulting from favorable exchange rate movements for transactions denominated in British Pound, Euro and Canadian Dollar, particularly during the fourth fiscal quarter, as opposed to the net currency exchange loss of $0.5 million resulting from unfavorable foreign exchange rate movements for the fiscal year ended July 31, 2016.
Provision for Income Taxes
Fiscal years ended July 31, | ||||||||||||||
2017 | 2016 | Change | ||||||||||||
Amount | Amount | ($) | (%) | |||||||||||
(In thousands, except percentages) | ||||||||||||||
Provision for income taxes | $ | 12,053 | $ | 5,806 | $ | 6,247 | 108 | % | ||||||
Effective tax rate | 36 | % | 28 | % | ||||||||||
We recognized an income tax provision of $12.1 million for fiscal year 2017 compared to $5.8 million for fiscal year 2016. The increase in our provision for income taxes for fiscal year 2017 was primarily due to an increase in pre-tax net income, as compared to fiscal year 2016. Our effective income tax rate increased to 36% for fiscal year 2017 compared to 28% for fiscal year 2016. The increase in our effective income tax rate was primarily a result of lower research tax credits generated in fiscal year 2017.
47
Quarterly Results of Operations
The following table sets forth our selected unaudited quarterly financial information for each of the eight fiscal quarters ended July 31, 2018. In management’s opinion, the data below has been prepared on the same basis as the audited consolidated financial statements and reflect all necessary adjustments, consisting only of normal recurring adjustments, necessary for a fair statement of the data. The results of historical periods are not necessarily indicative of the results to be expected for a full year or any future period.
Fiscal quarters ended | |||||||||||||||||||||||||||||||
July 31, 2018 | April 30, 2018 | January 31, 2018 | October 31, 2017 | July 31, 2017 | April 30, 2017 | January 31, 2017 | October 31, 2016 | ||||||||||||||||||||||||
(unaudited) (in thousands, except per share amounts) | |||||||||||||||||||||||||||||||
Total revenue | $ | 248,639 | $ | 140,469 | $ | 163,788 | $ | 108,171 | $ | 181,100 | $ | 123,436 | $ | 115,621 | $ | 94,127 | |||||||||||||||
Total cost of revenue | 91,723 | 74,321 | 67,769 | 62,894 | 57,261 | 51,468 | 40,811 | 42,019 | |||||||||||||||||||||||
Total gross profit | 156,916 | 66,148 | 96,019 | 45,277 | 123,839 | 71,968 | 74,810 | 52,108 | |||||||||||||||||||||||
Income (loss) from operations | 55,237 | (29,187 | ) | (665 | ) | (32,715 | ) | 41,048 | (4,339 | ) | 8,205 | (18,302 | ) | ||||||||||||||||||
Net income (loss) | $ | 83,426 | $ | (48,622 | ) | $ | (45,555 | ) | $ | (8,914 | ) | $ | 26,927 | $ | (1,819 | ) | $ | 3,974 | $ | (7,858 | ) | ||||||||||
Income (loss) per share - basic | $ | 1.04 | $ | (0.62 | ) | $ | (0.59 | ) | $ | (0.12 | ) | $ | 0.36 | $ | (0.02 | ) | $ | 0.05 | $ | (0.11 | ) | ||||||||||
Income (loss) per share - diluted | $ | 1.02 | $ | (0.62 | ) | $ | (0.59 | ) | $ | (0.12 | ) | $ | 0.36 | $ | (0.02 | ) | $ | 0.05 | $ | (0.11 | ) | ||||||||||
Our quarterly results of operations may fluctuate significantly due to a variety of factors, many of which are outside of our control, making our results of operations variable and difficult to predict. Such factors include those discussed above and those set forth in “Risk Factors—We may experience significant quarterly and annual fluctuations in our results of operations due to a number of factors” and “Risk Factors—Seasonal sales patterns and other variations related to our revenue recognition may cause significant fluctuations in our results of operations and cash flows and may prevent us from achieving our quarterly or annual forecasts, which may cause our stock price to decline” in Item 1A of Part I of this Annual Report on Form 10-K. One or more of these factors may cause our results of operations to vary widely. As such, we believe that our quarterly results of operations may vary significantly in the future and that sequential quarterly comparisons of our results of operations may not be meaningful and should not be relied upon as an indication of future performance.
48
Liquidity and Capital Resources
Our principal sources of liquidity are as follows:
July 31, 2018 | July 31, 2017 | July 31, 2016 | ||||||||||
(in thousands) | ||||||||||||
Cash, cash equivalents, and investments | $ | 1,258,100 | $ | 687,788 | $ | 735,802 | ||||||
Working capital | $ | 997,319 | $ | 515,624 | $ | 588,589 | ||||||
Cash, Cash Equivalents, and Investments
Our cash, cash equivalents, and investments are primarily comprised of cash and liquid investments with remaining maturities of 90 days or less from the date of purchase, commercial paper and money market funds. Substantially all of our investments are comprised of corporate debt securities, U.S. government securities and agency securities, commercial paper and non-U.S. government securities, which include state, municipal and foreign government securities.
As of July 31, 2018, approximately $39.5 million of our cash and cash equivalent were domiciled in various foreign tax jurisdictions. While we have no current plans to repatriate these funds to the United States, we may repatriate foreign earnings that have been taxed in the United States in the future to the extent that the repatriation is not restricted by local laws or there are no substantial incremental costs associated with such repatriation.
Cash Flows
Our cash flows from operations are significantly impacted by timing of invoicing and collections of accounts receivable, annual bonus payment, as well as payments of payroll and other taxes. We expect that we will continue to generate positive cash flows from operations on an annual basis, although this may fluctuate significantly on a quarterly basis. In particular, we typically use more cash during the first fiscal quarter ended October 31, as we generally pay cash bonuses to our employees for the prior fiscal year during that period and pay seasonally higher sales commissions from increased customer orders booked in our fourth fiscal quarter.
We believe that our existing cash and cash equivalents and sources of liquidity will be sufficient to fund our operations for at least the next 12 months. Our future capital requirements will depend on many factors, including our rate of revenue growth, the expansion of our sales and marketing activities, the timing and extent of our spending to support our research and development efforts, and expansion into other markets. We also anticipate investing in, or acquiring complementary businesses, applications or technologies, which may require the use of significant cash resources and may require additional financing.
The following summary of cash flows for the periods indicated has been derived from our consolidated financial statements included elsewhere in this Annual Report on Form 10-K:
Fiscal years ended July 31, | ||||||||||||
2018 | 2017 | 2016 | ||||||||||
(in thousands) | ||||||||||||
Net cash provided by operating activities | $ | 140,459 | $ | 137,160 | $ | 99,900 | ||||||
Net cash used in investing activities | $ | (537,584 | ) | $ | (113,342 | ) | $ | (101,253 | ) | |||
Net cash provided by financing activities | $ | 573,000 | $ | 14,630 | $ | 13,454 | ||||||
Cash flows from Operating Activities
Net cash provided by operating activities increased by $3.3 million in fiscal year 2018 as compared to fiscal year 2017. This increase in operating cash was primarily attributable to a $22.1 million increase in net income after excluding the impact of non-cash charges such as deferred taxes, stock-based compensation expense, depreciation and amortization expense, and other non-cash items, partially offset by a $18.8 million increase in cash used in working capital activity as compared to the same period a year ago.
Net cash provided by operating activities increased by $37.3 million in fiscal year 2017 as compared to fiscal year 2016. The increase in operating cash was primarily attributable to a $22.1 million increase in net income after excluding the impact of non-cash charges such as stock-based compensation, depreciation and amortization expense, deferred taxes and other non-cash items, and a $15.1 million net increase in cash provided by working capital activity as compared to the same period a year ago.
49
Cash flows from Investing Activities
Our investing activities consist primarily of purchases and sales of short-term and long-term investments, capital expenditures to purchase property and equipment, acquisitions and changes in our strategic equity investment. In the future, we expect we will continue to invest in capital expenditures to support our expanding operations.
Net cash used in investing activities was $537.6 million in fiscal year 2018, as compared to $113.3 million net cash used in fiscal year 2017. The increase in net cash used in investing activities was primarily due to an increase of $481.1 million in net cash outflows from sales and purchases of marketable securities, and a $5.3 million increase in capital expenditures. Investing activities also included the use of $130.1 million of cash to acquire Cyence in fiscal year 2018, and $187.6 million of cash to acquire ISCS and FirstBest in fiscal year 2017. During fiscal year 2017, we also made a $4.7 million additional investment in a privately held company.
Net cash used in investing activities was $113.3 million in fiscal year 2017, as compared to $101.3 million in fiscal year 2016. The increase in net cash used in investing activities was primarily due to $154.1 million cash used for the acquisition of ISCS and $33.5 million used for the acquisition of FirstBest, as compared to $39.5 million cash used for the acquisition of EagleEye in fiscal year 2016. During fiscal year 2017, we also made a $4.7 million additional investment in a privately held company. These increases in cash used were partially offset by an increase of $140.2 million in net cash inflows from sales and purchases of marketable securities, and a small decrease of $0.4 million in capital expenditures.
Cash flows from Financing Activities
Our financing activities consist primarily of public debt and equity offerings and cash receipts from the exercise of stock options.
Net cash provided by financing activities was $573.0 million in fiscal year 2018, as compared to $14.6 million in fiscal year 2017. The increase of $558.4 million in net cash provided by financing activities was primarily due to $387.2 million and $220.9 million of cash raised from issuances of debt and equity, respectively. This increase was partially offset by the purchase of a capped call option for $37.2 million and fewer options exercised in fiscal year 2018.
Net cash provided by financing activities was $14.6 million in fiscal year 2017, as compared to $13.5 million in fiscal year 2016. The increase of $1.2 million in net cash provided by financing activities was primarily a result of the impact of excess tax benefits.
Excess tax benefits and deficiencies previously classified as financing activities have been classified as operating activities on the condensed consolidated statement of cash flows as a result of our adoption of ASU 2016-09 during the first quarter of fiscal year 2018. There were no excess tax benefits or deficiencies in financing activities during fiscal year 2018.
Contractual Obligations
The following summarizes our contractual obligations as of July 31, 2018:
Payments due by period | |||||||||||||||||||
Less than 1 year | 1 to 3 years | 3 to 5 years | More than 5 years | Total | |||||||||||||||
(in thousands) | |||||||||||||||||||
Long-term debt (1) | $ | 5,028 | $ | 10,000 | $ | 10,000 | $ | 410,000 | $ | 435,028 | |||||||||
Operating lease obligations (2) | 10,718 | 25,328 | 25,802 | 85,156 | 147,004 | ||||||||||||||
Royalty obligations (3) | 1,761 | 799 | — | — | 2,560 | ||||||||||||||
Purchase commitments (4) | 60,298 | 9,549 | 253 | — | 70,100 | ||||||||||||||
Total | $ | 77,805 | $ | 45,676 | $ | 36,055 | $ | 495,156 | $ | 654,692 | |||||||||
50
(1) | Long-term debt consists of principal and interest payments on our Convertible Senior Notes. The $400 million in principal will be due in March 2025. |
(2) | Operating lease agreements primarily represent our obligations to make payments under our non-cancellable lease agreements for our corporate headquarters and worldwide offices through 2028. |
(3) | Royalty obligations primarily represent our obligations under our non-cancellable agreements related to certain revenue-generating agreements. |
(4) | Purchase commitments consist of agreements to purchase goods and services, entered into in the ordinary course of business. These represent commitments for which a penalty could be imposed if the agreement was canceled for any reason other than an event of default as described by the agreement. |
Additionally, we have unrecognized tax benefits of $10.3 million primarily associated with our U.S. Federal and California research and development tax credits as of July 31, 2018. We are unable to estimate when any cash settlement with a taxing authority might occur.
Off-Balance Sheet Arrangements
Through July 31, 2018, we did not have any relationships with unconsolidated entities or financial partnerships, such as entities often referred to as structured finance or special purpose entities, which would have been established for the purpose of facilitating off-balance sheet arrangements or other contractually narrow or limited purposes.
Item 7A. Quantitative and Qualitative Disclosures about Market Risk
We are exposed to market risks in the ordinary course of our business. Market risk represents the risk of loss that may impact our financial position due to adverse changes in financial market prices and rates. Our market risk exposure is primarily a result of fluctuations in interest rates and foreign currency exchange rates. We do not hold or issue financial instruments for trading purposes.
Interest Rate Sensitivity
Our exposure to market risk for changes in interest rates relates primarily to our cash, cash equivalents, and investments as of July 31, 2018, and 2017. Our cash, cash equivalents, and investments as of July 31, 2018 and 2017 were $1,258.1 million and $687.8 million, respectively, and consisted primarily of cash, corporate bonds, U. S. agency debt securities, commercial paper, money market funds, and municipal debt securities. Our primary exposure to market risk is interest income sensitivity, which is affected by changes in the general level of the interest rates in the United States. However, because of the short-term nature of our interest-bearing securities, a ten percent change in market interest rates would not be expected to have a material impact on our consolidated financial condition or results of operations.
Foreign Currency Exchange Risk
Our results of operations and cash flows are subject to notable fluctuations due to changes in foreign currency exchange rates, particularly changes in the Argentine Peso, Australian Dollar, Brazilian Real, British Pound, Canadian Dollar, Euro, Japanese Yen, and Polish Zloty. The volatility of exchange rates depends on many factors that we cannot forecast with reliable accuracy. Although we believe our operating activities act as a natural hedge for a substantial portion of our foreign currency exposure because we typically collect revenue and incur costs in the currency in the location in which we provide our services, our contracts with our customers are long term in nature so it is difficult to predict if our operating activities will provide a natural hedge in the future. Additionally, changes in foreign currency exchange rates can affect our financial results due to transaction gains or losses related to revaluing certain current asset and current liability balances that are denominated in currencies other than the functional currency of the entities in which they are recorded. For the fiscal year ended July 31, 2018, we recorded a net foreign currency gain of $0.5 million as other income in our consolidated statements of operations due to declines in strength of foreign currencies against the United States Dollar. For the fiscal year ended July 31, 2017, we recorded a foreign currency gain of $0.8 million as other income in our consolidated statements of operations as a result of movements in foreign currencies against the United States Dollar. We will continue to experience fluctuations in foreign currency exchange rates, and if a ten percent change in foreign exchange rates occurs in the future, a similar impact would result as recorded to fiscal years 2018 and 2017. As our international operations grow, we will continue to assess our approach to managing our risk relating to fluctuations in currency rates.
Fair Value of Financial Instruments
51
We do not have material exposure to market risk with respect to investments in financial instruments, as our investments consist primarily of highly liquid investments purchased with a remaining maturity of two years or less. We do not use derivative financial instruments for speculative or trading purposes. However, this does not preclude our adoption of specific hedging strategies in the future.
52
Item 8. | Financial Statements and Supplemental Data |
GUIDEWIRE SOFTWARE, INC. AND SUBSIDIARIES
INDEX TO CONSOLIDATED FINANCIAL STATEMENTS
The supplementary financial information required by this Item 8 is included in Item 7 under the caption “Quarterly Results of Operations.”
53
Report of Independent Registered Public Accounting Firm
The Stockholders and Board of Directors
Guidewire Software, Inc.:
Opinions on the Consolidated Financial Statements and Internal Control Over Financial Reporting
We have audited the accompanying consolidated balance sheets of Guidewire Software, Inc. and subsidiaries (the Company) as of July 31, 2018 and 2017, the related consolidated statements of operations, comprehensive income (loss), stockholders’ equity, and cash flows for each of the years in the three-year period ended July 31, 2018, and the related notes (collectively, the consolidated financial statements). We also have audited the Company’s internal control over financial reporting as of July 31, 2018, based on criteria established in Internal Control - Integrated Framework (2013) issued by the Committee of Sponsoring Organizations of the Treadway Commission.
In our opinion, the consolidated financial statements referred to above present fairly, in all material respects, the financial position of the Company as of July 31, 2018 and 2017, and the results of its operations and its cash flows for each of the years in the three-year period ended July 31, 2018, in conformity with U.S. generally accepted accounting principles. Also in our opinion, the Company maintained, in all material respects, effective internal control over financial reporting as of July 31, 2018, based on criteria established in Internal Control - Integrated Framework (2013) issued by the Committee of Sponsoring Organizations of the Treadway Commission.
Change in Accounting Principle
As discussed in note 1 to the consolidated financial statements, the Company changed its method of accounting for share-based payments due to the adoption of FASB Accounting Standards Update 2016-09, Compensation - Stock Compensation (Topic 718), Improvements to Employee Share-Based Payment Accounting.
Basis for Opinions
The Company’s management is responsible for these consolidated financial statements, for maintaining effective internal control over financial reporting, and for its assessment of the effectiveness of internal control over financial reporting, included in the accompanying Management’s Annual Report on Internal Control Over Financial Reporting appearing under Item 9A. Our responsibility is to express an opinion on the Company’s consolidated financial statements and an opinion on the Company’s internal control over financial reporting based on our audits. We are a public accounting firm registered with the Public Company Accounting Oversight Board (United States) (PCAOB) and are required to be independent with respect to the Company in accordance with the U.S. federal securities laws and the applicable rules and regulations of the Securities and Exchange Commission and the PCAOB.
We conducted our audits in accordance with the standards of the PCAOB. Those standards require that we plan and perform the audits to obtain reasonable assurance about whether the consolidated financial statements are free of material misstatement, whether due to error or fraud, and whether effective internal control over financial reporting was maintained in all material respects.
Our audits of the consolidated financial statements included performing procedures to assess the risks of material misstatement of the consolidated financial statements, whether due to error or fraud, and performing procedures that respond to those risks. Such procedures included examining, on a test basis, evidence regarding the amounts and disclosures in the consolidated financial statements. Our audits also included evaluating the accounting principles used and significant estimates made by management, as well as evaluating the overall presentation of the consolidated financial statements. Our audit of internal control over financial reporting included obtaining an understanding of internal control over financial reporting, assessing the risk that a material weakness exists, and testing and evaluating the design and operating effectiveness of internal control based on the assessed risk. Our audits also included performing such other procedures as we considered necessary in the circumstances. We believe that our audits provide a reasonable basis for our opinions.
Definition and Limitations of Internal Control Over Financial Reporting
A company’s internal control over financial reporting is a process designed to provide reasonable assurance regarding the reliability of financial reporting and the preparation of financial statements for external purposes in accordance with generally accepted accounting principles. A company’s internal control over financial reporting includes those policies and procedures that (1) pertain to the maintenance of records that, in reasonable detail, accurately and fairly reflect the transactions and dispositions of the assets of the company; (2) provide reasonable assurance that transactions are recorded as necessary to permit preparation of financial statements in accordance with generally accepted accounting principles, and that receipts and
54
expenditures of the company are being made only in accordance with authorizations of management and directors of the company; and (3) provide reasonable assurance regarding prevention or timely detection of unauthorized acquisition, use, or disposition of the company’s assets that could have a material effect on the financial statements.
Because of its inherent limitations, internal control over financial reporting may not prevent or detect misstatements. Also, projections of any evaluation of effectiveness to future periods are subject to the risk that controls may become inadequate because of changes in conditions, or that the degree of compliance with the policies or procedures may deteriorate.
/s/ KPMG LLP
We have served as the Company’s auditor since 2006.
Santa Clara, California
September 18, 2018
55
GUIDEWIRE SOFTWARE, INC. AND SUBSIDIARIES
CONSOLIDATED BALANCE SHEETS
(in thousands, except for share data)
July 31, 2018 | July 31, 2017 | ||||||
ASSETS | |||||||
CURRENT ASSETS: | |||||||
Cash and cash equivalents | $ | 437,140 | $ | 263,176 | |||
Short-term investments | 630,008 | 310,027 | |||||
Accounts receivable, net of allowances of $1,062 and $0, respectively | 124,849 | 79,433 | |||||
Prepaid expenses and other current assets | 30,510 | 26,604 | |||||
Total current assets | 1,222,507 | 679,240 | |||||
Long-term investments | 190,952 | 114,585 | |||||
Property and equipment, net | 18,595 | 14,376 | |||||
Intangible assets, net | 95,654 | 71,315 | |||||
Deferred tax assets, net | 87,482 | 37,430 | |||||
Goodwill | 340,877 | 141,851 | |||||
Other assets | 22,525 | 20,104 | |||||
TOTAL ASSETS | $ | 1,978,592 | $ | 1,078,901 | |||
LIABILITIES AND STOCKHOLDERS’ EQUITY | |||||||
CURRENT LIABILITIES: | |||||||
Accounts payable | $ | 30,635 | $ | 13,416 | |||
Accrued employee compensation | 60,135 | 48,882 | |||||
Deferred revenue, current | 114,138 | 91,243 | |||||
Other current liabilities | 20,280 | 10,075 | |||||
Total current liabilities | 225,188 | 163,616 | |||||
Convertible senior notes, net | 305,128 | — | |||||
Deferred revenue, noncurrent | 23,758 | 19,892 | |||||
Other liabilities | 774 | 2,112 | |||||
Total liabilities | 554,848 | 185,620 | |||||
Commitments and contingencies (Note 7) | |||||||
STOCKHOLDERS’ EQUITY: | |||||||
Common stock, par value $0.0001 per share—500,000,000 shares authorized as of July 31, 2018 and 2017; 80,611,698 and 75,007,625 shares issued and outstanding as of July 31, 2018 and 2017, respectively | 8 | 8 | |||||
Additional paid-in capital | 1,297,979 | 830,014 | |||||
Accumulated other comprehensive loss | (7,748 | ) | (5,796 | ) | |||
Retained earnings | 133,505 | 69,055 | |||||
Total stockholders’ equity | 1,423,744 | 893,281 | |||||
TOTAL LIABILITIES AND STOCKHOLDERS’ EQUITY | $ | 1,978,592 | $ | 1,078,901 | |||
See accompanying Notes to Consolidated Financial Statements.
56
GUIDEWIRE SOFTWARE, INC. AND SUBSIDIARIES
CONSOLIDATED STATEMENTS OF OPERATIONS
(in thousands, except share and per share amounts)
Fiscal years ended July 31, | |||||||||||
2018 | 2017 | 2016 | |||||||||
Revenue: | |||||||||||
License and other | $ | 315,776 | $ | 271,462 | $ | 219,751 | |||||
Maintenance | 77,337 | 68,643 | 59,931 | ||||||||
Services | 267,954 | 174,179 | 144,764 | ||||||||
Total revenue | 661,067 | 514,284 | 424,446 | ||||||||
Cost of revenue: | |||||||||||
License and other | 35,452 | 17,046 | 7,184 | ||||||||
Maintenance | 14,783 | 13,397 | 11,547 | ||||||||
Services | 246,472 | 161,116 | 133,103 | ||||||||
Total cost of revenue | 296,707 | 191,559 | 151,834 | ||||||||
Gross profit: | |||||||||||
License and other | 280,324 | 254,416 | 212,567 | ||||||||
Maintenance | 62,554 | 55,246 | 48,384 | ||||||||
Services | 21,482 | 13,063 | 11,661 | ||||||||
Total gross profit | 364,360 | 322,725 | 272,612 | ||||||||
Operating expenses: | |||||||||||
Research and development | 171,657 | 130,323 | 112,496 | ||||||||
Sales and marketing | 124,117 | 109,239 | 92,765 | ||||||||
General and administrative | 75,916 | 56,551 | 50,914 | ||||||||
Total operating expenses | 371,690 | 296,113 | 256,175 | ||||||||
Income (loss) from operations | (7,330 | ) | 26,612 | 16,437 | |||||||
Interest income | 13,281 | 5,867 | 4,850 | ||||||||
Interest expense | (6,442 | ) | (13 | ) | — | ||||||
Other income (expense), net | 509 | 811 | (505 | ) | |||||||
Income before provision for income taxes | 18 | 33,277 | 20,782 | ||||||||
Provision for income taxes | 19,683 | 12,053 | 5,806 | ||||||||
Net income (loss) | $ | (19,665 | ) | $ | 21,224 | $ | 14,976 | ||||
Net income (loss) per share: | |||||||||||
Basic | $ | (0.25 | ) | $ | 0.29 | $ | 0.21 | ||||
Diluted | $ | (0.25 | ) | $ | 0.28 | $ | 0.20 | ||||
Shares used in computing net income (loss) per share: | |||||||||||
Basic | 77,709,592 | 73,994,577 | 72,026,694 | ||||||||
Diluted | 77,709,592 | 75,328,343 | 73,765,960 | ||||||||
See accompanying Notes to Consolidated Financial Statements.
57
GUIDEWIRE SOFTWARE, INC. AND SUBSIDIARIES
CONSOLIDATED STATEMENTS OF COMPREHENSIVE INCOME (LOSS)
(in thousands)
As of July 31, | |||||||||||
2018 | 2017 | 2016 | |||||||||
Net income (loss) | $ | (19,665 | ) | $ | 21,224 | $ | 14,976 | ||||
Other comprehensive income (loss): | |||||||||||
Foreign currency translation adjustments | (1,567 | ) | 1,179 | (562 | ) | ||||||
Unrealized (loss) gain on available-for-sale securities, net of tax benefit (expense) of $233, $234, and $(187), respectively | (363 | ) | (231 | ) | 288 | ||||||
Reclassification adjustment for realized (gain) loss on available-for-sale securities, included in net income | (22 | ) | (151 | ) | 24 | ||||||
Other comprehensive income (loss) | (1,952 | ) | 797 | (250 | ) | ||||||
Comprehensive income (loss) | $ | (21,617 | ) | $ | 22,021 | $ | 14,726 | ||||
See accompanying Notes to Consolidated Financial Statements.
58
GUIDEWIRE SOFTWARE, INC. AND SUBSIDIARIES
CONSOLIDATED STATEMENTS OF STOCKHOLDERS’ EQUITY
(in thousands, except for share data)
Common stock | Additional paid-in capital | Accumulated other comprehensive income (loss) | Retained Earnings | Total Stockholders’ Equity | |||||||||||||||||||
Shares | Amount | ||||||||||||||||||||||
Balance as of July 31, 2015 | 71,005,738 | $ | 7 | $ | 662,869 | $ | (6,343 | ) | $ | 32,855 | $ | 689,388 | |||||||||||
Issuance of common stock upon exercise of stock options | 652,832 | — | 7,840 | — | — | 7,840 | |||||||||||||||||
Issuance of common stock upon restricted stock unit ("RSU") release | 1,408,746 | — | — | — | — | — | |||||||||||||||||
Shares withheld for taxes related to net share settlement | (27,397 | ) | — | (1,488 | ) | — | — | (1,488 | ) | ||||||||||||||
Stock-based compensation | — | — | 66,409 | — | — | 66,409 | |||||||||||||||||
Tax benefit from the exercise of stock options and vesting of RSUs | — | — | 7,060 | — | — | 7,060 | |||||||||||||||||
Net income | — | — | — | — | 14,976 | 14,976 | |||||||||||||||||
Foreign currency translation adjustment | — | — | — | (562 | ) | — | (562 | ) | |||||||||||||||
Unrealized gain on available-for-sale securities, net of tax | — | — | — | 288 | — | 288 | |||||||||||||||||
Reclassification adjustment for realized loss included in net income | — | — | — | 24 | — | 24 | |||||||||||||||||
Balance as of July 31, 2016 | 73,039,919 | $ | 7 | $ | 742,690 | $ | (6,593 | ) | $ | 47,831 | $ | 783,935 | |||||||||||
Issuance of common stock upon exercise of stock options | 594,936 | — | 5,563 | — | — | 5,563 | |||||||||||||||||
Issuance of common stock upon RSU release | 1,372,770 | 1 | (1 | ) | — | — | — | ||||||||||||||||
Stock-based compensation | — | — | 72,695 | — | — | 72,695 | |||||||||||||||||
Tax benefit from the exercise of stock options and vesting of RSUs | — | — | 9,067 | — | — | 9,067 | |||||||||||||||||
Net income | — | — | — | — | 21,224 | 21,224 | |||||||||||||||||
Foreign currency translation adjustment | — | — | — | 1,179 | — | 1,179 | |||||||||||||||||
Unrealized loss on available-for-sale securities, net of tax | — | — | — | (231 | ) | — | (231 | ) | |||||||||||||||
Reclassification adjustment for realized gain, included in net income | — | — | — | (151 | ) | — | (151 | ) | |||||||||||||||
Balance as of July 31, 2017 | 75,007,625 | $ | 8 | $ | 830,014 | $ | (5,796 | ) | $ | 69,055 | $ | 893,281 | |||||||||||
Issuance of common stock upon exercise of stock options | 150,924 | — | 2,013 | — | — | 2,013 | |||||||||||||||||
Issuance of common stock upon RSU release | 1,255,605 | — | — | — | — | — | |||||||||||||||||
Stock-based compensation | — | — | 89,176 | — | — | 89,176 | |||||||||||||||||
Issuance of common stock for Cyence acquisition | 1,568,973 | — | 117,457 | — | — | 117,457 | |||||||||||||||||
Public offering, net of issuance cost | 2,628,571 | — | 220,948 | — | — | 220,948 | |||||||||||||||||
Equity component of convertible senior notes, net of issuance cost | — | — | 74,562 | — | — | 74,562 | |||||||||||||||||
Purchase of capped calls | — | — | (37,200 | ) | — | — | (37,200 | ) | |||||||||||||||
Net loss | — | — | — | — | (19,665 | ) | (19,665 | ) | |||||||||||||||
Foreign currency translation adjustment | — | — | — | (1,567 | ) | — | (1,567 | ) | |||||||||||||||
Unrealized loss on available-for-sale securities, net of tax | — | — | — | (363 | ) | — | (363 | ) | |||||||||||||||
Reclassification adjustment for realized gain on available-for-sale securities, included in net income | — | — | — | (22 | ) | — | (22 | ) | |||||||||||||||
Adoption of new accounting standard (ASU 2016-09) | — | — | 1,009 | — | 84,115 | 85,124 | |||||||||||||||||
Balance as of July 31, 2018 | 80,611,698 | $ | 8 | $ | 1,297,979 | $ | (7,748 | ) | $ | 133,505 | $ | 1,423,744 | |||||||||||
See accompanying Notes to Consolidated Financial Statements.
59
GUIDEWIRE SOFTWARE, INC. AND SUBSIDIARIES
CONSOLIDATED STATEMENTS OF CASH FLOWS
(in thousands)
See accompanying Notes to Consolidated Financial Statements.
Fiscal years ended July 31, | |||||||||||
2018 | 2017 | 2016 | |||||||||
CASH FLOWS FROM OPERATING ACTIVITIES: | |||||||||||
Net income (loss) | $ | (19,665 | ) | $ | 21,224 | $ | 14,976 | ||||
Adjustments to reconcile net income (loss) to net cash provided by operating activities: | |||||||||||
Depreciation and amortization | 35,611 | 18,725 | 8,842 | ||||||||
Amortization of debt discount and issuance costs | 4,512 | — | — | ||||||||
Stock-based compensation | 89,614 | 71,794 | 66,131 | ||||||||
Excess tax benefit from stock-based compensation | — | (9,067 | ) | (7,102 | ) | ||||||
Charges to bad debt and revenue reserves | 1,062 | — | — | ||||||||
Deferred income tax | 15,336 | (1,227 | ) | (4,568 | ) | ||||||
Amortization of premium on available-for-sale securities, and other non-cash items | (1,418 | ) | 1,462 | 2,516 | |||||||
Changes in operating assets and liabilities: | |||||||||||
Accounts receivable | (40,832 | ) | (9,750 | ) | (75 | ) | |||||
Prepaid expenses and other assets | (2,783 | ) | (9,463 | ) | (7,668 | ) | |||||
Accounts payable | 16,794 | 1,311 | 603 | ||||||||
Accrued employee compensation | 9,230 | 7,138 | 4,114 | ||||||||
Other liabilities | 8,858 | 8,211 | 5,993 | ||||||||
Deferred revenue | 24,140 | 36,802 | 16,138 | ||||||||
Net cash provided by operating activities | 140,459 | 137,160 | 99,900 | ||||||||
CASH FLOWS FROM INVESTING ACTIVITIES: | |||||||||||
Purchases of available-for-sale securities | (859,657 | ) | (462,035 | ) | (652,017 | ) | |||||
Sales and maturities of available-for-sale securities | 464,143 | 547,630 | 597,405 | ||||||||
Purchase of property and equipment | (9,398 | ) | (5,886 | ) | (7,111 | ) | |||||
Capitalized software development costs | (2,613 | ) | (784 | ) | — | ||||||
Strategic investment | — | (4,677 | ) | — | |||||||
Acquisitions of business, net of cash acquired | (130,059 | ) | (187,590 | ) | (39,530 | ) | |||||
Net cash used in investing activities | (537,584 | ) | (113,342 | ) | (101,253 | ) | |||||
CASH FLOWS FROM FINANCING ACTIVITIES: | |||||||||||
Proceeds from issuance of convertible senior notes, net of issuance costs | 387,239 | — | — | ||||||||
Proceeds from issuance of common stock, net of issuance costs | 220,948 | — | — | ||||||||
Purchase of capped calls | (37,200 | ) | — | — | |||||||
Proceeds from issuance of common stock upon exercise of stock options | 2,013 | 5,563 | 7,840 | ||||||||
Taxes remitted on restricted stock units vested | — | — | (1,488 | ) | |||||||
Excess tax benefit from exercise of stock options and vesting of restricted stock units | — | 9,067 | 7,102 | ||||||||
Net cash provided by financing activities | 573,000 | 14,630 | 13,454 | ||||||||
Effect of foreign exchange rate changes on cash and cash equivalents | (1,911 | ) | 1,146 | (881 | ) | ||||||
NET INCREASE IN CASH AND CASH EQUIVALENTS | 173,964 | 39,594 | 11,220 | ||||||||
CASH AND CASH EQUIVALENTS—Beginning of period | 263,176 | 223,582 | 212,362 | ||||||||
CASH AND CASH EQUIVALENTS—End of period | $ | 437,140 | $ | 263,176 | $ | 223,582 | |||||
SUPPLEMENTAL DISCLOSURES OF CASH FLOW INFORMATION: | |||||||||||
Cash paid for income taxes, net of tax refunds | $ | 4,744 | $ | 3,700 | $ | 3,907 | |||||
SUPPLEMENTAL DISCLOSURES OF NONCASH INVESTING AND FINANCING ACTIVITIES: | |||||||||||
Accruals for purchase of property and equipment | $ | 1,508 | $ | 1,376 | $ | 882 | |||||
Accruals for capitalized software development costs | $ | 189 | $ | 171 | $ | — | |||||
60
GUIDEWIRE SOFTWARE, INC. AND SUBSIDIARIES
NOTES TO CONSOLIDATED FINANCIAL STATEMENTS
1. The Company and Summary of Significant Accounting Policies
Company
Guidewire Software, Inc., a Delaware corporation, was incorporated on September 20, 2001. Guidewire Software, Inc. together with its subsidiaries (the “Company”) provides a technology platform which consists of three key elements: core transaction processing, data management and analytics, and digital engagement. The Company’s technology platform supports core insurance operations, including underwriting and policy administration, claim management and billing, enables new insights into data that can improve business decision making and supports digital sales, service and claims experiences for policyholders, agents, and other key stakeholders. The Company’s customers are primarily property and casualty insurance carriers.
Public Offerings
In March 2018, the Company completed a public offering of 2,628,571 shares of its common stock, including the sale of shares in connection with the underwriters’ exercise in full of their option to purchase additional shares of common stock from the Company. The public offering price of the shares sold in the offering was $87.50 per share. No shares were sold by the Company’s stockholders in this public offering. Concurrently, the Company completed a sale of $400.0 million aggregate principal amount of 1.25% Convertible Senior Notes due 2025 (the “Convertible Senior Notes”), including amounts sold in connection with the underwriters’ exercise in full of their option to purchase additional Convertible Senior Notes. Net of offering expenses and underwriting discounts (“issuance costs”), the Company received net proceeds of approximately $220.9 million related to the common stock offering and $387.2 million related to the convertible note offering.
Basis of Presentation and Consolidation
Our consolidated financial statements have been prepared in accordance with generally accepted accounting principles in the United States of America (“U.S. GAAP”). The consolidated financial statements include the accounts of Guidewire Software, Inc. and its wholly-owned subsidiaries. All inter-company balances and transactions have been eliminated in consolidation.
Use of Estimates
The preparation of the accompanying consolidated financial statements in conformity with U.S. GAAP requires management to make estimates and assumptions about future events that affect the amounts of assets and liabilities reported, disclosures about contingent assets and liabilities, and reported amounts of revenue and expenses. Significant items subject to such estimates include, but are not limited to, revenue recognition, the useful lives of property and equipment and intangible assets, allowance for doubtful accounts, valuation allowance for deferred tax assets, stock-based compensation, annual bonus attainment, income tax uncertainties, fair value of convertible senior notes, investments and acquired assets and assumed liabilities including deferred revenue, valuation of goodwill and intangible assets, determination of software development costs to be capitalized, and contingencies. These estimates and assumptions are based on management’s best estimates and judgment. Management regularly evaluates its estimates and assumptions using historical experience and other factors; however, actual results could differ from these estimates.
Reclassification
Certain prior period balances have been reclassified to conform to the current period presentation in the Company’s consolidated financial statements and the accompanying notes.
Foreign Currency
The functional currency of the Company’s foreign subsidiaries is their respective local currency. The Company translates all assets and liabilities of foreign subsidiaries to U.S. dollars at the current exchange rate as of the applicable balance sheet date. Revenue and expenses are translated at the average exchange rate prevailing during the period in which the transactions occur. The effects of foreign currency translations are recorded in accumulated other comprehensive income/loss as a separate component of stockholders’ equity in the accompanying consolidated statements of stockholders’ equity. Transaction gains and losses that arise from exchange rate fluctuations on transactions denominated in a currency other than the local functional currency are recorded as other income (expense) in the consolidated statements of operations.
61
Cash and Cash Equivalents
Cash and cash equivalents are comprised of cash and highly liquid investments with remaining maturities of 90 days or less at the date of purchase. Cash equivalents primarily consist of commercial paper and money market funds.
Investments
Management determines the appropriate classification of investments at the time of purchase based upon management’s intent with regard to such investments. All investments are classified as available-for-sale.
The Company classifies investments as short-term when they have remaining contractual maturities of one year or less from the balance sheet date, and as long-term when the investments have remaining contractual maturities of more than one year from the balance sheet date. All investments are recorded at fair value with unrealized holding gains and losses included in accumulated other comprehensive income (loss).
Property and Equipment
Property and equipment are stated at cost less accumulated depreciation and amortization. Depreciation is calculated on a straight-line basis over the estimated useful lives of the assets. Leasehold improvements are amortized over the shorter of the lease term or the estimated useful lives of the related assets. Maintenance and repairs that do not extend the life or improve an asset are expensed in the period incurred.
The estimated useful lives of property and equipment are as follows:
Computer hardware | 3 years | |
Purchased software | 3 years | |
Furniture and fixtures | 3 years | |
Leasehold improvements | Shorter of the lease term or estimated useful life | |
Software Development Costs
For qualifying costs incurred for computer software developed for internal use, the Company begins to capitalize its costs to develop software when preliminary development efforts are successfully completed, management has authorized and committed project funding, it is probable that the project will be completed, and the software will be used as intended. These capitalized costs are amortized to expense over the estimated useful lives of the related assets, generally estimated to be three years. Costs incurred prior to meeting these capitalization criteria and costs incurred for training and maintenance are expensed as incurred and recorded in research and development expense on the Company’s consolidated statements of operations. Capitalized software development costs are recorded in property and equipment on the Company’s consolidated balance sheets.
Business Combinations
The Company uses its best estimates and assumptions to assign fair value to the tangible and intangible assets acquired and liabilities assumed at the acquisition date. Goodwill is calculated as the difference between the acquisition-date fair value of the consideration transferred and the values assigned to the assets acquired and liabilities assumed. The Company’s estimates of fair value are based upon assumptions believed to be reasonable, but which are inherently uncertain and subject to refinement and, as a result, actual results may differ from estimates. During the measurement period, which may be up to one year from the acquisition date, if new information is obtained about facts and circumstances that existed as of the acquisition date, the Company may record adjustments to the fair value of these assets and liabilities, with the corresponding offset to goodwill. Upon the conclusion of the measurement period or final determination of the fair value of assets acquired and liabilities assumed, whichever comes first, subsequent adjustments, if any, are recorded to the Company’s consolidated statements of operations.
Impairment of Long-Lived Assets, Intangible Assets and Goodwill
The Company evaluates its long-lived assets, consisting of property and equipment and intangible assets, for indicators of possible impairment when events or changes in circumstances indicate that the carrying amount of certain assets may not be recoverable. Impairment exists if the carrying amounts of such assets exceed the estimates of future net undiscounted cash flows expected to be generated by such assets. Should impairment exist, the impairment loss would be measured based on the excess carrying value of the assets over the estimated fair value of the assets. The Company has not written down any of its long-lived assets as a result of impairment during any of the periods presented.
The Company tests goodwill for impairment annually, during the fourth quarter of each fiscal year, and in the interim whenever events or changes in circumstances indicate that the carrying amount may not be recoverable. The Company evaluates qualitative
62
factors to determine whether it is more likely than not that the fair value of a reporting unit is less than its carrying amount as a basis for determining whether it is necessary to perform the two-step goodwill impairment test. In performing the qualitative assessment, the Company considers events and circumstances, including but not limited to, macroeconomic conditions, industry and market considerations, cost factors, overall financial performance, changes in management or key personnel, changes in strategy, changes in customers, changes in the composition or carrying amount of a reporting unit’s net assets and changes in the price of the Company’s common stock. If, after assessing the totality of events or circumstances, the Company determines that it is more likely than not that the fair value of the Company’s single reporting unit is greater than its carrying amount, then the two-step goodwill impairment test is not performed. There have been no goodwill impairments during any of the periods presented.
Convertible Senior Notes
In March 2018, the Company issued $400.0 million aggregate principal amount of 1.25% Convertible Senior Notes due 2025. The Company accounts for the liability and equity components of the issued Convertible Senior Notes separately. The carrying amount of the equity component, representing the conversion option, was determined by deducting the fair value of the liability component from the par value of the Convertible Senior Notes as a whole. This difference represents a debt discount that is amortized to interest expense using the effective interest method over the term of the Convertible Senior Notes. The carrying amount of the liability component was calculated by measuring the fair value of a similar liability that does not have an associated convertible feature. The equity component of the Convertible Senior Notes is recorded as the difference between the initial proceeds less the fair value of the liability component and will not be remeasured as long as it continues to meet the requirements for equity classification. The equity component is net of issuance costs and recorded in additional paid in capital.
Concentration of Credit Risk
Financial instruments that potentially subject the Company to concentrations of credit risk consist of cash, cash equivalents, investments and accounts receivable. The Company maintains its cash, cash equivalents and investments with high quality financial institutions. The Company is exposed to credit risk for cash held in financial institutions in the event of a default to the extent that such amounts recorded on the balance sheet are in excess of amounts that are insured by the Federal Deposit Insurance Corporation (“FDIC”).
No customer individually accounted for 10% or more of the Company’s revenue for the years ended July 31, 2018, 2017 and 2016. As of July 31, 2018, no customer accounted for 10% or more of the Company’s total accounts receivable. As of July 31, 2017, one customer individually accounted for 11% of the Company’s total accounts receivable.
Accounts Receivable and Allowance for Doubtful Accounts
Accounts receivable are recorded at invoiced amounts and do not bear interest. The Company does not require collateral, performs ongoing credit evaluations of its customers and provides for expected losses. The Company maintains an allowance for doubtful accounts based upon the expected collectability of its accounts receivable. The expectation of collectability is based on historical loss patterns, the number of days that billings are past due, and an evaluation of the potential risk of loss associated with delinquent accounts.
Revenue Recognition
The Company enters into arrangements to deliver multiple products or services (multiple-elements). For a substantial majority of its sales, the Company applies software revenue recognition rules and allocates the total revenue among elements based on vendor-specific objective evidence (“VSOE”) of the fair value of each element. The Company recognizes revenue on a net basis excluding indirect taxes, such as sales tax and value added tax, collected from customers and remitted to government authorities.
Revenue is derived from three sources:
(i) | License fees, related to term (or time-based) licenses, cloud-based subscriptions (also referred to as “subscriptions”), and perpetual software licenses; |
(ii) | Maintenance fees associated with term or perpetual licenses relate to email and phone support, bug fixes and unspecified software updates, and upgrades released when, and if, available during the maintenance term; and |
(iii) | Services fees from professional services relate to implementation of the Company’s software, reimbursable travel, and training provided to our customers. |
Revenue is recognized when all of the following criteria are met:
• | Persuasive evidence of an arrangement exists. Evidence of an arrangement consists of a written contract signed by both the customer and management prior to the end of the period. |
63
• | Delivery or performance has occurred. The Company’s software is delivered electronically to the customer. Delivery is considered to have occurred when the Company provides the customer access to the software along with login credentials. |
• | Fees are fixed or determinable. The Company assesses whether a fee is fixed or determinable at the outset of the arrangement, primarily based on the payment terms associated with the transaction. Fees from term licenses are invoiced in advance in annual or quarterly installments over the term of the agreement beginning on the effective date of the license and represent extended payment terms. A significant majority are invoiced annually. As a result, term license fees are not considered to be fixed and determinable until they become due or payment is received. Perpetual license fees are generally due between 30 and 60 days from delivery of software. We offer extended payment terms in limited cases. |
• | Collectability is probable or reasonably assured. Collectability is assessed on a customer-by-customer basis, based primarily on creditworthiness as determined by credit checks and analysis, as well as customer payment history. Payment terms generally range from 30 to 90 days from invoice date. If it is determined prior to revenue recognition that collection of an arrangement fee is not probable, revenue is deferred until collection becomes probable or reasonably assured, or cash is collected, assuming all other revenue recognition criteria are satisfied. |
VSOE of fair value does not exist for the Company’s software licenses; therefore, the Company allocates revenue to software licenses using the residual method. Under the residual method, the amount recognized for license fees is the difference between the total fixed and determinable fees and the VSOE of fair value for the undelivered elements under the arrangement.
The VSOE of fair value for elements of an arrangement is based upon the normal pricing and discounting practices for those elements when sold separately. VSOE of fair value for maintenance is established using the stated maintenance renewal rate in the customer’s contract. For term licenses with duration of one year or less, no VSOE of fair value for maintenance exists. VSOE of fair value for services is established if a substantial majority of historical stand-alone selling prices for a service fall within a reasonably narrow price range.
If the undelivered elements are all service elements and VSOE of fair value does not exist for one or more service element, the total arrangement fee is recognized ratably over the longest service period starting at software delivery, assuming all the related services have been made available to the customer.
The Company’s subscriptions are recognized ratably over the term of the arrangement typically upon provisioning the products.
As noted above, the Company generally invoices fees for licenses and maintenance to its customers in annual or, in certain cases, quarterly installments payable in advance. The fees related to maintenance are recognized over the period the maintenance is provided.
Substantially all of the Company’s professional services engagements are billed on a time and materials basis and are typically not considered essential to the functionality of the software. The related revenue and costs are recognized in the period incurred. In select situations, the Company will contract our professional services on a fixed fee basis, where we generally recognize services revenue on a proportional performance basis as the performance obligations are completed.
When professional services are sold with a license arrangement the Company evaluates whether those services are essential to the functionality of the software. In the limited cases where professional services are deemed to be essential to the functionality of the software and separate accounting for the services is not permitted, the arrangement is accounted for using contract accounting until the essential services are complete.
Deferred revenue represent amounts, which are billed to or collected from creditworthy customers for which one or more of the revenue recognition criteria have not been met. The deferred revenue balance does not represent the total contract value of annual or multi-year, non-cancellable arrangements.
Sales Commissions
Sales commissions are recognized as an expense when earned by the sales representative, generally occurring at the time the customer order is signed. Substantially all of the effort by the sales force is expended through the time of closing the sale, with limited to no involvement thereafter.
64
Warranties
The Company generally provides a warranty for its software products and services to its customers for periods ranging from 3 to 12 months. The Company’s software products are generally warranted to be free of defects in materials and workmanship under normal use and to substantially perform as described in published documentation. The Company’s services are generally warranted to be performed in a professional manner and to materially conform to the specifications set forth in the related customer contract. In the event there is a failure of such warranties, the Company generally will correct the problem or provide a reasonable workaround or replacement product. If the Company cannot correct the problem or provide a workaround or replacement product, then the customer’s remedy is generally limited to refund of the fees paid for the nonconforming product or services. Warranty expense has been insignificant to date.
Advertising Costs
Advertising costs are expensed as incurred and amounts incurred were not material during the years ended July 31, 2018, 2017 and 2016.
Stock-Based Compensation
The Company accounts for stock-based compensation using the fair value method, which requires the Company to measure the stock-based compensation based on the grant-date fair value of the awards and recognize the compensation expense over the requisite service period. The Company recognizes compensation expense net of actual forfeitures. To date, the Company has granted or assumed stock options, restricted stock awards (“RSAs”), time-based restricted stock units (“RSUs”), performance-based restricted stock units (“PSUs”), and restricted stock units that may be earned subject to the Company’s total shareholder return ranking relative to the software companies in the S&P Software and Services Select Industry Index (“S&P Index”) for a specified performance period or specified performance periods, service periods, and in select cases, subject to certain performance conditions (“TSR PSUs”). RSAs, RSUs, PSUs, and TSR PSUs are collectively referred to as “Stock Awards”.
The fair value of the Company’s RSAs, RSUs and PSUs equal the market value of the Company’s common stock on the date of grant. These awards are subject to time-based vesting, which generally occurs over a period of four years. The Company recognizes compensation expense for awards which contain only service conditions on a straight-line basis over the requisite service period, which is generally the vesting period of the respective awards. The Company recognizes the compensation cost for awards that contain either a performance condition, market conditions, or both using the graded vesting method.
The fair value of the Company’s Stock Options and TSR PSUs are estimated at the grant date using the Black-Scholes model and Monte Carlo simulation method, respectively. The assumptions utilized in this simulation require judgments and estimates. Changes in these inputs and assumptions could affect the measurement of the estimated fair value and the related compensation expense related to these stock options and stock awards. Compensation expense associated with these TSR PSUs will be recognized over the vesting period regardless of whether the market condition is ultimately satisfied; however, the expense will be reversed if a grantee terminates prior to satisfying the requisite service period. For TSR PSUs containing an additional performance condition, a portion of the expense may fluctuate depending on the achievement of the performance conditions. All TSR PSUs will vest at the end of a three-year period.
Income Taxes
Income taxes are accounted for under the asset and liability method. Under this method, the Company determines deferred tax assets and liabilities on the basis of the differences between the financial statement carrying amounts and tax basis of existing assets and liabilities by using enacted tax rates in effect for the year in which the difference is expected to reverse. All deferred tax assets and liabilities are classified as non-current on the consolidated balance sheets. The effect on deferred tax assets and liabilities of a change in tax rates is recognized in income in the period that includes the enactment date. A valuation allowance against deferred tax assets is recorded when it is more likely than not that some portion or all of such deferred tax assets will not be realized and is based on the positive and negative evidence about the future including future reversals of existing taxable temporary differences, projected future taxable income, tax-planning strategies, and results of recent operations.
The effective tax rate in any given financial statement period may differ materially from the statutory rate. These differences may be caused by changes in tax regulations and resulting changes in the deferred tax valuation allowance, changes in the mix and level of income or losses, changes in the expected outcome of tax audits, as well as permanent differences for stock-based compensation, including excess tax benefits, research and development credits, the tax rate differences between the United States and foreign countries, foreign withholding taxes, certain non-deductible expenses including executive compensation, and acquisition-related expenses.
The Company records interest and penalties related to unrecognized tax benefits as income tax expense in its consolidated statement of operations.
65
Recently Adopted Accounting Pronouncements
Compensation, Stock Compensation (ASC 718): Improvements on Employee Share-Based Payment Accounting
In March 2016, the Financial Accounting Standards Board (“FASB”) issued Accounting Standards Update (“ASU”) No. 2016-09, Compensation, Stock Compensation (ASC 718): Improvements on Employee Share-Based Payment Accounting (“ASU 2016-09”), which simplifies several aspects of the accounting for employee share-based payment transactions for both public and nonpublic entities, including the accounting for income taxes, forfeitures, and statutory tax withholding requirements, as well as classification in the statement of cash flows. The Company adopted ASU 2016-09 on August 1, 2017. As a result of this adoption, previously unrecognized tax benefits of $85.7 million were recorded as deferred tax assets net of valuation allowance of $0.6 million, on a modified retrospective approach with a net cumulative effect adjustment to opening retained earnings of $85.1 million. The Company elected to account for forfeitures based on actuals, as they occur, and using a modified retrospective transition method, recorded a cumulative-effect adjustment of $1.0 million to decrease the Company’s opening retained earnings balance as of the adoption date. For the year ended July 31, 2018, the provision for income taxes included tax benefits of $9.1 million related to the tax effects of settled stock-based awards.
Recent Accounting Pronouncements Not Yet Adopted
Revenue from Contracts with Customers (ASC 606): Revenue Recognition
In May 2014, the FASB issued ASU No. 2014-09, Revenue from Contracts with Customers (ASC 606) (“ASU 2014-09”), which provides guidance for revenue recognition. This ASU affects any entity that either enters into contracts with customers to transfer goods or services or enters into contracts for the transfer of non-financial assets. This ASU will supersede the revenue recognition requirements in ASC 605, Revenue Recognition, and most industry-specific guidance.
In August 2015, the FASB issued ASU No. 2015-14, Revenue from Contracts with Customers: Deferral of the Effective Date, which deferred the effective date of this standard. As a result, ASU 2014-09 and related amendments will be effective for the Company for its fiscal year beginning August 1, 2018, including interim periods within that fiscal year. The FASB issued ASU No. 2016-08, Principal Versus Agent Consideration (or Reporting Revenue Gross versus Net) in March 2016, ASU No. 2016-10, Identifying Performance Obligations and Licensing in April 2016, and ASU No. 2016-12, Narrow-Scope Improvements and Practical Expedients in May 2016. These amendments clarified certain aspects of ASU 2014-09 and have the same effective date as ASU 2014-09.
The Company will adopt these ASUs (collectively, ASC 606) on August 1, 2018 under the Modified Retrospective Method.
The Company has evaluated the potential impact of ASC 606 on its revenue recognition policy and practices and has concluded that ASC 606 will impact the pattern of its revenue recognition associated with its software licenses and, to a lesser extent, cloud-based subscriptions. The Company’s term licenses require payments to be made annually or quarterly in advance and are subject to extended payment terms. Currently under ASC 605, revenue associated with term software licenses is recognized in the earlier of the period in which the payments are due or are actually made. Under ASC 606, the Company will be required to recognize term license revenue associated with such payments not when they are made or due, but when control of the software license is transferred to the customer, which occurs at or near the time a contract with a customer is executed. As a result, under ASC 606, contractually obligated payments allocated to the software license under a term license that the Company reasonably expects to collect would be recognized upon delivery. In conjunction with its evaluation of this new standard, the Company began revising its contracting practices and amending existing agreements with certain customers primarily by shortening the initial, non-refundable term of its licenses. Since fiscal year 2017, a majority of new term license contracts have a two-year initial term with subsequent one-year auto renewal options.
The Company currently anticipates that the impact of ASC 606 on its cloud-based subscriptions, will be more limited than for term license arrangements and will impact, primarily, those cloud-based subscriptions that contractually provide for increasing annual subscription payments during the term of the arrangement. Under ASC 606, revenue on these types of cloud-based arrangements will be recognized ratably throughout the committed term.
While the Company is still evaluating the impact of the change to the timing of revenue recognition, the Company expects to have a balance sheet impact at the date of adoption of approximately $29 million to $39 million recorded as a reduction primarily to deferred revenue and an increase to un-billed contract revenue. Another significant provision under ASC 606 includes the capitalization and amortization of costs associated with obtaining a contract, most significantly sales commissions. The amortization period for the Company's deferred costs will be recognized over the estimated period of benefit, which is estimated to be five years. The Company expects there to be a balance sheet impact at the date of adoption recognizing the deferred sales commission capitalization costs of approximately $11 million to $17 million. We will continue to monitor additional changes, modifications, clarifications or interpretations of ASC 606, which may impact current expectations.
Leases (ASC 842): Accounting for Leases
66
In February 2016, the FASB issued ASU No. 2016-02, Leases (ASC 842) (“ASU 2016-02”), which requires lessees to put most leases on their balance sheets but recognize the expenses on their income statements in a manner similar to current practice. ASU 2016-02 states that a lessee would recognize a lease liability for the obligation to make lease payments and a right-to-use asset for the right to use the underlying asset for the lease term. The standard will be effective for the Company beginning August 1, 2019. While the Company is currently evaluating the impact this update will have on its consolidated financial statements, it expects ASU 2016-02 to have a significant impact on recorded assets and liabilities.
Financial Instruments (ASC 825): Recognition and Measurement of Financial Assets and Financial Liabilities
In January 2016, the FASB issued ASU 2016-01, Financial Instruments (ASC 825) (“ASU 2016-01”), which impacts certain aspects of recognition, measurement, presentation and disclosure of financial instruments. Under ASU 2016-01, unconsolidated non-equity method investments shall be measured at fair value. If such investments do not have a readily determinable fair value, an election may be made to measure them at cost after considering observable price changes for similar instruments. The standard will be effective for the Company beginning August 1, 2018. The Company does not expect the impact this update will have on its strategic equity investment in a privately-held company to be significant.
Other recent accounting pronouncements that are or will be applicable to the Company did not, or are not expected to, have a material impact on the Company’s present or future financial statements.
2. Fair Value of Financial Instruments
Available-for-sale investments within cash equivalents and investments consist of the following:
July 31, 2018 | |||||||||||||||
Amortized Cost | Unrealized Gains | Unrealized Losses | Estimated Fair Value | ||||||||||||
(in thousands) | |||||||||||||||
U.S. Government agency securities | $ | 9,000 | $ | — | $ | (27 | ) | $ | 8,973 | ||||||
Commercial paper | 471,966 | 4 | (141 | ) | 471,829 | ||||||||||
Corporate bonds | 432,234 | 69 | (763 | ) | 431,540 | ||||||||||
U.S. Government bonds | 89,986 | — | (55 | ) | 89,931 | ||||||||||
Foreign government bonds | 9,306 | 7 | (1 | ) | 9,312 | ||||||||||
Certificate of deposit | 81,985 | 53 | (8 | ) | 82,030 | ||||||||||
Money market funds | 90,766 | — | — | 90,766 | |||||||||||
Total | $ | 1,185,243 | $ | 133 | $ | (995 | ) | $ | 1,184,381 | ||||||
July 31, 2017 | |||||||||||||||
Amortized Cost | Unrealized Gains | Unrealized Losses | Estimated Fair Value | ||||||||||||
(in thousands) | |||||||||||||||
U.S. Government agency securities | $ | 22,662 | $ | — | $ | (66 | ) | $ | 22,596 | ||||||
Commercial paper | 147,371 | 2 | (34 | ) | 147,339 | ||||||||||
Corporate bonds | 258,334 | 157 | (146 | ) | 258,345 | ||||||||||
U.S. Government bonds | 67,164 | — | (185 | ) | 66,979 | ||||||||||
Certificate of deposit | 27,498 | 29 | — | 27,527 | |||||||||||
Money market funds | 96,313 | — | — | 96,313 | |||||||||||
Total | $ | 619,342 | $ | 188 | $ | (431 | ) | $ | 619,099 | ||||||
67
The following table shows the gross unrealized losses and fair value of the Company’s investments with unrealized losses, aggregated by investment category and length of time that individual securities have been in an unrealized loss position:
July 31, 2018 | |||||||||||||||||||||||
Less Than 12 Months | 12 Months or Greater | Total | |||||||||||||||||||||
Fair Value | Gross Unrealized Losses | Fair Value | Gross Unrealized Losses | Fair Value | Gross Unrealized Losses | ||||||||||||||||||
(in thousands) | |||||||||||||||||||||||
U.S. Government agency securities | $ | 6,974 | $ | (24 | ) | $ | 1,999 | $ | (3 | ) | $ | 8,973 | $ | (27 | ) | ||||||||
Commercial paper | 144,342 | (141 | ) | — | — | 144,342 | (141 | ) | |||||||||||||||
Corporate bonds | 307,590 | (755 | ) | 13,497 | (8 | ) | 321,087 | (763 | ) | ||||||||||||||
U. S. Government bonds | 65,013 | (11 | ) | 19,948 | (44 | ) | 84,961 | (55 | ) | ||||||||||||||
Foreign government bonds | 766 | (1 | ) | — | — | 766 | (1 | ) | |||||||||||||||
Certificate of deposit | 23,734 | (8 | ) | — | — | 23,734 | (8 | ) | |||||||||||||||
Total | $ | 548,419 | $ | (940 | ) | $ | 35,444 | $ | (55 | ) | $ | 583,863 | $ | (995 | ) | ||||||||
As of July 31, 2018, the Company had 188 investments in a gross unrealized loss position. The unrealized losses on its available-for-sale securities were primarily a result of unfavorable changes in interest rates subsequent to the initial purchase of these securities. The Company does not intend to sell, nor does it believe it will need to sell, these securities before recovering the associated unrealized losses. The Company does not consider any portion of the unrealized losses at July 31, 2018 to be other-than-temporarily impaired, nor are any unrealized losses considered to be credit losses. The Company has recorded the securities at fair value in its consolidated balance sheets, with unrealized gains and losses reported as a component of accumulated other comprehensive loss. The amount of realized gains and losses reclassified into earnings are based on the specific identification of the securities sold. The realized gains and losses from sales of securities in the periods presented were not material.
The following table summarizes the contractual maturities of the Company’s available-for-sale investments measured at fair value:
July 31, 2018 | |||||||||||
Less Than 12 Months | 12 to 24 Months | Total | |||||||||
(in thousands) | |||||||||||
U.S. Government agency securities | $ | 1,999 | $ | 6,974 | $ | 8,973 | |||||
Commercial paper | 465,030 | 6,799 | 471,829 | ||||||||
Corporate bonds | 280,249 | 151,291 | 431,540 | ||||||||
U.S. Government bonds | 89,931 | — | 89,931 | ||||||||
Foreign government bonds | 4,448 | 4,864 | 9,312 | ||||||||
Certificate of deposit | 61,006 | 21,024 | 82,030 | ||||||||
Money market funds | 90,766 | — | 90,766 | ||||||||
Total | $ | 993,429 | $ | 190,952 | $ | 1,184,381 | |||||
Fair Value Measurement
The Company classifies cash equivalents, short-term investments and long-term investments within Level 1 or Level 2 in the fair value hierarchy because the Company uses quoted market prices or alternative pricing sources and models utilizing observable market inputs to determine their fair value.
Fair value is defined as the exchange price that would be received for an asset or an exit price paid to transfer a liability in the principal or most advantageous market for the asset or liability in an orderly transaction between market participants on the measurement date. Valuation techniques used to measure fair value must maximize the use of observable inputs and minimize the use of unobservable inputs.
The Company uses a three-tier fair value hierarchy, which prioritizes the inputs used in the valuation methodologies in measuring fair value:
Level 1 - Unadjusted quoted prices in active markets for identical assets or liabilities;
68
Level 2 - Inputs other than quoted prices that are observable but do not qualify as a Level 1 quoted price, unadjusted quoted prices in markets that are not active, or other inputs that are observable or can be corroborated by observable market data; and
Level 3 - Unobservable inputs that are supported by little or no market activity, which require the Company to develop its own assumptions.
The categorization of a financial instrument within the valuation hierarchy is based upon the lowest level of input that is significant to the fair value measurement. The carrying value of the Company’s accounts receivable, accounts payable and accrued liabilities approximates their fair value due to the short-term nature of these instruments.
The Company bases the fair value of its Level 1 financial instruments, which are in active markets, using quoted market prices for identical instruments.
The Company obtains the fair value of its Level 2 financial instruments, which are not in active markets, from a third-party professional pricing service using quoted market prices for identical or comparable instruments, rather than direct observations of quoted prices in active markets. The Company’s professional pricing service gathers observable inputs for all of its fixed income securities from a variety of industry data providers (e.g. large custodial institutions) and other third-party sources. Once the observable inputs are gathered, all data points are considered and an average price is determined.
The Company validates the quoted market prices provided by its primary pricing service by comparing their assessment of the fair values of our Level 2 investment portfolio balance against the fair values of its Level 2 investment portfolio balance provided by its investment managers. The Company’s investment managers use similar techniques to its professional pricing service to derive pricing as described above.
The Company did not have any Level 3 financial assets or liabilities as of July 31, 2018, or 2017.
Available-for-sale investments
The following tables summarize the Company’s available-for-sale investments measured at fair value on a recurring basis, by level within the fair value hierarchy:
July 31, 2018 | |||||||||||||||
Level 1 | Level 2 | Level 3 | Total | ||||||||||||
(in thousands) | |||||||||||||||
Cash equivalents: | |||||||||||||||
Commercial paper | $ | — | $ | 269,654 | $ | — | $ | 269,654 | |||||||
Corporate bonds | — | 3,001 | — | 3,001 | |||||||||||
Money market funds | 90,766 | — | — | 90,766 | |||||||||||
Total Cash equivalents | 90,766 | 272,655 | — | 363,421 | |||||||||||
Short-term investments: | |||||||||||||||
U.S. Government agency securities | — | 1,999 | — | 1,999 | |||||||||||
Commercial paper | — | 195,376 | — | 195,376 | |||||||||||
U.S. Government bonds | — | 89,931 | — | 89,931 | |||||||||||
Foreign government bonds | — | 4,448 | — | 4,448 | |||||||||||
Corporate bonds | — | 277,248 | — | 277,248 | |||||||||||
Certificate of deposit | — | 61,006 | — | 61,006 | |||||||||||
Total Short-term investments | — | 630,008 | — | 630,008 | |||||||||||
Long-term investments: | |||||||||||||||
U.S. Government agency securities | — | 6,974 | — | 6,974 | |||||||||||
Certificate of deposit | — | 21,024 | — | 21,024 | |||||||||||
Corporate bonds | — | 151,291 | — | 151,291 | |||||||||||
Commercial paper | — | 6,799 | — | 6,799 | |||||||||||
Foreign government bonds | — | 4,864 | — | 4,864 | |||||||||||
Total Long-term investments | — | 190,952 | — | 190,952 | |||||||||||
Total | $ | 90,766 | $ | 1,093,615 | $ | — | $ | 1,184,381 | |||||||
69
July 31, 2017 | |||||||||||||||
Level 1 | Level 2 | Level 3 | Total | ||||||||||||
(in thousands) | |||||||||||||||
Cash and cash equivalents: | |||||||||||||||
Commercial paper | $ | — | $ | 98,174 | $ | — | $ | 98,174 | |||||||
Money market funds | 96,313 | — | — | 96,313 | |||||||||||
Total Cash equivalents | 96,313 | 98,174 | — | 194,487 | |||||||||||
Short-term investments: | |||||||||||||||
U.S. Government agency securities | — | 20,583 | — | 20,583 | |||||||||||
Commercial paper | — | 49,165 | — | 49,165 | |||||||||||
U. S. Government bonds | — | 47,105 | — | 47,105 | |||||||||||
Foreign government bonds | — | — | — | — | |||||||||||
Corporate bonds | — | 170,654 | — | 170,654 | |||||||||||
Certificate of deposit | — | 22,520 | — | 22,520 | |||||||||||
Total Short-term investments | — | 310,027 | — | 310,027 | |||||||||||
Long-term investments: | |||||||||||||||
U.S. Government agency securities | — | 2,013 | — | 2,013 | |||||||||||
Certificate of deposit | — | 5,007 | — | 5,007 | |||||||||||
Corporate bonds | — | 87,691 | — | 87,691 | |||||||||||
U.S. Government bonds | — | 19,874 | — | 19,874 | |||||||||||
Foreign government bonds | — | — | — | — | |||||||||||
Total Long-term investments | — | 114,585 | — | 114,585 | |||||||||||
Total | $ | 96,313 | $ | 522,786 | $ | — | $ | 619,099 | |||||||
Convertible Senior Notes
The carrying value of the Convertible Senior Notes was $310.5 million before consideration of issuance costs, which approximates their fair value at July 31, 2018. In accounting for the issuance of the notes, the Company separated the notes into liability and equity components. The carrying amount of the liability component was calculated by measuring the fair value of a similar liability that does not have an associated conversion feature. The carrying amount of the equity component representing the conversion option was determined by deducting the fair value of the liability component from the par value of the notes as a whole.
The Company estimates the fair value of the Convertible Senior Notes using commonly accepted valuation methodologies and market-based risk measurements that are indirectly observable, such as credit risk (Level 2). The Company carries the Convertible Senior Notes at face value less unamortized debt discount and issuance costs on its consolidated balance sheet, and presents the fair value for required disclosure purposes only. For further information on the Convertible Senior Notes see Note 6.
70
3. | Acquisitions |
The Company’s acquisitions during fiscal years 2018 and 2017 were all accounted for as business combinations. U.S. GAAP requires the Company to recognize separately from goodwill the assets acquired and the liabilities assumed at the acquisition date fair values. Goodwill as of the acquisition date is measured as the excess of consideration transferred over the net of the acquisition date fair value of the assets acquired and the liabilities assumed. The Company utilized the discounted cash flow methodology and the profit allocation methodology under the income approach to estimate the fair values of the intangible assets. The acquired intangible assets are amortized over their estimated useful lives. The Company used the cost build-up approach to estimate the fair value of deferred revenue by estimating the costs related to fulfilling the obligation plus an additional markup for an assumed operating margin to reflect the profit a third party would expect to make on the costs incurred. These fair value measurements were based on significant inputs that were not observable in the market and thus represents a Level 3 measurement. The valuation models were based on estimates of future operating projections of the acquired business and rights to sell new products containing the acquired technology as well as judgments on the discount rates used and other variables. The Company developed forecasts based on a number of factors including future revenue and operating cost projections, a discount rate that is representative of the weighted average cost of capital, in addition to royalty and long-term sustainable growth rates based on market analysis.
Fiscal Year 2018
Cyence Acquisition
On November 1, 2017, the Company completed its acquisition of Cyence, Inc. (“Cyence”) for an aggregate consideration of approximately $260.3 million, including approximately 146.6 million in cash, and equity consideration valued at approximately $113.7 million of newly issued Guidewire common stock and options, net of certain adjustments including a net working capital adjustment (the “Cyence Acquisition”). Through the acquisition, the Company gained a cloud-based data listening and risk analytics technology offering for the property and casualty insurance (“P&C”) industry which enables underwriting new and evolving risks, such as cyber risk. The results of Cyence’s operations have been included in the Company’s results of operations since November 1, 2017, the date of acquisition.
As part of the acquisition, the Company assumed certain Cyence compensation agreements, including RSAs and stock options with an estimated fair value of $37.6 million. Based on the service period related to the period prior to the acquisition date, $18.2 million was allocated to the purchase price, and $19.4 million relating to post-acquisition services will be recorded as operating expenses over the remaining requisite service periods. RSAs were valued based on the November 1, 2017 grant date value, and the estimated fair value of the stock options assumed by the Company was determined using the Black-Scholes option pricing model.
The adjustments reflected herein to determine the purchase consideration are preliminary and may change as the Company finalizes these adjustments during the measurement period based on new information as it becomes available. The measurement period will end no later than October 31, 2018. The preliminary purchase consideration is as follows (in thousands):
Cash consideration paid at close | $ | 146,651 | |
Equity issued to shareholders | 102,493 | ||
Issuance of replacement awards | 11,205 | ||
Total preliminary purchase consideration | $ | 260,349 | |
In conjunction with the preliminary purchase price allocation, the Company determined that Cyence’s separately identifiable intangible assets were developed technology, customer contracts and related relationships, order backlog, and trade names. The valuation method used was in accordance with the Company’s policy, practice, and experience as described above. The valuation models were based on estimates of future operating projections of Cyence and rights to sell new products containing the acquired technology as well as judgments on the discount rates used and other variables. The Company developed forecasts based on a number of factors including future revenue and operating cost projections, a discount rate that is representative of the weighted average cost of capital, in addition to royalty and long-term sustainable growth rates based on a market analysis. The Company amortizes the acquired intangibles over their estimated useful lives as set forth in the table below.
The allocation of purchase price is preliminary pending the final valuation of intangible and tangible assets acquired and liabilities assumed, certain acquired deferred tax assets and completion of certain statutory tax filing requirements and is therefore subject to potential future measurement period adjustments. The preliminary allocation of the purchase consideration is as follows:
71
Preliminary Purchase Price Allocation | Estimated Useful Lives | |||||
(in thousands) | (in years) | |||||
Acquired assets, net of assumed liabilities | $ | 9,620 | ||||
Developed technology | 28,400 | 5 | ||||
Customer contracts and related relationships | 17,700 | 5 | ||||
Order backlog | 3,200 | 2 | ||||
Trademarks | 2,500 | 7 | ||||
Goodwill | 198,929 | |||||
Total preliminary purchase consideration | $ | 260,349 | ||||
The goodwill of $198.9 million arising from the Cyence Acquisition consists largely of the acquired workforce and the opportunity to expand the Company’s customer base. The goodwill recognized is not expected to be deductible for income tax purposes.
Cyence’s post-acquisition results of operations were included in the Company’s results of operations. Since the acquisition date of November 1, 2017 through July 31, 2018, total revenue and net loss of Cyence was $11.0 million and $20.3 million, respectively. The Company incurred $5.2 million of total acquisition-related costs that were recognized in general and administrative expenses in fiscal year 2018.
Unaudited Pro Forma Financial Information
The following unaudited pro forma financial information presents the combined results of operations for the Company and Cyence for the fiscal years ended July 31, 2018 and 2017, after giving effect to the Cyence Acquisition as if it had occurred on August 1, 2016. The unaudited pro forma financial information includes adjustments to give effect to pro forma events that are directly attributable to the business combination and factually supportable. The unaudited pro forma financial information presented includes the business combination accounting effects resulting from the acquisition, including adjustments for the amortization of intangible assets, stock-based compensation, deferred revenue, and transaction costs on August 1, 2016 with a corresponding reduction of these amounts in the period originally recognized.
The unaudited pro forma financial information is presented for illustrative purposes only and is not necessarily indicative of the results of operations that would have been realized if the Cyence acquisition had been completed on August 1, 2016, nor does it purport to project the results of operations of the combined company in future periods. The unaudited pro forma financial information does not give effect to any anticipated integration costs related to the acquired company. Consequently, actual results will differ from the unaudited pro forma financial information.
The unaudited pro forma financial information is as follows (in thousands):
Fiscal years ended July 31, | |||||||
2018 | 2017 | ||||||
Pro forma revenue | $ | 665,999 | $ | 524,102 | |||
Pro forma net loss | $ | (22,618 | ) | $ | (9,891 | ) | |
Pro forma net loss per share -- basic and diluted | $ | (0.29 | ) | $ | (0.13 | ) | |
The pro forma revenue and net loss reflects material, nonrecurring adjustments, such as transaction, transition and integration-related charges (including legal, accounting and other professional fees, and retention bonuses) that resulted from the acquisition.
Fiscal Year 2017
72
ISCS Acquisition
On February 16, 2017, the Company completed its acquisition of ISCS, Inc., a privately-held company that provides a cloud-based, all-in-one system for policy administration, billing and claims management to P&C insurers (“ISCS Acquisition”). The purchase price of the ISCS Acquisition was $160 million, subject to certain preliminary adjustments including a net working capital adjustment, which resulted in cash consideration paid of $154.9 million. The fair value of all assets acquired and liabilities assumed was finalized in the fiscal quarter ended April 30, 2018. A portion of the consideration has been placed into an escrow account as partial security to satisfy any potential claims, including the indemnification liability for state sales taxes. The ISCS Acquisition is intended to enhance the Company's ability to serve those P&C insurers that prefer a cloud-based, all-in-one platform that offers policy, billing, and claims management functionality. Total acquisition costs of $1.1 million were expensed as incurred, and recorded as general and administrative expenses in the accompanying consolidated statement of operations in fiscal year 2017. The results of ISCS’ operations have been included in the Company’s results of operations since February 16, 2017, the acquisition date.
In connection with the ISCS Acquisition, the Company recorded an indemnification asset of $1.6 million, which represents the selling security holders’ obligation under the Agreement and Plan of Merger to indemnify the Company for unpaid state sales taxes. The indemnification asset was recognized on the same basis as the corresponding liability, which is based on its estimated fair value as of the date of acquisition.
The ISCS Acquisition was accounted for as a business combination. As part of the purchase price allocation, the Company determined that ISCS’s separately identifiable intangible assets were developed technology, customer contracts and related relationships, and order backlog. The valuation method used was in accordance with the Company’s policy, practice, and experience as described above. The allocation of the purchase consideration was as follows:
Total Purchase Price Allocation | Estimated Useful Lives | |||||
(in thousands) | (in years) | |||||
Acquired assets, net of assumed liabilities | $ | 4,530 | ||||
Developed technology | 43,300 | 4 | ||||
Customer contracts and related relationships | 7,000 | 9 | ||||
Order backlog | 3,500 | 4 | ||||
Deferred tax assets | 171 | |||||
Goodwill | 96,431 | |||||
Total preliminary purchase price | $ | 154,932 | ||||
The goodwill of $96.4 million arising from the ISCS Acquisition consists largely of the acquired workforce, expected synergies and the opportunity to expand the Company’s customer base. The goodwill recognized is expected to be deductible for income tax purposes.
FirstBest Acquisition
On August 31, 2016, the Company acquired all of the outstanding equity interests of FirstBest Systems, Inc. (the “FirstBest Acquisition”), a privately-held provider of underwriting management systems and related applications for P&C insurers. Total consideration for the FirstBest Acquisition was $37.8 million which included amounts placed into escrow to cover future potential claims. The fair value of all assets acquired and liabilities assumed was finalized in the fiscal quarter ended October 31, 2017. The Company believes that the FirstBest Acquisition will enable the expansion of its insurance platform by providing insurers in the U.S. and Canada writing complex commercial, specialty, and workers’ compensation lines greater support for their risk assessment and decision-making processes. Total acquisition costs of $1.2 million were expensed as incurred and recorded as general and administrative expenses in the accompanying consolidated statement of operations, of which, $0.9 million were expensed as incurred during the year ended July 31, 2017 and $0.3 million were expensed as incurred during the year ended July 31, 2016.
The FirstBest Acquisition was accounted for as a business combination. As part of the purchase price allocation, the Company determined that FirstBest’s separately identifiable intangible assets were developed technology, customer contracts and related relationships, and order backlog. The valuation method used was in accordance with the Company’s policy, practice and experience as described above. The allocation of the purchase consideration was as follows:
73
Total Purchase Price Allocation | Estimated Useful Lives | |||||
(in thousands) | (in years) | |||||
Acquired assets, net of assumed liabilities | $ | 2,518 | ||||
Developed technology | 8,000 | 5 | ||||
Customer contracts and related relationships | 6,500 | 9 | ||||
Order backlog | 900 | 3 | ||||
Deferred tax assets, net | 4,406 | |||||
Goodwill | 15,434 | |||||
Total purchase price | $ | 37,758 | ||||
The goodwill of $15.4 million arising from the acquisition consists largely of the acquired workforce, expected synergies and the opportunity to expand the Company’s customer base. The goodwill recognized is not expected to be deductible for income tax purposes.
4. Balance Sheet Components
Property and Equipment, net
Property and equipment consist of the following:
July 31, 2018 | July 31, 2017 | ||||||
(in thousands) | |||||||
Computer hardware | $ | 24,879 | $ | 21,408 | |||
Purchased software | 4,664 | 3,855 | |||||
Capitalized software development costs | 3,978 | 1,065 | |||||
Furniture and fixtures | 4,217 | 3,253 | |||||
Leasehold improvements | 10,751 | 8,251 | |||||
Total property and equipment | 48,489 | 37,832 | |||||
Less accumulated depreciation | (29,894 | ) | (23,456 | ) | |||
Property and equipment, net | $ | 18,595 | $ | 14,376 | |||
As of July 31, 2018 and 2017, no property and equipment was pledged as collateral against borrowings. Amortization of leasehold improvements is included in depreciation expense. Depreciation expense was $7.7 million, $6.6 million and $6.5 million for the years ended July 31, 2018, 2017 and 2016, respectively.
During the third fiscal quarter of fiscal year 2017, the Company began to capitalize software development costs for technology applications that the Company will offer solely as cloud-based subscriptions. The amount capitalized as of July 31, 2018 and 2017 was $4.0 million and $1.1 million, respectively, primarily comprised of compensation and related headcount costs for employees who were directly associated with the software development projects. During the fiscal year ended July 31, 2018, the Company began to amortize the technology applications that were ready for their intended use. The Company recognized approximately $0.4 million in amortization expense in cost of revenue, license and other on the accompanying consolidated statements of operations during the fiscal year ended July 31, 2018. There was no such amortization during the fiscal years ended July 31, 2017 and 2016.
Other Assets
The Company’s other assets of $22.5 million and $20.1 million at July 31, 2018 and 2017, respectively, include the strategic equity investment in a privately-held company, which was accounted for using the cost method of accounting. Strategic investments are non-marketable equity securities, in which the Company does not have a controlling interest or the ability to exert significant influence. These investments do not have a readily determinable market value. Under the cost method of accounting, the non-marketable securities are carried at cost and are adjusted only for other-than temporary impairments, certain distributions and additional investments. Accordingly, if the Company were to disclose the fair value of the investment, the fair value measurement would be Level 3 in the valuation hierarchy. The Company assesses the investment for impairment when events or changes in circumstances indicate that its carrying amount may not be recoverable. As of July 31, 2018 and 2017, there were no indicators that the strategic equity investment with carrying value of $10.7 million was impaired.
74
Goodwill and Intangible Assets
Changes in the carrying amount of goodwill for the periods presented is as follows (in thousands):
Goodwill - July 31, 2016 | $ | 30,080 | ||
FirstBest Acquisition | 15,434 | |||
ISCS Acquisition | 96,337 | |||
Goodwill - July 31, 2017 | $ | 141,851 | ||
Cyence Acquisition | 198,929 | |||
Changes in carrying value | 97 | |||
Goodwill - July 31, 2018 | $ | 340,877 | ||
The Company’s intangible assets are amortized over their estimated useful lives. Intangible assets consist of the following:
July 31, 2018 | July 31, 2017 | ||||||||||||||||||||||
Cost | Accumulated Amortization | Net Book Value | Cost | Accumulated Amortization | Net Book Value | ||||||||||||||||||
(in thousands) | |||||||||||||||||||||||
Intangible assets: | |||||||||||||||||||||||
Acquired technology | $ | 93,600 | $ | 34,189 | 59,411 | $ | 65,200 | $ | 14,710 | $ | 50,490 | ||||||||||||
Customer contracts and related relationships | 35,700 | 6,633 | 29,067 | 18,000 | 1,683 | 16,317 | |||||||||||||||||
Partner relationships | 200 | 52 | 148 | 200 | 30 | 170 | |||||||||||||||||
Trademarks | 2,500 | 268 | 2,232 | — | — | — | |||||||||||||||||
Order backlog | 8,700 | 3,904 | 4,796 | 5,500 | 1,162 | 4,338 | |||||||||||||||||
Total | $ | 140,700 | $ | 45,046 | $ | 95,654 | $ | 88,900 | $ | 17,585 | $ | 71,315 | |||||||||||
Amortization expense was $27.5 million, $12.1 million and $2.3 million during the years ended July 31, 2018, 2017 and 2016, respectively. The estimated future aggregate amortization expense for existing intangible assets as of July 31, 2018, based on their current useful lives, is as follows (in thousands):
Fiscal year ending July 31, | ||||
2019 | $ | 29,112 | ||
2020 | 26,834 | |||
2021 | 19,965 | |||
2022 | 11,143 | |||
2023 | 3,799 | |||
Thereafter | 4,801 | |||
Total future amortization expense | $ | 95,654 | ||
Allowance for Doubtful Accounts
Allowance for Doubtful Accounts consists of the following (in thousands):
Allowance for Doubtful Accounts as of July 31, 2017 | $ | — | ||
Charges to bad debt and revenue reserves | 1,062 | |||
Write-offs, net | — | |||
Allowance for Doubtful Accounts as of July 31, 2018 | $ | 1,062 | ||
Accrued Employee Compensation
Accrued employee compensation consists of the following:
75
July 31, 2018 | July 31, 2017 | ||||||
(in thousands) | |||||||
Accrued bonuses | $ | 31,273 | $ | 26,581 | |||
Accrued commission | 7,287 | 5,228 | |||||
Accrued vacation | 13,132 | 10,873 | |||||
Accrued salaries, payroll taxes and benefits | 8,443 | 6,200 | |||||
Total | $ | 60,135 | $ | 48,882 | |||
Deferred Revenue
Deferred revenue, current and non-current, consists of the following:
July 31, 2018 | July 31, 2017 | ||||||
Deferred revenue, current: | (in thousands) | ||||||
Deferred license and other revenue | $ | 42,235 | $ | 21,018 | |||
Deferred maintenance revenue | 52,010 | 46,562 | |||||
Deferred services revenue | 19,893 | 23,663 | |||||
Total deferred revenue, current | $ | 114,138 | $ | 91,243 | |||
Deferred revenue, non-current | 23,758 | 19,892 | |||||
Total | $ | 137,896 | $ | 111,135 | |||
Accumulated Other Comprehensive Loss
Changes in accumulated other comprehensive loss was as follows:
Foreign Currency Items | Unrealized gain (loss) on available-for-sale securities | Total | |||||||||
(in thousands) | |||||||||||
Balance as of July 31, 2016 | $ | (6,809 | ) | $ | 216 | $ | (6,593 | ) | |||
Foreign currency translation adjustments | 1,179 | (465 | ) | 714 | |||||||
Unrealized loss on available-for-sale securities | — | (151 | ) | (151 | ) | ||||||
Tax effect | — | 234 | 234 | ||||||||
Balance as of July 31, 2017 | (5,630 | ) | (166 | ) | (5,796 | ) | |||||
Foreign currency translation adjustments | (1,567 | ) | (596 | ) | (2,163 | ) | |||||
Unrealized loss on available-for-sale securities | — | (22 | ) | (22 | ) | ||||||
Tax effect | — | 233 | 233 | ||||||||
Balance as of July 31, 2018 | $ | (7,197 | ) | $ | (551 | ) | $ | (7,748 | ) | ||
5. Net Income (Loss) per Share
The Company calculates basic earnings per share by dividing the net income (loss) by the weighted average number of shares of common stock outstanding for the period. The diluted earnings per share is computed by giving effect to all potential dilutive common stock equivalents outstanding for the period. For purposes of this calculation, options to purchase common stock and stock awards are considered to be common stock equivalents.
76
The following table sets forth the computation of the Company’s basic and diluted net income per share for the years ended July 31, 2018, 2017 and 2016:
Fiscal years ended July 31, | |||||||||||
2018 | 2017 | 2016 | |||||||||
(in thousands, except share and per share amounts) | |||||||||||
Numerator: | |||||||||||
Net income (loss) | $ | (19,665 | ) | $ | 21,224 | $ | 14,976 | ||||
Net income (loss) per share: | |||||||||||
Basic | $ | (0.25 | ) | $ | 0.29 | $ | 0.21 | ||||
Diluted | $ | (0.25 | ) | $ | 0.28 | $ | 0.20 | ||||
Denominator: | |||||||||||
Weighted average shares used in computing net income (loss) per share: | |||||||||||
Basic | 77,709,592 | 73,994,577 | 72,026,694 | ||||||||
Weighted average effect of dilutive stock options | — | 544,520 | 859,855 | ||||||||
Weighted average effect of dilutive Stock Awards | — | 789,246 | 879,411 | ||||||||
Diluted | 77,709,592 | 75,328,343 | 73,765,960 | ||||||||
The following weighted shares outstanding of potential common stock were excluded from the computation of diluted net income (loss) per share for the periods presented because including them would have been antidilutive:
Fiscal years ended July 31, | ||||||||
2018 | 2017 | 2016 | ||||||
Stock options to purchase common stock | 597,476 | 24,128 | 77,737 | |||||
Restricted Stock Awards | 3,161,157 | 88,582 | 22,994 | |||||
Since the Company has the intent and ability to settle the principal amount of the Convertible Senior Notes in cash and any excess in shares of the Company’s common stock, the Company uses the treasury stock method for calculating any potential dilutive effect of the conversion spread on diluted net income per share, if applicable. The conversion spread will have a dilutive impact on net income per share of common stock when the average market price of the Company’s common stock for a given period exceeds the conversion price of $113.75 per share for the Convertible Senior Notes. Since the Convertible Senior Notes were issued, the Company's weighted average common stock price has remained below the conversion price of the Convertible Senior Notes.
6. Convertible Senior Notes
In March 2018, the Company offered and sold $400.0 million aggregate principal amount of its 1.25% Convertible Senior Notes due 2025, including the underwriters’ exercise in full of their option to purchase an additional $40.0 million of the Convertible Senior Notes. The Convertible Senior Notes were issued in accordance with the Indenture, dated as of March 13, 2018, between the Company and U.S. Bank National Association, as trustee (the “Trustee”) (the “Base Indenture”), as amended and supplemented by the First Supplemental Indenture, dated as of March 13, 2018, between the Company and the Trustee (together with the Base Indenture, the “Indenture”). The net proceeds from the issuance of the Convertible Senior Notes were $387.2 million, after deducting issuance costs.
The Convertible Senior Notes are unsecured obligations of the Company, and interest is payable semi-annually in arrears at a rate of 1.25% per year, on March 15 and September 15 of each year, beginning on September 15, 2018. The Convertible Senior Notes will mature on March 15, 2025 unless repurchased, redeemed, or converted prior to such date. Prior to the close of business on the business day immediately preceding October 15, 2024, the Convertible Senior Notes are convertible at the option of holders during certain periods, upon satisfaction of certain conditions. On or after October 15, 2024, the Convertible Senior Notes are convertible at any time until the close of business on the second scheduled trading day immediately preceding the maturity date. The Convertible Senior Notes will have an initial conversion rate of 8.7912 shares of common stock per $1,000 principal (equivalent to an initial conversion price of approximately $113.75 per share of its common stock). The conversion rate is subject to customary adjustments upon the occurrence of certain events but will not be adjusted for any accrued and unpaid interest. Upon conversion, the Company will pay or deliver, as the case may be, cash, shares of its common stock or a combination of cash and shares of its common stock, at its election.
77
The Company may redeem the Convertible Senior Notes, at its option, on or after March 20, 2022, at a redemption price equal to 100% of the principal amount thereof, plus accrued and unpaid interest if the last reported sale price of the Company’s common stock has been at least 130% of the conversion price then in effect for at least 20 trading days (whether or not consecutive), including at least one of the 3 trading days immediately preceding the date on which the Company provides notice of redemption, during any 30 consecutive trading day period ending on, and including, the trading day immediately preceding the date on which the notice of redemption was provided. No sinking fund is provided for the Notes. Upon the occurrence of a fundamental change (as defined in the Indenture) prior to the maturity date, holders may require the Company to repurchase all or a portion of the Notes for cash at a price equal to 100% of the principal amount of the notes to be repurchased, plus any accrued and unpaid interest to, but excluding, the fundamental change repurchase date.
The Convertible Senior Notes rank senior in right of payment to any of the Company’s indebtedness that is expressly subordinated in right of payment to the Convertible Senior Notes, and equal in right of payment to any of its indebtedness that is not so subordinated. The Convertible Senior Notes are effectively junior in right of payment to any of the Company’s secured indebtedness to the extent of the value of the assets securing such indebtedness; and structurally junior to all indebtedness and other liabilities (including trade payables) and any preferred equity of its current or future subsidiaries.
In accounting for the issuance of the Convertible Senior Notes, the Company separated the Convertible Senior Notes into liability and equity components. The carrying amount of the liability component was calculated by measuring the fair value of a similar liability that does not have an associated convertible feature. The carrying amount of the equity component representing the conversion option was determined by deducting the fair value of the liability component from the par value of the Convertible Senior Notes as a whole. The excess of the principal amount of the Convertible Senior Notes over its carrying amount is amortized to interest expense using the effective interest method over the term of the Convertible Senior Notes. The equity component of the Convertible Senior Notes is recorded as the difference between the initial proceeds less the fair value of the liability component and will not be remeasured as long as it continues to meet the requirements for equity classification. The equity component is net of issuance costs and recorded as additional paid-in capital in stockholders' equity.
The net carrying value of the liability component, unamortized debt discount and issuance costs of the Convertible Senior Notes was as follows:
July 31, 2018 | |||
(in thousands) | |||
Principal | $ | 400,000 | |
Less: unamortized debt discount and issuance costs | |||
Unamortized debt discount | 85,343 | ||
Debt issuance cost | 9,529 | ||
Net carrying amount | $ | 305,128 | |
The following table sets forth the interest expense recognized related to the Convertible Senior Notes:
Fiscal Year Ended July 31, 2018 | |||
(in thousands) | |||
Contractual interest expense | $ | 1,903 | |
Amortization of debt discount | 4,134 | ||
Amortization of debt issuance costs | 378 | ||
Total | $ | 6,415 | |
Effective interest rate of the liability component | 5.53 | % | |
Capped Call
78
The Company paid $37.2 million to purchase capped calls with certain financial institutions pursuant to capped call confirmations (the “Capped Calls”). The Capped Calls have an initial strike price of $113.75 per share, subject to certain adjustments, which corresponds to the initial conversion price of the Notes. The Capped Calls have initial cap prices of $153.13 per share, subject to certain adjustments. The Capped Calls cover, subject to anti-dilution adjustments, 3.5 million shares of common stock. By entering into the Capped Calls, the Company expects to reduce the potential dilution to its common stock (or, in the event the conversion is settled in cash, to reduce its cash payment obligation) in the event that at the time of conversion its stock price exceeds the conversion price under the Convertible Senior Notes. The Capped Calls are subject to either adjustment or termination upon the occurrence of specified extraordinary events affecting the Company, including a merger event, tender offer, and a nationalization, insolvency, or delisting involving the Company. Additionally, the Capped Calls are subject to certain specified additional disruption events that may give rise to a termination of the Capped Calls, including change in law, insolvency filing, and hedging disruptions. The Capped Calls were recorded as a reduction of the Company’s additional paid-in capital in the accompanying condensed consolidated balance sheets.
7. Commitments and Contingencies
The Company’s contractual obligations and commitments as of July 31, 2018 are as follows:
Lease Obligations (1) | Royalty Obligations (2) | Purchase Commitments (3) | Long-Term Debt (4) | Total | |||||||||||||||
Fiscal Year Ending July 31, | (in thousands) | ||||||||||||||||||
2019 | $ | 10,718 | $ | 1,761 | $ | 60,298 | $ | 5,028 | $ | 77,805 | |||||||||
2020 | 10,713 | 698 | 8,181 | 5,000 | 24,592 | ||||||||||||||
2021 | 14,615 | 101 | 1,368 | 5,000 | 21,084 | ||||||||||||||
2022 | 13,295 | — | 253 | 5,000 | 18,548 | ||||||||||||||
2023 | 12,507 | — | — | 5,000 | 17,507 | ||||||||||||||
2024 and thereafter | 85,156 | — | — | 410,000 | 495,156 | ||||||||||||||
Total | $ | 147,004 | $ | 2,560 | $ | 70,100 | $ | 435,028 | $ | 654,692 | |||||||||
(1) | Operating lease agreements primarily represent our obligations to make payments under our non-cancellable lease agreements for our corporate headquarters and worldwide offices through 2028. |
(2) | Royalty obligations primarily represent our obligations under our non-cancellable agreements related to software used in certain revenue-generating agreements. |
(3) | Purchase commitments consist of agreements to purchase services, entered into in the ordinary course of business. These represent commitments for which a penalty could be imposed if the agreement was canceled for any reason other than an event of default as described by the agreement. |
(4) | Long-term debt consists of principal and interest payments on the Company’s Convertible Senior Notes. The $400 million in principal will be due in March 2025. |
Leases
The Company leases certain facilities and equipment under operating leases. Lease expense for all worldwide facilities and equipment, which is being recognized on a straight-line basis over terms of the various leases, was $8.7 million, $6.8 million and $5.7 million during the years ended July 31, 2018, 2017, and 2016, respectively.
In December 2017, the Company entered into a new lease agreement for its future headquarters facility. The lease term is expected to commence on December 1, 2018, for a period of 10.5 years. Total payments committed under the lease are $126.7 million. In connection with this lease agreement, the Company also entered into an irrevocable stand-by letter of credit to guarantee the $1.8 million security deposit.
Legal Proceedings
From time to time, the Company is involved in various legal proceedings and receives claims, arising from the normal course of business activities. The Company has determined that no provision for liability nor disclosure is required related to any claim against the Company because: (a) there is not a reasonable possibility that a loss exceeding amounts already recognized (if any) may be incurred with respect to such claim; (b) a reasonably possible loss or range of loss cannot be estimated; or (c) such estimate
79
is immaterial. Accordingly, the Company has not recorded any accrual for claims as of July 31, 2018 and 2017. The Company expenses legal fees in the period in which they are incurred.
Indemnification
The Company sells software licenses and services to its customers under contracts (“Software License”). Each Software License contains the terms of the contractual arrangement with the customer and generally includes certain provisions for defending the customer against any claims that the Company’s software infringes upon a patent, copyright, trademark, or other proprietary right of a third-party. Software Licenses also indemnify the customer against losses, expenses, and liabilities from damages that may be assessed against the customer in the event the Company’s software is found to infringe upon such third-party rights.
The Company has not had to reimburse any of its customers for losses related to indemnification provisions and no material claims against the Company were outstanding as of July 31, 2018 and 2017. For several reasons, including the lack of prior indemnification claims and the lack of a monetary liability limit for certain infringement cases under various Software Licenses, the Company cannot estimate the amount of potential future payments, if any, related to indemnification provisions.
The Company has also agreed to indemnify its directors and executive officers for costs associated with any fees, expenses, judgments, fines and settlement amounts incurred by any of these persons in any action or proceeding to which any of these persons is, or is threatened to be, made a party by reason of the person’s service as a director or officer, including any action by the Company, arising out of that person’s services as the Company’s director or officer or that person’s services provided to any other company or enterprise at the Company’s request. The Company maintains director and officer insurance coverage that may enable the Company to recover a portion of any future amounts paid.
8. Stockholders’ Equity and Stock-Based Compensation
Equity Incentive Plans
On September 14, 2011, the Company’s Board of Directors adopted the 2011 Stock Plan (“2011 Plan”) for the purpose of granting equity-based incentive awards as compensation tools to motivate the Company’s workforce. The Company had initially reserved 7,500,000 shares of its common stock for the issuance of awards under the 2011 Plan. The 2011 Plan provides that the number of shares reserved and available for issuance under the plan will automatically increase each January 1, beginning on January 1, 2013, by up to 5% of the outstanding number of shares of the Company’s common stock on the immediately preceding December 31. This number is subject to adjustment in the event of a stock split, stock dividend or other defined changes in the Company’s capitalization.
In addition, the Company has equity awards outstanding from its other equity incentive plans, the 2006 Stock Plan, the 2009 Stock Plan and the 2010 Restricted Stock Unit Plan, which were discontinued for the purposes of making new grants upon the adoption of the 2011 Plan.
The Company requires that employees sell a portion of the shares that they receive upon the vesting of RSUs in order to cover any required withholding taxes (“sell-to-cover”).
Stock-Based Compensation Expense
Stock-based compensation cost related to Stock Awards and stock options is included in the Company’s consolidated statements of operations as follows:
80
Fiscal years ended July 31, | |||||||||||
2018 | 2017 | 2016 | |||||||||
(in thousands) | |||||||||||
Total stock-based compensation | $ | 89,176 | $ | 72,695 | $ | 66,409 | |||||
Net impact of deferred stock-based compensation | 438 | (901 | ) | (278 | ) | ||||||
Total stock-based compensation expense | $ | 89,614 | $ | 71,794 | $ | 66,131 | |||||
Stock-based compensation expense was charged to the following categories: | |||||||||||
Cost of license and other revenue | $ | 1,002 | $ | 373 | $ | 433 | |||||
Cost of maintenance revenue | 1,886 | 1,694 | 1,491 | ||||||||
Cost of services revenue | 21,856 | 18,622 | 17,878 | ||||||||
Research and development | 25,440 | 18,123 | 15,555 | ||||||||
Sales and marketing | 18,387 | 16,663 | 15,090 | ||||||||
General and administrative | 21,043 | 16,319 | 15,684 | ||||||||
Total stock-based compensation expense | 89,614 | 71,794 | 66,131 | ||||||||
Tax benefit from stock-based compensation | 24,481 | 23,014 | 20,092 | ||||||||
Total stock-based compensation expense, net of tax effect | $ | 65,133 | $ | 48,780 | $ | 46,039 | |||||
81
As of July 31, 2018, total unrecognized stock-based compensation cost for our options and Stock Awards was as follows:
Unrecognized Expense | Weighted Average Expected Recognition Period | ||||
(in thousands) | (in years) | ||||
Stock Options | $ | 5,832 | 2.2 | ||
Stock Awards | 152,037 | 2.2 | |||
$ | 157,869 | ||||
Stock Awards
A summary of the Company’s Stock Awards activity under the Company’s equity incentive plans is as follows:
Stock Awards Outstanding | ||||||||||
Number of Stock Awards | Weighted Average Grant Date Fair Value | Aggregate Intrinsic Value (1) | ||||||||
(in thousands) | ||||||||||
Balance as of July 31, 2015 | 2,882,674 | $ | 42.65 | $ | 170,222 | |||||
Granted | 1,586,192 | 54.99 | ||||||||
Released | (1,408,746 | ) | 41.21 | $ | 78,763 | |||||
Canceled | (332,396 | ) | 46.71 | |||||||
Balance as of July 31, 2016 | 2,727,724 | 50.08 | $ | 167,673 | ||||||
Granted | 1,542,235 | 61.22 | ||||||||
Released | (1,372,770 | ) | 49.38 | $ | 81,427 | |||||
Canceled | (263,104 | ) | 53.53 | |||||||
Balance as of July 31, 2017 | 2,634,085 | 56.62 | $ | 190,076 | ||||||
Granted | 1,814,084 | 79.65 | ||||||||
Released | (1,260,758 | ) | 56.92 | $ | 103,957 | |||||
Canceled | (255,256 | ) | 63.66 | |||||||
Balance as of July 31, 2018 | 2,932,155 | $ | 69.43 | $ | 252,752 | |||||
Expected to vest as of July 31, 2018 | 2,932,155 | $ | 69.43 | $ | 252,752 | |||||
(1) | Aggregate intrinsic value at each fiscal year end represents the total market value of Stock Awards at the Company’s closing stock price of $86.20, $72.16 and $61.47 on July 31, 2018, 2017 and 2016, respectively. Aggregate intrinsic value for released Stock Awards represents the total market value of released Stock Awards at date of release. |
Certain executives and employees of the Company received PSUs and TSR PSUs in addition to RSUs. The PSUs included performance-based conditions and vest over a four-year period. The TSR PSUs are subject to total shareholder return rankings relative to the software companies in the S&P Index for a specified performance period or specified performance periods, and vest at the end of three years. In select cases, certain TSR PSUs are also subject to performance-based conditions.
RSAs are issued and outstanding upon grant; however, vesting is based on continued employment. The weighted average grant date fair value is based on the market value of our common stock on the date of grant.
The Company recognized stock-based compensation of $19.1 million, $9.4 million and $6.9 million that were related to these performance-based and market-based stock awards in fiscal years 2018, 2017 and 2016, respectively.
82
Stock Options
Stock option activity under the Company’s equity incentive plans is as follows:
Number of Stock Options Outstanding | Weighted Average Exercise Price | Weighted Average Remaining Contractual Life | Aggregate Intrinsic Value (1) | |||||||||
(in years) | (in thousands) | |||||||||||
Balance as of July 31, 2015 | 1,822,062 | $ | 14.29 | 4.9 | $ | 81,548 | ||||||
Granted | 10,000 | 54.00 | ||||||||||
Exercised | (652,832 | ) | 12.01 | $ | 29,186 | |||||||
Canceled | (20,658 | ) | 40.86 | |||||||||
Balance as of July 31, 2016 | 1,158,572 | 15.45 | 4.0 | $ | 53,316 | |||||||
Granted | — | — | ||||||||||
Exercised | (594,936 | ) | 9.35 | $ | 30,636 | |||||||
Canceled | (8,000 | ) | 2.74 | |||||||||
Balance as of July 31, 2017 | 555,636 | 22.17 | 4.0 | $ | 27,777 | |||||||
Granted(2) | 137,057 | 10.23 | ||||||||||
Exercised | (150,924 | ) | 13.32 | $ | 10,710 | |||||||
Canceled | (4,705 | ) | 40.05 | |||||||||
Balance as of July 31, 2018 | 537,064 | $ | 21.45 | 4.3 | $ | 34,774 | ||||||
Vested and expected to vest as of July 31, 2018 | 537,064 | $ | 21.45 | 4.3 | $ | 34,774 | ||||||
Exercisable as of July 31, 2018 | 443,782 | $ | 23.04 | 3.5 | $ | 28,028 | ||||||
(1) | Aggregate intrinsic value at each fiscal year end represents the difference between the Company’s closing stock price of $86.20, $72.16 and $61.47 on July 31, 2018, 2017 and 2016 and the exercise price of the option, respectively. Aggregate intrinsic value for exercised options represents the difference between the Company’s stock price at date of exercise and the exercise price. |
(2) | Represents options assumed through the Cyence acquisition on November 1, 2017. |
Valuation of Awards
TSR PSUs
The fair values of the TSR PSUs were estimated at the grant date using Monte Carlo simulation model which included the following assumptions:
Fiscal years ended July 31, | |||||
2018 | 2017 | 2016 | |||
Expected term (in years) | 2.88 | 2.66 - 2.88 | * | ||
Risk-free interest rate | 1.44% | 0.89% - 1.34% | * | ||
Expected volatility of the Company | 28% | 30.2% - 31.5% | * | ||
Average expected volatility of the peer companies in the S&P Index | 34.7% | 36.9% - 37.0% | * | ||
Expected dividend yield | —% | —% | * | ||
* There were no TSR PSUs granted during the fiscal year ended July 31, 2016.
83
The number of TSR PSUs that may ultimately vest will vary based on the relative performance of the Company’s total shareholder return rankings relative to the software companies in the S&P Index for a specified performance period or periods. The Monte Carlo methodology incorporates into the valuation all possible outcomes, including that the Company’s relative performance may result in no shares vesting. As a result, stock-based compensation expense is recognized regardless of the ultimate achievement of the plan’s performance metrics. The expense will be reversed only in the event that a grantee is terminated prior to satisfying the requisite service period.
For a subset of TSR PSUs, the number of shares that may ultimately vest will vary based on the achievement of certain Company specific financial performance metrics in addition to the Company’s total shareholder return condition noted above. As a result, the expense recognized will fluctuate based on the Company’s estimated financial performance relative to the target financial performance metrics.
Stock Options
The per share fair value of each stock option was determined using the Black-Scholes option-pricing model with the following assumptions:
Fiscal years ended July 31, | |||||
2018 | 2017 | 2016 | |||
Expected life (in years) | 1.27 | * | 4.9 | ||
Risk-free interest rate | 1.48% | * | 1.5% | ||
Expected volatility | 24.12% | * | 38.8% | ||
Expected dividend yield | —% | * | —% | ||
Weighted average fair value of options granted | $67.90 | * | $19.18 | ||
Common Stock Reserved for Issuance
As of July 31, 2018 and 2017, the Company was authorized to issue 500,000,000 shares of common stock with a par value of $0.0001 per share and, of these, 80,611,698 and 75,007,625 shares of common stock were issued and outstanding, respectively. As of July 31, 2018 and 2017, the Company had reserved shares of common stock for future issuance as follows:
July 31, 2018 | July 31, 2017 | ||||
Exercise of stock options to purchase common stock | 537,064 | 555,636 | |||
Vesting of restricted stock units | 2,932,155 | 2,634,085 | |||
Shares available for grant under stock plans | 21,592,494 | 18,453,674 | |||
Total common stock reserved for issuance | 25,061,713 | 21,643,395 | |||
9. Income Taxes
On December 22, 2017, the Tax Act was enacted into law which changed U.S. tax law, including, but not limited to: (1) reducing the U.S. Federal corporate income tax rate from 35% to 21%; (2) requiring companies to pay a one-time transition tax on certain unrepatriated earnings of foreign subsidiaries; (3) generally eliminating U.S. Federal corporate income taxes on dividends from foreign subsidiaries; (4) capitalizing R&D expenses which are amortized over five to 15 years; and (5) other changes to how foreign and domestic earnings are taxed.
As a result of the Company’s fiscal year being a non-calendar year, the lower U.S. statutory Federal income tax rate resulted in a blended U.S. Federal statutory rate of 26.9% for the Company’s fiscal year 2018. For the year ended July 31, 2018, the Company recognized provisional effects from the Tax Act, which include remeasurements of U.S. deferred tax assets and liabilities based on the rates at which they are expected to reverse and recorded a net charge of $35.0 million on Federal net deferred tax assets. In addition, as a result of changes in tax law under the Tax Act, the Company recorded a benefit of $6.1 million related to the change of valuation allowance against certain deferred tax assets that are more likely than not to be realized. The Company concluded that no tax will be due related to the one-time transition tax on the deemed repatriation of deferred foreign income.
84
The Tax Act includes a provision to tax global intangible low-taxed income (“GILTI”) of foreign subsidiaries and a base erosion abuse tax measure that taxes certain payments between a U.S. corporation and its foreign subsidiaries. These provisions of the Tax Act will be effective for the Company beginning August 1, 2018. Under U.S. GAAP, the Company can make an accounting policy election to either treat taxes due on the GILTI inclusion as a current period expense or factor such amounts into our measurement of deferred taxes. The Company has elected the current period expense method. The SEC staff issued Staff Accounting Bulletin No. 118 which provides for a measurement period of up to one year after the enactment date of the Tax Act to finalize the related income tax impacts. The Company expects to complete the accounting for the Tax Act during this measurement period.
The Company’s income before provision for income taxes for the years ended July 31, 2018, 2017 and 2016 is as follows:
Fiscal years ended July 31, | |||||||||||
2018 | 2017 | 2016 | |||||||||
(in thousands) | |||||||||||
Domestic | $ | (5,207 | ) | $ | 26,474 | $ | 11,209 | ||||
International | 5,225 | 6,803 | 9,573 | ||||||||
Income before provision for income taxes | $ | 18 | $ | 33,277 | $ | 20,782 | |||||
The provision for income taxes consisted of the following:
Fiscal years ended July 31, | |||||||||||
2018 | 2017 | 2016 | |||||||||
(in thousands) | |||||||||||
Current: | |||||||||||
U.S. Federal | $ | 2,047 | $ | 7,793 | $ | 4,936 | |||||
State | 249 | 1,974 | 1,006 | ||||||||
Foreign | 2,203 | 3,595 | 4,350 | ||||||||
Total current | 4,499 | 13,362 | 10,292 | ||||||||
Deferred: | |||||||||||
U.S. Federal | 16,820 | (686 | ) | (4,867 | ) | ||||||
State | (1,328 | ) | (429 | ) | 631 | ||||||
Foreign | (308 | ) | (194 | ) | (250 | ) | |||||
Total deferred | 15,184 | (1,309 | ) | (4,486 | ) | ||||||
Total provision for income taxes | $ | 19,683 | $ | 12,053 | $ | 5,806 | |||||
Differences between income taxes calculated using the statutory Federal income tax rate of 26.9% in the fiscal year ended July 31, 2018 and 35% in the fiscal years ended July 31, 2017 and 2016 and the provision for income taxes are as follows:
Fiscal years ended July 31, | |||||||||||
2018 | 2017 | 2016 | |||||||||
(in thousands) | |||||||||||
Statutory Federal income tax | $ | 5 | $ | 11,647 | $ | 7,274 | |||||
State taxes, net of Federal benefit | (859 | ) | 900 | 1,261 | |||||||
Share-based compensation | (8,715 | ) | 2,517 | 2,670 | |||||||
Non-deductible officers' compensation | 3,229 | 959 | — | ||||||||
Foreign income taxed at different rates | 1,022 | (819 | ) | (1,190 | ) | ||||||
Research tax credits | (5,822 | ) | (2,377 | ) | (3,827 | ) | |||||
Re-measurement of U.S. deferred taxes | 34,979 | — | — | ||||||||
Non-deductible acquisition costs | 1,270 | 270 | 354 | ||||||||
Domestic production activity deduction | — | (1,514 | ) | (1,189 | ) | ||||||
Permanent differences and others | 666 | 470 | 453 | ||||||||
Change in valuation allowance | (6,092 | ) | — | — | |||||||
Total provision for income taxes | $ | 19,683 | $ | 12,053 | $ | 5,806 | |||||
85
The tax effects of temporary differences that gave rise to significant portions of deferred tax assets and liabilities are as follows:
As of July 31, | |||||||
2018 | 2017 | ||||||
(in thousands) | |||||||
Accruals and reserves | $ | 12,129 | $ | 11,612 | |||
Stock-based compensation | 7,658 | 8,519 | |||||
Deferred revenue | 3,688 | 3,848 | |||||
Property and equipment | 1,268 | 1,189 | |||||
Net operating loss carryforwards | 53,885 | 16,720 | |||||
Tax credits | 60,450 | 11,919 | |||||
Total deferred tax assets | 139,078 | 53,807 | |||||
Less valuation allowance | 28,310 | 12,583 | |||||
Net deferred tax assets | 110,768 | 41,224 | |||||
Less deferred tax liabilities: | |||||||
Intangible assets | 11,461 | 3,794 | |||||
Convertible debt | 11,567 | — | |||||
Unremitted foreign earnings | 258 | — | |||||
Total deferred tax liabilities | 23,286 | 3,794 | |||||
Deferred tax assets, net | 87,482 | 37,430 | |||||
Less foreign deferred revenue | 69 | — | |||||
Total net deferred tax assets | $ | 87,413 | $ | 37,430 | |||
The Company adopted ASU 2016-09 effective August 1, 2017 and recorded $85.7 million of deferred tax assets related to excess tax benefits from share-based award activity as of July 31, 2017, which was offset by an increase to the valuation allowance of $0.6 million.
As a result of the Company’s convertible note offering in March 2018, the Company recorded a net deferred tax liability (“DTL”) of $11.7 million. The initial DTL was recorded as a reduction to additional paid in capital.
The Company considered both positive and negative evidence, including future reversals of existing taxable temporary differences, projected future taxable income, tax planning strategies, historic book profit/loss, prior taxable income/loss, and results of future operations, and determined that a valuation allowance was not required for a significant portion of its deferred tax assets. A valuation allowance of $28.3 million and $12.6 million remained as of July 31, 2018 and 2017, respectively. The increase of $15.7 million in valuation allowances in the current year relate primarily to net operating losses and income tax credits incurred in certain tax jurisdictions for which no tax benefit was recognized.
As of July 31, 2018, the Company had U. S. Federal, California and other states net operating loss (“NOL”) carryforwards of $207.0 million, $66.2 million, and $105.7 million, respectively. The U. S. Federal and California NOL carryforwards will start to expire in 2027 and 2019, respectively.
As of July 31, 2018, the Company had research and development tax credit (“R&D credit”) carryforwards of the following (in thousands):
U.S. Federal | $ | 33,074 | ||
California | 28,531 | |||
Total R&D credit carryforwards | $ | 61,605 | ||
The U.S. Federal R&D credit will start to expire in 2023. California R&D tax credits have no expiration.
Federal and California laws impose restrictions on the utilization of net operating loss carryforwards and R&D credit carryforwards in the event of a change in ownership of the Company, which constitutes an “ownership change” as defined by Internal Revenue Code Sections 382 and 383. The Company experienced an ownership change in the past that does not materially impact the availability of its net operating losses and tax credits. However, should there be an ownership change in the future, the Company’s ability to utilize existing carryforwards could be substantially restricted.
86
The Company provides U.S. income taxes on the earnings of foreign subsidiaries, unless the subsidiaries’ earnings are considered indefinitely reinvested outside the United States. As of July 31, 2018, the Company has recorded a provisional estimate for U.S. income taxes on undistributed earnings from foreign subsidiaries of $0.3 million. The Company may repatriate foreign earnings that have been taxed in the United States in the future to the extent that the repatriation is not restricted by local laws or there are no substantial incremental costs associated with such repatriation.
Unrecognized Tax Benefits
Activity related to unrecognized tax benefits is as follows:
Fiscal years ended July 31, | |||||||||||
2018 | 2017 | 2016 | |||||||||
(in thousands) | |||||||||||
Unrecognized tax benefit - beginning of period | $ | 9,346 | $ | 7,687 | $ | 6,109 | |||||
Gross increases - prior period tax positions | 729 | 712 | 177 | ||||||||
Gross decreases - prior period tax positions | (878 | ) | (691 | ) | (216 | ) | |||||
Gross increases - current period tax positions | 1,124 | 1,638 | 1,617 | ||||||||
Unrecognized tax benefit - end of period | $ | 10,321 | $ | 9,346 | $ | 7,687 | |||||
During the year ended July 31, 2018, the Company’s unrecognized tax benefits increased by $1.0 million, primarily associated with the Company’s U.S. Federal and California R&D tax credits. As of July 31, 2018, the Company had unrecognized tax benefits of $5.4 million that, if recognized, would affect the Company’s effective tax rate. An estimate of the range of possible change within the next 12 months cannot be made at this time.
The Company or one of its subsidiaries files income taxes in the U.S. Federal jurisdiction and various state and foreign jurisdictions. If the Company utilizes net operating losses or tax credits in future years, the U.S. Federal, state and local, and non-U.S. tax authorities may examine the tax returns covering the period in which the net operating losses and tax credits arose. As a result, the Company’s tax returns in the U.S. and California remain open to examination from fiscal years 2002 through 2018. As of July 31, 2018, the Company has no income tax audits in progress in the U.S. or foreign jurisdictions.
10. Defined Contribution and Other Post-retirement Plans
The Company’s employee savings and retirement plan in the United States is qualified under Section 401(k) of the Internal Revenue Code. Employees on the Company’s U.S. payroll are automatically enrolled when they meet eligibility requirements, unless they decline participation. Upon enrollment employees are provided with tax-deferred salary deductions and various investment options. Employees may contribute up to 60% of their eligible salary up to the statutory prescribed annual limit. The Company matches employees’ contributions up to $5,000 per participant per calendar year. Certain of the Company’s foreign subsidiaries also have defined contribution plans in which a majority of its employees participate and the Company makes matching contributions. The Company’s contributions to its 401(k) and foreign subsidiaries’ plans were $8.7 million, $7.1 million and $5.5 million for the fiscal years ended July 31, 2018, 2017 and 2016, respectively.
11. Segment Information
The Company operates in one segment. The Company’s chief operating decision maker (the “CODM”), its Chief Executive Officer, manages the Company’s operations on a consolidated basis for purposes of allocating resources. When evaluating the Company’s financial performance, the CODM reviews separate revenue information for the Company’s license, maintenance and professional services offerings, while all other financial information is reviewed on a consolidated basis. All of the Company’s principal operations and decision-making functions are located in the United States.
87
Revenue by country and region based on the billing address of the customer is as follows:
Fiscal years ended July 31, | |||||||||||
2018 | 2017 | 2016 | |||||||||
(in thousands) | |||||||||||
United States | $ | 416,961 | $ | 301,155 | $ | 230,935 | |||||
Canada | 45,591 | 50,981 | 44,717 | ||||||||
Other Americas | 20,571 | 19,447 | 18,114 | ||||||||
Total Americas | 483,123 | 371,583 | 293,766 | ||||||||
United Kingdom | 36,653 | 32,554 | 34,031 | ||||||||
Other EMEA | 79,197 | 48,727 | 41,914 | ||||||||
Total EMEA | 115,850 | 81,281 | 75,945 | ||||||||
Total APAC | 62,094 | 61,420 | 54,735 | ||||||||
Total revenue | $ | 661,067 | $ | 514,284 | $ | 424,446 | |||||
No country other than those listed above accounted for more than 10% of revenue during the years ended July 31, 2018, 2017 and 2016.
The Company’s long-lived assets, including goodwill and intangibles, net by geographic region are as follows:
July 31, 2018 | July 31, 2017 | ||||||
(in thousands) | |||||||
Americas | $ | 449,588 | $ | 224,667 | |||
EMEA | 5,491 | 2,747 | |||||
APAC | 47 | 128 | |||||
Total | $ | 455,126 | $ | 227,542 | |||
88
Item 9. | Changes in and Disagreements with Accountant on Accounting and Financial Disclosure |
None.
Item 9A. | Controls and Procedures |
Evaluation of Disclosure Controls and Procedures
Our management, with the participation of our principal executive officer and principal financial officer, has evaluated the effectiveness of our disclosure controls and procedures (as defined in Rules 13a- 15(e) and 15d- 15(e) under the Securities Exchange Act of 1934, as amended (the “Exchange Act”)), as of the end of the period covered by this Annual Report on Form 10-K. Based on such evaluation, our principal executive officer and principal financial officer have concluded that as of such date, our disclosure controls and procedures were effective.
Management’s Annual Report on Internal Control Over Financial Reporting
Our management is responsible for establishing and maintaining adequate internal control over our financial reporting as defined in Rule 13a-15(f) or 15d-15(f) of the Exchange Act. Internal control over financial reporting is a process designed to provide reasonable assurance regarding the reliability of financial reporting and the preparation of financial statements for external purposes in accordance with generally accepted accounting principles, and includes those policies and procedures that: (i) pertain to the maintenance of records that, in reasonable detail, accurately and fairly reflect the transactions and dispositions of our assets; (ii) provide reasonable assurance that transactions are recorded as necessary to permit preparation of financial statements in accordance with generally accepted accounting principles, and that our receipts and expenditures are being made only in accordance with authorizations of our management and directors; and (iii) provide reasonable assurance regarding prevention or timely detection of unauthorized acquisition, use or disposition of our assets that could have a material effect on our financial statements.
Because of its inherent limitations, internal control over financial reporting may not prevent or detect misstatements. Also, projections of any evaluation of effectiveness to future periods are subject to the risk that controls may become inadequate because of changes in conditions, or that the degree of compliance with the policies or procedures may deteriorate.
Our management assessed the effectiveness of our internal control over financial reporting as of July 31, 2018, using the criteria set forth in Internal Control—Integrated Framework issued by the Committee of Sponsoring Organizations of the Treadway Commission’s 2013 framework. Based on this assessment and those criteria, management concluded that our internal control over financial reporting was effective as of July 31, 2018.
Our internal control over financial reporting has been audited by KPMG LLP, an independent registered public accounting firm, as stated in their report, which appears in Part II, Item 8 of this Form 10-K.
Inherent Limitations of Internal Controls
Our management, including our Chief Executive Officer and Chief Financial Officer, does not expect that our disclosure controls and procedures or our internal controls will prevent all errors and all fraud. A control system, no matter how well conceived and operated, can provide only reasonable, not absolute, assurance that the objectives of the control system are met. Because of the inherent limitations in all control systems, no evaluation of controls can provide absolute assurance that all control issues and instances of fraud, if any, within the Company have been detected. These inherent limitations include the realities that judgments in decision-making can be faulty, and that breakdowns can occur because of a simple error or mistake. Additionally, controls can be circumvented by the individual acts of some persons, by collusion of two or more people, or by management override of the control. The design of any system of controls also is based in part upon certain assumptions about the likelihood of future events, and there can be no assurance that any design will succeed in achieving its stated goals under all potential future conditions. Over time, controls may become inadequate because of changes in conditions, or the degree of compliance with the policies or procedures may deteriorate. Because of the inherent limitations in a cost-effective control system, misstatements due to error or fraud may occur and not be detected.
Changes in Internal Control over Financial Reporting
We implemented a new global finance Enterprise Resource Planning (“ERP”) system, during the second quarter of our 2018 fiscal year for the purpose of our corporate operations including general ledger, procurement, payment and reporting functions. We expect to implement modules for our order management and revenue recognition functions by the end of the first
89
quarter of our fiscal year 2019. Our new ERP system is intended to provide us with enhanced transactional processing and management tools compared to our legacy system and to enhance internal control over financial reporting. We have taken the necessary steps to monitor and maintain appropriate internal control over financial reporting during this period of system change and will continue that through the implementation of remaining modules. Additionally, we will continue to evaluate the operating effectiveness of related controls during subsequent periods.
There were no changes in our internal control over financial reporting, other than the implementation of a new ERP system, identified in management’s evaluation pursuant to Rules 13a-15(d) or 15d-15(d) of the Exchange Act in our fiscal year 2018 that materially affected, or are reasonably likely to materially affect, our internal control over financial reporting.
Item 9B. | Other Information |
None.
90
PART III
Item 10. | Directors, Executive Officers and Corporate Governance |
We have adopted a Code of Business Conduct and Ethics that applies to all of our directors, officers and employees, including our principal executive officer and principal financial officer. The Code of Business Conduct and Ethics is posted on our investor relations website.
We will post any amendments to, or waivers from, a provision of this Code of Business Conduct and Ethics by posting such information on our investor relations website.
The other information required by this item will be contained in our definitive proxy statement to be filed with the Securities and Exchange Commission in connection with our 2018 annual meeting of stockholders (the “Proxy Statement”), which is expected to be filed not later than 120 days after the end of our fiscal year ended July 31, 2018, and is incorporated in this report by reference.
Item 11. | Executive Compensation |
The information required by this item will be set forth in the Proxy Statement and is incorporated herein by reference.
Item 12. | Security Ownership of Certain Beneficial Owners and Management and Related Stockholder Matters |
The information required by this item will be set forth in the Proxy Statement and is incorporated herein by reference.
Item 13. | Certain Relationships and Related Transactions, and Director Independence |
The information, if any, required by this item will be set forth in the Proxy Statement and is incorporated herein by reference.
Item 14. | Principal Accountant Fees and Services |
The information required by this item will be set forth in the Proxy Statement and is incorporated herein by reference.
91
PART IV
Item 15. | Exhibits and Financial Statement Schedules |
(a) The following documents are filed as part of this report:
1. Consolidated Financial Statements
See Index to Consolidated Financial Statements at Item 8 herein.
2. Financial Statement Schedules
Schedules have been omitted because the information required to be set forth therein is not applicable or is shown in the financial statements or notes herein.
3. Exhibits
See the Exhibit Index immediately following the signature page of this Annual Report on Form 10-K.
92
Signatures
Pursuant to the requirements of Section 13 or 15(d) of the Securities Exchange Act of 1934, the registrant has duly caused this report to be signed on its behalf by the undersigned, thereunto duly authorized.
Date: September 18, 2018
GUIDEWIRE SOFTWARE, INC. | ||
By: | /s/ Curtis Smith | |
Curtis Smith | ||
Chief Financial Officer (Principal Financial and Accounting Officer) | ||
POWER OF ATTORNEY
Each person whose individual signature appears below hereby authorizes and appoints Marcus S. Ryu, Curtis Smith, and Winston King, and each of them, with full power of substitution and resubstitution and full power to act without the other, as his or her true and lawful attorney-in-fact and agent to act in his or her name, place and stead and to execute in the name and on behalf of each person, individually and in each capacity stated below, and to file any and all amendments to this Annual Report on Form 10-K, and to file the same, with all exhibits thereto, and other documents in connection therewith, with the Securities and Exchange Commission, granting unto said attorneys-in-fact and agents, and each of them, full power and authority to do and perform each and every act and thing, ratifying and confirming all that said attorneys-in-fact and agents or any of them or their or his substitute or substitutes may lawfully do or cause to be done by virtue thereof.
Pursuant to the requirements of the Securities Exchange Act of 1934, this report has been signed below by the following persons on behalf of the registrant and in the capacities and on the dates indicated.
Signature | Title | Date | ||
/s/ Marcus S. Ryu | President, Chief Executive Officer and Director (Principal Executive Officer) | September 18, 2018 | ||
Marcus S. Ryu | ||||
/s/ Curtis Smith | Chief Financial Officer (Principal Financial and Accounting Officer) | September 18, 2018 | ||
Curtis Smith | ||||
/s/ Peter Gassner | Director (Chairman of the Board) | September 18, 2018 | ||
Peter Gassner | ||||
/s/ Andrew Brown | Director | September 18, 2018 | ||
Andrew Brown | ||||
/s/ Craig Conway | Director | September 18, 2018 | ||
Craig Conway | ||||
/s/ Guy Dubois | Director | September 18, 2018 | ||
Guy Dubois | ||||
/s/ Paul Lavin | Director | September 18, 2018 | ||
Paul Lavin | ||||
/s/ Clifton Thomas Weatherford | Director | September 18, 2018 | ||
Clifton Thomas Weatherford | ||||
93
EXHIBIT INDEX
The exhibits listed below are filed or incorporated by reference as part of this Annual Report on Form 10-K.
Exhibit Number | Description | Incorporated by Reference From Form | Incorporated by Reference From Exhibit Number | Date Filed | |||||
Agreement and Plan of Reorganization, by and among Guidewire Software, Inc., Cyence Inc., Caesar Acquisition Sub I, Inc., Caesar Acquisition Sub II, LLC and Shareholder Representative Services LLC dated October 5, 2017. | 8-K | 2.1 | November 2, 2017 | ||||||
Amended and Restated Certificate of Incorporation. | 10-Q | 3.1 | March 14, 2012 | ||||||
Amended and Restated Bylaws. | 8-K | 3.1 | December 5, 2016 | ||||||
Form of Common Stock certificate of the Registrant. | S-1/A | 4.1 | January 9, 2012 | ||||||
Indenture, dated as of March 13, 2018, by and between Guidewire Software, Inc. and U.S. Bank National Association. | 8-K | 4.1 | March 13, 2018 | ||||||
First Supplemental Indenture, dated as of March 13, 2018, by and between Guidewire Software, Inc. and U.S. Bank National Association. | 8-K | 4.2 | March 13, 2018 | ||||||
Form of 1.25% Convertible Senior Note Due March 15, 2025. | 8-K | 4.3 | March 13, 2018 | ||||||
Form of Indemnification Agreement between the Registrant and each of its directors and executive officers. | S-1/A | 10.1 | October 28, 2011 | ||||||
2006 Stock Plan and forms of agreements thereunder. | S-1 | 10.2 | September 2, 2011 | ||||||
2009 Stock Plan and forms of agreements thereunder. | S-1 | 10.3 | September 2, 2011 | ||||||
2010 Restricted Stock Unit Plan and forms of agreements thereunder. | S-1 | 10.4 | September 2, 2011 | ||||||
2011 Stock Plan and forms of agreements thereunder. | S-1/A | 10.5 | December 13, 2011 | ||||||
Form of Executive Agreement. | 10-K | 10.6 | September 17, 2014 | ||||||
Senior Executive Incentive Bonus Plan. | S-1/A | 10.12 | December 13, 2011 | ||||||
Lease Agreement between Parkside Towers, L.P. and the Registrant dated as of December 5, 2011. | S-1/A | 10.13 | December 13, 2011 | ||||||
Form of Performance-Based Restricted Stock Unit Award Agreement under the 2011 Stock Plan. | 10-Q | 10.9 | December 2, 2015 | ||||||
Form of Capped Call Confirmation. | 8-K | 10.1 | March 13, 2018 | ||||||
Lease Agreement between Bay Meadows Station 2 Investors, LLC and the Registrant dated as of December 18, 2017. | Filed herewith | — | — | ||||||
Statement Regarding the Computation of Ratio of Earnings to Fixed Charges for the Years Ended July 31, 2013, 2014, 2015, 2016 and 2017, and the Six Months Ended January 31, 2018. | S-3 | 12.1 | March 7, 2018 | ||||||
Subsidiaries of the Registrant. | Filed herewith | — | — | ||||||
94
Consent of KPMG LLP, Independent Registered Public Accounting Firm. | Filed herewith | — | — | ||||||
Certification of the Chief Executive Officer pursuant to Section 302 of the Sarbanes-Oxley Act. | Filed herewith | — | — | ||||||
Certification of the Chief Financial Officer pursuant to Section 302 of the Sarbanes-Oxley Act. | Filed herewith | — | — | ||||||
Certification of the Chief Executive Officer and the Chief Financial Officer pursuant to Section 906 of the Sarbanes-Oxley Act. | Furnished herewith | — | — | ||||||
101.INS | XBRL Instance Document. | Filed herewith | — | — | |||||
101.SCH | XBRL Taxonomy Extension Schema Document. | Filed herewith | — | — | |||||
101.CAL | XBRL Taxonomy Extension Calculation Linkbase Document. | Filed herewith | — | — | |||||
101.DEF | XBRL Taxonomy Extension Definition Linkbase Document. | Filed herewith | — | — | |||||
101.LAB | XBRL Taxonomy Extension Label Linkbase Document. | Filed herewith | — | — | |||||
101.PRE | XBRL Taxonomy Extension Presentation Linkbase Document. | Filed herewith | — | — | |||||
* | The certifications furnished in Exhibit 32.1 hereto are deemed to accompany this Annual Report on Form 10-K and will not be deemed “filed” for purposes of Section 18 of the Securities Exchange Act of 1934, as amended. Such certifications will not be deemed to be incorporated by reference into any filings under the Securities Act of 1933, as amended, or the Securities Exchange Act of 1934, as amended, except to the extent that the registrant specifically incorporates it by reference. |
95