Attached files
| file | filename |
|---|---|
| 8-K - 8-K - WABASH NATIONAL Corp | tv502888_8k.htm |
Exhibit 99.1

WABASH NATIONAL CORPORATION Investor Update September 2018

2 This presentation contains certain forward - looking statements, as defined by the Private Securities Litigation Reform Act of 1995. All statements other than historical facts are forward - looking statements, including without limit, those regarding shipment outlook, Operating EBITDA, backlog, demand level expectations, profitability and earnings capacity, margin opportunities, and potential benefits of any recent acquisitions. Any forward - looking statements are subject to certain risks and uncertainties that could cause actual results to differ materially from those implied by the forward - looking statements. Without limit, these risks and uncertainties include economic conditions, increased competition, dependence on new management, reliance on certain customers and corporate partnerships, shortages and costs of raw materials, manufacturing capacity and cost containment risks, dependence on industry trends, access to capital, acceptance of products, and government regulation. You should review and consider the various disclosures made by the Company in this presentation and in its reports to its stockholders and periodic reports on Forms 10 - K and 10 - Q. We cannot give assurance that the expectations reflected in our forward - looking statements will prove to be correct. Our actual results could differ materially from those anticipated in these forward - looking statements. All written and oral forward - looking statements attributable to us are expressly qualified in their entirety by the factors we disclose that could cause our actual results to differ materially from our expectations. S AFE H ARBOR S TATEMENT © 2018 Wabash National, L.P. All rights reserved. Wabash®, Wabash National®, Beall®, Benson®, Brenner® Tank, Bulk Tank International, DuraPlate ®, Extract Technology®, Garsite , Progress Tank, Supreme®, Transcraft ®, Walker Engineered Products, and Walker Transport are marks owned by Wabash National Corporation.

3 ▪ Earnings up over 45% since 2012 (Adjusted EPS $0.95/ sh in 2012 to $1.38/ sh in 2017) ▪ Free cash flow focused; $144M in Operating Cash Flow in 2017 ▪ $288M of liquidity or 14% of revenue as of 6/30/2018 ▪ 2.0x net debt leverage as of 6/30/2018 F INANCIAL H IGHLIGHTS Disciplined Balance Sheet Management Margin Expansion Strong Earnings & Cash Generation Balanced Capital Allocation ▪ $223M of shares repurchased since 2015 ▪ Over $260M of debt repayments since 2012 ▪ Quarterly dividend increased by 25% to $0.075/ sh for 2018 ▪ Approximately $40M of CapEx planned for 2018 Strong, Disciplined Financial Performance 2005 2016 2017 TTM Q2 2018 Gross Profit 11.1% 17.6% 14.8% 13.7% Operating Margin 6.6% 11.0% 8.3 * % 7.2 * % *Excluding acquisition related expenses

4 W ABASH N ATIONAL C ORPORATION Separate “Final Mile” Segment Increases Focus, Expands Reach Leading Brands in Diverse End Markets and Industries ▪ Dry and Refrigerated Van Trailers ▪ Platform Trailers ▪ Fleet Used Trailers ▪ Aftermarket Parts and Service ▪ Tank Trailers and Truck - Mounted Tanks ▪ Composite Panels and Products ▪ Food, Dairy and Beverage Equipment ▪ Containment and Aseptic Systems ▪ Aircraft Refueling Equipment ▪ Truck - Mounted Dry Bodies ▪ Truck - Mounted Refrigerated Bodies ▪ Service Bodies ▪ FRP Panel Sales ▪ Stake Bodies Commercial Trailer Products 2017 Sales: $1.3B Proforma 2017: $307M Q4 2017 Sales: $70M 2017 Sales: $361M Diversified Products Final Mile Products

5 O UR I DENTITY I S S HIFTING F ROM P RIMARILY A D RY V AN M ANUFACTURER We are a diversified industrial manufacturer that is less dependent on dry vans 2007 $1.1B Dry Vans Dry Van Trailers Other Specialty Trailers Non - Trailer Products Growing, Diversified Revenue Lowers Overall % of Dry Vans 2020 Dry Vans Non - Trailer Other Trailer Types 69% 26% 5% Reefers Platforms Parts & Service 2017 $1.8B Dry Vans 60% 22% 18% Reefers Platforms Tank Trailers MSC Trailers Truck Bodies Composite Products Process Systems Parts & Service
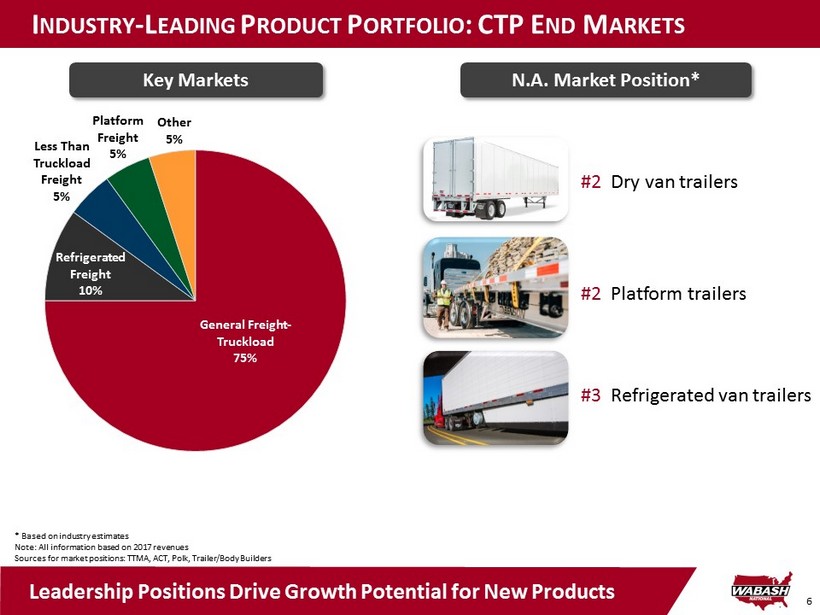
6 I NDUSTRY - L EADING P RODUCT P ORTFOLIO : CTP E ND M ARKETS * Based on industry estimates Note: All information based on 2017 revenues Sources for market positions: TTMA, ACT, Polk, Trailer/Body Builders Leadership Positions Drive Growth Potential for New Products Key Markets N.A. Market Position* General Freight - Truckload 75% Refrigerated Freight 10% Less Than Truckload Freight 5% Platform Freight 5% Other 5% #2 Dry van trailers #2 Platform trailers #3 Refrigerated van trailers

7 Food, Dairy, Beverage 31% Chemical 18% General Freight 16% Refined Fuel/O&G 8% Pharmaceutical 7% Aviation 6% Aerodynamic Devices 4% Defense, Parts & Other 10% I NDUSTRY - L EADING P RODUCT P ORTFOLIO : DPG E ND M ARKETS Leadership Positions Drive Growth Potential for New Products * Based on industry and management estimates Note: All information based on 2017 revenues Sources for market positions: TTMA, ACT, Polk, Trailer/Body Builders #1 Stainless steel liquid tank trailers Key Markets #1 Isolators and downflow booths worldwide N.A. Market Position*
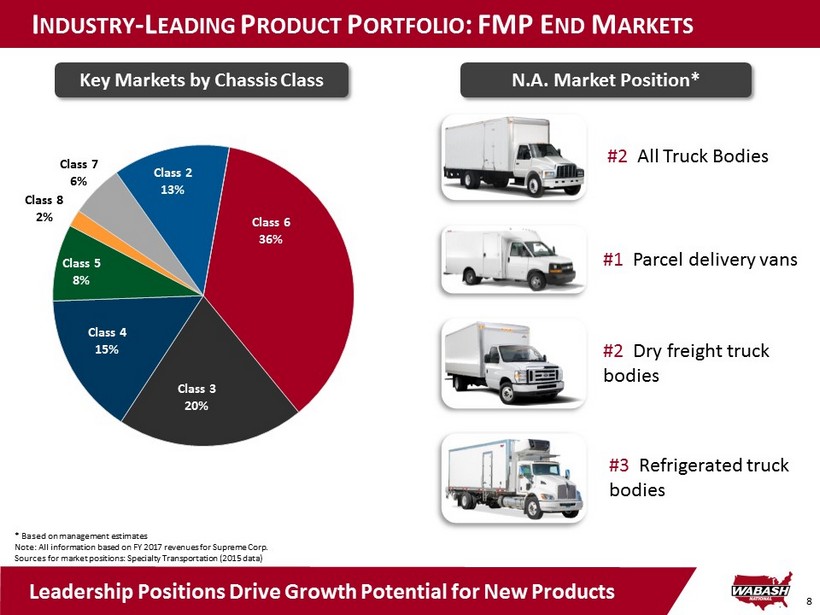
8 I NDUSTRY - L EADING P RODUCT P ORTFOLIO : FMP E ND M ARKETS Leadership Positions Drive Growth Potential for New Products * Based on management estimates Note: All information based on FY 2017 revenues for Supreme Corp. Sources for market positions: Specialty Transportation (2015 data) Key Markets by Chassis Class N.A. Market Position* #2 All Truck Bodies #1 Parcel delivery vans #2 Dry freight truck bodies #3 Refrigerated truck bodies Class 6 36% Class 3 20% Class 4 15% Class 5 8% Class 8 2% Class 7 6% Class 2 13%
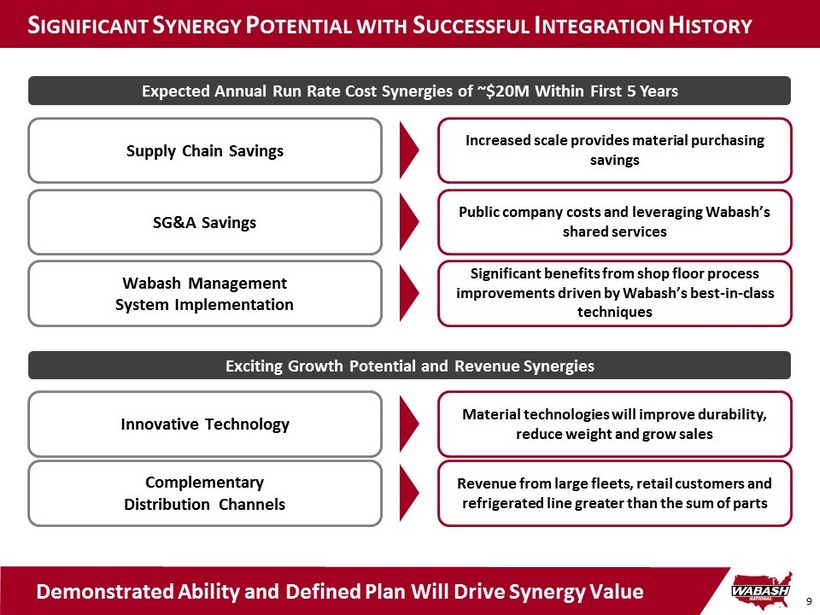
9 S IGNIFICANT S YNERGY P OTENTIAL WITH S UCCESSFUL I NTEGRATION H ISTORY Expected Annual Run Rate Cost Synergies of ~$20M Within First 5 Years Supply Chain Savings Increased scale provides material purchasing savings SG&A Savings Public company costs and leveraging Wabash’s shared services Wabash Management System Implementation Significant benefits from shop floor process improvements driven by Wabash’s best - in - class techniques Exciting Growth Potential and Revenue Synergies Complementary Distribution Channels Revenue from large fleets, retail customers and refrigerated line greater than the sum of parts Innovative Technology Material technologies will improve durability, reduce weight and grow sales Demonstrated Ability and Defined Plan Will Drive Synergy Value

10 I NNOVATIVE T ECHNOLOGY ▪ New material technologies will improve durability, reduce weight and grow sales ▪ Over 200 patents and patent applications in the U.S. and globally Our Technology Sets Us Apart from Other OEMs Honeycomb Core ▪ Exclusive license to continuous honeycomb process technology for the containment and transportation industries in North America ▪ Lighter weight composite panels drive growth in current and new applications Molded Structural Composites (MSC) ▪ Improves thermal efficiency up to 25% & reduces weight as much as 15% in truck body application ▪ Opened 600,000 sq. ft. facility in Little Falls, MN, as the launch facility for MSC products in April 2017 ▪ Since 2017, we have invested over $9M in Little Falls purchase and development of the facility Cell Core ▪ Patented technology offers reduced weight DuraPlate panels for heavy - duty applications ▪ Significant reduction in plastic material consumption and overall cost Superior Advanced Materials

WABASH NATIONAL CORPORATION Growth Drivers & Market Dynamics

12 G ROWTH I NITIATIVES D RIVING R ECORD R ESULTS 2006: Transcraft Acquisition 2012/13: Walker Group and Beall Acquisition 2008: Wabash Composites Launch and Benson Acquisition 2015: Truck Bodies Launch 2017: Little Falls Facility Acquisition 2017: Supreme Industries, Inc. Acquisition Growing, Diversified Revenue Lowers Overall % of Dry Vans Key Highlights Growing, Diversified Revenue Lowers Overall % of Dry Vans All Other Products Dry Vans 2005 2017 2018 Consolidated Revenue 2005 vs. 2017 & 2018 $1.8B $1.2B 77% of total Revenue 60% of total Revenue D ry Vans $1.0B D ry Vans $1.1B D ry Vans <60% of total Revenue ~$2.3B
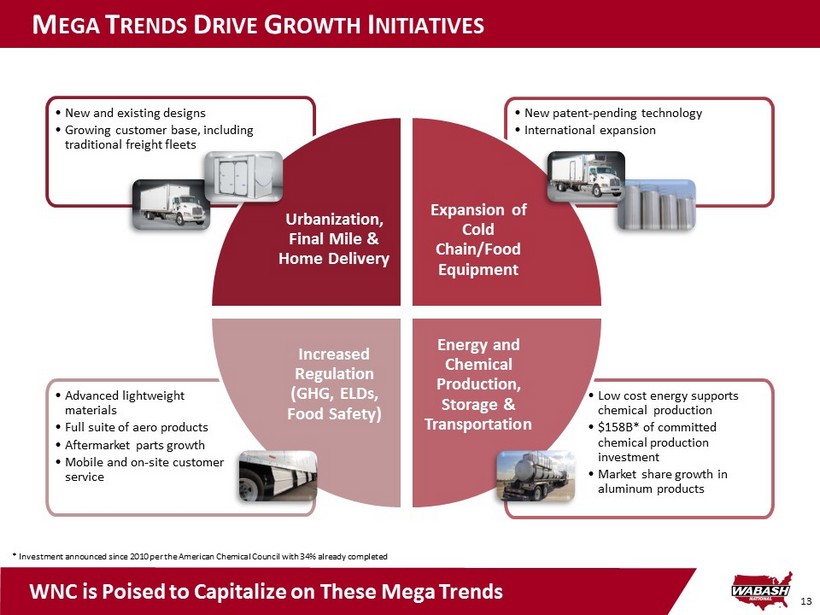
13 M EGA T RENDS D RIVE G ROWTH I NITIATIVES * Investment announced since 2010 per the American Chemical Council with 34% already completed WNC is Poised to Capitalize on These Mega Trends • Low cost energy supports chemical production • $158B* of committed chemical production investment • Market share growth in aluminum products • Advanced lightweight materials • Full suite of aero products • Aftermarket parts growth • Mobile and on - site customer service • New patent - pending technology • International expansion • New and existing designs • Growing customer base, including traditional freight fleets Urbanization, Final Mile & Home Delivery Expansion of Cold Chain/Food Equipment Energy and Chemical Production, Storage & Transportation Increased Regulation (GHG, ELDs, Food Safety)

14 M ARKET D RIVERS : T RAILER P RODUCTS ▪ Strong demand above replacement levels forecast for next 4 years ▪ Fleet equipment dynamics and regulations key drivers of trailer demand Strong Demand Above Replacement Levels Trailer Demand Forecasts

15 M ARKET D RIVERS : F INAL M ILE P RODUCTS Final Mile Logistics and Distribution Models are Transforming Dollars in Billions $0.0 $0.5 $1.0 $1.5 $2.0 $2.5 2015 2016 2017F 2018F 2019F 2020F 2015 - 2020E CAGR 1.4% Curtainside 4.3% Reefer 9.9% Walk - In 3.2% Parcel Delivery 3.2% Dry Freight $1.7B $2.2B Megatrends Changing Distribution ▪ U.S. E - Commerce expected to grow from 9.6% of Total Retail Sales to 17% by 2022 ▪ Trends in home delivery and Cold Chain Logistics driving truck body demand ▪ Record truck body replacement demand since 2014 Truck Body Revenue Forecast U.S. Retail E - Commerce Sales 7.6% 8.2% 8.9% 10.0% 12.0% 13.0% 0.0% 2.0% 4.0% 6.0% 8.0% 10.0% 12.0% 14.0% $0 $100 $200 $300 $400 $500 $600 $700 $800 2016 2017E 2018E 2019E 2020E 2021E Dollars in Billions

WABASH NATIONAL CORPORATION Our Financial Outlook

17 F INANCIAL P ERFORMANCE Annual Revenue Annual Operating Income & Gross Margin $1,462 $1,636 $1,863 $2,027 $1,845 $1,767 $2,073 $0 $500 $1,000 $1,500 $2,000 $2,500 2012 2013 2014 2015 2016 2017 Q2 2018 (TTM) ($ mils) $70 $103 $122 $180 $203 $131 $134 11.2% 13.2% 12.5% 15.0% 17.6% 14.8% 13.7% 0% 5% 10% 15% 20% $0 $50 $100 $150 $200 $250 $300 2012 2013 2014 2015 2016 2017 Q2 2018 (TTM) ($ mils) $119 $150 $169 $230 $253 $189 $195 $0 $50 $100 $150 $200 $250 $300 2012 2013 2014 2015 2016 2017 Q2 2018 (TTM) ($ mils) Operating EBITDA (1) 1 See Appendix for reconciliation of non - GAAP financial information Liquidity (2) 2 Defined as cash on hand plus available borrowing capacity on our revolving credit facility $224 $254 $290 $348 $333 $361 $288 $0 $50 $100 $150 $200 $250 $300 $350 $400 2012 2013 2014 2015 2016 2017 Q2 2018 ($ mils) Our Strong Financial Position Allows for Flexibility
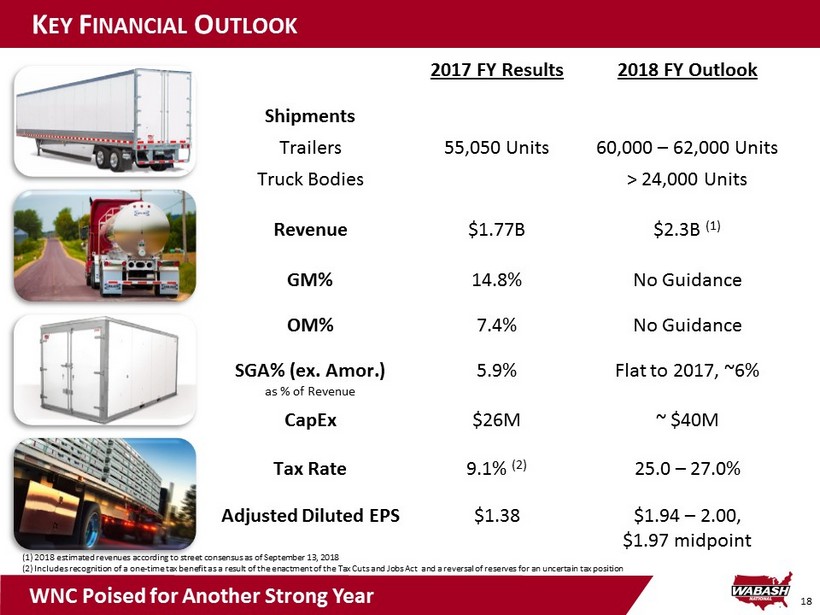
18 K EY F INANCIAL O UTLOOK 2017 FY Results 2018 FY Outlook Shipments Trailers Truck Bodies 55,050 Units 60,000 – 62,000 Units > 24,000 Units Revenue $1.77B $2.3B (1) GM% 14.8% No Guidance OM% 7.4% No Guidance SGA% (ex. Amor.) as % of Revenue 5.9% Flat to 2017, ~6% CapEx $26M ~ $40M Tax Rate 9.1% (2) 25.0 – 27.0% Adjusted Diluted EPS $1.38 $1.94 – 2.00, $1.97 midpoint WNC Poised for Another Strong Year (1) 2018 estimated revenues according to street consensus as of September 13, 2018 (2) Includes recognition of a one - time tax benefit as a result of the enactment of the Tax Cuts and Jobs Act and a reversal of reserves for an uncertain tax position
WABASH NATIONAL CORPORATION Appendix

20 2012 2013 2014 2015 2016 2017 Q2 2018 TTM Net sales 1,461,854$ 1,635,686$ 1,863,315$ 2,027,489$ 1,845,444$ 1,767,161$ 2,072,551$ Cost of sales 1,298,031 1,420,563 1,630,681 1,724,046 1,519,910 1,506,286 1,789,278 Gross profit 163,823$ 215,123$ 232,634$ 303,443$ 325,534$ 260,875$ 283,273$ % of sales 11.2% 13.2% 12.5% 15.0% 17.6% 14.8% 13.7% General and administrative expenses 44,751 58,666 61,694 73,495 74,129 77,825 91,276 % of sales 3.1% 3.6% 3.3% 3.6% 4.0% 4.4% 4.4% Selling expenses 23,589 30,597 26,676 27,233 27,270 25,588 30,419 % of sales 1.6% 1.9% 1.4% 1.3% 1.5% 1.4% 1.5% Amortization of intangibles 10,590 21,786 21,878 21,259 19,940 17,041 18,325 % of sales 0.7% 1.3% 1.2% 1.0% 1.1% 1.0% 0.9% Other operating expenses 14,409 883 - 1,087 1,663 9,605 9,673 % of sales 1.0% 0.1% 0.0% 0.1% 0.1% 0.5% 0.5% - - - Income from operations 70,484$ 103,191$ 122,386$ 180,369$ 202,532$ 130,816$ 133,580$ % of sales 4.8% 6.3% 6.6% 8.9% 11.0% 7.4% 6.4% Other income (expense) Interest expense (21,724) (26,308) (22,165) (19,548) (15,663) (16,400) (25,127) Other, net (97) 740 (1,759) 2,490 (1,452) 8,122 18,418 Income before income taxes 48,663$ 77,623$ 98,462$ 163,311$ 185,417$ 122,538$ 126,871$ Income tax (benefit) expense (56,968) 31,094 37,532 59,022 65,984 11,116 5,393 Net income 105,631$ 46,529$ 60,930$ 104,289$ 119,433$ 111,422$ 121,478$ Diluted net income per share 1.53$ 0.67$ 0.85$ 1.50$ 1.82$ 1.78$ 1.99$ C ONSOLIDATED I NCOME S TATEMENT ($ in thousands, except per share amounts)
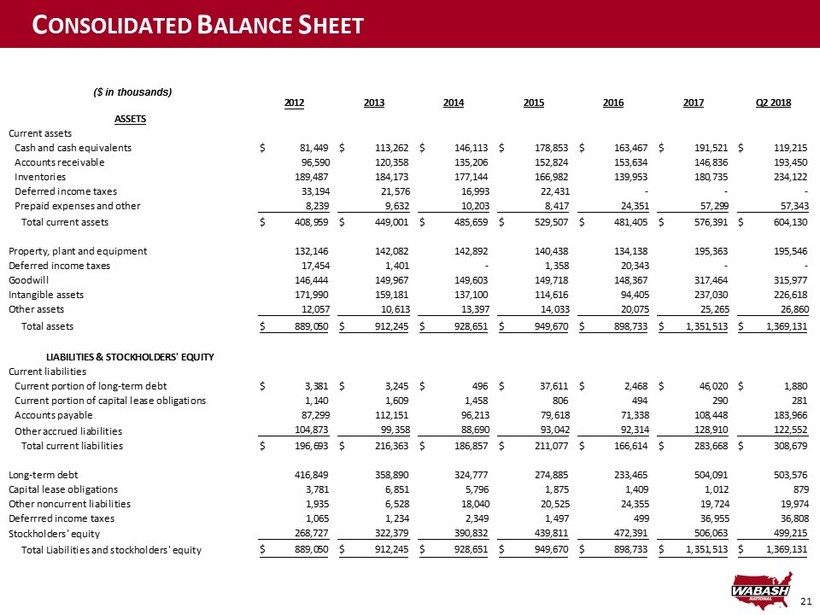
21 2012 2013 2014 2015 2016 2017 Q2 2018 ASSETS Current assets Cash and cash equivalents 81,449$ 113,262$ 146,113$ 178,853$ 163,467$ 191,521$ 119,215$ Accounts receivable 96,590 120,358 135,206 152,824 153,634 146,836 193,450 Inventories 189,487 184,173 177,144 166,982 139,953 180,735 234,122 Deferred income taxes 33,194 21,576 16,993 22,431 - - - Prepaid expenses and other 8,239 9,632 10,203 8,417 24,351 57,299 57,343 Total current assets 408,959$ 449,001$ 485,659$ 529,507$ 481,405$ 576,391$ 604,130$ Property, plant and equipment 132,146 142,082 142,892 140,438 134,138 195,363 195,546 Deferred income taxes 17,454 1,401 - 1,358 20,343 - - Goodwill 146,444 149,967 149,603 149,718 148,367 317,464 315,977 Intangible assets 171,990 159,181 137,100 114,616 94,405 237,030 226,618 Other assets 12,057 10,613 13,397 14,033 20,075 25,265 26,860 Total assets 889,050$ 912,245$ 928,651$ 949,670$ 898,733$ 1,351,513$ 1,369,131$ LIABILITIES & STOCKHOLDERS' EQUITY Current liabilities Current portion of long-term debt 3,381$ 3,245$ 496$ 37,611$ 2,468$ 46,020$ 1,880$ Current portion of capital lease obligations 1,140 1,609 1,458 806 494 290 281 Accounts payable 87,299 112,151 96,213 79,618 71,338 108,448 183,966 Other accrued liabilities 104,873 99,358 88,690 93,042 92,314 128,910 122,552 Total current liabilities 196,693$ 216,363$ 186,857$ 211,077$ 166,614$ 283,668$ 308,679$ Long-term debt 416,849 358,890 324,777 274,885 233,465 504,091 503,576 Capital lease obligations 3,781 6,851 5,796 1,875 1,409 1,012 879 Other noncurrent liabilities 1,935 6,528 18,040 20,525 24,355 19,724 19,974 Deferrred income taxes 1,065 1,234 2,349 1,497 499 36,955 36,808 Stockholders' equity 268,727 322,379 390,832 439,811 472,391 506,063 499,215 Total Liabilities and stockholders' equity 889,050$ 912,245$ 928,651$ 949,670$ 898,733$ 1,351,513$ 1,369,131$ C ONSOLIDATED B ALANCE S HEET ($ in thousands)

22 2012 2013 2014 2015 2016 2017 Q2 2018 TTM Cash flows from operating activities Net income 105,631$ 46,529$ 60,930$ 104,289$ 119,433$ 111,422$ 121,478$ Adjustments to reconcile net income to net cash provided by operating activities Depreciation 14,975 16,550 16,951 16,739 16,830 18,012 19,930 Amortization of intangibles 10,590 21,786 21,878 21,259 19,940 17,041 18,325 Net loss (gain) on the sale of assets 203 140 13 (8,299) 101 (8,046) (15,287) Loss on debt extinguishment - 1,889 1,042 5,808 1,895 799 209 Deferred income taxes (55,292) 30,089 16,573 (7,749) 2,448 (14,682) (14,808) Stock-based compensation 5,149 7,480 7,833 10,010 12,038 10,429 10,389 Non-cash interest expense 2,972 4,643 4,840 5,222 3,475 2,258 2,326 Impairment of goodwill and other intangibles - - - 1,087 1,663 - - Changes in operating assets and liabilities Accounts receivable 1,180 (23,691) (14,848) (17,618) (809) 31,943 (45,277) Inventories 41,696 6,260 3,116 10,162 24,969 (13,158) (8,467) Prepaid expenses and other 736 (3,893) (571) 1,786 (10,147) (2,014) (4,256) Accounts payable and accrued liabilities (48,777) 18,082 (26,787) (12,243) (13,002) (963) 36,544 Other, net (3,046) 2,805 1,665 1,342 (84) (8,662) (11,500) Net cash provided by operating activities 76,017$ 128,669$ 92,635$ 131,795$ 178,750$ 144,379$ 109,606$ Cash flows from investing activities Capital expenditures (14,916) (18,352) (19,957) (20,847) (20,342) (26,056) (26,317) Acquisition, net of cash acquired (364,012) (15,985) - - - (323,487) (323,487) Proceeds from the sale of property, plant and equipment 607 305 87 13,203 19 10,860 23,550 Other (2,500) 2,500 4,113 - 3,014 6,443 8,283 Net cash used in investing activities (380,821)$ (31,532)$ (15,757)$ (7,644)$ (17,309)$ (332,240)$ (317,971)$ Cash flows from financing activities Proceeds from exercise of stock options 354 600 1,921 2,012 4,831 5,790 1,070 Borrowings under senior notes - - - - - 325,000 325,000 Borrowings under revolving credit facilities 206,015 1,166 806 1,134 618 713 765 Payments under revolving credit facilities (271,015) (1,166) (806) (1,134) (618) (713) (765) Principal payments under capital lease obligations (1,629) (1,700) (1,898) (4,201) (779) (600) (440) Principal payments under term loan credit facility (2,250) (62,827) (42,078) (194,291) (1,928) (386,577) (197,099) Principal payments under industrial revenue bond - (381) (475) (496) (473) (583) (364) Stock repurchase (564) (35) (1,497) (61,757) (79,556) (74,491) (53,110) Proceeds from issuance of convertible senior notes 145,500 - - - - - - Proceeds from issuance of term loan credit facility, net of issuance costs 292,500 - - 192,845 - 377,519 188,049 Convertible notes repurchase - - - (22,936) (98,922) (8,045) (80,914) (5,134) (981) - (2,587) - (6,783) (6,429) 2,500 - - - - - - Common stock dividends paid - - (15,315) (16,819) Net cash provided by (used in) financing activities 366,277$ (65,324)$ (44,027)$ (91,411)$ (176,827)$ 215,915$ 158,944$ Net increase (decrease) in cash and cash equivalents 61,473$ 31,813$ 32,851$ 32,740$ (15,386)$ 28,054$ (49,421)$ Cash and cash equivalents at beginning of period 19,976 81,449 113,262 146,113 178,853 163,467 178,633 Cash and cash equivalents at end of period 81,449$ 113,262$ 146,113$ 178,853$ 163,467$ 191,521$ 129,212$ Debt amendment and issuance costs paid Proceeds from issuance of industrial revenue bond C ONSOLIDATED C ASH F LOWS ($ in thousands)

23 2012 2013 2014 2015 2016 2017 Q2 2018 TTM Net income 105.6$ 46.5$ 60.9$ 104.3$ 119.4$ 111.4$ 121.5$ Income tax (benefit) expense (57.1) 31.1 37.5 59.0 66.0 11.1 5.4 Interest expense 21.7 26.3 22.2 19.5 15.7 16.4 25.1 Depreciation and amortization 25.6 38.3 38.8 38.0 36.8 35.1 38.2 Stock-based compensation 5.2 7.5 7.8 10.0 12.0 10.4 10.4 Impairment of goodwill and other ingtangibles - - - 1.1 1.7 - - Acquisition expenses 17.3 0.9 - - - 12.7 13.3 Other non-operating expense (income) 0.2 (0.7) 1.8 (2.5) 1.5 (8.1) (18.4) Operating EBITDA 118.5$ 149.9$ 169.0$ 229.5$ 253.0$ 189.0$ 195.5$ % of sales 8.1% 9.2% 9.1% 11.3% 13.7% 10.7% 9.4% R ECONCILIATION OF N ON - GAAP M EASURES ($ in millions) Note: This table reconciles annual net income for the periods presented to the non - GAAP measure of Operating EBITDA. Differenc es may exist in the calculation of Operating EBITDA due to rounding.

24 $ Per Share $ Per Share $ Per Share $ Per Share $ Per Share $ Per Share Net Income 46,529$ 0.67$ 60,930$ 0.86$ 104,289$ 1.50$ 119,433$ 1.82$ 111,422$ 1.78$ 121,478$ 1.99$ Adjustments: Acquisition expenses and related charges 883 0.01 - - - - - - 15,012 0.24 15,831 0.26 Revaluation of net deferred income tax assets due to changes in statutory tax rates - - 1,041 0.01 - - - - - - - - Branch Transactions a - - 608 0.01 (8,345) (0.12) (290) - (6,546) (0.10) (15,520) (0.25) Executive severance expense - - - - - - - - 238 - - - Impairment of goodwill and other intangibles - - - - 1,087 0.02 1,663 0.03 - - - Loss on debt extinguishment 1,889 0.03 1,042 0.02 5,807 0.08 1,895 0.03 800 0.01 209 0.00 Tax effect on aforementioned items (1,111) (0.01) (660) (0.01) 554 0.01 (1,163) (0.02) (3,421) (0.05) (1,151) (0.02) Income tax benefit, net - - - - - - - - (31,339) (0.50) (31,339) (0.51) Adjusted earnings 48,190$ 0.70$ 62,961$ 0.89$ 103,392$ 1.49$ 121,538$ 1.85$ 86,166$ 1.38$ 89,508$ 1.47$ Weighted Average # of Diluted Shares O/S 69,081 71,063 69,368 65,762 62,598 60,982 Twelve Months Ended December 31, 20172015 20162013 2014 2018 Q2 TTM R ECONCILIATION OF N ON - GAAP M EASURES a/ Branch transactions in years presented relate to (gains) losses incurred for sale and/or closing of certain branch locatio ns. Note: This table reconciles annual net income for the periods presented to the non - GAAP measure of adjusted earnings and adjust ed earnings per share. Differences may exist in the calculation of adjusted earnings per share due to rounding.