Attached files
| file | filename |
|---|---|
| EX-21 - WABASH NATIONAL Corp | v212088_ex21.htm |
| EX-31.02 - WABASH NATIONAL Corp | v212088_ex31-02.htm |
| EX-32.01 - WABASH NATIONAL Corp | v212088_ex32-01.htm |
| EX-31.01 - WABASH NATIONAL Corp | v212088_ex31-01.htm |
| EX-23.01 - WABASH NATIONAL Corp | v212088_ex23-01.htm |
|
|
UNITED STATES
SECURITIES AND EXCHANGE COMMISSION
Washington, D.C. 20549
Form 10-K
(Mark One)
|
x
|
ANNUAL REPORT PURSUANT TO SECTION 13 OR 15 (d)
OF THE SECURITIES EXCHANGE ACT OF 1934
For the Fiscal Year Ended December 31, 2010
OR
|
|
|
¨
|
TRANSITION REPORT PURSUANT TO SECTION 13 OR 15 (d)
OF THE SECURITIES EXCHANGE ACT OF 1934
|
For the transition period from to ______________
Commission File Number: 1-10883
WABASH NATIONAL CORPORATION
(Exact name of registrant as specified in its charter)
|
Delaware
(State or other jurisdiction of
incorporation or organization)
1000 Sagamore Parkway South
Lafayette, Indiana
(Address of Principal Executive Offices)
|
|
52-1375208
(IRS Employer
Identification Number)
47905
(Zip Code)
|
Registrant’s telephone number, including area code: (765) 771-5300
Securities registered pursuant to Section 12(b) of the Act:
|
Title of each class
|
Name of each exchange on which registered
|
|
|
Common Stock, $.01 Par Value
|
New York Stock Exchange
|
|
|
Series D Preferred Share Purchase Rights
|
New York Stock Exchange
|
Securities registered pursuant to Section 12(g) of the Act: None
Indicate by check mark if the registrant is a well-known seasoned issuer, as defined in Rule 405 of the Securities Act. Yes ¨ No x
Indicate by check mark if the registrant is not required to file reports pursuant to Section 13 or Section 15(d) of the Act. Yes ¨ No x
Indicate by check mark whether the registrant (1) has filed all reports required to be filed by Section 13 or 15(d) of the Securities Exchange Act of 1934 during the preceding 12 months (or for such shorter period that the registrant was required to file such reports), and (2) has been subject to such filing requirements for the past 90 days. Yes x No ¨
Indicate by check mark whether the registrant has submitted electronically and posted on its corporate website, if any, every Interactive Data File required to be submitted and posted pursuant to Rule 405 of Regulation S-T (§ 232.405 of this chapter) during the preceding 12 months (or for such shorter period that the registrant was required to submit and post such files). Yes ¨ No ¨
Indicate by check mark if disclosure of delinquent filers pursuant to Item 405 of Regulation S-K (§ 229.405 of this chapter) is not contained herein, and will not be contained, to the best of registrant's knowledge, in definitive proxy or information statements incorporated by reference in Part III of this Form 10-K or any amendment to this Form 10-K. ¨
Indicate by check mark whether the registrant is a large accelerated filer, an accelerated filer, a non-accelerated filer, or a smaller reporting company. See definitions of “large accelerated filer,” “accelerated filer” and “smaller reporting company” in Rule 12b-2 of the Exchange Act. (Check one):
|
Large accelerated filer ¨
|
Accelerated filer x
|
Non-accelerated filer ¨
|
Smaller reporting company ¨
|
|||
|
(Do not check if a smaller reporting company)
|
||||||
Indicate by check mark whether the registrant is a shell company (as defined in Rule 12b-2 of the Act). Yes ¨ No x
The aggregate market value of voting stock held by non-affiliates of the registrant as of June 30, 2010 was $415,957,141 based upon the closing price of the Company's common stock as quoted on the New York Stock Exchange composite tape on such date.
The number of shares outstanding of the registrant's common stock as of February 21, 2011 was 68,303,569.
Part III of this Form 10-K incorporates by reference certain portions of the registrant’s Proxy Statement for its Annual Meeting of Stockholders to be filed within 120 days after December 31, 2010.
|
|
TABLE OF CONTENTS
WABASH NATIONAL CORPORATION
FORM 10-K FOR THE FISCAL
YEAR ENDED DECEMBER 31, 2010
|
Pages
|
||
|
PART I
|
||
|
Item 1
|
Business
|
3
|
|
Item 1A
|
Risk Factors
|
12
|
|
Item 1B
|
Unresolved Staff Comments
|
17
|
|
Item 2
|
Properties
|
17
|
|
Item 3
|
Legal Proceedings
|
18
|
|
Item 4
|
[Removed and Reserved]
|
19
|
|
PART II
|
||
|
Item 5
|
Market for Registrant’s Common Equity, Related Stockholder Matters and Issuer Purchases of Equity Securities
|
20
|
|
Item 6
|
Selected Financial Data
|
22
|
| Item 7 |
Management’s Discussion and Analysis of Financial Condition and Results of Operations
|
22
|
|
Item 7A
|
Quantitative and Qualitative Disclosures about Market Risk
|
38
|
|
Item 8
|
Financial Statements and Supplementary Data
|
39
|
| Item 9 |
Changes in and Disagreements with Accountants on Accounting and Financial Disclosure
|
66
|
|
Item 9A
|
Controls and Procedures
|
66
|
|
Item 9B
|
Other Information
|
68
|
|
PART III
|
||
|
Item 10
|
Executive Officers of the Registrant
|
68
|
|
Item 11
|
Executive Compensation
|
68
|
| Item 12 |
Security Ownership of Certain Beneficial Owners and Management and Related Stockholder Matters
|
68
|
|
Item 13
|
Certain Relationships and Related Transactions, and Director Independence
|
68
|
|
Item 14
|
Principal Accounting Fees and Services
|
68
|
|
PART IV
|
||
|
Item 15
|
Exhibits and Financial Statement Schedules
|
69
|
|
SIGNATURES
|
71
|
|
2
FORWARD LOOKING STATEMENTS
This Annual Report contains “forward-looking statements” within the meaning of Section 27A of the Securities Act and Section 21E of the Securities Exchange Act of 1934 (the “Exchange Act”). Forward-looking statements may include the words “may,” “will,” “estimate,” “intend,” “continue,” “believe,” “expect,” “plan” or “anticipate” and other similar words. Our “forward-looking statements” include, but are not limited to, statements regarding:
|
|
·
|
our business plan;
|
|
|
·
|
our expected revenues, income or loss and capital expenditures;
|
|
|
·
|
plans for future operations;
|
|
|
·
|
financing needs, plans and liquidity;
|
|
|
·
|
our ability to achieve sustained profitability;
|
|
|
·
|
reliance on certain customers and corporate relationships;
|
|
|
·
|
availability and pricing of raw materials;
|
|
|
·
|
availability of capital;
|
|
|
·
|
dependence on industry trends;
|
|
|
·
|
the outcome of any pending litigation;
|
|
|
·
|
export sales and new markets;
|
|
|
·
|
engineering and manufacturing capabilities and capacity;
|
|
|
·
|
acceptance of new technology and products;
|
|
|
·
|
government regulation; and
|
|
|
·
|
assumptions relating to the foregoing.
|
Actual results could differ materially from those projected or assumed in our forward-looking statements. Our future financial condition and results of operations, as well as any forward-looking statements, are subject to change and are subject to inherent risks and uncertainties, such as those disclosed in this Annual Report. Each forward-looking statement contained in this Annual Report reflects our management’s view only as of the date on which that forward-looking statement was made. We are not obligated to update forward-looking statements or publicly release the result of any revisions to them to reflect events or
circumstances after the date of this Annual Report or to reflect the occurrence of unanticipated events, except as required by law.
Currently known risks and uncertainties that could cause actual results to differ materially from our expectations are described throughout this Annual Report, including in “Item 1A. Risk Factors”. We urge you to carefully review that section for a more complete discussion of the risks of an investment in our securities.
PART I
ITEM 1—BUSINESS
Founded in 1985 as a start-up company, Wabash National Corporation (“Wabash,” “Company,” “us,” “we” or “our”) is one of North America’s leaders in designing, manufacturing and marketing standard and customized truck trailers and related transportation equipment. We believe our position as a leader has been the result of our longstanding relationships with our core customers, our demonstrated ability to attract new customers, our broad and innovative product lines, our technological leadership and our large distribution and service network. Our management team is focused on continuing to size our manufacturing and retail
operations to match the current demand environment, implementing our cost savings initiatives, strengthening our capital structure, developing innovative products, improving earnings and selective production introductions that meet the needs of our customers.
3
We seek to identify and produce proprietary products that offer exceptional value to customers with the potential to generate higher profit margins than those of standardized products. We believe that we have the engineering and manufacturing capability to produce these products efficiently. We introduced our proprietary composite product, DuraPlateâ, in 1996. According to the most recent A.C.T. Research Company, LLC (ACT) estimates on total trailer industry shipments, composite trailers have achieved
widespread industry acceptance accounting for approximately one out of every three dry van trailer shipments in 2010. Since 2002, sales of our DuraPlateâ trailers represented approximately 91% of our total new dry van trailer sales. We are also a competitive producer of standardized sheet and post and refrigerated trailer products and we strive to become the low-cost producer of these products within our industry. Through our Transcraft subsidiary we also manufacture steel flatbed and dropdeck trailers. As part of our commitment to expand our customer base, diversify our revenues and extend our market leadership, Transcraft acquired in July 2008 certain operating assets of Benson International LLC, and its affiliates (Benson), a manufacturer of
aluminum flatbeds, dump trailers and other truck bodies. In addition, in December 2008, the Company announced a multi-year agreement to build and service all of PODS®1 portable storage container requirements as part of our strategy to leverage our DuraPlate® panel technology into other industry segments. We expect to continue a program of product development and selective acquisitions of quality proprietary products that further differentiate us from our competitors and increase shareholder value.
We market our transportation equipment under the Wabashâ, DuraPlateâ, DuraPlateHDâ, FreightProâ, ArcticLite®, RoadRailer®, Transcraft®, Eagle®, Eagle II®, D-Eagle® and Benson® trademarks directly to customers, through independent dealers and through our Company-owned retail branch network. Historically, we have focused on our longstanding core customers representing many of the largest companies in the trucking industry. Our relationships with our core customers have been central to our growth since inception. We have also actively pursued the diversification of our customer base by focusing on
what we refer to as the mid-market. These carriers, which represent over 2,100 carriers, operate fleets of between 250 to 7,500 trailers, which we estimate in total account for approximately two million trailers.
Longstanding core customers include – Averitt Express, Inc.; Crete Carrier Corporation; FedEx Corporation; Heartland Express, Inc.; Knight Transportation, Inc.; Old Dominion Freight Lines, Inc.; SAIA Motor Freightlines, Inc.; Safeway, Inc.; Schneider National, Inc.; Swift Transportation Corporation; U.S. Xpress Enterprises, Inc.; Werner Enterprises, Inc.; and YRC Worldwide, Inc.
Mid-market customers include – Baylor Trucking; Barr-Nunn Transportation, Inc.; C&S Wholesale Grocers, Inc.; CR England, Inc.; Cargo Transporters Inc; Celadon Group, Inc.; Con-way Truckload (formerly CFI); Cowan Systems, LLC; Dollar General Corporation; Frozen Food Express Industries, Inc.; Gordon Trucking, Inc.; Landair Transport, Inc.; New Penn Motor Express, Inc.; Prime, Inc.; Roehl Transport, Inc.; Star Transport, Inc.; USA Logistics; USF Corporation; and Xtra Lease, Inc.
Our 11 Company-owned full service retail branches provide additional opportunities to distribute our products and also offer nationwide services and support capabilities for our customers. In addition, we maintain three used fleet sales centers to focus on selling both large and small fleet trade packages to the wholesale market. Our retail branch network’s sale of new and used trailers, aftermarket parts and service generally provides enhanced margin opportunities. We also utilize a network of 30 independent dealers with approximately 65 locations throughout North America to distribute our van trailers. In addition, we distribute our flatbed and dropdeck trailers
through a network of 82 independent dealers with approximately 120 locations throughout North America.
Wabash was incorporated in Delaware in 1991 and is the successor by merger to a Maryland corporation organized in 1985. We operate in two reportable business segments: (1) manufacturing and (2) retail and distribution. Financial results by segment, including information about revenues from customers, measures of profit and loss, total assets, and financial information regarding geographic areas and export sales are discussed in Note 14, Segments and Related Information, of the accompanying consolidated financial statements. Our internet website is www.wabashnational.com. We make our electronic filings with the Securities Exchange Commission (the “SEC”), including our annual reports on Form 10-K, quarterly reports on Form 10-Q, current reports on Form 8-K and amendments to these reports available on our website free of charge as soon as practicable after we file or furnish them with the SEC. Information on the website is not part of this Form 10-K.
1 PODS® is a registered trademark of PODS, Inc. and Pods Enterprises, Inc.
4
Strategy
We are committed to a corporate strategy that seeks to maximize shareholder value by executing on the core elements of our strategic plan:
|
|
·
|
Value Creation. We intend to continue our focus on improved earnings and cash flow.
|
|
|
·
|
Operational Excellence. We are focused on maintaining a reduced cost structure by adhering to continuous improvement and lean manufacturing initiatives.
|
|
|
·
|
People. We recognize that in order to achieve our strategic goals we must continue to develop the organization’s skills to advance our associates capabilities and to attract talented people.
|
|
|
·
|
Customer Focus. We have been successful in developing longstanding relationships with core customers and we intend to maintain these relationships while expanding new customer relationships through the offering of tailored transportation solutions to create new revenue opportunities.
|
|
|
·
|
Innovation. We intend to continue to be the technology leader by providing new differentiated products and services that generate enhanced profit margins.
|
|
|
·
|
Corporate Growth. We intend to expand our product offering and competitive advantage by increasing our focus on the diversification of the products through our DuraPlate® Product Group and leveraging our intellectual and physical assets for organic growth.
|
Industry and Competition
Trucking in the U.S., according to the American Trucking Association (ATA), was estimated to be a $660 billion industry in 2008. The ATA estimates that approximately 69% of all freight tonnage is carried by trucks at some point during its shipment. Trailer demand is a direct function of the amount of freight to be transported. As the economy improves, it is forecasted that truck carriers will need to expand and replace their fleets, which typically results in increased trailer orders.
Transportation in the U.S., including trucking, is a cyclical industry. Transportation has experienced three cycles over the last 20 years. Truck freight tonnage, according to ATA statistics, started declining year-over-year in 2006 and remained at depressed levels through 2009. However, the most recent ATA data shows that in 2010 freight tonnage increased approximately 6% from 2009. Three U.S. economic downturns have occurred during the last 20 years and in each instance the decline in freight tonnage preceded the general economic decline by approximately two and one-half years and its recovery has generally preceded that of the economy as a whole. The trailer
industry generally follows the transportation industry, experiencing cycles in the early and late 90’s lasting approximately 58 and 67 months, respectively. The most recent cycle began in early 2001 and, based on current ACT estimates, reached the bottom in 2009. While the trailer industry in 2010 recovered significantly from the previous year’s low, the total trailer market for 2010 was still well below replacement demand levels. In our view, the sustainability of a recovery within the trailer industry will require improvements in general freight demand, improved credit markets and a recovery of the housing and construction markets. In addition, there are several different topics within state and federal legislative processes that could have a favorable impact on the demand for trailers in the near term, specifically the bonus
depreciation provision for eligible capital investments, comprehensive safety programs for carriers and drivers as well as proposed rule changes regarding hours of service restrictions.
Wabash, and its two largest competitors, Great Dane and Utility, are generally viewed as the top three trailer manufacturers in the United States and have accounted for greater than 50% of U.S. new trailer market share in recent years, including approximately 59% in 2010. Our market share of U.S. total trailer shipments in 2010 was approximately 21%. Trailer manufacturers compete primarily through the quality of their products, customer relationships, service availability and cost. Over the past several years, we have seen a number of our competitors follow our leadership in the development and use of composite sidewalls that compete directly with our DuraPlateâ products. Our product development is focused on maintaining our leading position with respect to these products.
5
The table below sets forth new trailer production for Wabash and, as provided by Trailer Body Builders Magazine, our largest competitors and the trailer industry as a whole within North America. The data represents all segments of the market, except containers and chassis. For the years included below, we have participated in the van, platform and dump trailer segments. Van production has declined from a high of approximately 198,000 trailers in 2006 to a low of approximately 50,000 trailers in 2009 while recovering to an estimated 89,000 trailers in 2010. Our market share for van trailers in 2010 was approximately 29%, an
increase of approximately 8% from 2009 due to increased market demand in the dry van market, our largest segment, as compared to the refrigerated trailer market.
|
2010
|
2009
|
2008
|
2007
|
2006
|
||||||||||||||||
|
Wabash(1)
|
27,000 | 12,000 | 32,000 | 46,000 | 60,000 |
(2)
|
||||||||||||||
|
Great Dane
|
21,000 | 15,000 | 29,000 | 48,000 | 60,000 | |||||||||||||||
|
Utility
|
23,000 | 17,000 | 23,000 | 31,000 | 37,000 | |||||||||||||||
|
Hyundai Translead
|
8,000 | 5,000 | 7,000 | 13,000 | 14,000 | |||||||||||||||
|
Stoughton
|
5,000 | 3,000 | 5,000 | 11,000 | 19,000 | |||||||||||||||
|
Other principal producers
|
19,000 | 12,000 | 20,000 | 25,000 | 40,000 | |||||||||||||||
|
Total Industry
|
121,000 | 79,000 |
(3)
|
143,000 |
(3)
|
218,000 |
(3)
|
283,000 |
(3)
|
|||||||||||
|
(1)
|
Does not include approximately 700 intermodal containers in 2006.
|
|
(2)
|
The 2006 production includes Transcraft volumes on a full-year pro forma basis.
|
|
(3)
|
Data revised by publisher in a subsequent year.
|
Competitive Strengths
We believe our core competitive strengths include:
|
|
·
|
Long-Term Core Customer Relationships – We are the leading provider of trailers to a significant number of top tier trucking companies, generating a revenue base that has helped to sustain us as one of the market leaders.
|
|
|
·
|
Innovative Product Offerings – Our DuraPlateâ proprietary technology offers what we believe to be a superior trailer, which commands premium pricing. A DuraPlateâ trailer is a composite plate trailer using material that contains a high-density polyethylene core bonded between high-strength steel skins. We believe that the competitive advantages of our DuraPlateâ trailers compared to standard trailers include the following:
|
- Extended Service Life – operate three to five years longer;
- Lower Total Cost of Ownership – less costly to maintain;
- Less Downtime – higher utilization for fleets;
- Extended Warranty – warranty period for DuraPlateâ panels is ten years; and
- Improved Resale – higher trade-in values.
We have been manufacturing DuraPlateâ trailers for over 15 years and through December 2010 have sold over 400,000 trailers. This proven experience, combined with ownership and knowledge of the DuraPlateâ panel technology, helps ensure continued industry leadership in the future. We have also successfully introduced innovations in our ArcticLite® refrigerated trailers and other product lines, including the
DuraPlateHD® trailer and the FreightPro® sheet and post trailer.
|
|
·
|
Significant Market Share and Brand Recognition – We have been one of the three largest manufacturers of trailers in North America since 1994, with one of the most widely recognized brands in the industry. We are one of the largest producers of van trailers in North America. According to Trailer Body Builders Magazine, our Transcraft subsidiary has been one of the top three leading producers of platform trailers in each year since our acquisition in March 2006.
|
|
|
·
|
Committed Focus on Operational Excellence – Safety, quality, on-time delivery, productivity and cost reduction are the core elements of our program of continuous improvement. We currently maintain an ISO 14001 registration of our Environmental Management System.
|
6
|
|
·
|
Technology – We are recognized by the trucking industry as a leader in developing technology to reduce trailer maintenance costs. In 2010, we were selected to partner with Navistar International in a five year venture funded by the U.S. Department of Energy to develop a Class 8 Super Truck (tractor-trailer combination) capable of a 50% improvement in fuel efficiency when compared to today’s best technology. As the exclusive trailer partner, we will be responsible for developing and building a proof-of-concept, scale model and full size test trailers for wind tunnel and test track evaluation. The selection of Wabash as the exclusive trailer partner in this venture is a
clear confirmation of our recognition as the market leader in innovative efforts with respect to over-the-highway trailer design and construction. In addition, over the past couple of years we have had several industry innovations including the following: a revolutionary 35,000 pound concentrated floor load rated dry van for heavy haul applications; a tire haul trailer to provide a cost effective transport of large tires; TrustLock®, a proprietary single-lock rear door mechanism; and, DuraPlate® Aeroskirt®, a durable aerodynamic solution that based on our testing provides improved fuel efficiencies of approximately
6%.
|
|
|
·
|
Corporate Culture – We benefit from an experienced, value-driven management team and dedicated workforce focused on operational excellence.
|
|
|
·
|
Extensive Distribution Network – Our 11 Company-owned retail branches and three used trailer locations extend our sales network throughout North America, diversify our factory direct sales, provide an outlet for used trailer sales and support our national service contracts. Additionally, we utilize a network of 30 independent dealers with approximately 65 locations throughout North America to distribute our van trailers, and our Transcraft distribution network consists of 82 independent dealers with approximately 120 locations throughout North America.
|
Regulation
Truck trailer length, height, width, maximum weight capacity and other specifications are regulated by individual states. The federal government also regulates certain safety features incorporated in the design and use of truck trailers. These regulations include, but are not limited to, requirements on anti-lock braking systems (ABS) and rear-impact guard standards as well as operator restrictions as to hours of service and minimum driver safety standards (see “Industry Trends”). Manufacturing operations are subject to environmental laws enforced by federal, state and local agencies (see
"Environmental Matters").
Products
Since our inception, we have expanded our product offerings from a single truck trailer product to a broad range of trailer-related transportation equipment. Our manufacturing segment specializes in the development of innovative proprietary products for our key markets. Manufacturing segment sales represented approximately 85%, 79% and 83% of consolidated Wabash net sales in 2010, 2009 and 2008, respectively. Our current transportation equipment and DuraPlate® products primarily include the following:
|
|
·
|
Dry Vans. The dry van market represents our largest product line and includes trailers sold under DuraPlateâ, DuraPlateHDâ, and FreightPro® trademarks. Our DuraPlate® trailers utilize a proprietary technology that consists of a composite plate wall for increased durability and greater strength. Our FreightPro® trailers provide us a competitive product within the smooth aluminum, or “sheet and post”, trailer segment.
|
|
|
·
|
Platform Trailers. Platform trailers are sold under Transcraft®, Eagle® and Benson® trademarks. The acquisition of certain assets from Benson in July 2008 provides us the ability to offer a premium all-aluminum platform trailer. Platform trailers consist of a trailer chassis with a flat or “drop” loading deck without permanent sides or a roof. These trailers are primarily utilized to haul steel coils, construction materials and
large equipment.
|
7
|
|
·
|
Refrigerated Trailers. Refrigerated trailers have insulating foam in the walls, roof and floor, which improves both the insulation capabilities and durability of the trailers. Our refrigerated trailers are sold under the ArticLite® trademark and use our proprietary SolarGuard® technology, coupled with our novel foaming process, which we believe enables customers to achieve lower costs through reduced operating hours of refrigeration equipment and therefore reduced fuel consumption.
|
|
|
·
|
RoadRailer® Equipment. The RoadRailer® intermodal system is a patented bimodal technology consisting of a truck trailer and a detachable rail “bogie” that permits a trailer to run both over the highway and directly on railroad lines.
|
|
|
·
|
Dump Equipment. The acquisition of certain assets from Benson in July 2008 provides the ability to offer premium aluminum and steel dump equipment sold under the name of Benson®. This dump equipment is primarily used in the coal industry.
|
|
|
·
|
DuraPlate® Products. The DuraPlate® Products Group was initiated in 2008 to expand the use of DuraPlate® composite panels, already a proven product in the semi-trailer market for over 15 years, into new product and market applications, including building and servicing all of PODS® portable storage container
requirements with our new DuraPlate® container. We are actively exploring new opportunities to leverage proprietary technology into new industries and applications and in 2009 introduced our EPA Smartway®2 approved DuraPlate® Aeroskirt®.
|
Our retail and distribution segment offers products in three general categories: new trailers, used trailers and parts and service. The following is a description of each product category:
|
|
·
|
We sell new trailers produced by the manufacturing segment. Additionally, we sell specialty trailers produced by third parties that are purchased in smaller quantities for local or regional transportation needs. New trailer sales through the retail branch network represented approximately 6%, 6% and 8% of consolidated net sales in 2010, 2009 and 2008, respectively.
|
|
|
·
|
We provide replacement parts and accessories and maintenance service for trailers and other related equipment. Parts and service sales represented approximately 6%, 10% and less than 5% of consolidated net sales in 2010, 2009 and 2008, respectively.
|
|
|
·
|
We sell used trailers including units taken in trade from our customers upon the sale of new trailers. The ability to remarket used trailers promotes new trailer sales by permitting trade-in allowances and offering customers an outlet for the disposal of used equipment. Used trailer sales represented less than 6% of consolidated net sales in 2010, 2009 and 2008.
|
Customers
Our customer base has historically included many of the nation’s largest truckload common carriers, leasing companies, private fleet carriers, less-than-truckload (LTL) common carriers and package carriers. We successfully diversified our customer base from approximately 60% of total trailers sold to large core customers in 2002 to approximately 30% in 2010 by continuing to expand our customer base and by diversifying into the broader trailer market through the recent acquisitions of Transcraft and Benson assets. In addition, we continue to diversify our products by expanding the use of DuraPlate®
composite panels through portable storage containers, DuraPlate® Aeroskirts® and truck bodies. All of these efforts have been accomplished while maintaining our relationships with our core customers. Our five largest customers together accounted for approximately 32%, 41% and 35% of our aggregate net sales in 2010, 2009 and 2008, respectively, with two different customers representing approximately 10% and 14% of our net sales in 2010 and 2009, respectively. International sales, primarily to Canadian customers, accounted for less than 10% of net sales for each of the last three years.
We have established relationships as a supplier to many large customers in the transportation industry, including the following:
2 EPA Smartway® is a registered trademark of U.S. Environmental Protection Agency (EPA)
8
|
|
·
|
Truckload Carriers: Averitt Express, Inc.; Crete Carrier Corporation; Heartland Express, Inc.; Knight Transportation, Inc.; Schneider National, Inc.; Swift Transportation Corporation; U.S. Xpress Enterprises, Inc.; and Werner Enterprises, Inc.
|
|
|
·
|
Leasing Companies: GE Trailer Fleet Services; and Xtra Lease, Inc.
|
|
|
·
|
Private Fleets: C&S Wholesale Grocers, Inc.; Dillard’s, Inc.; Dollar General Corporation; and Safeway, Inc.
|
|
|
·
|
Less-Than-Truckload Carriers: FedEx Corporation; Old Dominion Freight Lines, Inc.; SAIA Motor Freightlines, Inc.; Vitran Express, Inc.; and YRC Worldwide, Inc.
|
Marketing and Distribution
We market and distribute our products through the following channels:
|
|
·
|
factory direct accounts;
|
|
|
·
|
Company-owned distribution network; and
|
|
|
·
|
independent dealerships.
|
Factory direct accounts are generally large fleets, with over 7,500 trailers, that are high volume purchasers. Historically, we have focused on the factory direct market in which customers are highly knowledgeable of the life-cycle costs of trailer equipment and, therefore, are best equipped to appreciate the design and value-added features of our products. We have also actively pursued through our Company-owned and independent dealer network the diversification of our customer base focusing on what we refer to as the mid-market. These approximately 2,100 carriers operate fleets of between 250 to 7,500 trailers, which we estimate in total account for approximately two million
trailers. Since implementing our mid-market sales strategy in late 2003, we have added approximately 320 new mid-market customers accounting for approximately 22,000 new trailer orders.
Our Company-owned distribution network generates retail sales of trailers to smaller fleets and independent operators located in geographic regions where our branches are located. This branch network enables us to provide maintenance and other services to customers. The branch network and our used trailer centers provide an outlet for used trailers taken in trade upon the sale of new trailers, which is a common practice with fleet customers.
We also sell our van trailers through a network of 30 independent dealers with approximately 65 locations throughout North America. Our platform trailers are sold through 82 independent dealers with approximately 120 locations throughout North America. The dealers primarily serve mid-market and smaller sized carriers and private fleets in the geographic region where the dealer is located and occasionally may sell to large fleets. The dealers may also perform service work for our customers.
Raw Materials
We utilize a variety of raw materials and components including specialty steel coil, plastic, aluminum, lumber, tires, landing gear, axles and suspensions, which we purchase from a limited number of suppliers. Costs of raw materials and component parts represented approximately 75%, 75% and 74% of our consolidated net sales in 2010, 2009 and 2008, respectively. Significant price fluctuations or shortages in raw materials or finished components has had, and could have further, adverse affects on our results of operations. In 2011 and for the foreseeable future, we expect that the raw materials used in the greatest quantity will be steel, aluminum, plastic and wood. Our
suppliers of raw material and components have advised us that they have adequate capacity to meet our current and expected demands during 2011, but if the demand for their products increases then their lead-times may increase as well, or they could place us on allocation, which has happened in the past. For 2011, we expect there to be continued price volatility for our primary commodity raw materials, including aluminum, steel and plastic along with significant component pricing, including tires. Our Harrison, Arkansas laminated hardwood floor facility provides the majority of our requirements for trailer floors.
9
Backlog
Orders that have been confirmed by customers in writing and can be produced during the next 18 months are included in our backlog. Orders that comprise our backlog may be subject to changes in quantities, delivery, specifications and terms or cancellation. Our backlog of orders at December 31, 2010 and 2009 were approximately $480 million and $137 million, respectively. We expect to complete the majority of our existing backlog orders within the next 12 months.
Patents and Intellectual Property
We hold or have applied for 58 patents in the U.S. on various components and techniques utilized in our manufacture of transportation equipment. In addition, we hold or have applied for 68 patents in foreign countries. Our patents include intellectual property related to the manufacture of trailers using our proprietary DuraPlateâ product, which we believe offers us a significant competitive advantage. The patents in our DuraPlate® portfolio have expiration dates ranging from 2011 to
2024. In addition, we have applied for, or been granted, patents in the United States and foreign countries relating to innovative product designs or design improvements, which were first developed by Wabash National and have become highly desirable in our industry. In our view there are no meaningful patents having an expiration date prior to 2016.
We also hold or have applied for 38 trademarks in the U.S., as well as 31 trademarks in foreign countries. These trademarks include the Wabash®, Wabash National®, Transcraft® and Benson® brand names as well as trademarks associated with our proprietary products such as DuraPlateâ, RoadRailerâ, Eagle® and Benson® trailers. We believe these trademarks are important for the identification of our products and the associated customer goodwill; however, our business is not materially dependent on such trademarks.
Research and Development
Research and development expenses are charged to earnings as incurred and were $0.9 million, $1.2 million and $3.2 million in 2010, 2009 and 2008, respectively.
Environmental Matters
Our facilities are subject to various environmental laws and regulations, including those relating to air emissions, wastewater discharges, the handling and disposal of solid and hazardous wastes, and occupational safety and health. Our operations and facilities have been and in the future may become the subject of enforcement actions or proceedings for non-compliance with such laws or for remediation of company-related releases of substances into the environment. Resolution of such matters with regulators can result in commitments to compliance abatement or remediation programs and in some cases the payment of penalties (see Item 3
“Legal Proceedings”).
We believe that our facilities are in substantial compliance with applicable environmental laws and regulations. Our facilities have incurred, and will continue to incur, capital and operating expenditures and other costs in complying with these laws and regulations. However, we currently do not anticipate that the future costs of environmental compliance will have a material adverse effect on our business, financial condition or results of operations.
Employees
As of December 31, 2010 and 2009, we had approximately 1,800 and 1,600 full-time associates, respectively. Throughout 2010, all of our active associates were non-union. As the demand for trailers increased throughout 2010, we also increased our temporary associates from approximately 5% of our production workforce as of December 31, 2009 to approximately 50% throughout the second half of 2010 in order to meet our customer demand. We place a strong emphasis on employee relations through educational programs and quality improvement teams. We believe our employee relations are good.
10
Executive Officers of Wabash National Corporation
The following are the executive officers of the Company:
|
Name
|
Age
|
Position
|
||
|
Richard J. Giromini
|
57
|
President and Chief Executive Officer, Director
|
||
|
Rodney P. Ehrlich
|
64
|
Senior Vice President – Chief Technology Officer
|
||
|
Bruce N. Ewald
|
59
|
Senior Vice President – Sales and Marketing
|
||
|
Timothy J. Monahan
|
58
|
Senior Vice President – Human Resources
|
||
|
Erin J. Roth
|
35
|
Senior Vice President – General Counsel and Secretary
|
||
|
Mark J. Weber
|
39
|
Senior Vice President – Chief Financial Officer
|
Richard J. Giromini. Mr. Giromini was promoted to President and Chief Executive Officer on January 1, 2007. He had been Executive Vice President and Chief Operating Officer from February 28, 2005 until December 2005 when he was appointed President and a Director of the Company. Prior to that, he had been Senior Vice President - Chief Operating Officer since joining the Company on July 15, 2002. Mr. Giromini was with Accuride Corporation from April 1998 to July 2002, where he served in capacities as Senior Vice President - Technology and Continuous Improvement; Senior Vice
President and General Manager - Light Vehicle Operations; and President and CEO of AKW LP. Previously, Mr. Giromini was employed by ITT Automotive, Inc. from 1996 to 1998 serving as the Director of Manufacturing. Mr. Giromini also serves on the board of directors of Robbins & Myers, Inc., a global supplier of highly engineered equipment and systems for critical applications in energy, industrial, chemical and pharmaceutical markets, which he joined in October 2008. Mr. Giromini holds a Bachelor of Science degree in mechanical and industrial engineering and a Master of Science degree in industrial management, both from Clarkson University. He is a graduate of the Advanced Management Program at the Duke University Fuqua School of Management.
Rodney P. Ehrlich. Mr. Ehrlich has been Senior Vice President – Chief Technology Officer of the Company since January 2004. From 2001 to 2003, Mr. Ehrlich was Senior Vice President of Product Development. Mr. Ehrlich has been in charge of the Company's engineering operations since the Company's founding. Prior to Wabash National, Mr. Ehrlich started with Monon Trailer Corporation in 1963 working various positions until becoming Chief Engineer in 1973, Director of Engineering in 1978, and serving until joining the founders of Wabash National in 1985. Mr. Ehrlich has obtained over 50 patents in trailer related
design during his 47 year trailer career. Mr. Ehrlich holds a Bachelor of Science degree in Mechanical Engineering from Purdue University.
Bruce N. Ewald. Mr. Ewald’s original appointment was Vice President and General Manager of Wabash National Trailer Centers, Inc. when he joined the Company in March 2005. In October 2005, he was promoted to Senior Vice President – Sales and Marketing. Mr. Ewald has nearly 30 years experience in the transportation industry. Most recently, Mr. Ewald was with PACCAR from 1991 to February 2005 where he served in a number of executive-level positions. Prior to PACCAR, Mr. Ewald spent 10 years with Genuine Parts Co. where he served in several positions, including President and General Manager,
Napa Auto Parts/Genuine Parts Co. Mr. Ewald holds a Bachelor of Science degree in Business from the University of Minnesota.
Timothy J. Monahan. Mr. Monahan has been Senior Vice President – Human Resources since joining the Company in October 2003. Prior to Wabash, Mr. Monahan was with Textron Fastening Systems from 1999 to October 2003 where he served as Vice President – Human Resources for the Commercial Solutions Group and later Global Vice President – Human Resources. Previously, Mr. Monahan served in a variety of key executive roles at Beloit Corporation, Ingersoll Cutting Tools and Regal Beloit Corporation, including Vice President – Human Resources at both Beloit’s Mill Pro and Paper Machinery
Groups. Mr. Monahan serves on the board of directors of Global Specialty Solutions, a global producer of special cutting tools and tooling solutions. He holds a Bachelor of Science degree from Milton College and has attended several executive management programs, including the Duke University Fuqua School of Management where he completed the Advanced Executive Management Program.
Erin J. Roth. Effective January 1, 2011, Ms. Roth was promoted to the position of Senior Vice President – General Counsel and Secretary, following her appointment on March 1, 2010 to the position of Vice President – General Counsel and Secretary. Ms. Roth joined the Company in March 2007 as Corporate Counsel and was promoted in July 2009 to Senior Corporate Counsel. For the five years prior to joining the Company, Ms. Roth was engaged in the private practice of law with Barnes & Thornburg, LLP, representing a number of private and public companies throughout the United States. Ms. Roth earned her
Bachelor of Science degree in Accounting from Butler University and her Juris Doctorate from the Georgetown University Law Center.
11
Mark J. Weber. Mr. Weber was promoted to Senior Vice President – Chief Financial Officer on August 31, 2009. Mr. Weber joined the Company in August 2005 as Director of Internal Audit, was promoted in February 2007 to Director of Finance, and in November 2007 he was promoted to Vice President and Corporate Controller. Prior to joining the Company, Mr. Weber was with Great Lakes Chemical Corporation from October 1995 through August 2005 where he served in several positions of increasing responsibility within accounting and finance, including Vice President of Finance. Mr. Weber earned his Master’s of
Business Administration and Bachelor of Science in Accounting from Purdue University’s Krannert School of Management.
ITEM 1A—RISK FACTORS
You should carefully consider the risks described below in addition to other information contained or incorporated by reference in this Annual Report before investing in our securities. Realization of any of the following risks could have a material adverse effect on our business, financial condition, cash flows and results of operations.
Risks Related to Our Business, Strategy and Operations
Our results of operations have declined significantly in recent periods, and the impact of the current global economic downturn and its effects on our industry could continue to harm our operations and financial performance.
As of December 31, 2010, our stockholders' equity totaled
$129.0 million. For the three years ending December 31,
2010 and excluding the impact of the goodwill impairment recorded in 2008, we
have recorded net losses from operations totaling $119.0
million. These accumulated net operating losses reflect the conditions in
the markets we serve and the general condition of the global
economy. We believe that the overall industry in which we operate has
been affected similarly during this period. The global economic
downturn has caused demand for new trailers to decline and has led to, in some
cases, the cyclical timeframe for trailer replacement to be delayed due to
economic pressures. For example, according to a February 2011 report
by ACT, total trailer industry shipments for the years ending 2010, 2009 and
2008 were approximately 120,000 trailers, 79,000 trailers and 143,000 trailers,
respectively. By comparison, each of these years are
significantly below both the total trailer industry shipments in 2007 of 213,000
and the industry replacement demand levels of approximately 185,000
trailers. ACT is estimating 2011 trailer volumes to be approximately
195,000, representing an increase of approximately 63% from the previous
year. Even with the forecasted recovery within the trailer
manufacturing industry, we cannot make any assurances that we will be profitable
in future periods or, if we do become profitable, that we will be able to
sustain or increase profitability in the future. Achieving
profitability will be dependant on several factors, including but not limited to
our ability to increase our overall trailer volumes, improve our product
diversification efforts and manage our expenses. If we are unable to
generate profitability in the future, we may not be able to meet our
requirements under our revolving credit facility.
We continue to be affected by the global economy, especially the credit markets, as well as the decline in the housing and construction-related markets in the U.S. The same general economic concerns faced by us are also faced by our customers. We believe that some of our customers are highly leveraged, have limited access to capital, and may be reliant on liquidity from global credit markets and other sources of external financing. If the current conditions impacting the credit markets and general economy are prolonged, we may be faced with unexpected delays in product purchases or the loss of customers, which could further materially impact our financial position, results of
operations and cash flow. Further, lack of liquidity by our customers could impact our ability to collect amounts owed to us. While we have taken steps to address these concerns through the implementation of our strategic plan, we are not immune to the pressures being faced by our industry or the global economy, and our results of operations may decline.
12
Our ability to fund operations is limited by our cash on hand and available borrowing capacity under our revolving credit facility.
As of December 31, 2010, our liquidity position, defined as cash on hand and available borrowing capacity, amounted to $60.4 million. Our ability to fund our working capital needs and capital expenditures is limited by the net cash provided by operations, cash on hand and available borrowings under our revolving credit facility. Additional declines in net cash provided by operations, further decreases in the availability under the revolving credit facility or changes in the credit our suppliers provide to us, could rapidly exhaust our liquidity. However, we believe our liquidity on December 31, 2010 of $60.4 million will be adequate to fund expected operating results, working capital
requirements and capital expenditures throughout 2011, which we expect to be a period of economic recovery within the trailer manufacturing industry. However, if needed, our inability to increase liquidity would adversely impact our future performance, operations and results of operations.
Our revolving credit facility contains several restrictive covenants that, if breached, could limit our financial and operating flexibility and subject us to other risks.
Our revolving credit facility includes certain financial covenants that, if not met, would trigger an event of default and our lenders may declare all amounts outstanding under our debt agreement, together with any accrued interest, to be immediately due and payable.
Our revolving credit facility requires that we maintain a certain minimum level of availability throughout the duration of the agreement. Pursuant to the revolving credit facility, if the availability under our revolving credit facility is less than $15,000,000 at any time before the earlier of (i) August 14, 2011 or (ii) the date that monthly financial statements are delivered for the month ending June 30, 2011, we are required to maintain a varying minimum EBITDA and are restricted in the amount of capital expenditures it can make during such period. If our availability is less than $20,000,000 thereafter, we are required to maintain a fixed charge coverage ratio for the 12 month period
ending on the last day of the calendar month that ended most recently prior to such time of not less than 1.10 to 1.0, which could limit our ability to make capital expenditures.
The revolving credit facility also contains customary events of default including, without limitation, failure to pay obligations when due under the revolving credit facility, false and misleading representations, breaches of covenants (subject in some instances to cure and grace periods), defaults by us on certain other indebtedness, the occurrence of certain uninsured losses, business disruptions for a period of time that materially adversely affects the capacity to continue business on a profitable basis, changes of control and the incurrence of certain judgments that are not stayed, released or discharged within 30 days.
Due to the amount of our excess availability, as calculated under the revolving credit facility, we are currently in compliance will all covenants. Our ability to comply with our credit facility in the future may be affected by events beyond our control, including prevailing economic, financial and industry conditions.
Our business is highly cyclical, which has had, and could have further, adverse affects on our sales and results of operations.
The truck trailer manufacturing industry historically has been and is expected to continue to be cyclical, as well as affected by overall economic conditions. Customers historically have replaced trailers in cycles that run from five to 12 years, depending on service and trailer type. Poor economic conditions can adversely affect demand for new trailers and have historically, and has currently, led to an overall aging of trailer fleets beyond this typical replacement cycle. Customers' buying patterns can also reflect regulatory changes, such as federal hours-of-service rules and federal emissions standards.
While we have taken steps to diversify through the implementation of our strategic plan, we are subject to the cyclicality. As a result, during downturns, we operate with a lower level of backlog and have had to temporarily slow down or halt production at some or all of our facilities, including extending normal shut down periods and reducing salaried headcount levels. We could be forced to further slow down or halt additional production. An economic downturn may reduce, and in the past has reduced, demand for trailers, resulting in lower sales volumes, lower prices and decreased profits and losses.
A change in our customer relationships or in the financial condition of our customers has had, and could have further, adverse affects on our business.
We have longstanding relationships with a number of large customers to whom we supply our products. We do not have long-term agreements with these customers. Our success is dependent, to a significant extent, upon the continued strength of these relationships and the growth of our core customers. We often are unable to predict the level of demand for our products from these customers, or the timing of their orders. In addition, the same economic conditions that adversely affect us also often adversely affect our customers and in the current environment have led to reduced demand. As some of our customers are highly leveraged and have limited access to
capital, their continued existence may be uncertain. The loss of a significant customer or unexpected delays in product purchases could further adversely affect our business and results of operations.
13
Demand for new trailers has been and will continue to be sensitive to economic conditions over which we have no control and that may further adversely affect our revenues and profitability.
Demand for trailers is sensitive to changes in economic conditions such as the level of employment, consumer confidence, consumer income, new housing starts, government regulations and the availability of financing and interest rates. The status of these economic conditions periodically have an adverse effect on truck freight and the demand for and the pricing of our trailers, and have resulted in, and could lead to further, result in the inability of customers to meet their contractual terms or payment obligations, which could further cause our operating revenues and profits to decline.
Our backlog is not necessarily indicative of the level of our future revenues.
Our backlog represents future production for which we have written orders from our customers that can be produced or sold in the next 18 months. Orders that comprise our backlog may be subject to changes in quantities, delivery, specifications and terms, or cancellation, and our reported backlog may not be converted to revenue in any particular period and actual revenue from such orders may not equal our backlog revenues. Therefore, our backlog is not necessarily indicative of the level of our future revenues.
Our technology and products may not achieve market acceptance or competing products could gain market share, which could adversely affect our competitive position.
We continue to optimize and expand our product offerings to meet our customer needs through our established brands, such as DuraPlate®, DuraPlateHD®, FreightPro®, ArcticLite®, Transcraft Eagle® and Benson®. While we target product development to meet customer needs, there is no assurance that our product development efforts will be embraced and that we will meet our sales projections. Companies in the truck transportation industry, a very fluid industry in which our customers primarily operate, make frequent changes to maximize their operations and profits.
Over the past several years, we have seen a number of our competitors follow our leadership in the development and use of composite sidewalls that compete directly with our DuraPlateâ products. Our product development is focused on maintaining our leadership on these products but competitive pressures may erode our market share or margins. We continue to take steps to protect our proprietary rights in our products. However, the steps we have taken to protect them may not be sufficient or may not be enforced by a court of law. If we are unable to protect our
intellectual properties, other parties may attempt to copy or otherwise obtain or use our products or technology. If competitors are able to use our technology, our ability to effectively compete could be harmed. In addition, litigation related to intellectual property could result in substantial costs and efforts which may not result in a successful outcome.
We have a limited number of suppliers of raw materials and components; increases in the price of raw materials or the inability to obtain raw materials could adversely affect our results of operations.
We currently rely on a limited number of suppliers for certain key components and raw materials in the manufacturing of our products, such as tires, landing gear, axles, suspensions and specialty steel coil used in DuraPlate® panels. From time to time, there have been and may in the future be shortages of supplies of raw materials or components, or our suppliers may place us on allocation, which would have an adverse impact on our ability to meet demand for our products. Shortages and allocations may result in inefficient operations and a build-up of inventory, which can negatively affect our
working capital position. In addition, any price volatility in commodity pricing has had and could continue to have negative impacts to our operating margins. The loss of any of our suppliers or their inability to meet our price, quality, quantity and delivery requirements could have a significant impact on our results of operations.
14
Disruption of our manufacturing operations would have an adverse effect on our financial condition and results of operations.
We manufacture our products at two van trailer manufacturing facilities in Lafayette, Indiana, a flatbed and dump-body trailer facility in Cadiz, Kentucky, and a hardwood floor facility in Harrison, Arkansas. An unexpected disruption in our production at any of these facilities for any length of time would have an adverse effect on our business, financial condition and results of operations.
The inability to attract and retain key personnel could adversely affect our results of operations.
Our ability to operate our business and implement our strategies depends, in part, on the efforts of our executive officers and other key employees. Our future success depends, in large part, on our ability to attract and retain qualified personnel, including manufacturing personnel, sales professionals and engineers. The unexpected loss of services of any of our key personnel or the failure to attract or retain other qualified personnel could have a material adverse effect on the operation of our business.
We rely significantly on our integrated Enterprise Resource Planning (ERP) solution to support our operations.
We rely on an ERP system and telecommunications infrastructure to integrate departments and functions, to enhance the ability to service customers, to improve our control environment and to manage our cost reduction initiatives. Any issues involving our critical business applications and infrastructure may adversely impact our ability to manage operations and the customers we serve.
Significant competition in the industry in which we operate may result in our competitors offering new or better products and services or lower prices, which could result in a loss of customers and a decrease in our revenues.
The truck trailer manufacturing industry is highly competitive. We compete with other manufacturers of varying sizes, some of which have substantial financial resources. Trailer manufacturers compete primarily on the quality of their products, customer relationships, service availability and cost. Barriers to entry in the standard truck trailer manufacturing industry are low. As a result, it is possible that additional competitors could enter the market at any time. In the recent past, manufacturing over-capacity and high leverage of some of our competitors, along with bankruptcies and financial stresses that affected the industry, contributed to significant pricing
pressures.
If we are unable to compete successfully with other trailer manufacturers, we could lose customers and our revenues may decline. In addition, competitive pressures in the industry may affect the market prices of our new and used equipment, which, in turn, may adversely affect our sales margins and results of operations.
We are subject to extensive governmental laws and regulations, and our costs related to compliance with, or our failure to comply with, existing or future laws and regulations could adversely affect our business and results of operations.
The length, height, width, maximum weight capacity and other specifications of truck trailers are regulated by individual states. The federal government also regulates certain truck trailer safety features, such as lamps, reflective devices, tires, air-brake systems and rear-impact guards. Changes or anticipation of changes in these regulations can have a material impact on our financial results, as our customers may defer purchasing decisions and we may have to re-engineer products. We are subject to various environmental laws and regulations dealing with the transportation, storage, presence, use, disposal and handling of hazardous materials, discharge of storm water and
underground fuel storage tanks and may be subject to liability associated with operations of prior owners of acquired property. In addition, we are subject to laws and regulations relating to the employment of our associates and labor-related practices.
If we are found to be in violation of applicable laws or regulations in the future, it could have an adverse effect on our business, financial condition and results of operations. Our costs of complying with these or any other current or future regulations may be material. In addition, if we fail to comply with existing or future laws and regulations, we may be subject to governmental or judicial fines or sanctions.
15
Product liability and other legal claims could have an adverse effect on our financial condition and results of operations.
As a manufacturer of products widely used in commerce, we are subject to product liability claims and litigation, as well as warranty claims. From time to time claims may involve material amounts and novel legal theories, and any insurance we carry may prove inadequate to insulate us from material liabilities for these claims.
In addition to product liability claims, we are subject to legal proceedings and claims that arise in the ordinary course of business, such as workers' compensation claims, OSHA investigations, employment disputes and customer and supplier disputes arising out of the conduct of our business. Litigation may result in substantial costs and may divert management's attention and resources from the operation of our business, which could have a material adverse effect on our business, results of operations or financial condition.
Risks Related to an Investment in Our Common Stock
Our common stock has experienced, and may continue to experience, price volatility and a low trading volume.
The trading price and volume of our common stock has been and may continue to be subject to large fluctuations. The market price and volume of our common stock may increase or decrease in response to a number of events and factors, including:
|
|
·
|
trends in our industry and the markets in which we operate;
|
|
|
·
|
changes in the market price of the products we sell;
|
|
|
·
|
the introduction of new technologies or products by us or by our competitors;
|
|
|
·
|
changes in expectations as to our future financial performance, including financial estimates by securities analysts and investors;
|
|
|
·
|
operating results that vary from the expectations of securities analysts and investors;
|
|
|
·
|
announcements by us or our competitors of significant contracts, acquisitions, strategic partnerships, joint ventures, financings or capital commitments;
|
|
|
·
|
changes in laws and regulations;
|
|
|
·
|
general economic and competitive conditions; and
|
|
|
·
|
changes in key management personnel.
|
This volatility may adversely affect the prices of our common stock regardless of our operating performance. To the extent that the price of our common stock declines, our ability to raise funds through the issuance of equity or otherwise use our common stock as consideration will be reduced. These factors may limit our ability to implement our operating and growth plans.
In connection with our issuance of preferred stock and the common stock warrant, certain provisions of the terms of our preferred stock may discourage third parties from seeking to acquire us.
Certain provisions of the documents governing our preferred stock may discourage third parties from seeking to acquire the Company. In particular, in the event of a change of control, defined as more than 50% of the voting power is transferred or acquired by any person other than Trailer Investments or its affiliates, occurs within twelve months of the date of the preferred stock was redeemed (or on or before May 28, 2011) our preferred stock has a mandatory redemption feature requiring us to offer to redeem the preferred stock at an additional premium of $74.6 million representing the difference between what Trailer Investments received at the time of redemption and what it would have been entitled to
receive on the date of redemption if a change of control had occurred on that date. As a result, this could discourage third parties from seeking to acquire us because any additional premium to our current common stock equity value would need to take into account the premium on our preferred stock. This means that to offer the holders of our common stock a premium, a third party would have to pay an amount significantly in excess of the current value of our common stock.
16
An ownership change could result in a limitation on the use of our net operating losses.
As of December 31, 2010, we had approximately $180 million of remaining U.S. federal income tax net operating loss carryforwards (“NOLs”), which will begin to expire in 2022, if unused, and which may be subject to other limitations under Internal Revenue Service (the “IRS”) rules. We have various, multistate income tax net operating loss carryforwards, which have been recorded as a deferred income tax asset, of approximately $18 million, before valuation allowances. We also have various U.S. federal income tax credit carryforwards, which will expire beginning in 2013, if unused. Our NOLs, including any future NOLs that may arise, are subject to limitations
on use under the IRS rules, including Section 382 of the Internal Revenue Code of 1986, as revised. Section 382 limits the ability of a company to utilize NOLs in the event of an ownership change. We would undergo an ownership change if, among other things, the stockholders, or group of stockholders, who own or have owned, directly or indirectly, 5% or more of the value of our stock or are otherwise treated as 5% stockholders under Section 382 and the regulations promulgated thereunder increase their aggregate percentage ownership of our stock by more than 50 percentage points over the lowest percentage of our stock owned by these stockholders at any time during the testing period, which is generally the three-year period preceding the potential ownership change.
In the event of an ownership change, Section 382 imposes an annual
limitation on the amount of post-ownership change taxable income a corporation
may offset with pre-ownership change NOLs and certain recognized built-in
losses. The limitation imposed by Section 382 for any post-change year would be
determined by multiplying the value of our stock immediately before the
ownership change (subject to certain adjustments) by the applicable long-term
tax-exempt rate in effect at the time of the ownership change. Any unused annual
limitation may be carried over to later years, and the limitation may under
certain circumstances be increased by built-in gains that may be present in
assets held by us at the time of the ownership change that are recognized in the
five-year period after the ownership change. It is expected that any
loss of our NOLs would cause our effective tax rate to go up significantly when
we return to profitability, excluding impacts of valuation allowance.
On May 28, 2010 a change of ownership did occur resulting from the issuance of 11,750,000 shares of common stock, which invoked a limitation on the utilization of pre-ownership change NOLs under Section 382. Pre-ownership change NOLs are $177 million. Management has estimated the annual NOL limitations under IRC Section 382 through 2014 are $70 million for 2011; $42 million for 2012; $40 million for 2013; and, $25 million for 2014. To the extent the limitation in any year is not reached, any remaining limitation can be carried forward indefinitely to future years. Post-ownership change NOLs at December 31, 2010 are $3 million, which is currently not subject to utilization
limits.
In 2009, we undertook a study to ensure that the change in ownership related to the issuance of the Warrant (see “Liquidity and Capital Resources”) in August 2009 did not result in a Section 382 limitation and believe that such a limitation was not triggered. However, there can be no assurance that such a change was not triggered at that time, due to the lack of authoritative guidance.
ITEM 1B—UNRESOLVED STAFF COMMENTS
None.
ITEM 2—PROPERTIES
Manufacturing Facilities
We own or lease, and operate trailer manufacturing facilities in Lafayette, Indiana and Cadiz, Kentucky, as well as a trailer floor manufacturing facility in Harrison, Arkansas. During 2010 we consolidated our Anna, Illinois, steel flatbed operation into our Cadiz facility to further our lean manufacturing efforts and subsequently sold the Anna facility. In addition, we sold our Mt. Sterling, Kentucky facility that was idled in 2007. Our main Lafayette facility is a 1.2 million square foot facility that houses truck trailer and composite material production, tool and die operations, research laboratories and offices. The second Lafayette facility is 0.6 million square
feet, primarily used for the production of refrigerated trailers. In total, our facilities have the capacity to produce approximately 80,000 trailers annually on a three shift, five-day workweek schedule, dependent on mix of product.
17
Retail and Distribution Facilities
Retail and distribution facilities include 11 full service branches and three used trailer centers. Each sales and service branch consists of an office, parts warehouse and service space, and ranges in size from 20,000 to 50,000 square feet per facility. The 14 facilities are located in 10 states with three of the facilities being leased.
Properties owned by Wabash are subject to security interests held by our lenders.
ITEM 3—LEGAL PROCEEDINGS
Various lawsuits, claims and proceedings have been or may be instituted or asserted against the Company arising in the ordinary course of business, including those pertaining to product liability, labor and health related matters, successor liability, environmental matters and possible tax assessments. While the amounts claimed could be substantial, the ultimate liability cannot now be determined because of the considerable uncertainties that exist. Therefore, it is possible that results of operations or liquidity in a particular period could be materially affected by certain contingencies. However, based on facts currently available, management believes that the disposition of
matters that are currently pending or asserted other than the matters below, which are addressed individually, will not have a material adverse effect on the Company's financial position, liquidity or results of operations. Costs associated with the litigation and settlements of legal matters are reported within General and Administrative Expenses in the Consolidated Statements of Operations.
Brazil Joint Venture
In March 2001, Bernard Krone Indústria e Comércio de Máquinas Agrícolas Ltda. ("BK") filed suit against the Company in the Fourth Civil Court of Curitiba in the State of Paraná, Brazil. Because of the bankruptcy of BK, this proceeding is now pending before the Second Civil Court of Bankruptcies and Creditors Reorganization of Curitiba, State of Paraná (No. 232/99).
The case grows out of a joint venture agreement between BK and the Company related to marketing of RoadRailer trailers in Brazil and other areas of South America. When BK was placed into the Brazilian equivalent of bankruptcy late in 2000, the joint venture was dissolved. BK subsequently filed its lawsuit against the Company alleging that it was forced to terminate business with other companies because of the exclusivity and non-compete clauses purportedly found in the joint venture agreement. BK asserts damages of approximately R$20.8 million (Brazilian Reais) which is approximately $12.5 million U.S. dollars using current exchange rates. The amount of damages asserted
in local currency has not changed since 2001.
We answered the complaint in May 2001, denying any wrongdoing. We believe that the claims asserted by BK are without merit and intend to vigorously defend our position. A bench (non-jury) trial was held on March 30, 2010 in Curitiba, Paraná, Brazil. A ruling on the evidence presented at the trial is not expected for several months. We believe that the resolution of this lawsuit will not have a material adverse effect on our financial position, liquidity or future results of operations; however, at this stage of the proceeding no assurances can be given as to the ultimate outcome of the case.
Intellectual Property
In October 2006, the Company filed a patent infringement suit against Vanguard National Corporation (“Vanguard”) regarding Wabash National’s U.S. Patent Nos. 6,986,546 and 6,220,651 in the U.S. District Court for the Northern District of Indiana (Civil Action No. 4:06-cv-135). The Company amended the Complaint in April 2007. In May 2007, Vanguard filed its Answer to the Amended Complaint, along with Counterclaims seeking findings of non-infringement, invalidity, and unenforceability of the subject patents. The Company filed a reply to Vanguard’s counterclaims in May 2007, denying any wrongdoing or merit to the allegations as set forth in the
counterclaims. The case has currently been stayed by agreement of the parties while the U.S. Patent and Trademark Office (“Patent Office”) undertakes a reexamination of U.S. Patent Nos. 6,986,546. The Patent Office recently notified the Company that the reexamination is complete and the Patent Office has reissued U.S. Patent No. 6,986,546 without cancelling any claims of the patent. The parties plan to petition the Court to lift the stay; however, it is unknown at this time when the petition to lift the stay may be granted.
18
The Company believes that its claims against Vanguard have merit, that the claims asserted by Vanguard are without merit, and intends to vigorously defend its position and intellectual property. The Company believes that the resolution of this lawsuit will not have a material adverse effect on its financial position, liquidity or future results of operations; however, at this stage of the proceeding, no assurance can be given as to the ultimate outcome of the case.
Environmental Disputes
In September 2003, we were noticed as a potentially responsible party (PRP) by the U.S. Environmental Protection Agency (“EPA”) pertaining to the Motorola 52nd Street, Phoenix, Arizona Superfund Site (the “Superfund Site”) pursuant to the Comprehensive Environmental Response, Compensation and Liability Act (“CERCLA”). PRPs include current and former owners and operators of facilities at which hazardous substances were allegedly disposed. The EPA’s allegation that we were a PRP arises out of our acquisition of a former branch facility located approximately five miles from the original Superfund Site. We acquired this facility in 1997,
operated the facility until 2000, and sold the facility to a third party in 2002. In June 2010, we were contacted by the Roosevelt Irrigation District (“RID”) informing it that the Arizona Department of Environmental Quality (“ADEQ”) had approved a remediation plan in excess of $100 million for the RID portion of the Superfund Site, and demanded that we contribute to the cost of the plan or be named as a defendant in a CERCLA action to be filed in July 2010. We initiated settlement discussions with the RID and the ADEQ in July 2010 to provide a full release from the RID, and a covenant not-to-sue and contribution protection regarding the former branch property from the ADEQ, in exchange for payment from us. If the settlement is approved by all parties, it will prevent any third party from successfully bringing claims against us
for environmental contamination relating to this former branch property. We are awaiting approval from the ADEQ for the settlement we proposed in July 2010; we do not expect to receive a response from the ADEQ for several more months. Based upon our limited period of ownership of the former branch property, and the fact that we no longer own the former branch property, we do not anticipate that the ADEQ will reject the proposed settlement, but no assurance can be given at this time as to the ADEQ’s response to the settlement proposal. The proposed settlement terms have been accrued and did not have a material adverse effect on our financial condition or results of operations, and we believe that any ongoing proceedings will not have a material adverse effect on the Company’s financial condition or results of operations.
In January 2006, the Company received a letter from the North Carolina Department of Environment and Natural Resources indicating that a site that the Company formerly owned near Charlotte, North Carolina has been included on the state's October 2005 Inactive Hazardous Waste Sites Priority List. The letter states that the Company was being notified in fulfillment of the state's “statutory duty” to notify those who own and those who at present are known to be responsible for each Site on the Priority List. No action is being requested from the Company at this time. The Company does not expect that this designation will have a material adverse effect on its financial
condition or results of operations.
ITEM 4—[REMOVED AND RESERVED]
19
PART II
ITEM 5—MARKET FOR REGISTRANT’S COMMON STOCK, RELATED STOCKHOLDER MATTERS AND ISSUER PURCHASES OF EQUITY SECURITIES
Information Regarding our Common Stock
Our common stock is traded on the New York Stock Exchange (ticker symbol: WNC). The number of record holders of our common stock at February 21, 2011 was 878.
We declared quarterly dividends of $0.045 per share on our common stock from the first quarter of 2005 through the third quarter of 2008. In December 2008, we suspended the payment of our quarterly dividend due to the continued weak economic environment and the uncertainty as to the timing of a recovery as well as our effort to enhance liquidity. No dividends on our common stock were declared or paid in 2010. In accordance with our Third Amended and Restated Loan and Security Agreement, effective August 3, 2009 and as amended on May 28, 2010, we are restricted from the payment of cash dividends to holders of our common stock for a
period of two years. At any time after our second anniversary of our credit facility, or August 3, 2011, we are limited to the amount of cash dividends of $20 million per year unless otherwise approved by a majority of our lenders, so long as no default or event of default is continuing or would be caused by the distribution and only if our available borrowing capacity is in excess of $40 million after distribution of dividend. The reinstatement of quarterly cash dividends on our common stock will depend on our future earnings, capital availability, financial condition and the discretion of our Board of Directors.
On May 13, 2010, our stockholders approved an amendment to our Certificate of Incorporation, as amended, to increase the number of authorized shares of common stock, par value $0.01 per share, from 75 million shares to 200 million shares and correspondingly, to increase the total number of authorized shares of all classes of capital stock from 100 million shares to 225 million shares, which includes 25 million shares of preferred stock, par value $0.01 per share.
High and low stock prices as reported on the New York Stock Exchange for the last two years were:
|
High
|
Low
|
|||||||
|
2009
|
||||||||
|
First Quarter
|
$ | 5.07 | $ | 0.51 | ||||
|
Second Quarter
|
$ | 2.71 | $ | 0.68 | ||||
|
Third Quarter
|
$ | 3.25 | $ | 0.50 | ||||
|
Fourth Quarter
|
$ | 3.05 | $ | 1.36 | ||||
|
2010
|
||||||||
|
First Quarter
|
$ | 7.84 | $ | 1.82 | ||||
|
Second Quarter
|
$ | 10.85 | $ | 5.86 | ||||
|
Third Quarter
|
$ | 8.94 | $ | 5.96 | ||||
|
Fourth Quarter
|
$ | 13.00 | $ | 7.51 | ||||
20
Performance Graph
The following graph shows a comparison of cumulative total returns for an investment in our common stock, the S&P 500 Composite Index and the Dow Jones Transportation Index. It covers the period commencing December 31, 2005 and ending December 31, 2010. The graph assumes that the value for the investment in our common stock and in each index was $100 on December 31, 2005 and that all dividends were reinvested.
Comparative of Cumulative Total Return
December 31, 2005 through December 31, 2010
among Wabash National Corporation, the S&P 500 Index
and the Dow Jones Transportation Index
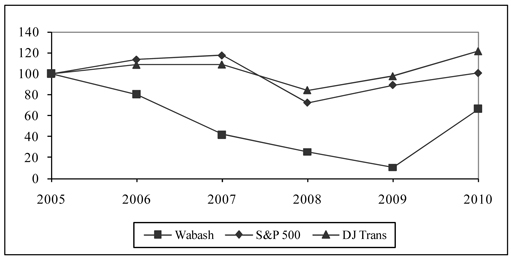
Purchases of Our Equity Securities
For the quarter ending December 31, 2010, we repurchased a total of 5,445 shares to cover minimum employee tax withholding obligations upon the vesting of restricted stock awards. During this period, there were no repurchases made pursuant to any repurchase programs
|
Period
|
Total Number of
Shares
Purchased
|
Average Price Paid
per Share
|
Total Number of
Shares Purchased
as Part of Publicly
Announced Plans
or Programs
|
Maximum Number
of Shares that May
Yet Be Purchased
Under the Plans or
Programs
|
||||||||||||
|
October 2010
|
622 | $ | 7.11 | — | — | |||||||||||
|
November 2010
|
— | $ | — | — | — | |||||||||||
|
December 2010
|
4,823 | $ | 12.32 | — | — | |||||||||||
|
Total
|
5,445 | $ | 11.72 | — | — | |||||||||||
21
ITEM 6—SELECTED FINANCIAL DATA
The following selected consolidated financial data with respect to Wabash for each of the five years in the period ended December 31, 2010, have been derived from our consolidated financial statements. The following information should be read in conjunction with Management's Discussion and Analysis of Financial Condition and Results of Operations and the consolidated financial statements and notes thereto included elsewhere in this Annual Report.
|
Years Ended December 31,
|
||||||||||||||||||||
|
2010
|
2009
|
2008
|
2007
|
2006
|
||||||||||||||||
|
(Dollars in thousands, except per share data)
|
||||||||||||||||||||
|
Statement of Operations Data:
|
||||||||||||||||||||
|
Net sales
|
$ | 640,372 | $ | 337,840 | $ | 836,213 | $ | 1,102,544 | $ | 1,312,180 | ||||||||||
|
Cost of sales
|
612,289 | 360,750 | 815,289 | 1,010,823 | 1,207,687 | |||||||||||||||
|
Gross profit
|
$ | 28,083 | $ | (22,910 | ) | $ | 20,924 | $ | 91,721 | $ | 104,493 | |||||||||
|
Selling, general and administrative expenses
|
43,500 | 43,164 | 58,384 | 65,255 | 66,227 | |||||||||||||||
|
Impairment of goodwill
|
- | - | 66,317 | - | 15,373 | |||||||||||||||
|
(Loss) Income from operations
|
$ | (15,417 | ) | $ | (66,074 | ) | $ | (103,777 | ) | $ | 26,466 | $ | 22,893 | |||||||
|
Increase in fair value of warrant
|
(121,587 | ) | (33,447 | ) | - | - | - | |||||||||||||
|
Interest expense
|
(4,140 | ) | (4,379 | ) | (4,657 | ) | (5,755 | ) | (6,921 | ) | ||||||||||
|
Other, net
|
(667 | ) | (866 | ) | (328 | ) | 3,977 | 330 | ||||||||||||
|
(Loss) Income before income taxes
|
$ | (141,811 | ) | $ | (104,766 | ) | $ | (108,762 | ) | $ | 24,688 | $ | 16,302 | |||||||
|
Income tax (benefit) expense
|
(51 | ) | (3,001 | ) | 17,064 | 8,403 | 6,882 | |||||||||||||
|
Net (loss) income
|
$ | (141,760 | ) | $ | (101,765 | ) | $ | (125,826 | ) | $ | 16,285 | $ | 9,420 | |||||||
|
Preferred stock dividends and early extinguishment
|
25,454 | 3,320 | - | - | - | |||||||||||||||
|
Net (loss) income applicable to common stockholders
|
$ | (167,214 | ) | $ | (105,085 | ) | $ | (125,826 | ) | $ | 16,285 | $ | 9,420 | |||||||
|
Basic net (loss) income per common share
|
$ | (3.36 | ) | $ | (3.48 | ) | $ | (4.21 | ) | $ | 0.53 | $ | 0.30 | |||||||
|
Diluted net (loss) income per common share
|
$ | (3.36 | ) | $ | (3.48 | ) | $ | (4.21 | ) | $ | 0.52 | $ | 0.30 | |||||||
|
Common stock dividends declared
|
$ | - | $ | - | $ | 0.135 | $ | 0.180 | $ | 0.180 | ||||||||||
|
Balance Sheet Data:
|
||||||||||||||||||||
|
Working capital
|
$ | 61,427 | $ | (34,927 | ) | $ | (2,698 | ) | $ | 146,616 | $ | 154,880 | ||||||||
|
Total assets
|
$ | 302,834 | $ | 223,777 | $ | 331,974 | $ | 483,582 | $ | 556,483 | ||||||||||
|
Total debt and capital leases
|
$ | 59,554 | $ | 33,243 | $ | 85,148 | $ | 104,500 | $ | 125,000 | ||||||||||
|
Stockholders' equity
|
$ | 129,025 | $ | 53,485 | $ | 153,437 | $ | 279,929 | $ | 277,955 | ||||||||||
ITEM 7—MANAGEMENT’S DISCUSSION AND ANALYSIS OF FINANCIAL CONDITION AND RESULTS OF OPERATIONS
Management’s Discussion and Analysis of Financial Condition and Results of Operations (MD&A) describes the matters that we consider to be important to understanding the results of our operations for each of the three years in the period ended December 31, 2010, and our capital resources and liquidity as of December 31, 2010. Our discussion begins with our assessment of the condition of the North American trailer industry along with a summary of the actions we have taken to strengthen the Company. We then analyze the results of our operations for the last three years, including the trends in the overall business and our operations
segments, followed by a discussion of our cash flows and liquidity, capital markets events and transactions, our credit facility and contractual commitments. We also provide a review of the critical accounting judgments and estimates that we have made that we believe are most important to an understanding of our MD&A and our consolidated financial statements. These are the critical accounting policies that affect the recognition and measurement of our transactions and the balances in our consolidated financial statements. We conclude our MD&A with information on recent accounting pronouncements that we adopted during the year, as well as those not yet adopted that are expected to have an impact on our financial accounting practices.
22
We have two reportable segments: manufacturing and retail and distribution. The manufacturing segment produces trailers that are sold to customers who purchase trailers directly or through independent dealers and to the retail and distribution segment. The retail and distribution segment includes the sale of new and used trailers, as well as the sale of aftermarket parts and service through our retail branch network.
Executive Summary
The year ending December 31, 2009 was extremely challenging for the trailer industry as the factors negatively impacting demand for new trailers became more intense and pervasive across the United States. According to the A.C.T. Research Company, LLC (“ACT”) estimates, total trailer industry shipments in 2009 were approximately 79,000, or a decline of 45% from the 143,000 trailers shipped in 2008 and more than 62% lower than the 213,000 trailers shipped for the year ended December 31, 2007. Total demand for trailers in 2009 dropped to levels the industry has not seen since 1975 with dry van demand at its lowest levels since 1963. This reflected the
weakness of truck freight, which trended down since the latter part of 2006 as a result of general economic conditions and, more particularly, declines in new home construction and the automotive industry. As a result of these significant declines within the trailer industry, the Company’s revenues, gross profits, financial position and liquidity for 2009 were all negatively impacted. In light of these economic conditions and the decline in the our operating results and financial condition, in July 2009, we issued $35 million of preferred stock and warrants to Trailer Investments, LLC (“Trailer Investments”) and amended our revolving credit facility (as discussed in further details under the Liquidity and Capital Resources section below).
While the Company has experienced historically low demand for trailers in
2010, the overall trailer market has significantly improved from 2009,
reflecting the beginning of a recovery within the trailer
industry. As the year progressed, several of the economic indicators
within the broader manufacturing environment and, more specifically, the trailer
and freight industry showed signs of improvement. According to the
most recent ACT estimates, total trailer industry shipments for 2010 were up 52%
from 2009 to approximately 120,000 trailers in 2010. By product line,
ACT estimates that the demand for dry vans, the largest segment within the
trailer industry, doubled from 2009 to approximately 60,000 trailers in
2010. Furthermore, our backlog of orders at December 31, 2010 was
$480 million, up 250% from our backlog at December 31, 2009. These
positive trends, coupled with our previously enacted cost actions and
operational enhancement initiatives, yielded significant improvements to both
revenue and gross profit as compared to the previous years. Gross
profit levels showed continuous improvements throughout 2010 due primarily to
increases in new trailer volumes and lower overhead costs per unit as compared
to the previous year.
As the outlook within the trailer industry continued to show signs of a recovery, in May 2010 we were able to successfully close on a public offering of our common stock consisting of 11,750,000 shares sold by us and 16,137,500 shares sold by Trailer Investments. Net proceeds from this offering were used to redeem all of the preferred stock and to repay a portion of our outstanding indebtedness under our revolving credit facility. Furthermore, in September 2010 Trailer Investments exercised in full the remaining 9,349,032 warrants in an underwritten public offering. As a result of these successful offerings, an improved trailer market and the various cash management actions implemented
during the economic downturn, we were able to make significant improvements to our liquidity position, defined as cash on hand and available borrowing capacity. As of December 31, 2011, our liquidity position totaled $60.4 million, an increase of over $39.4 million from the previous year.
We expect continued improvements in the overall trailer market for 2011 as
compared to 2010. In fact, recent estimates from industry
forecasters, ACT and FTR Associates (FTR), indicate shipment levels to increase
in each of the next three years and exceeding 220,000 trailers for each of the
years 2012 through 2015. Furthermore, ACT is currently estimating
2011 levels to be approximately 195,000 trailers, or an increase of 63% while
FTR anticipates a 33% increase in new trailers for 2011 as compared to
2010. This healthier demand environment reinforces our belief that
the recovery of the industry is well under way and we believe we are well
positioned to capitalize on the expected improvement in overall
demand. In addition, while 2011 will remain a very price competitive
environment, we do anticipate seeing pricing power improve as trailer order
demand and confidence increases throughout the year and into 2012. We
are also not relying solely on volume recovery within the trailer industry to
improve operations and profitability. We intend to continue focus on
the diversification of the product offering through our DuraPlate®
Product Group and leveraging our intellectual and physical assets for
opportunities of organic growth. We will also continue to try to
optimize our cost structure to improve results, including the consolidation of
our flatbed manufacturing facilities completed in 2010.
23
Operating Performance
We measure our operating performance in four key areas – Safety/Environmental, Quality, Productivity and Continuous Improvement. Our objective of being better today than yesterday and better tomorrow than we are today is simple, straightforward and easily understood by all our associates.
|
|
·
|
Safety/Environmental. We continually focus on reducing the severity and frequency of workplace injuries in order to minimize our workers compensation costs. In addition, we maintain ISO 14001 registration of our Environmental Management System at our Lafayette operations. We believe that our improved environmental, health and safety management translates into higher labor productivity and lower costs as a result of less time away from work and improved system management.
|
|
|
·
|
Quality. We monitor product quality on a continual basis through a number of means for both internal and external performance as follows:
|
|
-
|
Internal performance. Our primary internal quality measurement is Process Yield. Process Yield is a performance metric that measures the impact of all aspects of the business on our ability to ship trailers at the end of the production process. As with previous years, the expectations of the highest quality product continue to increase while maintaining Process Yield performance and reducing rework.
|
|
|
-
|
External performance. We actively measure and track our warranty claims and costs. Early life cycle warranty claims are trended for performance monitoring and have shown a steady improvement from an average of approximately 6 claims per 100 trailers in 2005 to 3 claims per 100 trailers in 2010. This information is utilized, along with other data, to drive continuous improvement initiatives relative to product quality and reliability. Through these efforts we continue to realize improved quality which has resulted in sustained decreases in warranty payments over the past eight years.
|
|
|
·
|
Productivity. We measure productivity on many fronts. Some key indicators include production line cycle-time speed, man-hours per trailer and inventory levels. Improvements over the last several years in these areas have translated into significant improvements in our ability to better manage inventory flow and control costs. During the past couple of years, we focused on productivity enhancements within manufacturing assembly and sub-assembly areas through developing the capability for mixed model production. We also established a central warehousing and distribution center to improve material flow, inventory levels and inventory accuracy within our supply chain. The successful implementation of these productivity
enhancements supported our ability to effectively manage the increases in trailer volumes realized in 2010 and anticipated in the future as compared to the previous year.
|
|
|
·
|
Cost Reduction. We believe continuous improvement is a fundamental component of our operational excellence focus. In 2010, we trained and deployed several team-focused groups through the successful integration of a Wabash Integrated Network (WIN) program which empowered the manufacturing workforce to improve their departments through continuous improvement activities in the areas throughout our company, including safety, quality, inventory management, maintenance and cost reduction. In addition, we were able to successfully complete the consolidation of our platform and dump manufacturing facilities into one location. These cost reductions, coupled with holding other costs relatively stable throughout 2010, enabled us to significantly lower our
overall manufacturing cost per unit.
|
24
Industry Trends
Truck transportation in the U.S., according to the ATA, was estimated to be a $660 billion industry in 2008. ATA estimates that approximately 69% of all freight tonnage is carried by trucks at some point during its shipment. Trailer demand is a direct function of the amount of freight to be transported. To monitor the state of the industry, we evaluate a number of indicators related to trailer manufacturing and the transportation industry. Recent trends we have observed include the following:
|
|
·
|
Transportation / Trailer Cycle. Transportation,
including trucking, is a cyclical industry that has experienced three cycles
over the last 20 years. Truck freight tonnage, according to ATA
statistics, started declining year-over-year in 2006 and remained at depressed
levels through 2009. However, 2010 data shows that freight tonnage
increased approximately 6% from 2009. The trailer industry generally
precedes transportation industry cycles. The most recently completed
cycle began in early 2001 when industry shipments totaled approximately 140,000,
reached a peak in 2006 with shipments of approximately 280,000 and reached the
bottom in 2009 with shipments of approximately 79,000
trailers. According to ACT, shipments in 2010 amounted to
approximately 120,000 trailers. As the trailer industry continues to
recover, ACT is estimating demand within the trailer industry to increase in
each of the next 3 years to approximately 195,000, 236,000 and 252,000 in 2011,
2012 and 2013, respectively. Furthermore, these increases in demand
for trailers are being driven by improvements within the dry van segment, our
largest product line. ACT is forecasting total dry van market to grow
from approximately 60,000 trailers in 2010 to 112,000, 135,000 and 153,000
trailers in 2011, 2012 and 2013, respectively, representing year over year
increases of 87%, 21% and 13%, respectively. Our view is generally
consistent with that of ACT.
|
|
|
·
|
Age of Trailer Fleets. The average age of fleets has increased during the recent industry downturn. According to ACT, the average age of dry and refrigerated vans has continued to increase and has reached historic highs in 2010 of approximately 8.5 years and 6 years, respectively. The increase in age of trailers suggests an increase in replacement demand over the next several years.
|
|
|
·
|
New Trailer Orders. According to ACT, quarterly industry order placements ranged from approximately 34,000 to 62,000 trailers in each quarter of 2010, a significant improvement from approximately 15,000 to 25,000 trailers in each quarter in 2009. Total orders in 2010 were approximately 166,000 trailers, a 105% increase from approximately 81,000 trailers ordered in 2009, driven by dry van orders, the largest segment of the trailer industry, increasing year-over-year by approximately 192%.
|
|
|
·
|
Transportation Regulations and Legislation. There are several different topics within both federal and state government regulations and legislation that are expected to have an impact on trailer demand, including:
|
|
-
|
The Federal Motor Carrier Safety Administration (the “FMCSA”) is currently looking at ways to improve the overall truck safety standards, particularly by implementing Comprehensive Safety Analysis 2010 (“CSA2010”) in December 2010. CSA2010 is considered a comprehensive driver and fleet rating system that will measure both the freight carriers and its drivers on several safety related criteria, including driver safety, equipment maintenance and overall condition of trailers. This system is expected to drive increased awareness and action by carriers as government enforcement is expected to begin by midyear 2011. Current industry estimates
indicate CSA2010 could make 5% to 10% of drivers ineligible to operate commercial equipment due to not meeting minimum safety standards.
|
|
-
|
The FMCSA issued in December 2010 a preliminary proposal for rule changes in regard to truck driver hours-of-service rules with final rules to be published in February 2011 and enforcement currently scheduled to begin by July 2011. The proposed rule changes include reductions in the driver hours per day requirement from the current 11 hours to 10 hours. Additionally, driver “re-start” requirements are expected to be lengthened from the current 34 hours to as much as 48 hours. Current estimates indicate these actions could lead to productivity losses of approximately 5% to 7%. This ruling increases the potential that a carrier’s
drop-and-hook activities will increase and, therefore, require an increase in trailer to truck ratios across the industry.
|
25
|
-
|
The FMCSA also issued in January 2011 a proposed rule change requiring the installation and use of Electronic On-Board Recorders for over-the-road trucks and buses which would be used to monitor and enforce the driver hour-of-service rules. A final ruling on this proposal is scheduled for June 2012.
|
|
-
|
The federal government put forth bills in 2010 that would increase the allowable gross vehicle weight of a semi-trailer combo from the current 80,000 pounds to 97,000 pounds. This gross vehicle weight increase would require the addition of a third axle to existing equipment with the likelihood that many fleets may elect to replace older trailers as opposed to investing in upgrading them with the third axle.
|
|
-
|
The Tax Relief Act of 2010 extended bonus depreciation provisions for 2011 and 2012. More specifically, corporations can expense 100% and 50% of certain capital investments made during 2011 and 2012, respectively. This extension will be an incentive for many fleets to increase or accelerate their purchase decisions to maximize the tax benefits available.
|
|
-
|
The California Air Resource Board (CARB) regulations mandate that refrigeration units older than 7 years may no longer operate in California. As refrigeration units become obsolete, capacity in the refrigerated segment will tighten and the increase in demand for new refrigerated trailers is likely.
|
|
|
·
|
Other Developments. Other developments and potential impacts on the industry include:
|
|
|
-
|
Miniaturization of electronic products resulting in increased density of loads could further decrease demand for dry van trailers.
|
|
|
-
|
Packaging optimization of bulk goods and the efficiency of the packaging around goods may contribute to further decreases in demand for dry van trailers.
|
|
|
-
|
Trucking company profitability, which can be influenced by factors such as fuel prices, freight tonnage volumes, and government regulations, is highly correlated with the overall economy of the U.S. Carrier profitability significantly impacts demand for, and the financial ability to purchase, new trailers.
|
|
|
-
|
Although truck driver shortages have not been a significant problem in the past year, constraints are expected to exacerbate as freight demand increases. As a result, trucking companies are under increased pressure to look for alternative ways to move freight, leading to more intermodal freight movement. We believe that railroads are at or near capacity, which will limit their ability to respond to freight demand pressures. We therefore expect that the majority of freight will still be moved by truck.
|
26
Results of Operations
The following table sets forth certain operating data as a percentage of net sales for the periods indicated:
|
Years Ended December 31,
|
||||||||||||
|
2010
|
2009
|
2008
|
||||||||||
|
Net sales
|
100.0 | % | 100.0 | % | 100.0 | % | ||||||
|
Cost of sales
|
95.6 | 106.8 | 97.5 | |||||||||
|
Gross profit
|
4.4 | (6.8 | ) | 2.5 | ||||||||
|
General and administrative expenses
|
5.1 | 9.5 | 5.3 | |||||||||
|
Selling expenses
|
1.7 | 3.3 | 1.7 | |||||||||
|
Impairment of goodwill
|
- | - | 7.9 | |||||||||
|
Loss from operations
|
(2.4 | ) | (19.6 | ) | (12.4 | ) | ||||||
|
Increase in fair value of warrant
|
(19.0 | ) | (9.9 | ) | - | |||||||
|
Interest expense
|
(0.6 | ) | (1.3 | ) | (0.6 | ) | ||||||
|
Other, net
|
(0.1 | ) | (0.2 | ) | - | |||||||
|
Loss before income taxes
|
(22.1 | ) | (31.0 | ) | (13.0 | ) | ||||||
|
Income tax (benefit) expense
|
- | (0.9 | ) | 2.0 | ||||||||
|
Net loss
|
(22.1 | ) % | (30.1 | ) % | (15.0 | ) % | ||||||
2010 Compared to 2009
Net Sales
Net sales in 2010 were $640.4 million, an increase of $302.6 million, or 89.6%, compared to 2009. By business segment, net external sales and related trailers sold were as follows (dollars in millions):
|
Year Ended December 31,
|
||||||||||||
|
2010
|
2009
|
% Change
|
||||||||||
|
Sales by Segment
|
||||||||||||
|
Manufacturing
|
$ | 542.0 | $ | 265.5 | 104.1 | |||||||
|
Retail and Distribution
|
98.4 | 72.3 | 36.1 | |||||||||
|
Total
|
$ | 640.4 | $ | 337.8 | 89.6 | |||||||
|
New Trailers
|
(units)
|
|||||||||||
|
Manufacturing
|
23,400 | 12,000 | 95.0 | |||||||||
|
Retail and Distribution
|
1,500 | 800 | 87.5 | |||||||||
|
Total
|
24,900 | 12,800 | 94.5 | |||||||||
|
Used Trailers
|
2,700 | 3,200 | (15.6 | ) | ||||||||
Manufacturing segment sales were $542.0 million for 2010, up $276.5 million, or 104.1%, compared to 2009. The increase in sales is due primarily to a 95.0% increase in new trailer shipments with approximately 23,400 trailers shipped in 2010 compared to 12,000 trailers shipped in the prior year as a result of the overall strengthening in market demand. This increase in unit volume is coupled with a 5.0% increase in average selling prices as compared to the previous year due to customer and product mix and higher prices necessary to cover commodity cost increases. Non-trailer related net sales increased $16.5 million as compared to the
prior year due to increased demand for our DuraPlate® composite products.
27
Retail and distribution segment sales were $98.4 million in 2010, up $26.1 million, or 36.1%, compared to the prior year. New trailer sales increased $17.8 million, or 86.5%, due to an 87.5% increase in shipments. Used trailer sales were up $3.5 million, or 18.4%, as increases in the average selling price per unit resulting from higher priced late model trailers more than offset the 500 unit decline in used trailer shipments. Parts and service sales were up $4.7 million, or 14.5%, due to increased market demand.
Cost of Sales
Cost of sales for 2010 was $612.3 million, an increase of $251.5 million, or 69.7%, compared to 2009. As a percentage of net sales, cost of sales was 95.6% for 2010 compared to 106.8% for 2009.
Manufacturing segment cost of sales, as detailed in the following table, was $521.9 million for 2010, an increase of $233.6 million, or 81.0%, compared to 2009. As a percentage of net sales, cost of sales was 96.3% for 2010 compared to 108.6% in 2009.
|
Year Ended December 31,
|
||||||||||||||||
|
Manufacturing Segment
|
2010
|
2009
|
||||||||||||||
|
(dollars in millions)
|
||||||||||||||||
|
% of Net
Sales
|
% of Net
Sales
|
|||||||||||||||
|
Material Costs
|
$ | 406.4 | 75.0 | % | $ | 202.5 | 76.3 | % | ||||||||
|
Other Manufacturing Costs
|
115.5 | 21.3 | % | 85.8 | 32.3 | % | ||||||||||
| $ | 521.9 | 96.3 | % | $ | 288.3 | 108.6 | % | |||||||||
Cost of sales is composed of material costs, a variable expense, and other
manufacturing costs, comprised of both fixed and variable expenses, including
direct and indirect labor, outbound freight and overhead
expenses. Material costs were 75.0% of net sales in 2010 compared to
76.3% in 2009. The 1.3% decrease was the result of utilization
of unfavorable fixed price aluminum contracts that we were obligated to fulfill
in the prior year, favorable customer and product mix as well as increased
production volume, which resulted in favorable quantity
discounts. These decreases were offset by increases in commodity
costs during 2010. In addition, other manufacturing costs decreased
from 32.3% of net sales in 2009 to 21.3% in 2010. The 11.0% decrease
is primarily the result of an 11,400 unit increase in new trailer sales as
compared to the prior year, which resulted in allocating our fixed overhead
costs over more trailers, and the benefit of favorable experience on trailer warranties which expired of $3.2 million.
Retail and distribution segment cost of sales was $90.2 million in 2010, an increase of $17.5 million, or 24.1%, compared to 2009. As a percentage of net sales, cost of sales was 91.7% in 2010 compared to 100.6% in 2009. The 8.9% improvement as a percentage of sales was primarily the result of increased new trailer and parts and service volumes coupled with inventory valuation reserves on both new and used trailers recognized in the prior year not repeated in the current year.
Gross Profit
Gross profit for 2010 was $28.1 million, an increase of $51.0 million compared to 2009. Gross profit as a percent of sales was 4.4% compared to negative 6.8% for 2009. Gross profit by segment was as follows (in millions):
|
Year Ended December 31,
|
||||||||
|
2010
|
2009
|
|||||||
|
Gross Profit by Segment:
|
||||||||
|
Manufacturing
|
$ | 20.1 | $ | (22.7 | ) | |||
|
Retail and Distribution
|
8.2 | (0.4 | ) | |||||
|
Intercompany Profit Eliminations
|
(0.2 | ) | 0.2 | |||||
|
Total
|
$ | 28.1 | $ | (22.9 | ) | |||
Manufacturing segment gross profit was $20.1 million for 2010 compared to negative $22.7 million in 2009. Gross profit as a percentage of sales was 3.7% in 2010 as compared to a negative 8.5% in 2009. The increase in gross profit and gross profit margin was driven by a 95.0% increase in new trailer volumes and favorable customer and product mix.
28
Retail and distribution segment gross profit was $8.2 million for 2010, an increase of $8.6 million compared to 2009. Gross profit as a percentage of sales was 8.3% compared to negative 0.6% for the prior year. This increase is primarily due to increased new trailer and parts and service volumes coupled with inventory valuation reserves on both new and used trailers recognized in the prior year not repeated in the current year.
General and Administrative Expenses
General and administrative expenses increased $0.8 million, or 2.6%, to $32.8 million in 2010 compared to 2009 as a $1.9 million reduction in salaries and other employee related costs achieved through the implementation of various cost cutting initiatives made during 2009 to adjust our cost structure to match market demand were fully realized during the current year. This decrease was more than offset by expenses related to annual employee incentive plans not incurred in the previous year period and higher professional services primarily related to legal defense costs.
Selling Expenses
Selling expenses decreased $0.5 million, or 4.5%, to $10.7 million in 2010 compared to 2009. This decrease, the result of our cost cutting initiatives to adjust our cost structure to match market demand, provided a $0.8 million reduction in salaries and other employee related costs in the current year and was offset by increases in expenses related to annual employee incentive plans not incurred in the previous year period.
Other Income (Expense)
Increase in fair value of warrant of $121.6 million represents the expense recognized as a result of the fair value adjustment for the warrant issued to Trailer Investments as a part of the Securities Purchase Agreement entered into in July 2009. The increase results from the $74.6 million and $47.0 million increases, respectively, in fair value of the warrant recorded prior to the exercise of 16,137,500 warrant shares on May 28, 2010 and 9,349,032 warrant shares on September 17, 2010. As a result, the warrant shares were fully exercised and were no longer outstanding as of December 31, 2010.
Income Taxes
In 2010, we recognized an income tax benefit of less than $0.1 million compared to a benefit of $3.0 million in 2009. The effective rate for 2010 was less than 0.1%. This rate differs from the U.S. federal statutory rate of 35% primarily due to the recognition of a full valuation allowance against our net deferred tax asset and the effect of a non-deductible adjustment to the fair market value of the warrant we issued in 2009. As of December 31, 2010, we had $180 million of remaining U.S. federal income tax net operating loss carryforwards, which will begin to expire in 2022 if unused, and which may be subject to other limitations
under IRS rules. We have various multi-state income tax net operating loss carryforwards, which have been recorded as a deferred income tax asset, of approximately $18 million, before valuation allowances. We also have various U.S. federal income tax credit carryforwards of approximately $1 million, which will expire beginning in 2013, if unused.
29
2009 Compared to 2008
Net Sales
Net sales in 2009 were $337.8 million, a decrease of $498.4 million, or 59.6%, compared to 2008. By business segment, net external sales and related trailers sold were as follows (dollars in millions):
|
Year Ended December 31,
|
||||||||||||
|
2009
|
2008
|
% Change
|
||||||||||
|
Sales by Segment
|
||||||||||||
|
Manufacturing
|
$ | 265.5 | $ | 694.2 | (61.8 | ) | ||||||
|
Retail and Distribution
|
72.3 | 142.0 | (49.1 | ) | ||||||||
|
Total
|
$ | 337.8 | $ | 836.2 | (59.6 | ) | ||||||
|
New Trailers
|
(units)
|
|||||||||||
|
Manufacturing
|
12,000 | 30,800 | (61.0 | ) | ||||||||
|
Retail and Distribution
|
800 | 2,500 | (68.0 | ) | ||||||||
|
Total
|
12,800 | 33,300 | (61.6 | ) | ||||||||
|
Used Trailers
|
3,200 | 6,600 | (51.5 | ) | ||||||||
Manufacturing segment sales for 2009 were $265.5 million, a decrease of $428.7 million, or 61.8%, compared to 2008. The reduction in sales is primarily due to the continued weak market demand as new trailer sales volumes decreased approximately 18,800 trailers, or 61.0%. Average selling prices declined slightly in 2009 as compared to the prior year due to customer demand and product mix.
Retail and distribution segment sales were $72.3 million in 2009, a decrease of $69.7 million, or 49.1%, compared to 2008. Weak market demand across all product lines yielded reduced volumes as compared to 2008. New trailer sales decreased $47.6 million, or 69.7%, due to a 68.0% reduction in volumes. Used trailer sales were down $17.4 million, or 47.7%, primarily due to a 51.5% reduction in volumes. Parts and service sales were down $4.6 million, or 12.5%.
Cost of Sales
Cost of sales for 2009 was $360.8 million, a decrease of $454.5 million, or 55.8% compared to 2008. As a percentage of net sales, cost of sales was 106.8% in 2009 compared to 97.5% in 2008.
Manufacturing segment cost of sales, as detailed in the following table, was $288.3 million for 2009, a decrease of $392.1 million, or 57.6%, compared to 2008. As a percentage of net sales, cost of sales was 108.6% in 2009 compared to 98.0% in 2008.
|
Year Ended December 31,
|
||||||||||||||||
|
Manufacturing Segment
|
2009
|
2008
|
||||||||||||||
|
(dollars in millions)
|
||||||||||||||||
|
% of Net
Sales
|
% of Net
Sales
|
|||||||||||||||
|
Material Costs
|
$ | 202.5 | 76.3 | % | $ | 517.9 | 74.6 | % | ||||||||
|
Other Manufacturing Costs
|
85.8 | 32.3 | % | 162.5 | 23.4 | % | ||||||||||
| $ | 288.3 | 108.6 | % | $ | 680.4 | 98.0 | % | |||||||||
As shown in the table above, cost of sales is composed of material costs, a variable expense, and other manufacturing costs, comprised of both fixed and variable expenses, including direct and indirect labor, outbound freight, and overhead expenses. Material costs were 76.3% of net sales in 2009 compared to 74.6% in 2008. The 1.7% increase is primarily the result of increased raw material commodity and component costs driven by unfavorable fixed price aluminum contracts as compared to market pricing which could not be offset by increases in selling prices. In addition, our other manufacturing costs increased from 23.4% of net sales to 32.3% in 2009. The 8.9% increase is
primarily the result of the inability to reduce fixed costs in proportion to the 61.0% decrease in new trailer volumes.
30
Retail and distribution segment cost of sales was $72.7 million in 2009, a decrease of $63.2 million, or 46.5%, compared to the 2008 period. As a percentage of net sales, cost of sales was 100.6% in 2009 compared to 95.7% in 2008. The 4.9% increase was primarily the result of a 9.9% increase as a percent of net sales in direct and indirect labor and overhead expenses due to the inability to reduce these costs in proportion to the 68.0% and 51.5% reductions in new and used trailer volumes, respectively. This increase in cost of sales as a percentage of net sales compared to the prior year was further magnified by valuation reserves required due to the depressed market conditions
for both new and used trailers.
Gross Profit
Gross profit in 2009 was negative $22.9 million, down $43.8 million compared to 2008. Gross profit as a percent of sales was negative 6.8% in 2009 compared to 2.5% in 2008. Gross profit by segment was as follows (in millions):
|
Year Ended December 31,
|
||||||||
|
2009
|
2008
|
|||||||
|
Gross Profit by Segment:
|
||||||||
|
Manufacturing
|
$ | (22.7 | ) | $ | 13.8 | |||
|
Retail and Distribution
|
(0.4 | ) | 6.1 | |||||
|
Intercompany Profit Eliminations
|
0.2 | 1.0 | ||||||
|
Total
|
$ | (22.9 | ) | $ | 20.9 | |||
Manufacturing segment gross profit was negative $22.7 million in 2009, a decrease of $36.5 million compared to 2008. Gross profit as a percentage of sales was negative 8.5% in 2009 compared to 2.0% in 2008. The decrease in gross profit and gross profit margin percentage was primarily driven by the 61.0% decline in new trailer volumes coupled with higher raw material and component part costs that outpaced increases in selling prices.
Retail and distribution segment gross profit was negative $0.4 million in 2009, a decrease of $6.5 million compared to 2008. Gross profit as a percentage of sales was negative 0.6% compared to 4.3% in 2008 due to reduced trailer and parts and service volumes as well as continued pricing pressures on new and used trailers.
General and Administrative Expenses
General and administrative expenses were $32.0 million in 2009, a decrease of $12.1 million, or 27.5%, compared to the prior year. The decrease was the result of our cost cutting initiatives to adjust our cost structure to match the current market demand. These initiatives resulted in an $8.2 million reduction in salaries and employee related costs, net of severances, due to headcount and base pay reductions made in the current year as well as a reduction of approximately $3.9 million in other various discretionary costs.
Selling Expenses
Selling expenses were $11.2 million in 2009, a decrease of $3.1 million, or 21.8%, compared to the prior year. The decrease was the result of our cost cutting initiatives and efforts to adjust our cost structure to match the current market demand. These initiatives resulted in a $2.3 million reduction in salaries and other employee related costs, net of severances, due to headcount and base pay reductions as well as reductions in advertising and promotional activities of $0.6 million.
Other Income (Expense)
Increase in fair value of warrant of $33.4 million represents the expense recognized as a result of the fair value adjustment for the warrant issued to Trailer Investments as a part of the Securities Purchase Agreement entered into on July 17, 2009.
31
Other, net includes an expense of $0.9 million relating to the termination of our interest rate swaps previously designated as cash flow hedges. The current period ending December 31, 2009 includes the acceleration of amounts previously reported through Other Comprehensive Income (Loss) as the designated hedged transaction was considered no longer probable. The 2009 period also includes an expense of $0.3 million for the proportionate write-off of deferred debt issuance costs recognized on the amendment and reduction in capacity of our Revolving Credit Facility, which was effective on August 3, 2009.
Income Taxes
In 2009, we recognized income tax benefit of $3.0 million compared to income tax expense of $17.1 million in 2008. The effective rate for 2009 was (2.9%). This rate differs from the U.S. federal statutory rate of 35% primarily due to the recognition of a full valuation allowance against our net deferred tax asset, the effect of a non-deductible adjustment to the fair market value of our warrant and the reduction in valuation allowance of $2.9 million whereby, in January 2010, we filed a claim with the IRS for a refund of $2.9 million for U.S. federal alternative minimum taxes previously paid during the years 2004 through 2006 as provided under
the provisions of the Worker, Homeownership, and Business Assistance Act of 2009, which was signed into law in November 2009.
As of December 31, 2009, we had a U.S. federal tax net operating loss carryforward of approximately $167 million, which will expire beginning in 2022, if unused, and which may be subject to other limitations under IRS rules. We have various multi-state income tax net operating loss carryforwards, which have been recorded as a deferred income tax asset, of approximately $17 million, before valuation allowances. We also have various U.S. federal income tax credit carryforwards, which will expire beginning in 2013, if unused.
Liquidity and Capital Resources
Capital Structure
In July 2009, we entered into a Securities Purchase Agreement (the “Securities Purchase Agreement”) with Trailer Investments pursuant to which Trailer Investments purchased 20,000 shares of Series E redeemable preferred stock (“Series E Preferred”), 5,000 shares of Series F redeemable preferred stock (“Series F Preferred”), and 10,000 shares of Series G redeemable preferred stock (“Series G Preferred”, and together with the Series E Preferred and the Series F Preferred, the “Series E-G Preferred Stock”) for an aggregate purchase price of $35.0 million. Trailer Investments also received a warrant
that was exercisable at $0.01 per share for 24,762,636 newly issued shares of our common stock (the “Warrant”) representing, on August 3, 2009, the date the Warrant was delivered, 44.21% of our issued and outstanding common stock after giving effect to the issuance of the shares underlying the Warrant, subject to upward adjustment to maintain that percentage if currently outstanding options were exercised.
On May 28, 2010, we closed on a public offering of our common stock, par value $0.01 per share (the “Initial Offering”), which consisted of 11,750,000 shares of common stock sold by us and 16,137,500 shares of common stock sold by Trailer Investments as a selling stockholder, each at a purchase price of $6.50 per share. The shares of common stock sold in the Initial Offering by Trailer Investments included 3,637,500 shares sold pursuant to the underwriters’ exercise in full of their option to purchase additional shares to cover over-allotments. All shares sold by Trailer Investments were issued upon the partial exercise of the Warrant it held and the Replacement Warrant, as
defined below, was issued to Trailer Investments on May 28, 2010. We did not receive any proceeds from the sale of the shares by Trailer Investments. We generated proceeds from the Initial Offering, net of underwriting discounts and commissions, of $71.9 million and used the net proceeds to redeem all of our outstanding preferred stock and to repay a portion of our outstanding indebtedness under our revolving credit facility.
From the net proceeds of the Initial Offering, we redeemed (the “Redemption”) all outstanding shares of our Series E-G Preferred Stock at a liquidation value of $1,000 per share, or $35.0 million, plus accrued and unpaid dividends and a premium adjustment of 20% as required under the Securities Purchase Agreement for any redemption made prior to August 2014. The Series E Preferred, Series F Preferred and Series G Preferred paid an annual dividend rate of 15%, 16% and 18%, respectively, based on liquidation value. Through the date of the Redemption, accrued and unpaid dividends totaled approximately $4.8 million. The
premium adjustment for early redemption of $8.0 million was applied to the sum of the liquidation value and accrued and unpaid dividends. The total redemption price of the Series E-G Preferred Stock including all accrued and unpaid dividends was approximately $47.8 million. Certificates of elimination were filed on September 21, 2010 with the Secretary of State of the State of Delaware to eliminate from the Company’s Certificate of Incorporation all provisions that were set forth in the certificates of designation for the Series E-G Preferred Stock.
32
If a change of control, meaning if more than 50% of the voting power is transferred or acquired by any person other than Trailer Investments and its affiliates, occurs within 12 months of the date of the Redemption (by or before May 28, 2011), Trailer Investments will be entitled to receive an aggregate payment equal to $74.6 million, representing the difference between what it received in the Redemption and what it would have been entitled to receive on the date of the Redemption if a change of control had occurred on that date.
Also in connection with our Initial Offering of common stock, we amended the warrant originally issued to Trailer Investments on August 3, 2009 (the “Warrant,” and, as amended, the “Replacement Warrant”). The Warrant was modified so that (i) the Warrant would no longer adjust or increase based upon any limitation on our ability to fully utilize our net operating loss (“NOL”) carryforwards and (ii) the Warrant was increased by a fixed number of 750,000 warrant shares in lieu of the market price anti-dilution adjustment that would have otherwise applied as a result of the Initial Offering. The Initial Offering
of common stock included 16,137,500 shares sold by Trailer Investments pursuant to a partial exercise of the Warrant. The partial net exercise of the Warrant was made by Trailer Investments via the forfeiture of 22,812 shares of common stock under the Warrant.
On September 17, 2010, Trailer Investments sold the Replacement Warrant to the several underwriters, who exercised the Replacement Warrant in full and sold the 9,349,032 shares underlying the Replacement Warrant in an underwritten public offering at a price per share of $6.75 (the “Second Offering”). We did not offer or sell any shares in the Second Offering nor did we receive any proceeds from the Second Offering. The exercise of the Replacement Warrant was made via the forfeiture of 13,549 shares of common stock. As a result of this offering and the related cashless exercise, the Replacement Warrant was fully exercised
and is no longer outstanding. Pursuant to the terms of the Investors Rights Agreement, Trailer Investments had significant rights that no longer exist as a result of the consummation of the offering effective September 17, 2010. These rights included the ability to designate five persons for election to the board of directors for so long as Trailer Investments and its affiliates beneficially owned at least 10% of our outstanding common stock. On September 21, 2010, we received resignation letters from each of the four board members designated by Trailer Investments.
As a result of the Initial Offering and our ability to use the net proceeds to redeem all of our outstanding preferred stock and repay a portion of our outstanding indebtedness under the revolving credit facility, we have been able to reduce our total debt and significantly improve our overall capital structure providing us the additional liquidity necessary to meet working capital requirements as the overall demand in our industry grows.
As of December 31, 2010, our debt to equity ratio was approximately
0.5:1.0. Our long-term objective is to generate operating cash flows
sufficient to fund normal working capital requirements, to fund capital
expenditures and to be positioned to take advantage of market
opportunities. For 2011 we expect to fund operating results, working
capital requirements and capital expenditures through cash flows from operations
as well as available borrowings.
Debt Agreements and Related Amendments
Concurrent with entering into the Securities Purchase Agreement, in July 2009, we entered into a Third Amended and Restated Loan and Security Agreement (the “Facility”) with our lenders, effective August 3, 2009, with a maturity date of August 3, 2012. The Facility is guaranteed by certain subsidiaries of ours and secured by substantially all of our assets. The Facility has a capacity of $100 million, subject to a borrowing base and other discretionary reserves. The Facility amends and restates our previous revolving credit facility, and our lenders waived certain events of default that had occurred under the previous
revolving credit facility and waived the right to receive default interest during the time the events of default had continued.
In May 2010, we entered into the Consent and Amendment No. 1 to the Third Amended and Restated Loan and Security Agreement (the “Amended Facility”) with our lenders. The Amended Facility amends and restates the Facility. The Amended Facility was entered into to permit the early redemption of our Series E-G Preferred Stock and required us to pay down our revolving credit facility by at least $23.0 million. The repayment did not reduce our revolving loan commitments. Pursuant to the Amended Facility, if the availability under our revolving credit facility is less than $15.0 million at any time before the earlier
of August 14, 2011 or the date that monthly financial statements are delivered for the month ending June 30, 2011, we would be required to maintain a varying minimum EBITDA and would be restricted in the amount of capital expenditures we could make during such period. If our availability is less than $20.0 million thereafter, we would be required to maintain a fixed charge coverage ratio for the 12 month period ending on the last day of the calendar month that ended most recently prior to such time of not less than 1.1 to 1.0. In addition, the Amended Facility modifies our borrowing base by eliminating a $12.5 million facility reserve while reducing the fixed assets sub-limit by $12.5 million.
33
The interest rate on borrowings under our revolving credit facility from the date of effectiveness through July 31, 2010 was LIBOR plus 4.25% or the prime rate of Bank of America, N.A. (the “Prime Rate”) plus 2.75%. After July 31, 2010, the interest rate is based upon average unused availability and will range between LIBOR plus 3.75% to 4.25% or the Prime Rate plus 2.25% to 2.75%. We are required to pay a monthly unused line fee equal to 0.375% times the average daily unused availability along with other customary fees and expenses of our agent and lenders. All interest and fees are paid monthly.
Our revolving credit facility contains customary representations, warranties, affirmative and negative covenants, including, without limitation, restrictions on mergers, dissolutions, acquisitions, indebtedness, affiliate transactions, the occurrence of liens, payments of subordinated indebtedness, disposition of assets, leases and changes to organizational documents.
Our revolving credit facility contains customary events of default including, without limitation, failure to pay obligations when due under the facility, false and misleading representations, breaches of covenants (subject in some instances to cure and grace periods), defaults on certain other indebtedness, the occurrence of certain uninsured losses, business disruptions for a period of time that materially adversely affects the capacity to continue business on a profitable basis, changes of control and the incurrence of certain judgments that are not stayed, released or discharged within 30 days.
As of December 31, 2010, we were in compliance with all covenants of the Amended Facility.
Cash Flow
Cash used in operating activities amounted to $30.7 million in 2010 compared to $7.0 million in 2009. The use of cash from operating activities for the current year was primarily the result of a $31.3 million increase in our working capital offset slightly by $0.6 million of net income, adjusted for various non-cash activities, including depreciation, amortization, stock-based compensation and changes in the fair value of our warrant. Changes in working capital for the current year can be attributed to the increased production levels in comparison to the previous year and the related increases in purchasing activities have resulted in higher working capital requirements. Changes
in key working capital accounts for 2010 compared to the prior year are summarized below (in millions):
|
2010
|
2009
|
Change
|
||||||||||
|
Accounts receivable
|
$ | (20.8 | ) | $ | 20.8 | $ | (41.6 | ) | ||||
|
Inventories
|
(59.1 | ) | 41.1 | (100.2 | ) | |||||||
|
Accounts payable and accrued liabilities
|
45.3 | (22.7 | ) | 68.0 | ||||||||
Accounts receivable increased by $20.8 million in 2010 as compared to a $20.8 million decrease in 2009. Days sales outstanding, a measure of working capital efficiency that measures the amount of time a receivable is outstanding, improved to approximately 14 days in 2010 compared to 21 days in 2009 due to timing of collections. The increase in accounts receivable for 2010 was primarily the result of the timing of shipments as trailer demands increased throughout the current year resulting in an 89.5% increase in our consolidated net sales as compared to the prior year. Inventory increased $59.1 million during 2010 compared to a decrease of $41.1 million in 2009. The
increase in inventory for 2010 was due to higher new trailer inventories and raw materials resulting from increased order levels for 2010 as compared to 2009. Despite the increased inventory levels, our inventory turns, a commonly used measure of working capital efficiency that measures how quickly inventory turns per year, improved to approximately 7 times in 2010 as compared to 5 times in 2009 due to our ability to manage inventory levels as the overall demand for trailers increased. Accounts payable and accrued liabilities increased $45.3 million in 2010 compared to a decrease of $22.7 million in 2009. The increase in the current year was also due primarily to higher production levels throughout 2010 as compared to the previous year. Days payable outstanding, a measure of working capital efficiency that measures the amount of time a payable
is outstanding, was reduced to 29 days for 2010 compared to 31 days for 2009 due primarily to the timing of shipments relative to our production levels.
34
Investing activities provided less than $0.1 million during 2010 compared to $0.7 million used in 2009. The uses of cash from investing activities for both the 2010 and 2009 periods have been limited to capital spending for required replacement projects and other cost reduction initiatives. The current year period uses were offset by the proceeds received from the sale of our Transcraft production facilities located in Anna, Illinois and Mt. Sterling, Kentucky.
Financing activities provided $50.8 million during 2010 primarily as a result of closing the Initial Offering of our common stock on May 28, 2010 as well as an increase in our borrowings against our revolving credit facility due to higher working capital requirements necessary to fund operational activities. We generated proceeds, net of underwriting discounts and commissions, of $71.9 million from the Initial Offering and used it to redeem all of our outstanding preferred stock and repay a portion of our outstanding indebtedness on our revolving credit facility.
As of December 31, 2010, our liquidity position, defined as cash on hand and available borrowing capacity, amounted to $60.4 million, an improvement of $39.4 million from December 31, 2009. Total debt and capital lease obligations amounted to approximately $59.6 million as of December 31, 2010. As a result of closing on the Initial Offering of our common stock on May 28, 2010 and concurrent with our redemption of all outstanding Series E-G Preferred Stock, as described in the Capital Structure section above, we believe our liquidity is adequate to meet our expected operating results, working capital needs and capital expenditures for 2011.
In light of the uncertain market and economic conditions, we aggressively managed our cost structure, capital expenditures and cash position throughout the past several years. During 2008 and 2009, we implemented various cost reduction actions resulting in decreases of overhead and operating costs, including: reductions in hourly and salary headcount and temporary reductions in compensation and benefits. In addition, we have optimized our operations through plant, assembly line and warehouse consolidation projects. As we continue to see improvements to both the overall the trailer industry as well as our operating performance metrics during 2011, management expects to begin to
reinstate some of the temporary cost reduction initiatives previously implemented.
Capital Expenditures
Capital spending for 2010 amounted to approximately $1.8 million as our efforts to manage cash flows and enhance liquidity limited our capital expenditures to required replacement projects and cost reduction initiatives. We anticipate increasing our capital expenditures to approximately $5 million in 2011in order to support growth and improvement initiatives within our facilities.
Off-Balance Sheet Transactions
As of December 31, 2010, we had approximately $1.6 million in operating lease commitments. We did not enter into any material off-balance sheet debt or operating lease transactions during the year.
Outlook
The demand environment for trailers is improving, as evidenced by the
increases in our new trailer shipments and backlog as well as trailer industry
forecasts for the upcoming years. According to the most recent ACT
estimates, total trailer industry shipments for 2011 are expected to be up 63%
from 2010 to approximately 195,000 trailers. By product type, ACT is
expecting the dry van market to lead the industry with increases of
approximately 87% in 2011 compared to 2010 and total van trailer shipments will
be up approximately 71% in 2011 compared to 2010. ACT is forecasting
that platform trailer shipments will increase approximately 60% and dump trailer
shipments will increase approximately 57% in 2011. For 2012, ACT
estimates that shipments will grow approximately 21% to a total of 236,000
trailers with the dry van segment leading the industry with shipments increasing
approximately 21% to a total of 135,000 dry van trailers. Downside
concerns for 2011 relate to continued issues with the global economy,
unemployment, tight credit markets, as well as depressed housing and
construction-related markets in the U.S. Taking into consideration
recent economic and industry forecasts, as well as discussions with customers
and suppliers, management expects demand for new trailers to improve as we move
through 2011 and the economy continues to improve.
We believe we are well-positioned for long-term growth in the industry because: (1) our core customers are among the dominant participants in the trucking industry; (2) our DuraPlate® trailer continues to have increased market acceptance; (3) our focus is on developing solutions that reduce our customers’ trailer maintenance costs; and (4) we expect some expansion of our presence into the mid-market carriers.
35
While our expectations for industry volumes are generally in line with those of ACT, our challenges as we proceed into 2011, a period of higher demand, will primarily relate to pricing of new trailers and rising commodity costs. Raw material and component costs have risen and remain volatile as overall demand will drive an increase in prices as the economy improves. As has been our policy, we will endeavor to pass along raw material and component price increases to our customers. We have a focus on continuing to develop innovative new products that both add value to our customers’ operations and allow us to continue to differentiate our products from the competition in order
to return to profitability.
Based on industry forecasts, conversations with our customers regarding their current requirements and our existing backlog of orders, we estimate that for the full year 2011 our total new trailers sold will be between 38,000 and 42,000, an increase from 2010 of approximately 53% to 69%.
Contractual Obligations and Commercial Commitments
A summary of payments of our contractual obligations and commercial commitments, both on and off balance sheet, as of December 31, 2010 are as follows (in millions):
|
2011
|
2012
|
2013
|
2014
|
2015
|
Thereafter
|
Total
|
||||||||||||||||||||||
|
DEBT:
|
||||||||||||||||||||||||||||
|
Revolving Facility (due 2012)
|
$ | - | $ | 55.0 | $ | - | $ | - | $ | - | $ | - | $ | 55.0 | ||||||||||||||
|
Capital Leases (including principal and interest)
|
0.8 | 3.7 | 0.2 | - | - | - | 4.7 | |||||||||||||||||||||
|
TOTAL DEBT
|
$ | 0.8 | $ | 58.7 | $ | 0.2 | $ | - | $ | - | $ | - | $ | 59.7 | ||||||||||||||
|
OTHER:
|
||||||||||||||||||||||||||||
|
Operating Leases
|
$ | 0.5 | $ | 0.3 | $ | 0.3 | $ | 0.2 | $ | 0.1 | $ | 0.2 | $ | 1.6 | ||||||||||||||
|
TOTAL OTHER
|
$ | 0.5 | $ | 0.3 | $ | 0.3 | $ | 0.2 | $ | 0.1 | $ | 0.2 | $ | 1.6 | ||||||||||||||
|
OTHER COMMERCIAL COMMITMENTS:
|
||||||||||||||||||||||||||||
|
Letters of Credit
|
$ | 5.8 | $ | - | $ | - | $ | - | $ | - | $ | - | $ | 5.8 | ||||||||||||||
|
Purchase Commitments
|
34.3 | - | - | - | - | - | 34.3 | |||||||||||||||||||||
|
TOTAL OTHER COMMERCIAL COMMITMENTS
|
$ | 40.1 | $ | - | $ | - | $ | - | $ | - | $ | - | $ | 40.1 | ||||||||||||||
|
TOTAL OBLIGATIONS
|
$ | 41.4 | $ | 59.0 | $ | 0.5 | $ | 0.2 | $ | 0.1 | $ | 0.2 | $ | 101.4 | ||||||||||||||
Scheduled payments for our Amended Facility exclude interest payments as rates are variable. Borrowings under the Amended Facility bear interest at a variable rate based on the London Interbank Offer Rate (LIBOR) or a base rate determined by the lender’s prime rate plus an applicable margin, as defined in the agreement. The interest rate on borrowings under our revolving credit facility from the date of effectiveness through July 31, 2010 was LIBOR plus 4.25% or the prime rate of Bank of America, N.A. (the “Prime Rate”) plus 2.75%. After July 31, 2010, the interest rate is based upon average unused availability and will range between LIBOR plus 3.75% to 4.25% or
the Prime Rate plus 2.25% to 2.75%. We are required to pay a monthly unused line fee equal to 0.375% times the average daily unused availability along with other customary fees and expenses of our agent and lenders. All interest and fees are paid monthly.
Capital leases represent the present value of future minimum lease payments. Operating leases represent the total future minimum lease payments.
We have $34.3 million in purchase commitments through December 2010 for aluminum, which is within normal production requirements.
We have standby letters of credit totaling $5.8 million issued in connection with workers compensation claims and surety bonds.
36
Significant Accounting Policies and Critical Accounting Estimates
Our significant accounting policies are more fully described in Note 2 to our consolidated financial statements. Certain of our accounting policies require the application of significant judgment by management in selecting the appropriate assumptions for calculating financial estimates. By their nature, these judgments are subject to an inherent degree of uncertainty. These judgments are based on our historical experience, terms of existing contracts, our evaluation of trends in the industry, information provided by our customers and information available from other outside sources, as appropriate.
We consider an accounting estimate to be critical if it requires us to make assumptions about matters that were uncertain at the time we were making the estimate or changes in the estimate or different estimates that we could have selected would have had a material impact on our financial condition or results of operations.
The table below presents information about the nature and rationale for our critical accounting estimates:
|
Balance Sheet
Caption
|
Critical Estimate
Item
|
Nature of Estimates
Required
|
Assumptions/
Approaches Used
|
Key Factors
|
||||
|
Other accrued liabilities and other non-current liabilities
|
Warranty
|
Estimating warranty requires us to forecast the resolution of existing claims and expected future claims on products sold.
|
We base our estimate on historical trends of trailers sold and payment amounts, combined with our current understanding of the status of existing claims, recall campaigns and discussions with our customers.
|
Failure rates and estimated repair costs
|
||||
|
Accounts receivable
|
Allowance for doubtful accounts
|
Estimating the allowance for doubtful accounts requires us to estimate the financial capability of customers to pay for products.
|
We base our estimates on historical experience, the time an account is outstanding, customer’s financial condition and information from credit rating services.
|
Customer financial condition
|
||||
|
Inventories
|
Lower of cost or market write-downs
|
We evaluate future demand for products, market conditions and incentive programs.
|
Estimates are based on recent sales data, historical experience, external market analysis and third party appraisal services.
|
Market conditions
Product type
|
||||
|
Property, plant and equipment, intangible assets, and other assets
|
Valuation of long- lived assets
|
We are required periodically to review the recoverability of certain of our assets based on projections of anticipated future cash flows, including future profitability assessments of various product lines.
|
We estimate cash flows using internal budgets based on recent sales data, and independent trailer production volume estimates.
|
Future production estimates
|
||||
|
Deferred income taxes
|
Recoverability of deferred tax assets - in particular, net operating loss carry-forwards
|
We are required to estimate whether recoverability of our deferred tax assets is more likely than not based on forecasts of taxable earnings.
|
We use projected future operating results, based upon our business plans, including a review of the eligible carry-forward period, tax planning opportunities and other relevant considerations.
|
Variances in future projected profitability, including by taxing entity
Tax law changes
|
||||
|
Additional paid-in capital
|
Stock-based compensation
|
We are required to estimate the fair value of all stock awards we grant.
|
We use a binomial valuation model to estimate the fair value of stock awards. We feel the binomial model provides the most accurate estimate of fair value.
|
Risk-free interest rate
Historical volatility
Dividend yield
Expected term
|
37
In addition, there are other items within our financial statements that require estimation, but are not as critical as those discussed above. Changes in estimates used in these and other items could have a significant effect on our consolidated financial statements. The determination of the fair market value of new and used trailers is subject to variation, particularly in times of rapidly changing market conditions. A 5% change in the valuation of our new and used inventories would be approximately $4 million.
Other
Inflation
We have historically been able to offset the impact of rising costs through productivity improvements as well as selective price increases. As a result, inflation has not had, and is not expected to have, a significant impact on our business.
New Accounting Pronouncements
During 2010, there were no new accounting pronouncements that had or are expected to have a material impact to our financial position, results of operations or cash flows.
ITEM 7A—QUANTITATIVE AND QUALITATIVE DISCLOSURES ABOUT MARKET RISK
In addition to the risks inherent in our operations, we have exposure to financial and market risk resulting from volatility in commodity prices and interest rates. The following discussion provides additional detail regarding our exposure to these risks.
|
|
a.
|
Commodity Price Risks
|
We are exposed to fluctuation in commodity prices through the purchase of raw materials that are processed from commodities such as aluminum, steel, wood and polyethylene. Given the historical volatility of certain commodity prices, this exposure can significantly impact product costs. Historically, we have managed aluminum price changes by entering into fixed price contracts with our suppliers. As of December 31, 2010, we had $34.3 million in raw material purchase commitments through December 2011 for materials that will be used in the production process. We typically do not set prices for our products more than 45-90 days in advance of our commodity purchases and can,
subject to competitive market conditions, take into account the cost of the commodity in setting our prices for each order. To the extent that we are unable to offset the increased commodity costs in our product prices, our results would be materially and adversely affected.
|
|
b.
|
Interest Rates
|
As of December 31, 2010, we had $55.0 million of floating rate debt outstanding under our revolving facility. A hypothetical 100 basis-point change in the floating interest rate from the current level would result in a corresponding $0.6 million change in interest expense over a one-year period. This sensitivity analysis does not account for the change in the competitive environment indirectly related to the change in interest rates and the potential managerial action taken in response to these changes.
38
ITEM 8—FINANCIAL STATEMENTS AND SUPPLEMENTARY DATA
|
Pages
|
|
|
Report of Independent Registered Public Accounting Firm
|
40
|
|
Consolidated Balance Sheets as of December 31, 2010 and 2009
|
41
|
|
Consolidated Statements of Operations for the years ended December 31, 2010, 2009 and 2008
|
42
|
|
Consolidated Statements of Stockholders’ Equity for the years ended December 31, 2010, 2009 and 2008
|
43
|
|
Consolidated Statements of Cash Flows for the years ended December 31, 2010, 2009 and 2008
|
44
|
|
Notes to Consolidated Financial Statements
|
45
|
39
Report of Independent Registered Public Accounting Firm
The Board of Directors and Shareholders of Wabash National Corporation:
We have audited the accompanying consolidated balance sheets of Wabash National Corporation as of December 31, 2010 and 2009, and the related consolidated statements of operations, stockholders' equity, and cash flows for each of the three years in the period ended December 31, 2010. These financial statements are the responsibility of the Company's management. Our responsibility is to express an opinion on these financial statements based on our audits.
We conducted our audits in accordance with the standards of the Public Company Accounting Oversight Board (United States). Those standards require that we plan and perform the audit to obtain reasonable assurance about whether the financial statements are free of material misstatement. An audit includes examining, on a test basis, evidence supporting the amounts and disclosures in the financial statements. An audit also includes assessing the accounting principles used and significant estimates made by management, as well as evaluating the overall financial statement presentation. We believe that our audits provide a reasonable basis for our opinion.
In our opinion, the financial statements referred to above present fairly, in all material respects, the consolidated financial position of Wabash National Corporation at December 31, 2010 and 2009, and the consolidated results of its operations and its cash flows for each of the three years in the period ended December 31, 2010, in conformity with U.S. generally accepted accounting principles.
We also have audited, in accordance with the standards of the Public Company Accounting Oversight Board (United States), Wabash National Corporation’s internal control over financial reporting as of December 31, 2010, based on criteria established in Internal Control—Integrated Framework issued by the Committee of Sponsoring Organizations of the Treadway Commission and our report dated February 25, 2011 expressed an unqualified opinion thereon.
|
ERNST & YOUNG LLP
|
Indianapolis, Indiana
February 25, 2011
40
CONSOLIDATED BALANCE SHEETS
(Dollars in thousands)
|
December 31,
|
||||||||
|
2010
|
2009
|
|||||||
|
ASSETS
|
||||||||
|
CURRENT ASSETS
|
||||||||
|
Cash
|
$ | 21,200 | $ | 1,108 | ||||
|
Accounts receivable
|
37,853 | 17,081 | ||||||
|
Inventories
|
110,850 | 51,801 | ||||||
|
Prepaid expenses and other
|
2,155 | 6,877 | ||||||
|
Total current assets
|
$ | 172,058 | $ | 76,867 | ||||
|
PROPERTY, PLANT AND EQUIPMENT
|
98,834 | 108,802 | ||||||
|
INTANGIBLE ASSETS
|
22,863 | 25,952 | ||||||
|
OTHER ASSETS
|
9,079 | 12,156 | ||||||
| $ | 302,834 | $ | 223,777 | |||||
|
LIABILITIES AND STOCKHOLDERS' EQUITY
|
||||||||
|
CURRENT LIABILITIES
|
||||||||
|
Current portion of capital lease obligations
|
$ | 590 | $ | 337 | ||||
|
Accounts payable
|
71,145 | 30,201 | ||||||
|
Other accrued liabilities
|
38,896 | 34,583 | ||||||
|
Warrant
|
- | 46,673 | ||||||
|
Total current liabilities
|
$ | 110,631 | $ | 111,794 | ||||
|
LONG-TERM DEBT
|
55,000 | 28,437 | ||||||
|
CAPITAL LEASE OBLIGATIONS
|
3,964 | 4,469 | ||||||
|
OTHER NONCURRENT LIABILITIES AND CONTINGENCIES
|
4,214 | 3,258 | ||||||
|
PREFERRED STOCK, net of discount, 25,000,000 shares authorized, $0.01 par value,
0 and 35,000 shares issued and outstanding, respectively |
- | 22,334 | ||||||
|
STOCKHOLDERS' EQUITY
|
||||||||
|
Common stock 200,000,000 shares authorized, $0.01 par value, 67,930,814
and 30,376,374 shares issued and outstanding, respectively |
703 | 331 | ||||||
|
Additional paid-in capital
|
598,671 | 355,747 | ||||||
|
Accumulated deficit
|
(444,330 | ) | (277,116 | ) | ||||
|
Treasury stock at cost, 1,764,823 and 1,713,468 common shares, respectively
|
(26,019 | ) | (25,477 | ) | ||||
|
Total stockholders' equity
|
$ | 129,025 | $ | 53,485 | ||||
| $ | 302,834 | $ | 223,777 | |||||
The accompanying notes are an integral part of these Consolidated Statements.
41
CONSOLIDATED STATEMENTS OF OPERATIONS
(Dollars in thousands, except per share amounts)
|
Years Ended December 31,
|
||||||||||||
|
2010
|
2009
|
2008
|
||||||||||
|
NET SALES
|
$ | 640,372 | $ | 337,840 | $ | 836,213 | ||||||
|
COST OF SALES
|
612,289 | 360,750 | 815,289 | |||||||||
|
Gross profit
|
$ | 28,083 | $ | (22,910 | ) | $ | 20,924 | |||||
|
GENERAL AND ADMINISTRATIVE EXPENSES
|
32,831 | 31,988 | 44,094 | |||||||||
|
SELLING EXPENSES
|
10,669 | 11,176 | 14,290 | |||||||||
|
IMPAIRMENT OF GOODWILL
|
- | - | 66,317 | |||||||||
|
Loss from operations
|
$ | (15,417 | ) | $ | (66,074 | ) | $ | (103,777 | ) | |||
|
OTHER INCOME (EXPENSE)
|
||||||||||||
|
Increase in fair value of warrant
|
(121,587 | ) | (33,447 | ) | - | |||||||
|
Interest expense
|
(4,140 | ) | (4,379 | ) | (4,657 | ) | ||||||
|
Other, net
|
(667 | ) | (866 | ) | (328 | ) | ||||||
|
Loss before income taxes
|
$ | (141,811 | ) | $ | (104,766 | ) | $ | (108,762 | ) | |||
|
INCOME TAX (BENEFIT) EXPENSE
|
(51 | ) | (3,001 | ) | 17,064 | |||||||
|
Net loss
|
$ | (141,760 | ) | $ | (101,765 | ) | $ | (125,826 | ) | |||
|
PREFERRED STOCK DIVIDENDS AND EARLY EXTINGUISHMENT
|
25,454 | 3,320 | - | |||||||||
|
NET LOSS APPLICABLE TO COMMON STOCKHOLDERS
|
$ | (167,214 | ) | $ | (105,085 | ) | $ | (125,826 | ) | |||
|
COMMON STOCK DIVIDENDS DECLARED
|
$ | - | $ | - | $ | 0.135 | ||||||
|
BASIC AND DILUTED NET LOSS PER SHARE
|
$ | (3.36 | ) | $ | (3.48 | ) | $ | (4.21 | ) | |||
|
COMPREHENSIVE LOSS
|
||||||||||||
|
Net loss
|
$ | (141,760 | ) | $ | (101,765 | ) | $ | (125,826 | ) | |||
|
Changes in fair value of derivatives, net of tax
|
- | 118 | (1,516 | ) | ||||||||
|
Reclassification adjustment for interest rate swaps included in net loss
|
- | 1,398 | - | |||||||||
|
NET COMPREHENSIVE LOSS
|
$ | (141,760 | ) | $ | (100,249 | ) | $ | (127,342 | ) | |||
The accompanying notes are an integral part of these Consolidated Statements.
42
WABASH NATIONAL CORPORATION
CONSOLIDATED STATEMENTS OF STOCKHOLDERS' EQUITY
(Dollars in thousands)
|
Additional
|
Other
|
|||||||||||||||||||||||||||
|
Common Stock
|
Paid-In
|
Accumulated
|
Comprehensive
|
Treasury
|
||||||||||||||||||||||||
|
Shares
|
Amount
|
Capital
|
Deficit
|
Income (Loss)
|
Stock
|
Total
|
||||||||||||||||||||||
|
BALANCES, December 31, 2007
|
29,842,945 | $ | 321 | $ | 347,143 | $ | (42,058 | ) | $ | - | $ | (25,477 | ) | $ | 279,929 | |||||||||||||
|
Net loss for the year
|
- | - | - | (125,826 | ) | - | - | (125,826 | ) | |||||||||||||||||||
|
Stock-based compensation
|
155,852 | 3 | 4,987 | - | - | - | 4,990 | |||||||||||||||||||||
|
Stock repurchase
|
(17,714 | ) | - | (138 | ) | - | - | - | (138 | ) | ||||||||||||||||||
|
Common stock dividends
|
- | - | - | (4,147 | ) | - | - | (4,147 | ) | |||||||||||||||||||
|
Tax benefit from stock-based compensation
|
- | - | (222 | ) | - | - | - | (222 | ) | |||||||||||||||||||
|
Interest rate swap
|
- | - | - | - | (1,516 | ) | - | (1,516 | ) | |||||||||||||||||||
|
Common stock issued in connection with:
|
||||||||||||||||||||||||||||
|
Stock option plan
|
11,267 | - | 97 | - | - | - | 97 | |||||||||||||||||||||
|
Outside directors' plan
|
33,660 | - | 270 | - | - | - | 270 | |||||||||||||||||||||
|
BALANCES, December 31, 2008
|
30,026,010 | $ | 324 | $ | 352,137 | $ | (172,031 | ) | $ | (1,516 | ) | $ | (25,477 | ) | $ | 153,437 | ||||||||||||
|
Net loss for the year
|
- | - | - | (101,765 | ) | - | - | (101,765 | ) | |||||||||||||||||||
|
Stock-based compensation
|
178,172 | 5 | 3,377 | - | - | - | 3,382 | |||||||||||||||||||||
|
Stock repurchase
|
(22,052 | ) | - | (35 | ) | - | - | - | (35 | ) | ||||||||||||||||||
|
Preferred stock dividends
|
- | - | - | (3,320 | ) | - | - | (3,320 | ) | |||||||||||||||||||
|
Interest rate swap
|
- | - | - | - | 1,516 | - | 1,516 | |||||||||||||||||||||
|
Common stock issued in connection with:
|
||||||||||||||||||||||||||||
|
Outside directors' plan
|
194,244 | 2 | 268 | - | - | - | 270 | |||||||||||||||||||||
|
BALANCES, December 31, 2009
|
30,376,374 | $ | 331 | $ | 355,747 | $ | (277,116 | ) | $ | - | $ | (25,477 | ) | $ | 53,485 | |||||||||||||
|
Net loss for the year
|
- | - | - | (141,760 | ) | - | - | (141,760 | ) | |||||||||||||||||||
|
Stock-based compensation
|
293,389 | (2 | ) | 2,433 | - | - | - | 2,431 | ||||||||||||||||||||
|
Stock repurchase
|
(51,355 | ) | 1 | 157 | - | - | (542 | ) | (384 | ) | ||||||||||||||||||
|
Preferred stock dividends and early extinguishment
|
- | - | - | (25,454 | ) | - | - | (25,454 | ) | |||||||||||||||||||
|
Common stock issued in connection with:
|
||||||||||||||||||||||||||||
|
Public offering
|
11,750,000 | 118 | 71,825 | - | - | - | 71,943 | |||||||||||||||||||||
|
Exercise of warrant
|
25,486,532 | 254 | 168,006 | - | - | - | 168,260 | |||||||||||||||||||||
|
Stock option plan
|
75,874 | 1 | 503 | - | - | - | 504 | |||||||||||||||||||||
|
BALANCES, December 31, 2010
|
67,930,814 | $ | 703 | $ | 598,671 | $ | (444,330 | ) | $ | - | $ | (26,019 | ) | $ | 129,025 | |||||||||||||
The accompanying notes are an integral part of these Consolidated Statements.
43
CONSOLIDATED STATEMENTS OF CASH FLOWS
(Dollars in thousands)
|
Years Ended December 31,
|
||||||||||||
|
2010
|
2009
|
2008
|
||||||||||
|
Cash flows from operating activities
|
||||||||||||
|
Net loss
|
$ | (141,760 | ) | $ | (101,765 | ) | $ | (125,826 | ) | |||
|
Adjustments to reconcile net loss to net cash (used in) provided by operating activities
|
||||||||||||
|
Depreciation and amortization
|
16,855 | 19,585 | 21,467 | |||||||||
|
Net loss (gain) on sale of assets
|
431 | (55 | ) | 606 | ||||||||
|
Loss (Gain) on early debt extinguishment
|
- | 303 | (151 | ) | ||||||||
|
Deferred income taxes
|
- | - | 17,286 | |||||||||
|
Excess tax benefits from stock-based compensation
|
- | - | (6 | ) | ||||||||
|
Increase in fair value of warrant
|
121,587 | 33,447 | - | |||||||||
|
Stock-based compensation
|
3,489 | 3,382 | 4,990 | |||||||||
|
Impairment of goodwill
|
- | - | 66,317 | |||||||||
|
Changes in operating assets and liabilities
|
||||||||||||
|
Accounts receivable
|
(20,772 | ) | 20,845 | 30,827 | ||||||||
|
Inventories
|
(59,062 | ) | 41,095 | 20,229 | ||||||||
|
Prepaid expenses and other
|
3,024 | (1,570 | ) | 436 | ||||||||
|
Accounts payable and accrued liabilities
|
45,251 | (22,666 | ) | (5,657 | ) | |||||||
|
Other, net
|
266 | 385 | 153 | |||||||||
|
Net cash (used in) provided by operating activities
|
$ | (30,691 | ) | $ | (7,014 | ) | $ | 30,671 | ||||
|
Cash flows from investing activities
|
||||||||||||
|
Capital expenditures
|
(1,782 | ) | (981 | ) | (12,613 | ) | ||||||
|
Proceeds from the sale of property, plant and equipment
|
1,813 | 300 | 213 | |||||||||
|
Net cash provided by (used in) investing activities
|
$ | 31 | $ | (681 | ) | $ | (12,400 | ) | ||||
|
Cash flows from financing activities
|
||||||||||||
|
Proceeds from exercise of stock options
|
504 | - | 97 | |||||||||
|
Excess tax benefits from stock-based compensation
|
- | - | 6 | |||||||||
|
Borrowings under revolving credit facilities
|
712,491 | 276,853 | 202,908 | |||||||||
|
Payments under revolving credit facilities
|
(685,928 | ) | (328,424 | ) | (122,900 | ) | ||||||
|
Payments under long-term debt obligations
|
- | - | (104,133 | ) | ||||||||
|
Principal payments under capital lease obligations
|
(352 | ) | (334 | ) | (193 | ) | ||||||
|
Debt issuance costs paid
|
- | (1,420 | ) | (4 | ) | |||||||
|
Payments under redemption of preferred stock
|
(47,791 | ) | - | - | ||||||||
|
Proceeds from issuance of preferred stock and warrant
|
- | 35,000 | - | |||||||||
|
Preferred stock issuance costs paid
|
(120 | ) | (2,638 | ) | - | |||||||
|
Proceeds from issuance of common stock, net of expenses
|
71,948 | - | - | |||||||||
|
Common stock dividends paid
|
- | - | (5,510 | ) | ||||||||
|
Net cash provided by (used in) financing activities
|
$ | 50,752 | $ | (20,963 | ) | $ | (29,729 | ) | ||||
|
Net increase (decrease) in cash
|
$ | 20,092 | $ | (28,658 | ) | $ | (11,458 | ) | ||||
|
Cash at beginning of year
|
1,108 | 29,766 | 41,224 | |||||||||
|
Cash at end of year
|
$ | 21,200 | $ | 1,108 | $ | 29,766 | ||||||
|
Supplemental disclosures of cash flow information
|
||||||||||||
|
Cash paid (received) during the period for
|
||||||||||||
|
Interest
|
$ | 3,474 | $ | 5,055 | $ | 5,247 | ||||||
|
Income taxes
|
$ | (3,084 | ) | $ | (865 | ) | $ | (4 | ) | |||
The accompanying notes are an integral part of these Consolidated Statements.
44
WABASH NATIONAL CORPORATION
NOTES TO CONSOLIDATED FINANCIAL STATEMENTS
|
1.
|
DESCRIPTION OF THE BUSINESS
|
Wabash National Corporation (the “Company”) designs, manufactures and markets standard and customized truck trailers and intermodal equipment under the Wabashâ, DuraPlateâ, DuraPlateHDâ, FreightProâ, ArcticLite®, RoadRailerâ, Transcraftâ, Eagleâ, Eagle IIâ, D-Eagleâ and Benson® trademarks. The Company’s wholly-owned subsidiary, Wabash National Trailer Centers, Inc., sells new and used trailers through its retail network and provides aftermarket parts and service for the Company’s and competitors’ trailers and
related equipment.
|
2.
|
SUMMARY OF SIGNIFICANT ACCOUNTING POLICIES
|
a. Basis of Consolidation
The consolidated financial statements reflect the accounts of the Company and its wholly-owned and majority-owned subsidiaries. All significant intercompany profits, transactions and balances have been eliminated in consolidation.
b. Use of Estimates
The preparation of consolidated financial statements in conformity with U.S. generally accepted accounting principles requires management to make estimates and assumptions that directly affect the amounts reported in its consolidated financial statements and accompanying notes. Actual results could differ from these estimates.
c. Revenue Recognition
The Company recognizes revenue from the sale of trailers and aftermarket parts when the customer has made a fixed commitment to purchase the trailers for a fixed or determinable price, collection is reasonably assured under the Company’s billing and credit terms and ownership and all risk of loss has been transferred to the buyer, which is normally upon shipment to or pick up by the customer. Revenues exclude all taxes collected from the customer.
d. Used Trailer Trade Commitments and Residual Value Guarantees
The Company has commitments with certain customers to accept used trailers on trade for new trailer purchases. These commitments arise in the normal course of business related to future new trailer orders at the time a new trailer order is placed by the customer. The Company acquired used trailers on trade of approximately $8.1 million, $2.9 million and $20.7 million in 2010, 2009 and 2008, respectively. As of December 31, 2010 and 2009, the Company had approximately $8.2 million and $6.1 million, respectively, of outstanding trade commitments. On occasion, the amount of the trade allowance provided for in the used trailer commitments, or cost, may exceed the net
realizable value of the underlying used trailer. In these instances, the Company’s policy is to recognize the loss related to these commitments at the time the new trailer revenue is recognized. Net realizable value of used trailers is measured considering market sales data for comparable types of trailers. The net realizable value of the used trailers subject to the remaining outstanding trade commitments was estimated by the Company to be approximately $7.7 million and $5.7 million as of December 31, 2010 and 2009, respectively.
e. Accounts Receivable
Accounts receivable are shown net of allowance for doubtful accounts and primarily include trade receivables. The Company records and maintains a provision for doubtful accounts for customers based upon a variety of factors including the Company’s historical experience, the length of time the account has been outstanding and the financial condition of the customer. If the circumstances related to specific customers were to change, the Company’s estimates with respect to the collectability of the related accounts could be further adjusted. The Company’s policy is to write-off receivables when it has been determined to be uncollectible. Provisions to the
allowance for doubtful accounts are charged to both General and Administrative Expenses and Selling Expenses in the Consolidated Statements of Operations. The activity in the allowance for doubtful accounts was as follows (in thousands):
45
|
Years Ended December 31,
|
||||||||||||
|
2010
|
2009
|
2008
|
||||||||||
|
Balance at beginning of year
|
$ | 2,790 | $ | 2,183 | $ | 1,770 | ||||||
|
Expense
|
60 | 680 | 689 | |||||||||
|
Write-offs, net
|
(609 | ) | (73 | ) | (276 | ) | ||||||
|
Balance at end of year
|
$ | 2,241 | $ | 2,790 | $ | 2,183 | ||||||
f. Inventories
Inventories are stated at the lower of cost, primarily determined on the first-in, first-out (FIFO) method, or market. The cost of manufactured inventory includes raw material, labor and overhead. Inventories consist of the following (in thousands):
|
December 31,
|
||||||||
|
2010
|
2009
|
|||||||
|
Raw materials and components
|
$ | 27,970 | $ | 15,280 | ||||
|
Work in progress
|
4,025 | 386 | ||||||
|
Finished goods
|
70,371 | 26,920 | ||||||
|
Aftermarket parts
|
4,486 | 4,072 | ||||||
|
Used trailers
|
3,998 | 5,143 | ||||||
| $ | 110,850 | $ | 51,801 | |||||
g. Prepaid Expenses and Other
Prepaid expenses and other as of December 31, 2010 and 2009 were $2.2 million and $6.9 million, respectively. Prepaid expenses and other primarily includes items such as insurance premiums, computer software maintenance agreements and assets held for sale. Assets held for sale, which consisted of a closed manufacturing facility in Mt. Sterling, Kentucky, was $1.7 million as of December 31, 2009. In August 2010, the Company sold this facility and recorded a loss on the sale of approximately $0.4 million to Other Expense in
the Consolidated Statements of Operations.
h. Property, Plant and Equipment
Property, plant and equipment are recorded at cost, net of accumulated depreciation. Maintenance and repairs are charged to expense as incurred, while expenditures that extend the useful life of an asset are capitalized. Depreciation is recorded using the straight-line method over the estimated useful lives of the depreciable assets. The estimated useful lives are up to 33 years for buildings and building improvements and range from three to ten years for machinery and equipment. Depreciation expense, which is recorded in Cost of Sales and General and
Administrative Expenses in the Consolidated Statements of Operations, as appropriate, on property, plant and equipment was $11.3 million, $13.8 million and $15.3 million for 2010, 2009 and 2008, respectively. In July 2008, the Company entered into a non-cash capital lease obligation for its manufacturing facility in Cadiz, Kentucky totaling $5.3 million. In 2010, the Company renegotiated the terms of the lease to reflect the current market value of the facility, reducing the total lease obligation to $4.7 million. As of December 31, 2010 and 2009, the assets related to the Company’s capital lease agreements are recorded within Property, Plant and Equipment in the Consolidated Balance Sheet for the amount of $5.2 million and $5.1 million, respectively, net of accumulated depreciation of
$0.4 million and $0.2 million, respectively.
46
Property, plant and equipment consist of the following (in thousands):
|
December 31,
|
||||||||
|
2010
|
2009
|
|||||||
|
Land
|
$ | 21,392 | $ | 21,614 | ||||
|
Buildings and building improvements
|
91,998 | 92,992 | ||||||
|
Machinery and equipment
|
157,066 | 159,179 | ||||||
|
Construction in progress
|
1,338 | 295 | ||||||
| $ | 271,794 | $ | 274,080 | |||||
|
Less: accumulated depreciation
|
(172,960 | ) | (165,278 | ) | ||||
| $ | 98,834 | $ | 108,802 | |||||
i. Goodwill
The changes in the carrying amount of goodwill in the manufacturing reportable segment are as follows (in thousands):
|
Total
|
||||
|
Balance as of January 1, 2008:
|
||||
|
Goodwill
|
$ | 66,317 | ||
|
Accumulated impairment losses
|
- | |||
| $ | 66,317 | |||
|
Impairment charge recorded in 2008
|
(66,317 | ) | ||
| $ | - | |||
|
Balances as of December 31, 2008, 2009 and 2010:
|
||||
|
Goodwill
|
66,317 | |||
|
Accumulated impairment losses
|
(66,317 | ) | ||
| $ | - | |||
The Company tests goodwill for impairment on an annual basis or more frequently if an event occurs or circumstances change that could more likely than not reduce the fair value of a reporting unit below its carrying amount. The Company estimates fair value based upon the present value of future cash flows as well as considering the estimated market value of the Company and its reporting units. In estimating the future cash flows, the Company takes into consideration the overall and industry economic conditions and trends, market risk of the Company and historical information.
During the fourth quarter of 2008, the Company reviewed its goodwill for impairment and, based on a combination of factors, including the significant decline in the Company’s market capitalization as well as the current decline in the U.S. economy, the Company concluded that indicators of potential impairment were present. The measurement of impairment of goodwill consists of two steps. The first step requires the Company to compare the fair value of the reporting unit to its carrying value. During the fourth quarter of 2008, the Company completed a valuation of the fair value of its reporting units which incorporated existing market based considerations as well as
discounted cash flows based on current and projected results. Based on this evaluation, it was determined that the carrying value of both the Company’s platform trailer and wood product manufacturing operations exceeded its fair value. The second step involves determining the implied fair value of each reporting unit’s goodwill as compared to its carrying value. After calculating the implied fair value of the goodwill by deducting the fair value of all tangible and intangible net assets of the reporting unit from the fair value of the reporting unit, it was determined that the recorded goodwill of $66.3 million was fully impaired. Based on these facts and circumstances, the Company recorded a non-cash goodwill impairment of $66.3 million.
j. Intangible Assets
The Company has intangible assets including patents, licenses, trade names, trademarks and customer relationships, which are being amortized on a straight-line basis over periods ranging up to 20 years. As of December 31, 2010 and 2009, the Company had gross intangible assets of $54.0 million. Amortization expense for 2010, 2009 and 2008 was $3.1 million, $3.1 million and $3.4 million, respectively, and is estimated to be $3.0 million per year for the years 2011 through 2015.
47
k. Other Assets
The Company capitalizes the cost of computer software developed or obtained for internal use. Capitalized software is amortized using the straight-line method over three to seven years. As of December 31, 2010 and 2009, the Company had software costs, net of amortization, of $5.2 million and $7.7 million, respectively. Amortization expense for 2010, 2009 and 2008 was $2.4 million, $2.6 million and $2.5 million, respectively.
l. Long-Lived Assets
Long-lived assets, consisting primarily of intangible assets and property, plant and equipment, are reviewed for impairment whenever facts and circumstances indicate that the carrying amount may not be recoverable. Specifically, this process involves comparing an asset’s carrying value to the estimated undiscounted future cash flows the asset is expected to generate over its remaining life. If this process were to result in the conclusion that the carrying value of a long-lived asset would not be recoverable, a write-down of the asset to fair value would be recorded through a charge to operations. Fair value is determined based upon discounted cash flows or appraisals as
appropriate. During 2010, 2009 and 2008, the Company noted indicators of potential impairment on its long-lived assets and, therefore, conducted an analysis that indicated the estimated future undiscounted cash flows exceeded the carrying value of its long-lived assets as of December 31, 2010, 2009 and 2008, and no impairment was recognized for these periods.
m. Other Accrued Liabilities
The following table presents the major components of Other Accrued Liabilities (in thousands):
|
Years Ended December 31,
|
||||||||
|
2010
|
2009
|
|||||||
|
Warranty
|
$ | 11,936 | $ | 14,782 | ||||
|
Payroll and related taxes
|
8,667 | 5,405 | ||||||
|
Self-insurance
|
5,403 | 6,838 | ||||||
|
Accrued taxes
|
6,255 | 4,403 | ||||||
|
Customer deposits
|
2,689 | 1,246 | ||||||
|
All other
|
3,946 | 1,909 | ||||||
| $ | 38,896 | $ | 34,583 | |||||
The following table presents the changes in the product warranty accrual included in Other Accrued Liabilities (in thousands):
|
2010
|
2009
|
|||||||
|
Balance as of January 1
|
$ | 14,782 | $ | 17,027 | ||||
|
Provision for warranties issued in current year
|
2,341 | 1,162 | ||||||
|
Recovery of pre-existing warranties
|
(3,160 | ) | (40 | ) | ||||
|
Payments
|
(2,027 | ) | (3,367 | ) | ||||
|
Balance as of December 31
|
$ | 11,936 | $ | 14,782 | ||||
The Company offers a limited warranty for its products. With respect to Company products manufactured prior to 2005, the limited warranty coverage period is five years. Beginning in 2005, the coverage period for DuraPlate® trailer panels was extended to ten years, with all other product components remaining at five years. The Company passes through component manufacturers’ warranties to our customers. The Company’s policy is to accrue the estimated cost of warranty coverage at the time of the sale.
48
The following table presents the changes in the self-insurance accrual included in Other Accrued Liabilities (in thousands):
|
Self-Insurance
Accrual
|
||||
|
Balance as of January 1, 2009
|
$ | 7,555 | ||
|
Expense
|
21,589 | |||
|
Payments
|
(22,306 | ) | ||
|
Balance as of December 31, 2009
|
$ | 6,838 | ||
|
Expense
|
16,305 | |||
|
Payments
|
(17,740 | ) | ||
|
Balance as of December 31, 2010
|
$ | 5,403 | ||
The Company is self-insured up to specified limits for medical and workers’ compensation coverage. The self-insurance reserves have been recorded to reflect the undiscounted estimated liabilities, including claims incurred but not reported, as well as catastrophic claims as appropriate.
n. Income Taxes
The Company determines its provision or benefit for income taxes under the asset and liability method. The asset and liability method measures the expected tax impact at current enacted rates of future taxable income or deductions resulting from differences in the tax and financial reporting basis of assets and liabilities reflected in the Consolidated Balance Sheets. Future tax benefits of tax losses and credit carryforwards are recognized as deferred tax assets. Deferred tax assets are reduced by a valuation allowance to the extent the Company concludes there is uncertainty as to their realization.
The Company accounts for income tax contingencies by prescribing a minimum recognition threshold that a tax position is required to meet before being recognized in the financial statements.
o. New Accounting Pronouncements
During 2010, there were no new accounting pronouncements that had or are expected to have a material impact to the Company’s financial position, results of operations or cash flows.
|
3.
|
DERIVATIVE INSTRUMENTS AND HEDGING ACTIVITIES
|
During 2008, the Company entered into two-year interest rate swap
agreements (Swaps) whereby the Company pays a fixed interest rate and receives a
variable interest rate. The Company had designated these Swaps as
cash flow hedges in an effort to reduce its exposure to fluctuations in interest
rates by converting a portion of its variable rate borrowings to a fixed rate
for a specific period of time. The effective portion of the change in
the fair value of a derivative designated as a cash flow hedge is recorded in
accumulated other comprehensive income (loss) (OCI) and is recognized in the
statement of operations when the hedged item affects net income. If
and when a derivative is determined not to be highly effective as a hedge or
the underlying hedged transaction is no longer likely to occur, hedge accounting is discontinued. Any past or
future changes in the derivative’s fair value, which will not be effective
as an offset to the income effects of the item being hedged, are recognized
currently in the income statement.
In April 2009, the Company and its counterparty mutually agreed to
terminate the existing Swaps and settle based on the fair value of the Swap
contracts of approximately $1.4 million. These contracts were
originally set to mature through October 2010. The total amounts paid
under the terms of these contracts have been charged to interest or other
expense and totaled $1.6 million in 2009. The cash flows from these
contracts were recorded as operating activities in the consolidated statement of
cash flows.
49
|
4.
|
FAIR VALUE MEASUREMENTS
|
The Company’s fair value measurements are based upon a three-level valuation hierarchy. These valuation techniques are based upon the transparency of inputs (observable and unobservable) to the valuation of an asset or liability as of the measurement date. Observable inputs reflect market data obtained from independent sources, while unobservable inputs reflect the Company’s market assumptions. These two types of inputs create the following fair value hierarchy:
|
|
·
|
Level 1 — Valuation is based on quoted prices for identical assets or liabilities in active markets;
|
|
|
·
|
Level 2 — Valuation is based on quoted prices for similar assets or liabilities in active markets, or other inputs that are observable for the asset or liability, either directly or indirectly, for the full term of the financial instrument; and
|
|
|
·
|
Level 3 — Valuation is based upon other unobservable inputs that are significant to the fair value measurement.
|
The following table sets forth by level within the fair value hierarchy the Company’s financial assets and liabilities that were accounted for at fair value on a recurring basis (in thousands):
|
December 31, 2010
|
December 31, 2009
|
|||||||||||||||||||||||||||||||
|
Level 1
|
Level 2
|
Level 3
|
Total
|
Level 1
|
Level 2
|
Level 3
|
Total
|
|||||||||||||||||||||||||
|
Liabilities
|
||||||||||||||||||||||||||||||||
|
Incentive awards
|
$ | - | $ | 1,058 | $ | - | $ | 1,058 | $ | - | $ | - | $ | - | $ | - | ||||||||||||||||
|
Warrant
|
- | - | - | - | - | 46,673 | - | 46,673 | ||||||||||||||||||||||||
| $ | - | $ | 1,058 | $ | - | $ | 1,058 | $ | - | $ | 46,673 | $ | - | $ | 46,673 | |||||||||||||||||
The following methods and assumptions were used to estimate the fair value of each class of financial instrument:
Incentive awards: The fair value of the Company’s cash-settled stock appreciation rights and performance units is valued on a market approach using a binomial option-pricing model in which the significant inputs can be derived from observable market data such as volatility, interest rates, and expected terms.
Warrant: The fair value of the warrant was estimated based on a market approach using a binomial valuation pricing model. This approach was sensitive to changes in the trading market price of the Company’s common stock which has a high historical volatility. As discussed in Note 8, the Warrant was fully exercised in 2010 and was no longer outstanding as of December 31, 2010.
The carrying amounts of accounts receivable and accounts payable reported in the Consolidated Balance Sheets approximate fair value.
The fair value of total borrowings is estimated based on current quoted market prices for similar issues or debt with the same maturities. The interest rates on the Company’s bank borrowings under its Revolving Facility are adjusted regularly to reflect current market rates and thus carrying value approximates fair value.
50
|
5.
|
PER SHARE OF COMMON STOCK
|
Per share results have been computed based on the average number of common shares outstanding. The computation of basic and diluted net loss per share is determined using net loss applicable to common stockholders as the numerator and the number of shares included in the denominator as follows (in thousands, except per share amounts):
|
Years Ended December 31,
|
||||||||||||
|
2010
|
2009
|
2008
|
||||||||||
|
Basic and diluted net loss per share
|
||||||||||||
|
Net loss applicable to common stockholders
|
$ | (167,214 | ) | $ | (105,085 | ) | $ | (125,826 | ) | |||
|
Dividends paid and undistributed earnings allocated to
|
||||||||||||
|
participating securities
|
- | - | (132 | ) | ||||||||
|
Net loss applicable to common stockholders excluding amounts
|
||||||||||||
|
applicable to participating securities
|
$ | (167,214 | ) | $ | (105,085 | ) | $ | (125,958 | ) | |||
|
Weighted average common shares outstanding
|
49,819 | 30,237 | 29,954 | |||||||||
|
Basic and dluted net loss per share
|
$ | (3.36 | ) | $ | (3.48 | ) | $ | (4.21 | ) | |||
The computation of diluted net loss per share for the period ending December 31, 2008 excludes the after-tax equivalent of interest on the Company’s Senior Convertible Notes (the “Convertible Notes”) of $0.8 million. Due to the losses reported in 2010, 2009 and 2008, average diluted shares outstanding exclude the antidilutive effects of the following potential common shares (in thousands):
|
Years Ended December 31,
|
||||||||||||
|
2010
|
2009
|
2008
|
||||||||||
|
Convertible Notes equivalent shares
|
- | - | 1,708 | |||||||||
|
Stock options and restricted stock
|
336 | 11 | 87 | |||||||||
|
Redeemable warrants
|
12,890 | 11,336 | - | |||||||||
|
Options to purchase common shares
|
1,437 | 2,133 | 1,713 | |||||||||
Options to purchase common shares are considered potentially dilutive and excluded from computations of diluted net loss per share as the exercise prices were greater than the average market price of the common shares.
|
6.
|
OTHER LEASE ARRANGEMENTS
|
The Company leases office space, manufacturing, warehouse and service facilities and equipment under operating leases, the majority of which expire through 2013. Future minimum lease payments required under these lease commitments as of December 31, 2010 are as follows (in thousands):
|
Payments
|
||||
|
2011
|
$ | 513 | ||
|
2012
|
316 | |||
|
2013
|
312 | |||
|
2014
|
168 | |||
|
2015
|
95 | |||
|
Thereafter
|
156 | |||
| $ | 1,560 | |||
Total rental expense was $2.7 million for 2010 and 2009 and $3.8 million for 2008. As of December 31, 2010 the total minimum rentals to be received in future periods under these lease commitments was approximately $0.5 million.
51
|
7.
|
DEBT
|
In May 2010, the Company entered into the Consent and Amendment No. 1 to the Third Amended and Restated Loan and Security Agreement (the “Amended Facility”) with the Company’s lenders. The Amended Facility amended and restated the Company’s previous revolving credit facility entered into in July 2009 (the “Original Facility”). The Amended Facility is guaranteed by certain subsidiaries of the Company and secured by substantially all of its assets. The Amended Facility has a maturity date of August 3, 2012 and a capacity of $100 million, subject to a borrowing base and other discretionary reserves. The Amended Facility modified the Company’s borrowing base by eliminating a
$12.5 million availability reserve while reducing the amounts which can be borrowed under the fixed assets sub-limit by $12.5 million from $30.3 million to $17.8 million.
The Amended Facility was entered into to permit the early redemption of the Company’s Series E-G Preferred Stock and required the Company to pay down its revolving credit facility by at least $23.0 million. The repayment did not reduce the Company’s revolving loan commitments. Pursuant to the Amended Facility, if the availability under the Company’s revolving credit facility is less than $15.0 million at any time before the earlier of August 14, 2011 or the date that monthly financial statements are delivered for the month ending June 30, 2011, the Company would be required to maintain a varying minimum EBITDA and would be restricted in the amount of capital expenditures the Company can make
during such period. If the Company’s availability is less than $20.0 million thereafter, it would be required to maintain a fixed charge coverage ratio for the 12 month period ending on the last day of the calendar month that ended most recently prior to such time of not less than 1.1 to 1.0.
Under the Amended Facility, the Company may not repurchase or redeem its common stock and may not pay cash dividends to the Company’s common stockholders until the second anniversary of the effectiveness of the Original Facility, or August 3, 2011, and then only if (i) no default or events of default are in existence or would be caused by such purchase, redemption or payment, (ii) immediately after such purchase, redemption or payment, the Company has unused availability of at least $40 million, (iii) the amount of all cash dividends paid by the Company does not exceed $20 million in any fiscal year and (iv) at least 5 business days prior to the purchase, redemption or payment, an officer of the Company
delivers a certificate to its lenders certifying that the conditions precedent in clauses (i)-(iii) have been satisfied. The Company is, however, permitted to repurchase stock from employees upon termination of their employment so long as no default or event of default exists at the time or would be caused by such repurchase and such repurchases do not exceed $2.5 million in any fiscal year.
Under the Original Facility the Company could not repurchase or redeem the Preferred Stock and could not pay cash dividends to the holders of the Preferred Stock until July 1, 2010. At any time after July 1, 2010 until the second anniversary of the effectiveness of the Amended Facility, the Company could pay cash dividends or redeem or repurchase the Preferred Stock if (i) no default or events of default were then in existence or would be caused by such purchase, redemption or payment, (ii) immediately after such purchase, redemption or payment, the Company had unused availability of at least $25 million and (iii) at least 5 business days prior to the purchase, redemption or payment, an officer of the Company had
delivered a certificate to its lenders certifying that the conditions precedent in clauses (i)-(iii) had been satisfied. After the second anniversary of the effectiveness of the Amended Facility, the unused availability condition precedent was to be reduced to $12.5 million.
The interest rate on borrowings under the Amended Facility through July 31, 2010 was LIBOR plus 4.25% or the prime rate of Bank of America, N.A. (the “Prime Rate”) plus 2.75%. After July 31, 2010, the interest rate is based upon average unused availability and will range between LIBOR plus 3.75% to 4.25% or the Prime Rate plus 2.25% to 2.75%. The Company is required to pay a monthly unused line fee equal to 0.375% times the average daily unused availability along with other customary fees and expenses of the Company’s agent and lenders. All interest and fees are paid monthly.
The Amended Facility contains customary representations, warranties, affirmative and negative covenants, including, without limitation, restrictions on mergers, dissolutions, acquisitions, indebtedness, affiliate transactions, the occurrence of liens, payments of subordinated indebtedness, disposition of assets, leases and changes to organizational documents.
The Amended Facility also contains customary events of default including, without limitation, failure to pay obligations when due under the facility, false and misleading representations, breaches of covenants (subject in some instances to cure and grace periods), defaults on certain other indebtedness, the occurrence of certain uninsured losses, business disruptions for a period of time that materially adversely affects the capacity to continue business on a profitable basis, changes of control and the incurrence of certain judgments that are not stayed, released or discharged within 30 days.
52
The Company’s previous loan and security agreement, as amended, had a capacity of $200 million, subject to a borrowing base, with a maturity date of March 6, 2012. On April 1, 2009, events of default occurred which permitted the lenders to increase the interest on the outstanding principal by 2%, to cause an acceleration of the maturity of borrowings, to restrict advances and to terminate the agreement. The events of default included: the Company’s failure to deliver audited financial statements for fiscal year 2008 by March 31, 2009; that the report of the Company’s independent registered public accounting firm accompanying the Company’s
audited financial statements for fiscal year 2008 included an explanatory paragraph with respect to the Company’s ability to continue as a going concern; the Company’s failure to deliver prompt written notification of name changes of subsidiaries; the Company’s failure to have a minimum fixed charge coverage ratio of 1.1:1.0 when the available borrowing capacity is below $30 million; and, the Company requesting loans under the facility during the existence of a default or events of default. In accordance with the terms of the facility, on April 1, 2009, the agent increased the interest on the outstanding principal by 2% and implemented availability reserves that result in a reduction of the Company’s borrowing base under the facility by $25 million.
In April 2009, the Company entered into a Forbearance Agreement with the lenders. Pursuant to the Forbearance Agreement, the lenders agreed to refrain from accelerating maturity of the facility due to specified existing or anticipated events of default, as described above, through the earlier of May 29, 2009 or the occurrence or existence of any event of default other than the existing or anticipated events of default.
In May 2009, the Company entered into a First Amendment to Forbearance Agreement and Fourth Amendment to Second Amended and Restated Loan and Security Agreement (the “Amendment”) with the lenders. Pursuant to the Amendment, the lenders agreed to continue to refrain from accelerating maturity of the facility due to specified existing or anticipated events of default, as described above, through the earlier of July 31, 2009 or the occurrence or existence of any event of default other than the existing or anticipated events of default. In addition to the extension of the forbearance period, the Amendment reduced the availability reserve to $17.5 million through July 31, 2009 and decreased the borrowing
availability of eligible accounts receivable from 90% to 85%.
As of December 31, 2010 and 2009, the Company’s liquidity position, defined as cash on hand and available borrowing capacity on the Amended Facility, amounted to $60.4 and $21.0 million, respectively. As of December 31, 2010, the Company was in compliance with all covenants of the Amended Facility.
In July 2008, the Company entered into a three-year, non-cash capital lease obligation for its manufacturing facility in Cadiz, Kentucky totaling $5.3 million. The lease includes a bargain purchase option. In November 2010, the Company renegotiated the terms of the lease to reflect the current market value of the facility, which resulted in a six month extension and a reduction in the total lease obligation to $4.7 million. As of December 31, 2010 and 2009, the present value of future minimum lease payments totaled $3.8 million and $4.8 million, respectively. Annual remaining minimum lease payments as of December 31, 2010 were $0.8 million, $3.7 million and $0.2
million for the years ending 2011, 2012 and 2013, respectively, including interest of approximately $0.3 million.
|
8.
|
ISSUANCE OF PREFERRED STOCK AND WARRANT
|
In July 2009, the Company entered into a Securities Purchase Agreement with Trailer Investments pursuant to which Trailer Investments purchased 20,000 shares of Series E redeemable preferred stock (“Series E Preferred”), 5,000 shares of Series F redeemable preferred stock (“Series F Preferred”), and 10,000 shares of Series G redeemable preferred stock (“Series G Preferred”, and together with the Series E Preferred and the Series F Preferred, the “Series E-G Preferred Stock”) for an aggregate purchase price of $35.0 million. Trailer Investments also received a warrant that was exercisable at $0.01 per share for
24,762,636 newly issued shares of the Company’s common stock (the “Warrant”) representing, on August 3, 2009, the date the Warrant was delivered, 44.21% of the Company’s issued and outstanding common stock after giving effect to the issuance of the shares underlying the Warrant, subject to upward adjustment to maintain that percentage if currently outstanding options were exercised. The number of shares of common stock subject to the Warrant was also subject to upward adjustment to an amount equivalent to 49.99% of the issued and outstanding common stock of the Company outstanding immediately after the closing after giving effect to the issuance of the shares underlying the Warrant in specified circumstances where the Company would lose its ability to utilize its net operating loss carryforwards, including as a result of a stockholder of the Company acquiring
greater than 5% of the outstanding common stock of the Company.
53
Trailer Investments’ ownership of the Series E-G Preferred Stock included significant rights pursuant to the applicable certificates of designation for the Series E-G Preferred Stock and pursuant to the Investor Rights Agreement dated August 3, 2009 between the Company and Trailer Investments (the “Investor Rights Agreement”). As a result of the Redemption (as defined and further described below), except for the payment in connection with a change of control described below, the principal rights that previously existed but are no longer held by Trailer Investments are (i) the right to receive the preferred dividend, (ii) veto rights over certain
significant aspects of the Company’s operations and business, including payments of dividends, issuance of the Company’s securities, incurrence of indebtedness, liquidation and sale of assets, changes in the size of the Company’s board of directors, amendments to the Company’s organizational documents (including those of its subsidiaries), and other material actions by the Company, subject to certain thresholds and limitations, and (iii) a right of first refusal to participate in any future private financings.
The Warrant contained several conditions, including, among other things, an upward adjustment of shares upon the occurrence of certain contingent events, and the holder had an option pursuant to the terms of the Investor Rights Agreement to settle the Warrant for cash in event of a specific default. These provisions resulted in the classification of the Warrant as a liability that was adjusted to fair value at each balance sheet date. The warrant liability was recorded initially at fair value with subsequent changes in fair value reflected in earnings. Estimating fair value of the Warrant required the use of assumptions and inputs that were observable, either
directly or indirectly, were likely to change over the duration of the Warrant with related changes in internal and external market factors. In addition, option-based techniques are highly volatile and sensitive to changes in the trading market price of the Company’s common stock, which has a high historical volatility. Because the Warrant was initially and subsequently carried at fair value, the Company’s Statements of Operations reflected the volatility in these estimate and assumption changes.
In May 2010, in connection with the Initial Offering (as discussed in Note 9), the Company redeemed (the “Redemption”) all outstanding shares of the Company’s Series E-G Preferred Stock at a liquidation value of $1,000 per share, or $35.0 million, plus accrued and unpaid dividends and a premium adjustment of 20% as required under the Securities Purchase Agreement for any redemption made prior to August 2014. The Series E Preferred, Series F Preferred and Series G Preferred paid an annual dividend rate of 15%, 16% and 18%, respectively, based on liquidation value. The Company accrued all dividend payments on the Series E-G Preferred Stock totaling
approximately $4.8 million through the Redemption date. The premium adjustment for early redemption of $8.0 million was applied to the sum of the liquidation value and accrued and unpaid dividends. The total redemption price of the Series E-G Preferred Stock, including accrued and unpaid dividends, was approximately $47.8 million. Certificates of elimination were filed on September 21, 2010 with the Secretary of State of the State of Delaware to eliminate from the Company’s Certificate of Incorporation all provisions that were set forth in the certificates of designation for the Series E-G Preferred Stock.
If a change of control, meaning more than 50% of the voting power is transferred or acquired by any person other than Trailer Investments and its affiliates, occurs within 12 months of the date of the Redemption (on or before May 28, 2011), Trailer Investments will be entitled to receive an aggregate payment of $74.6 million representing the difference between what it received in the Redemption and what it would have been entitled to receive on the date of the Redemption if a change of control had occurred on that date.
54
The following table presents the activity for the Series E-G Preferred Stock (in thousands):
|
Series E
|
Series F
|
Series G
|
Total Preferred
|
|||||||||||||
|
Preferred
|
Preferred
|
Preferred
|
Stock
|
|||||||||||||
|
Balance as of January 1, 2009
|
$ | - | $ | - | $ | - | $ | - | ||||||||
|
Original proceeds from issuance of
|
||||||||||||||||
|
preferred stock and warrant
|
20,000 | 5,000 | 10,000 | 35,000 | ||||||||||||
|
Fair value of warrant
|
(7,283 | ) | (1,890 | ) | (4,053 | ) | (13,226 | ) | ||||||||
|
Issuance costs
|
(1,520 | ) | (394 | ) | (846 | ) | (2,760 | ) | ||||||||
|
Accretion
|
536 | 140 | 306 | 982 | ||||||||||||
|
Accrued and unpaid dividends
|
1,251 | 334 | 753 | 2,338 | ||||||||||||
|
Balance as of December 31, 2009
|
$ | 12,984 | $ | 3,190 | $ | 6,160 | $ | 22,334 | ||||||||
|
Accretion
|
483 | 123 | 247 | 853 | ||||||||||||
|
Accrued and unpaid dividends
|
1,328 | 355 | 808 | 2,491 | ||||||||||||
|
Early extinguishment of preferred stock
|
12,297 | 3,159 | 6,657 | 22,113 | ||||||||||||
|
Payments under redemption of preferred stock
|
(27,092 | ) | (6,827 | ) | (13,872 | ) | (47,791 | ) | ||||||||
|
Balance as of December 31, 2010
|
$ | - | $ | - | $ | - | $ | - | ||||||||
Also in connection with the Initial Offering, the Company amended the Warrant on May 28, 2010 (as amended, the “Replacement Warrant”). The Warrant was modified so that (i) the Warrant would no longer adjust or increase based upon any limitation on the Company’s ability to fully utilize its net operating loss (“NOL”) carryforwards and (ii) the Warrant was increased by a fixed number of 750,000 warrant shares in lieu of the market price anti-dilution adjustment that would have otherwise applied as a result of the Initial Offering. The Initial Offering included 16,137,500 shares sold by Trailer Investments (the “Warrant Shares”) pursuant to a partial exercise of the Warrant.
The partial net exercise of the Warrant was made by Trailer Investments via the forfeiture of 22,812 shares of common stock under the Warrant.
In anticipation of the Second Offering (as discussed in Note 9), the Replacement Warrant was amended on September 13, 2010 to modify its cashless exercise provision to facilitate determination of the number of shares required to be withheld to pay the exercise price of the Replacement Warrant when exercised in connection with the Second Offering.
On September 17, 2010, Trailer Investments sold the Replacement Warrant to the several underwriters, who exercised the Replacement Warrant in full and sold the 9,349,032 shares of common stock underlying the Replacement Warrant in the Second Offering. The exercise of the Replacement Warrant was made via the forfeiture of 13,549 shares of common stock. As a result of the Second Offering and related cashless exercise, the Replacement Warrant was fully exercised and was no longer outstanding as of December 31, 2010. Pursuant to the terms of the Investor Rights Agreement between the Company and Trailer Investments dated August 3, 2009, Trailer Investments had significant rights that no longer exist as a result of the
consummation of the Second Offering. These rights included the ability to designate five persons for election to the Company’s board of directors for so long as Trailer Investments and its affiliates beneficially owned at least 10% of the Company’s outstanding common stock. As a result, on September 21, 2010, the Company received resignation notices from each of the existing four Trailer Investments board members, notifying the Company of each member’s intent to resign from the Company’s board of directors with immediate effect.
|
9.
|
STOCKHOLDERS’ EQUITY
|
a. Common Stock
On May 13, 2010, the Company’s stockholders approved an amendment to the Company’s Certificate of Incorporation, as amended, to increase the number of authorized shares of common stock, par value $0.01 per share, from 75 million shares to 200 million shares and correspondingly, to increase the total number of authorized shares of all classes of capital stock from 100 million shares to 225 million shares, which includes 25 million shares of preferred stock, par value $0.01 per share.
55
On May 28, 2010, the Company closed on a public offering of the Company’s common stock, par value $0.01 per share (the “Initial Offering”), which consisted of 11,750,000 shares of common stock sold by the Company and 16,137,500 shares of common stock sold by Trailer Investments as selling stockholder, each at a purchase price of $6.50 per share. The shares of common stock sold in the Initial Offering by Trailer Investments included 3,637,500 shares sold pursuant to the underwriters’ exercise in full of their option to purchase additional shares to cover over-allotments. All shares sold by Trailer Investments were issued upon the partial exercise of the Warrant it held and the Replacement
Warrant was issued to Trailer Investments on May 28, 2010 (as discussed in Note 8). The Company did not receive any proceeds from the sale of the shares by Trailer Investments. The Company generated proceeds from its sale of 11,750,000 shares of common stock of $76.4 million and used the net proceeds to redeem all of its outstanding preferred stock and to repay a portion of its outstanding indebtedness under its revolving credit facility.
On September 17, 2010, Trailer Investments sold the Replacement Warrant to the several underwriters, who exercised the Replacement Warrant in full and sold the 9,349,032 shares of common stock underlying the Replacement Warrant at a price per share of $6.75 (the “Second Offering”). Pursuant to the underwriting agreement between the Company, Trailer Investments and Morgan Stanley & Co. Incorporated, as underwriter (the “Underwriter”), upon the closing of the Second Offering, Trailer Investments transferred the Replacement Warrant to the Underwriter and the Company issued 9,349,032 shares of the common stock to the Underwriter upon the net exercise of the Replacement Warrant and the
Second Offering was consummated. The net exercise of the Replacement Warrant was made by the Underwriter via the forfeiture of 13,549 shares of common stock issuable under the Replacement Warrant. As a result, the Replacement Warrant was fully exercised and is no longer outstanding as of December 31, 2010. The Company did not receive any proceeds from the sale of these shares in the Second Offering by Trailer Investments.
b. Preferred Stock
As discussed in Note 8, all outstanding shares of the Company’s Series E-G Preferred Stock, which were issued pursuant to the Securities Purchase Agreement in July 2009, were redeemed in May 2010. Additionally, the Company has a series of 300,000 shares of preferred stock designated as Series D Junior Participating Preferred Stock, par value $0.01 per share. As of December 31, 2010 and 2009, the Company had no Series D Junior Participating shares issued or outstanding.
The board of directors has the authority to issue up to 25 million shares of unclassified preferred stock and to fix dividends, voting and conversion rights, redemption provisions, liquidation preferences and other rights and restrictions.
|
|
c.
|
Stockholders’ Rights Plan
|
The Company has a Stockholders’ Rights Plan (the “Rights Plan”) that is designed to deter coercive or unfair takeover tactics in the event of an unsolicited takeover attempt. It is not intended to prevent a takeover on terms that are favorable and fair to all stockholders and will not interfere with a merger approved by our board of directors. Each right entitles stockholders to buy one one-thousandth of a share of Series D Junior Participating Preferred Stock at an exercise price of $120. The rights will be exercisable only if a person or a group acquires or announces a tender or exchange offer to acquire 20% or more of our common stock or if we enter into other business combination
transactions not approved by our board of directors. As part of our transaction with Trailer Investments in 2009, Trailer Investments was exempted from the application of the Rights Plan to the acquisition of our shares by them. In the event the rights become exercisable, the Rights Plan allows for our stockholders to acquire our stock or the stock of the surviving corporation, whether or not we are the surviving corporation, having a value twice that of the exercise price of the rights. These rights pursuant to the Rights Plan will expire December 28, 2015 or are redeemable for $0.01 per right by the board under certain circumstances.
|
10.
|
STOCK-BASED COMPENSATION
|
In May 2007, the Company adopted the 2007 Omnibus Incentive Plan (the “Omnibus Plan”). This plan provides for the issuance of common stock options, restricted stock, stock appreciation rights and performance units to directors, officers and other eligible employees. This plan makes available approximately 3.5 million shares for issuance, subject to adjustment for stock dividends, recapitalizations and the like.
56
The Company recognizes all share-based payments to eligible employees based upon their fair value. Total stock-based compensation expense was $3.5 million, $3.4 million and $5.0 million in 2010, 2009 and 2008, respectively. The amount of compensation costs related to nonvested common stock options, restricted stock, stock appreciation rights and performance units not yet recognized was $4.1 million at December 31, 2010, for which the weighted average remaining life was 1.9 years.
Stock Options
Stock options are awarded with an exercise price equal to the market price on the date of grant, become exercisable three years after the date of grant and expire ten years after the date of grant. The fair value of stock option awards is estimated on the date of grant using a binomial option-pricing model that uses the assumptions noted in the following table:
|
Valuation Assumptions
|
2010
|
2009
|
2008
|
|||||||||
|
Risk-free interest rate
|
3.77 | % | 2.76 | % | 3.61 | % | ||||||
|
Expected volatility
|
70.1 | % | 56.3 | % | 53.4 | % | ||||||
|
Expected dividend yield
|
0.00 | % | 0.00 | % | 2.10 | % | ||||||
|
Expected term
|
6 yrs.
|
6 yrs.
|
6 yrs.
|
|||||||||
The expected volatility is based upon the Company’s historical experience. The expected term represents the period of time that options granted are expected to be outstanding. The risk-free interest rate utilized for periods throughout the contractual life of the options are based on U.S. Treasury security yields at the time of grant.
A summary of all stock option activity during 2010 is as follows:
|
Number of
Options
|
Weighted
Average
Exercise
Price
|
Weighted
Average
Remaining
Contractual
Life
|
Aggregate
Intrinsic
Value ($ in
millions)
|
|||||||||||||
|
Options Outstanding at December 31, 2009
|
1,997,074 | $ | 12.42 | 6.3 | $ | - | ||||||||||
|
Granted
|
10,000 | $ | 2.06 | |||||||||||||
|
Exercised
|
(75,874 | ) | $ | 6.64 | $ | 0.3 | ||||||||||
|
Forfeited
|
(42,232 | ) | $ | 8.14 | ||||||||||||
|
Expired
|
(229,711 | ) | $ | 16.35 | ||||||||||||
|
Options Outstanding at December 31, 2010
|
1,659,257 | $ | 12.19 | 5.2 | $ | 3.9 | ||||||||||
|
Options Exercisable at December 31, 2010
|
1,397,400 | $ | 13.49 | 4.7 | $ | 2.2 | ||||||||||
The estimated fair value of the options granted in 2010, 2009 and 2008 were $1.35, $2.10 and $3.98 per option, respectively. The total intrinsic value of stock options exercised during 2010 and 2008 was $0.3 million and less than $0.1 million, respectively. No stock options were exercised during 2009.
Restricted stock
Restricted stock awards vest over a period of three years and may be based on achievement of specific financial performance metrics. These shares are valued at the market price on the date of grant, are forfeitable in the event of terminated employment prior to vesting and include the right to vote and receive dividends.
57
A summary of all restricted stock activity during 2010 is as follows:
|
Number of
Shares
|
Weighted
Average
Grant Date
Fair Value
|
|||||||
|
Restricted Stock Outstanding at December 31, 2009
|
731,464 | $ | 7.64 | |||||
|
Granted
|
10,000 | $ | 2.06 | |||||
|
Vested
|
(293,389 | ) | $ | 10.74 | ||||
|
Forfeited
|
(67,815 | ) | $ | 6.44 | ||||
|
Restricted Stock Outstanding at December 31, 2010
|
380,260 | $ | 5.68 | |||||
During 2010, 2009 and 2008, the Company granted 10,000, 500,544 and 448,900 shares of restricted stock with aggregate fair values on the date of grant of less than $0.1 million, $1.8 million and $3.9 million, respectively. The total fair value of restricted stock that vested during 2010, 2009 and 2008 was $2.2 million, $0.3 million and $1.2 million, respectively.
Cash-Settled Performance Units and Stock Appreciation Rights
In March 2010, the Company awarded eligible employees cash-settled stock appreciation rights and performance units. The stock appreciation rights vest over a three year period and provide each participant with the right to receive payment in cash representing the appreciation in the market value of the Company’s common stock from the grant date to the award’s vesting date. The per share exercise price of a stock appreciation right is equal to the closing market price of the Company’s stock on the date of grant. As of December 31, 2010, the weighted average fair market value of each remaining right was $8.70 and will be remeasured at each reporting period using a binomial option-pricing model.
The performance units vest over a three year period and provide each participant with the right to receive payments in cash, upon vesting, for the lesser of the market value of the Company’s stock on the date of grant or the vesting date. As of December 31, 2010, the weighted average fair market value of each performance unit was $7.44 and will be remeasured at each reporting period using a binomial option-pricing model. The number of performance units actually awarded to eligible employees was based on the achievement of specific financial performance metrics.
11. EMPLOYEE SAVINGS PLANS
Substantially all of the Company’s employees are eligible to participate in a defined contribution plan under Section 401(k) of the Internal Revenue Code. The Company also provides a non-qualified defined contribution plan for senior management and certain key employees. Both plans provide for the Company to match, in cash, a percentage of each employee’s contributions up to certain limits. As of September 1, 2008, the Company reduced the matching contribution for its 401(k) plan and suspended all matching contributions to the non-qualified plan. Subsequently, as of April 1, 2009, the Company temporarily suspended all matching contributions for its 401(k) plan. The temporary suspension of all matching
contributions was effective throughout 2010 and, therefore, no matching expenses were incurred. The Company’s matching contribution and related expense for these plans for the previous years of 2009 and 2008 totaled approximately $0.3 million and $3.2 million, respectively.
12. INCOME TAXES
|
|
a.
|
Income Before Income Taxes
|
The consolidated loss before income taxes for 2010, 2009 and 2008 consists of the following (in thousands):
|
2010
|
2009
|
2008
|
||||||||||
|
Domestic
|
$ | (141,867 | ) | $ | (104,769 | ) | $ | (108,437 | ) | |||
|
Foreign
|
56 | 3 | (325 | ) | ||||||||
|
Total loss before income taxes
|
$ | (141,811 | ) | $ | (104,766 | ) | $ | (108,762 | ) | |||
58
|
|
b.
|
Income Tax (Benefit) Expense
|
The consolidated income tax (benefit) expense for 2010, 2009 and 2008 consists of the following components (in thousands):
|
2010
|
2009
|
2008
|
||||||||||
|
Current
|
||||||||||||
|
U.S. Federal
|
$ | (163 | ) | $ | (127 | ) | $ | 13 | ||||
|
Foreign
|
- | - | 14 | |||||||||
|
State
|
112 | 32 | (27 | ) | ||||||||
|
Deferred
|
- | (2,906 | ) | 17,064 | ||||||||
|
Total consolidated (benefit) expense
|
$ | (51 | ) | $ | (3,001 | ) | $ | 17,064 | ||||
The Company’s following table provides a reconciliation of differences from the U.S. Federal statutory rate of 35% as follows (in thousands):
|
2010
|
2009
|
2008
|
||||||||||
|
Pretax book loss
|
$ | (141,811 | ) | $ | (104,766 | ) | $ | (108,762 | ) | |||
|
Federal tax benefit at 35% statutory rate
|
(49,634 | ) | (36,668 | ) | (38,067 | ) | ||||||
|
State and local income taxes
|
(6,981 | ) | (5,205 | ) | (4,650 | ) | ||||||
|
Provisions for valuation allowance for net operating
|
||||||||||||
|
losses and credit carrryforwards - U.S. and states
|
7,604 | 23,944 | 48,272 | |||||||||
|
Effect of non-deductible impairment of goodwill
|
- | - | 10,212 | |||||||||
|
Effect of non-deductible adjustment to fair market
|
||||||||||||
|
value of warrants
|
48,635 | 13,379 | - | |||||||||
|
Effect of non-deductible stock-based compensation
|
395 | 868 | 403 | |||||||||
|
Other
|
(70 | ) | 681 | 894 | ||||||||
|
Total income tax (benefit) expense
|
$ | (51 | ) | $ | (3,001 | ) | $ | 17,064 | ||||
The $3.0 million income tax benefit for the year ended December 31, 2009 was substantially associated with a change in the tax law which permitted the Company to recover U.S. federal alternative minimum taxes paid in 2004, 2005 and 2006 of $2.9 million against which the Company previously had recorded a full valuation allowance.
c. Deferred Taxes
The Company’s deferred income taxes are primarily due to temporary differences between financial and income tax reporting for the depreciation of property, plant and equipment, amortization of intangibles, compensation adjustments, other accrued liabilities and tax credits and losses carried forward.
Deferred tax assets are reduced by a valuation allowance when, in the opinion of management, it is more likely than not that some portion or all of the deferred tax assets will not be realized. During 2010, the Company recorded an additional $7.6 million net valuation allowance. Companies are required to assess whether valuation allowances should be established against their deferred tax assets based on the consideration of all available evidence, both positive and negative, using a “more likely than not” standard. In making such judgments, significant weight is given to evidence that can be objectively verified.
The Company assesses, on a quarterly basis, the realizability of its deferred tax assets by evaluating all available evidence, both positive and negative, including: (1) the cumulative results of operations in recent years, (2) the nature of recent losses, (3) estimates of future taxable income, (4) the length of operating loss carryforward periods and (5) the uncertainty associated with a possible change in ownership, which imposes an annual limitation on the use of these carryforwards. The Company has been in a cumulative three-year pre-tax loss position since the quarter ended December 31, 2008. The cumulative three-year loss is considered significant negative evidence which is objective and verifiable.
Additional negative evidence considered included the uncertainty regarding the magnitude and length of the current economic recession and the highly competitive nature of the transportation market. Positive evidence considered by the Company in its assessment included lengthy operating loss carryforward periods, a lack of unused expired operating loss carryforwards in the Company’s history and estimates of future taxable income. However, there is uncertainty as to the Company’s ability to meet its estimates of future taxable income in order to recover its deferred tax assets in the United States.
59
After considering both the positive and negative evidence management determined that it was no longer more-likely-than-not that it would realize the value of its deferred tax assets. As a result, the Company established a full valuation allowance against its net deferred tax assets as of December 31, 2010, 2009 and 2008. In subsequent periods, the Company will continue to evaluate the deferred income tax asset valuation allowance and adjust the allowance when management has determined that it is more-likely than not, after considering both the positive and negative evidence, that the realizability of the related deferred tax assets, or a portion thereof, has changed.
As of December 31, 2010, the Company has U.S. federal tax net operating loss carryforwards (“NOLs”) of approximately $180 million, which will expire beginning in 2022, if unused, and which may be subject to other limitations under Internal Revenue Service (the “IRS”) rules. The Company has various multistate income tax net operating loss carryforwards, which have been recorded as a deferred income tax asset, of approximately $18 million, before valuation allowances. The Company also has various U.S. federal income tax credit carryforwards, which will expire beginning in 2013, if unused. The Company’s NOLs, including any future NOLs that may arise, are subject to limitations on use
under the IRS rules, including Section 382 of the Internal Revenue Code of 1986 (“Section 382”), as revised. Section 382 limits the ability of a company to utilize NOLs in the event of an ownership change. The Company would undergo an ownership change if, among other things, the stockholders, or group of stockholders, who own or have owned, directly or indirectly, 5% or more of the value of the Company’s stock or are otherwise treated as 5% stockholders under Section 382 and the regulations promulgated thereunder increase their aggregate percentage ownership of the Company’s stock by more than 50 percentage points over the lowest percentage of its stock owned by these stockholders at any time during the testing period, which is generally the three-year period preceding the potential ownership change.
In the event of an ownership change, Section 382 imposes an annual
limitation on the amount of post-ownership change taxable income a corporation
may offset with pre-ownership change NOLs and certain recognized built-in
losses. The limitation imposed by Section 382 for any post-change year would be
determined by multiplying the value of our stock immediately before the
ownership change (subject to certain adjustments) by the applicable long-term
tax-exempt rate in effect at the time of the ownership change. Any unused annual
limitation may be carried over to later years, and the limitation may under
certain circumstances be increased by built-in gains that may be present in
assets held by us at the time of the ownership change that are recognized in the
five-year period after the ownership change. It is expected that any loss of the
Company’s NOLs would cause its effective tax rate to go up significantly
if the Company returns to profitability, excluding impacts of valuation allowance.
On May 28, 2010 a change of ownership did occur resulting from the issuance of 11,750,000 shares of common stock, which invoked a limitation on the utilization of pre-ownership change NOLs under Section 382. Pre-ownership change NOLs are $177 million. Management has estimated the annual NOL limitations under Section 382 through 2014 to be the following: $70 million for 2011; $42 million for 2012; $40 million for 2013; and $25 million for 2014. To the extent the limitation in any year is not reached, any remaining limitation can be carried forward indefinitely to future years. Post-ownership change NOLs at December 31, 2010 are $3 million, which
is currently not subject to utilization limits.
In 2009 the Company undertook a study to ensure that the change in ownership related to the issuance of the warrant in August 2009 did not result in a Section 382 limitation and believes that such a limitation was not triggered. However, there can be no assurance that such a change was not triggered at that time due to lack of authoritative guidance.
60
The components of deferred tax assets and deferred tax liabilities as of December 31, 2010 and 2009 were as follows (in thousands):
|
2010
|
2009
|
|||||||
|
Deferred tax assets
|
||||||||
|
Tax credits and loss carryforwards
|
$ | 81,808 | $ | 75,776 | ||||
|
Accrued liabilities
|
5,518 | 6,174 | ||||||
|
Incentive compensation
|
7,439 | 7,983 | ||||||
|
Other
|
7,097 | 4,698 | ||||||
| $ | 101,862 | $ | 94,631 | |||||
|
Deferred tax liabilities
|
||||||||
|
Property, plant and equipment
|
(1,687 | ) | (2,550 | ) | ||||
|
Intangibles
|
(2,766 | ) | (2,111 | ) | ||||
|
Other
|
(525 | ) | (690 | ) | ||||
| $ | (4,978 | ) | $ | (5,351 | ) | |||
|
Net deferred tax asset before valuation allowances and reserves
|
$ | 96,884 | $ | 89,280 | ||||
|
Valuation allowances
|
(87,479 | ) | (79,875 | ) | ||||
|
Uncertain tax positions
|
(9,405 | ) | (9,405 | ) | ||||
|
Net deferred tax asset
|
$ | - | $ | - | ||||
d. Tax Reserves
The Company’s policy with respect to interest and penalties associated with reserves or allowances for uncertain tax positions is to classify such interest and penalties in income tax expense in the Statements of Operations. As of December 31, 2010 and 2009, the total amount of unrecognized income tax benefits was approximately $10.1 million, all of which, if recognized, would impact the effective income tax rate of the Company. As of December 31, 2010 and 2009, the Company had recorded a total of $0.5 million and $0.4 million, respectively, of accrued interest and penalties related to uncertain tax positions. The Company foresees no significant changes to the facts and circumstances underlying
its reserves and allowances for uncertain income tax positions as reasonably possible during the next 12 months. As of December 31, 2010, the Company is subject to unexpired statutes of limitation for U.S. federal income taxes for the years 2001 through 2010. The Company is also subject to unexpired statutes of limitation for Indiana state income taxes for the years 2001 through 2010.
A reconciliation of the beginning and ending amount of unrecognized tax benefits is as follows (in thousands):
|
Balance at January 1, 2009
|
$ | 10,080 | ||
|
Balance at December 31, 2009
|
$ | 10,080 | ||
|
Increase in prior year tax positions
|
15 | |||
|
Balance at December 31, 2010
|
$ | 10,095 |
13. COMMITMENTS AND CONTINGENCIES
a. Litigation
Various lawsuits, claims and proceedings have been or may be instituted or asserted against the Company arising in the ordinary course of business, including those pertaining to product liability, labor and health related matters, successor liability, environmental matters and possible tax assessments. While the amounts claimed could be substantial, the ultimate liability cannot now be determined because of the considerable uncertainties that exist. Therefore, it is possible that results of operations or liquidity in a particular period could be materially affected by certain contingencies. However, based on facts currently available, management believes that the disposition of matters that are currently pending
or asserted other than the matters below, which are addressed individually, will not have a material adverse effect on the Company's financial position, liquidity or results of operations. Costs associated with the litigation and settlements of legal matters are reported within General and Administrative Expenses in the Consolidated Statements of Operations.
61
Brazil Joint Venture
In March 2001, Bernard Krone Indústria e Comércio de Máquinas Agrícolas Ltda. ("BK") filed suit against the Company in the Fourth Civil Court of Curitiba in the State of Paraná, Brazil. Because of the bankruptcy of BK, this proceeding is now pending before the Second Civil Court of Bankruptcies and Creditors Reorganization of Curitiba, State of Paraná (No. 232/99).
The case grows out of a joint venture agreement between BK and the Company related to marketing of RoadRailer trailers in Brazil and other areas of South America. When BK was placed into the Brazilian equivalent of bankruptcy late in 2000, the joint venture was dissolved. BK subsequently filed its lawsuit against the Company alleging that it was forced to terminate business with other companies because of the exclusivity and non-compete clauses purportedly found in the joint venture agreement. BK asserts damages of approximately R$20.8 million (Brazilian Reais) which is approximately $12.5 million U.S. dollars using current exchange rates. The amount of damages
asserted in local currency has not changed since 2001.
We answered the complaint in May 2001, denying any wrongdoing. We believe that the claims asserted by BK are without merit and intend to vigorously defend our position. A bench (non-jury) trial was held on March 30, 2010 in Curitiba, Paraná, Brazil. A ruling on the evidence presented at the trial is not expected for several months. We believe that the resolution of this lawsuit will not have a material adverse effect on our financial position, liquidity or future results of operations; however, at this stage of the proceeding no assurances can be given as to the ultimate outcome of the case.
Intellectual Property
In October 2006, the Company filed a patent infringement suit against Vanguard National Corporation (“Vanguard”) regarding Wabash National’s U.S. Patent Nos. 6,986,546 and 6,220,651 in the U.S. District Court for the Northern District of Indiana (Civil Action No. 4:06-cv-135). The Company amended the Complaint in April 2007. In May 2007, Vanguard filed its Answer to the Amended Complaint, along with Counterclaims seeking findings of non-infringement, invalidity, and unenforceability of the subject patents. The Company filed a reply to Vanguard’s counterclaims in May 2007, denying any wrongdoing or merit to the allegations as set forth in the counterclaims. The case has currently been
stayed by agreement of the parties while the U.S. Patent and Trademark Office (“Patent Office”) undertakes a reexamination of U.S. Patent Nos. 6,986,546. The Patent Office recently notified the Company that the reexamination is complete and the Patent Office has reissued U.S. Patent No. 6,986,546 without cancelling any claims of the patent. The parties plan to petition the Court to lift the stay; however, it is unknown at this time when the petition to lift the stay may be granted.
The Company believes that its claims against Vanguard have merit, that the claims asserted by Vanguard are without merit, and intends to vigorously defend its position and intellectual property. The Company believes that the resolution of this lawsuit will not have a material adverse effect on its financial position, liquidity or future results of operations; however, at this stage of the proceeding, no assurance can be given as to the ultimate outcome of the case.
Environmental Disputes
In September 2003, we were noticed as a potentially responsible party (PRP) by the U.S. Environmental Protection Agency (“EPA”) pertaining to the Motorola 52nd Street, Phoenix, Arizona Superfund Site (the “Superfund Site”) pursuant to the Comprehensive Environmental Response, Compensation and Liability Act (“CERCLA”). PRPs include current and former owners and operators of facilities at which hazardous substances were allegedly disposed. The EPA’s allegation that we were a PRP arises out of our acquisition of a former branch facility located approximately five miles from the original Superfund Site. We acquired this facility in 1997, operated the facility until 2000, and
sold the facility to a third party in 2002. In June 2010, we were contacted by the Roosevelt Irrigation District (“RID”) informing it that the Arizona Department of Environmental Quality (“ADEQ”) had approved a remediation plan in excess of $100 million for the RID portion of the Superfund Site, and demanded that we contribute to the cost of the plan or be named as a defendant in a CERCLA action to be filed in July 2010. We initiated settlement discussions with the RID and the ADEQ in July 2010 to provide a full release from the RID, and a covenant not-to-sue and contribution protection regarding the former branch property from the ADEQ, in exchange for payment from us. If the settlement is approved by all parties, it will prevent any third party from successfully bringing claims against us for environmental contamination relating to this former branch property.
We are awaiting approval from the ADEQ for the settlement we proposed in July 2010; we do not expect to receive a response from the ADEQ for several more months. Based upon our limited period of ownership of the former branch property, and the fact that we no longer own the former branch property, we do not anticipate that the ADEQ will reject the proposed settlement, but no assurance can be given at this time as to the ADEQ’s response to the settlement proposal. The proposed settlement terms have been accrued and did not have a material adverse effect on our financial condition or results of operations, and we believe that any ongoing proceedings will not have a material adverse effect on the Company’s financial condition or results of operations.
62
In January 2006, the Company received a letter from the North Carolina Department of Environment and Natural Resources indicating that a site that the Company formerly owned near Charlotte, North Carolina has been included on the state's October 2005 Inactive Hazardous Waste Sites Priority List. The letter states that the Company was being notified in fulfillment of the state's “statutory duty” to notify those who own and those who at present are known to be responsible for each Site on the Priority List. No action is being requested from the Company at this time. The Company does not expect that this designation will have a material adverse effect on its financial condition or results of
operations.
b. Environmental Litigation Commitments and Contingencies
The Company generates and handles certain material, wastes and emissions in the normal course of operations that are subject to various and evolving federal, state and local environmental laws and regulations.
The Company assesses its environmental liabilities on an on-going basis by evaluating currently available facts, existing technology, presently enacted laws and regulations as well as experience in past treatment and remediation efforts. Based on these evaluations, the Company estimates a lower and upper range for treatment and remediation efforts and recognizes a liability for such probable costs based on the information available at the time. As of December 31, 2010, in addition to a reserve of $0.2 million relating to the ADEQ proposed settlement discussed above, the Company had reserved estimated remediation costs of $0.2 million for activities at a former branch property.
c. Letters of Credit
As of December 31, 2010, the Company had standby letters of credit totaling $5.8 million issued in connection with workers compensation claims and surety bonds.
d. Purchase Commitments
The Company has $34.3 million in purchase commitments through December 2011 for aluminum, which is within normal production requirements.
14. SEGMENTS AND RELATED INFORMATION
|
|
a.
|
Segment Reporting
|
The Company has two reportable segments: manufacturing and retail and distribution. The manufacturing segment produces and sells new trailers to the retail and distribution segment or to customers who purchase trailers directly from the Company or through independent dealers. The retail and distribution segment includes the sale of new and used trailers, as well as the sale of after-market parts and service, through its retail branch network.
The accounting policies of the segments are the same as those described in
the summary of significant accounting policies except that the Company evaluates
segment performance based on income from operations. The Company has not
allocated certain corporate related administrative costs,
interest and income taxes included in the manufacturing segment to the Company’s
other reportable segment. The Company accounts for intersegment sales and
transfers at cost plus a specified mark-up. Reportable segment information is as
follows (in thousands):
63
|
Retail and
|
Combined
|
Consolidated
|
||||||||||||||||||
|
Manufacturing
|
Distribution
|
Segments
|
Eliminations
|
Total
|
||||||||||||||||
|
2010
|
||||||||||||||||||||
|
Net sales
|
||||||||||||||||||||
|
External customers
|
$ | 542,016 | $ | 98,356 | $ | 640,372 | $ | - | $ | 640,372 | ||||||||||
|
Intersegment sales
|
33,787 | - | 33,787 | (33,787 | ) | $ | - | |||||||||||||
|
Total net sales
|
$ | 575,803 | $ | 98,356 | $ | 674,159 | $ | (33,787 | ) | $ | 640,372 | |||||||||
|
Depreciation and amortization
|
16,172 | 683 | 16,855 | - | 16,855 | |||||||||||||||
|
(Loss) Income from operations
|
(15,532 | ) | 297 | (15,235 | ) | (182 | ) | (15,417 | ) | |||||||||||
|
Reconciling items to net loss
|
||||||||||||||||||||
|
Increase in fair value of warrant
|
121,587 | |||||||||||||||||||
|
Interest expense
|
4,140 | |||||||||||||||||||
|
Other, net
|
667 | |||||||||||||||||||
|
Income tax benefit
|
(51 | ) | ||||||||||||||||||
|
Net loss
|
$ | (141,760 | ) | |||||||||||||||||
|
Capital expenditures
|
$ | 1,616 | $ | 166 | $ | 1,782 | $ | - | $ | 1,782 | ||||||||||
|
Assets
|
$ | 436,015 | $ | 96,821 | $ | 532,836 | $ | (230,002 | ) | $ | 302,834 | |||||||||
|
2009
|
||||||||||||||||||||
|
Net sales
|
||||||||||||||||||||
|
External customers
|
$ | 265,541 | $ | 72,299 | $ | 337,840 | $ | - | $ | 337,840 | ||||||||||
|
Intersegment sales
|
13,977 | - | 13,977 | (13,977 | ) | $ | - | |||||||||||||
|
Total net sales
|
$ | 279,518 | $ | 72,299 | $ | 351,817 | $ | (13,977 | ) | $ | 337,840 | |||||||||
|
Depreciation and amortization
|
18,728 | 857 | 19,585 | - | 19,585 | |||||||||||||||
|
(Loss) Income from operations
|
(57,459 | ) | (8,827 | ) | (66,286 | ) | 212 | (66,074 | ) | |||||||||||
|
Reconciling items to net loss
|
||||||||||||||||||||
|
Increase in fair value of warrant
|
33,447 | |||||||||||||||||||
|
Interest expense
|
4,379 | |||||||||||||||||||
|
Other, net
|
866 | |||||||||||||||||||
|
Income tax benefit
|
(3,001 | ) | ||||||||||||||||||
|
Net loss
|
$ | (101,765 | ) | |||||||||||||||||
|
Capital expenditures
|
$ | 837 | $ | 144 | $ | 981 | $ | - | $ | 981 | ||||||||||
|
Assets
|
$ | 358,351 | $ | 95,246 | $ | 453,597 | $ | (229,820 | ) | $ | 223,777 | |||||||||
|
2008
|
||||||||||||||||||||
|
Net sales
|
||||||||||||||||||||
|
External customers
|
$ | 694,187 | $ | 142,026 | $ | 836,213 | $ | - | $ | 836,213 | ||||||||||
|
Intersegment sales
|
50,712 | 32 | 50,744 | (50,744 | ) | $ | - | |||||||||||||
|
Total net sales
|
$ | 744,899 | $ | 142,058 | $ | 886,957 | $ | (50,744 | ) | $ | 836,213 | |||||||||
|
Depreciation and amortization
|
20,356 | 1,111 | 21,467 | - | 21,467 | |||||||||||||||
|
Impairment of goodwill
|
66,317 | - | 66,317 | - | 66,317 | |||||||||||||||
|
(Loss) Income from operations
|
(98,840 | ) | (5,991 | ) | (104,831 | ) | 1,054 | (103,777 | ) | |||||||||||
|
Reconciling items to net loss
|
||||||||||||||||||||
|
Interest expense
|
4,657 | |||||||||||||||||||
|
Other, net
|
328 | |||||||||||||||||||
|
Income tax expense
|
17,064 | |||||||||||||||||||
|
Net loss
|
$ | (125,826 | ) | |||||||||||||||||
|
Capital expenditures
|
$ | 12,221 | $ | 392 | $ | 12,613 | $ | - | $ | 12,613 | ||||||||||
|
Assets
|
$ | 442,614 | $ | 119,647 | $ | 562,261 | $ | (230,287 | ) | $ | 331,974 | |||||||||
b. Customer Concentration
For 2010 and 2009, the Company had one manufacturing segment customer which represented approximately 10% and 14%, respectively, of our consolidated net sales. For 2008, no customer represented more than 10% of consolidated net sales. International sales, primarily to Canadian customers, accounted for less than 10% in each of the last three years.
64
c. Product Information
The Company offers products primarily in three general categories: new trailers, used trailers and parts, service and other. The following table sets forth the major product categories and their percentage of consolidated net sales (dollars in thousands):
|
2010
|
2009
|
2008
|
||||||||||||||||||||||
|
New Trailers
|
$ | 550,470 | 86.0 | % | $ | 272,678 | 80.7 | % | $ | 741,011 | 88.6 | % | ||||||||||||
|
Used Trailers
|
22,619 | 3.5 | 19,109 | 5.7 | 36,512 | 4.4 | ||||||||||||||||||
|
Parts, service and other
|
67,283 | 10.5 | 46,053 | 13.6 | 58,690 | 7.0 | ||||||||||||||||||
|
Total Sales
|
$ | 640,372 | 100.0 | % | $ | 337,840 | 100.0 | % | $ | 836,213 | 100.0 | % | ||||||||||||
15. CONSOLIDATED QUARTERLY FINANCIAL DATA (UNAUDITED)
The following is a summary of the unaudited quarterly results of operations for fiscal years 2010, 2009 and 2008 (dollars in thousands except per share amounts):
|
First
|
Second
|
Third
|
Fourth
|
|||||||||||||
|
Quarter
|
Quarter
|
Quarter
|
Quarter
|
|||||||||||||
|
2010
|
||||||||||||||||
|
Net sales
|
$ | 78,274 | $ | 149,699 | $ | 170,848 | $ | 241,551 | ||||||||
|
Gross profit
|
(976 | ) | 5,301 | 6,467 | 17,291 | |||||||||||
|
Net (loss) income(1)
|
(139,079 | ) | (5,602 | ) | (1,938 | ) | 4,859 | |||||||||
|
Basic and diluted net (loss) income per share(2)(3)
|
(4.64 | ) | (0.72 | ) | (0.03 | ) | 0.07 | |||||||||
|
2009
|
||||||||||||||||
|
Net sales
|
$ | 77,937 | $ | 86,206 | $ | 88,324 | $ | 85,373 | ||||||||
|
Gross profit
|
(15,476 | ) | (5,231 | ) | (321 | ) | (1,882 | ) | ||||||||
|
Net (loss) income(1)
|
(28,284 | ) | (17,935 | ) | (66,404 | ) | 10,858 | |||||||||
|
Basic and diluted net (loss) income per share(2)(3)
|
(0.94 | ) | (0.59 | ) | (2.23 | ) | 0.15 | |||||||||
|
2008
|
||||||||||||||||
|
Net sales
|
$ | 161,061 | $ | 201,484 | $ | 242,953 | $ | 230,715 | ||||||||
|
Gross profit
|
5,905 | 10,773 | 8,988 | (4,742 | ) | |||||||||||
|
Net loss(4)(5)
|
(6,387 | ) | (3,203 | ) | (4,330 | ) | (111,906 | ) | ||||||||
|
Basic and diluted net loss per share(3)
|
(0.21 | ) | (0.11 | ) | (0.15 | ) | (3.73 | ) | ||||||||
|
|
(1)
|
Net (loss) income includes a non-cash benefit (charge) of ($54.0) million, $20.5 million, ($126.8) million, $1.9 million and $3.3 million related to the change in the fair value of the Company’s warrant for the third and fourth quarters of 2009 and the first, second and third quarters of 2010, respectively.
|
|
|
(2)
|
Basic and diluted net income (loss) per share includes $1.1 million, $2.2 million, $2.0 million and $1.3 million of preferred stock dividends for the third and fourth quarters of 2009 and the first and second quarters of 2010, respectively. The second quarter of 2010 also includes a $22.1 million loss on early extinguishment of preferred stock.
|
|
|
(3)
|
Net income (loss) per share is computed independently for each of the quarters presented. Therefore, the sum of the quarterly net income (loss) per share may differ from annual net income (loss) per share due to rounding.
|
|
|
(4)
|
The fourth quarter of 2008 included $66.3 million of expense related to the impairment of goodwill.
|
|
(5)
|
The fourth quarter of 2008 included $23.1 million of expense related to establishing a full tax valuation allowance.
|
ITEM 9—CHANGES IN AND DISAGREEMENTS WITH ACCOUNTANTS ON ACCOUNTING AND FINANCIAL DISCLOSURE
None
65
ITEM 9A—CONTROLS AND PROCEDURES
Disclosure Controls and Procedures
We maintain disclosure controls and procedures that are designed to provide reasonable assurance to our management and board of directors that information required to be disclosed in the reports we file or submit under the Securities Exchange Act of 1934, as amended, is recorded, processed, summarized and reported within the time periods specified in the Securities and Exchange Commission’s rules and forms, and that such information is accumulated and communicated to our management, including our Chief Executive Officer and Chief Financial Officer, as appropriate to allow timely decisions regarding required disclosure. Based on an evaluation conducted under the supervision and with the participation of the
Company’s management, including our Chief Executive Officer and our Chief Financial Officer, of the effectiveness of the design and operation of our disclosure controls and procedures as of December 31, 2010, including those procedures described below, we, including our Chief Executive Officer and our Chief Financial Officer, determined that those controls and procedures were effective.
Changes in Internal Controls
There were no changes in our internal control over financial reporting, as defined in Rules 13a-15(f) and 15d-15(f) under the Exchange Act, during the fourth quarter of fiscal 2010 that have materially affected or are reasonably likely to materially affect our internal control over financial reporting.
Report of Management on Internal Control over Financial Reporting
The management of Wabash National Corporation (the Company), is responsible for establishing and maintaining adequate internal control over financial reporting. The Company’s internal control over financial reporting is a process designed to provide reasonable assurance regarding the reliability of financial reporting and the preparation of financial statements for external purposes in accordance with U.S. generally accepted accounting principles. Internal control over financial reporting includes those policies and procedures that (1) pertain to the maintenance of records that, in reasonable detail, accurately and fairly reflect the transactions and dispositions of the assets of the Company; (2) provide
reasonable assurance that transactions are recorded as necessary to permit preparation of the financial statements in accordance with U.S. generally accepted accounting principles; (3) provide reasonable assurance that receipts and expenditures of the Company are being made only in accordance with authorizations of management and directors of the Company; and (4) provide reasonable assurance regarding prevention or timely detection of unauthorized acquisition, use or disposition of the Company’s assets that could have a material effect on the financial statements.
Because of its inherent limitations, internal control over financial reporting may not prevent or detect misstatements. Also, projections of any evaluation of effectiveness to future periods are subject to the risk that controls may become inadequate because of changes in conditions, or that the degree of compliance with the policies and procedures may deteriorate.
Management assessed the effectiveness of the Company’s internal control over financial reporting as of December 31, 2010, based on criteria for effective internal control over financial reporting described in Internal Control – Integrated Framework issued by the Committee of Sponsoring Organizations of the Treadway Commission (COSO). Based on this assessment, we have concluded that internal control over financial reporting is effective as of December 31, 2010.
Ernst & Young LLP, an Independent Registered Public Accounting Firm, has audited the Company’s consolidated financial statements as of and for the year ended December 31, 2010, and its report on internal controls over financial reporting as of December 31, 2010 appears on the following page.
|
Richard J. Giromini
|
President and Chief Executive Officer
|
|
Mark J. Weber
|
Senior Vice President and Chief Financial Officer
|
February 25, 2011
66
Report of Independent Registered Public Accounting Firm
The Board of Directors and Shareholders of Wabash National Corporation:
We have audited Wabash National Corporation’s internal control over financial reporting as of December 31, 2010, based on criteria established in Internal Control—Integrated Framework issued by the Committee of Sponsoring Organizations of the Treadway Commission (the COSO criteria). Wabash National Corporation’s management is responsible for maintaining effective internal control over financial reporting, and for its assessment of the effectiveness of internal control over financial reporting included in the accompanying Report of Management on Internal Control over Financial Reporting. Our responsibility is to express an opinion on the company’s internal control over financial
reporting based on our audit.
We conducted our audit in accordance with the standards of the Public Company Accounting Oversight Board (United States). Those standards require that we plan and perform the audit to obtain reasonable assurance about whether effective internal control over financial reporting was maintained in all material respects. Our audit included obtaining an understanding of internal control over financial reporting, assessing the risk that a material weakness exists, testing and evaluating the design and operating effectiveness of internal control based on the assessed risk, and performing such other procedures as we considered necessary in the circumstances. We believe that our audit provides a reasonable
basis for our opinion.
A company’s internal control over financial reporting is a process designed to provide reasonable assurance regarding the reliability of financial reporting and the preparation of financial statements for external purposes in accordance with generally accepted accounting principles. A company’s internal control over financial reporting includes those policies and procedures that (1) pertain to the maintenance of records that, in reasonable detail, accurately and fairly reflect the transactions and dispositions of the assets of the company; (2) provide reasonable assurance that transactions are recorded as necessary to permit preparation of financial statements in accordance with generally
accepted accounting principles, and that receipts and expenditures of the company are being made only in accordance with authorizations of management and directors of the company; and (3) provide reasonable assurance regarding prevention or timely detection of unauthorized acquisition, use, or disposition of the company’s assets that could have a material effect on the financial statements.
Because of its inherent limitations, internal control over financial reporting may not prevent or detect misstatements. Also, projections of any evaluation of effectiveness to future periods are subject to the risk that controls may become inadequate because of changes in conditions, or that the degree of compliance with the policies or procedures may deteriorate.
In our opinion, Wabash National Corporation maintained, in all material respects, effective internal control over financial reporting as of December 31, 2010, based on the COSO criteria.
We also have audited, in accordance with the standards of the Public Company Accounting Oversight Board (United States), the consolidated balance sheets of Wabash National Corporation as of December 31, 2010 and 2009, and the related consolidated statements of operations, stockholder’s equity, and cash flows for each of the three years in the period ended December 31, 2010 and our report dated February 25, 2011 expressed an unqualified opinion thereon.
|
Ernst & Young LLP
|
Indianapolis, Indiana
February 25, 2011
67
ITEM 9B—OTHER INFORMATION
None.
PART III
ITEM 10—EXECUTIVE OFFICERS OF THE REGISTRANT
The Company hereby incorporates by reference the information contained under the heading “Executive Officers of Wabash National Corporation” from Item 1 Part I of this Annual Report.
The Company hereby incorporates by reference the information contained under the headings “Section 16(a) Beneficial Ownership Reporting Compliance” or “Election of Directors” from its definitive Proxy Statement to be delivered to stockholders of the Company in connection with the 2011 Annual Meeting of Stockholders to be held May 19, 2011.
Code of Ethics
As part of our system of corporate governance, our Board of Directors has adopted a Code of Business Conduct and Ethics (Code of Ethics) that is specifically applicable to our Chief Executive Officer and Senior Financial Officers. This Code of Ethics is available on the Investors page of the Company Info section of our website at www.wabashnational.com/investors/index.htm. We will disclose any waivers for our Chief Executive Officer or Senior Financial Officers under, or any amendments to, our Code of Ethics by posting such information on our website at the address above.
ITEM 11—EXECUTIVE COMPENSATION
The Company hereby incorporates by reference the information contained under the headings “Executive Compensation" and “Director Compensation” from its definitive Proxy Statement to be delivered to the stockholders of the Company in connection with the 2011 Annual Meeting of Stockholders to be held May 19, 2011.
ITEM 12—SECURITY OWNERSHIP OF CERTAIN BENEFICIAL OWNERS AND MANAGEMENT AND RELATED STOCKHOLDER MATTERS
The Company hereby incorporates by reference the information contained under the headings "Beneficial Ownership of Common Stock" and “Equity Compensation Plan Information” from its definitive Proxy Statement to be delivered to the stockholders of the Company in connection with the 2011 Annual Meeting of Stockholders to be held on May 19, 2011.
ITEM 13—CERTAIN RELATIONSHIPS AND RELATED TRANSACTIONS, AND DIRECTOR INDEPENDENCE
The Company hereby incorporates by reference the information contained under the headings “Election of Directors” and "Related Party Transactions" from its definitive Proxy Statement to be delivered to the stockholders of the Company in connection with the 2011 Annual Meeting of Stockholders to be held on May 19, 2011.
ITEM 14—PRINCIPAL ACCOUNTING FEES AND SERVICES
Information required by Item 14 of this form and the audit committee’s pre-approval policies and procedures regarding the engagement of the principal accountant are incorporated herein by reference to the information contained under the heading “Ratification of the Appointment of Independent Registered Public Accounting Firm” from the Company’s definitive Proxy Statement to be delivered to the stockholders of the Company in connection with the 2011 Annual Meeting of Stockholders to be held on May 19, 2011.
68
PART IV
ITEM 15—EXHIBITS AND FINANCIAL STATEMENT SCHEDULES
|
(a)
|
Financial Statements: The Company has included all required financial statements in Item 8 of this Form 10-K. The financial statement schedules have been omitted as they are not applicable or the required information is included in the Notes to the consolidated financial statements.
|
|
(b)
|
Exhibits: The following exhibits are filed with this Form 10-K or incorporated herein by reference to the document set forth next to the exhibit listed below:
|
|
2.01
|
Stock Purchase Agreement by and among the Company, Transcraft Corporation and Transcraft Investment Partners, L.P. dated as of March 3, 2006 (12)
|
|
3.01
|
Certificate of Incorporation of the Company (1)
|
|
3.02
|
Certificate of Designations of Series D Junior Participating Preferred Stock (10)
|
|
3.03
|
Certificate of Designations, Preferences and Rights of Series E Redeemable Preferred Stock (18)
|
|
3.04
|
Certificate of Designations, Preferences and Rights of Series F Redeemable Preferred Stock (18)
|
|
3.05
|
Certificate of Designations, Preferences and Rights of Series G Redeemable Preferred Stock (18)
|
|
3.06
|
Amended and Restated Bylaws of the Company, as amended (18)
|
|
3.07
|
Certificate of Elimination of Series E Redeemable Preferred Stock (23)
|
|
3.08
|
Certificate of Elimination of Series F Redeemable Preferred Stock (23)
|
|
3.09
|
Certificate of Elimination of Series G Redeemable Preferred Stock (23)
|
|
4.01
|
Specimen Stock Certificate (2)
|
|
4.02
|
Rights Agreement between the Company and National City Bank as Rights Agent dated December 28, 2005 (11)
|
|
4.03
|
Amendment No. 1 to the Rights Agreement dated July 17, 2009 (17)
|
|
10.01#
|
1992 Stock Option Plan (1)
|
|
10.02#
|
2000 Stock Option Plan (3)
|
|
10.03#
|
Executive Employment Agreement dated June 28, 2002 between the Company and Richard J. Giromini (4)
|
|
10.04#
|
Non-qualified Stock Option Agreement dated July 15, 2002 between the Company and Richard J. Giromini (4)
|
|
10.05#
|
Non-qualified Stock Option Agreement between the Company and William P. Greubel (4)
|
|
10.06
|
Asset Purchase Agreement dated July 22, 2003 (5)
|
|
10.07
|
Amendment No. 1 to the Asset Purchase Agreement dated September 19, 2003 (5)
|
|
10.08#
|
2004 Stock Incentive Plan (6)
|
|
10.09#
|
Form of Associate Stock Option Agreements under the 2004 Stock Incentive Plan (7)
|
|
10.10#
|
Form of Associate Restricted Stock Agreements under the 2004 Stock Incentive Plan (7)
|
|
10.11#
|
Form of Executive Stock Option Agreements under the 2004 Stock Incentive Plan (7)
|
|
10.12#
|
Form of Executive Restricted Stock Agreements under the 2004 Stock Incentive Plan (7)
|
|
10.13#
|
Restricted Stock Unit Agreement between the Company and William P. Greubel dated March 7, 2005 (8)
|
|
10.14#
|
Stock Option Agreement between the Company and William P. Greubel dated March 7, 2005 (8)
|
|
10.15#
|
Corporate Plan for Retirement – Executive Plan (9)
|
|
10.16#
|
Change in Control Policy (15)
|
|
10.17#
|
Executive Severance Policy (15)
|
|
10.18#
|
Form of Restricted Stock Unit Agreement under the 2004 Stock Incentive Plan (13)
|
|
10.19#
|
Form of Restricted Stock Agreement under the 2004 Stock Incentive Plan (13)
|
|
10.20#
|
Form of CEO and President Restricted Stock Agreement under the 2004 Stock Incentive Plan (13)
|
|
10.21#
|
Form of Stock Option Agreement under the 2004 Stock Incentive Plan (13)
|
|
10.22#
|
Form of CEO and President Stock Option Agreement under the 2004 Stock Incentive Plan (13)
|
|
10.23#
|
Executive Director Agreement dated January 1, 2007 between the Company and William P. Greubel (14)
|
|
10.24#
|
Amendment to Executive Employment Agreement dated January 1, 2007 between the Company and Richard J. Giromini (14)
|
|
10.25#
|
Form of Non-Qualified Stock Option Agreement under the 2007 Omnibus Incentive Plan (15)
|
|
10.26#
|
Form of Restricted Stock Agreement under the 2007 Omnibus Incentive Plan (15)
|
|
10.27#
|
2007 Omnibus Incentive Plan, as amended (16)
|
|
10.28
|
Securities Purchase Agreement by and between the Company and Trailer Investments, LLC, dated July 17, 2009 (17)
|
69
|
10.29
|
Third Amended and Restated Loan and Security Agreement by and among the Company and certain of its subsidiaries identified on the signature page thereto, Bank of America, N.A., and the other lender parties thereto, dated July 17, 2009 (17)
|
|
10.30
|
Investor Rights Agreement by and between the Company and Trailer Investments, LLC dated August 3, 2009 (18)
|
|
10.31
|
Warrant to Purchase Shares of Common Stock issued August 3, 2009 (18)
|
|
10.32
|
Form of Indemnification Agreement with investor directors (18)
|
|
10.33
|
Consent and Amendment No. 1 to the Third Amended and Restated Loan and Security Agreement, by and among the Company and certain of its subsidiaries identified on the signature page thereto, Bank of America, N.A. , as a Lender and as Agent, as the other Lender parties thereto (19)
|
|
10.34
|
Consent and Waiver dated May 24, 2010 between the Company and Trailer Investments, Inc. (20)
|
|
10.35
|
Replacement Warrant to Purchase Shares of Common Stock issued on May 28, 2010 (21)
|
|
10.36
|
Amendment to Warrant to Purchase Shares of Common Stock issued on May 28, 2010 (22)
|
|
21.00
|
List of Significant Subsidiaries (24)
|
|
23.01
|
Consent of Ernst & Young LLP (24)
|
|
31.01
|
Certification of Principal Executive Officer (24)
|
|
31.02
|
Certification of Principal Financial Officer (24)
|
|
32.01
|
Written Statement of Chief Executive Officer and Chief Financial Officer Pursuant to Section 906 of the Sarbanes-Oxley Act of 2002 (18 U.S.C. Section 1350) (24)
|
|
#
|
Management contract or compensatory plan.
|
|
|
(1)
|
Incorporated by reference to the Registrant's Registration Statement on Form S-1 (No. 33-42810) or the Registrant’s Registration Statement on Form 8-A filed December 6, 1995 (item 3.02 and 4.02)
|
|
|
(2)
|
Incorporated by reference to the Registrant’s registration statement Form S-3 (Registration No. 333-27317) filed on May 16, 1997
|
|
|
(3)
|
Incorporated by reference to the Registrant’s Form 10-Q for the quarter ended March 31, 2001 (File No. 1-10883)
|
|
|
(4)
|
Incorporated by reference to the Registrant’s Form 10-Q for the quarter ended June 30, 2002 (File No. 1-10883)
|
|
|
(5)
|
Incorporated by reference to the Registrant’s Form 8-K filed on September 29, 2003 (File No. 1-10883)
|
|
|
(6)
|
Incorporated by reference to the Registrant’s Form 10-Q for the quarter ended June 30, 2004 (File No. 1-10883)
|
|
|
(7)
|
Incorporated by reference to the Registrant’s Form 10-Q for the quarter ended September 30, 2004 (File No. 1-10883)
|
|
|
(8)
|
Incorporated by reference to the Registrant’s Form 8-K filed on March 11, 2005 (File No. 1-10883)
|
|
|
(9)
|
Incorporated by reference to the Registrant’s Form 10-Q for the quarter ended March 31, 2005 (File No. 1-10883)
|
|
|
(10)
|
Incorporated by reference to the Registrant’s Form 8-K filed on December 28, 2005 (File No. 1-10883)
|
|
|
(11)
|
Incorporated by reference to the Registrant’s registration statement on Form 8-A12B filed on December 28, 2005 (File No. 1-10883)
|
|
|
(12)
|
Incorporated by reference to the Registrant’s Form 8-K filed on March 8, 2006 (File No. 1-10883)
|
|
|
(13)
|
Incorporated by reference to the Registrant’s Form 8-K filed on May 18, 2006 (File No. 1-10883)
|
|
|
(14)
|
Incorporated by reference to the Registrant’s Form 8-K filed on January 8, 2007 (File No. 1-10883)
|
|
|
(15)
|
Incorporated by reference to the Registrant’s Form 8-K filed on May 24, 2007 (File No. 1-10883)
|
|
|
(16)
|
Incorporated by reference to the Registrant’s Form 10-K for the year ended December 31, 2007 (File No. 1-10883)
|
|
|
(17)
|
Incorporated by reference to the Registrant’s Form 8-K filed on July 20, 2009 (File No. 1-10883)
|
|
|
(18)
|
Incorporated by reference to the Registrant’s Form 8-K filed on August 4, 2009 (File No. 1-10883)
|
|
|
(19)
|
Incorporated by reference to the Registrant’s Form 8-K filed on May 21, 2010 (File No. 1-10883)
|
|
|
(20)
|
Incorporated by reference to the Registrant’s Form 8-K filed on May 26, 2010 (File No. 1-10883)
|
|
|
(21)
|
Incorporated by reference to the Registrant’s Form 8-K filed on June 3, 2010 (File No. 1-10883)
|
|
|
(22)
|
Incorporated by reference to the Registrant’s Form 8-K filed on September 17, 2010 (File No. 1-10883)
|
|
|
(23)
|
Incorporated by reference to the Registrant’s Form 8-K filed on September 23, 2010 (File No. 1-10883)
|
|
|
(24)
|
Filed herewith
|
70
SIGNATURES
Pursuant to the requirements of Section 13 or 15(d) of the Securities Exchange Act of 1934, the registrant has duly caused this report to be signed on its behalf by the undersigned, thereunto duly authorized.
WABASH NATIONAL CORPORATION
|
February 25, 2011
|
By:
|
/s/ Mark J. Weber
|
|
Mark J. Weber
|
||
|
Senior Vice President and Chief Financial Officer
(Principal Financial Officer and Principal Accounting
Officer)
|
Pursuant to the requirements of the Securities Exchange Act of 1934, this report has been signed below by the following persons on behalf of the registrant in the capacities and on the date indicated.
|
Date
|
Signature and Title
|
||
|
February 25, 2011
|
By:
|
/s/ Richard J. Giromini
|
|
|
Richard J. Giromini
|
|||
|
President and Chief Executive Officer, Director
|
|||
|
(Principal Executive Officer)
|
|||
|
February 25, 2011
|
By:
|
/s/ Mark J. Weber
|
|
|
Mark J. Weber
|
|||
|
Senior Vice President and Chief Financial Officer
(Principal Financial Officer and Principal Accounting
Officer)
|
|||
|
February 25, 2011
|
By:
|
/s/ Martin C. Jischke
|
|
|
Dr. Martin C. Jischke
|
|||
|
Chairman of the Board of Directors
|
|||
|
February 25, 2011
|
By:
|
/s/ James D. Kelly
|
|
|
James D. Kelly
|
|||
|
Director
|
|||
|
February 25, 2011
|
By:
|
/s/ Larry J. Magee
|
|
|
Larry J. Magee
|
|||
|
Director
|
|||
|
February 25, 2011
|
By:
|
/s/ Scott K. Sorensen
|
|
|
Scott K. Sorensen
|
|||
|
Director
|
|||
|
February 25, 2011
|
By:
|
/s/ Ronald L. Stewart
|
|
|
Ronald L. Stewart
|
|||
|
Director
|
|||
71