Attached files
| file | filename |
|---|---|
| 8-K - 8-K - SHORE BANCSHARES INC | tv502821_8k.htm |
Exhibit 99.1

KBW 2017 COMMUNITY BANK SANDLER O’NEILL 2018 DC FIELD TRIP SEPTEMBER 12, 2018
Safe Harbor Regarding Forward - Looking Statements This presentation may contain “forward - looking statements” within the meaning of the Private Securities Litigation Reform Act of 1995 regarding Shore Bancshares, Inc. (the “Company”). Forward - looking statements often include the words “believes,” “expects,” “anticipates,” “estimates,” “forecasts,” “intends,” “plans,” “targets,” “potentially,” “probably,” “projects,” “outlook” or s imi lar expressions or future or conditional verbs such as “may,” “will,” “should,” “would” and “could.” These forward - looking statements are subjec t to known and unknown risks, uncertainties and other factors that could cause the actual results to differ materially from the fo rwa rd - looking statements, including, without limitation, the following: the strength of the United States economy in general and the streng th of the local economies in which the Company conducts operations; fluctuations in interest rates and in real estate values; monetary and fiscal policies of the Board of Governors of the Federal Reserve System and the U.S. Government and other governmental initiatives a ffe cting the financial services industry; the risks of lending and investing activities, including changes in the level and direction of loan delinquencies and write - offs and changes in estimates of the adequacy of the allowance for loan losses; the Company’s ability to access cost - effective funding; the timely development of and acceptance of the Bank’s new products and services and the perceived overa ll value of these products and services by users, including the features, pricing and quality compared to competitors’ products and services; expected cost savings, synergies and other benefits from the Company’s merger and acquisition activities might not be realize d w ithin the anticipated time frames or at all, and costs or difficulties relating to integration matters, including but not limited to cu sto mer and employee retention, might be greater than expected; fluctuations in real estate values and both residential and commercial re al estate market conditions; demand for loans and deposits in the Company’s market areas; legislative or regulatory changes that advers ely affect the Company’s business; results of examinations of the Company and its subsidiaries by their regulators, including the possib ili ty that such regulators may, among other things, take regulatory enforcement action or require the Company’s bank subsidiary to incre ase their reserves for loan losses or to write - down assets; the impact of technological changes; and the Company’s success at managing the risks involved in the foregoing. Any forward - looking statements are based upon management’s beliefs and assumptions at the time they a re made. The Company undertakes no obligation to publicly update or revise any forward - looking statements or to update the reasons why ac tual results could differ from those contained in such statements, whether as a result of new information, future events or otherw ise . In light of these risks, uncertainties and assumptions, the forward - looking statements discussed might not occur, and you should not put undue reliance on any forward - looking statements. Important Statements 2
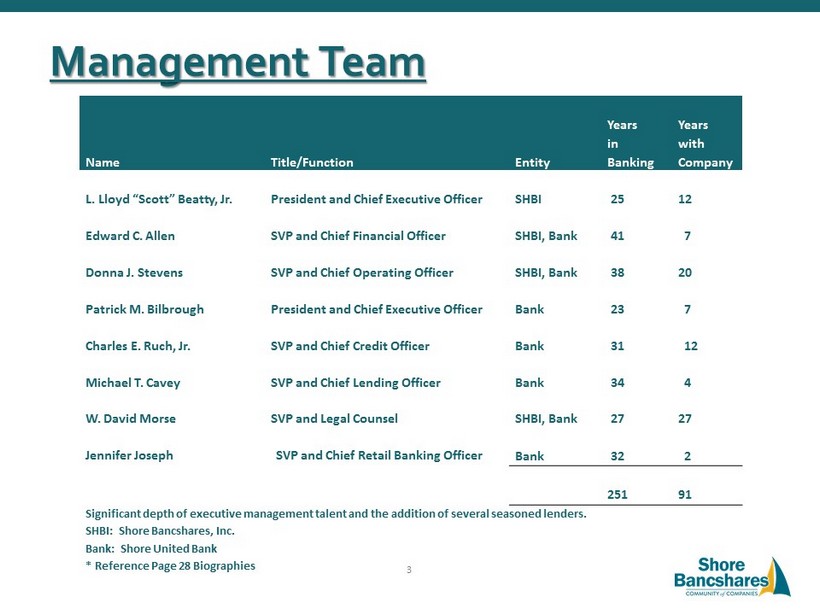
Management Team Name Title/Function Entity Years in Banking Years with Company L. Lloyd “Scott” Beatty, Jr. President and Chief Executive Officer SHBI 25 12 Edward C. Allen SVP and Chief Financial Officer SHBI, Bank 41 7 Donna J. Stevens SVP and Chief Operating Officer SHBI, Bank 38 20 Patrick M. Bilbrough President and Chief Executive Officer Bank 23 7 Charles E. Ruch, Jr. SVP and Chief Credit Officer Bank 31 12 Michael T. Cavey SVP and Chief Lending Officer Bank 34 4 W. David Morse SVP and Legal Counsel SHBI, Bank Bank 27 32 27 2 Jennifer Joseph SVP and Chief Retail Banking Officer 251 91 Significant depth of executive management talent and the addition of several seasoned lenders. SHBI: Shore Bancshares, Inc. Bank: Shore United Bank * Reference Page 28 Biographies 3
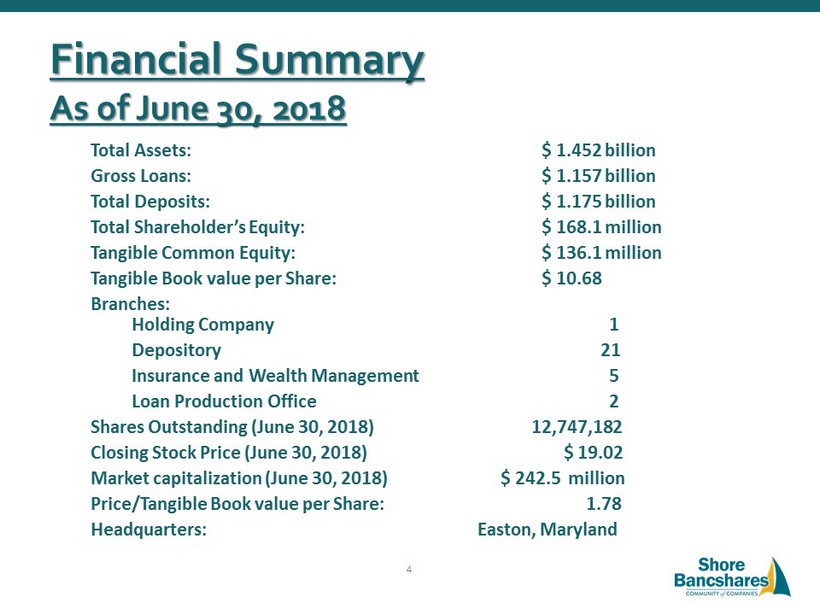
Financial Summary As of June 30, 2018 Total Assets: $ 1.452 billion Gross Loans: $ 1.157 billion Total Deposits: $ 1.175 billion Total Shareholder’s Equity: $ 168.1 million Tangible Common Equity: $ 136.1 million Tangible Book value per Share: $ 10.68 Branches: Holding Company 1 Depository 21 Insurance and Wealth Management 5 Loan Production Office 2 Shares Outstanding (June 30, 2018) 12,747,182 Closing Stock Price (June 30, 2018) $ 19.02 Market capitalization (June 30, 2018) $ 242.5 million Price/Tangible Book value per Share: 1.78 Headquarters: Easton, Maryland 4
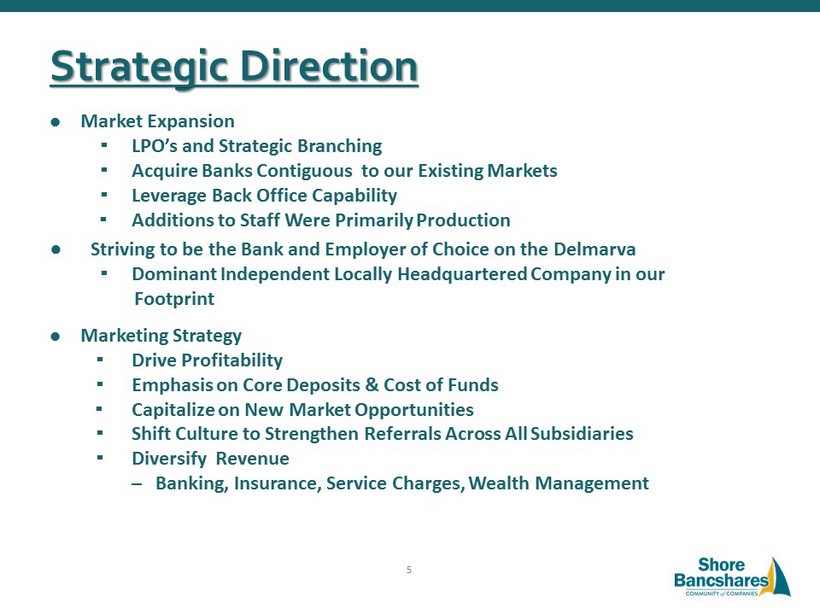
Strategic Direction; Market Expansion ▪ LPO’s and Strategic Branching ▪ Acquire Banks Contiguous to our Existing Markets ▪ Leverage Back Office Capability ▪ Additions to Staff Were Primarily Production ● Striving to be the Bank and Employer of Choice on the Delmarva ▪ Dominant Independent Locally Headquartered Company in our Footprint; Marketing Strategy ▪ Drive Profitability ▪ Emphasis on Core Deposits & Cost of Funds ▪ Capitalize on New Market Opportunities ▪ Shift Culture to Strengthen Referrals Across All Subsidiaries ▪ Diversify Revenue – Banking, Insurance, Service Charges, Wealth Management 5
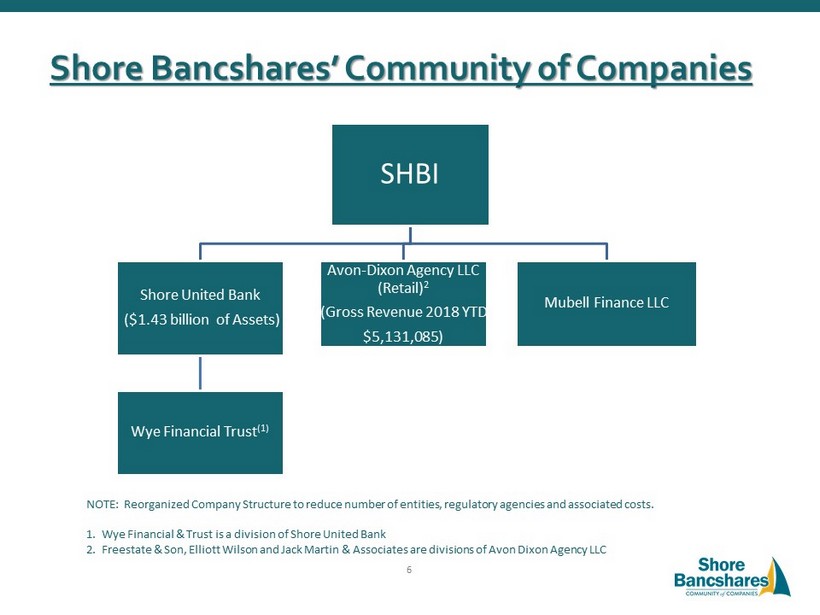
Shore Bancshares’ Community of Companies SHBI Shore United Bank ($1.43 billion of Assets) Wye Financial Trust (1) Avon - Dixon Agency LLC (Retail) 2 (Gross Revenue 2018 YTD $5,131,085) Mubell Finance LLC NOTE: Reorganized Company Structure to reduce number of entities, regulatory agencies and associated costs. 1. Wye Financial & Trust is a division of Shore United Bank 2. Freestate & Son, Elliott Wilson and Jack Martin & Associates are divisions of Avon Dixon Agency LLC 6
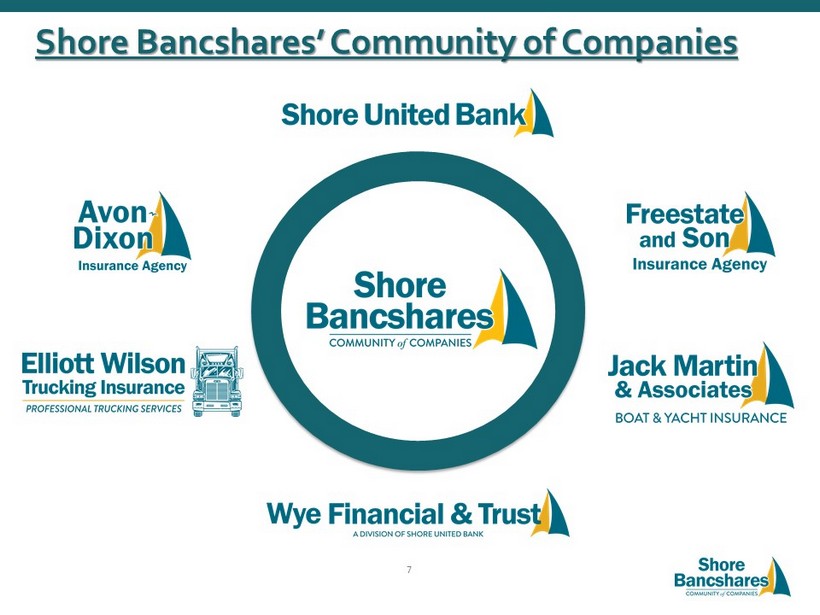
Shore Bancshares’ Community of Companies 7
8
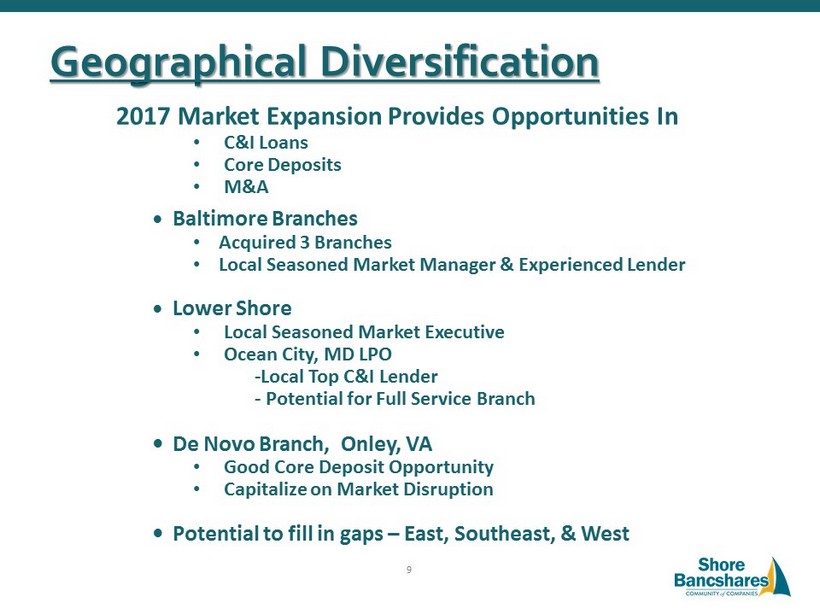
Geographical Diversification 2017 Market Expansion Provides Opportunities In • C&I Loans • Core Deposits • M&A • Baltimore Branches • Acquired 3 Branches • Local Seasoned Market Manager & Experienced Lender • Lower Shore • Local Seasoned Market Executive • Ocean City, MD LPO - Local Top C&I Lender - Potential for Full Service Branch • De Novo Branch, Onley, VA • Good Core Deposit Opportunity • Capitalize on Market Disruption • Potential to fill in gaps – East, Southeast, & West 9
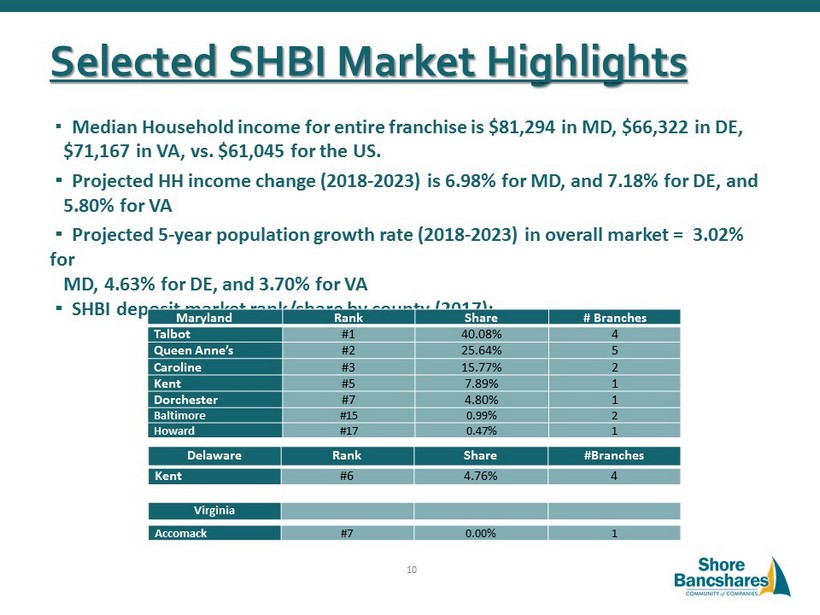
Selected SHBI Market Highlights ▪ Median Household income for entire franchise is $81,294 in MD, $66,322 in DE, $71,167 in VA, vs. $61,045 for the US. ▪ Projected HH income change (2018 - 2023) is 6.98% for MD, and 7.18% for DE, and 5.80% for VA ▪ Projected 5 - year population growth rate (2018 - 2023) in overall market = 3.02% for MD, 4.63% for DE, and 3.70% for VA ▪ SHBI deposit market rank/share by county (2017): Maryland Rank Share # Branches Talbot #1 40.08% 4 Queen Anne’s #2 25.64% 5 Caroline #3 15.77% 2 Kent #5 7.89% 1 Dorchester #7 4.80% 1 Baltimore #15 0.99% 2 Howard #17 0.47% 1 Delaware Rank Share #Branches Kent #6 4.76% 4 Virginia Accomack #7 0.00% 1 10
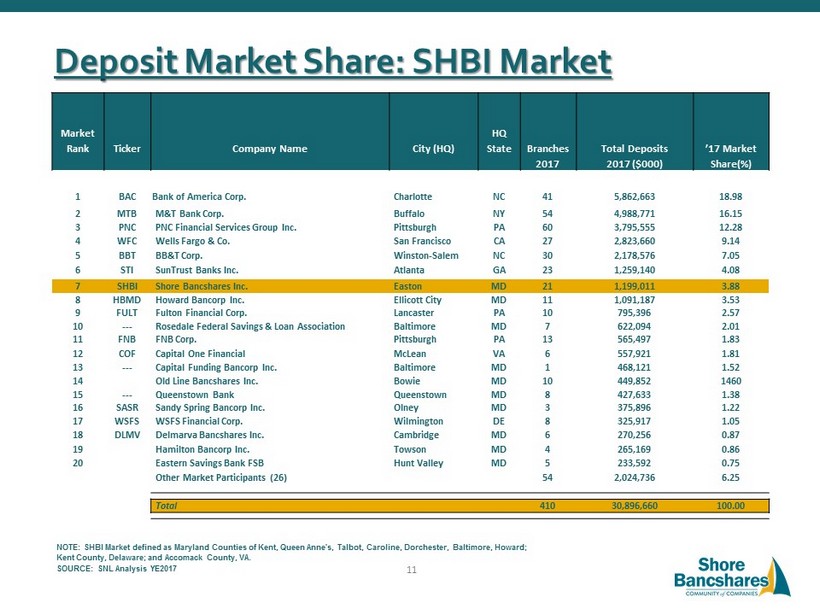
Deposit Market Share: SHBI Market Market Rank Ticker Company Name City (HQ) HQ State Branches 2017 Total Deposits 2017 ($000) ’17 Market Share(%) 1 BAC Bank of America Corp. Charlotte NC 41 5,862,663 18.98 2 MTB M&T Bank Corp. Buffalo NY 54 4,988,771 16.15 3 PNC PNC Financial Services Group Inc. Pittsburgh PA 60 3,795,555 12.28 4 WFC Wells Fargo & Co. San Francisco CA 27 2,823,660 9.14 5 BBT BB&T Corp. Winston - Salem NC 30 2,178,576 7.05 6 STI SunTrust Banks Inc. Atlanta GA 23 1,259,140 4.08 7 SHBI Shore Bancshares Inc. Easton MD 21 1,199,011 3.88 8 HBMD Howard Bancorp Inc. Ellicott City MD 11 1,091,187 3.53 9 FULT Fulton Financial Corp. Lancaster PA 10 795,396 2.57 10 --- Rosedale Federal Savings & Loan Association Baltimore MD 7 622,094 2.01 11 FNB FNB Corp. Pittsburgh PA 13 565,497 1.83 12 COF Capital One Financial McLean VA 6 557,921 1.81 13 --- Capital Funding Bancorp Inc. Baltimore MD 1 468,121 1.52 14 Old Line Bancshares Inc. Bowie MD 10 449,852 1460 15 --- Queenstown Bank Queenstown MD 8 427,633 1.38 16 SASR Sandy Spring Bancorp Inc. Olney MD 3 375,896 1.22 17 WSFS WSFS Financial Corp. Wilmington DE 8 325,917 1.05 18 DLMV Delmarva Bancshares Inc. Cambridge MD 6 270,256 0.87 19 Hamilton Bancorp Inc. Towson MD 4 265,169 0.86 20 Eastern Savings Bank FSB Hunt Valley MD 5 233,592 0.75 Other Market Participants (26) 54 2,024,736 6.25 Total 410 30,896,660 100.00 NOTE: SHBI Market defined as Maryland Counties of Kent, Queen Anne's, Talbot, Caroline, Dorchester, Baltimore, Howard; Kent County, Delaware; and Accomack County, VA. SOURCE: SNL Analysis YE2017 11
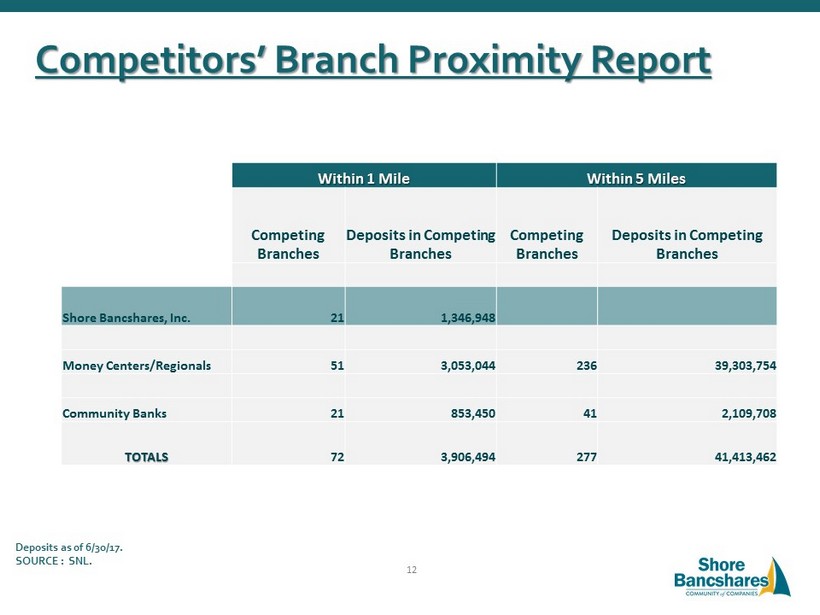
Competitors’ Branch Proximity Report Within 1 Mile Within 5 Miles Competing Branches Deposits in Competing Branches Competing Branches Deposits in Competing Branches Shore Bancshares, Inc. 21 1,346,948 Money Centers/Regionals 51 3,053,044 236 39,303,754 Community Banks 21 853,450 41 2,109,708 TOTALS 72 3,906,494 277 41,413,462 Deposits as of 6/30/17. SOURCE : SNL. 12
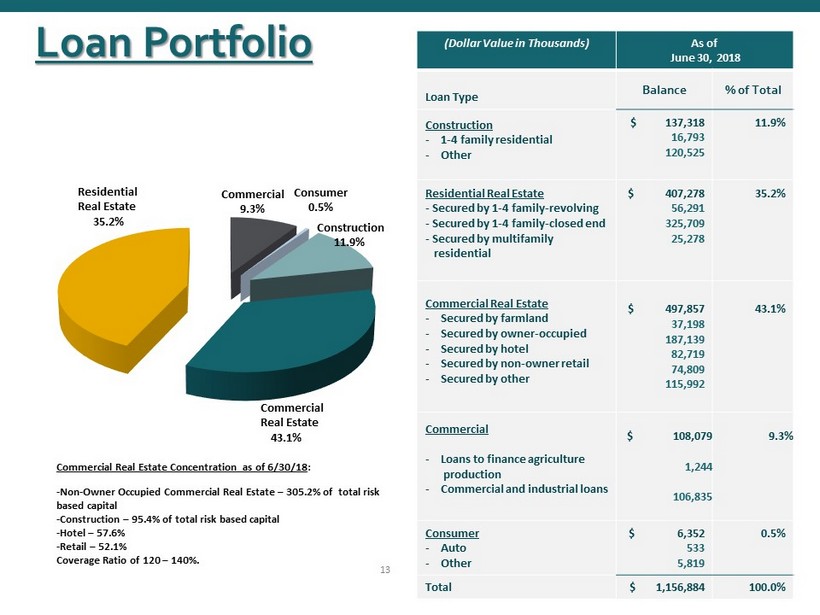
Loan Portfolio (Dollar Value in Thousands) As of June 30, 2018 Loan Type Balance % of Total Construction - 1 - 4 family residential - Other $ 137,318 16,793 120,525 11.9% Residential Real Estate - Secured by 1 - 4 family - revolving - Secured by 1 - 4 family - closed end - Secured by multifamily residential $ 407,278 56,291 325,709 25,278 35.2% Commercial Real Estate - Secured by farmland - Secured by owner - occupied - Secured by hotel - Secured by non - owner retail - Secured by other $ 497,857 37,198 187,139 82,719 74,809 115,992 43.1% Commercial - Loans to finance agriculture production - Commercial and industrial loans $ 108,079 1,244 106,835 9.3% Consumer - Auto - Other $ 6,352 533 5,819 0.5% Total $ 1,156,884 100.0% Residential Real Estate 35.2% Commercial 9.3% Consumer 0.5% Construction 11.9% Commercial Real Estate 43.1% Commercial Real Estate Concentration as of 6/30/18 : - Non - Owner Occupied Commercial Real Estate – 305.2% of total risk based capital - Construction – 95.4% of total risk based capital - Hotel – 57.6% - Retail – 52.1% Coverage Ratio of 120 – 140%. 13
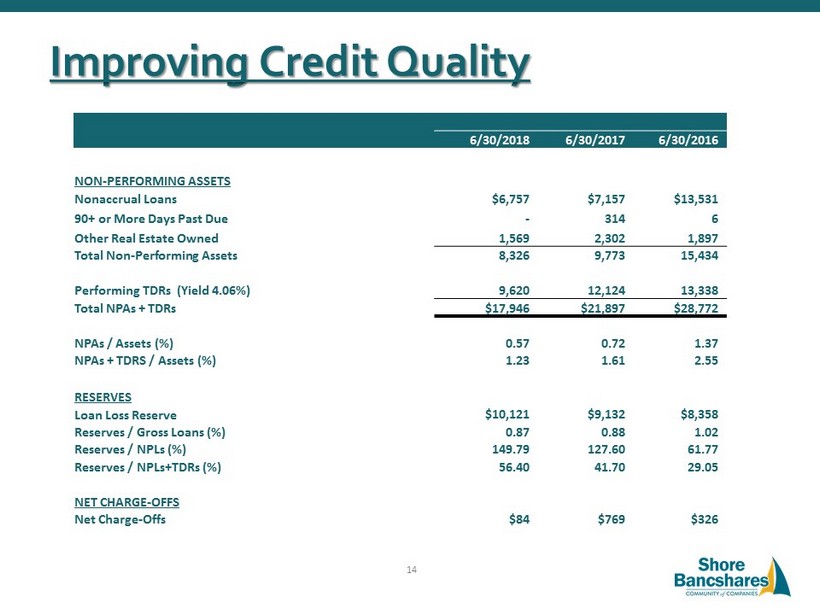
Improving Credit Quality 6/30/2018 6/30/2017 6/30/2016 NON - PERFORMING ASSETS Nonaccrual Loans $6,757 $7,157 $13,531 90+ or More Days Past Due - 314 6 Other Real Estate Owned 1,569 2,302 1,897 Total Non - Performing Assets 8,326 9,773 15,434 Performing TDRs (Yield 4.06%) 9,620 12,124 13,338 Total NPAs + TDRs $17,946 $21,897 $28,772 NPAs / Assets (%) 0.57 0.72 1.37 NPAs + TDRS / Assets (%) 1.23 1.61 2.55 RESERVES Loan Loss Reserve $10,121 $9,132 $8,358 Reserves / Gross Loans (%) 0.87 0.88 1.02 Reserves / NPLs (%) 149.79 127.60 61.77 Reserves / NPLs+TDRs (%) 56.40 41.70 29.05 NET CHARGE - OFFS Net Charge - Offs $84 $769 $326 14
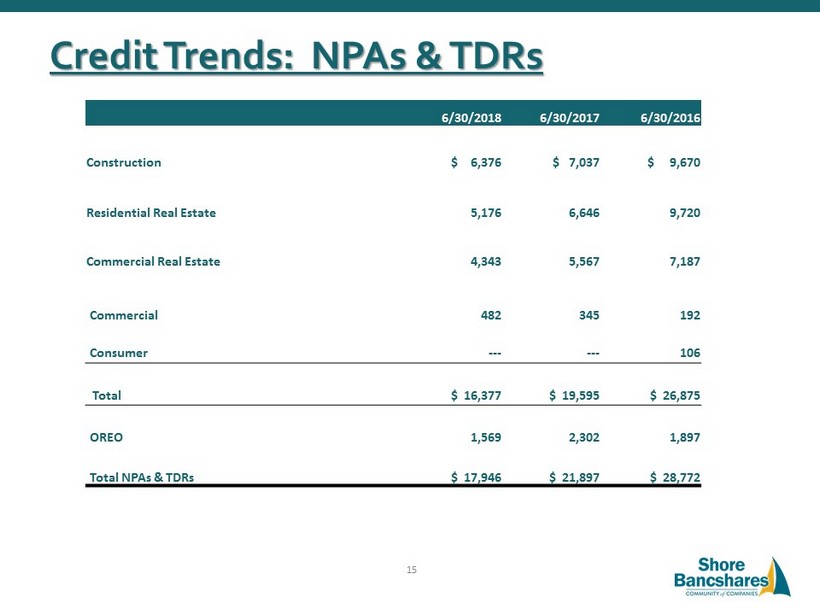
Credit Trends: NPAs & TDRs 6/30/2018 6/30/2017 6/30/2016 Construction $ 6,376 $ 7,037 $ 9,670 Residential Real Estate 5,176 6,646 9,720 Commercial Real Estate 4,343 5,567 7,187 Commercial 482 345 192 Consumer --- --- 106 Total $ 16,377 $ 19,595 $ 26,875 OREO 1,569 2,302 1,897 Total NPAs & TDRs $ 17,946 $ 21,897 $ 28,772 15
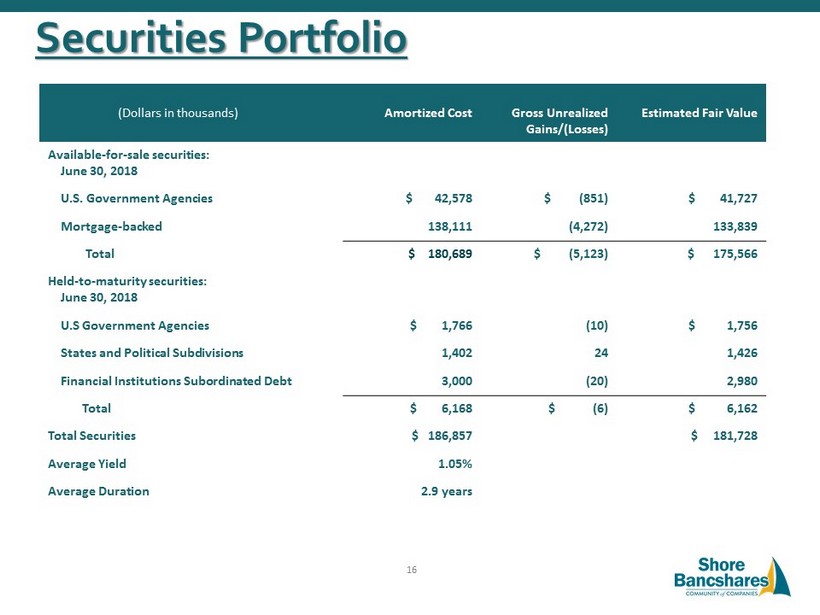
Securities Portfolio (Dollars in thousands) Amortized Cost G Gross Unrealized Gains/(Losses) E Estimated Fair Value Available - for - sale securities: June 30, 2018 U.S. Government Agencies $ 42,578 $ (851) $ 41,727 Mortgage - backed 138,111 (4,272) 133,839 Total $ 180,689 $ (5,123) $ 175,566 Held - to - maturity securities: June 30, 2018 U.S Government Agencies $ 1,766 (10) $ 1,756 States and Political Subdivisions 1,402 24 1,426 Financial Institutions Subordinated Debt 3,000 (20) 2,980 Total $ 6,168 $ (6) $ 6,162 Total Securities $ 186,857 $ 181,728 Average Yield 1.05% Average Duration 2.9 years 16
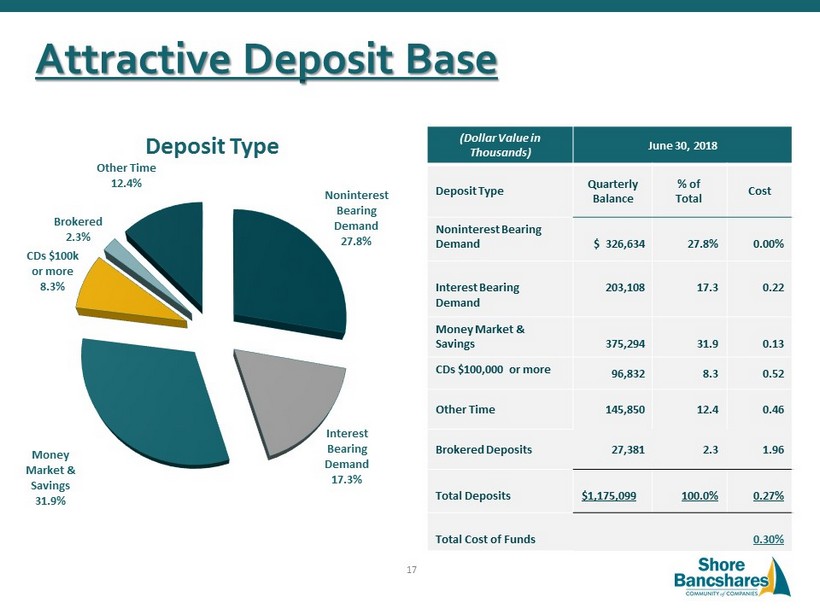
Attractive Deposit Base (Dollar Value in Thousands) June 30, 2018 Deposit Type Quarterly Balance % of Total Cost Noninterest Bearing Demand $ 326,634 27.8% 0.00% Interest Bearing Demand 203,108 17.3 0.22 Money Market & Savings 375,294 31.9 0.13 CDs $100,000 or more 96,832 8.3 0.52 Other Time 145,850 12.4 0.46 Brokered Deposits 27,381 2.3 1.96 Total Deposits $1,175,099 100.0% 0.27% Total Cost of Funds 0.30% Noninterest Bearing Demand 27.8% Interest Bearing Demand 17.3% Money Market & Savings 31.9% CDs $100k or more 8.3% Brokered 2.3% Other Time 12.4% Deposit Type 17
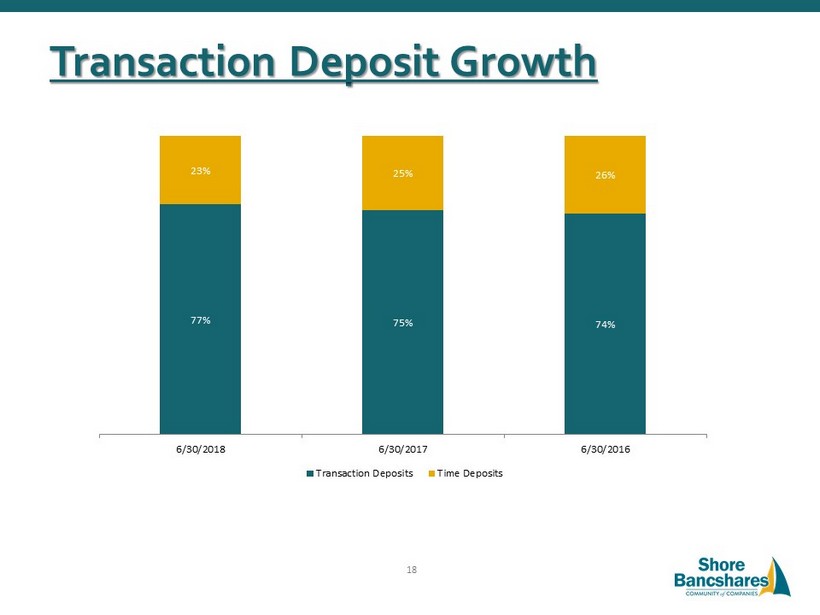
Transaction Deposit Growth 77% 75% 74% 23% 25% 26% 6/30/2018 6/30/2017 6/30/2016 Transaction Deposits Time Deposits 18
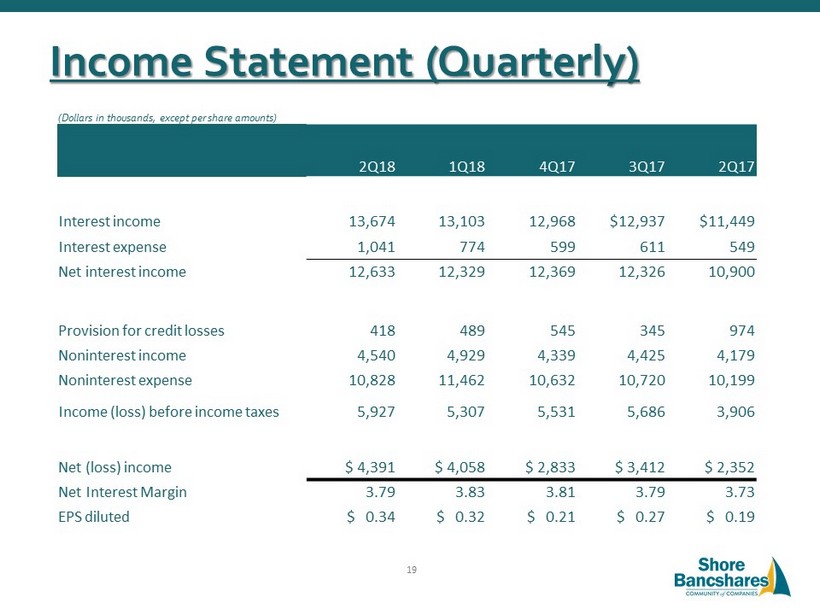
Income Statement (Quarterly) (Dollars in thousands, except per share amounts) 2Q18 1Q18 4Q17 3Q17 2Q17 Interest income 13,674 13,103 12,968 $12,937 $11,449 Interest expense 1,041 774 599 611 549 Net interest income 12,633 12,329 12,369 12,326 10,900 Provision for credit losses 418 489 545 345 974 Noninterest income 4,540 4,929 4,339 4,425 4,179 Noninterest expense 10,828 11,462 10,632 10,720 10,199 Income (loss) before income taxes 5,927 5,307 5,531 5,686 3,906 Net (loss) income $ 4,391 $ 4,058 $ 2,833 $ 3,412 $ 2,352 Net Interest Margin 3.79 3.83 3.81 3.79 3.73 EPS diluted $ 0.34 $ 0.32 $ 0.21 $ 0.27 $ 0.19 19
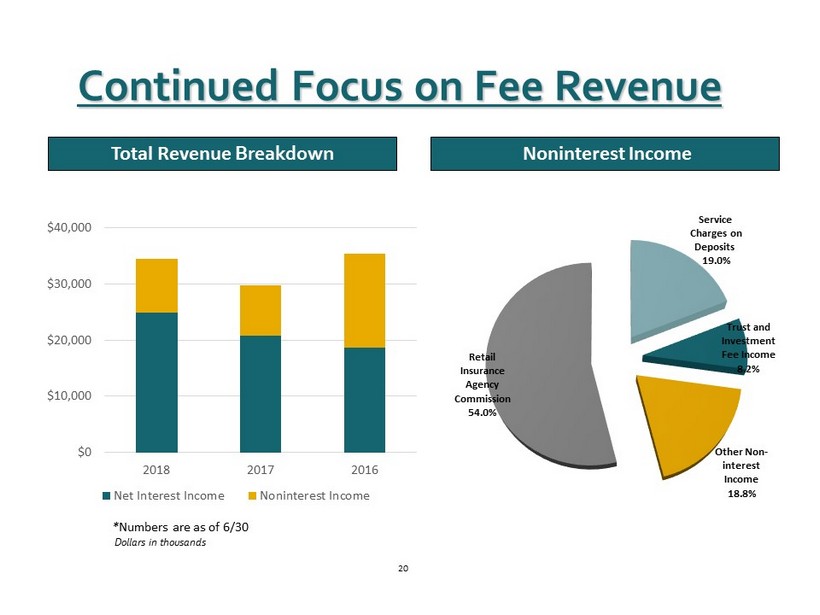
Continued Focus on Fee Revenue Total Revenue Breakdown Noninterest Income * Numbers are as of 6/30 Dollars in thousands 24% 25% 26% 34% 32% 31% Trust and Investment Fee Income 8.2% Other Non - interest Income 18.8% Retail Insurance Agency Commission 54.0% Service Charges on Deposits 19.0% 20 $0 $10,000 $20,000 $30,000 $40,000 2018 2017 2016 Net Interest Income Noninterest Income
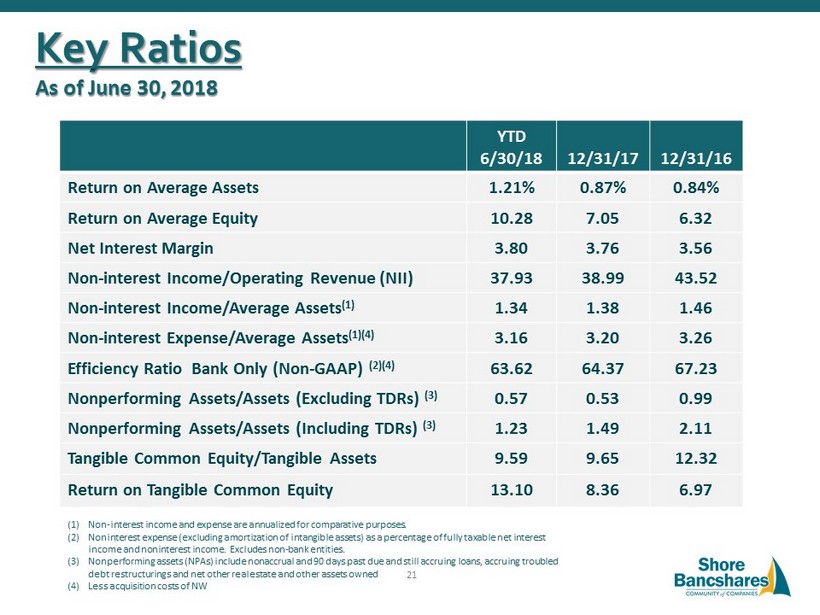
YTD 6/30/18 12/31/17 12/31/16 Return on Average Assets 1.21% 0.87% 0.84% Return on Average Equity 10.28 7.05 6.32 Net Interest Margin 3.80 3.76 3.56 Non - interest Income/Operating Revenue (NII) 37.93 38.99 43.52 Non - interest Income/Average Assets (1) 1.34 1.38 1.46 Non - interest Expense/Average Assets (1)(4) 3.16 3.20 3.26 Efficiency Ratio Bank Only (Non - GAAP) (2)(4) 63.62 64.37 67.23 Nonperforming Assets/Assets (Excluding TDRs) (3) 0.57 0.53 0.99 Nonperforming Assets/Assets (Including TDRs) (3) 1.23 1.49 2.11 Tangible Common Equity/ Tangible Assets 9.59 9.65 12.32 Return on Tangible Common Equity 13.10 8.36 6.97 Key Ratios As of June 30, 2018 (1) Non - interest income and expense are annualized for comparative purposes. (2) Noninterest expense (excluding amortization of intangible assets) as a percentage of fully taxable net interest income and noninterest income. Excludes non - bank entities. (3) Nonperforming assets (NPAs) include nonaccrual and 90 days past due and still accruing loans, accruing troubled debt restructurings and net other real estate and other assets owned (4) Less acquisition costs of NW 21
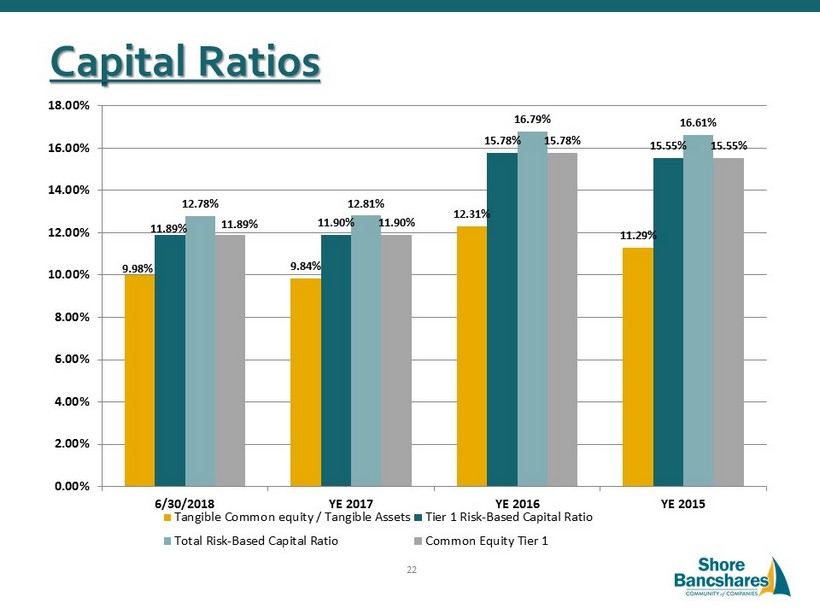
Capital Ratios 9.98% 9.84% 12.31% 11.29% 11.89% 11.90% 15.78% 15.55% 12.78% 12.81% 16.79% 16.61% 11.89% 11.90% 15.78% 15.55% 0.00% 2.00% 4.00% 6.00% 8.00% 10.00% 12.00% 14.00% 16.00% 18.00% 6/30/2018 YE 2017 YE 2016 YE 2015 Tangible Common equity / Tangible Assets Tier 1 Risk-Based Capital Ratio Total Risk-Based Capital Ratio Common Equity Tier 1 22
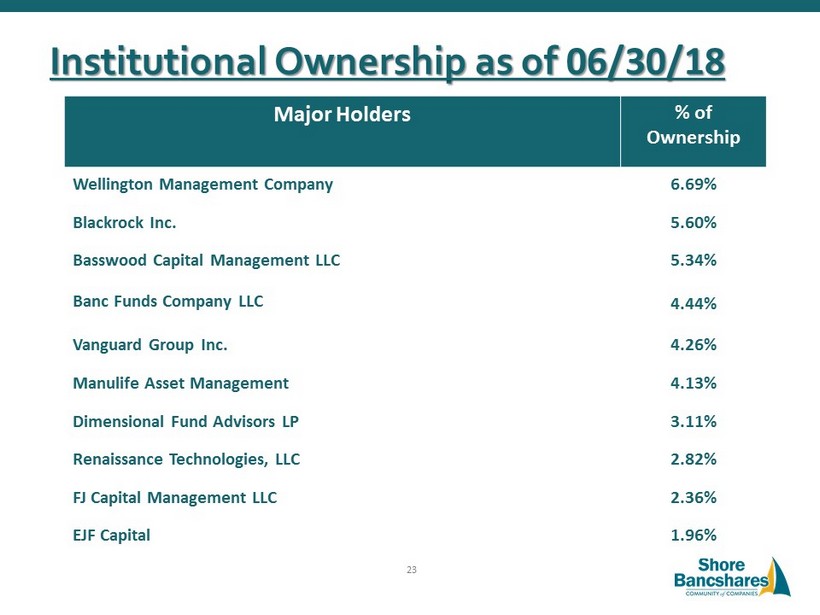
Institutional Ownership as of 06/30/18 Major Holders % of Ownership Wellington Management Company 6.69% Blackrock Inc. 5.60% Basswood Capital Management LLC Banc Funds Company LLC 5.34% 4.44% Vanguard Group Inc. 4.26% Manulife Asset Management 4.13% Dimensional Fund Advisors LP 3.11% Renaissance Technologies, LLC 2.82% FJ Capital Management LLC 2.36% EJF Capital 1.96% 23
• Exceptional Cost of Funds • Strategic plan positioned for organic growth and acquisitions • Focused on creating sustainable competitive advantages • Strengthened noninterest revenue sources • Driving a sales culture with both a commercial and retail focus while maintaining our credit discipline Compelling Investment Considerations 24
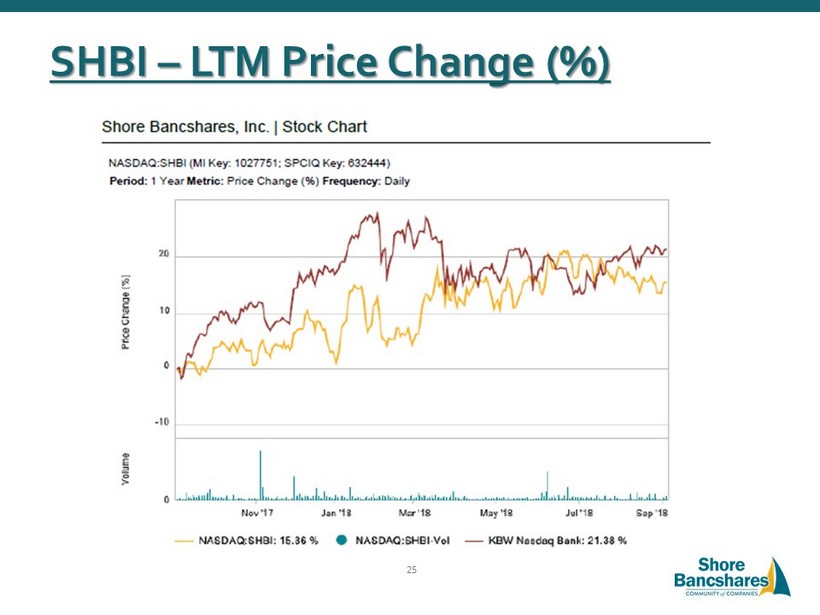
SHBI – LTM Price Change (%) 25
Peer Group Definition Publically traded banking companies in MD, DC, VA, DE with total assets between $750M - $2B. 26
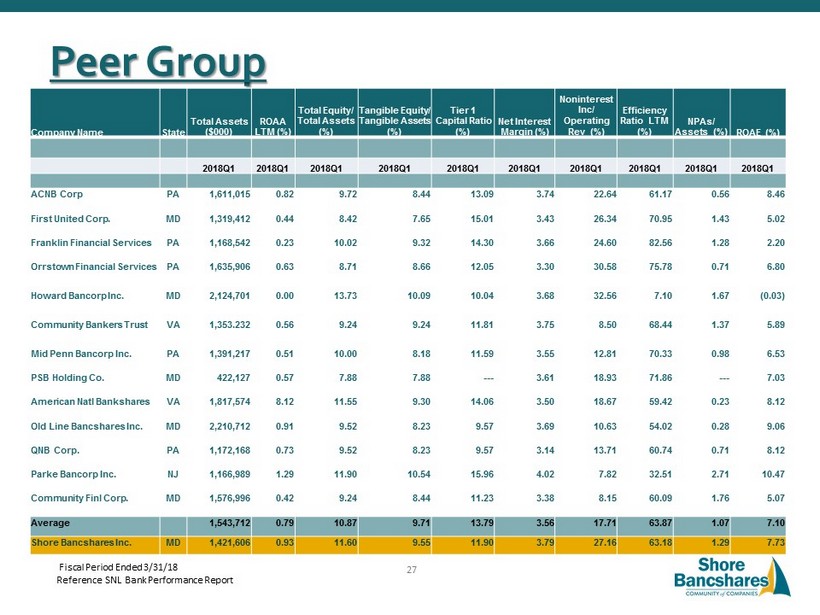
Peer Group Company Name State Total Assets ($000) ROAA LTM (%) Total Equity/ Total Assets (%) Tangible Equity/ Tangible Assets (%) Tier 1 Capital Ratio (%) Net Interest Margin (%) Noninterest Inc/ Operating Rev (%) Efficiency Ratio LTM (%) NPAs/ Assets (%) ROAE (%) 2018Q1 2018Q1 2018Q1 2018Q1 2018Q1 2018Q1 2018Q1 2018Q1 2018Q1 2018Q1 ACNB Corp PA 1,611,015 0.82 9.72 8.44 13.09 3.74 22.64 61.17 0.56 8.46 First United Corp. MD 1,319,412 0.44 8.42 7.65 15.01 3.43 26.34 70.95 1.43 5.02 Franklin Financial Services PA 1,168,542 0.23 10.02 9.32 14.30 3.66 24.60 82.56 1.28 2.20 Orrstown Financial Services PA 1,635,906 0.63 8.71 8.66 12.05 3.30 30.58 75.78 0.71 6.80 Howard Bancorp Inc. MD 2,124,701 0.00 13.73 10.09 10.04 3.68 32.56 7.10 1.67 (0.03) Community Bankers Trust VA 1,353.232 0.56 9.24 9.24 11.81 3.75 8.50 68.44 1.37 5.89 Mid Penn Bancorp Inc. PA 1,391,217 0.51 10.00 8.18 11.59 3.55 12.81 70.33 0.98 6.53 PSB Holding Co. MD 422,127 0.57 7.88 7.88 --- 3.61 18.93 71.86 --- 7.03 American Natl Bankshares VA 1,817,574 8.12 11.55 9.30 14.06 3.50 18.67 59.42 0.23 8.12 Old Line Bancshares Inc. MD 2,210,712 0.91 9.52 8.23 9.57 3.69 10.63 54.02 0.28 9.06 QNB Corp. PA 1,172,168 0.73 9.52 8.23 9.57 3.14 13.71 60.74 0.71 8.12 Parke Bancorp Inc. NJ 1,166,989 1.29 11.90 10.54 15.96 4.02 7.82 32.51 2.71 10.47 Community Finl Corp. MD 1,576,996 0.42 9.24 8.44 11.23 3.38 8.15 60.09 1.76 5.07 Average 1,543,712 0.79 10.87 9.71 13.79 3.56 17.71 63.87 1.07 7.10 Shore Bancshares Inc. MD 1,421,606 0.93 11.60 9.55 11.90 3.79 27.16 63.18 1.29 7.73 Fiscal Period Ended 3/31/18 Reference SNL Bank Performance Report 27
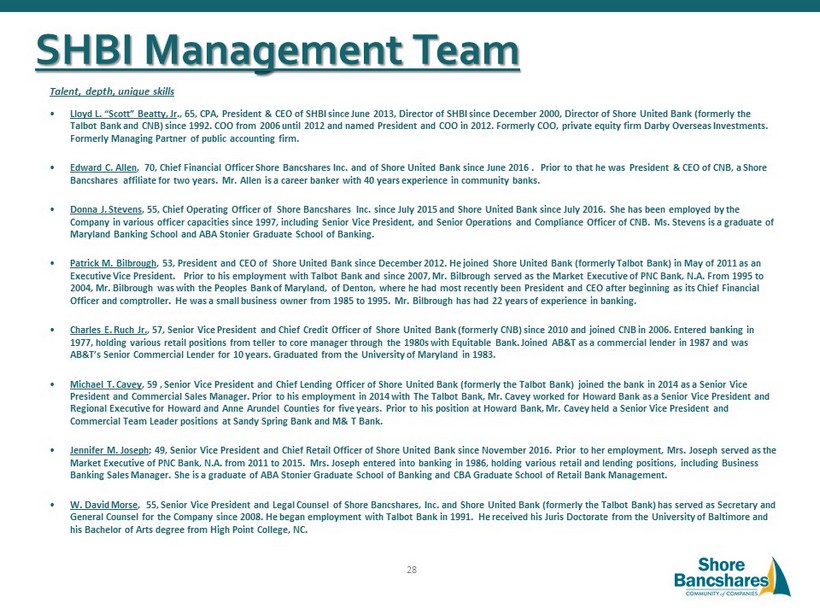
Talent, depth, unique skills • Lloyd L. “Scott” Beatty, Jr ., 65, CPA, President & CEO of SHBI since June 2013, Director of SHBI since December 2000, Director of Shore United Bank (for mer ly the Talbot Bank and CNB) since 1992. COO from 2006 until 2012 and named President and COO in 2012. Formerly COO, private equity f irm Darby Overseas Investments. Formerly Managing Partner of public accounting firm. • Edward C. Allen , 70, Chief Financial Officer Shore Bancshares Inc. and of Shore United Bank since June 2016 . Prior to that he was Presi den t & CEO of CNB, a Shore Bancshares affiliate for two years. Mr. Allen is a career banker with 40 years experience in community banks. • Donna J. Stevens , 55, Chief Operating Officer of Shore Bancshares Inc. since July 2015 and Shore United Bank since July 2016. She has been em ployed by the Company in various officer capacities since 1997, including Senior Vice President, and Senior Operations and Compliance Offic er of CNB. Ms. Stevens is a graduate of Maryland Banking School and ABA Stonier Graduate School of Banking. • Patrick M. Bilbrough , 53, President and CEO of Shore United Bank since December 2012. He joined Shore United Bank (formerly Talbot Bank) in May of 2011 as an Executive Vice President. Prior to his employment with Talbot Bank and since 2007, Mr. Bilbrough served as the Market Execu tiv e of PNC Bank, N.A. From 1995 to 2004, Mr. Bilbrough was with the Peoples Bank of Maryland, of Denton, where he had most recently been President and CEO after be ginning as its Chief Financial Officer and comptroller. He was a small business owner from 1985 to 1995. Mr. Bilbrough has had 22 years of experience in ba nki ng. • Charles E. Ruch Jr. , 57, Senior Vice President and Chief Credit Officer of Shore United Bank (formerly CNB) since 2010 and joined CNB in 2006. Ent ered banking in 1977, holding various retail positions from teller to core manager through the 1980s with Equitable Bank. Joined AB&T as a co mme rcial lender in 1987 and was AB&T’s Senior Commercial Lender for 10 years. Graduated from the University of Maryland in 1983. • Michael T. Cavey , 59 , Senior Vice President and Chief Lending Officer of Shore United Bank (formerly the Talbot Bank) joined the bank in 20 14 as a Senior Vice President and Commercial Sales Manager. Prior to his employment in 2014 with The Talbot Bank, Mr. Cavey worked for Howard Ban k a s a Senior Vice President and Regional Executive for Howard and Anne Arundel Counties for five years. Prior to his position at Howard Bank, Mr. Cavey held a Senior Vice President and Commercial Team Leader positions at Sandy Spring Bank and M& T Bank. • Jennifer M. Joseph ; 49, Senior Vice President and Chief Retail Officer of Shore United Bank since November 2016. Prior to her employment, Mrs. Jo seph served as the Market Executive of PNC Bank, N.A. from 2011 to 2015. Mrs. Joseph entered into banking in 1986, holding various retail and lend ing positions, including Business Banking Sales Manager. She is a graduate of ABA Stonier Graduate School of Banking and CBA Graduate School of Retail Bank Man age ment. • W. David Morse , 55, Senior Vice President and Legal Counsel of Shore Bancshares, Inc. and Shore United Bank (formerly the Talbot Bank) has se rved as Secretary and General Counsel for the Company since 2008. He began employment with Talbot Bank in 1991. He received his Juris Doctorate fr om the University of Baltimore and his Bachelor of Arts degree from High Point College, NC. SHBI Management Team 28