Attached files
| file | filename |
|---|---|
| 8-K - BENCHMARK CONFERENCE 8-K - MEREDITH CORP | benchmarkirpresentation8-k.htm |
General IR Presentation September 2018
FORWARD-LOOKING STATEMENTS This presentation contains certain forward-looking statements that are subject to risks and uncertainties. These statements are based on management’s current knowledge and estimates of factors affecting the Company and its operations. Statements in this presentation that are forward-looking include, but are not limited to, the expected benefits of the acquisition of Time Inc., including the expected synergies from the transaction and the combined company’s prospects for growth and increasing shareholder value. Actual results may differ materially from those currently anticipated. Factors that could adversely affect future results include, but are not limited to, downturns in national and/or local economies; a softening of the domestic advertising market; world, national or local events that could disrupt broadcast television; increased consolidation among major advertisers or other events depressing the level of advertising spending; the unexpected loss or insolvency of one or more major clients or vendors; the integration of acquired businesses; changes in consumer reading, purchasing and/or television viewing patterns; increases in paper, postage, printing, syndicated programming or other costs; changes in television network affiliation agreements; technological developments affecting products or methods of distribution; changes in government regulations affecting the Company’s industries; increases in interest rates; the consequences of acquisitions and/or dispositions; the risks associated with the Company’s recent acquisition of Time Inc., including: (1) litigation challenging the acquisition; (2) the Company’s ability to retain key personnel; (3) competitive responses to the acquisition; (4) unexpected costs, charges or expenses resulting from the acquisition; (5) adverse reactions or changes to business relationships resulting from the acquisition; (6) the Company’s ability to realize the benefits of the acquisition of Time Inc.; (7) delays, challenges and expenses associated with integrating the businesses; and (8) the Company’s ability to comply with the terms of the debt and equity financings entered into in connection with the acquisition; and the risk factors contained in the Company’s most recent Form 10-K and Form 10-Q filed with the Securities and Exchange Commission, which are available on the SEC’s website at www.sec.gov. The Company undertakes no obligation to update any forward- looking statement, whether as a result of new information, future events or otherwise. 2
TODAY’S AGENDA ❖Meredith Overview ❖Go-Forward Strategy ❖Total Shareholder Return ❖Q&A 3

THE NEW MEREDITH > Unparalleled portfolio of iconic, trusted brands, reaching 175 million Americans across channels — digital and print to social and TV > Engaging, inspiring and activating 110 million U.S. adult women including 80% of all millennial women and 65% of all Latinas > Readership of 120 million and paid subscriptions of more than 40 million > Top digital company with 140 million unique visitors, 9 billion video views annually and 265 million social followers > Strong, highly-profitable local TV portfolio with 11% U.S. reach > Data powerhouse with 175 million direct consumer relationships > World’s second-largest brand licensor 4
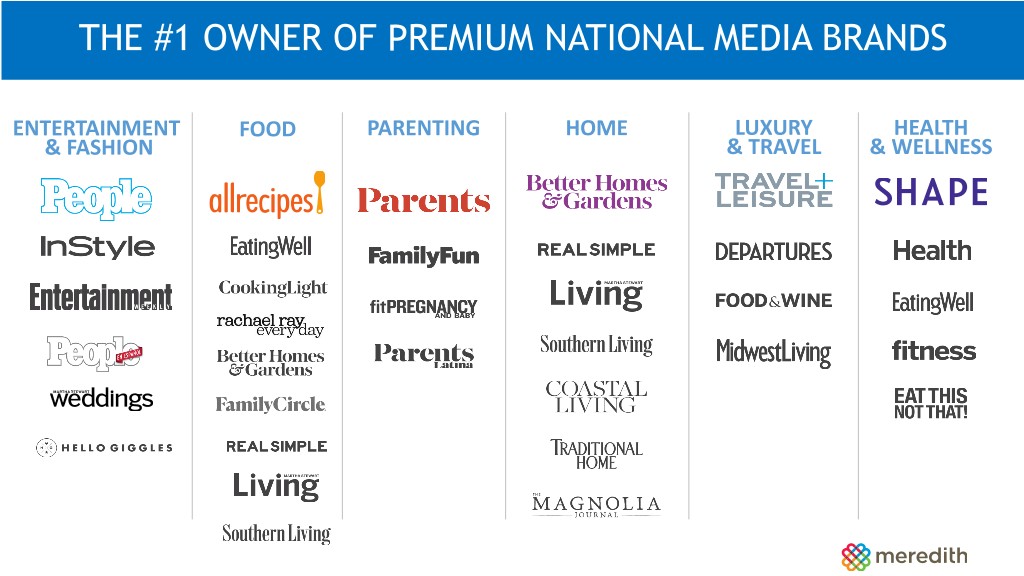
THE #1 OWNER OF PREMIUM NATIONAL MEDIA BRANDS ENTERTAINMENT FOOD PARENTING HOME LUXURY HEALTH & FASHION & TRAVEL & WELLNESS

PEOPLE: THE WORLD’S #1 ENTERTAINMENT BRAND PRINT DIGITAL PLATFORMS MOBILE SOCIAL VIDEO 40 MILLION 80 MILLION 45 MILLION 35 MILLION 375 MILLION READERS MONTHLY UNIQUE VISITORS MONTHLY UNIQUE VISITORS SOCIAL FOLLOWERS TOTAL VIDEO VIEWS IN 2017 +7% +50% YOY +58% YOY +18% YOY +34% YOY 6

TOP DIGITAL MEDIA COMPANY +140 million U.S. monthly unique visitors Unique Visitors in the U.S. • #1 network for women and millennials Company Dec-17 1 Google Sites 245.5 • Depth and scale across all key content and ad categories, including lifestyle and food 2 Oath 216.1 3 Facebook 210.1 • Achieve video scale with more than 9 billion annual views 4 Microsoft Sites 202.7 • First party data drives unique/actionable insights/analytics 5 Amazon Sites 197.3 6 Comcast NBCUniversal 163.0 Diversified digital advertising revenue streams 7 CBS Interactive 153.8 8 Twitter 151.3 Unparalleled suite of brands 9 Apple 148.8 10 Meredith 140.0 Proprietary advertising technology delivering 10 PayPal 140.0 strong results 12 Turner Digital 138.4 13 Snapchat 131.9 14 Wikimedia 127.7 15 Wal-Mart 127.2 #’s in millions. 7 Source: comScore Dec. 2017.
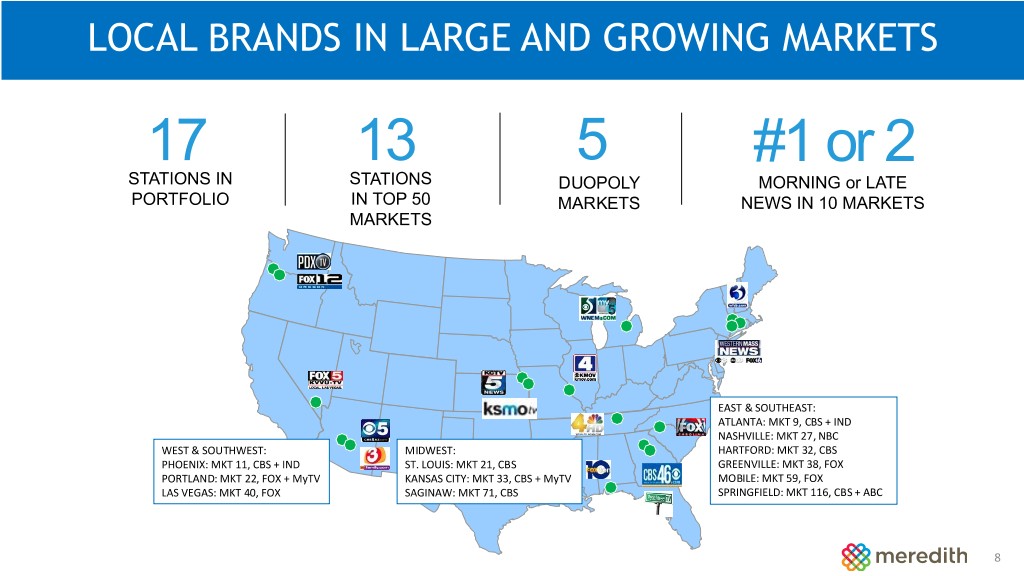
LOCAL BRANDS IN LARGE AND GROWING MARKETS 17 13 5 #1 or 2 STATIONS IN STATIONS DUOPOLY MORNING or LATE PORTFOLIO IN TOP 50 MARKETS NEWS IN 10 MARKETS MARKETS EAST & SOUTHEAST: ATLANTA: MKT 9, CBS + IND NASHVILLE: MKT 27, NBC WEST & SOUTHWEST: MIDWEST: HARTFORD: MKT 32, CBS PHOENIX: MKT 11, CBS + IND ST. LOUIS: MKT 21, CBS GREENVILLE: MKT 38, FOX PORTLAND: MKT 22, FOX + MyTV KANSAS CITY: MKT 33, CBS + MyTV MOBILE: MKT 59, FOX LAS VEGAS: MKT 40, FOX SAGINAW: MKT 71, CBS SPRINGFIELD: MKT 116, CBS + ABC 8

TODAY’S AGENDA ❖Meredith Overview ❖Go-Forward Strategy ❖Total Shareholder Return ❖Q&A 9

MEREDITH GO-FORWARD STRATEGY Successfully integrate Time Inc. acquisition by: 1 • Improving the advertising performance of acquired properties to at least industry norms • Aggressively growing revenue and raising profit margins on acquired digital properties to MDP’s levels • Completing the divestiture process of media assets not core to our business • Fully realizing annual cost synergies that exceed $500 million in the first two full years of operations Grow non-advertising revenue streams, including 2 circulation, brand licensing and e-commerce Continue to maximize Meredith’s Local Media Group 3 and pursue portfolio expansion 10
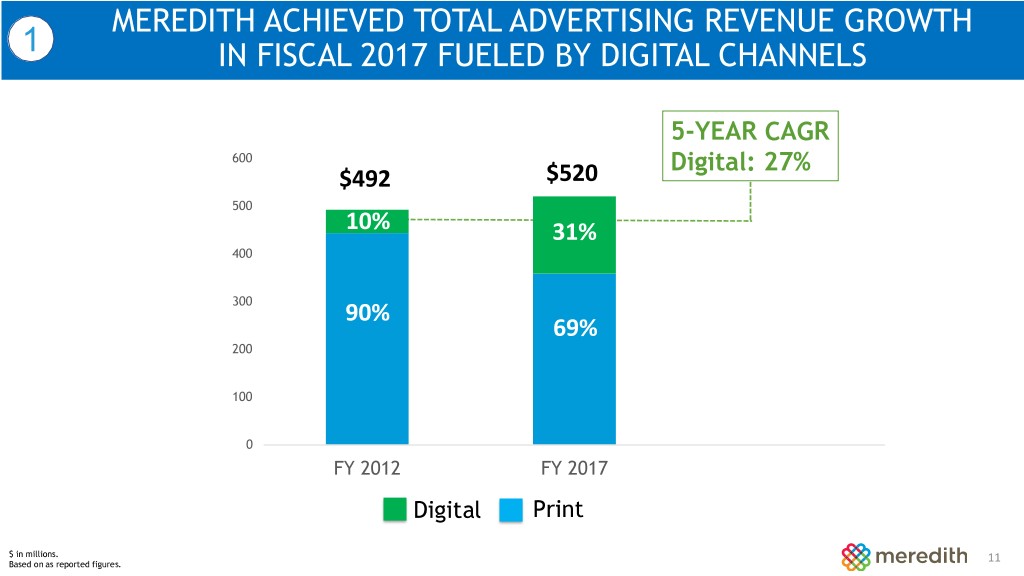
MEREDITH ACHIEVED TOTAL ADVERTISING REVENUE GROWTH 1 IN FISCAL 2017 FUELED BY DIGITAL CHANNELS 5-YEAR CAGR 600 Digital: 27% $492 $520 500 10% 31% 400 300 90% 69% 200 100 0 FY 2012 FY 2017 Digital Print $ in millions. 11 Based on as reported figures. 11

1 GROW DIGITAL REVENUES AND PROFIT MARGIN Opportunities 1 Improve mix of Legacy Time Inc. advertising inventory to Meredith levels: <40% of Legacy Time Inc. inventory running at premium monetization >50% of Legacy Meredith inventory running at premium monetization 2 Maximize fast-growing programmatic advertising platform: • Strengthen consumer engagement to drive repeat visits and longer stays on sites • Improve pricing through targeted marketing and new advertising products 3 Expand emerging opportunities: • Performance marketing • Voice • E-commerce • Connected home & car • Paid products 12

1 CONDUCT REVIEW OF MEDIA PORTFOLIO Transactions Held For Sale Completed Time UK Brands 13

1 EXECUTE ON MORE THAN $500 MILLION OF COST SYNERGIES Category Example Annual Savings Public company • Administrative/Central overhead $170 and duplicative • Elimination of duplicate operating functions $110 expenses ($300) • Elimination of public company expenses $20 Real estate and • New scale to enable expense savings on physical $60 costs, including paper and printing vendor contracts • Combine offices, leverage India where possible $40 ($130) • Leverage capacity in Des Moines where possible $30 Circulation, • Circulation, consumer marketing to Des Moines $60 fulfillment and other • Bundling to achieve promotion efficiencies $40 ($120) • Production management overhead, pre-media $20 savings, and newsstand distribution Total EBITDA $550 million opportunity $ in millions. 14 Source: Company management.
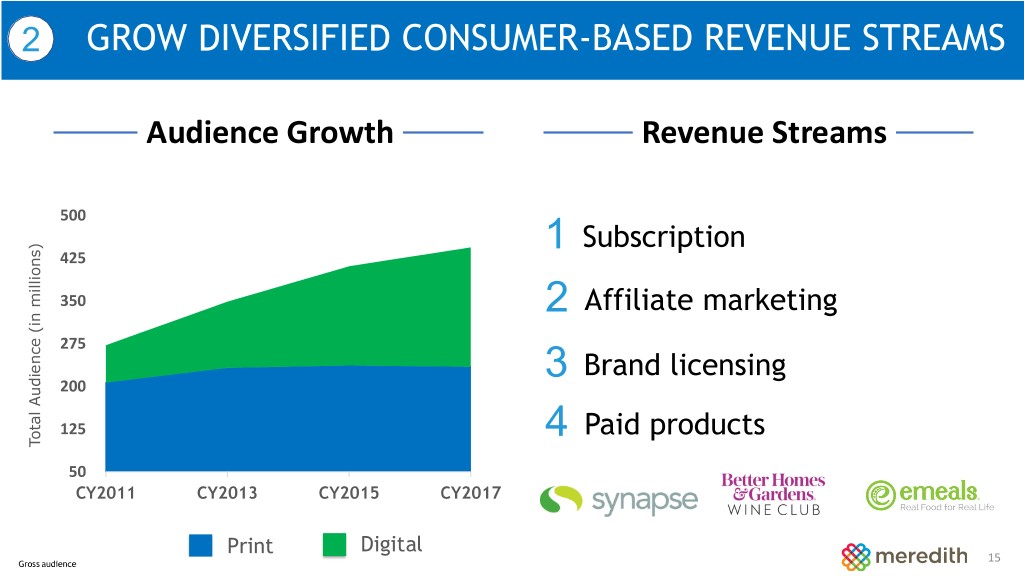
2 GROW DIVERSIFIED CONSUMER-BASED REVENUE STREAMS Audience Growth Revenue Streams 500 1 Subscription 425 350 2 Affiliate marketing 275 3 Brand licensing 200 125 4 Paid products Total Audience (in millions)(in Audience Total 50 CY2011 CY2013 CY2015 CY2017 Print Digital Gross audience 15

3 MAXIMIZE LOCAL MEDIA GROUP Historical Performance Opportunities Revenues 15% CAGR ❖ $693 Maximize political advertising $630 $534 $548 ❖ $403 Integrate and expand MNI Targeted Media ❖ Grow retransmission revenue ❖ FY14 FY15 FY16 FY17 FY18 Increase collaboration with National Media Group: Operating Profit 14% $215 CAGR 2 $189 $163 $158 $113 FY14 FY15 FY16 FY17 FY18 $ in millions. 16
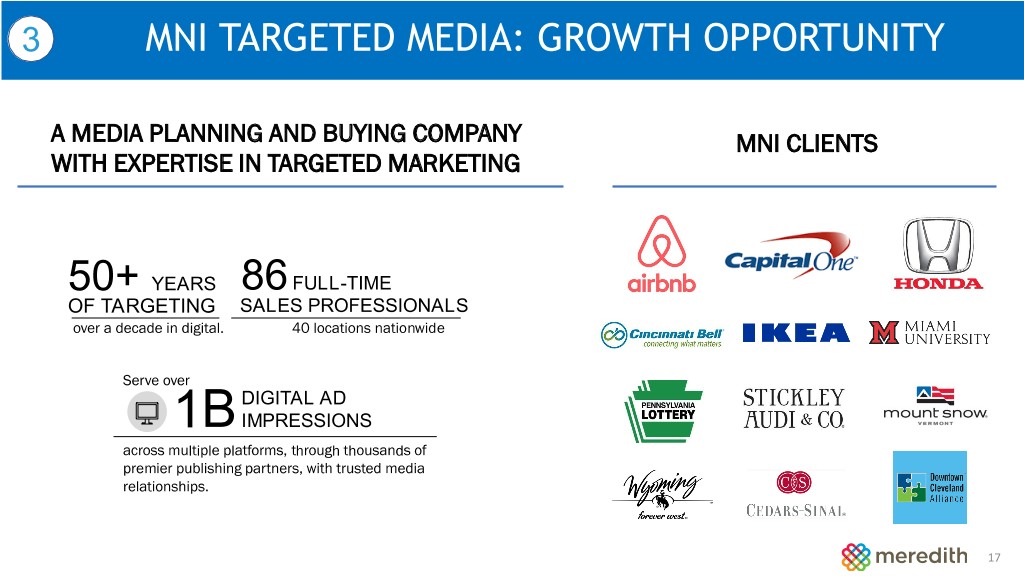
3 MNI TARGETED MEDIA: GROWTH OPPORTUNITY A MEDIA PLANNING AND BUYING COMPANY MNI CLIENTS WITH EXPERTISE IN TARGETED MARKETING 50+ YEARS 86 FULL-TIME OF TARGETING SALES PROFESSIONALS over a decade in digital. 40 locations nationwide Serve over DIGITAL AD 1BIMPRESSIONS across multiple platforms, through thousands of premier publishing partners, with trusted media relationships. 17

3 POLITICAL ADVERTISING OUTLOOK IS STRONG Significant Political Races Meredith Historical Political Ad Revenues Senate Gubernatorial Presidential Election Year $55-65 Mid-term Election Year Arizona (Open) Alabama (Open) $63 Dean Heller (R-NV) Connecticut (Open) Chris Murphy (D-CT) Florida (Open) Bill Nelson (D-FL) Georgia (Open) Elizabeth Warren (D-MA) Kansas (Open) $44 $39 Debbie Stabenow (D-MI) Michigan (Open) $35 Claire McCaskill (D-MO) Nevada (Open) Maria Cantwell (D-WA) South Carolina (Open) Tennessee (Open) Doug Ducey (R-AZ) Bruce Ranner (R-IL) Charlie Baker (R-MA) Kate Brown (D-OR) FY11 FY13 FY15 FY17 FY19 $ in millions. 18

3 RETRANSMISSION & AFFILIATION RENEWAL SCHEDULE ❖ 90% of Meredith Subscriber Households will Renew in FY19 and FY20 MVPD Renewal Schedule 8% 34% 58% Fiscal Fiscal Fiscal Fiscal Fiscal 2018 2019 2020 2021 2022 Las Vegas Springfield Atlanta Nashville Portland (ABC) Phoenix (NBC) Greenville Kansas City Mobile Saginaw Springfield St. Louis (CBS) (FOX) Hartford Springfield Affiliation Renewal Schedule (CBS) 19

3 NATIONAL AND LOCAL COLLABORATION INITIATIVES ❖Weekly video content sharing ❖Monthly video content sharing ❖Quarterly video by Joanna Gains ❖Planned content sharing for special events 20

MEREDITH’S NEAR-TERM FINANCIAL GOALS Debt Reduction EBITDA Generation $1 Billion $1 Billion in Fiscal 2019 in Fiscal 2020 21

TODAY’S AGENDA ❖Meredith Overview ❖Go-Forward Strategy ❖Total Shareholder Return ❖Q&A 22

TOTAL SHAREHOLDER RETURN STRATEGY 1. Strong EBITDA, margin and cash flow growth 2. Strengthening financial profile, driven by de-levering 3. Commitment to ongoing dividend increases: • Dividend payer for 71 consecutive years, with 25-straight years of growth • Current annualized dividend of $2.18 per share, yielding 4.0% 23
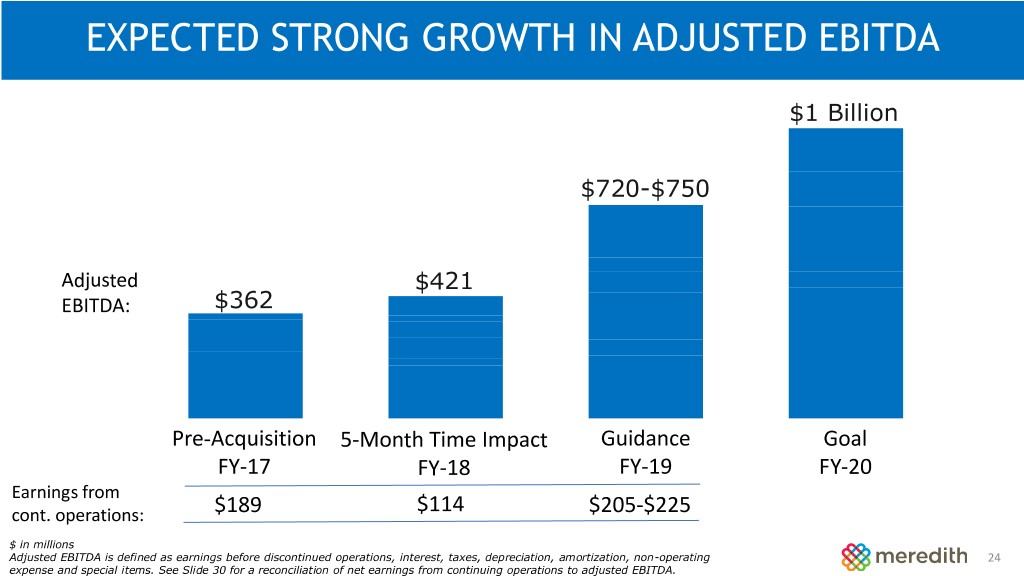
EXPECTED STRONG GROWTH IN ADJUSTED EBITDA $1 Billion $720-$750 Adjusted $421 EBITDA: $362 Pre-Acquisition 5-Month Time Impact Guidance Goal FY-17 FY-18 FY-19 FY-20 Earnings from cont. operations: $189 $114 $205-$225 $ in millions Adjusted EBITDA is defined as earnings before discontinued operations, interest, taxes, depreciation, amortization, non-operating 24 expense and special items. See Slide 30 for a reconciliation of net earnings from continuing operations to adjusted EBITDA.

HISTORICAL AND FORWARD-LOOKING USE OF CASH FY 2017 FY 2018 FY 2019¹ FY 2020¹ Interest 22 66 180 150 Income taxes 73 24 50 120 Capital expenditures 35 53 70 60 Cost to achieve synergies & other 48 75 163 163 Preferred dividends -- 23 55 55 Expected Uses of Cash $ 178 $ 241 $ 518 $ 548 $ in millions 25 (1) Fiscal 2019 and Fiscal 2020 represent management expectations
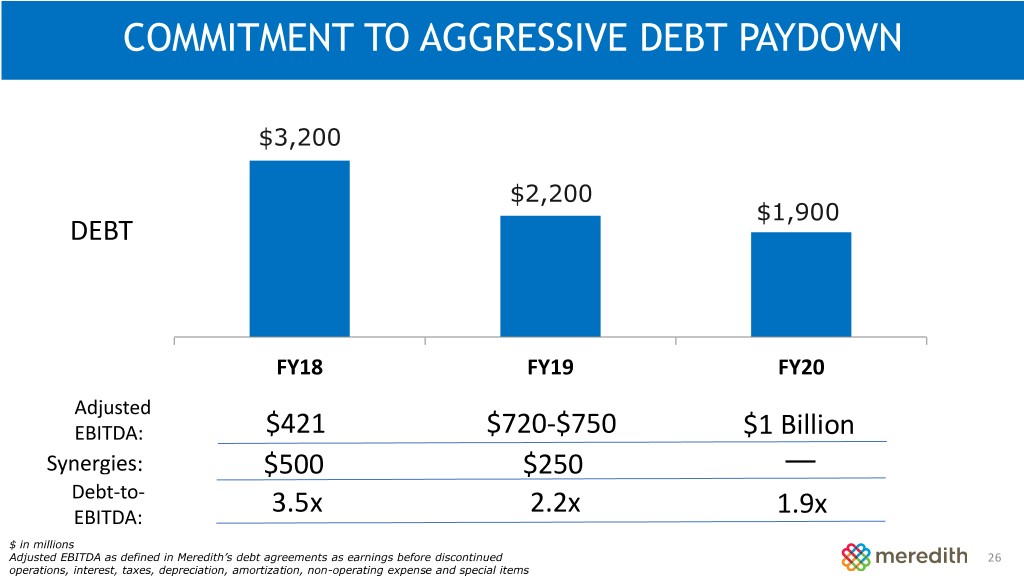
COMMITMENT TO AGGRESSIVE DEBT PAYDOWN $3,200 $2,200 $1,900 DEBT FY18 FY19 FY20 Adjusted EBITDA: $421 $720-$750 $1 Billion Synergies: $500 $250 Debt-to- EBITDA: 3.5x 2.2x 1.9x $ in millions Adjusted EBITDA as defined in Meredith’s debt agreements as earnings before discontinued 26 operations, interest, taxes, depreciation, amortization, non-operating expense and special items

STRONG TRACK RECORD OF INCREASING DIVIDENDS 10% CAGR $2.18 $1.83 $1.53 $0.90 2009 2012 2015 2018 $ in dollars per share 27

COMMITMENT TO STRONG CAPITAL STEWARDSHIP AND DELIVERING TOP THIRD SHAREHOLDER RETURN ❖ Continued commitment to returning cash to shareholders via dividends ❖ Debt repayment and de-levering in the near-term, fueled by: Priority —Strong EBITDA growth —Proceeds from asset sales —Leverage target below 2x by CY2020 ❖ Accretive acquisitions at attractive valuations with strong synergies ❖ Selective share repurchases 28

General IR Presentation September 2018

ADJUSTED EBITDA RECONCILIATION FY 2019¹ FY 2017 FY 2018 Low High Earnings from continuing operations $ 188.9 $ 114.0 $ 205.0 $ 225.0 Interest expense 18.8 96.9 180.0 180.0 Net income tax 101.4 (123.6) 80.0 88.0 Depreciation & amortization 53.8 129.0 255.0 257.0 Net special items (0.7) 193.0 Other non-operating expenses 11.7 Adjusted EBITDA $ 362.2 $ 421.0 $ 720.0 $ 750.0 $ in millions 30 (1) Fiscal 2019 represents management’s expectations
