Attached files
| file | filename |
|---|---|
| EX-21 - EXHIBIT 21 - SUBSIDIARIES - MEREDITH CORP | fy14q4exhibit21.htm |
| EX-23 - EXHIBIT 23 - CONSENT - MEREDITH CORP | fy14q4exhibit23.htm |
| EX-31.1 - EXHIBIT 31.1 CEO CERTIFICATION - MEREDITH CORP | fy14q4exhibit311.htm |
| EX-31.2 - EXHIBIT 31.2 CFO CERTIFICATION - MEREDITH CORP | fy14q4exhibit312.htm |
| EX-32 - EXHIBIT 32 - SECTION 906 CERTIFICATION OF CEO AND CFO - MEREDITH CORP | fy14q4exhibit32.htm |
| 10-K - PDF OF ENTIRE SUBMISSION - MEREDITH CORP | fy14q4form10k.pdf |
| EXCEL - IDEA: XBRL DOCUMENT - MEREDITH CORP | Financial_Report.xls |
UNITED STATES SECURITIES AND EXCHANGE COMMISSION |
Washington, D.C. 20549 |
FORM 10-K |
ANNUAL REPORT PURSUANT TO SECTION 13 OR 15(d) |
OF THE SECURITIES EXCHANGE ACT OF 1934 |
For the fiscal year ended June 30, 2014 | Commission file number 1-5128 |

MEREDITH CORPORATION | |
(Exact name of registrant as specified in its charter) | |
Iowa | 42-0410230 |
(State or other jurisdiction of incorporation or organization) | (I.R.S. Employer Identification No.) |
1716 Locust Street, Des Moines, Iowa | 50309-3023 |
(Address of principal executive offices) | (ZIP Code) |
Registrant's telephone number, including area code: (515) 284-3000 | |
Securities registered pursuant to Section 12(b) of the Act: | ||||
Title of each class | Name of each exchange on which registered | |||
Common Stock, par value $1 | New York Stock Exchange | |||
Securities registered pursuant to Section 12(g) of the Act: | ||||||||
Title of class | ||||||||
Class B Common Stock, par value $1 | ||||||||
Indicate by check mark if the registrant is a well-known seasoned issuer, as defined in Rule 405 of the Securities Act. Yes x No o
Indicate by check mark if the registrant is not required to file reports pursuant to Section 13 or Section 15(d) of the Act. Yes o No x
Indicate by check mark whether the registrant (1) has filed all reports required to be filed by Section 13 or 15(d) of the Securities Exchange Act of 1934 during the preceding 12 months (or for such shorter period that the registrant was required to file such reports), and (2) has been subject to such filing requirements for the past 90 days. Yes x No o
Indicate by check mark whether the registrant has submitted electronically and posted on its corporate Web site, if any, every Interactive Data File required to be submitted and posted pursuant to Rule 405 of Regulation S-T during the preceding 12 months (or for such shorter period that the registrant was required to submit and post such files). Yes x No o
Indicate by check mark if disclosure of delinquent filers pursuant to Item 405 of Regulation S-K is not contained herein, and will not be contained, to the best of registrant's knowledge, in definitive proxy or information statements incorporated by reference in Part III of this Form 10-K or any amendment to this Form 10-K. x
Indicate by check mark whether the registrant is a large accelerated filer, an accelerated filer, a non-accelerated filer, or a smaller reporting company. See the definitions of "large accelerated filer," "accelerated filer," and "smaller reporting company" in Rule 12b-2 of the Exchange Act.
Large accelerated filer x Accelerated filer o Non-accelerated filer o Smaller reporting company o
Indicate by check mark whether the registrant is a shell company (as defined in Rule 12b-2 of the Exchange Act). Yes o No x
The registrant estimates that the aggregate market value of voting and non-voting common equity held by non-affiliates of the registrant at December 31, 2013, was $1,846,000,000 based upon the closing price on the New York Stock Exchange at that date.
Shares of stock outstanding at July 31, 2014 | ||
Common shares | 36,778,633 | |
Class B shares | 7,699,516 | |
Total common and Class B shares | 44,478,149 | |
DOCUMENT INCORPORATED BY REFERENCE | ||||
Certain portions of the Registrant's Proxy Statement for the Annual Meeting of Shareholders to be held on November 12, 2014, are incorporated by reference in Part III to the extent described therein. | ||||
TABLE OF CONTENTS | ||||
Page | ||||
Part I | ||||
Business | ||||
Description of Business | ||||
Local Media | ||||
National Media | ||||
Executive Officers of the Company | ||||
Employees | ||||
Other | ||||
Available Information | ||||
Forward Looking Statements | ||||
Risk Factors | ||||
Unresolved Staff Comments | ||||
Properties | ||||
Legal Proceedings | ||||
Mine Safety Disclosures | ||||
Part II | ||||
Market for Registrant's Common Equity, Related Shareholder | ||||
Matters, and Issuer Purchases of Equity Securities | ||||
Selected Financial Data | ||||
Management's Discussion and Analysis of Financial | ||||
Condition and Results of Operations | ||||
Quantitative and Qualitative Disclosures About Market Risk | ||||
Financial Statements and Supplementary Data | ||||
Changes in and Disagreements with Accountants on | ||||
Accounting and Financial Disclosure | ||||
Controls and Procedures | ||||
Other Information | ||||
Part III | ||||
Directors, Executive Officers, and Corporate Governance | ||||
Executive Compensation | ||||
Security Ownership of Certain Beneficial Owners and | ||||
Management and Related Stockholder Matters | ||||
Certain Relationships and Related Transactions and | ||||
Director Independence | ||||
Principal Accounting Fees and Services | ||||
Part IV | ||||
Exhibits and Financial Statement Schedules | ||||
Meredith Corporation and its consolidated subsidiaries are referred to in this Annual Report on Form 10-K (Form 10-K) as Meredith, the Company, we, our, and us. | ||||
PART I | ||
ITEM 1. BUSINESS
GENERAL
Meredith Corporation has been committed to service journalism for more than 110 years. Meredith began in 1902 as an agricultural publisher. In 1924, the Company published the first issue of Better Homes and Gardens. The Company entered the television broadcasting business in 1948. Today, Meredith uses multiple media outlets—including print, broadcast television, digital, mobile, tablets, and video—to provide consumers with content they desire and to deliver the messages of its advertising and marketing partners. The Company is incorporated under the laws of the State of Iowa. Our common stock is listed on the New York Stock Exchange under the ticker symbol MDP.
The Company operates two business segments: local media and national media. Our local media segment consists of 14 owned television stations and one operated television station located across the United States (U.S.) in mostly fast growing markets, related digital and mobile media, and a national video creation unit. The owned television stations consist of seven CBS affiliates, three FOX affiliates, two MyNetworkTV affiliates, one NBC affiliate, and one independent station. Local media's digital presence includes 12 websites, 2 mobile-optimized websites, and 27 applications (apps) focused on news, sports, and weather-related information.
Our national media segment includes leading national consumer media brands delivered via multiple media platforms including print magazines and digital and mobile media, brand licensing activities, database-related activities, and business-to-business marketing products and services. It focuses on the home and family market and is a leading publisher of magazines serving women. In fiscal 2014, we published in print twenty-one subscription magazines, including Better Homes and Gardens, Parents, Family Circle, Allrecipes, EveryDay with Rachael Ray, and FamilyFun, and approximately 120 special interest publications. Twenty of our brands are also available as digital editions on various platforms. The national media segment's extensive digital media presence consists of more than 40 websites, almost 30 mobile-optimized websites, and nearly 20 apps. Of those websites and apps, the Allrecipes' brand accounts for 19 websites and 19 mobile sites serving 23 countries in 12 languages, and 3 mobile apps across multiple countries and platforms. The national media segment also includes digital and customer relationship marketing, which provides specialized marketing products and services to some of America's leading companies; a large consumer database; brand licensing activities; and other related operations.
Financial information about industry segments can be found in Item 7-Management's Discussion and Analysis of Financial Condition and Results of Operations and in Item 8-Financial Statements and Supplementary Data under Note 15.
The Company's largest revenue source is advertising. National and local economic conditions affect the magnitude of our advertising revenues. Both local media and national media revenues and operating results can be affected by changes in the demand for advertising and consumer demand for our products. Television advertising is seasonal and cyclical to some extent, traditionally generating higher revenues in the second and fourth fiscal quarters and during key political contests and major sporting events. Magazine circulation revenues are generally affected by national and regional economic conditions and competition from other forms of media.
1
BUSINESS DEVELOPMENTS
In February 2014, Meredith completed its acquisition of KMOV, the CBS affiliate in St. Louis, Missouri, the nation's 21st largest television market. In June 2014, the Company completed its acquisition of KTVK, an independent station in Phoenix, Arizona, the nation's 12th largest television market.
Starting with a December 2013 issue, Meredith launched Allrecipes magazine, the print extension of Allrecipes.com, the world's most popular digital food destination. The Allrecipes magazine is being published six times a year and started with an initial rate base of 500,000. The rate base was increased to 650,000 beginning with the April 2014 issue.
DESCRIPTION OF BUSINESS
Local Media
Local media contributed 27 percent of Meredith's consolidated revenues and 50 percent of the combined operating profit from local media and national media operations in fiscal 2014. Information about the Company's television stations at June 30, 2014, follows:
Station, Market | DMA National Rank 1 | Network Affiliation | Channel | Expiration Date of FCC License | Average Audience Share 2 |
WGCL-TV | 9 | CBS | 46 | 4-1-2005 (3 | 4.5 % |
Atlanta, GA | |||||
KPHO-TV | 12 | CBS | 5 | 10-1-2006 3) | 6.0 % |
Phoenix, AZ | |||||
KTVK | 12 | Independent | 3 | 10-1-2014 | 3.0 % |
Phoenix, AZ | |||||
KMOV | 21 | CBS | 4 | 2-1-2022 | 9.7 % |
St. Louis, MO | |||||
KPTV | 22 | FOX | 12 | 2-1-2007 (3) | 5.8 % |
Portland, OR | |||||
KPDX | 22 | MyNetworkTV | 49 | 2-1-2015 | 2.3 % |
Portland, OR | |||||
WSMV-TV | 29 | NBC | 4 | 8-1-2005 (3) | 9.7 % |
Nashville, TN | |||||
WFSB | 30 | CBS | 3 | 4-1-2015 | 10.5 % |
Hartford, CT | |||||
New Haven, CT | |||||
KCTV | 31 | CBS | 5 | 2-1-2006 (3) | 10.0 % |
Kansas City, MO | |||||
KSMO-TV | 31 | MyNetworkTV | 62 | 2-1-2014 (3) | 1.0 % |
Kansas City, MO | |||||
2
Station, Market | DMA National Rank 1 | Network Affiliation | Channel | Expiration Date of FCC License | Average Audience Share 2 |
WHNS | 37 | FOX | 21 | 12-1-2004 (3) | 4.0 % |
Greenville, SC | |||||
Spartanburg, SC | |||||
Asheville, NC | |||||
Anderson, SC | |||||
KVVU-TV | 42 | FOX | 5 | 10-1-2006 (3) | 4.8 % |
Las Vegas, NV | |||||
WNEM-TV | 68 | CBS | 5 | 10-1-2005 (3) | 15.6 % |
Flint, MI | |||||
Saginaw, MI | |||||
Bay City, MI | |||||
WSHM-LD | 114 | CBS | 3 | 4-1-2015 | 6.7 % |
Springfield, MA | |||||
Holyoke, MA | |||||
1 Designated Market Area (DMA) is a registered trademark of, and is defined by, Nielsen Media Research. The national rank is from the 2013-2014 DMA ranking. | |||||
2 Average audience share represents the estimated percentage of households using television tuned to the station in the DMA. The percentages shown reflect the average total day shares (6:00 a.m. to 2:00 a.m.) for the November 2013, February 2014, and May 2014 measurement periods. | |||||
3 Renewal application pending. Under FCC rules, a license is automatically extended pending FCC processing and granting of the renewal application. We have no reason to believe that these licenses will not be renewed by the FCC. | |||||
Operations
The principal sources of the local media segment's revenues are: 1) local non-political advertising focusing on the immediate geographic area of the stations; 2) national non-political advertising; 3) political advertising which is seasonal with peaks occurring in our odd fiscal years (e.g. fiscal 2013, fiscal 2015) and particularly in our second fiscal quarter of those years; 4) retransmission of our television signal by satellite and cable systems and telecommunications companies; 5) station operation management fees; 6) digital advertising on the stations' websites and mobile websites; and 7) payments by advertisers for other services, such as the production of advertising materials.
The stations sell commercial time to both local/regional and national advertisers. Rates for spot advertising are influenced primarily by the market size, number of in-market broadcasters, audience share, and audience demographics. The larger a station's audience share in any particular daypart, the more leverage a station has in setting advertising rates. Generally, as the market fluctuates with supply and demand, so does a station's advertising rates. Most national advertising is sold by an independent representative firm. The sales staff at each station generates local/regional advertising revenues.
Typically 30 to 40 percent of a market's television advertising revenue is generated by local newscasts. Station personnel are continually working to grow their news ratings, which in turn will augment revenues. The Company broadcasts local newscasts in high definition in nine of our markets and in wide screen format in our other two markets.
The national network affiliations of Meredith's 13 network-affiliated television stations also influence advertising rates. Generally, a network affiliation agreement provides a station the exclusive right to broadcast network programming in its local service area. In return, the network has the right to sell most of the commercial advertising aired during network programs.
3
Our CBS affiliation agreements expire in April 2016 and August 2017. Our two MyNetworkTV affiliation agreements expire in September 2016. Our NBC affiliation agreement and our Fox affiliation agreements each expire in December 2017. Programming fees paid to NBC increased significantly in fiscal 2014. These payments are in essence a portion of the retransmission fees that Meredith receives from cable, satellite, and telecommunications service providers, which pay Meredith to carry our local television programming in their markets. These stations generally also pay networks for certain programming and services such as marquee sports (professional football, college basketball, and Olympics) and news services. The Company's Fox affiliates also pay the Fox network for additional advertising spots during prime-time programming. While Meredith's relations with the networks historically have been very good, the Company can make no assurances they will remain so over time.
Retransmission revenue is generated from cable, satellite and telecommunications service providers who pay Meredith for access to our television station signals so that they may retransmit our signals and charge their subscribers for this programming. These fees increased in fiscal 2014 primarily due to having a full year of benefit from agreements that were renegotiated in fiscal 2013.
The Federal Communications Commission (FCC) has permitted broadcast television station licensees to use their digital spectrum for a wide variety of services such as high-definition television programming, audio, data, mobile applications, and other types of communication, subject to the requirement that each broadcaster provide at least one free video channel equal in quality to the current technical standards. Several of our stations are broadcasting a second programming stream on their digital channel. Our Las Vegas, Phoenix, Hartford and Greenville stations currently broadcast a news/weather channel, our other Phoenix station broadcasts This TV Network, Flint-Saginaw has a MyNetworkTV affiliate, St. Louis broadcasts MeTV, Nashville has a Heartland Channel affiliate, and Kansas City airs MundoFox, an American Spanish language broadcast television network.
The costs of television programming are significant. In addition to network affiliation fees, there are two principal programming costs for Meredith: locally produced programming, including local news; and purchased syndicated programming. The Company continues to increase our locally produced news and entertainment programming to control content and costs and to attract advertisers. Syndicated programming costs are based largely on demand from stations in the market and can fluctuate significantly.
Meredith Video Studios (MVS) is our development, production, and multiplatform distribution company that produces video for use by Meredith's television stations and our local and national media websites, and is producing custom video for clients as well. Sponsorship opportunities include video billboards, product integration, channel sponsorships, and custom videos.
Produced by MVS, The Better Show, our daily lifestyle television show, currently airs every weekday in more than 160 markets reaching 80 percent of U.S. television households, including Top 10 markets such as New York, Los Angeles, Philadelphia, Dallas, Boston, and Atlanta. Meredith recently renewed The Better Show for an eighth season.
Competition
Meredith's television stations compete directly for advertising dollars and programming in their respective markets with other local television stations, radio stations, and cable television providers. Other mass media providers such as newspapers and their websites are also competitors. Advertisers compare market share, audience demographics, and advertising rates, and take into account audience acceptance of a station's programming, whether local, network, or syndicated.
Regulation
The ownership, operation, and sale of broadcast television and radio stations, including those licensed to the Company, are subject to the jurisdiction of the FCC, which engages in extensive regulation of the broadcasting industry under authority granted by the Communications Act of 1934, as amended (Communications Act), including authority to promulgate rules and regulations governing broadcasting. The Communications Act requires
4
broadcasters to serve the public interest. Among other things, the FCC assigns frequency bands; determines stations' locations and operating parameters; issues, renews, revokes, and modifies station licenses; regulates and limits changes in ownership or control of station licenses; regulates equipment used by stations; regulates station employment practices; regulates certain program content, including commercial matters in children's programming; has the authority to impose penalties for violations of its rules or the Communications Act; and imposes annual fees on stations. Reference should be made to the Communications Act, as well as to the FCC's rules, public notices, and rulings for further information concerning the nature and extent of federal regulation of broadcast stations.
Broadcast licenses are granted for eight-year periods. The Communications Act directs the FCC to renew a broadcast license if the station has served the public interest and is in substantial compliance with the provisions of the Communications Act and FCC rules and policies. Management believes the Company is in substantial compliance with all applicable provisions of the Communications Act and FCC rules and policies and knows of no reason why Meredith's broadcast station licenses will not be renewed.
The FCC has, on occasion, changed the rules related to local ownership of media assets, including rules relating to the ownership of one or more television stations in a market. The FCC's media ownership rules are subject to further review by the FCC, various court appeals, petitions for reconsideration before the FCC, and possible actions by Congress. We cannot predict the impact of any of these developments on our business.
The Communications Act and the FCC also regulate relationships between television broadcasters and cable and satellite television providers. Under these provisions, most cable systems must devote a specified portion of their channel capacity to the carriage of the signals of local television stations that elect to exercise this right to mandatory carriage. Alternatively, television stations may elect to restrict cable systems from carrying their signals without their written permission, referred to as retransmission consent. Congress and the FCC have established and implemented generally similar market-specific requirements for mandatory carriage of local television stations by satellite television providers when those providers choose to provide a market's local television signals.
The FCC has proposed a plan, called the National Broadband Plan, to increase the amount of spectrum available in the United States for wireless broadband use. In furtherance of the National Broadband Plan, Congress enacted and the President signed into law legislation authorizing the FCC to conduct a “reverse auction” for which television broadcast licensees could submit bids to receive compensation in return for relinquishing all or a portion of their rights in the television spectrum of their full service and/or Class A stations. Under the new law, the FCC may hold one reverse auction, and another auction for the newly freed spectrum. The FCC must complete both auctions by 2022. In May 2014, the FCC adopted a Report and Order setting forth the basic framework for the reverse auction and the subsequent repacking of broadcast television signals into a new television band plan.
Even if a television licensee does not participate in the reverse auction, the results of the auction could materially impact a station's operations. The FCC has the authority to force a television station to change channels and/or modify its coverage area to allow the FCC to rededicate certain channels within the television band for wireless broadband use. We cannot predict whether or how this will affect the Company or its television stations.
In addition to the National Broadband Plan, Congress and the FCC have under consideration, and in the future may adopt, new laws, regulations, and policies regarding a wide variety of other matters that also could affect, directly or indirectly, the operation, ownership transferability, and profitability of the Company's broadcast stations and affect the ability of the Company to acquire additional stations. In addition to the matters noted above, these could include spectrum usage fees, regulation of political advertising rates, restrictions on the advertising of certain products (such as alcoholic beverages), program content restrictions, and ownership rule changes.
Other matters that could potentially affect the Company's broadcast properties include technological innovations and developments generally affecting competition in the mass communications industry for viewers or advertisers, such as home video recording devices and players, satellite radio and television services, cable television systems, newspapers, outdoor advertising, and internet-delivered video programming services.
5
The information provided in this section is not intended to be inclusive of all regulatory provisions currently in effect. Statutory provisions and FCC regulations are subject to change, and any such changes could affect future operations and profitability of the Company's local media segment. Management cannot predict what regulations or legislation may be adopted, nor can management estimate the effect any such changes would have on the Company's television broadcasting operations.
National Media
National media contributed 73 percent of Meredith's consolidated revenues and 50 percent of the combined operating profit from local media and national media operations in fiscal 2014. Better Homes and Gardens magazine, our flagship brand, continues to account for a significant percentage of revenues and operating profit of the national media segment and the Company.
Magazines
Information for our major magazine titles as of June 30, 2014, follows:
Title | Description | Frequency per Year | Year-end Rate Base | 1 | |
Better Homes and Gardens | Women's service | 12 | 7,600,000 | ||
Family Circle | Women's service | 12 | 4,000,000 | ||
Parents | Parenthood | 12 | 2,200,000 | ||
FamilyFun | Parenthood | 10 | 2,100,000 | ||
American Baby | Parenthood | 12 | 2,000,000 | ||
EveryDay with Rachael Ray | Women's lifestyle and food | 10 | 1,700,000 | ||
Fitness | Women's lifestyle | 10 | 1,500,000 | ||
More | Women's lifestyle (age 40+) | 10 | 1,300,000 | ||
Midwest Living | Travel and lifestyle | 6 | 950,000 | ||
Ser Padres | Hispanic parenthood | 8 | 850,000 | ||
Traditional Home | Home decorating | 8 | 850,000 | ||
EatingWell | Women's lifestyle and food | 6 | 750,000 | ||
Allrecipes | Food | 6 | 650,000 | ||
Siempre Mujer | Hispanic women's lifestyle | 6 | 550,000 | ||
Wood | Woodworking | 7 | 450,000 | ||
Successful Farming | Farming business | 13 | 420,000 | ||
1 | Rate base is the circulation guaranteed to advertisers. Actual circulation generally exceeds rate base and for most of the Company's titles is tracked by the Alliance for Audited Media, which issues periodic statements for audited magazines. | |
In addition to these major magazine titles, we published approximately 120 special interest publications under approximately 80 titles in fiscal 2014, primarily under the Better Homes and Gardens brand. The titles are issued from one to six times annually and sold primarily on newsstands. A limited number of subscriptions are also sold to certain special interest publications. The following titles were published quarterly or more frequently: American Patchwork & Quilting, Country Gardens, Diabetic Living, Do It Yourself, Kitchen and Bath Ideas, and Quilts & More.
Magazine Advertising—Advertising revenues are generated primarily from sales to clients engaged in consumer marketing. Many of Meredith's larger magazines offer regional and demographic editions that contain similar editorial content but allow advertisers to customize messages to specific markets or audiences. The Company sells two primary types of magazine advertising: display and direct-response. Advertisements are either run-of-press
6
(printed along with the editorial portions of the magazine) or inserts (preprinted pages). Most of the national media segment's advertising revenues are derived from run-of-press display advertising. Meredith also possesses a strategic marketing unit, Meredith 360°, which provides clients and their agencies with access to all of Meredith’s media platforms and capabilities, including print, television, digital, video, mobile, consumer events and custom marketing. Our team of creative and marketing experts delivers innovative solutions across multiple media channels that meet each client's unique advertising and promotional requirements.
Magazine Circulation—Subscriptions obtained through direct-mail solicitation, agencies, insert cards, the internet, and other means are Meredith's largest source of circulation revenues. All of our subscription magazines, except American Baby, Ser Padres, and Successful Farming, are also sold by single copy. Single copies sold on newsstands are distributed primarily through magazine wholesalers, who have the right to receive credit from the Company for magazines returned to them by retailers.
Digital and Mobile Media
We have 20 of our brands available as digital tablet editions, with an audience of approximately 690,000. Paid digital customers represent 3 percent of our total rate base. For four of our brands, we offer digital editions that are enhanced for the tablet to include bonus content.
National media's more than 40 websites and nearly 30 mobile-optimized websites provide ideas and inspiration. These branded websites focus on the topics that women care about most—food, home, entertaining, and meeting the needs of moms—and on delivering powerful content geared toward lifestyle topics such as health, beauty, style, and wellness. Our apps, which focus on the same topics, reached nearly 31 million cumulative downloads during fiscal 2014. Digital traffic across our various platforms averaged 51 million unique monthly visitors in fiscal 2014, reaching an all-time high of 58 million during the fiscal year. Our brands have a strong social networking presence as well. In fiscal 2014, national media reached over 13 million Facebook fans, over 2 million Twitter followers, and nearly 2 million Pintrest followers.
In fiscal 2014, we generated 7 million digital orders for print magazine subscriptions, an increase of 18 percent over the prior year. We now receive over one-third of our orders from digital sources.
Other Sources of Revenues
Other revenues are derived from digital and customer relationship marketing, other custom publishing projects, brand licensing agreements, ancillary products and services, and book sales.
Meredith Xcelerated Marketing—Meredith Xcelerated Marketing (MXM) is a leading content-powered, customer engagement agency that provides fully-integrated marketing solutions for some of the world's top brands, including Kraft, Lowe's, Honda, Chrysler, Kia, and Allergan. Through its rich 45-year history, MXM has established itself as the dominant force in content marketing with deep expertise in mobile, social media, customer relationship management, and advanced analytics. Its revenue is independent of advertising and circulation, though sometimes its services are sold as part of larger programs that include advertising components.
MXM employs over 600 people in eight offices globally: New York; Los Angeles; Washington, D.C.; Dallas; Des Moines; Detroit; Windsor, Canada; and Hyderabad, India. In addition, the Meredith-iris Global Network, Meredith's partnership with iris Nation Worldwide Limited, serves the increasing global needs of MXM's domestic clients while also opening the doors to new clients in the European and Asia-Pacific markets.
Brand Licensing—Brand licensing consists of the licensing of various proprietary trademarks in connection with retail programs conducted through a number of retailers and manufacturers, and multiple licensing agreements that extend several of Meredith's brands internationally.
Meredith's largest licensing agreement is for Better Homes and Gardens branded products at Wal-Mart Stores, Inc. (Walmart). During fiscal 2014, we continued to expand the scope of Better Homes and Gardens branded products at Walmart stores. Our current licensing agreement with Walmart continues through 2016.
7
Meredith also has a long-term agreement to license the Better Homes and Gardens brand to Realogy Corporation (Realogy), which continues to build a residential real estate franchise system based on the Better Homes and Gardens brand. The network now includes more than 250 offices across the United States and Canada and more than 8,300 agents.
Meredith's titles are currently distributed in more than 70 countries—including more than 25 licensed local editions in countries such as Australia, China, Indonesia, Italy, Russia, and Turkey. During fiscal 2014, Meredith renewed and expanded several agreements that expanded the reach of our popular media brands in Greece, Philippines, and Russia.
The Company continues to pursue brand extensions that will serve consumers and advertisers alike and also extend and strengthen the reach and vitality of our brands.
Meredith Books—Meredith has licensed exclusive global rights to publish and distribute books based on our consumer-leading brands, including the powerful Better Homes and Gardens imprint, to a book publisher. Meredith creates book content and retains all approval and content rights while the publisher is responsible for book layout and design, printing, sales and marketing, distribution, and inventory management. Meredith receives royalties based on net sales subject to a guaranteed minimum.
Production and Delivery
Paper, printing, and postage costs accounted for 31 percent of the national media segment's fiscal 2014 operating expenses.
Coated publication paper is the major raw material essential to the national media segment. We directly purchase all of the paper for our magazine production and custom publishing business. The Company has contractual agreements with major paper manufacturers to ensure adequate supplies for planned publishing requirements. The price of paper is driven by overall market conditions and is therefore difficult to predict. In fiscal 2014, average paper prices decreased 4 percent. They declined 5 percent in fiscal 2013. Average paper prices increased 3 percent in fiscal 2012. Management anticipates paper prices will fall in the low to mid-single digits during fiscal 2015 and that fiscal 2015 average paper prices will be down in the low to mid-single digits compared to fiscal 2014.
Meredith has printing contracts with two major domestic printers for our magazines.
Postage is a significant expense of the national media segment. We continually seek the most economical and effective methods for mail delivery, including cost-saving strategies that leverage work-sharing opportunities offered within the postal rate structure. Periodical postage accounts for 78 percent of Meredith's postage costs, while other mail items—direct mail, replies, and bills—account for 22 percent. The Governors of the United States Postal Service (USPS) review prices for mailing services annually and adjust postage rates periodically. Though prices and price increases for various USPS products vary, overall average price increases are capped by law at the rate of inflation as measured by the Consumer Price Index, which was 1.7 percent in fiscal 2014. However, the USPS obtained approval for an additional increase of 4.3 percent, effective in January 2014, to cover recent financial losses, bringing the total price increase to 6.0 percent. The additional rate increase is currently set to phase out once losses have been recovered but may become permanent depending on the outcome of court appeals. Postage prices have risen in each of Meredith's last four fiscal years. Over the longer term, prices have increased in eight of the last nine fiscal years for Meredith.
Meredith continues to work independently and with others to encourage and help the USPS find and implement efficiencies to contain rate increases. We cannot, however, predict future changes in the postal rates or the impact they will have on our national media business.
Subscription fulfillment services for Meredith's national media segment are provided by third parties. National magazine newsstand distribution services are provided by third parties through multi-year agreements.
8
Competition
Publishing is a highly competitive business. The Company's magazines and related publishing products and services compete with other mass media, including the internet and many other leisure-time activities. Competition for advertising dollars is based primarily on advertising rates, circulation levels, reader demographics, advertiser results, and sales team effectiveness. Competition for readers is based principally on editorial content, marketing skills, price, and customer service. While competition is strong for established titles, gaining readership for newer magazines and specialty publications is especially competitive.
EXECUTIVE OFFICERS OF THE COMPANY
Executive officers are elected to one year terms each November. The current executive officers of the Company are:
Stephen M. Lacy—Chairman, President, and Chief Executive Officer (2010 - present) and a director of the Company since 2004. Formerly President and Chief Executive Officer (2006 - 2010). Age 60.
Thomas H. Harty—President-National Media Group (2010 - present). Formerly President-Consumer Magazines (2009 - 2010) and Vice President-Magazine Group (2004 - 2009). Age 51.
Paul A. Karpowicz—President-Local Media Group (2005 - present). Age 61.
Joseph H. Ceryanec—Vice President-Chief Financial Officer (2008 - present). Age 53.
John S. Zieser—Chief Development Officer/General Counsel and Secretary (2006 - present). Age 55.
EMPLOYEES
As of June 30, 2014, the Company had approximately 3,500 full-time and 100 part-time employees. Only a small percentage of our workforce is unionized. We consider relations with our employees to be good.
OTHER
Name recognition and the public image of the Company's trademarks (e.g., Better Homes and Gardens and Parents) and television station call letters are vital to the success of our ongoing operations and to the introduction of new businesses. The Company protects our brands by aggressively defending our trademarks and call letters.
The Company had no material expenses for research and development during the past three fiscal years. Revenues from individual customers and revenues, operating profits, and identifiable assets of foreign operations were not significant. Compliance with federal, state, and local provisions relating to the discharge of materials into the environment and to the protection of the environment had no material effect on capital expenditures, earnings, or the Company's competitive position.
AVAILABLE INFORMATION
The Company's corporate website is meredith.com. The content of our website is not incorporated by reference into this Form 10-K. Meredith makes available free of charge through our website our Form 10-K, Quarterly Reports on Form 10-Q, Current Reports on Form 8-K, and amendments to those reports filed or furnished to the Securities and Exchange Commission (SEC) pursuant to Section 13(a) or 15(d) of the Securities Exchange Act of 1934 as soon as reasonably practical after such documents are electronically filed with or furnished to the SEC. Meredith also
9
makes available on our website our corporate governance information including charters of all of our Board Committees, our Corporate Governance Guidelines, our Code of Business Conduct and Ethics, our Code of Ethics for CEO and Senior Financial Officers, and our Bylaws. Copies of such documents are also available free of charge upon written request.
FORWARD LOOKING STATEMENTS
This Form 10-K, including the sections titled Item 1-Business, Item 1A-Risk Factors, and Item 7-Management's Discussion and Analysis of Financial Condition and Results of Operations, contains forward-looking statements that relate to future events or our future financial performance. We may also make written and oral forward-looking statements in our SEC filings and elsewhere. By their nature, forward-looking statements involve risks, trends, and uncertainties that could cause actual results to differ materially from those anticipated in any forward-looking statements. Such factors include, but are not limited to, those items described in Item 1A-Risk Factors below, those identified elsewhere in this document, and other risks and factors identified from time to time in our SEC filings. We have tried, where possible, to identify such statements by using words such as believe, expect, intend, estimate, may, anticipate, will, likely, project, plan, and similar expressions in connection with any discussion of future operating or financial performance. Any forward-looking statements are and will be based upon our then-current expectations, estimates, and assumptions regarding future events and are applicable only as of the dates of such statements. Readers are cautioned not to place undue reliance on such forward-looking statements that are part of this filing; actual results may differ materially from those currently anticipated. The Company undertakes no obligation to update or revise any forward-looking statements, whether as a result of new information, future events, or otherwise.
ITEM 1A. RISK FACTORS
In addition to the other information contained or incorporated by reference into this Form 10-K, investors should consider carefully the following risk factors when investing in our securities. In addition to the risks described below, there may be additional risks that we have not yet perceived or that we currently believe are immaterial.
Advertising represents the largest portion of our revenues. In fiscal 2014, 53 percent of our revenues were derived from advertising. Advertising constitutes 45 percent of our national media revenues and 73 percent of our local media revenues. Demand for advertising is highly dependent upon the strength of the U.S. economy. During an economic downturn, demand for advertising may decrease. The growth in alternative forms of media, particularly electronic media including those based on the internet, has increased the competition for advertising dollars, which could in turn reduce expenditures for magazine and television advertising or suppress advertising rates.
Circulation revenues represent a significant portion of our revenues. Magazine circulation is another significant source of revenue, representing 22 percent of total revenues and 31 percent of national media revenues. Preserving circulation is critical for maintaining advertising sales. Magazines face increasing competition from alternative forms of media and entertainment. As a result, sales of magazines through subscriptions and at the newsstand could decline. As publishers compete for subscribers, subscription prices could decrease and marketing expenditures may increase.
Technology in the media industry continues to evolve rapidly. Advances in technology have led to an increasing number of alternative methods for the delivery of content and have driven consumer demand and expectations in unanticipated directions. If we are unable to exploit new and existing technologies to distinguish our products and services from those of our competitors or adapt to new distribution methods that provide optimal user experiences, our business, financial condition, and prospects may be adversely affected. Technology developments also pose
10
other challenges that could adversely affect our revenues and competitive position. New delivery platforms may lead to pricing restrictions, the loss of distribution control, and the loss of a direct relationship with consumers. We may also be adversely affected if the use of technology developed to block the display of advertising on websites proliferates. In addition, new and emerging technologies such as subscription streaming media services and mobile video are increasing competition for household audiences and advertisers. This competition may make it difficult for us to grow or maintain our print and broadcasting revenues, which we believe may challenge us to expand the contribution of our online and other digital businesses.
Our websites and internal networks may be vulnerable to unauthorized persons accessing our systems, which could disrupt our operations. The Company uses computers in substantially all aspects of its business operations. Our website activities involve the storage and transmission of proprietary information, which we endeavor to protect from unauthorized access. However, it is possible that unauthorized persons may be able to circumvent our protections and misappropriate proprietary information or cause interruptions or malfunctions in our digital operations. We invest in security resources and technology to protect our data and business processes against risk of data security breaches and cyber-attack, but the techniques used to attempt attacks are constantly changing. A breach or successful attack could have a negative impact on our operations or business reputation.
World events may result in unexpected adverse operating results for our local media segment. Our local media results could be affected adversely by world events such as wars, political unrest, acts of terrorism, and natural disasters. Such events can result in significant declines in advertising revenues as the stations will not broadcast or will limit broadcasting of commercials during times of crisis. In addition, our stations may have higher newsgathering costs related to coverage of the events.
Our local media operations are subject to FCC regulation. Our broadcasting stations operate under licenses granted by the FCC. The FCC regulates many aspects of television station operations including employment practices, political advertising, indecency and obscenity, programming, signal carriage, and various technical matters. Violations of these regulations could result in penalties and fines. Changes in these regulations could impact the results of our operations. The FCC also regulates the ownership of television stations. Changes in the ownership rules could affect our ability to consummate future transactions. Details regarding regulation and its impact on our local media operations are provided in Item 1-Business beginning on page 4.
Loss of or changes in affiliation agreements could adversely affect operating results for our local media segment. Due to the quality of the programming provided by the networks, stations that are affiliated with a network generally have higher ratings than unaffiliated independent stations in the same market. As a result, it is important for stations to maintain their network affiliations. Most of our stations have network affiliation agreements. Seven are affiliated with CBS, three with Fox, two with MyNetworkTV, and one with NBC. These television networks produce and distribute programming in exchange for each of our stations' commitment to air the programming at specified times and for commercial announcement time during the programming. In most cases, we also make cash payments to the networks. These payments are in essence a portion of the retransmission fees that Meredith receives from cable, satellite, and telecommunications service providers, which pay Meredith to carry its local television programming in their markets. The non-renewal or termination of any of our network affiliation agreements would prevent us from being able to carry programming of the affiliate network. This loss of programming would require us to obtain replacement programming, which may involve higher costs and/or which may not be as attractive to our audiences, resulting in reduced revenues. Our CBS affiliation agreements expire in April 2016 and August 2017. Our two MyNetworkTV affiliation agreements expire in September 2016. Our NBC affiliation agreement and our Fox affiliation agreements each expire in December 2017.
Client relationships are important to our brand licensing and consumer relationship marketing businesses. Our ability to maintain existing client relationships and generate new clients depends significantly on the quality of our products and services, our reputation, and the continuity of Company and client personnel. Dissatisfaction with our products and services, damage to our reputation, or changes in key personnel could result in a loss of business.
11
Paper and postage prices are difficult to predict and control. Paper and postage represent significant components of our total cost to produce, distribute, and market our printed products. In fiscal 2014, these expenses accounted for 22 percent of national media's operating costs. Paper is a commodity and its price has been subject to significant volatility. All of our paper supply contracts currently provide for price adjustments based on prevailing market prices; however, we historically have been able to realize favorable paper pricing through volume discounts. The USPS distributes substantially all of our magazines and many of our marketing materials. Postal rates are dependent on the operating efficiency of the USPS and on legislative mandates imposed upon the USPS. Although we work with others in the industry and through trade organizations to encourage the USPS to implement efficiencies that will minimize rate increases, we cannot predict with certainty the magnitude of future price changes for paper and postage. Further, we may not be able to pass such increases on to our customers.
Acquisitions pose inherent financial and other risks and challenges. As a part of our strategic plan, we have acquired businesses and we expect to continue acquiring businesses in the future. These acquisitions can involve a number of risks and challenges, any of which could cause significant operating inefficiencies and adversely affect our growth and profitability. Such risks and challenges include underperformance relative to our expectations and the price paid for the acquisition; unanticipated demands on our management and operational resources; difficulty in integrating personnel, operations, and systems; retention of customers of the combined businesses; assumption of contingent liabilities; and acquisition-related earnings charges. If our acquisitions are not successful, we may record impairment charges. Our ability to continue to make acquisitions will depend upon our success at identifying suitable targets, which requires substantial judgment in assessing their values, strengths, weaknesses, liabilities and potential profitability, as well as the availability of suitable candidates at acceptable prices, and whether restrictions are imposed by regulations. Moreover, competition for certain types of acquisitions is significant, particularly in the fields of broadcast stations and interactive media. Even if successfully negotiated, closed, and integrated, certain acquisitions may not advance our business strategy and may fall short of expected return on investment targets.
Impairment of goodwill and intangible assets is possible, depending upon future operating results and the value of the Company's stock. We test our goodwill and intangible assets, including FCC licenses, for impairment during the fourth quarter of every fiscal year and on an interim basis if indicators of impairment exist. Factors which influence the evaluation include the Company's stock price and expected future operating results. If the carrying value of a reporting unit or an intangible asset is no longer deemed to be recoverable, a potentially material impairment charge could be incurred. At June 30, 2014, goodwill and intangible assets totaled $1.7 billion, or 66 percent of Meredith's total assets, with $955.3 million in the national media segment and $721.8 million in the local media segment. The review of goodwill is performed at the reporting unit level. The Company has three reporting units, local media, magazine brands, and MXM. As of May 31, 2014, the date that management last performed its annual review of impairment of goodwill and intangible assets, the fair value of the local media reporting unit significantly exceeded its net assets, the fair value of the magazine brands reporting unit exceeded its net assets by 20 percent, and the fair value of the MXM reporting unit exceeded its net assets by more than 40 percent. Changes in key assumptions about the economy or business prospects used to estimate fair value or other changes in market conditions could result in an impairment charge. Although these charges would be non-cash in nature and would not affect the Company's operations or cash flow, they would adversely affect stockholders' equity and reported results of operations in the period charged.
We have two classes of stock with different voting rights. We have two classes of stock: common stock and Class B stock. Holders of common stock are entitled to one vote per share and account for approximately 30 percent of the voting power. Holders of Class B stock are entitled to ten votes per share and account for the remaining 70 percent of the voting power. There are restrictions on who can own Class B stock. The majority of Class B shares are held by members of Meredith's founding family. Control by a limited number of holders may make the Company a less attractive takeover target, which could adversely affect the market price of our common stock. This
voting control also prevents other shareholders from exercising significant influence over certain of the Company's business decisions.
The preceding risk factors should not be construed as a complete list of factors that may affect our future operations and financial results. | ||
12
ITEM 1B. UNRESOLVED STAFF COMMENTS
None.
ITEM 2. PROPERTIES
Meredith is headquartered in Des Moines, IA. The Company owns buildings at 1716 and 1615 Locust Street and is the sole occupant of these buildings. The Company believes these facilities are adequate for their intended use.
The local media segment operates from facilities in the following locations: Atlanta, GA; Phoenix, AZ; Beaverton, OR; Rocky Hill, CT; Nashville, TN; Fairway, KS; St. Louis, MO; Greenville, SC; Henderson, NV; Springfield, MA; Saginaw, MI; and New York, NY. The Company believes these properties are adequate for their intended use. The properties in St. Louis, Springfield, and New York are leased, while the other properties are owned by the Company. Each of the broadcast stations also maintains one or more owned or leased transmitter sites.
The national media segment operates mainly from the Des Moines offices and from a leased facility in New York, NY. The New York facility is used primarily as advertising sales offices for all Meredith magazines and as headquarters for Family Circle, Parents, FamilyFun, American Baby, EveryDay with Rachael Ray, Fitness, More, and Siempre Mujer properties. Allrecipes.com operates out of leased space in Seattle, WA. We have also entered into leases for magazine editorial offices, customer relationship marketing operations, and national media sales offices in the states of California, Illinois, Massachusetts, Michigan, Texas, Vermont, and Virginia. The Company believes these facilities are sufficient to meet our current and expected future requirements.
ITEM 3. LEGAL PROCEEDINGS
There are various legal proceedings pending against the Company arising from the ordinary course of business. In the opinion of management, liabilities, if any, arising from existing litigation and claims are not expected to have a material effect on the Company's earnings, financial position, or liquidity.
ITEM 4. MINE SAFETY DISCLOSURES
Not applicable.
13
PART II | ||
ITEM 5. MARKET FOR REGISTRANT'S COMMON EQUITY, RELATED SHAREHOLDER MATTERS, AND ISSUER PURCHASES OF EQUITY SECURITIES
MARKET INFORMATION, DIVIDENDS, AND HOLDERS
The principal market for trading Meredith's common stock is the New York Stock Exchange (trading symbol MDP). There is no separate public trading market for Meredith's Class B stock, which is convertible share for share at any time into common stock. Holders of both classes of stock receive equal dividends per share.
The range of trading prices for the Company's common stock and the dividends per share paid during each quarter of the past two fiscal years are presented below.
High | Low | Dividends | |||||||||
Fiscal 2014 | |||||||||||
First Quarter | $ | 49.10 | $ | 42.44 | $ | 0.4075 | |||||
Second Quarter | 53.84 | 46.70 | 0.4075 | ||||||||
Third Quarter | 52.45 | 40.11 | 0.4325 | ||||||||
Fourth Quarter | 48.45 | 43.01 | 0.4325 | ||||||||
High | Low | Dividends | |||||||||
Fiscal 2013 | |||||||||||
First Quarter | $ | 37.84 | $ | 30.00 | $ | 0.3825 | |||||
Second Quarter | 35.79 | 29.27 | 0.3825 | ||||||||
Third Quarter | 45.95 | 33.52 | 0.4075 | ||||||||
Fourth Quarter | 48.37 | 36.06 | 0.4075 | ||||||||
Meredith stock became publicly traded in 1946, and quarterly dividends have been paid continuously since 1947. Meredith has increased our dividend for 21 consecutive years. It is currently anticipated that comparable dividends will continue to be paid in the future.
On July 31, 2014, there were approximately 1,165 holders of record of the Company's common stock and 605 holders of record of Class B stock.
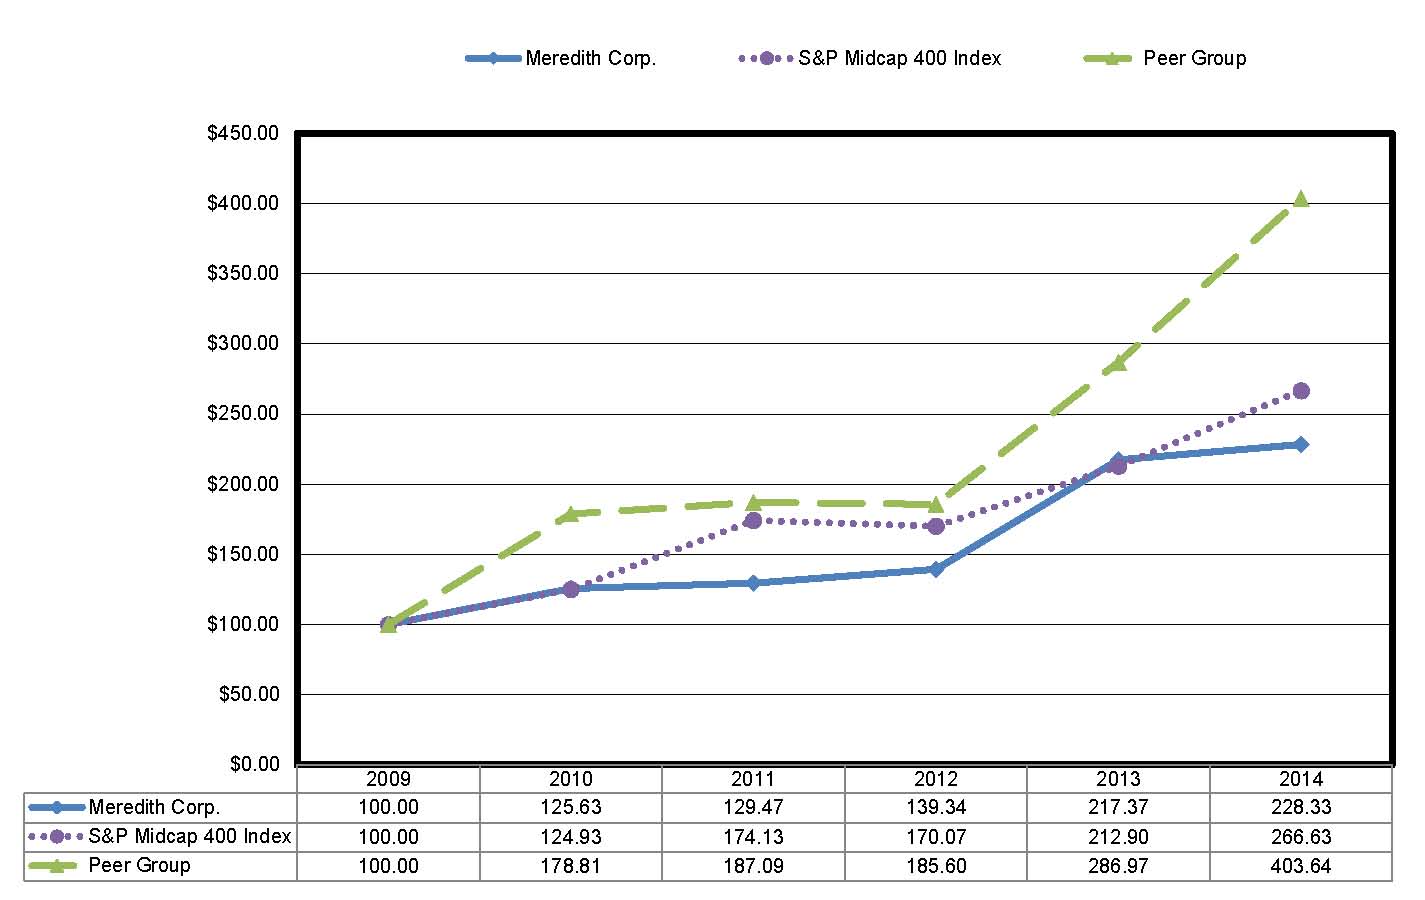
COMPARISON OF SHAREHOLDER RETURN
The following graph compares the performance of the Company's common stock during the period July 1, 2009, to June 30, 2014, with the Standard and Poor's (S&P) MidCap 400 Index and with a peer group of companies engaged in multimedia businesses primarily with publishing and/or television broadcasting in common with the Company.
The S&P MidCap 400 Index is comprised of 400 mid-sized U.S. companies with a market cap in the range of $1.2 billion to $5.1 billion in the financial, information technology, industrial, and consumer discretionary industries covering more than 7 percent of the U.S. equities market and is weighted by market capitalization. The Peer Group
14
selected by the Company for comparison, which is also weighted by market capitalization, is comprised of Gannett Co., Inc.; Graham Holding Company (formerly The Washington Post Company); Martha Stewart Living Omnimedia, Inc.; Media General, Inc.; and The E.W. Scripps Company. Belo Corp. was removed from our Peer group as it was acquired by Gannett Co., Inc. during fiscal 2014.
The graph depicts the results for investing $100 in the Company's common stock, the S&P MidCap 400 Index and the Peer Group at closing prices on June 30, 2009, assuming dividends were reinvested.
15
ISSUER PURCHASES OF EQUITY SECURITIES
The following table sets forth information with respect to the Company's repurchases of common stock during the quarter ended June 30, 2014.
Period | (a) Total number of shares purchased 1, 2, 3 | (b) Average price paid per share | (c) Total number of shares purchased as part of publicly announced programs | (d) Approximate dollar value of shares that may yet be purchased under the programs | |||||||||||
(in thousands) | |||||||||||||||
April 1 to April 30, 2014 | 6,948 | $ | 45.12 | 3,692 | $ | 15,628 | |||||||||
May 1 to May 31, 2014 | 154,071 | 45.00 | 94,889 | 111,375 | |||||||||||
June 1 to June 30, 2014 | 70,656 | 44.70 | 70,076 | 108,243 | |||||||||||
Total | 231,675 | 44.92 | 168,657 | ||||||||||||
1 | Total number of shares purchased includes the purchase of 282 shares of Class B common stock in June 2014. |
2 | The number of shares purchased includes 3,692 shares in April 2014, 9,237 shares in May 2014, and 93 shares in June 2014 delivered or deemed to be delivered to us in satisfaction of tax withholding on option exercises and the vesting of restricted shares. These shares are included as part of our repurchase program and reduce the repurchase authority granted by our Board. The number of shares repurchased excludes shares we reacquired pursuant to forfeitures of restricted stock. |
3 | The number of shares purchased includes 3,256 shares in April 2014, 59,182 shares in May 2014, and 580 shares in June 2014 deemed to be delivered to us on tender of stock in payment for the exercise price of options. Effective July 1, 2013, these shares are no longer included as part of our repurchase program and thus they do not reduce the repurchase authority granted by our Board. |
In October 2011, the Board of Directors authorized the repurchase of up to $100.0 million in shares of the Company's stock through public and private transactions. In May 2014, the Board authorized an additional $100.0 million in shares for repurchase.
Effective July 1, 2013, shares that are deemed to be delivered to us on tender of stock in payment for the exercise price of options do not reduce the repurchase authority granted by our Board. Shares delivered or deemed to be delivered to us in satisfaction of tax withholding on option exercises and the vesting of restricted shares continue to reduce the repurchase authority granted by our Board.
For more information on the Company's share repurchase program, see Item 7-Management's Discussion and Analysis of Financial Condition and Results of Operations, under the heading "Share Repurchase Program" on page 33.
ITEM 6. SELECTED FINANCIAL DATA
Selected financial data for the fiscal years 2010 through 2014 is contained under the heading "Five-Year Financial History with Selected Financial Data" beginning on page 79 and is derived from consolidated financial statements for those years. Information contained in that table is not necessarily indicative of results of operations in future years and should be read in conjunction with Item 7-Management's Discussion and Analysis of Financial Condition and Results of Operations and Item 8-Financial Statements and Supplementary Data of this Form 10-K.
16
ITEM 7. MANAGEMENT'S DISCUSSION AND ANALYSIS OF FINANCIAL CONDITION AND RESULTS OF OPERATIONS
Management's Discussion and Analysis of Financial Condition and Results of Operations (MD&A) consists of the following sections:
MD&A should be read in conjunction with the other sections of this Form 10-K, including Item 1-Business, Item 6-Selected Financial Data, and Item 8-Financial Statements and Supplementary Data. MD&A contains forward-looking statements within the meaning of the Private Securities Litigation Reform Act of 1995. These statements are based upon our current expectations and could be affected by many risks, uncertainties, and changes in circumstances including the uncertainties and risk factors described throughout this filing, particularly in Item 1A-Risk Factors. Important factors that could cause actual results to differ materially from those described in forward-looking statements are set forth under the heading “Forward Looking Statements." in Item 1-Business.
EXECUTIVE OVERVIEW
Meredith Corporation has been committed to service journalism for more than 110 years. Today, Meredith uses multiple media outlets—including print, broadcast television, digital, mobile, tablets, and video—to provide consumers with content they desire and to deliver the messages of its advertising and marketing partners.
Meredith operates two business segments. The local media segment includes 15 owned or operated television stations reaching 10 percent of U.S. households. Meredith’s portfolio is concentrated in large, fast-growing markets, with seven stations in the nation’s Top 25—including Atlanta, Phoenix, and Portland—and 13 in Top 50 markets. Meredith’s stations produce approximately 525 hours of local news and entertainment content each week, and operate leading local digital destinations. Additionally, MVS produces The Better Show, a syndicated daily lifestyle television program reaching 80 percent of U.S. TV households.
Meredith’s national media segment reaches 100 million unduplicated American women, including 60 percent of millennial women. Meredith is the leader in creating content across media platforms in key consumer interest areas such as food, home, parenthood, and health through well-known brands such as Better Homes and Gardens, Parents, and Allrecipes. The national media segment features robust brand licensing activities, including over 3,000 SKUs of branded products at 4,000 Walmart stores across the U.S. MXM provides expertise in mobile, social media, customer relationship management, and advanced analytics for many of the nation’s top companies and brands.
Both segments operate primarily in the U.S. and compete against similar media and other types of media on both a local and national basis. In fiscal 2014, the national media segment accounted for 73 percent of the Company's $1.5 billion in revenues while local media segment revenues contributed 27 percent.
17
Meredith's balanced portfolio consistently generates substantial free cash flow, and the Company is committed to growing Total Shareholder Return (TSR) through dividend payments, share repurchases, and strategic business investments. Meredith’s current annualized dividend of $1.73 per share yields approximately 4 percent. Meredith has paid a dividend for 67 straight years and increased it for 21 consecutive years.
In Fiscal 2014, we aggressively executed on our TSR strategy by deploying capital in high cash flow businesses and growing the amount of cash returned to our shareholders. For example, we added great new television stations to our local media portfolio; executed a number of initiatives to strengthen and grow our national media segment; increased our dividend; and expanded our share repurchase program. Fiscal 2014 highlights include:
Strengthening of our portfolio of media businesses through acquisitions and new launches. For example, we:
• | Executed agreements to buy the broadcast assets of stations in three markets - KTVK, an independent station in Phoenix, the nation's 12th largest television market; KMOV, the CBS affiliate in St. Louis, the nation’s 21st largest television market; and WGGB, the ABC affiliate in Springfield, Massachusetts. The KTVK and KMOV acquisitions closed in fiscal 2014 and the WGGB acquisition is expected to close in the first quarter of fiscal 2015. |
• | Successfully launched Allrecipes magazine, which Media Industry Newsletter called the “Hottest Launch of the Year.” |
• | Strengthened our parenthood activities by integrating the Parenting and Baby Talk brands that we acquired late in fiscal 2013. In the spring of fiscal 2015, we expect to launch an English-language parenting magazine for U.S. Hispanic moms called Parents Latina. |
Growing revenues and operating profit from activities that are not dependent on advertising. We delivered significant growth in retransmission-related revenues and profit in our local media segment. Within our national media segment, we grew revenues related to circulation and brand licensing, while MXM solidified its relationship with its top 10 clients.
Proving the effectiveness of advertising on both broadcast and print platforms. Broadcast television continues to demonstrate its unique effectiveness to local advertisers as we delivered 8 percent growth in local media non-political advertising. Our national media segment was named “Advertisers’ Favorite Media Company” for the second time in four years by Advertiser Perceptions, which annually surveys thousands of leading advertising agencies and marketers.
Finally, in fiscal 2014 we again successfully executed our TSR strategy. We increased our dividend another 6 percent in fiscal 2014 and we repurchased 1.6 million shares. We also invested more than $400 million in growing the television side of our business.
Going forward, we are aggressively pursuing these parallel paths designed to accelerate revenue growth and increase operating profit margins and cash flow over time:
• | First, we are working to grow our existing businesses organically. This includes our magazine, television, digital, licensing, and marketing services businesses. |
• | Second, we are pursuing opportunities to add to our portfolio in both our national and local media groups. |
• | Third, we are aggressively managing costs; and |
• | Finally, we are executing our TSR Strategy, as highlighted by our established pattern of dividend increases and corresponding very attractive yield; share repurchase authorizations and buybacks; and our accretive acquisitions in both segments. |
18
LOCAL MEDIA
Local media derives the majority of its revenues—73 percent in fiscal 2014—from the sale of advertising both over the air and on our stations' websites and apps. The remainder comes from television retransmission fees, station operation management fees, television production services, and other services.
The stations sell advertising to both local/regional and national accounts. Political advertising revenues are cyclical in that they are significantly greater during biennial election campaigns (which take place primarily in odd-numbered fiscal years) than at other times. MVS produces video content for Meredith stations, non-Meredith stations, online distribution, and corporate customers. We have generated additional revenues from internet activities and programs focused on local interests such as community events and college and professional sports.
Changes in advertising revenues tend to correlate with changes in the level of economic activity in the U.S. and in the local markets in which we operate stations, and with the cyclical changes in political advertising discussed previously. Programming content, audience share, audience demographics, and the advertising rates charged relative to other available advertising opportunities also affect advertising revenues. On occasion, unusual events necessitate uninterrupted television coverage and will adversely affect spot advertising revenues.
Local media's major expense categories are employee compensation and programming fees paid to the networks. Employee compensation represented 44 percent of local media's operating expenses in fiscal 2014. Compensation expense is affected by salary and incentive levels, the number of employees, the costs of our various employee benefit plans, and other factors. Programming fees paid to the networks represented 16 percent of this segment's fiscal 2014 expenses. Sales and promotional activities, costs to produce local news programming, and general overhead costs for facilities and technical resources accounted for most of the remaining 40 percent of local media's fiscal 2014 operating expenses.
NATIONAL MEDIA
Advertising revenues made up 45 percent of fiscal 2014 national media revenues. These revenues were generated from the sale of advertising space in our magazines and on our websites to clients interested in promoting their brands, products, and services to consumers. Changes in advertising revenues tend to correlate with changes in the level of economic activity in the U.S. Indicators of economic activity include changes in the level of gross domestic product, consumer spending, housing starts, unemployment rates, auto sales, and interest rates. Circulation levels of Meredith's magazines, reader demographic data, and the advertising rates charged relative to other comparable available advertising opportunities also affect the level of advertising revenues.
Circulation revenues accounted for 31 percent of fiscal 2014 national media revenues. Circulation revenues result from the sale of magazines to consumers through subscriptions and by single copy sales on newsstands in print form, primarily at major retailers and grocery/drug stores, and in digital form on tablets and other media devices. In the short term, subscription revenues, which accounted for 81 percent of circulation revenues, are less susceptible to economic changes because subscriptions are generally sold for terms of one to three years. The same economic factors that affect advertising revenues also can influence consumers' response to subscription offers and result in lower revenues and/or higher costs to maintain subscriber levels over time. A key factor in our subscription success is our industry-leading database. It contains approximately 100 million entries that include information on about three-quarters of American homeowners, which includes 60 percent of millennial women, providing an average of 800 data points for each name. The size and depth of our database is a key to our circulation model and allows more precise consumer targeting. Newsstand revenues are more volatile than subscription revenues and can vary significantly month to month depending on economic and other factors.
The remaining 24 percent of national media revenues came from a variety of activities that included the sale of customer relationship marketing products and services and books as well as brand licensing, product sales, and other related activities. MXM offers integrated promotional, database management, relationship, and direct
19
marketing capabilities for corporate customers, both in printed and digital forms. These other revenues are generally affected by changes in the level of economic activity in the U.S. including changes in the level of gross domestic product, consumer spending, unemployment rates, and interest rates.
National media's major expense categories are production and delivery of publications and promotional mailings and employee compensation costs. Paper, postage, and production charges represented 31 percent of the segment's operating expenses in fiscal 2014. The price of paper can vary significantly on the basis of worldwide demand and supply for paper in general and for specific types of paper used by Meredith. The printing of our publications is outsourced. We typically have multi-year contracts for the printing of our magazines, a practice which reduces price fluctuations over the contract term. Postal rates are dependent on the operating efficiency of the USPS and on legislative mandates imposed on the USPS. The USPS increased rates most recently in January 2014. At this time, the USPS has not proposed any future rate increases other than making permanent a previous rate increase of 4.3 percent that is currently set to phase out once USPS loses have been recovered. Meredith works with others in the industry and through trade organizations to encourage the USPS to implement efficiencies and contain rate increases.
Employee compensation, which includes benefits expense, represented 26 percent of national media's operating expenses in fiscal 2014, and is affected by the same factors noted for local media.The remaining 43 percent of fiscal 2014 national media expenses included costs for magazine newsstand and book distribution, advertising and promotional efforts, and overhead costs for facilities and technology services.
FISCAL 2014 FINANCIAL OVERVIEW
• | Meredith completed its acquisition of KMOV, the CBS affiliate in St. Louis, Missouri in February 2014 and completed its acquisition of KTVK, an independent station in Phoenix, Arizona in June 2014. |
• | In February 2014, the Company entered into a $150 million note purchase agreement. Proceeds were used for the acquisition of KMOV. |
• | In March 2014, Meredith entered into a credit agreement that provides a revolving credit facility of $200 million and a term loan of $250 million, both of which expire in March 2019. The term loan was used to fund the purchase of the acquisition of the KTVK and an interest in certain of KASW's broadcast assets. Our prior revolving credit facility was paid off in March 2014. |
• | Local media revenues increased 7 percent in fiscal 2014 as revenues from the station acquisitions and strong increases in other revenues more than offset a $34.1 million reduction in political advertising, which is expected in a non-political year. Local media operating profit declined 9 percent in fiscal 2014. The local media segment recorded $5.5 million in acquisition costs that were expensed during the year. |
• | National media revenues declined 3 percent from the prior year as declines in our magazine operations of $29.1 million and in our integrated marketing operations of $5.2 million more than offset increased revenues in our licensing operations of $3.9 million. National media operating profit declined 18 percent due primarily to a larger restructuring charge in the current year of $20.8 million as compared to the prior year restructuring charge of $6.4 million. In addition, decreases in the operating profit of our magazine operations of $23.8 million more than offset improved operating results in our interactive media operations of $8.6 million and our licensing operations of $3.9 million. |
• | During fiscal 2014, management committed to several performance improvement plans related primarily to business realignments including integration of local media acquisitions, converting Ladies' Home Journal from a monthly subscription magazine to a newsstand only quarterly special interest publication, the closing of our medical sales force training business, and other selected workforce reductions. In connection with these plans, the Company recorded a pre-tax restructuring charge of $24.5 million. This charge |
20
includes $11.9 million for severance and related benefit costs, $10.3 million for the impairment of intangible assets, the write-down of fixed assets of $0.9 million, vacated building and lease accruals of $0.7 million, and other accruals and write-downs of $0.7 million. The Company also recorded $1.4 million in reversals of excess restructuring reserves accrued in prior years.
• | Diluted earnings per share decreased 9 percent to $2.50 from $2.74 in fiscal 2013. |
• | In fiscal 2014, we generated $178.1 million in operating cash flows, invested $417.5 million in acquisitions of and investments in businesses, and invested $24.8 million in capital improvements. |
RESULTS OF OPERATIONS
Years ended June 30, | 2014 | Change | 2013 | Change | 2012 | ||||||||||||
(In millions except per share data) | |||||||||||||||||
Total revenues | $ | 1,468.7 | 0 | % | $ | 1,471.3 | 7 | % | $ | 1,376.7 | |||||||
Costs and expenses | 1,222.3 | 1 | % | 1,215.1 | 6 | % | 1,146.6 | ||||||||||
Depreciation and amortization | 59.9 | 32 | % | 45.4 | 2 | % | 44.3 | ||||||||||
Total operating expenses | 1,282.2 | 2 | % | 1,260.5 | 6 | % | 1,190.9 | ||||||||||
Income from operations | $ | 186.5 | (12 | )% | $ | 210.8 | 13 | % | $ | 185.8 | |||||||
Net earnings | $ | 113.5 | (8 | )% | $ | 123.7 | 18 | % | $ | 104.4 | |||||||
Diluted earnings per share | 2.50 | (9 | )% | 2.74 | 19 | % | 2.31 | ||||||||||
OVERVIEW
Following are brief descriptions of recent acquisitions and a discussion of the trends and uncertainties that affected our businesses. Following the Overview is an analysis of the results of operations for the local media and national media segments and an analysis of our consolidated results of operations for the last three fiscal years.
Acquisitions
The Company completed its acquisition of KMOV in February 2014 and its acquisition of KTVK in June 2014. In fiscal 2013, we acquired Parenting and Babytalk magazines and related digital assets and the remaining interest in Living the Country Life, LLC. Effective July 1, 2011, Meredith acquired EatingWell Media Group. Also during fiscal 2012, we completed the following acquisitions: the October 2011 acquisition of EveryDay with Rachael Ray magazine and its related digital assets, the January 2012 acquisition of FamilyFun and its related assets, the March 2012 acquisition of Allrecipes.com, and the May 2012 acquisition of ShopNation. These acquisitions were not material to our consolidated financial statements. The results of these acquisitions have been included in the Company's consolidated operating results since their respective acquisition dates. See Note 2 to the consolidated financial statements for further information.
Trends and Uncertainties
Advertising demand is the Company's key uncertainty, and its fluctuation from period to period can have a material effect on operating results. Advertising revenues accounted for 53 percent of total revenues in fiscal 2014. Other significant uncertainties that can affect operating results include fluctuations in the cost of paper, postage rates and, over time, television programming rights. The Company's cash flows from operating activities, our primary source of liquidity, is adversely affected when the advertising market is weak or when costs rise. One of our priorities is to manage our businesses prudently during expanding and contracting economic cycles to maximize shareholder return over time. To manage the uncertainties inherent in our businesses, we prepare monthly internal forecasts of
21
anticipated results of operations and monitor the economic indicators mentioned in the Executive Overview. See Item 1A-Risk Factors in this Form 10-K for further discussion.
LOCAL MEDIA
The following discussion reviews operating results for the Company's local media segment, which consists of 14 owned television stations and one managed station, related digital and mobile media, and video creation operations. The local media segment contributed 27 percent of Meredith's consolidated revenues and 50 percent of the combined operating profit from local media and national media operations in fiscal 2014.
Local media revenues increased 7 percent in fiscal 2014 as revenues from the station acquisitions and strong increases in other revenues more than offset a $34.1 million reduction in political advertising, which is expected in a non-political year. Local media operating profit declined 9 percent in fiscal 2014.
Local media revenues increased 19 percent in fiscal 2013 as both political advertising and other revenues increased significantly. Local media operating profit increased 41 percent in fiscal 2013 on the strength of political advertising and other revenues.
Local media operating results for the last three fiscal years were as follows:
Years ended June 30, | 2014 | Change | 2013 | Change | 2012 | ||||||||||||
(In millions) | |||||||||||||||||
Revenues | $ | 402.8 | 7 | % | $ | 376.1 | 19 | % | $ | 316.3 | |||||||
Operating expenses | (289.7 | ) | 15 | % | (252.0 | ) | 11 | % | (228.0 | ) | |||||||
Operating profit | $ | 113.1 | (9 | )% | $ | 124.1 | 41 | % | $ | 88.3 | |||||||
Local Media Revenues
The table below presents the components of revenues for the last three fiscal years.
Years ended June 30, | 2014 | Change | 2013 | Change | 2012 | ||||||||||||
(In millions) | |||||||||||||||||
Revenues | |||||||||||||||||
Non-political advertising | $ | 290.7 | 8 | % | $ | 268.8 | (1 | )% | $ | 270.7 | |||||||
Political advertising | 4.9 | (87 | )% | 39.0 | 476 | % | 6.8 | ||||||||||
Other | 107.2 | 57 | % | 68.3 | 76 | % | 38.8 | ||||||||||
Total revenues | $ | 402.8 | 7 | % | $ | 376.1 | 19 | % | $ | 316.3 | |||||||
Local media revenues increased 7 percent in fiscal 2014. Non-political advertising revenues increased 8 percent in fiscal 2014 as compared to the prior year primarily due to the addition of local media acquisitions non-political revenue of $14.7 million. Local non-political advertising revenues increased 8 percent. National non-political advertising increased 5 percent in fiscal 2014. Political advertising revenues totaled $4.9 million in fiscal 2014 compared with $39.0 million in the prior year. Fluctuations in political advertising revenues at our stations and throughout the broadcasting industry generally follow the biennial cycle of election campaigns (which take place primarily in our odd-numbered fiscal years). Political advertising may displace a certain amount of non-political advertising; therefore, the revenues may not be entirely incremental. The automotive, telecommunications, and retail categories were stronger, while the electronics, drug, and education categories were weaker. Online advertising revenues grew more than 15 percent in fiscal 2014 driven by increased traffic across the desktop and video platforms, the launch of new mobile apps, and addition of local media acquisitions. Other revenue, which was
22
primarily retransmission fees from cable and satellite operators and station management fees, grew significantly in fiscal 2014 primarily reflecting increased retransmission fees due to having a full year of benefit from agreements that were renegotiated in fiscal 2013.
Local media total revenues increased 19 percent in fiscal 2013, reflecting higher political advertising related to the November 2012 elections. Political advertising revenues totaled $39.0 million in fiscal 2013 compared with $6.8 million in the prior year. Non-political advertising revenues decreased 1 percent in fiscal 2013 as political advertising displaced some non-political advertising. Local non-political advertising revenues decreased 2 percent in fiscal 2013. National non-political advertising revenues increased 1 percent as compared to the prior year. In fiscal 2013, the automotive, furnishings, and media categories were stronger. Online advertising revenues, a small but growing percentage of non-political advertising revenues, increased 8 percent as compared to the prior year. Other revenue increased significantly in fiscal 2013 primarily reflecting increased retransmission fees.
Local Media Operating Expenses
Local media operating expenses increased 15 percent in fiscal 2014 primarily due to increased programming fees paid to the networks of $14.8 million, the addition of local media acquisition expenses of $14.1 million, transaction costs related to the acquisitions of $5.5 million, higher payroll and related costs of $2.8 million partially offset by lower legal service costs of $3.6 million. In fiscal 2014, the local media segment recorded a restructuring charge of $3.7 million including severance and related benefit costs of $3.4 million and an accrual to vacate a building of $0.3 million.
Fiscal 2013 local media operating expenses increased 11 percent as compared to the prior year primarily due to increased programming fees paid to the networks of $25.4 million partially offset by a reduction in film amortization expense of $2.3 million. In fiscal 2013, the local media segment recorded a restructuring charge of $1.5 million for severance and related benefits costs.
Local Media Operating Profit
Local media operating profit declined 9 percent in fiscal 2014 compared with fiscal 2013 primarily due to a change in the mix of revenues from higher margin political advertising revenues to lower margin other revenues and increased operating expenses as discussed above.
Fiscal 2013 local media operating profit increased 41 percent as compared to fiscal 2012. The increase was primarily due to the strength of political advertising revenues and higher other revenues partially offset by increased programming fees paid to the networks.
NATIONAL MEDIA
The following discussion reviews operating results for our national media segment, which includes magazine publishing, digital and customer relationship marketing, digital and mobile media, brand licensing, database-related activities, and other related operations. The national media segment contributed 73 percent of Meredith's consolidated revenues and 50 percent of the combined operating profit from local media and national media operations in fiscal 2014.
23
In fiscal 2014, national media revenues declined 3 percent and segment operating profit decreased 18 percent. In fiscal 2013, national media revenues increased 3 percent while segment operating profit grew 4 percent. National media operating results for the last three fiscal years were as follows:
Years ended June 30, | 2014 | Change | 2013 | Change | 2012 | ||||||||||||
(In millions) | |||||||||||||||||
Revenues | $ | 1,065.9 | (3 | )% | $ | 1,095.2 | 3 | % | $ | 1,060.4 | |||||||
Operating expenses | (952.8 | ) | 0 | % | (957.2 | ) | 3 | % | (927.4 | ) | |||||||
Operating profit | $ | 113.1 | (18 | )% | $ | 138.0 | 4 | % | $ | 133.0 | |||||||
National Media Revenues
The table below presents the components of revenues for the last three fiscal years.
Years ended June 30, | 2014 | Change | 2013 | Change | 2012 | ||||||||||||
(In millions) | |||||||||||||||||
Revenues | |||||||||||||||||
Advertising | $ | 482.8 | (6 | )% | $ | 515.8 | 5 | % | $ | 492.3 | |||||||
Circulation | 327.2 | 2 | % | 322.2 | 13 | % | 285.3 | ||||||||||
Other | 255.9 | 0 | % | 257.2 | (9 | )% | 282.8 | ||||||||||
Total revenues | $ | 1,065.9 | (3 | )% | $ | 1,095.2 | 3 | % | $ | 1,060.4 | |||||||
Advertising Revenue
The following table presents advertising page information according to Publishers Information Bureau for our major subscription-based magazines for the last three fiscal years:
Years ended June 30, | 2014 | Change | 2013 | Change | 2012 | |||||||||
Parents | 1,256 | 2 | % | 1,231 | (1 | )% | 1,248 | |||||||
Better Homes and Gardens | 1,174 | (7 | )% | 1,263 | (11 | )% | 1,416 | |||||||
Family Circle | 962 | (16 | )% | 1,147 | (15 | )% | 1,343 | |||||||
Fitness | 729 | (5 | )% | 766 | (5 | )% | 805 | |||||||
EveryDay with Rachael Ray ¹ | 628 | (3 | )% | 645 | n/m | 335 | ||||||||
More | 611 | (11 | )% | 685 | (6 | )% | 725 | |||||||
FamilyFun ¹ | 543 | (3 | )% | 558 | n/m | 165 | ||||||||
Ladies' Home Journal | 517 | (26 | )% | 703 | (17 | )% | 844 | |||||||
Traditional Home | 495 | (12 | )% | 562 | 2 | % | 553 | |||||||
Midwest Living | 402 | 5 | % | 382 | (4 | )% | 398 | |||||||
American Baby | 348 | (6 | )% | 370 | (16 | )% | 439 | |||||||
EatingWell | 293 | 31 | % | 223 | 10 | % | 203 | |||||||
¹ Since date of acquisition in fiscal 2012 | ||||||||||||||
n/m - Not meaningful | ||||||||||||||
National media advertising revenues decreased 6 percent in fiscal 2014. Magazine advertising revenues declined 7 percent. Total advertising pages decreased in the high-single digits on a percentage basis in fiscal 2014 with most of our titles showing declines. Among our advertising categories, direct response and non-prescription drugs showed strength while demand was weaker for toiletries and cosmetics, food and beverage, and retail. Online advertising revenues in our digital and mobile media operations declined 1 percent in fiscal 2014.
24
National media advertising revenues increased 5 percent in fiscal 2013. Magazine advertising revenues declined 2 percent in fiscal 2013 as compared to fiscal 2012. Total advertising pages decreased in the low-single digits on a percentage basis. Excluding advertising revenues and pages from acquisitions completed by the national media segment during fiscal 2012, magazine advertising revenues and advertising pages decreased 9 percent in fiscal 2013 with most titles showing declines. Among our core advertising categories, demand was weaker for the majority of categories. Online advertising revenues in our digital and mobile media operations increased more than 60 percent in fiscal 2013. Excluding online advertising revenues from acquisitions completed by the national media segment during fiscal 2012, online advertising revenues increased 8 percent in fiscal 2013.
Circulation Revenues
Magazine circulation revenues increased 2 percent in fiscal 2014. While subscription revenues increased in the low-single digits, newsstand revenues declined in the high-single digits. The increase in subscription revenues is primarily due to the additional distribution of the recently launched Allrecipes magazine with Meredith's legacy titles and the additional subscribers obtained through the acquisition of Parenting and Babytalk magazines. The decline in newsstand revenues is primarily due to weakness in special interest media and other titles.
Magazine circulation revenues increased 13 percent in fiscal 2013. Excluding circulation revenues from acquisitions completed by the national media segment during fiscal 2012, magazine circulation revenues increased 6 percent as subscription revenues grew 10 percent while newsstand revenues declined 6 percent. The increase in subscription revenues is primarily due to a test issue of a magazine based on the Allrecipes brand and growth in our legacy titles.
Other Revenues
Other revenues were flat in fiscal 2014. MXM revenues decreased in the mid-single digits in fiscal 2014 due primarily to weakness in our health and digital customer relation marketing practices. Brand licensing revenues grew approximately 10 percent primarily due to continued strong sales of Better Homes and Gardens’ licensed products at Walmart stores.
Fiscal 2013 other revenues decreased 9 percent. MXM revenues were down approximately 10 percent in fiscal 2013 due primarily to reductions in programs from certain clients. In addition, other revenues declined primarily due to lower sales of books. Brand licensing revenues grew 7 percent in fiscal 2013.
National Media Operating Expenses
National media operating expenses were flat in fiscal 2014. Fiscal 2014 paper costs declined $9.6 million primarily due to the decrease in printing volumes. In addition to the decrease in the volume of paper used, paper expense also decreased due to a mid-single digit decline in average paper prices as compared to the prior year. Payroll and related costs were down $7.9 million due primarily to actions taken in the prior year. Postage and other delivery and fulfillment costs declined $5.9 million and editorial costs declined by $4.5 million. Performance-based incentive accruals decreased by $5.1 million. Mostly offsetting these declines were increases in circulation expenses of $10.1 million and paid search costs of $3.2 million. Circulation expenses rose due to an increase in agent expenses.
In addition, in fiscal 2014, the national media segment recorded a $20.8 million restructuring charge. This compares to a $6.4 million restructuring charge recorded by national media in fiscal 2013. The $20.8 million restructuring charge included the impairment of intangible assets of $10.3 million, severance and related benefit costs of $8.5 million, the write-down of fixed assets of $0.9 million, a vacated lease accrual of $0.4 million, and other accruals and write-downs of $0.7 million. Partially offsetting these charges was a $1.1 million reversal of excess restructuring accrual previously recorded by the national media segment.
National media operating expenses increased 3 percent in fiscal 2013 primarily due to operating expenses related to acquisitions completed by the national media segment during fiscal 2012 increasing $72.1 million and circulation expenses increasing $12.6 million. These increases were partially offset by declines in paper of $15.4 million,
25
processing of $6.6 million, postage and other delivery costs of $4.4 million, and editorial costs of $2.1 million primarily due to the decrease in advertising pages. In addition to the decrease in the volume of paper used, paper expense also decreased due to a mid-single digit decline in average paper prices as compared to the prior year. In accord with the decrease in MXM's revenues, customer relationship marketing production expenses declined $14.3 million. Net restructuring costs declined $6.5 million in fiscal 2013 and there was a lack of acquisition costs in fiscal 2013 compared to $2.7 million of acquisition costs incurred in fiscal 2012.
National Media Operating Profit
National media operating profit decreased 18 percent in fiscal 2014. The decrease in operating profit was primarily due to a larger restructuring charge recorded in fiscal 2014 as compared to the restructuring charge recorded in fiscal 2013. In addition, decreases in the operating profit of our magazine operations of $23.8 million more than offset improved operating results in our interactive media operations of $8.6 million and our licensing operations of $3.9 million.
In fiscal 2013, national media operating profit grew 4 percent compared with the prior year primarily due to there being lower restructuring charges recorded in fiscal 2013 than were recorded in fiscal 2012 and the lack of acquisition expenses in fiscal 2013. In addition, operating profit from acquisitions completed by the national media segment during fiscal 2012 increased $6.6 million and brand licensing operations operating profit increased by $2.8 million. These increases were partially offset by declines in operating profit of our magazine operations of $10.2 million and customer relationship marketing operations of $2.0 million.
UNALLOCATED CORPORATE EXPENSES
Unallocated corporate expenses are general corporate overhead expenses not attributable to the operating groups. These expenses for the last three fiscal years were as follows:
Years ended June 30, | 2014 | Change | 2013 | Change | 2012 | |||||||||||||||
(In millions) | ||||||||||||||||||||
Unallocated corporate expenses | $ | 39.7 | (23 | )% | $ | 51.3 | 44 | % | $ | 35.5 | ||||||||||
Unallocated corporate expenses decreased 23 percent in fiscal 2014 as fiscal 2013 results included a charge of $5.1 million for professional fees and expenses related to a strategic transaction that did not materialize. Decreases in investment spending in Next Issue Media of $4.1 million and charitable contributions of $1.5 million also contributed to the decline.
Unallocated corporate expenses increased 44 percent in fiscal 2013 compared with the prior year. Fiscal 2013 results included a charge of $5.1 million for professional fees and expenses related to a strategic transaction that did not materialize. In addition, increases in performance-based incentive accruals of $3.4 million; medical, pension, and other benefit costs of $2.8 million; consulting costs of $2.6 million; and investment spending in Next Issue Media of $1.5 million were partially offset by a reduction in building rent of $1.6 million.
26
CONSOLIDATED
Consolidated Operating Expenses
Consolidated operating expenses for the last three fiscal years were as follows:
Years ended June 30, | 2014 | Change | 2013 | Change | 2012 | ||||||||||||
(In millions) | |||||||||||||||||
Production, distribution, and editorial | $ | 567.0 | 1 | % | $ | 561.1 | 2 | % | $ | 547.6 | |||||||
Selling, general, and administrative | 655.2 | 0 | % | 654.1 | 9 | % | 599.0 | ||||||||||
Depreciation and amortization | 59.9 | 32 | % | 45.4 | 2 | % | 44.3 | ||||||||||
Operating expenses | $ | 1,282.2 | 2 | % | $ | 1,260.5 | 6 | % | $ | 1,190.9 | |||||||
Production, Distribution, and Editorial Costs
Fiscal 2014 production, distribution, and editorial costs increased 1 percent. Increases in programming fees paid to the networks of $14.8 million and the addition of local media acquisition expenses of $6.1 million offset declines in national media paper costs of $9.6 million, postage and other delivery and fulfillment costs of $5.9 million, and editorial costs of $4.5 million.
Production, distribution, and editorial costs increased 2 percent in fiscal 2013 as compared to the prior year. Programming fees paid to the networks increased $25.4 million and expenses related to acquisitions completed by the national media segment during fiscal 2012 increased $24.7 million. These increases were partially offset by declines in national media paper of $15.4 million, processing of $6.6 million, postage and other delivery expenses of $4.4 million, and editorial costs of $2.1 million; customer relationship marketing production costs of $5.9 million; and local media film amortization of $2.3 million.
Selling, General, and Administrative Expenses
Fiscal 2014 selling, general, and administrative expenses were flat as compared to the prior year. In fiscal 2014, the Company recorded a $13.1 million restructuring charge. This compares to a $7.8 million restructuring charge recorded in fiscal 2013. The $13.1 million restructuring charge recorded in fiscal 2014 including severance and related benefit costs of $11.9 million, vacated building and lease accruals of $0.7 million, and other accruals of $0.5 million. Partially offsetting these charges was a $1.4 million reversal of excess restructuring accrual previously accrued.
Circulation expenses rose $10.1 million in fiscal 2014. The addition of local media acquisition expenses added $5.3 million. Declines in performance-based incentive accruals of $6.3 million, expenses related to a fiscal 2013 strategic transaction that did not materialize of $5.1 million, investment spending in Next Issue Media of $4.1 million, local media legal costs of $3.6 million, employee compensation costs of $2.5 million, favorable curtailment credit related to our postretirement benefit plan of $1.5 million, and charitable contributions of $1.5 million mostly offset the increases.
Selling, general, and administrative expenses increased 9 percent in fiscal 2013. During fiscal 2013, the Company recorded a restructuring charge of $7.8 million, including $7.4 million for severance and related benefit costs and a vacated lease accrual of $0.4 million related to business realignments. Partially offsetting these charges was an $0.8 million reversal of excess restructuring accrual previously accrued. Fiscal 2013 results also included a charge of $5.1 million for professional fees and expenses related to a strategic transaction that did not materialize.
In addition, contributing to the increase were expenses from acquisitions completed by the national media segment during fiscal 2012 of $44.4 million; circulation expenses of $12.6 million; medical, pension, and other benefit costs of $7.3 million; performance-based incentive accruals of $6.0 million; and consulting costs of $2.2 million. These increases were partially offset by reductions in customer relationship marketing selling expenses of $6.3 million,
27
net restructuring costs of $6.2 million, employee compensation costs of $4.3 million, and acquisition costs $2.7 million.
Depreciation and Amortization
Depreciation and amortization expense increased 32 percent in fiscal 2014. Due to restructuring plans committed to by management during fiscal 2014, trademarks of $9.5 million and customer lists of $0.8 million were deemed to be impaired and were written off. In addition, the Company recorded an impairment charge of $0.9 million on fixed assets primarily due to the closing of the Company's medical sales force training business. Excluding these impairments, depreciation and amortization expense increased primarily due to the acquisition of KMOV.
Depreciation and amortization increased 2 percent in fiscal 2013 as compared to the prior year primarily due to the increased depreciation expenses from acquisitions completed by the national media segment during fiscal 2012.
Operating Expenses
Employee compensation including benefits was the largest component of our operating expenses in fiscal 2014. Employee compensation represented 33 percent of total operating expenses in fiscal 2014 compared to 34 percent in fiscal 2013, and 33 percent in fiscal 2012. National media paper, production, and postage combined expense was the second largest component of our operating costs in fiscal 2014, representing 23 percent of the total. In fiscal 2013, these expenses represented 24 percent and in fiscal 2012, they were 27 percent.
Income from Operations
Income from operations decreased 12 percent in fiscal 2014. The decrease in income from operations was primarily due to a larger restructuring charge recorded in the current year than was recorded in the prior year. In addition, decreases in the operating profit of our magazine operations of $23.8 million more than offset improved operating results in our interactive media operations of $8.6 million and our licensing operations of $3.9 million.
Income from operations rose 13 percent in fiscal 2013 as compared to the prior year primarily due to revenue growth and higher operating profits of $35.8 million in our local media segment and increased operating profit from acquisitions completed by the national media segment during fiscal 2012 of $6.6 million. These increases were partially offset by the increased unallocated corporate expenses of $15.7 million and declines in operating results in our magazine operations of $10.2 million.
Net Interest Expense
Net interest expense was $12.2 million in fiscal 2014, $13.4 million in fiscal 2013, and $12.9 million in fiscal 2012. Average long-term debt outstanding was $428.8 million in fiscal 2014, $367.7 million in fiscal 2013, and $305.4 million in fiscal 2012. The Company's approximate weighted average interest rate was 2.7 percent in fiscal 2014, 3.7 percent in fiscal 2013, and 4.2 percent in fiscal 2012.
Income Taxes
The Company's effective tax rate was 34.9 percent in fiscal 2014, 37.4 percent in fiscal 2013, and 39.6 percent in fiscal 2012. Our effective tax rate was primarily impacted by our lower pretax earnings due to the impairment and restructuring charges recorded in fiscal 2014 and a tax benefit from the realignment of international operations. The decrease in the fiscal 2013 effective tax rate is primarily due to tax benefits from the resolution of state and local tax contingencies.
Net Earnings and Earnings per Share
Net earnings were $113.5 million ($2.50 per diluted share) in fiscal 2014, down 8 percent from $123.7 million ($2.74 per diluted share) in fiscal 2013. The decrease in net earnings was primarily due to a larger restructuring charge recorded in the current year than was recorded in the prior year. In addition, decreases in the operating profit
28
of our magazine operations of $23.8 million more than offset improved operating results in our interactive media operations of $8.6 million and our licensing operations of $3.9 million. Both average basic and diluted shares outstanding increased slightly.
Net earnings were $123.7 million ($2.74 per diluted share) in fiscal 2013, up 18 percent from $104.4 million ($2.31 per diluted share) in fiscal 2012. The improvement was primarily the result of revenue growth and higher operating profits in our local media segment of $35.8 million, increased operating profits from the prior year national media acquisitions of $6.6 million and a lower effective tax rate. These increases were partially offset by the increased unallocated corporate expenses of $15.7 million and declines in operating results in our magazine of $10.1 million. Both average basic and diluted shares outstanding decreased slightly.
LIQUIDITY AND CAPITAL RESOURCES
Years ended June 30, | 2014 | 2013 | 2012 | ||||||||
(In millions) | |||||||||||
Cash flows from operating activities | $ | 178.1 | $ | 189.1 | $ | 181.9 | |||||
Cash flows from investing activities | (442.3 | ) | (76.2 | ) | (284.7 | ) | |||||
Cash flows from financing activities | 273.1 | (111.1 | ) | 100.9 | |||||||
Net cash flows | $ | 8.9 | $ | 1.9 | $ | (1.9 | ) | ||||
Cash and cash equivalents | $ | 36.6 | $ | 27.7 | $ | 25.8 | |||||
Long-term debt (including current portion) | 715.0 | 350.0 | 380.0 | ||||||||
Shareholders' equity | 891.7 | 854.3 | 797.4 | ||||||||
Debt to total capitalization | 45 % | 29 % | 32 % | ||||||||
OVERVIEW
Meredith's primary source of liquidity is cash generated by operating activities. Debt financing is typically used for significant acquisitions. Our core businesses—magazine and television broadcasting—have been strong cash generators. Despite the introduction of many new technologies, we believe these businesses will continue to have strong market appeal for the foreseeable future. As is true in any business, operating results and cash flows are subject to changes in demand for our products and changes in costs. Changes in the level of demand for magazine and television advertising or other products can have a significant effect on cash flows.
Historically, Meredith has been able to absorb normal business downturns without significant increases in debt and management believes the Company will continue to do so. We expect cash on hand, internally generated cash flow, and available credit from financing agreements will provide adequate funds for operating and recurring cash needs (e.g., working capital, capital expenditures, debt repayments, and cash dividends) into the foreseeable future. At June 30, 2014, we had up to $180.0 million available under our revolving credit facility and up to $30.0 million available under our asset-backed bank facility (depending on levels of accounts receivable). While there are no guarantees that we will be able to replace current credit agreements when they expire, we expect to be able to do so.
SOURCES AND USES OF CASH
Cash and cash equivalents increased $8.9 million in fiscal 2014 and $1.9 million in fiscal 2013. They decreased $1.9 million in fiscal 2012. Over the three-year period, net cash provided by operating activities was used for acquisitions, debt repayments, dividends, stock repurchases, and capital investments.
29
Operating Activities
The largest single component of operating cash inflows is cash received from advertising customers. Advertising accounted for more than 50 percent of total revenues in each of the past three fiscal years. Other sources of operating cash inflows include cash received from magazine circulation sales and other revenue transactions such as customer relationship marketing, retransmission consent fees, brand licensing, and product sales. Operating cash outflows include payments to vendors and employees and payments of interest and income taxes. Our most significant vendor payments are for production and delivery of publications and promotional mailings, broadcasting programming rights, employee benefits (including pension plans), network programming fees, and other services and supplies.
Cash provided by operating activities totaled $178.1 million in fiscal 2014 compared with $189.1 million in fiscal 2013. The change is primarily due to the timing of cash payments such as income tax payments and lower net earnings (excluding the impact of non-cash impairments).
Cash provided by operating activities totaled $189.1 million in fiscal 2013 compared with $181.9 million in fiscal 2012. The increase is primarily due to higher net earnings partially offset by a reduction in the current year deferred income taxes compared to the prior year.
Changes in the Company's cash contributions to qualified defined benefit pension plans can have a significant effect on cash provided by operations. We have not made any contributions in the last three fiscal years. We do not anticipate a required contribution in fiscal 2015.
Investing Activities
Investing cash inflows generally include proceeds from the sale of assets or a business. Investing cash outflows generally include payments for the acquisition of new businesses; investments; and additions to property, plant, and equipment.
Net cash used in investing activities was $442.3 million in fiscal 2014 compared to $76.2 million in fiscal 2013. The increase primarily reflects cash used for the purchase of the broadcast stations in the current year.
Net cash used in investing activities decreased to $76.2 million in fiscal 2013 from $284.7 million in the prior year. The decrease primarily reflects more cash used in the prior year for acquisitions as well as higher spending in the prior year for additions to property, plant, and equipment due to a move into our new leased facilities in New York in fiscal 2012.
Financing Activities
Financing cash inflows generally include borrowings under debt agreements and proceeds from the exercise of common stock options issued under share-based compensation plans. Financing cash outflows generally include the repayment of long-term debt, repurchases of Company stock, and the payment of dividends.
Net cash provided by financing activities totaled $273.1 million in fiscal 2014, compared with net cash used in financing activities of $111.1 million in the prior year. The change in cash from financing activities is primarily due to net debt of $365.0 million being incurred in the current year, primarily to finance the broadcast acquisitions, compared to a net $30.0 million debt reduction in the prior year.
Net cash used in financing activities totaled $111.1 million in the year ended June 30, 2013, compared with net cash provided by financing activities of $100.9 million in fiscal 2012. The change in cash from financing activities is primarily due to a net $30.0 million debt reduction in fiscal 2013, compared to net debt of $185.0 million being incurred in fiscal 2012 primarily to finance acquisitions. Also effecting the change in cash used for financing activities was increased use of cash for higher dividend payments due to the increased dividend per share rate and
30
increased purchases of Company common stock in fiscal 2013 offset by increased proceeds from common stock issued.
Long-term Debt
At June 30, 2014, long-term debt outstanding totaled $715.0 million ($250.0 million under a term loan, $225.0 million in fixed-rate unsecured senior notes, $150.0 million in floating-rate unsecured senior notes, $70.0 million under an asset-backed bank facility, and $20.0 million outstanding under a revolving credit facility). Of the fixed-rate unsecured senior notes, $75.0 million is due in the next 12 months. We expect to repay the senior notes with cash from operations and credit available under existing credit agreements. The fixed-rate senior notes are repayable in amounts of $25.0 million and $50.0 million and are due from July 13, 2014, to March 1, 2018. Interest rates on the fixed-rate senior notes range from 2.62 percent to 7.19 percent with a weighted average interest rate of 3.41 percent.
In February 2014, Meredith issued $150.0 million in floating-rate senior notes which are due in February 2024. The interest rate under the notes is based on a fixed spread over LIBOR. None of the floating-rate senior notes are due in the next 12 months.
In connection with the asset-backed bank facility, we entered into a revolving agreement. Under this agreement, we currently sell all of our rights, title, and interest in the majority of our accounts receivable related to advertising and miscellaneous revenues to Meredith Funding Corporation, a special-purpose entity established to purchase accounts receivable from Meredith. At June 30, 2014, $150.9 million of accounts receivable net of reserves were outstanding under the agreement. Meredith Funding Corporation in turn sells receivable interests to a major national bank. In consideration of the sale, Meredith receives cash and a subordinated note that bears interest at the prime rate, 3.25 percent at June 30, 2014, from Meredith Funding Corporation.
The revolving agreement is structured as a true sale under which the creditors of Meredith Funding Corporation will be entitled to be satisfied out of the assets of Meredith Funding Corporation prior to any value being returned to Meredith or its creditors. The accounts of Meredith Funding Corporation are fully consolidated in Meredith's consolidated financial statements. The asset-backed bank facility has a capacity of up to $100.0 million. The interest rate on the asset-backed bank facility is variable based on the London Interbank Offered Rate (LIBOR) plus a fixed spread. The interest rate was 1.04 percent as of June 30, 2014. The renewed facility will expire in April 2015.
During fiscal 2014, Meredith entered into a credit agreement that provided for a revolving credit facility of $200.0 million and a term loan of $250.0 million, which expire in March 2019. The interest rate under both facilities is variable based on LIBOR and Meredith's debt to trailing 12 month EBITDA ratio (earnings before interest, taxes, depreciation, and amortization as defined in the debt agreement). The term loan is payable in quarterly installments based on an amortization schedule as set forth in the agreement. The commitment fees under both facilities range from 0.125 percent to 0.25 percent of the unused commitment based on the Company's leverage ratio. At June 30, 2014, $250.0 million was outstanding under the term loan and $20.0 million was outstanding under the revolver. Of the term loan, $12.5 million is due in the next 12 months.
31
We believe our debt agreements are material to discussions of Meredith's liquidity. All of our debt agreements include financial covenants, and failure to comply with any such covenants could result in the debt becoming payable on demand. A summary of the most significant financial covenants and their status at June 30, 2014, is as follows:
Required at June 30, 2014 | Actual at June 30, 2014 | ||
Ratio of debt to trailing 12 month EBITDA1 | Less than 3.75 | 2.68 | |
Ratio of EBITDA1 to interest expense | Greater than 2.75 | 14.94 | |
1 EBITDA is earnings before interest, taxes, depreciation, and amortization as defined in the debt agreements. | |||
The Company was in compliance with these and all other financial covenants at June 30, 2014.
Contractual Obligations
The following table summarizes our principal contractual obligations as of June 30, 2014:
Payments Due by Period | ||||||||||||||||||||
Contractual obligations | Total | Less than 1 Year | 1-3 Years | 4-5 Years | After 5 Years | |||||||||||||||
(In millions) | ||||||||||||||||||||
Long-term debt | $ | 715.0 | $ | 87.5 | $ | 137.5 | $ | 340.0 | $ | 150.0 | ||||||||||
Debt interest 1 | 57.5 | 13.4 | 20.1 | 11.9 | 12.1 | |||||||||||||||
Broadcast rights and network programming 2 | 223.7 | 64.5 | 127.1 | 31.2 | 0.9 | |||||||||||||||
Contingent consideration 3 | 2.6 | — | — | 2.6 | — | |||||||||||||||
Operating leases | 170.7 | 18.8 | 35.3 | 27.7 | 88.9 | |||||||||||||||
Purchase obligations and other 4 | 59.2 | 24.9 | 23.1 | 5.5 | 5.7 | |||||||||||||||
Total contractual cash obligations | $ | 1,228.7 | $ | 209.1 | $ | 343.1 | $ | 418.9 | $ | 257.6 | ||||||||||
1 | Debt interest represents semi-annual interest payments due on fixed-rate senior notes outstanding at June 30, 2014 and estimated interest payments on variable-rate term loan and variable-rate private placement senior notes outstanding at June 30, 2014. Interest payments on variable-rate debt is estimated using the effective interest rate as of June 30, 2014. | |||||||||||||||||||
2 | Commitments for broadcasting rights and network programming consist of future rights to broadcast television programming and future programming costs pursuant to network affiliate agreements. Broadcast rights include $29.5 million owed for broadcast rights that are not currently available for airing and are therefore not included in the Consolidated Balance Sheet at June 30, 2014. | |||||||||||||||||||
3 | These amounts include contingent acquisition payments. While it is not certain if and /or when these payments will be made, we have included the payments in the table based on our best estimates of the amounts and dates when the contingencies may be resolved. | |||||||||||||||||||
4 | Purchase obligations and other includes expected postretirement benefit payments. | |||||||||||||||||||
Due to uncertainty with respect to the timing of future cash flows associated with unrecognized tax benefits at June 30, 2014, the Company is unable to make reasonably reliable estimates of the period of cash settlement. Therefore, $45.6 million of unrecognized tax benefits have been excluded from the contractual obligations table above. See Note 7 to the Consolidated Financial Statements for further discussion of income taxes.
Purchase obligations represent legally binding agreements to purchase goods and services that specify all significant terms. Outstanding purchase orders, which represent authorizations to purchase goods and services but are not legally binding, are not included in purchase obligations. We believe current cash balances, cash generated by future operating activities, and cash available under current credit agreements will be sufficient to meet our contractual cash obligations and other operating cash requirements for the foreseeable future. Projections of future cash flows
32
are, however, subject to substantial uncertainty as discussed throughout MD&A and particularly in Item 1A-Risk Factors beginning on page 10. Debt agreements may be renewed or refinanced if we determine it is advantageous to do so. We also have commitments in the form of standby letters of credit totaling $1.2 million that expire within one year.
Share Repurchase Program
We have maintained a program of Company share repurchases for 26 years. In fiscal 2014, we spent $78.2 million to repurchase an aggregate of 1,640,000 shares of Meredith Corporation common and Class B stock at then current market prices. We spent $54.7 million to repurchase an aggregate of 1,477,000 shares in fiscal 2013 and $26.9 million to repurchase an aggregate of 976,000 shares in fiscal 2012. We expect to continue repurchasing shares from time to time subject to market conditions. In October 2011, the Board of Directors authorized the repurchase of up to $100.0 million in shares of the Company's stock through public and private transactions. In May 2014, the Board of Directors authorized the repurchase of up to $100.0 million in additional shares of the Company's stock through public and private transactions. As of June 30, 2014, $108.2 million remained available under the current authorizations for future repurchases. The status of the repurchase program is reviewed at each quarterly Board of Directors meeting. See Item 5-Issuer Purchases of Equity Securities of this Form 10-K for detailed information on share repurchases during the quarter ended June 30, 2014.
Dividends
Meredith has paid quarterly dividends continuously since 1947 and we have increased our dividend annually for 21 consecutive years. The last increase occurred in February 2014 when the Board of Directors approved the quarterly dividend of 43.25 cents per share effective with the dividend payable in March 2014. Given the current number of shares outstanding, the increase will result in additional dividend payments of approximately $4.4 million annually. Dividend payments totaled $75.4 million, or $1.6800 per share, in fiscal 2014 compared with $70.5 million, or $1.5800 per share, in fiscal 2013, and $63.0 million, or $1.4025 per share, in fiscal 2012.
Capital Expenditures
Spending for property, plant, and equipment totaled $24.8 million in fiscal 2014, $26.0 million in fiscal 2013, and $35.7 million in fiscal 2012. Current and prior year investments primarily relate to assets acquired in the normal course of business. Fiscal 2012 spending primarily related to leasehold improvements related to our move into new leased facilities in New York along with assets acquired in the normal course of business. The Company has no material commitments for capital expenditures. We expect funds for future capital expenditures to come from operating activities or, if necessary, borrowings under credit agreements.
CRITICAL ACCOUNTING POLICIES
Meredith's consolidated financial statements are prepared in accordance with GAAP. Our significant accounting policies are summarized in Note 1 to the consolidated financial statements. The preparation of our consolidated financial statements requires management to make estimates and assumptions that affect the amounts reported in the consolidated financial statements and accompanying notes. Some of these estimates and assumptions are inherently difficult to make and subjective in nature. We base our estimates on historical experience, recent trends, our expectations for future performance, and other assumptions as appropriate. We reevaluate our estimates on an ongoing basis; actual results, however, may vary from these estimates.
The following are the accounting policies that management believes are most critical to the preparation of our consolidated financial statements and require management's most difficult, subjective, or complex judgments. In addition, there are other items within the consolidated financial statements that require estimation but are not deemed to be critical accounting policies. Changes in the estimates used in these and other items could have a material impact on the consolidated financial statements.
33
GOODWILL AND INTANGIBLE ASSETS
The Company has a significant amount of goodwill and indefinite-lived intangible assets that are reviewed at least annually for impairment. At June 30, 2014, goodwill and intangible assets totaled $1.7 billion, or 66 percent of Meredith's total assets, with $955.3 million in the national media segment and $721.8 million in the local media segment.
Management is required to evaluate goodwill and intangible assets with indefinite lives for impairment on an annual basis or when events occur or circumstances change that would indicate the carrying value exceeds the fair value. In reviewing goodwill for impairment, the Company may first assess qualitative factors to determine whether it is more likely than not that the fair value of a reporting unit is less than its carrying amount. At May 31, 2014, the date the Company last performed its annual evaluation of impairment of goodwill, management elected to perform the two-step goodwill impairment test for all reporting units. The first step of this test is to compare the fair value of a reporting unit to its carrying value. In reviewing other indefinite-lived intangible assets for impairment, the Company compares the fair value of the asset to the asset’s carrying value.
Fair value is determined using a discounted cash flow model which requires us to estimate the future cash flows expected to be generated by the reporting unit or to result from the use of the assets. These estimates depend upon assumptions about future revenues (including projections of overall market growth and our share of market), estimated costs, and appropriate discount rates where applicable. Our assumptions are based on historical data, various internal estimates, and a variety of external sources and are consistent with the assumptions used in both our short-term financial forecasts and long-term strategic plans. Depending on the assumptions and estimates used, future cash flow projections can vary within a range of outcomes. Changes in key assumptions about the local media and national media businesses and their prospects or changes in market conditions could result in an impairment charge. See Item 1A. Risk Factors for other factors which could affect our assumptions. Also see Note 4 to the consolidated financial statements for additional information. The impairment analysis of these assets is considered critical because of their significance to the Company and our local media and national media segments.
BROADCAST RIGHTS
Broadcast rights, which consist primarily of rights to broadcast syndicated programs and feature films, are recorded at cost when the programs become available for airing. Amortization of broadcast rights is generally recorded on an accelerated basis over the contract period. Broadcast rights valued at $7.7 million were included in the Consolidated Balance Sheet at June 30, 2014. In addition, we had entered into contracts valued at $29.5 million not included in the Consolidated Balance Sheet at June 30, 2014, because the related programming was not yet available for airing.
Broadcast rights are valued at the lower of unamortized cost or net realizable value. The determination of net realizable value requires us to estimate future net revenues expected to be earned as a result of airing of the programming. Future revenues can be affected by changes in the level of advertising demand, competition from other television stations or other media, changes in television programming ratings, changes in the planned usage of programming materials, and other factors. Changes in such key assumptions could result in an impairment charge.
PENSION AND POSTRETIREMENT PLANS
Meredith has noncontributory pension plans covering substantially all employees. These plans include qualified (funded) plans as well as nonqualified (unfunded) plans. These plans provide participating employees with retirement benefits in accordance with benefit provision formulas. The nonqualified plans provide retirement benefits only to certain highly compensated employees. Meredith also sponsors defined healthcare and life insurance plans that provide benefits to eligible retirees.
34
The accounting for pension and postretirement plans is actuarially based and includes assumptions regarding expected returns on plan assets, discount rates, and the rate of increase in healthcare costs. We consider the accounting for pension and postretirement plans critical to Meredith and both of our segments because of the number of significant judgments required. More information on our assumptions and our methodology in arriving at these assumptions can be found in Note 8 to the consolidated financial statements. Changes in key assumptions could materially affect the associated assets, liabilities, and benefit expenses. Depending on the assumptions and estimates used, these balances could vary within a range of outcomes. We monitor trends in the marketplace and rely on guidance from employee benefit specialists to arrive at reasonable estimates. These estimates are reviewed annually and updated as needed. Nevertheless, the estimates are subjective and may vary from actual results.
Meredith will use a long-term rate of return on assets of 8.0 percent in developing fiscal 2015 pension costs, the same as used in fiscal 2014. The fiscal 2014 rate was based on various factors that include but are not limited to the plans' asset allocations, a review of historical capital market performance, historical plan performance, current market factors such as inflation and interest rates, and a forecast of expected future asset returns. The pension plan assets earned 20.2 percent in fiscal 2014 and 12.9 percent in fiscal 2013. If we had decreased our expected long-term rate of return on plan assets by 0.5 percent in fiscal 2014, our pension expense would have increased by $0.6 million.
Meredith will use a discount rate of 3.57 percent in developing the fiscal 2015 pension costs, down from a rate of 3.92 percent used in fiscal 2014. If we had decreased the discount rate by 0.5 percent in fiscal 2014, our pension expense would have increased by $0.1 million.
Assumed rates of increase in healthcare cost levels have a significant effect on postretirement benefit costs. A one-percentage-point increase in the assumed healthcare cost trend rate would have resulted in an increase of $0.4 million in the postretirement benefit obligation at June 30, 2014, and no increase in the aggregate service and interest cost components of fiscal 2014 expense.
REVENUE RECOGNITION
Revenues from the newsstand sale of magazines are recorded net of our best estimate of expected product returns. Net revenues from newsstand sales totaled 5 percent of fiscal 2014 national media segment revenues. Allowances for returns are subject to considerable variability. Return allowances may exceed 65 percent for magazines sold on the newsstand. Estimation of these allowances for future returns is considered critical to the national media segment and the Company as a whole because of the potential impact on revenues.
Estimates of magazine newsstand returns are based on historical experience and current marketplace conditions. Allowances for returns are adjusted continually on the basis of actual results. Unexpected changes in return levels may result in adjustments to net revenues.
SHARE-BASED COMPENSATION EXPENSE
Meredith has a stock incentive plan that permits us to grant various types of share-based incentives to key employees and directors. The primary types of incentives granted under the plan are stock options and restricted shares of common stock. Share-based compensation expense totaled $12.2 million in fiscal 2014. As of June 30, 2014, unearned compensation cost was $6.0 million for restricted stock and $3.5 million for stock options. These costs will be recognized over weighted average periods of 1.8 years and 1.7 years, respectively.
Restricted shares are valued at the market value of traded shares on the date of grant. The valuation of stock options requires numerous assumptions. We determine the fair value of each option as of the date of grant using the Black-Scholes option-pricing model. This model requires inputs for the expected volatility of our stock price, expected life of the option, and expected dividend yield, among others. We base our assumptions on historical data, expected
35
market conditions, and other factors. In some instances, a range of assumptions is used to reflect differences in behavior among various groups of employees. In addition, we estimate the number of options and restricted stock expected to eventually vest. This is based primarily on past experience.
We consider the accounting for share-based compensation expense critical to Meredith and both of our segments because of the number of significant judgments required. More information on our assumptions can be found in Note 11 to the consolidated financial statements. Changes in these assumptions could materially affect the share-based compensation expense recognized as well as various liability and equity balances.
INCOME TAXES
Income taxes are recorded for the amount of taxes payable for the current year and include deferred tax assets and liabilities for the effect of temporary differences between the financial and tax basis of recorded assets and liabilities using enacted tax rates. Deferred tax assets are reduced by a valuation allowance if it is more likely than not that some portion or all of the deferred tax assets will not be realized. Income tax expense was 34.9 percent of earnings before income taxes in fiscal 2014. Net deferred tax liabilities totaled $296.7 million, or 18 percent of total liabilities, at June 30, 2014.
We consider accounting for income taxes critical to our operations because management is required to make significant subjective judgments in developing our provision for income taxes, including the determination of deferred tax assets and liabilities, any valuation allowances that may be required against deferred tax assets, and reserves for uncertain tax positions.
The Company operates in numerous taxing jurisdictions and is subject to audit in each of these jurisdictions. These audits can involve complex issues that tend to require an extended period of time to resolve and may eventually result in an increase or decrease to amounts previously paid to the taxing jurisdictions. Any such audits are not expected to have a material effect on the Company's consolidated financial statements.
ACCOUNTING AND REPORTING DEVELOPMENTS
ADOPTED OR PENDING ACCOUNTING PRONOUNCEMENTS
There were no new accounting pronouncements issued or effective during the fiscal year which have had or are expected to have a material impact on the consolidated financial statements. See Note 1 to the consolidated financial statements for further detail on applicable accounting pronouncements that were adopted in fiscal 2014 or will be effective for fiscal 2015.
ITEM 7A. QUANTITATIVE AND QUALITATIVE DISCLOSURES ABOUT MARKET RISK
Meredith is exposed to certain market risks as a result of our use of financial instruments, in particular the potential market value loss arising from adverse changes in interest rates. The Company does not utilize financial instruments for trading purposes and does not hold any derivative financial instruments that could expose the Company to significant market risk. There have been no significant changes in the market risk exposures since June 30, 2013.
36
Interest Rates
We generally manage our risk associated with interest rate movements through the use of a combination of variable and fixed-rate debt. At June 30, 2014, Meredith had $225.0 million outstanding in fixed-rate long-term debt. There are no earnings or liquidity risks associated with the Company's fixed-rate debt. The fair value of the fixed-rate debt (based on discounted cash flows reflecting borrowing rates currently available for debt with similar terms and maturities) varies with fluctuations in interest rates. A 10 percent decrease in interest rates would have changed the fair value of the fixed-rate debt to $228.2 million from $227.0 million at June 30, 2014.
At June 30, 2014, $490 million of our debt was variable-rate debt. The Company is subject to earnings and liquidity risks for changes in the interest rate on this debt. A 10 percent increase in interest rates would increase annual interest expense by $0.8 million.
Broadcast Rights Payable
The Company enters into broadcast rights contracts for our television stations. As a rule, these contracts are on a market-by-market basis and subject to terms and conditions of the seller of the broadcast rights. These procured rights generally are sold to the highest bidder in each market, and the process is very competitive. There are no earnings or liquidity risks associated with broadcast rights payable. Fair values are determined using discounted cash flows. At June 30, 2014, a 10 percent decrease in interest rates would have resulted in an immaterial change in the fair value of the available broadcast rights payable and the unavailable broadcast rights commitments.
37
ITEM 8. FINANCIAL STATEMENTS AND SUPPLEMENTARY DATA
Index to Financial Statements and Supplementary Data | |
Page | |
Financial Statements | |
Consolidated Balance Sheets as of June 30, 2014 and 2013 | |
Consolidated Statements of Earnings for the Years Ended June 30, 2014, 2013, and 2012 | |
Consolidated Statements of Comprehensive Income for the Years Ended June 30, 2014, 2013, and 2012 | |
Consolidated Statements of Shareholders' Equity for the Years Ended June 30, 2014, 2013, and 2012 | |
Consolidated Statements of Cash Flows for the Years Ended June 30, 2014, 2013, and 2012 | |
Notes to Consolidated Financial Statements | |
Financial Statement Schedule | |
38
Report of Independent Registered Public Accounting Firm
The Board of Directors and Shareholders
Meredith Corporation:
We have audited the accompanying consolidated balance sheets of Meredith Corporation and subsidiaries (the Company) as of June 30, 2014 and 2013, and the related consolidated statements of earnings, comprehensive income, shareholders' equity, and cash flows for each of the years in the three-year period ended June 30, 2014. In connection with our audits of the consolidated financial statements, we have also audited the consolidated financial statement schedule, Schedule II-Valuation and Qualifying Accounts. We also have audited the Company's internal control over financial reporting as of June 30, 2014, based on criteria established in Internal Control - Integrated Framework (1992) issued by the Committee of Sponsoring Organizations of the Treadway Commission (COSO). The Company's management is responsible for these consolidated financial statements and financial statement schedule, for maintaining effective internal control over financial reporting, and for its assessment of the effectiveness of internal control over financial reporting, included in the accompanying Management's Report on Internal Control over Financial Reporting. Our responsibility is to express an opinion on these consolidated financial statements and financial statement schedule and an opinion on the Company's internal control over financial reporting based on our audits.
We conducted our audits in accordance with the standards of the Public Company Accounting Oversight Board (United States). Those standards require that we plan and perform the audits to obtain reasonable assurance about whether the financial statements are free of material misstatement and whether effective internal control over financial reporting was maintained in all material respects. Our audits of the consolidated financial statements included examining, on a test basis, evidence supporting the amounts and disclosures in the financial statements, assessing the accounting principles used and significant estimates made by management, and evaluating the overall financial statement presentation. Our audit of internal control over financial reporting included obtaining an understanding of internal control over financial reporting, assessing the risk that a material weakness exists, and testing and evaluating the design and operating effectiveness of internal control based on the assessed risk. Our audits also included performing such other procedures as we considered necessary in the circumstances. We believe that our audits provide a reasonable basis for our opinions.
A company's internal control over financial reporting is a process designed to provide reasonable assurance regarding the reliability of financial reporting and the preparation of financial statements for external purposes in accordance with generally accepted accounting principles. A company's internal control over financial reporting includes those policies and procedures that (1) pertain to the maintenance of records that, in reasonable detail, accurately and fairly reflect the transactions and dispositions of the assets of the company; (2) provide reasonable assurance that transactions are recorded as necessary to permit preparation of financial statements in accordance with generally accepted accounting principles, and that receipts and expenditures of the company are being made only in accordance with authorizations of management and directors of the company; and (3) provide reasonable assurance regarding prevention or timely detection of unauthorized acquisition, use, or disposition of the company's assets that could have a material effect on the financial statements.
Because of its inherent limitations, internal control over financial reporting may not prevent or detect misstatements. Also, projections of any evaluation of effectiveness to future periods are subject to the risk that controls may become inadequate because of changes in conditions, or that the degree of compliance with the policies or procedures may deteriorate.
In our opinion, the consolidated financial statements referred to above present fairly, in all material respects, the financial position of Meredith Corporation and subsidiaries as of June 30, 2014 and 2013, and the results of their operations and their cash flows for each of the years in the three-year period ended June 30, 2014, in conformity with U.S. generally accepted accounting principles. Also in our opinion, the related financial statement schedule, when considered in relation to the basic consolidated financial statements taken as a whole, presents fairly, in all
39
material respects, the information set forth therein. Also in our opinion, the Company maintained, in all material respects, effective internal control over financial reporting as of June 30, 2014, based on criteria established in Internal Control - Integrated Framework (1992) issued by the Committee of Sponsoring Organizations of the Treadway Commission (COSO).
/s/ KPMG LLP
Des Moines, Iowa
August 25, 2014
40
REPORT OF MANAGEMENT
To the Shareholders of Meredith Corporation:
Meredith management is responsible for the preparation, integrity, and objectivity of the financial information included in this Annual Report on Form 10-K. We take this responsibility very seriously as we recognize the importance of having well-informed, confident investors. The consolidated financial statements have been prepared in accordance with accounting principles generally accepted in the United States of America and include amounts based on our informed judgments and estimates. We have adopted appropriate accounting policies and are fully committed to ensuring that those policies are applied properly and consistently. In addition, we strive to report our consolidated financial results in a manner that is relevant, complete, and understandable. We welcome any suggestions from those who use our reports.
To meet our responsibility for financial reporting, our internal control systems and accounting procedures are designed to provide reasonable assurance as to the reliability of financial records. In addition, our internal audit staff monitors and reports on compliance with Company policies, procedures, and internal control systems.
The consolidated financial statements and the effectiveness of the Company's internal control over financial reporting have been audited by an independent registered public accounting firm in accordance with the standards of the Public Company Accounting Oversight Board (United States). The independent registered public accounting firm was given unrestricted access to all financial records and related information, including all Board of Directors and Board committee minutes.
The Audit Committee of the Board of Directors is responsible for reviewing and monitoring the Company's accounting policies, internal controls, and financial reporting practices. The Audit Committee is also directly responsible for the appointment, compensation, and oversight of the Company's independent registered public accounting firm. The Audit Committee consists solely of independent directors who meet with the independent registered public accounting firm, management, and internal auditors to review accounting, auditing, and financial reporting matters. To ensure complete independence, the independent registered public accounting firm has direct access to the Audit Committee without the presence of management representatives.
At Meredith, we have always placed a high priority on good corporate governance and will continue to do so in the future.
/s/ Joseph Ceryanec
Joseph Ceryanec
Chief Financial Officer
41
FINANCIAL STATEMENTS AND SUPPLEMENTARY DATA
Meredith Corporation and Subsidiaries
Consolidated Balance Sheets
Assets | June 30, | 2014 | 2013 | |||||
(In thousands) | ||||||||
Current assets | ||||||||
Cash and cash equivalents | $ | 36,587 | $ | 27,674 | ||||
Accounts receivable (net of allowances of $7,813 in 2014 and $10,559 in 2013) | 257,644 | 232,305 | ||||||
Inventories | 24,008 | 28,386 | ||||||
Current portion of subscription acquisition costs | 96,893 | 97,982 | ||||||
Current portion of broadcast rights | 4,551 | 2,831 | ||||||
Assets held for sale | 32,900 | — | ||||||
Other current assets | 17,429 | 18,514 | ||||||
Total current assets | 470,012 | 407,692 | ||||||
Property, plant, and equipment | ||||||||
Land | 23,363 | 20,318 | ||||||
Buildings and improvements | 143,169 | 131,653 | ||||||
Machinery and equipment | 314,949 | 295,476 | ||||||
Leasehold improvements | 14,125 | 14,815 | ||||||
Construction in progress | 5,610 | 1,993 | ||||||
Total property, plant, and equipment | 501,216 | 464,255 | ||||||
Less accumulated depreciation | (296,168 | ) | (277,938 | ) | ||||
Net property, plant, and equipment | 205,048 | 186,317 | ||||||
Subscription acquisition costs | 101,533 | 99,433 | ||||||
Broadcast rights | 3,114 | 3,634 | ||||||
Other assets | 86,935 | 69,848 | ||||||
Intangible assets, net | 835,531 | 584,281 | ||||||
Goodwill | 841,627 | 788,854 | ||||||
Total assets | $ | 2,543,800 | $ | 2,140,059 | ||||
See accompanying Notes to Consolidated Financial Statements | ||||||||
42
Meredith Corporation and Subsidiaries
Consolidated Balance Sheets (continued)
Liabilities and Shareholders' Equity | June 30, | 2014 | 2013 | |||||
(In thousands except per share data) | ||||||||
Current liabilities | ||||||||
Current portion of long-term debt | $ | 87,500 | $ | 50,000 | ||||
Current portion of long-term broadcast rights payable | 4,511 | 4,089 | ||||||
Accounts payable | 81,402 | 78,458 | ||||||
Accrued expenses | ||||||||
Compensation and benefits | 57,637 | 56,030 | ||||||
Distribution expenses | 8,504 | 12,505 | ||||||
Other taxes and expenses | 69,906 | 64,141 | ||||||
Total accrued expenses | 136,047 | 132,676 | ||||||
Current portion of unearned subscription revenues | 173,643 | 191,448 | ||||||
Total current liabilities | 483,103 | 456,671 | ||||||
Long-term debt | 627,500 | 300,000 | ||||||
Long-term broadcast rights payable | 4,327 | 5,096 | ||||||
Unearned subscription revenues | 151,533 | 163,809 | ||||||
Deferred income taxes | 277,477 | 247,487 | ||||||
Other noncurrent liabilities | 108,208 | 112,700 | ||||||
Total liabilities | 1,652,148 | 1,285,763 | ||||||
Shareholders' equity | ||||||||
Series preferred stock, par value $1 per share | ||||||||
Authorized 5,000 shares; none issued | — | — | ||||||
Common stock, par value $1 per share | ||||||||
Authorized 80,000 shares; issued and outstanding 36,776 shares in 2014 (excluding 24,395 treasury shares) and 36,242 shares in 2013 (excluding 23,992 treasury shares) | 36,776 | 36,242 | ||||||
Class B stock, par value $1 per share, convertible to common stock | ||||||||
Authorized 15,000 shares; issued and outstanding 7,700 shares in 2014 and 8,324 shares in 2013 | 7,700 | 8,324 | ||||||
Additional paid-in capital | 41,884 | 50,170 | ||||||
Retained earnings | 814,050 | 775,901 | ||||||
Accumulated other comprehensive loss | (8,758 | ) | (16,341 | ) | ||||
Total shareholders' equity | 891,652 | 854,296 | ||||||
Total liabilities and shareholders' equity | $ | 2,543,800 | $ | 2,140,059 | ||||
See accompanying Notes to Consolidated Financial Statements | ||||||||
43
Meredith Corporation and Subsidiaries
Consolidated Statements of Earnings
Years ended June 30, | 2014 | 2013 | 2012 | ||||||||
(In thousands except per share data) | |||||||||||
Revenues | |||||||||||
Advertising | $ | 778,391 | $ | 823,690 | $ | 769,815 | |||||
Circulation | 327,214 | 322,223 | 285,254 | ||||||||
All other | 363,103 | 325,427 | 321,618 | ||||||||
Total revenues | 1,468,708 | 1,471,340 | 1,376,687 | ||||||||
Operating expenses | |||||||||||
Production, distribution, and editorial | 567,024 | 561,058 | 547,564 | ||||||||
Selling, general, and administrative | 655,241 | 654,098 | 599,026 | ||||||||
Depreciation and amortization | 59,928 | 45,350 | 44,326 | ||||||||
Total operating expenses | 1,282,193 | 1,260,506 | 1,190,916 | ||||||||
Income from operations | 186,515 | 210,834 | 185,771 | ||||||||
Interest income | 10 | 17 | 8 | ||||||||
Interest expense | (12,186 | ) | (13,447 | ) | (12,904 | ) | |||||
Earnings before income taxes | 174,339 | 197,404 | 172,875 | ||||||||
Income taxes | (60,798 | ) | (73,754 | ) | (68,503 | ) | |||||
Net earnings | $ | 113,541 | $ | 123,650 | $ | 104,372 | |||||
Basic earnings per share | $ | 2.54 | $ | 2.78 | $ | 2.33 | |||||
Basic average shares outstanding | 44,636 | 44,455 | 44,825 | ||||||||
Diluted earnings per share | $ | 2.50 | $ | 2.74 | $ | 2.31 | |||||
Diluted average shares outstanding | 45,410 | 45,085 | 45,100 | ||||||||
Dividends paid per share | $ | 1.6800 | $ | 1.5800 | $ | 1.4025 | |||||
See accompanying Notes to Consolidated Financial Statements | |||||||||||
44
Meredith Corporation and Subsidiaries
Consolidated Statements of Comprehensive Income
Years ended June 30, | 2014 | 2013 | 2012 | ||||||||
(In thousands) | |||||||||||
Net earnings | $ | 113,541 | $ | 123,650 | $ | 104,372 | |||||
Other comprehensive income (loss), net of income taxes | |||||||||||
Pension and other postretirement benefit plans activity | 7,583 | 6,774 | (6,952 | ) | |||||||
Other comprehensive income (loss), net of income taxes | 7,583 | 6,774 | (6,952 | ) | |||||||
Comprehensive income | $ | 121,124 | $ | 130,424 | $ | 97,420 | |||||
See accompanying Notes to Consolidated Financial Statements | |||||||||||
45
Meredith Corporation and Subsidiaries
Consolidated Statements of Shareholders' Equity
(In thousands except per share data) | Common Stock - $1 par value | Class B Stock - $1 par value | Additional Paid-in Capital | Retained Earnings | Accumulated Other Comprehensive Income (Loss) | Total | |||||||||||||||||
Balance at June 30, 2011 | $ | 36,282 | $ | 8,776 | $ | 58,274 | $ | 687,816 | $ | (16,163 | ) | $ | 774,985 | ||||||||||
Net earnings | — | — | — | 104,372 | — | 104,372 | |||||||||||||||||
Other comprehensive loss, net of tax | — | — | — | — | (6,952 | ) | (6,952 | ) | |||||||||||||||
Stock issued under various incentive plans, net of forfeitures | 425 | — | 5,483 | — | — | 5,908 | |||||||||||||||||
Purchases of Company stock | (975 | ) | (1 | ) | (19,489 | ) | (6,416 | ) | — | (26,881 | ) | ||||||||||||
Share-based compensation | — | — | 10,459 | — | — | 10,459 | |||||||||||||||||
Conversion of class B to common stock | 59 | (59 | ) | — | — | — | — | ||||||||||||||||
Dividends paid, 1.4025 dollars per share | |||||||||||||||||||||||
Common stock | — | — | — | (50,725 | ) | — | (50,725 | ) | |||||||||||||||
Class B stock | — | — | — | (12,269 | ) | — | (12,269 | ) | |||||||||||||||
Tax deficiency from incentive plans | — | — | (1,452 | ) | — | — | (1,452 | ) | |||||||||||||||
Balance at June 30, 2012 | 35,791 | 8,716 | 53,275 | 722,778 | (23,115 | ) | 797,445 | ||||||||||||||||
Net earnings | — | — | — | 123,650 | — | 123,650 | |||||||||||||||||
Other comprehensive income, net of tax | — | — | — | — | 6,774 | 6,774 | |||||||||||||||||
Stock issued under various incentive plans, net of forfeitures | 1,537 | — | 37,982 | — | — | 39,519 | |||||||||||||||||
Purchases of Company stock | (1,471 | ) | (7 | ) | (53,256 | ) | — | — | (54,734 | ) | |||||||||||||
Share-based compensation | — | — | 11,518 | — | — | 11,518 | |||||||||||||||||
Conversion of class B to common stock | 385 | (385 | ) | — | — | — | — | ||||||||||||||||
Dividends paid, 1.5800 dollars per share | |||||||||||||||||||||||
Common stock | — | — | — | (57,196 | ) | — | (57,196 | ) | |||||||||||||||
Class B stock | — | — | — | (13,331 | ) | — | (13,331 | ) | |||||||||||||||
Tax benefit from incentive plans | — | — | 651 | — | — | 651 | |||||||||||||||||
Balance at June 30, 2013 | 36,242 | 8,324 | 50,170 | 775,901 | (16,341 | ) | 854,296 | ||||||||||||||||
Net earnings | — | — | — | 113,541 | — | 113,541 | |||||||||||||||||
Other comprehensive income, net of tax | — | — | — | — | 7,583 | 7,583 | |||||||||||||||||
Stock issued under various incentive plans, net of forfeitures | 1,550 | — | 57,335 | — | — | 58,885 | |||||||||||||||||
Purchases of Company stock | (1,639 | ) | (1 | ) | (76,586 | ) | — | — | (78,226 | ) | |||||||||||||
Share-based compensation | — | — | 12,224 | — | — | 12,224 | |||||||||||||||||
Conversion of class B to common stock | 623 | (623 | ) | — | — | — | — | ||||||||||||||||
Dividends paid, 1.6800 dollars per share | |||||||||||||||||||||||
Common stock | — | — | — | (61,949 | ) | — | (61,949 | ) | |||||||||||||||
Class B stock | — | — | — | (13,443 | ) | — | (13,443 | ) | |||||||||||||||
Tax deficiency from incentive plans | — | — | (1,259 | ) | — | — | (1,259 | ) | |||||||||||||||
Balance at June 30, 2014 | $ | 36,776 | $ | 7,700 | $ | 41,884 | $ | 814,050 | $ | (8,758 | ) | $ | 891,652 | ||||||||||
See accompanying Notes to Consolidated Financial Statements | |||||||||||||||||||||||
46
Meredith Corporation and Subsidiaries
Consolidated Statements of Cash Flows
Years ended June 30, | 2014 | 2013 | 2012 | ||||||||
(In thousands) | |||||||||||
Cash flows from operating activities | |||||||||||
Net earnings | $ | 113,541 | $ | 123,650 | $ | 104,372 | |||||
Adjustments to reconcile net earnings to net cash provided by operating activities | |||||||||||
Depreciation | 35,627 | 33,607 | 31,989 | ||||||||
Amortization | 13,099 | 11,743 | 12,337 | ||||||||
Share-based compensation | 12,224 | 11,518 | 10,459 | ||||||||
Deferred income taxes | 25,178 | 44,848 | 58,025 | ||||||||
Amortization of broadcast rights | 8,785 | 9,660 | 11,869 | ||||||||
Payments for broadcast rights | (10,332 | ) | (13,036 | ) | (14,487 | ) | |||||
Provision for write-down of impaired assets | 11,447 | — | 946 | ||||||||
Fair value adjustment to contingent consideration | (5,700 | ) | (2,500 | ) | (1,018 | ) | |||||
Excess tax benefits from share-based payments | (4,855 | ) | (5,438 | ) | (495 | ) | |||||
Changes in assets and liabilities, net of acquisitions/dispositions | |||||||||||
Accounts receivable | (2,430 | ) | (16,575 | ) | 10,197 | ||||||
Inventories | 4,133 | (5,814 | ) | 1,101 | |||||||
Other current assets | 2,100 | (1,899 | ) | (2,523 | ) | ||||||
Subscription acquisition costs | (1,011 | ) | (46,601 | ) | (42,698 | ) | |||||
Other assets | 5,620 | 7,052 | 10,294 | ||||||||
Accounts payable | 1,598 | 10,657 | (3,912 | ) | |||||||
Accrued expenses and other liabilities | 4,208 | 15,229 | (11,773 | ) | |||||||
Unearned subscription revenues | (30,013 | ) | 13,806 | 7,124 | |||||||
Other noncurrent liabilities | (5,129 | ) | (820 | ) | 123 | ||||||
Net cash provided by operating activities | 178,090 | 189,087 | 181,930 | ||||||||
Cash flows from investing activities | |||||||||||
Acquisitions of and investments in businesses | (417,461 | ) | (50,190 | ) | (248,964 | ) | |||||
Additions to property, plant, and equipment | (24,822 | ) | (25,969 | ) | (35,718 | ) | |||||
Net cash used in investing activities | (442,283 | ) | (76,159 | ) | (284,682 | ) | |||||
Cash flows from financing activities | |||||||||||
Proceeds from issuance of long-term debt | 666,000 | 175,000 | 355,000 | ||||||||
Repayments of long-term debt | (301,000 | ) | (205,000 | ) | (170,000 | ) | |||||
Dividends paid | (75,392 | ) | (70,527 | ) | (62,994 | ) | |||||
Purchases of Company stock | (78,226 | ) | (54,734 | ) | (26,881 | ) | |||||
Proceeds from common stock issued | 58,885 | 39,519 | 5,908 | ||||||||
Excess tax benefits from share-based payments | 4,855 | 5,438 | 495 | ||||||||
Other | (2,016 | ) | (770 | ) | (677 | ) | |||||
Net cash provided by (used in) financing activities | 273,106 | (111,074 | ) | 100,851 | |||||||
Net increase (decrease) in cash and cash equivalents | 8,913 | 1,854 | (1,901 | ) | |||||||
Cash and cash equivalents at beginning of year | 27,674 | 25,820 | 27,721 | ||||||||
Cash and cash equivalents at end of year | $ | 36,587 | $ | 27,674 | $ | 25,820 | |||||
See accompanying Notes to Consolidated Financial Statements | |||||||||||
47
Meredith Corporation and Subsidiaries
Consolidated Statements of Cash Flows (continued)
Years ended June 30, | 2014 | 2013 | 2012 | ||||||||
(In thousands) | |||||||||||
Supplemental disclosures of cash flow information | |||||||||||
Cash paid | |||||||||||
Interest | $ | 11,271 | $ | 12,758 | $ | 10,454 | |||||
Income taxes | 34,957 | 22,871 | 24,300 | ||||||||
Non-cash transactions | |||||||||||
Broadcast rights financed by contracts payable | 9,985 | 11,774 | 10,955 | ||||||||
See accompanying Notes to Consolidated Financial Statements | |||||||||||
48
Meredith Corporation and Subsidiaries
Notes to Consolidated Financial Statements
1. Summary of Significant Accounting Policies
Nature of Operations—Meredith Corporation (Meredith or the Company) is a diversified media company focused primarily on the home and family marketplace. The Company has two segments: local media and national media. The Company's local media segment includes 14 television stations, related digital and mobile media operations, and video creation operations.The national media segment includes magazine publishing, customer relationship marketing, digital and mobile media, brand licensing, database-related activities, and other related operations. Meredith's operations are primarily diversified geographically within the United States (U.S.) and the Company has a broad customer base.
Principles of Consolidation—The consolidated financial statements include the accounts of Meredith Corporation and its wholly owned subsidiaries. Significant intercompany balances and transactions are eliminated. Meredith does not have any off-balance sheet financing activities. The Company's use of special-purpose entities is limited to Meredith Funding Corporation, whose activities are fully consolidated in Meredith's consolidated financial statements (See Note 6).
Use of Estimates—The preparation of financial statements in conformity with accounting principles generally accepted in the United States of America (GAAP) requires management to make estimates and assumptions that affect the amounts reported in the consolidated financial statements. The Company bases its estimates on historical experience, management expectations for future performance, and other assumptions as appropriate. Key areas affected by estimates include the assessment of the recoverability of long-lived assets, including goodwill and other intangible assets, which is based on such factors as estimated future cash flows; the determination of the net realizable value of broadcast rights, which is based on estimated future revenues; provisions for returns of magazines sold, which are based on historical experience and current marketplace conditions; pension and postretirement benefit expenses, which are actuarially determined and include assumptions regarding discount rates, expected returns on plan assets, and rates of increase in compensation and healthcare costs; and share-based compensation expense, which is based on numerous assumptions including future stock price volatility and employees' expected exercise and post-vesting employment termination behavior. While the Company re-evaluates its estimates on an ongoing basis, actual results may vary from those estimates.
Cash and Cash Equivalents—Cash and short-term investments with original maturities of three months or less are considered to be cash and cash equivalents. Cash and cash equivalents are stated at cost, which approximates fair value.
Accounts Receivable—The Company's accounts receivable are primarily due from advertisers. Credit is extended to clients based on an evaluation of each client's creditworthiness and financial condition; collateral is not required. The Company maintains allowances for uncollectible accounts, rebates, rate adjustments, returns, and discounts. The allowance for uncollectible accounts is based on the aging of such receivables and any known specific collectability exposures. Accounts are written off when deemed uncollectible. Allowances for rebates, rate adjustments, returns, and discounts are generally based on historical experience and current market conditions. Concentration of credit risk with respect to accounts receivable is generally limited due to the large number of geographically diverse clients and individually small balances.
Inventories—Inventories are stated at the lower of cost or market. Cost is determined on the last-in first-out (LIFO) basis for paper and on the first-in first-out or average basis for all other inventories.
Subscription Acquisition Costs—Subscription acquisition costs primarily represent magazine agency commissions. These costs are deferred and amortized over the related subscription term, typically one to two years. In addition, direct-response advertising costs that are intended to solicit subscriptions and are expected to result in probable future benefits are capitalized. These costs are amortized over the period during which future benefits are
49
expected to be received. The asset balance of the capitalized direct-response advertising costs is reviewed quarterly to ensure the amount is realizable. Any write-downs resulting from this review are expensed as subscription acquisition advertising costs in the current period. Capitalized direct-response advertising costs were $6.5 million at June 30, 2014 and $6.5 million at June 30, 2013. There were no material write-downs of capitalized direct-response advertising costs in any of the fiscal years in the three-year period ended June 30, 2014.
Property, Plant, and Equipment—Property, plant, and equipment are stated at cost. Costs of replacements and major improvements are capitalized, and maintenance and repairs are charged to operations as incurred. Depreciation expense is provided primarily by the straight-line method over the estimated useful lives of the assets: 5-45 years for buildings and improvements and 3-20 years for machinery and equipment. The costs of leasehold improvements are amortized over the lesser of the useful lives or the terms of the respective leases. Depreciation and amortization of property, plant, and equipment was $35.6 million in fiscal 2014, $33.6 million in fiscal 2013, and $32.0 million in fiscal 2012.
Broadcast Rights—Broadcast rights consist principally of rights to broadcast syndicated programs, sports, and feature films. The total cost of these rights is recorded as an asset and as a liability when programs become available for broadcast. The current portion of broadcast rights represents those rights available for broadcast that are expected to be amortized in the succeeding year. These rights are valued at the lower of unamortized cost or estimated net realizable value, and are generally charged to operations on an accelerated basis over the contract period. Impairments of unamortized costs to net realizable value are included in production, distribution, and editorial expenses in the accompanying Consolidated Statements of Earnings. There were no impairments to unamortized costs in fiscal 2014 and 2013. Impairments of unamortized costs were $0.1 million in fiscal 2012. Future write-offs can vary based on changes in consumer viewing trends and the availability and costs of other programming.
Intangible Assets and Goodwill—Amortizable intangible assets consist primarily of network affiliation agreements, advertiser relationships, and customer lists. Intangible assets with finite lives are amortized over their estimated useful lives. The useful life of an intangible asset is the period over which the asset is expected to contribute directly or indirectly to future cash flows. Network affiliation agreements are amortized over the period of time the agreements are expected to remain in place, assuming renewals without material modifications to the original terms and conditions (generally 25 to 40 years from the original acquisition date). Other intangible assets are amortized over their estimated useful lives, ranging from 1 to 10 years.
Intangible assets with indefinite lives include Federal Communications Commission (FCC) broadcast licenses. These licenses are granted for a term of up to eight years, but are renewable if the Company provides at least an average level of service to its customers and complies with the applicable FCC rules and policies and the Communications Act of 1934. The Company has been successful in every one of its past license renewal requests and has incurred only minimal costs in the process. The Company expects the television broadcasting business to continue indefinitely; therefore, the cash flows from the broadcast licenses are also expected to continue indefinitely.
Goodwill and certain other intangible assets (FCC broadcast licenses and trademarks), which have indefinite lives, are not amortized but tested for impairment annually or when events occur or circumstances change that would indicate the carrying value exceeds the fair value. The review of goodwill is performed at the reporting unit level. The Company has three reporting units, local media, magazine brands, and Meredith Xcelerated Marketing (MXM). We also assess, at least annually, whether assets classified as indefinite-lived intangible assets continue to have indefinite lives.
At May 31, 2014, the date the Company last performed its annual evaluation of impairment of goodwill, management elected to perform the two-step goodwill impairment test for all reporting units. The first step of this test is to compare the fair value of a reporting unit to its carrying value. In reviewing other indefinite-lived intangible assets for impairment, the Company compares the fair value of the asset to the asset’s carrying value.
50
Fair value is determined using a discounted cash flow model, which requires us to estimate the future cash flows expected to be generated by the reporting unit or to result from the use of the asset. These estimates include assumptions about future revenues (including projections of overall market growth and our share of market), estimated costs, and appropriate discount rates where applicable. Our assumptions are based on historical data, various internal estimates, and a variety of external sources and are consistent with the assumptions used in both our short-term financial forecasts and long-term strategic plans. Depending on the assumptions and estimates used, future cash flow projections can vary within a range of outcomes. Changes in key assumptions about the local media and national media businesses and their prospects or changes in market conditions could result in an impairment charge.
Additional information regarding intangible assets and goodwill is provided in Note 4.
Impairment of Long-lived Assets—Long-lived assets (primarily property, plant, and equipment and amortizable intangible assets) are reviewed for impairment whenever events and circumstances indicate the carrying value of an asset may not be recoverable. Recoverability is measured by comparison of the forecasted undiscounted cash flows of the operation to which the assets relate to the carrying amount of the assets. Tests for impairment or recoverability require significant management judgment, and future events affecting cash flows and market conditions could result in impairment losses.
Revenue Recognition—The Company's primary source of revenue is advertising. Other sources include circulation and other revenues.
Advertising revenues—Advertising revenues are recognized when advertisements are published (defined as an issue's on-sale date) or aired by the broadcasting station, net of agency commissions and net of provisions for estimated rebates, rate adjustments, and discounts. Barter revenues are included in advertising revenue and are also recognized when the commercials are broadcast. Barter advertising revenues and the offsetting expense are recognized at the fair value of the advertising surrendered, as determined by similar cash transactions. Barter advertising revenues were not material in any period. Website advertising revenues are recognized ratably over the contract period or as services are delivered.
Circulation revenues—Circulation revenues include magazine single copy and subscription revenue. Single copy revenue is recognized upon publication, net of provisions for estimated returns. The Company bases its estimates for returns on historical experience and current marketplace conditions. Revenues from magazine subscriptions are deferred and recognized proportionately as products are distributed to subscribers.
Other revenues—Revenues from customer relationship marketing and other custom programs are recognized when the products or services are delivered. In addition, the Company participates in certain arrangements containing multiple deliverables. The guidance for accounting for multiple-deliverable arrangements requires that overall arrangement consideration be allocated to each deliverable (unit of accounting) in the revenue arrangement based on the relative selling price as determined by vendor specific objective evidence, third-party evidence, or estimated selling price. The related revenue is recognized when each specific deliverable of the arrangement is delivered. Brand licensing-based revenues are accrued generally monthly or quarterly based on the specific mechanisms of each contract. Payments are generally made by the Company's partners on a quarterly basis. Generally, revenues are accrued based on estimated sales and adjusted as actual sales are reported by partners. These adjustments are typically recorded within three months of the initial estimates and have not been material. Any minimum guarantees are typically earned evenly over the fiscal year. Retransmission revenues are recognized over the contract period based on the negotiated fee.
In certain instances, revenues are recorded gross in accordance with GAAP although the Company receives cash for a lesser amount due to the netting of certain expenses. Amounts received from customers in advance of revenue recognition are deferred as liabilities and recognized as revenue in the period earned.
51
Contingent Consideration—The Company estimates and records the acquisition date estimated fair value of contingent consideration as part of purchase price consideration for acquisitions. Additionally, each reporting period, the Company estimates changes in the fair value of contingent consideration, and any change in fair value is recognized in the Consolidated Statement of Earnings. An increase in the earn-out expected to be paid will result in a charge to operations in the quarter that the anticipated fair value of contingent consideration increases, while a decrease in the earn-out expected to be paid will result in a credit to operations in the quarter that the anticipated fair value of contingent consideration decreases. The estimate of the fair value of contingent consideration requires subjective assumptions to be made of future operating results, discount rates, and probabilities assigned to various potential operating result scenarios. Future revisions to these assumptions could materially change the estimate of the fair value of contingent consideration and, therefore, materially affect the Company’s future financial results.
Advertising Expenses—The majority of the Company's advertising expenses relate to direct-mail costs for magazine subscription acquisition efforts. Advertising costs that are not capitalized are expensed the first time the advertising takes place. Total advertising expenses included in the Consolidated Statements of Earnings were $79.5 million in fiscal 2014, $90.2 million in fiscal 2013, and $89.9 million in fiscal 2012.
Share-based Compensation—The Company establishes fair value for its equity awards to determine their cost and recognizes the related expense over the appropriate vesting period. The Company recognizes expense for stock options, restricted stock, and shares issued under the Company's employee stock purchase plan. See Note 11 for additional information related to share-based compensation expense.
Income Taxes—The income tax provision is calculated under the liability method. Deferred tax assets and liabilities are recognized for the future tax consequences attributable to differences between the financial statement carrying amounts of existing assets and liabilities and their respective tax bases and tax credit carryforwards. Deferred tax assets and liabilities are measured using enacted tax rates expected to apply to taxable income in the years in which those temporary differences are expected to be recovered or settled. The effect on deferred tax assets and liabilities of a change in tax rates is recognized in earnings in the period when such a change is enacted.
The Company recognizes the effect of income tax positions only if those positions are more likely than not of being sustained. Recognized income tax positions are measured at the largest amount that is greater than 50 percent likely of being realized. Changes in recognition or measurement are reflected in the period in which the change in judgment occurs.
Self-Insurance—The Company self-insures for certain medical claims, and its responsibility generally is capped through the use of a stop loss contract with an insurance company at a certain dollar level (usually $300 thousand). A third-party administrator is used to process claims. The Company uses actual claims data and estimates of incurred-but-not-reported claims to calculate estimated liabilities for unsettled claims on an undiscounted basis. Although management re-evaluates the assumptions and reviews the claims experience on an ongoing basis, actual claims paid could vary significantly from estimated claims.
Pensions and Postretirement Benefits Other Than Pensions—Retirement benefits are provided to employees through pension plans sponsored by the Company. Pension benefits are primarily a function of both the years of service and the level of compensation for a specified number of years. It is the Company's policy to fund the qualified pension plans to at least the extent required to maintain their fully funded status. In addition, the Company provides health care and life insurance benefits for certain retired employees, the expected costs of which are accrued over the years that the employees render services. It is the Company's policy to fund postretirement benefits as claims are paid. Additional information is provided in Note 8.
Comprehensive Income—Comprehensive income consists of net earnings and other gains and losses affecting shareholders' equity that, under GAAP, are excluded from net earnings. Other comprehensive income (loss) includes changes in prior service cost and net actuarial losses from pension and postretirement benefit plans, net of taxes.
52
Earnings Per Share—Basic earnings per share is calculated by dividing net earnings by the weighted average common and Class B shares outstanding. Diluted earnings per share is calculated similarly but includes the dilutive effect, if any, of the assumed exercise of securities, including the effect of shares issuable under the Company's share-based incentive plans.
Adopted Accounting Pronouncements—In February 2013, the Financial Accounting Standards Board (FASB) issued guidance related to Reporting of Amounts Reclassified Out of Accumulated Other Comprehensive Income, which requires companies to provide information about the amounts reclassified out of accumulated other comprehensive income by component. In addition, companies are required to present, either on the face of the statement where net income is presented or in the notes, significant amounts reclassified out of accumulated other comprehensive income by the respective line items of net income. This update was effective for us in our first quarter of fiscal 2014. The adoption of this guidance required a change in the format of presentation only and did not have an impact on our results of operations or financial position.
In April 2014, the FASB issued guidance that changes the criteria for reporting discontinued operations while enhancing disclosures in this area. Under the new guidance, a disposal that represents a strategic shift having a major effect on the organization’s operations and financial results should be presented as discontinued operations. The new guidance also requires expanded disclosures about discontinued operations including more information about the assets, liabilities, revenues and expenses of a discontinued operation. Additionally, it also requires disclosure of the pre-tax income attributable to a disposal of a significant part of an organization that does not qualify for discontinued operations reporting. Early adoption is permitted for disposals or classifications as held for sale that have not been reported in previously-issued financial statements. The Company has elected to early adopt this guidance for disposals beginning in the fourth quarter of fiscal 2014. Accordingly, since the disposals during the period did not represent a strategic shift nor were they individually significant, they are not reported as discontinued operations and the Company was not subject to the disclosure requirements of pre-tax income.
Pending Accounting Pronouncements—In July 2013, the FASB issued guidance on the presentation of an unrecognized tax benefit when a net operating loss carryforward, a similar tax loss, or a tax credit carryforward exists. The guidance requires the netting of unrecognized tax benefits against a deferred tax asset for a loss or other carryforward that would apply in settlement of uncertain tax positions. Under the new standard, unrecognized tax benefits will be netted against all available same-jurisdiction loss or other tax carryforwards that would be utilized, rather than only against carryforwards that are created by the unrecognized tax benefits. The guidance is effective for the Company in our first quarter of fiscal 2015 with earlier adoption permitted. Retrospective application of the guidance is also permitted. While the adoption of this guidance will not have an impact on our results of operations or cash flows, we are currently evaluating the impact of presenting unrecognized tax benefits net of our deferred tax assets where applicable on our Consolidated Balance Sheets.
In May 2014, the FASB issued an accounting standards update that replaces existing revenue recognition guidance. The new guidance requires a company to recognize revenue for the transfer of promised goods or services equal to the amount it expects to receive in exchange for those goods or services. Additionally, the guidance requires enhanced disclosures about the nature, amount, timing, and uncertainty of revenue and cash flows from customer contracts. This guidance will be effective for us in the first quarter of fiscal 2018. Early application is not permitted and companies may chose either a full retrospective or cumulative effect method of adoption. The Company is evaluating the method of adoption and the impact the guidance will have on our results of operations and financial position.
53
2. Acquisitions
Fiscal 2014
During fiscal 2014, Meredith paid $417.5 million primarily for the acquisitions of the television station KMOV, the CBS affiliate in St. Louis, Missouri and the television station KTVK, an independent station in Phoenix, Arizona.
Effective February 28, 2014, Meredith acquired KMOV. The results of KMOV's operations have been included in the consolidated financial statements since that date. The cash purchase price was $185.8 million.
Effective June 19, 2014, Meredith acquired KTVK and an interest in the assets of KASW, the CW affiliate in Phoenix, Arizona. The cash purchase price was $222.8 million, which has preliminarily been allocated as $189.9 million for KTVK and $32.9 million for the interest in KASW assets. The results of KTVK's operations have been included in the consolidated financial statements since that date. As part of the FCC approval of the transaction, Meredith is required to sell its interest in the KASW assets. Accordingly, this interest is shown on the Consolidated Balance Sheet as assets held for sale.
As a result of the acquisitions, the assets and liabilities of KMOV and KTVK, consisting primarily of FCC broadcast licenses, network affiliation agreement, identifiable intangible assets, fixed assets, accounts receivable and payable, and other accrued expenses are now reflected in the Company's Consolidated Balance Sheet. The consolidated financial statements reflect the preliminary allocation of the purchase price to the assets acquired and liabilities assumed, based on their respective fair values.
As of the date of each acquisition, Meredith allocates the purchase price to the assets acquired and liabilities assumed based on their respective preliminary fair values. The Company is in the process of obtaining third-party valuations of fixed and intangible assets; thus, the provisional measurements of fixed assets, intangible assets, goodwill, and deferred income tax balances are subject to change. The following table summarizes the total estimated fair values of the assets acquired and liabilities assumed:
(In thousands) | |||
Accounts receivable | $ | 18,934 | |
Current portion of broadcast rights | 6,495 | ||
Other current assets | 1,015 | ||
Property, plant, and equipment | 30,240 | ||
Noncurrent assets | 10,186 | ||
Intangible assets | 274,671 | ||
Total identifiable assets acquired | 341,541 | ||
Current portion of broadcast rights | (6,495 | ) | |
Other current liabilities | (1,820 | ) | |
Long-term liabilities | (10,184 | ) | |
Total liabilities assumed | (18,499 | ) | |
Net identifiable assets acquired | 323,042 | ||
Goodwill | 52,589 | ||
Net assets acquired | $ | 375,631 | |
54
The following table provides details of the acquired intangible assets by acquisition:
(In thousands) | KMOV | KTVK | Total | |||||||||
Intangible assets | ||||||||||||
subject to amortization | ||||||||||||
Network affiliation agreement | $ | 9,755 | $ | — | $ | 9,755 | ||||||
Other | 3,385 | 13,348 | 16,733 | |||||||||
Total | 13,140 | 13,348 | 26,488 | |||||||||
Intangible assets not | ||||||||||||
subject to amortization | ||||||||||||
FCC licenses | 101,973 | 146,210 | 248,183 | |||||||||
Intangible assets, total | $ | 115,113 | $ | 159,558 | $ | 274,671 | ||||||
The useful life of the network affiliation agreement is seven years and other intangible assets useful lives range from one to six years.
Goodwill, with a provisionally assigned value of $52.6 million, is expected to be fully deductible for tax purposes and is attributable to expected synergies and the assembled workforces of KMOV and KTVK.
The impact of the acquisitions is not material to the Company's results of operations; therefore, pro forma financial information has not been provided. During fiscal 2014, acquisition related costs of $5.5 million were expensed in the period in which they were incurred. These costs are included in the selling, general, and administrative line in the Consolidated Statements of Earnings.
Fiscal 2013
Meredith paid $50.2 million in fiscal 2013 primarily for the acquisitions of Parenting and Babytalk magazines and related digital assets (collectively Parenting) and Living the Country Life, LLC (Living the Country Life) and additional capital contributions to our minority investment in the Next Issue Media joint venture.
In October 2012, Meredith acquired the remaining 49 percent of the outstanding stock of Living the Country Life. The results of Living the Country Life's operations have been included in the consolidated financial statements since that date. The cash purchase price was $1.4 million.
In May 2013, Meredith acquired Parenting. The Parenting acquisition included Parenting and Babytalk magazine titles and related digital assets including the website www.parenting.com. The results of Parenting's operations have been included in the consolidated financial statements since that date. The acquisition-date fair value of the consideration totaled $45.5 million, which consisted of $41.5 million cash and a preliminary estimate of $4.0 million contingent consideration. The contingent consideration arrangement requires the Company to pay contingent payments should certain financial targets, generally based on revenues, be met over four fiscal years. Our estimate of the fair value of the contingent consideration is based on a probability-weighted discounted cash flow model. The estimated fair value is based on significant inputs not observable in the market and thus represents a Level 3 measurement as defined in Note 14. Revenue growth for the Parenting acquisition was initially strong and in line with the original estimate; however, a slowdown in advertising revenues in the second half of fiscal 2014 resulted in lower revenue expectations. Therefore, during fiscal 2014, the Company recognized a non-cash credit to operations of $2.3 million to reduce the estimated contingent consideration payable. This credit was recorded in the selling, general, and administrative expense line on the Consolidated Statements of Earnings. As of June 30, 2014, the Company estimates the future aggregate payments will range from zero to $7.5 million.
As a result of the acquisitions, the assets and liabilities of Parenting, consisting primarily of identifiable intangible assets and unearned subscription revenues, are reflected in the Company's Consolidated Balance Sheet. The consolidated financial statements reflect the allocation of the purchase price to the assets acquired and liabilities
55
assumed, based on their respective fair values. Definite-lived intangible assets include an internet domain name of $3.1 million, trademark of $1.7 million, customer lists of $1.5 million, advertiser relationships of $1.3 million, and developed content of $0.9 million. The definite-lived intangible assets have useful lives ranging from two to 10 years. Goodwill is attributable to expected synergies and has an assigned value of $56.4 million, of which $33.0 million is expected to be deductible for tax purposes.
Acquisition related costs were expensed by the Company in the period in which they were incurred. Acquisition costs related to the acquisitions were not material to the Company's results of operations. In fiscal 2013, the Company incurred $5.1 million for acquisition costs for professional fees and expenses related to a strategic transaction that did not materialize. These costs are included in the selling, general, and administrative line in the Consolidated Statements of Earnings.
Fiscal 2012
In fiscal 2012, Meredith paid $249.0 million primarily for the acquisitions of EatingWell Media Group (EatingWell), EveryDay with Rachael Ray magazine and its related digital assets (collectively Rachael Ray), FamilyFun magazine and its related assets (collectively FamilyFun), Allrecipes.com, Inc. (Allrecipes.com), and ShopNation Inc. (ShopNation), and a minority investment in iris Nation Worldwide Limited.
In July 2011, Meredith acquired 100 percent of the outstanding stock of EatingWell. The results of EatingWell's operations have been included in the consolidated financial statements since that date. The EatingWell portfolio includes a bi-monthly magazine, a website, a content licensing and custom marketing program, a Healthy-in-a-Hurry mobile recipe application, and a series of high-quality food and nutrition-related books and cookbooks. The cash purchase price was $27.8 million.
In October 2011, Meredith completed its acquisition of Rachael Ray. In addition, Meredith entered into a 10-year licensing agreement with Watch Entertainment Inc. for the Rachael Ray brand. The results of Rachael Ray's operations have been included in the consolidated financial statements since that date. The cash purchase price was $4.3 million.
In January 2012, Meredith completed its acquisition of FamilyFun. The FamilyFun portfolio includes FamilyFun magazine and its related assets, including its special interest publications, as well as the Toy Hopper and other digital magazine application. The results of FamilyFun's operations have been included in the consolidated financial statements since that date. The cash purchase price was $12.1 million.
In March 2012, Meredith acquired 100 percent of the outstanding stock of Allrecipes.com, which is the world's largest digital food brand. The results of Allrecipes.com operations have been included in the consolidated financial statements since that date. The cash purchase price was $175.0 million.
In May 2012, Meredith purchased 100 percent of the outstanding stock of ShopNation, an e-commerce website. The fair value of the consideration totaled $10.4 million, which consisted of $4.0 million of cash and $6.4 million of contingent consideration. The contingent consideration arrangement requires the Company to pay contingent payments should the acquired operations achieve certain financial targets over three fiscal years generally based on earnings before interest and taxes, as defined in the acquisition agreement. None of the contingent consideration is dependent on the continued employment of the sellers. We estimated the fair value of the contingent consideration using a probability-weighted discounted cash flow model. The fair value is based on significant inputs not observable in the market and thus represents a Level 3 measurement as defined in Note 14. At the acquisition date, the Company believed the proprietary technology acquired had significant potential but uncertain ongoing revenues. The terms of the acquisition reflected this with a smaller upfront payment relative to the contingent payment. Growth in revenues has been steady but earnings before interest and taxes has fallen short of management's expectations since the acquisition date. As a result, during fiscal years 2014 and 2013, the Company recognized non-cash credits to operations of $3.4 million and $2.5 million, respectively, reducing the estimated contingent consideration payable. These credits were recorded in the selling, general, and administrative expense line on the
56
Consolidated Statements of Earnings. As of June 30, 2014, the Company estimates there will be no future aggregate payments owed under the contingent consideration agreement.
Acquisition related costs were expensed by the Company in the period in which they were incurred. The Company recorded $2.7 million in acquisition costs in fiscal 2012 and these costs are included in the selling, general, and administrative line in the Consolidated Statements of Earnings.
3. Inventories
Inventories consist of paper stock, editorial content, and books. Of total net inventory values, 49 percent at June 30, 2014, and 50 percent at June 30, 2013, were determined using the LIFO method. LIFO inventory income included in the Consolidated Statements of Earnings was $0.8 million in fiscal 2014, $1.7 million in fiscal 2013, and $0.7 million in fiscal 2012.
June 30, | 2014 | 2013 | |||||
(In thousands) | |||||||
Raw materials | $ | 11,993 | $ | 14,336 | |||
Work in process | 13,398 | 16,392 | |||||
Finished goods | 2,814 | 2,680 | |||||
28,205 | 33,408 | ||||||
Reserve for LIFO cost valuation | (4,197 | ) | (5,022 | ) | |||
Inventories | $ | 24,008 | $ | 28,386 | |||
57
4. Intangible Assets and Goodwill
Intangible assets consist of the following:
June 30, | 2014 | 2013 | ||||||||||||||||||||||
(In thousands) | Gross Amount | Accumulated Amortization | Net Amount | Gross Amount | Accumulated Amortization | Net Amount | ||||||||||||||||||
Intangible assets subject to amortization | ||||||||||||||||||||||||
National media | ||||||||||||||||||||||||
Advertiser relationships | $ | 8,752 | $ | (6,069 | ) | $ | 2,683 | $ | 8,752 | $ | (3,755 | ) | $ | 4,997 | ||||||||||
Customer lists | 16,257 | (14,852 | ) | 1,405 | 16,387 | (11,242 | ) | 5,145 | ||||||||||||||||
Other | 17,105 | (5,608 | ) | 11,497 | 16,805 | (3,041 | ) | 13,764 | ||||||||||||||||
Local media | ||||||||||||||||||||||||
Network affiliation agreements | 228,314 | (122,888 | ) | 105,426 | 218,559 | (117,533 | ) | 101,026 | ||||||||||||||||
Other | 16,733 | (188 | ) | 16,545 | — | — | — | |||||||||||||||||
Total | $ | 287,161 | $ | (149,605 | ) | 137,556 | $ | 260,503 | $ | (135,571 | ) | 124,932 | ||||||||||||
Intangible assets not subject to amortization | ||||||||||||||||||||||||
National media | ||||||||||||||||||||||||
Internet domain names | 1,827 | 1,827 | ||||||||||||||||||||||
Trademarks | 148,889 | 158,446 | ||||||||||||||||||||||
Local media | ||||||||||||||||||||||||
FCC licenses | 547,259 | 299,076 | ||||||||||||||||||||||
Total | 697,975 | 459,349 | ||||||||||||||||||||||
Intangible assets, net | $ | 835,531 | $ | 584,281 | ||||||||||||||||||||
Amortization expense was $13.1 million in fiscal 2014, $11.7 million in fiscal 2013, and $12.3 million in fiscal 2012. Future amortization expense for intangible assets is expected to be as follows: $13.8 million in fiscal 2015, $12.3 million in fiscal 2016, $11.0 million in fiscal 2017, $10.1 million in fiscal 2018, and $10.1 million in fiscal 2019.
During fiscal 2014, the Company recorded an impairment charge of $10.3 million on national media intangible assets, including $9.5 million of trademarks and $0.8 million of customer lists. Management determined these intangible assets were fully impaired as part of management's commitment to performance improvement plans, including the conversion of Ladies' Home Journal from a subscription-based magazine to a quarterly newsstand special interest publication and the closure of Meredith's medical sales force training business. The impairment charges are recorded in the depreciation and amortization line in the Consolidated Statements of Earnings.
Changes in the carrying amount of goodwill were as follows:
(In thousands) | National Media | Local Media | Total | ||||||||
Balance at June 30, 2012 | $ | 733,127 | $ | — | $ | 733,127 | |||||
Acquisitions | 55,727 | — | 55,727 | ||||||||
Balance at June 30, 2013 | 788,854 | — | 788,854 | ||||||||
Acquisitions | 184 | 52,589 | 52,773 | ||||||||
Balance at June 30, 2014 | $ | 789,038 | $ | 52,589 | $ | 841,627 | |||||
58
The national media segment is comprised of two reporting units, the magazine brands reporting unit, which has $617.1 million of goodwill, and the MXM reporting unit, which has $171.9 million of goodwill.
Meredith completed annual impairment reviews of goodwill and intangible assets with indefinite lives as of May 31, 2014, 2013, and 2012. No impairments were recorded as a result of those reviews. As of May 31, 2014, the fair value of the local media reporting unit significantly exceeded its net assets, the fair value of the magazine brands reporting unit exceeded its net assets by 20 percent, and the fair value of the MXM reporting unit exceeded its net assets by more than 40 percent.
The fair value of the magazine brands reporting unit assumes a discount rate of 10 percent. Assumed revenue growth rates range from down 6.6 percent in the first year due to the conversion of Ladies’ Home Journal from a monthly subscription title to a quarterly special interest publication to up 2.0 percent. The assumed terminal growth rate is 2.0 percent. These assumptions are contingent upon a stable economic environment, continuing strong consumer engagement, and a continuing shift to digital platforms. Holding other assumptions constant, a 100 basis point increase in the discount rate would result in an estimated fair value that exceeds net assets by 7 percent. Holding other assumptions constant, a 100 basis point decrease in the long-term growth rate would result in an estimated fair value that exceeds net assets by 11 percent. Both of these scenarios individually would result in the magazine brands reporting unit passing step one of the test.
The fair value of the MXM reporting unit assumes a discount rate of 12 percent, near term revenue growth rates ranging from 2.4 percent to 5.2 percent, and a terminal growth rate of 5.0 percent. These assumptions are contingent upon a stable economic environment and either retaining or replacing key customers. Holding other assumptions constant, a 100 basis point increase in the discount rate would result in an estimated fair value that exceeds net assets by 25 percent. Holding other assumptions constant, a 100 basis point decrease in the long-term growth rate would result in an estimated fair value that exceeds net assets by more than 25 percent. Both of these scenarios individually would result in the MXM reporting unit passing step one of the test.
5. Restructuring Accrual
In the third quarter of fiscal 2014, management committed to several performance improvement plans related primarily to business realignments including converting Ladies' Home Journal from a monthly subscription magazine to a newsstand only quarterly special interest publication, the closing of our medical sales force training business, and other selected workforce reductions. In connection with these plans, the Company recorded a pre-tax restructuring charge of $20.8 million. The restructuring charge includes severance and related benefit costs of $8.5 million related to the involuntary termination of employees, an accrual for vacated lease spaces of $0.4 million, and other accruals of $0.5 million, all of which are recorded in the selling, general, and administrative line of the Consolidated Statements of Earnings. The Company also wrote down intangible assets by $10.3 million (see Note 4) and fixed assets of $0.9 million, which are recorded in the depreciation and amortization line of the Consolidated Statements of Earnings, and manuscript and art inventory by $0.2 million, which is recorded in the production, distribution, and editorial line of the Consolidated Statements of Earnings. The majority of severance costs will be paid out over the next nine months. These plans affected approximately 100 employees.
In the fourth quarter of fiscal 2014, management committed to a performance improvement plan related primarily to business realignments from recent broadcast station acquisitions that included selected workforce reductions. In connection with this plan, the Company recorded a pre-tax restructuring charge of $3.7 million. The restructuring charge includes severance and related benefit costs of $3.4 million related to the involuntary termination of employees and an accrual for vacating a building of $0.3 million, which are recorded in the selling, general, and administrative line of the Consolidated Statements of Earnings. The majority of severance costs will be paid out over the next twelve months. The plan will affect approximately 75 employees.
Additionally, during fiscal 2014, the Company recorded a reversal of $1.4 million of excess restructuring reserves accrued in prior fiscal years. The reversal of excess restructuring reserves is recorded in the selling, general, and administrative line of the Consolidated Statements of Earnings.
59
In the second quarter of fiscal 2013, management committed to a performance improvement plan related primarily to business realignments that included selected workforce reductions. In connection with this plan, the Company recorded a pre-tax restructuring charge of $7.8 million including severance and related benefit costs of $7.4 million related to the involuntary termination of employees and an accrual for vacated lease space of $0.4 million. The majority of severance costs have been paid out. The plan affected approximately 195 employees. The Company also recorded $0.8 million in reversals of excess restructuring reserves accrued in prior fiscal years. The restructuring charge and credit for the reversal of excess restructuring reserves are recorded in the selling, general, and administrative line of the Consolidated Statements of Earnings.
Details of changes in the Company's restructuring accrual are as follows:
Years ended June 30, | 2014 | 2013 | |||||
(In thousands) | |||||||
Balance at beginning of year | $ | 8,103 | $ | 10,644 | |||
Severance accrual | 11,915 | 7,382 | |||||
Other accruals | 1,141 | 463 | |||||
Cash payments | (6,258 | ) | (9,559 | ) | |||
Reversal of excess accrual | (1,356 | ) | (827 | ) | |||
Balance at end of year | $ | 13,545 | $ | 8,103 | |||
6. Long-term Debt
Long-term debt consists of the following:
June 30, | 2014 | 2013 | |||||
(In thousands) | |||||||
Variable-rate credit facilities | |||||||
Asset-backed bank facility of $100 million, due 4/24/2015 | $ | 70,000 | $ | 75,000 | |||
Revolving credit facility of $200 million, due 3/27/2019 | 20,000 | — | |||||
Term loan of $250 million, due 3/27/2019 | 250,000 | — | |||||
Private placement notes | |||||||
6.70% senior notes, due 7/13/2013 | — | 50,000 | |||||
7.19% senior notes, due 7/13/2014 | 25,000 | 25,000 | |||||
2.62% senior notes, due 3/1/2015 | 50,000 | 50,000 | |||||
3.04% senior notes, due 3/1/2016 | 50,000 | 50,000 | |||||
3.04% senior notes, due 3/1/2017 | 50,000 | 50,000 | |||||
3.04% senior notes, due 3/1/2018 | 50,000 | 50,000 | |||||
Floating rate senior notes, due 2/28/2024 | 150,000 | — | |||||
Total long-term debt | 715,000 | 350,000 | |||||
Current portion of long-term debt | (87,500 | ) | (50,000 | ) | |||
Long-term debt | $ | 627,500 | $ | 300,000 | |||
60
The following table shows principal payments on the debt due in succeeding fiscal years:
Years ending June 30, | |||
(In thousands) | |||
2015 | $ | 87,500 | |
2016 | 62,500 | ||
2017 | 75,000 | ||
2018 | 75,000 | ||
2019 | 265,000 | ||
Thereafter | 150,000 | ||
Total long-term debt | $ | 715,000 | |
In connection with the asset-backed bank facility, Meredith entered into a revolving agreement to sell all of its rights, title, and interest in the majority of its accounts receivable related to advertising and miscellaneous revenues to Meredith Funding Corporation, a special purpose entity established to purchase accounts receivable from Meredith. At June 30, 2014, $150.9 million of accounts receivable net of reserves were outstanding under the agreement. Meredith Funding Corporation in turn sells receivable interests to a major national bank. In consideration of the sale, Meredith receives cash and a subordinated note, bearing interest at the prime rate, 3.25 percent at June 30, 2014, from Meredith Funding Corporation. The agreement is structured as a true sale under which the creditors of Meredith Funding Corporation will be entitled to be satisfied out of the assets of Meredith Funding Corporation prior to any value being returned to Meredith or its creditors. The accounts of Meredith Funding Corporation are fully consolidated in Meredith's consolidated financial statements. The interest rate on the asset-backed bank facility is based on a fixed spread over London Interbank Offered Rate (LIBOR). The weighted average effective interest rate was 1.04 percent as of June 30, 2014. The asset-backed bank facility's two-year term will be up for renewal on April 24, 2015.
During fiscal 2014, Meredith entered into a credit agreement that provided for a revolving credit facility of $200.0 million and a term loan of $250.0 million, for a five-year term which expires March 27, 2019. The term loan is payable in quarterly installments based on an amortization schedule as set forth in the agreement. The interest rate under both facilities is variable based on LIBOR and Meredith's debt to trailing 12 month EBITDA (earnings before interest, taxes, depreciation, and amortization as defined in the debt agreement) ratio. As of June 30, 2014, the weighted average interest rate was 1.65 percent and 1.66 percent for the revolving credit facility and term loan, respectively. The new credit agreement replaced our prior revolving credit facility. In connection with this transaction, the Company wrote off $0.6 million of deferred financing costs to the interest expense line of the Consolidated Statements of Earnings.
In addition, Meredith issued $150.0 million in private placement floating-rate senior notes during fiscal 2014, which are due February 28, 2024. The interest rate under the notes is based on a fixed spread over LIBOR. Interest rates on all private placement notes range from 1.73 percent to 7.19 percent at June 30, 2014. The weighted average interest rate on the private placement notes outstanding at June 30, 2014 was 2.74 percent.
All of the Company's debt agreements include financial covenants and failure to comply with any such covenants could result in the debt becoming payable on demand. The most significant financial covenants require a ratio of debt to trailing 12 month EBITDA less than 3.75 and a ratio of EBITDA to interest expense of greater than 2.75. The Company was in compliance with these and all other financial covenants at June 30, 2014.
Interest expense related to long-term debt totaled $10.9 million in fiscal 2014, $12.7 million in fiscal 2013, and $12.0 million in fiscal 2012.
During fiscal 2014, Meredith guaranteed $12.5 million of debt of an unrelated third party in connection with the unrelated third party's purchase of title to the assets of KASW. This debt is expected to be repaid upon the sale of
61
this station in fiscal 2015, at which time the guarantee will be released. The Company believes the likelihood of the guarantee being called is remote.
At June 30, 2014, Meredith had additional credit available under the asset-backed bank facility of up to $30.0 million (depending on levels of accounts receivable) and had $180.0 million of credit available under the revolving credit facility with an option to request up to another $200.0 million. The commitment fee for the asset-backed bank facility ranges from 0.40 percent to 0.45 percent of the unused commitment based on utilization levels. The commitment fees for the revolving credit facility ranges from 0.125 percent to 0.25 percent of the unused commitment based on the Company's leverage ratio. Commitment fees paid in fiscal 2014 were not material.
7. Income Taxes
The following table shows income tax expense (benefit) attributable to earnings before income taxes:
Years ended June 30, | 2014 | 2013 | 2012 | ||||||||
(In thousands) | |||||||||||
Currently payable | |||||||||||
Federal | $ | 37,615 | $ | 30,604 | $ | 9,911 | |||||
State | 2,764 | 1,419 | 1,222 | ||||||||
Foreign | 37 | 42 | 103 | ||||||||
40,416 | 32,065 | 11,236 | |||||||||
Deferred | |||||||||||
Federal | 18,138 | 35,383 | 49,046 | ||||||||
State | 2,386 | 6,453 | 8,153 | ||||||||
Foreign | (142 | ) | (147 | ) | 68 | ||||||
20,382 | 41,689 | 57,267 | |||||||||
Income taxes | $ | 60,798 | $ | 73,754 | $ | 68,503 | |||||
The differences between the statutory U.S. federal income tax rate and the effective tax rate were as follows:
Years ended June 30, | 2014 | 2013 | 2012 | |||||
U.S. statutory tax rate | 35.0 | % | 35.0 | % | 35.0 | % | ||
State income taxes, less federal income tax benefits | 2.2 | 3.0 | 3.5 | |||||
Settlements - audits / tax litigation | (0.3 | ) | (1.6 | ) | (0.5 | ) | ||
Restructuring of international operations | (2.5 | ) | — | — | ||||
Other | 0.5 | 1.0 | 1.6 | |||||
Effective income tax rate | 34.9 | % | 37.4 | % | 39.6 | % | ||
The Company's effective tax rate was 34.9 percent in fiscal 2014, 37.4 percent in fiscal 2013, and 39.6 percent in fiscal 2012. The fiscal 2014 rate reflected tax benefits realized due to expiring federal and state statutes of limitations and federal tax benefits from the restructuring of Meredith's international operations. The fiscal 2013 rate reflected favorable adjustments primarily due to tax benefits from the resolution of state and local tax contingencies. The fiscal 2012 rate reflected the tax consequences of a smaller decrease in the fair value of the acquisition-related contingent consideration and smaller tax benefits realized due to expiring federal and state statutes of limitations as compared to the prior year.
62
The tax effects of temporary differences that gave rise to deferred tax assets and deferred tax liabilities were as follows:
June 30, | 2014 | 2013 | |||||
(In thousands) | |||||||
Deferred tax assets | |||||||
Accounts receivable allowances and return reserves | $ | 15,964 | $ | 12,123 | |||
Compensation and benefits | 34,320 | 42,602 | |||||
Indirect benefit of uncertain state and foreign tax positions | 10,875 | 10,421 | |||||
All other assets | 5,174 | 13,222 | |||||
Total deferred tax assets | 66,333 | 78,368 | |||||
Valuation allowance | (1,742 | ) | (1,655 | ) | |||
Net deferred tax assets | 64,591 | 76,713 | |||||
Deferred tax liabilities | |||||||
Subscription acquisition costs | 76,359 | 75,914 | |||||
Accumulated depreciation and amortization | 255,936 | 238,557 | |||||
Gains from dispositions | 24,048 | 24,027 | |||||
All other liabilities | 4,907 | 4,969 | |||||
Total deferred tax liabilities | 361,250 | 343,467 | |||||
Net deferred tax liability | $ | 296,659 | $ | 266,754 | |||
The Company's deferred tax assets are more likely than not to be fully realized except for a valuation allowance of $1.7 million that was recorded for capital losses and certain net operating losses booked in fiscal 2014, fiscal 2013, and fiscal 2012. The net current portions of deferred tax assets and liabilities are included in accrued expenses-other taxes and expenses at June 30, 2014 and 2013, in the Consolidated Balance Sheets.
A reconciliation of the beginning and ending balances of the total amounts of gross unrecognized tax benefits is as follows:
Years ended June 30, | 2014 | 2013 | |||||
(In thousands) | |||||||
Balance at beginning of year | $ | 42,402 | $ | 39,164 | |||
Increases in tax positions for prior years | 327 | 664 | |||||
Decreases in tax positions for prior years | (699 | ) | (181 | ) | |||
Increases in tax positions for current year | 5,756 | 9,987 | |||||
Settlements | (652 | ) | (65 | ) | |||
Lapse in statute of limitations | (9,139 | ) | (7,167 | ) | |||
Balance at end of year | $ | 37,995 | $ | 42,402 | |||
The total amount of unrecognized tax benefits that, if recognized, would impact the effective tax rate was $26.8 million as of June 30, 2014, and $25.2 million as of June 30, 2013. The uncertain tax benefit recognized during fiscal 2014 from lapse in statute of limitations that related to income tax positions on temporary differences was $2.7 million. The Company recognizes interest and penalties related to unrecognized tax benefits as a component of income tax expense. The amount of accrued interest and penalties related to unrecognized tax benefits was $7.6 million and $6.5 million as of June 30, 2014 and 2013, respectively.
The total amount of unrecognized tax benefits at June 30, 2014, may change significantly within the next 12 months, decreasing by an estimated range of $2.3 million to $24.1 million. The change, if any, may result primarily from foreseeable federal and state examinations, ongoing federal and state examinations, anticipated state settlements, expiration of various statutes of limitation, the results of tax cases, or other regulatory developments.
63
The Company's federal tax returns have been audited through fiscal 2002, and are closed by expiration of the statute of limitations for fiscal 2003, fiscal 2004, and fiscal 2005. Fiscal 2006 through fiscal 2010 are under the jurisdiction of IRS Appeals, while fiscals 2011 and 2012 are currently under examination. The Company has various state income tax examinations ongoing and at various stages of completion, but generally the state income tax returns have been audited or closed to audit through fiscal 2005.
8. Pension and Postretirement Benefit Plans
Savings and Investment Plan
Meredith maintains a 401(k) Savings and Investment Plan that permits eligible employees to contribute funds on a pretax basis. The plan allows employee contributions of up to 50 percent of eligible compensation subject to the maximum allowed under federal tax provisions. The Company matches 100 percent of the first 3 percent and 50 percent of the next 2 percent of employee contributions.
The 401(k) Savings and Investment Plan allows employees to choose among various investment options, including the Company's common stock, for both their contributions and the Company's matching contribution. Company contribution expense under this plan totaled $9.3 million in fiscal 2014, $8.7 million in fiscal 2013, and $8.4 million in fiscal 2012.
Pension and Postretirement Plans
Meredith has noncontributory pension plans covering substantially all employees. These plans include qualified (funded) plans as well as nonqualified (unfunded) plans. These plans provide participating employees with retirement benefits in accordance with benefit provision formulas. The nonqualified plans provide retirement benefits only to certain highly compensated employees. The Company also sponsors defined healthcare and life insurance plans that provide benefits to eligible retirees.
64
Obligations and Funded Status
The following tables present changes in, and components of, the Company's net assets/liabilities for pension and other postretirement benefits:
Pension | Postretirement | |||||||||||||||
June 30, | 2014 | 2013 | 2014 | 2013 | ||||||||||||
(In thousands) | ||||||||||||||||
Change in benefit obligation | ||||||||||||||||
Benefit obligation, beginning of year | $ | 140,549 | $ | 137,287 | $ | 12,302 | $ | 14,975 | ||||||||
Service cost | 10,196 | 10,100 | 170 | 377 | ||||||||||||
Interest cost | 5,604 | 4,911 | 480 | 611 | ||||||||||||
Participant contributions | — | — | 842 | 808 | ||||||||||||
Plan amendments | 915 | — | (1,732 | ) | — | |||||||||||
Actuarial loss (gain) | 4,083 | 473 | (114 | ) | (2,952 | ) | ||||||||||
Benefits paid (including lump sums) | (8,739 | ) | (12,222 | ) | (1,503 | ) | (1,517 | ) | ||||||||
Benefit obligation, end of year | $ | 152,608 | $ | 140,549 | $ | 10,445 | $ | 12,302 | ||||||||
Change in plan assets | ||||||||||||||||
Fair value of plan assets, beginning of year | $ | 128,267 | $ | 124,568 | $ | — | $ | — | ||||||||
Actual return on plan assets | 25,117 | 15,329 | — | — | ||||||||||||
Employer contributions | 534 | 592 | 661 | 709 | ||||||||||||
Participant contributions | — | — | 842 | 808 | ||||||||||||
Benefits paid (including lump sums) | (8,739 | ) | (12,222 | ) | (1,503 | ) | (1,517 | ) | ||||||||
Fair value of plan assets, end of year | $ | 145,179 | $ | 128,267 | $ | — | $ | — | ||||||||
Under funded status, end of year | $ | (7,429 | ) | $ | (12,282 | ) | $ | (10,445 | ) | $ | (12,302 | ) | ||||
Benefits paid directly from Meredith assets are included in both employer contributions and benefits paid.
Fair value measurements for pension assets as of June 30, 2014, were as follows:
June 30, 2014 | Total Fair Value | Quoted Prices (Level 1) | Significant Other Observable Inputs (Level 2) | Significant Unobservable Inputs (Level 3) | |||||||||||||||
(In thousands) | |||||||||||||||||||
Investments in registered investment companies | $ | 144,619 | $ | 85,509 | $ | 59,110 | $ | — | |||||||||||
Pooled separate accounts | 560 | — | 560 | — | |||||||||||||||
Total assets at fair value | $ | 145,179 | $ | 85,509 | $ | 59,670 | $ | — | |||||||||||
Fair value measurements for pension assets as of June 30, 2013, were as follows:
June 30, 2013 | Total Fair Value | Quoted Prices (Level 1) | Significant Other Observable Inputs (Level 2) | Significant Unobservable Inputs (Level 3) | |||||||||||||||
(In thousands) | |||||||||||||||||||
Investments in registered investment companies | $ | 127,266 | $ | 74,856 | $ | 52,410 | $ | — | |||||||||||
Pooled separate accounts | 1,001 | — | 1,001 | — | |||||||||||||||
Total assets at fair value | $ | 128,267 | $ | 74,856 | $ | 53,411 | $ | — | |||||||||||
65
Refer to Note 14 for a discussion of the three levels in the hierarchy of fair values.
The following amounts are recognized in the Consolidated Balance Sheets:
Pension | Postretirement | |||||||||||||||
June 30, | 2014 | 2013 | 2014 | 2013 | ||||||||||||
(In thousands) | ||||||||||||||||
Other assets | ||||||||||||||||
Prepaid benefit cost | $ | 23,078 | $ | 12,074 | $ | — | $ | — | ||||||||
Accrued expenses-compensation and benefits | ||||||||||||||||
Accrued benefit liability | (2,408 | ) | (1,644 | ) | (770 | ) | (837 | ) | ||||||||
Other noncurrent liabilities | ||||||||||||||||
Accrued benefit liability | (28,099 | ) | (22,712 | ) | (9,675 | ) | (11,465 | ) | ||||||||
Net amount recognized, end of year | $ | (7,429 | ) | $ | (12,282 | ) | $ | (10,445 | ) | $ | (12,302 | ) | ||||
The accumulated benefit obligation for all defined benefit pension plans was $138.3 million and $126.7 million at June 30, 2014 and 2013, respectively.
The following table provides information about pension plans with projected benefit obligations and accumulated benefit obligations in excess of plan assets:
June 30, | 2014 | 2013 | |||||
(In thousands) | |||||||
Projected benefit obligation | $ | 30,550 | $ | 24,460 | |||
Accumulated benefit obligation | 26,379 | 19,732 | |||||
Fair value of plan assets | 44 | 104 | |||||
Costs
The components of net periodic benefit costs recognized in the Consolidated Statements of Earnings were as follows:
Pension | Postretirement | |||||||||||||||||||||||
Years ended June 30, | 2014 | 2013 | 2012 | 2014 | 2013 | 2012 | ||||||||||||||||||
(In thousands) | ||||||||||||||||||||||||
Components of net periodic benefit costs | ||||||||||||||||||||||||
Service cost | $ | 10,196 | $ | 10,100 | $ | 9,434 | $ | 170 | $ | 377 | $ | 450 | ||||||||||||
Interest cost | 5,604 | 4,911 | 5,987 | 480 | 611 | 798 | ||||||||||||||||||
Expected return on plan assets | (9,687 | ) | (9,465 | ) | (10,014 | ) | — | — | — | |||||||||||||||
Prior service cost (credit) amortization | 391 | 359 | 368 | (440 | ) | (537 | ) | (536 | ) | |||||||||||||||
Actuarial loss (gain) amortization | 2,030 | 3,250 | 1,605 | (365 | ) | — | — | |||||||||||||||||
Curtailment credit | — | — | — | (1,511 | ) | — | — | |||||||||||||||||
Net periodic benefit costs (credit) | $ | 8,534 | $ | 9,155 | $ | 7,380 | $ | (1,666 | ) | $ | 451 | $ | 712 | |||||||||||
66
Amounts recognized in the accumulated other comprehensive loss component of shareholders' equity for Company-sponsored plans were as follows:
June 30, 2014 | Pension | Postretirement | Total | ||||||||
(In thousands) | |||||||||||
Unrecognized net actuarial losses (gains), net of taxes | $ | 9,956 | $ | (1,716 | ) | $ | 8,240 | ||||
Unrecognized prior service cost (credit), net of taxes | 728 | (982 | ) | (254 | ) | ||||||
Total | $ | 10,684 | $ | (2,698 | ) | $ | 7,986 | ||||
During fiscal 2015, the Company expects to recognize as part of its net periodic benefit costs $0.7 million of net actuarial losses and $0.2 million of prior-service costs for the pension plans, and $0.4 million of net actuarial gains and $0.4 million of prior service credit for the postretirement plan that are included, net of taxes, in the accumulated other comprehensive loss component of shareholders' equity at June 30, 2014.
Assumptions
Benefit obligations were determined using the following weighted average assumptions:
Pension | Postretirement | |||||||||||
June 30, | 2014 | 2013 | 2014 | 2013 | ||||||||
Weighted average assumptions | ||||||||||||
Discount rate | 3.57 | % | 3.92 | % | 4.00 | % | 4.50 | % | ||||
Rate of compensation increase | 3.50 | % | 3.50 | % | 3.50 | % | 3.50 | % | ||||
Rate of increase in health care cost levels | ||||||||||||
Initial level | NA | NA | 7.00 | % | 7.50 | % | ||||||
Ultimate level | NA | NA | 5.00 | % | 5.00 | % | ||||||
Years to ultimate level | NA | NA | 4 years | 5 years | ||||||||
NA-Not applicable | ||||||||||||
Net periodic benefit costs were determined using the following weighted average assumptions:
Pension | Postretirement | |||||||||||||||||
Years ended June 30, | 2014 | 2013 | 2012 | 2014 | 2013 | 2012 | ||||||||||||
Weighted average assumptions | ||||||||||||||||||
Discount rate | 3.92 | % | 3.50 | % | 4.65 | % | 4.50 | % | 4.10 | % | 5.25 | % | ||||||
Expected return on plan assets | 8.00 | % | 8.00 | % | 8.00 | % | NA | NA | NA | |||||||||
Rate of compensation increase | 3.50 | % | 3.50 | % | 4.50 | % | 3.50 | % | 3.50 | % | 4.50 | % | ||||||
Rate of increase in health care cost levels | ||||||||||||||||||
Initial level | NA | NA | NA | 7.50 | % | 8.00 | % | 8.50 | % | |||||||||
Ultimate level | NA | NA | NA | 5.00 | % | 5.00 | % | 5.00 | % | |||||||||
Years to ultimate level | NA | NA | NA | 5 years | 6 years | 7 years | ||||||||||||
NA-Not applicable | ||||||||||||||||||
The expected return on plan assets assumption was determined, with the assistance of the Company's investment consultants, based on a variety of factors. These factors include but are not limited to the plans' asset allocations, review of historical capital market performance, historical plan performance, current market factors such as inflation and interest rates, and a forecast of expected future asset returns. The Company reviews this long-term assumption on a periodic basis.
67
Assumed rates of increase in healthcare cost have a significant effect on the amounts reported for the healthcare plans. A change of one percentage point in the assumed healthcare cost trend rates would have the following effects:
One Percentage Point Increase | One Percentage Point Decrease | ||||||||||
(In thousands) | |||||||||||
Effect on service and interest cost components for fiscal 2014 | $ | 35 | $ | (28 | ) | ||||||
Effect on postretirement benefit obligation as of June 30, 2014 | 434 | (362 | ) | ||||||||
Plan Assets
The targeted and weighted average asset allocations by asset category for investments held by the Company's pension plans are as follows:
2014 Allocation | 2013 Allocation | |||||||||||
June 30, | Target | Actual | Target | Actual | ||||||||
Domestic equity securities | 35 | % | 36 | % | 35 | % | 34 | % | ||||
Fixed income investments | 30 | % | 27 | % | 30 | % | 28 | % | ||||
International equity securities | 25 | % | 26 | % | 25 | % | 27 | % | ||||
Global equity securities | 10 | % | 11 | % | 10 | % | 11 | % | ||||
Fair value of plan assets | 100 | % | 100 | % | 100 | % | 100 | % | ||||
Meredith's investment policy seeks to maximize investment returns while balancing the Company's tolerance for risk. The plan fiduciaries oversee the investment allocation process. This includes selecting investment managers, setting long-term strategic targets, and monitoring asset allocations. Target allocation ranges are guidelines, not limitations, and plan fiduciaries may occasionally approve allocations above or below a target range, or elect to rebalance the portfolio within the targeted range. The investment portfolio contains a diversified blend of equity and fixed-income investments. Furthermore, equity investments are diversified across domestic and international stocks and between growth and value stocks and small and large capitalizations. The primary investment strategy currently employed is a dynamic target allocation method that periodically rebalances among various investment categories depending on the current funded position. This program is designed to actively move from return-seeking investments (such as equities) toward liability-hedging investments (such as long-duration fixed-income) as funding levels improve. The reverse effect occurs when funding levels decrease.
Equity securities did not include any Meredith Corporation common or Class B stock at June 30, 2014 or 2013.
Cash Flows
Although we do not have a minimum funding requirement for the pension plans in fiscal 2015, the Company is currently determining what voluntary pension plan contributions, if any, will be made in fiscal 2015. Actual contributions will be dependent upon investment returns, changes in pension obligations, and other economic and regulatory factors. Meredith expects to contribute $0.8 million to its postretirement plan in fiscal 2015.
68
The following benefit payments, which reflect expected future service as appropriate, are expected to be paid:
Years ending June 30, | Pension Benefits | Postretirement Benefits | ||||||||
(In thousands) | ||||||||||
2015 | $ | 16,799 | $ | 770 | ||||||
2016 | 23,081 | 791 | ||||||||
2017 | 15,805 | 802 | ||||||||
2018 | 15,696 | 806 | ||||||||
2019 | 14,935 | 784 | ||||||||
2020-2024 | 84,791 | 3,508 | ||||||||
Other
The Company maintains collateral assignment split-dollar life insurance arrangements on certain key officers and retirees. The net periodic pension cost for fiscal 2014, 2013, and 2012 was $0.3 million, $0.3 million, and $0.2 million, respectively, and the accrued liability at June 30, 2014 and 2013, was $4.1 million and $4.0 million, respectively.
9. Earnings per Share
The calculation of basic earnings per share for each period is based on the weighted average number of common and Class B shares outstanding during the period. The calculation of diluted earnings per share for each period is based on the weighted average number of common and Class B shares outstanding during the period plus the effect, if any, of dilutive common stock equivalent shares.
The following table presents the calculations of earnings per share:
Years ended June 30, | 2014 | 2013 | 2012 | ||||||||
(In thousands except per share data) | |||||||||||
Net earnings | $ | 113,541 | $ | 123,650 | $ | 104,372 | |||||
Basic average shares outstanding | 44,636 | 44,455 | 44,825 | ||||||||
Dilutive effect of stock options and equivalents | 774 | 630 | 275 | ||||||||
Diluted average shares outstanding | 45,410 | 45,085 | 45,100 | ||||||||
Earnings per share | |||||||||||
Basic | $ | 2.54 | $ | 2.78 | $ | 2.33 | |||||
Diluted | 2.50 | 2.74 | 2.31 | ||||||||
In addition, antidilutive options excluded from the above calculations totaled 1.8 million options for the year ended June 30, 2014 ($50.54 weighted average exercise price), 3.1 million options for the year ended June 30, 2013 ($46.56 weighted average exercise price), and 4.2 million options for the year ended June 30, 2012 ($42.66 weighted average exercise price).
10. Capital Stock
The Company has two classes of common stock outstanding: common and Class B. Each class receives equal dividends per share. Class B stock, which has 10 votes per share, is not transferable as Class B stock except to family members of the holder or certain other related entities. At any time, Class B stock is convertible, share for share, into common stock with one vote per share. Class B stock transferred to persons or entities not entitled to
69
receive it as Class B stock will automatically be converted and issued as common stock to the transferee. The principal market for trading the Company's common stock is the New York Stock Exchange (trading symbol MDP). No separate public trading market exists for the Company's Class B stock.
From time to time, the Company's Board of Directors has authorized the repurchase of shares of the Company's common stock on the open market. In October 2011, the Board approved the repurchase of $100.0 million of shares. In May 2014, the Board approved the repurchase of an additional $100.0 million of shares. As of June 30, 2014, $108.2 million remained available under the current authorizations for future repurchases.
Repurchases of the Company's common and Class B stock are as follows:
Years ended June 30, | 2014 | 2013 | 2012 | ||||||||
(In thousands) | |||||||||||
Number of shares | 1,640 | 1,477 | 976 | ||||||||
Cost at market value | $ | 78,226 | $ | 54,734 | $ | 26,881 | |||||
Effective July 1, 2013, shares deemed to be delivered to the Company on tender of stock in payment for the exercise price of options are no longer included as part of our repurchase program and thus they do not reduce the repurchase authority granted by our Board. Shares delivered or deemed to be delivered to us in satisfaction of tax withholding on option exercises and the vesting of restricted shares continue to reduce the repurchase authority granted by our Board. During fiscal 2014, 1.1 million shares at a cost of $54.1 million were tendered for the exercise price of options.
11. Common Stock and Share-based Compensation Plans
Meredith has an employee stock purchase plan and a stock incentive plan, both of which are shareholder-approved. More detailed descriptions of these plans follows. Compensation expense recognized for these plans was $12.2 million in fiscal 2014, $11.5 million in fiscal 2013, and $10.5 million in fiscal 2012. The total income tax benefit recognized in earnings was $4.5 million in fiscal 2014, $4.2 million in fiscal 2013, and $3.9 million in fiscal 2012.
Employee Stock Purchase Plan
Meredith has an employee stock purchase plan (ESPP) available to substantially all employees. The ESPP allows employees to purchase shares of Meredith common stock through payroll deductions at the lesser of 85 percent of the fair market value of the stock on either the first or last trading day of an offering period. The ESPP has quarterly offering periods. One million five hundred thousand common shares are authorized and approximately 362,000 shares remain available for issuance under the ESPP. Compensation cost for the ESPP is based on the present value of the cash discount and the fair value of the call option component as of the grant date using the Black-Scholes option-pricing model. The term of the option is three months, the term of the offering period. The expected stock price volatility was 36 percent in fiscal 2014, 35 percent in fiscal 2013, and 32 percent in fiscal 2012. Information about the shares issued under this plan is as follows:
Years ended June 30, | 2014 | 2013 | 2012 | ||||||||
Shares issued (in thousands) | 86 | 130 | 135 | ||||||||
Average fair value | $ | 7.59 | $ | 5.55 | $ | 4.43 | |||||
Average purchase price | 40.30 | 29.50 | 22.60 | ||||||||
Average market price | 48.36 | 38.56 | 29.15 | ||||||||
70
Stock Incentive Plan
Meredith has a stock incentive plan that permits the Company to issue up to approximately 6.9 million shares (including unused shares under prior plans) in the form of stock options, restricted stock, stock equivalent units, restricted stock units, and performance shares to key employees and directors of the Company. Approximately 5.3 million shares remained available for future awards under the plan as of June 30, 2014. Forfeited awards, shares deemed to be delivered to us on tender of stock in payment for the exercise price of options, and shares reacquired pursuant to tax withholding on option exercises and the vesting of restricted shares increase shares available for future awards. The plan is designed to provide an incentive to contribute to the achievement of long-range corporate goals; provide flexibility in motivating, attracting, and retaining employees; and to align more closely the employees' interests with those of shareholders.
The Company has awarded restricted shares of common stock to eligible key employees and to non-employee directors under the plan. In addition, certain awards are granted based on specified levels of Company stock ownership. All awards have restriction periods tied primarily to employment and/or service. The awards generally vest over three or five years. The awards are recorded at the market value of traded shares on the date of the grant as unearned compensation. The initial values of the grants, net of estimated forfeitures, are amortized over the vesting periods.
The Company's restricted stock activity during the year ended June 30, 2014, was as follows:
Restricted Stock | Shares | Weighted Average Grant Date Fair Value | Aggregate Intrinsic Value | ||||||||||||
(Shares and Aggregate Intrinsic Value in thousands) | |||||||||||||||
Nonvested at June 30, 2013 | 576 | $ | 30.96 | ||||||||||||
Granted | 179 | 48.01 | |||||||||||||
Vested | (146 | ) | 31.79 | ||||||||||||
Forfeited | (44 | ) | 35.71 | ||||||||||||
Nonvested at June 30, 2014 | 565 | 35.77 | $ | 27,341 | |||||||||||
As of June 30, 2014, there was $6.0 million of unearned compensation cost related to restricted stock granted under the plan. That cost is expected to be recognized over a weighted average period of 1.8 years. The weighted average grant date fair value of restricted stock granted during the years ended June 30, 2014, 2013, and 2012 was $48.01, $34.69, and $25.97, respectively. The total fair value of shares vested during the years ended June 30, 2014, 2013, and 2012, was $6.2 million, $5.6 million, and $0.9 million, respectively.
Meredith also has outstanding stock equivalent units resulting from the deferral of compensation of employees and directors under various deferred compensation plans. The period of deferral is specified when the deferral election is made. These stock equivalent units are issued at the market price of the underlying stock on the date of deferral. In addition, shares of restricted stock may be converted to stock equivalent units upon vesting.
71
The following table summarizes the activity for stock equivalent units during the year ended June 30, 2014:
Stock Equivalent Units | Units | Weighted Average Issue Date Fair Value | Aggregate Intrinsic Value | |||||||||||
(Units and Aggregate Intrinsic Value in thousands) | ||||||||||||||
Balance at June 30, 2013 | 201 | $ | 35.60 | |||||||||||
Additions | 42 | 49.45 | ||||||||||||
Converted to common stock | (14 | ) | 35.31 | |||||||||||
Balance at June 30, 2014 | 229 | 38.19 | $ | 2,332 | ||||||||||
The total intrinsic value of stock equivalent units converted to common stock was $0.1 million in fiscal 2014 and zero for fiscal years 2013 and 2012.
Meredith has granted nonqualified stock options to certain employees and directors under the plan. The grant date of options issued is the date the Compensation Committee of the Board of Directors approves the granting of the options. The exercise price of options granted is set at the fair value of the Company's common stock on the grant date. All options granted under the plan expire at the end of 10 years. Options granted vest three years from the date of grant.
A summary of stock option activity and weighted average exercise prices follows:
Stock Options | Options | Weighted Average Exercise Price | Weighted Average Remaining Contractual Term | Aggregate Intrinsic Value | |||||||||||
(Options and Aggregate Intrinsic Value in thousands) | |||||||||||||||
Outstanding July 1, 2013 | 4,916 | $ | 39.76 | ||||||||||||
Granted | 464 | 48.23 | |||||||||||||
Exercised | (1,323 | ) | 41.21 | ||||||||||||
Forfeited | (179 | ) | 40.11 | ||||||||||||
Outstanding June 30, 2014 | 3,878 | 40.26 | 5.0 | $ | 35,305 | ||||||||||
Exercisable June 30, 2014 | 2,155 | 44.39 | 2.6 | 12,300 | |||||||||||
The fair value of each option is estimated as of the date of grant using the Black-Scholes option-pricing model. Expected volatility is based on historical volatility of the Company's common stock and other factors. The expected life of options granted incorporates historical employee exercise and termination behavior. Different expected lives are used for separate groups of employees who have similar historical exercise patterns. The risk-free rate for periods that coincide with the expected life of the options is based on the U.S. Treasury yield curve in effect at the time of grant.
The following summarizes the assumptions used in determining the fair value of options granted:
Years ended June 30, | 2014 | 2013 | 2012 | |||||
Risk-free interest rate | 1.9-2.1% | 0.4-1.3% | 0.4-1.6% | |||||
Expected dividend yield | 4.20 | % | 5.00 | % | 5.00 | % | ||
Expected option life | 7-8 yrs | 7-8 yrs | 7-8 yrs | |||||
Expected stock price volatility | 36 | % | 35 | % | 32 | % | ||
72
The weighted average grant date fair value of options granted during the years ended June 30, 2014, 2013, and 2012, was $11.41, $6.62, and $4.45, respectively. The total intrinsic value of options exercised during the years ended June 30, 2014, 2013, and 2012 was $9.6 million, $12.0 million, and $0.2 million, respectively. As of June 30, 2014, there was $3.5 million in unrecognized compensation cost for stock options granted under the plan. This cost is expected to be recognized over a weighted average period of 1.7 years.
Cash received from option exercises under all share-based payment plans for the years ended June 30, 2014, 2013, and 2012 was $54.5 million, $34.7 million, and $1.6 million, respectively. The actual tax benefit realized for the tax deductions from option exercises totaled $3.7 million, $4.7 million, and $0.1 million, respectively, for the years ended June 30, 2014, 2013, and 2012.
12. Commitments and Contingent Liabilities
The Company occupies certain facilities and sales offices and uses certain equipment under lease agreements. Rental expense for such leases was $20.2 million in fiscal 2014, $20.5 million in fiscal 2013, and $21.1 million in fiscal 2012.
Below are the minimum rental commitments at June 30, 2014, under all noncancelable operating leases due in succeeding fiscal years:
Years ending June 30, | |||
(In thousands) | |||
2015 | $ | 18,801 | |
2016 | 18,107 | ||
2017 | 17,165 | ||
2018 | 14,462 | ||
2019 | 13,225 | ||
Thereafter | 88,903 | ||
Total minimum rentals | $ | 170,663 | |
Most of the future lease payments relate to the lease of office facilities in New York City through December 31, 2026. In the normal course of business, leases that expire are generally renewed or replaced by leases on similar properties.
The Company has recorded commitments for broadcast rights payable in future fiscal years. The Company also is obligated to make payments under contracts for broadcast rights not currently available for use and therefore not included in the consolidated financial statements. Such unavailable rights amounted to $29.5 million at June 30, 2014. The fair value of these commitments for unavailable broadcast rights, determined by the present value of future cash flows discounted at the Company's current borrowing rate, was $28.1 million at June 30, 2014.
73
The table shows broadcast rights payments due in succeeding fiscal years:
Years ending June 30, | Recorded Commitments | Unavailable Rights | ||||||||
(In thousands) | ||||||||||
2015 | $ | 4,511 | $ | 10,101 | ||||||
2016 | 2,062 | 11,099 | ||||||||
2017 | 1,142 | 6,398 | ||||||||
2018 | 627 | 1,692 | ||||||||
2019 | 236 | 175 | ||||||||
Thereafter | 260 | — | ||||||||
Total amounts payable | $ | 8,838 | $ | 29,465 | ||||||
The Company is involved in certain litigation and claims arising in the normal course of business. In the opinion of management, liabilities, if any, arising from existing litigation and claims are not expected to have a material effect on the Company's earnings, financial position, or liquidity.
13. Other Comprehensive Income (Loss)
Comprehensive income (loss) is defined as the change in equity during a period from transactions and other events and circumstances from nonowner sources. Comprehensive income (loss) includes net earnings as well as items of other comprehensive income (loss).
The following table summarizes the items of other comprehensive income (loss) and the accumulated other comprehensive loss balances:
Minimum Pension/Post Retirement Liability Adjustments | ||||
(In thousands) | ||||
Balance at June 30, 2011 | $ | (16,163 | ) | |
Current-year adjustments, pretax | (11,397 | ) | ||
Tax benefit | 4,445 | |||
Other comprehensive loss | (6,952 | ) | ||
Balance at June 30, 2012 | (23,115 | ) | ||
Current-year adjustments, pretax | 10,997 | |||
Tax expense | (4,223 | ) | ||
Other comprehensive income | 6,774 | |||
Balance at June 30, 2013 | (16,341 | ) | ||
Current-year adjustments, pretax | 12,310 | |||
Tax expense | (4,727 | ) | ||
Other comprehensive income | 7,583 | |||
Balance at June 30, 2014 | (8,758 | ) | ||
74
14. Fair Value Measurement
Accounting standards define fair value as the price that would be received to sell an asset or paid to transfer a liability in an orderly transaction between market participants at the measurement date. Specifically, it establishes a hierarchy prioritizing the use of inputs in valuation techniques. The defined levels within the hierarchy are as follows:
• Level 1 | Quoted prices (unadjusted) in active markets for identical assets or liabilities; |
• Level 2 | Inputs other than quoted prices included within Level 1 that are either directly or indirectly |
observable;
• Level 3 | Assets or liabilities for which fair value is based on valuation models with significant unobservable |
pricing inputs and which result in the use of management estimates.
The following table sets forth the carrying value and the estimated fair value of the Company's financial instruments:
June 30, 2014 | June 30, 2013 | |||||||||||||||
(In thousands) | Carrying Value | Fair Value | Carrying Value | Fair Value | ||||||||||||
Broadcast rights payable | $ | 8,838 | $ | 8,408 | $ | 9,185 | $ | 8,723 | ||||||||
Long-term debt | 715,000 | 717,032 | 350,000 | 350,132 | ||||||||||||
The fair value of broadcast rights payable was determined using the present value of expected future cash flows discounted at the Company's current borrowing rate with inputs included in Level 3. The fair value of long-term debt was determined using the present value of expected future cash flows using borrowing rates currently available for debt with similar terms and maturities with inputs included in Level 2.
As of June 30, 2014, the Company had assets related to its qualified pension plans measured at fair value. The required disclosures regarding such assets are presented within Note 8. In addition, the Company has liabilities related to contingent consideration payables that are valued at estimated fair value as discussed in Note 2. The Company does not have any other assets or liabilities recognized at fair value.
15. Financial Information about Industry Segments
Meredith is a diversified media company focused primarily on the home and family marketplace. On the basis of products and services, the Company has established two reportable segments: national media and local media. The national media segment includes magazine publishing, customer relationship marketing, digital and mobile media, brand licensing, database-related activities, and other related operations. The local media segment consists primarily of the operations of network-affiliated television stations. Virtually all of the Company's revenues are generated in the U.S. and substantially all of the assets reside within the U.S. There are no material intersegment transactions.
There are two principal financial measures reported to the chief executive officer (the chief operating decision maker) for use in assessing segment performance and allocating resources. Those measures are operating profit and earnings before interest, taxes, depreciation, and amortization (EBITDA). Operating profit for segment reporting, disclosed below, is revenues less operating costs and unallocated corporate expenses. Segment operating expenses include allocations of certain centrally incurred costs such as employee benefits, occupancy, information systems, accounting services, internal legal staff, and human resources administration. These costs are allocated based on actual usage or other appropriate methods, primarily number of employees. Unallocated corporate expenses are corporate overhead expenses not attributable to the operating groups. Interest income and expense are not allocated to the segments. In accordance with authoritative guidance on disclosures about segments of an enterprise and related information, EBITDA is not presented below.
75
Significant non-cash items included in segment operating expenses other than depreciation and amortization of fixed and intangible assets is the amortization of broadcast rights in the local media segment. Broadcast rights amortization totaled $8.8 million in fiscal 2014, $9.7 million in fiscal 2013, and $11.9 million in fiscal 2012.
Segment assets include intangible, fixed, and all other non-cash assets identified with each segment. Jointly used assets such as office buildings and information technology equipment are allocated to the segments by appropriate methods, primarily number of employees. Unallocated corporate assets consist primarily of cash and cash items, assets allocated to or identified with corporate staff departments, and other miscellaneous assets not assigned to a segment.
The following table presents financial information by segment:
Years ended June 30, | 2014 | 2013 | 2012 | ||||||||
(In thousands) | |||||||||||
Revenues | |||||||||||
National media | $ | 1,065,898 | $ | 1,095,195 | $ | 1,060,385 | |||||
Local media | 402,810 | 376,145 | 316,302 | ||||||||
Total revenues | $ | 1,468,708 | $ | 1,471,340 | $ | 1,376,687 | |||||
Segment profit | |||||||||||
National media | $ | 113,113 | $ | 137,985 | $ | 133,020 | |||||
Local media | 113,060 | 124,116 | 88,291 | ||||||||
Unallocated corporate | (39,658 | ) | (51,267 | ) | (35,540 | ) | |||||
Income from operations | 186,515 | 210,834 | 185,771 | ||||||||
Interest expense, net | (12,176 | ) | (13,430 | ) | (12,896 | ) | |||||
Earnings before income taxes | $ | 174,339 | $ | 197,404 | $ | 172,875 | |||||
Depreciation and amortization | |||||||||||
National media | $ | 29,455 | $ | 19,199 | $ | 17,617 | |||||
Local media | 28,815 | 24,471 | 24,732 | ||||||||
Unallocated corporate | 1,658 | 1,680 | 1,977 | ||||||||
Total depreciation and amortization | $ | 59,928 | $ | 45,350 | $ | 44,326 | |||||
Assets | |||||||||||
National media | $ | 1,422,855 | $ | 1,454,225 | $ | 1,332,505 | |||||
Local media | 996,935 | 587,611 | 589,096 | ||||||||
Unallocated corporate | 124,010 | 98,223 | 94,698 | ||||||||
Total assets | $ | 2,543,800 | $ | 2,140,059 | $ | 2,016,299 | |||||
Capital expenditures | |||||||||||
National media | $ | 5,491 | $ | 6,455 | $ | 8,544 | |||||
Local media | 16,578 | 14,688 | 13,385 | ||||||||
Unallocated corporate | 2,753 | 4,826 | 13,789 | ||||||||
Total capital expenditures | $ | 24,822 | $ | 25,969 | $ | 35,718 | |||||
76
16. Selected Quarterly Financial Data (unaudited)
Year ended June 30, 2014 | First Quarter | Second Quarter | Third Quarter | Fourth Quarter | Total | ||||||||||||||
(In thousands except per share data) | |||||||||||||||||||
Revenues | |||||||||||||||||||
National media | $ | 266,899 | $ | 249,694 | $ | 269,680 | $ | 279,625 | $ | 1,065,898 | |||||||||
Local media | 89,553 | 104,354 | 97,734 | 111,169 | 402,810 | ||||||||||||||
Total revenues | $ | 356,452 | $ | 354,048 | $ | 367,414 | $ | 390,794 | $ | 1,468,708 | |||||||||
Operating profit | |||||||||||||||||||
National media | $ | 28,076 | $ | 28,070 | $ | 13,614 | $ | 43,353 | $ | 113,113 | |||||||||
Local media | 25,676 | 35,225 | 26,696 | 25,463 | 113,060 | ||||||||||||||
Unallocated corporate | (10,944 | ) | (11,394 | ) | (9,081 | ) | (8,239 | ) | (39,658 | ) | |||||||||
Income from operations | $ | 42,808 | $ | 51,901 | $ | 31,229 | $ | 60,577 | $ | 186,515 | |||||||||
Net earnings | $ | 24,041 | $ | 30,569 | $ | 18,486 | $ | 40,445 | $ | 113,541 | |||||||||
Basic earnings per share | 0.54 | 0.68 | 0.41 | 0.91 | 2.54 | ||||||||||||||
Diluted earnings per share | 0.53 | 0.67 | 0.41 | 0.89 | 2.50 | ||||||||||||||
Dividends per share | 0.4075 | 0.4075 | 0.4325 | 0.4325 | 1.6800 | ||||||||||||||
In the second quarter of fiscal 2014, the Company recorded $1.6 million in acquisition transaction costs related to the acquisitions of television stations. Also in the second quarter, the Company recorded a reduction in contingent consideration payable of $1.1 million.
In the third quarter of fiscal 2014, the Company recorded a pre-tax restructuring charge of $20.8 million and acquisition transaction costs related to the acquisitions of television stations of $1.5 million. Also in the third quarter, the Company recorded a reduction in contingent consideration payable of $2.3 million and $1.4 million in reversals of excess restructuring reserves accrued in prior fiscal years. Additionally, deferred financing costs of $0.6 million were written off to interest expense as a result of refinancing the revolving credit facility.
In the fourth quarter of fiscal 2014, the Company recorded a pre-tax restructuring charge of $3.7 million and acquisition transaction costs related to the acquisitions of television stations of $2.4 million. The Company recorded a reduction in contingent consideration payable of $2.3 million in the fourth quarter of fiscal 2014.
77
Year ended June 30, 2013 | First Quarter | Second Quarter | Third Quarter | Fourth Quarter | Total | ||||||||||||||
(In thousands except per share data) | |||||||||||||||||||
Revenues | |||||||||||||||||||
National media | $ | 266,970 | $ | 249,436 | $ | 284,228 | $ | 294,561 | $ | 1,095,195 | |||||||||
Local media | 87,187 | 111,159 | 85,387 | 92,412 | 376,145 | ||||||||||||||
Total revenues | $ | 354,157 | $ | 360,595 | $ | 369,615 | $ | 386,973 | $ | 1,471,340 | |||||||||
Operating profit | |||||||||||||||||||
National media | $ | 29,424 | $ | 22,177 | $ | 42,991 | $ | 43,393 | $ | 137,985 | |||||||||
Local media | 27,644 | 44,711 | 24,085 | 27,676 | 124,116 | ||||||||||||||
Unallocated corporate | (11,763 | ) | (9,435 | ) | (17,030 | ) | (13,039 | ) | (51,267 | ) | |||||||||
Income from operations | $ | 45,305 | $ | 57,453 | $ | 50,046 | $ | 58,030 | $ | 210,834 | |||||||||
Net earnings | $ | 24,855 | $ | 35,571 | $ | 29,421 | $ | 33,803 | $ | 123,650 | |||||||||
Basic earnings per share | 0.56 | 0.80 | 0.66 | 0.76 | 2.78 | ||||||||||||||
Diluted earnings per share | 0.55 | 0.79 | 0.65 | 0.75 | 2.74 | ||||||||||||||
Dividends per share | 0.3825 | 0.3825 | 0.4075 | 0.4075 | 1.5800 | ||||||||||||||
In the second quarter of fiscal 2013, the Company recorded a pre-tax restructuring charge of $7.8 million. Partially offsetting these charges was a reversal of excess restructuring accrual of $0.8 million previously recorded by the national media segment.
In the third quarter of fiscal 2013, the Company recorded pre-tax expenses of $5.1 million for professional fees and expenses related to a strategic transaction that did not materialize and a $2.5 million reduction in contingent consideration payable.
As a result of changes in shares outstanding during the year, the sum of the four quarters' earnings per share may not necessarily equal the earnings per share for the year.
78
Meredith Corporation and Subsidiaries
FIVE-YEAR FINANCIAL HISTORY WITH SELECTED FINANCIAL DATA
Years ended June 30, | 2014 | 2013 | 2012 | 2011 | 2010 | ||||||||||||||
(In thousands except per share data) | |||||||||||||||||||
Results of operations | |||||||||||||||||||
Revenues | $ | 1,468,708 | $ | 1,471,340 | $ | 1,376,687 | $ | 1,400,480 | $ | 1,382,831 | |||||||||
Costs and expenses | 1,222,265 | 1,215,156 | 1,146,590 | 1,135,644 | 1,156,820 | ||||||||||||||
Depreciation and amortization | 59,928 | 45,350 | 44,326 | 39,545 | 40,889 | ||||||||||||||
Income from operations | 186,515 | 210,834 | 185,771 | 225,291 | 185,122 | ||||||||||||||
Net interest expense | (12,176 | ) | (13,430 | ) | (12,896 | ) | (12,938 | ) | (18,533 | ) | |||||||||
Income taxes | (60,798 | ) | (73,754 | ) | (68,503 | ) | (80,743 | ) | (60,955 | ) | |||||||||
Earnings from continuing operations | 113,541 | 123,650 | 104,372 | 131,610 | 105,634 | ||||||||||||||
Discontinued operations | — | — | — | (4,178 | ) | (1,671 | ) | ||||||||||||
Net earnings | $ | 113,541 | $ | 123,650 | $ | 104,372 | $ | 127,432 | $ | 103,963 | |||||||||
Basic per share information | |||||||||||||||||||
Earnings from continuing operations | $ | 2.54 | $ | 2.78 | $ | 2.33 | $ | 2.89 | $ | 2.34 | |||||||||
Discontinued operations | — | — | — | (0.09 | ) | (0.04 | ) | ||||||||||||
Net earnings | $ | 2.54 | $ | 2.78 | $ | 2.33 | $ | 2.80 | $ | 2.30 | |||||||||
Diluted per share information | |||||||||||||||||||
Earnings from continuing operations | $ | 2.50 | $ | 2.74 | $ | 2.31 | $ | 2.87 | $ | 2.32 | |||||||||
Discontinued operations | — | — | — | (0.09 | ) | (0.04 | ) | ||||||||||||
Net earnings | $ | 2.50 | $ | 2.74 | $ | 2.31 | $ | 2.78 | $ | 2.28 | |||||||||
Average diluted shares outstanding | 45,410 | 45,085 | 45,100 | 45,832 | 45,544 | ||||||||||||||
Other per share information | |||||||||||||||||||
Dividends | $ | 1.6800 | $ | 1.5800 | $ | 1.4025 | $ | 0.9700 | $ | 0.9100 | |||||||||
Stock price-high | 53.84 | 48.37 | 35.00 | 37.51 | 38.08 | ||||||||||||||
Stock price-low | 40.11 | 29.27 | 21.10 | 28.92 | 23.61 | ||||||||||||||
Financial position at June 30, | |||||||||||||||||||
Current assets | $ | 470,012 | $ | 407,692 | $ | 359,436 | $ | 333,738 | $ | 381,427 | |||||||||
Working capital | (13,091 | ) | (48,979 | ) | (123,150 | ) | (75,254 | ) | (56,879 | ) | |||||||||
Total assets | 2,543,800 | 2,140,059 | 2,016,299 | 1,712,829 | 1,727,316 | ||||||||||||||
Long-term obligations (including current portion) | 723,838 | 359,185 | 390,447 | 208,979 | 318,853 | ||||||||||||||
Shareholders' equity | 891,652 | 854,296 | 797,445 | 774,985 | 688,345 | ||||||||||||||
Number of employees at June 30, | 3,639 | 3,347 | 3,366 | 3,192 | 3,182 | ||||||||||||||
NOTES TO FIVE-YEAR FINANCIAL HISTORY WITH SELECTED FINANCIAL DATA
General
This selected financial data should be read in conjunction with the consolidated financial statements and related notes included in Item 8-Financial Statements and Supplementary Data of this Form 10-K. Over the last five fiscal years, we have acquired a number of companies. The results of our acquired companies have been included in our consolidated financial statements since their respective dates of acquisition. Long-term obligations include broadcast rights payable and Company debt associated with continuing operations. Shareholders' equity includes temporary equity where applicable.
Discontinued operations
Fiscal 2011 included the operations of and related shut-down charges of ReadyMade magazine.
Fiscal 2010 included the operations of ReadyMade magazine.
79
Meredith Corporation and Subsidiaries
SCHEDULE II-VALUATION AND QUALIFYING ACCOUNTS
Additions | |||||||||||||||||||
Reserves Deducted from Receivables in the Consolidated Financial Statements: | Balance at beginning of period | Charged to costs and expenses | Charged to other accounts | Deductions | Balance at end of period | ||||||||||||||
(In thousands) | |||||||||||||||||||
Fiscal year ended June 30, 2014 | |||||||||||||||||||
Reserve for doubtful accounts | $ | 6,653 | $ | 3,177 | $ | — | $ | (4,366 | ) | $ | 5,464 | ||||||||
Reserve for returns | 3,906 | 4,662 | — | (6,219 | ) | 2,349 | |||||||||||||
Total | $ | 10,559 | $ | 7,839 | $ | — | $ | (10,585 | ) | $ | 7,813 | ||||||||
Fiscal year ended June 30, 2013 | |||||||||||||||||||
Reserve for doubtful accounts | $ | 9,126 | $ | 3,099 | $ | — | $ | (5,572 | ) | $ | 6,653 | ||||||||
Reserve for returns | 4,310 | 14,261 | — | (14,665 | ) | 3,906 | |||||||||||||
Total | $ | 13,436 | $ | 17,360 | $ | — | $ | (20,237 | ) | $ | 10,559 | ||||||||
Fiscal year ended June 30, 2012 | |||||||||||||||||||
Reserve for doubtful accounts | $ | 6,379 | $ | 4,841 | $ | — | $ | (2,094 | ) | $ | 9,126 | ||||||||
Reserve for returns | 4,444 | 13,763 | — | (13,897 | ) | 4,310 | |||||||||||||
Total | $ | 10,823 | $ | 18,604 | $ | — | $ | (15,991 | ) | $ | 13,436 | ||||||||
ITEM 9. CHANGES IN AND DISAGREEMENTS WITH ACCOUNTANTS ON ACCOUNTING AND FINANCIAL DISCLOSURE
None.
ITEM 9A. CONTROLS AND PROCEDURES
Evaluation of Disclosure Controls and Procedures
Meredith conducted an evaluation under the supervision and with the participation of management, including the Chief Executive Officer and Chief Financial Officer, of the effectiveness of the Company's disclosure controls and procedures (as defined in Rule 13a-15(e) and 15d-15(e) of the Securities Exchange Act of 1934 as amended (the Exchange Act)) as of June 30, 2014. On the basis of this evaluation, Meredith's Chief Executive Officer and Chief Financial Officer have concluded the Company's disclosure controls and procedures are effective in ensuring that information required to be disclosed in the reports that Meredith files or submits under the Exchange Act are (i) recorded, processed, summarized, and reported within the time periods specified in the Securities and Exchange Commission's rules and forms and (ii) accumulated and communicated to Meredith's management, including the Chief Executive Officer and Chief Financial Officer, to allow timely decisions regarding required disclosures.
Management's Report on Internal Control over Financial Reporting
The Company's management is responsible for establishing and maintaining adequate internal control over financial reporting, as such term is defined in Rule 13a-15(f) and 15d-15(f) of the Securities Exchange Act of 1934, as amended. Under the supervision and with the participation of management, including the Chief Executive Officer
80
and Chief Financial Officer, the Company conducted an evaluation of the effectiveness of the design and operation of internal control over financial reporting based on criteria established in Internal Control-Integrated Framework (1992 framework) issued by the Committee of Sponsoring Organizations of the Treadway Commission (COSO). On the basis of that evaluation, management concluded that internal control over financial reporting was effective as of June 30, 2014.
KPMG LLP, an independent registered public accounting firm, has issued an audit report on the effectiveness of the Company's internal control over financial reporting. This report appears on page 39.
Changes in Internal Control over Financial Reporting
There have been no changes in the Company's internal control over financial reporting during the quarter ended June 30, 2014, that have materially affected or are reasonably likely to materially affect the Company's internal control over financial reporting.
ITEM 9B. OTHER INFORMATION
Not applicable.
PART III | ||
ITEM 10. DIRECTORS, EXECUTIVE OFFICERS, AND CORPORATE GOVERNANCE
The information required by this Item is set forth in Registrant's Proxy Statement for the Annual Meeting of Shareholders to be held on November 12, 2014, under the captions "Election of Directors," "Corporate Governance," "Meetings and Committees of the Board" and "Section 16(a) Beneficial Ownership Reporting Compliance," and in Part I of this Form 10-K beginning on page 9 under the caption "Executive Officers of the Company" and is incorporated herein by reference.
The Company has adopted a Code of Business Conduct and Ethics and a Code of Ethics for CEO and Senior Financial Officers. These codes are applicable to the Chief Executive Officer, Chief Financial Officer, Controller, and any persons performing similar functions. The Company's Code of Business Conduct and Ethics and the Company's Code of Ethics for CEO and Senior Financial Officers are available free of charge on the Company's corporate website at meredith.com. Copies of the codes are also available free of charge upon written request to the Secretary of the Company. The Company will post any amendments to the Code of Business Conduct and Ethics or the Code of Ethics for CEO and Senior Financial Officers, as well as any waivers that are required to be disclosed by the rules of either the U.S. Securities and Exchange Commission or the New York Stock Exchange on the Company's corporate website.
There have been no material changes to the procedures by which shareholders of the Company may recommend nominees to the Company's Board of Directors.
81
ITEM 11. EXECUTIVE COMPENSATION
The information required by this Item is set forth in Registrant's Proxy Statement for the Annual Meeting of Shareholders to be held on November 12, 2014, under the captions "Compensation Discussion and Analysis," "Compensation Committee Report," "Summary Compensation Table," "Director Compensation," and "Compensation Committee Interlocks and Insider Participation" and is incorporated herein by reference.
ITEM 12. SECURITY OWNERSHIP OF CERTAIN BENEFICIAL OWNERS AND MANAGEMENT AND RELATED STOCKHOLDER MATTERS
Certain information required by this Item is set forth in Registrant's Proxy Statement for the Annual Meeting of Shareholders to be held on November 12, 2014, under the captions "Security Ownership of Certain Beneficial Owners and Management" and "Equity Compensation Plans” is incorporated herein by reference.
ITEM 13. CERTAIN RELATIONSHIPS AND RELATED TRANSACTIONS AND DIRECTOR INDEPENDENCE
The information required by this Item is set forth in Registrant's Proxy Statement for the Annual Meeting of Shareholders to be held on November 12, 2014, under the captions "Related Person Transaction Policy and Procedures" and "Corporate Governance - Director Independence" and is incorporated herein by reference.
ITEM 14. PRINCIPAL ACCOUNTING FEES AND SERVICES
The information required by this Item is set forth in Registrant's Proxy Statement for the Annual Meeting of Shareholders to be held on November 12, 2014, under the caption "Audit Committee Disclosure" and is incorporated herein by reference.
82
PART IV | ||
ITEM 15. EXHIBITS, FINANCIAL STATEMENT SCHEDULES
The following consolidated financial statements listed under (a) 1. and the financial statement schedule listed under (a) 2. of the Company and its subsidiaries are filed as part of this report as set forth in the Index on page 38 (Item 8).
(a) | Financial Statements, Financial Statement Schedule, and Exhibits | ||
1. | Financial Statements | ||
Report of Independent Registered Public Accounting Firm | |||
Consolidated Balance Sheets as of June 30, 2014 and 2013 | |||
Consolidated Statements of Earnings for the Years Ended June 30, 2014, 2013, and 2012 | |||
Consolidated Statements of Comprehensive Income for the Years Ended June 30, 2014, 2013, and 2012 | |||
Consolidated Statements of Shareholders' Equity for the Years Ended June 30, 2014, 2013, and 2012 | |||
Consolidated Statements of Cash Flows for the Years Ended June 30, 2014, 2013, and 2012 | |||
Notes to Consolidated Financial Statements | |||
Five-Year Financial History with Selected Financial Data | |||
2. | Financial Statement Schedule for the years ended June 30, 2014, 2013, and 2012 | ||
Schedule II-Valuation and Qualifying Accounts | |||
All other Schedules have been omitted because the items required by such schedules are not present in the consolidated financial statements, are covered in the consolidated financial statements or notes thereto, or are not significant in amount. | |||
3. | Exhibits | ||
Certain of the exhibits to this Form 10-K are incorporated herein by reference, as specified: | |||
(See Index to Attached Exhibits on page E-1 of this Form 10-K.) | |||
2.1 | Asset Purchase Agreement dated as of December 23, 2013 among Gannett Co., Inc. and Meredith Corporation is incorporated herein by reference to Exhibit 2.1 to the Company's Quarterly Report on Form 10-Q for the period ending December 31, 2013. | ||
2.2 | Asset Purchase Agreement dated as of December 23, 2013 among Gannett Co., Inc. and Meredith Corporation is incorporated herein by reference to Exhibit 2.2 to the Company's Quarterly Report on Form 10-Q for the period ending December 31, 2013. | ||
3.1 | The Company's Restated Articles of Incorporation, as amended, are incorporated herein by reference to Exhibit 3.1 to the Company's Quarterly Report on Form 10-Q for the period ended December 31, 2003. | ||
83
3.2 | The Restated Bylaws, as amended, are incorporated herein by reference to Exhibit 3.2 to the Company's Annual Report on Form 10-K for the fiscal year ended June 30, 2004. | ||
4.1 | Note Purchase Agreement dated as of June 16, 2008, among Meredith Corporation, as issuer and seller, and named purchasers is incorporated herein by reference to Exhibit 4.4 to the Company's Annual Report on Form 10-K for the fiscal year ended June 30, 2009. First amendment dated as of July 13, 2009, to the aforementioned agreement is incorporated herein by reference to Exhibit 4.5 to the Company's Annual Report on Form 10-K for the fiscal year ended June 30, 2009. | ||
4.2 | Note Purchase Agreement dated as of July 13, 2009, among Meredith Corporation, as issuer and seller, and named purchasers is incorporated herein by reference to Exhibit 4.3 to the Company's Annual Report on Form 10-K for the fiscal year ended June 30, 2009. | ||
4.3 | Credit Agreement dated June 16, 2010, among Meredith Corporation and a group of banks including Bank of America, N.A., as Administrative Agent and L/C Issuer is incorporated herein by reference to Exhibit 4.1 to the Company's Current Report on Form 8-K filed June 18, 2010. First amendment dated as of September 12, 2012, to the aforementioned agreement is incorporated herein by reference to Exhibit 4.1 to the Company's Quarterly Report on Form 10‑Q for the period ending September 30, 2012. | ||
4.4 | Note Purchase Agreement dated as of February 29, 2012, among Meredith Corporation, as issuer and seller, and named purchasers is incorporated herein by reference to Exhibit 4.1 to the Company's Current Report on Form 8-K filed March 1, 2012. | ||
4.5 | Note Purchase Agreement dated as of February 19, 2014, among Meredith Corporation, as issuer and seller, and named purchasers is incorporated herein by reference to Exhibit 4.1 to the Company's Current Report on Form 8-K filed February 28, 2014. | ||
4.6 | Credit Agreement dated March 27, 2014, among Meredith Corporation and a group of banks including Wells Fargo Bank, National Association, as Administrative Agent, Swingline Lender, and L/C Issuer is incorporated herein by reference to Exhibit 4.1 to the Company's Quarterly Report on Form 10-Q for the period ending March 31, 2014. | ||
10.1 | Indemnification Agreement in the form entered into between the Company and its officers and directors is incorporated herein by reference to Exhibit 10 to the Company's Quarterly Report on Form 10-Q for the period ending December 31, 1988.* | ||
10.2 | Meredith Corporation Deferred Compensation Plan, dated as of November 8, 1993, is incorporated herein by reference to Exhibit 10 to the Company's Quarterly Report on Form 10-Q for the period ending December 31, 1993.* | ||
10.3 | Meredith Corporation Management Incentive Plan is incorporated herein by reference to Exhibit 10.3 to the Company's Annual Report on Form 10-K for the fiscal year ended June 30, 1999.* | ||
10.4 | Meredith Corporation Stock Plan for Non-Employee Directors is incorporated herein by reference to Exhibit 10.2 to the Company's Quarterly Report on Form 10-Q for the period ended December 31, 2002.* | ||
10.5 | Amended and Restated Replacement Benefit Plan effective January 1, 2001, is incorporated herein by reference to Exhibit 10.17 to the Company's Annual Report on Form 10-K for the fiscal year ended June 30, 2003.* | ||
84
10.6 | Amended and Restated Supplemental Benefit Plan effective January 1, 2001, is incorporated herein by reference to Exhibit 10.18 to the Company's Annual Report on Form 10-K for the fiscal year ended June 30, 2003.* | ||
10.7 | Form of Nonqualified Stock Option Award Agreement between Meredith Corporation and the named employee for the 2004 Stock Incentive Plan is incorporated herein by reference to Exhibit 10.3 to the Company's Quarterly Report on Form 10-Q for the period ended December 31, 2004.* | ||
10.8 | Meredith Corporation 2004 Stock Incentive Plan is incorporated herein by reference to Exhibit 10.14 to the Company's Annual Report on Form 10-K for the fiscal year ended June 30, 2008.* | ||
10.9 | Form of Restricted Stock Award Agreement (performance based) between Meredith Corporation and the named employee for the 2004 Stock Incentive Plan is incorporated herein by reference to the Company's Current Report on Form 8-K filed August 18, 2008.* | ||
10.10 | Amended and Restated Severance Agreement in the form entered into between the Company and its executive officers is incorporated herein by reference to Exhibit 10.1 to the Company's Quarterly Report on Form 10-Q for the period ended December 31, 2008. | ||
10.11 | Letter employment agreement dated February 14, 2005, between Meredith Corporation and Paul A. Karpowicz is incorporated by reference to Exhibit 99.1 to the Company's Current Report on Form 8-K filed February 10, 2005. First amendment to the aforementioned agreement is incorporated herein by reference to Exhibit 10.5 to the Company's Quarterly Report on Form 10-Q for the period ended December 31, 2008.* | ||
10.12 | Employment Agreement dated January 20, 2006, and re-executed August 24, 2009, between Meredith Corporation and Stephen M. Lacy is incorporated herein by reference to Exhibit 10.15 to the Company's Annual Report on Form 10-K for the fiscal year ended June 30, 2009. First amendment to the aforementioned agreement is incorporated herein by reference to Exhibit 10 to the Company's Current Report on Form 8-K filed November 10, 2009.* | ||
10.13 | Employment Agreement dated August 14, 2008, and re-executed August 24, 2009, between Meredith Corporation and John S. Zieser is incorporated herein by reference to Exhibit 10.17 to the Company's Annual Report on Form 10-K for the fiscal year ended June 30, 2009.* | ||
10.14 | Letter employment agreement dated September 26, 2008, between Meredith Corporation and Joseph H. Ceryanec is incorporated herein by reference to the Company's Current Report on Form 8-K filed October 1, 2008. First amendment to the aforementioned agreement is incorporated herein by reference to Exhibit 10.3 to the Company's Quarterly Report on Form 10-Q for the period ended December 31, 2008.* | ||
10.15 | Employment Agreement effective July 1, 2013, between Meredith Corporation and Thomas H. Harty is incorporated herein by reference to Exhibit 10.15 to the Company's Annual Report on Form 10-K for the fiscal year ended June 30, 2013.* | ||
10.16 | Receivables Sale Agreement dated as of April 9, 2002 among Meredith Corporation, as Sole Initial Originator and Meredith Funding Corporation (a wholly-owned subsidiary of Meredith Corporation), as buyer is incorporated herein by reference to Exhibit 10.1 to the Company's Quarterly Report on Form 10-Q for the period ended March 31, 2002. | ||
85
10.17 | First Amended and Restated Receivables Purchase Agreement dated as of April 25, 2011, among Meredith Funding Corporation (a wholly-owned subsidiary of Meredith Corporation) as Seller, Meredith Corporation, as Servicer, Falcon Asset Securitization Company LLC, The Financial Institutions from time to time party hereto and JPMorgan Chase Bank, N.A., as Agent, is incorporated herein by reference to Exhibit 10.1 to the Company's Quarterly Report on Form 10-Q for the period ended March 31, 2011. First amendment dated as of September 21, 2012, to the aforementioned agreement is incorporated herein by reference to Exhibit 10.1 to the Company's Quarterly Report on Form 10‑Q for the period ending September 30, 2012. | ||
10.18 | Parent Guarantee from Meredith Corporation dated as of April 25, 2011, is incorporated herein by reference to Exhibit 10.2 to the Company's Quarterly Report on Form 10-Q for the period ended March 31, 2011. | ||
10.19 | Form of Continuing Restricted Stock Agreement for Non-Employee Directors is incorporated herein by reference to Exhibit 10.1 to the Company's Quarterly Report on Form 10-Q for the period ended December 31, 2011.* | ||
10.20 | Form of Continuing Nonqualified Stock Option Award Agreement for Non-Employee Directors is incorporated herein by reference to Exhibit 10.2 to the Company's Quarterly Report on Form 10-Q for the period ended December 31, 2011.* | ||
10.21 | Form of Restricted Stock Award Agreement between Meredith Corporation and the named employee for the 2004 Stock Incentive Plan is incorporated herein by reference to Exhibit 10.1 to the Company's Quarterly Report on Form 10-Q for the period ended March 31, 2012.* | ||
10.22 | Meredith Corporation Employee Stock Purchase Plan of 2002, as amended, is incorporated herein by reference to Exhibit 99.1 to the Company's Current Report on Form 8-K filed November 13, 2012.* | ||
21 | Subsidiaries of the Registrant | ||
23 | Consent of Independent Registered Public Accounting Firm | ||
31.1 | Certification of Chief Executive Officer pursuant to Rule 13a-14(a) and Rule 15d-14(a) of the Securities Exchange Act, as amended. | ||
31.2 | Certification of Chief Financial Officer pursuant to Rule 13a-14(a) and Rule 15d-14(a) of the Securities Exchange Act, as amended. | ||
32 | Certification of Chief Executive Officer and Chief Financial Officer pursuant to 18 U.S.C. Section 1350, as adopted pursuant to Section 906 of the Sarbanes-Oxley Act of 2002. | ||
101.INS | XBRL Instance Document | ||
101.SCH | XBRL Taxonomy Extension Schema Document | ||
101.CAL | XBRL Taxonomy Extension Calculation Linkbase Document | ||
101.DEF | XBRL Taxonomy Extension Definition Linkbase Document | ||
101.LAB | XBRL Taxonomy Extension Label Linkbase Document | ||
101.PRE | XBRL Taxonomy Extension Presentation Linkbase Document | ||
86
The Company agrees to furnish to the Commission, upon request, a copy of each agreement with respect to long-term debt of the Company for which the amount authorized thereunder does not exceed 10 percent of the total assets of the Company on a consolidated basis.
* | Management contract or compensatory plan or arrangement |
87
SIGNATURES
Pursuant to the requirements of Section 13 or 15(d) of the Securities Exchange Act of 1934, the registrant has duly caused this report to be signed on its behalf by the undersigned, thereunto duly authorized.
MEREDITH CORPORATION |
By /s/ John S. Zieser |
John S. Zieser, Chief Development Officer/ General Counsel and Secretary |
Pursuant to the requirements of the Securities Exchange Act of 1934, this report has been signed below by the following persons on behalf of the registrant and in the capacities and on the dates indicated.
/s/ Joseph Ceryanec | /s/ Stephen M. Lacy | |
Joseph Ceryanec, Chief Financial Officer (Principal Financial and Accounting Officer) | Stephen M. Lacy, Chairman of the Board, President, Chief Executive Officer, and Director (Principal Executive Officer) | |
/s/ D. Mell Meredith Frazier | /s/ Donald C. Berg | |
D. Mell Meredith Frazier, Vice Chairman of the Board and Director | Donald C. Berg, Director | |
/s/ Mary Sue Coleman | /s/ Frederick B. Henry | |
Mary Sue Coleman, Director | Frederick B. Henry, Director | |
/s/ Joel W. Johnson | /s/ Philip A. Marineau | |
Joel W. Johnson, Director | Philip A. Marineau, Director | |
/s/ Elizabeth E. Tallett | ||
Elizabeth E. Tallett, Director | ||
Each of the above signatures is affixed as of August 25, 2014.
88
INDEX TO ATTACHED EXHIBITS
Exhibit Number | Item | |
21 | Subsidiaries of the Registrant. | |
23 | Consent of Independent Registered Public Accounting Firm. | |
31.1 | Certification of Chief Executive Officer pursuant to Rule 13a-14(a) and Rule 15d-14(a) of the Securities Exchange Act, as amended. | |
31.2 | Certification of Chief Financial Officer pursuant to Rule 13a-14(a) and Rule 15d-14(a) of the Securities Exchange Act, as amended. | |
32 | Certification of Chief Executive Officer and Chief Financial Officer pursuant to 18 U.S.C. Section 1350, as adopted pursuant to Section 906 of the Sarbanes-Oxley Act of 2002. | |
101.INS | XBRL Instance Document | |
101.SCH | XBRL Taxonomy Extension Schema Document | |
101.CAL | XBRL Taxonomy Extension Calculation Linkbase Document | |
101.DEF | XBRL Taxonomy Extension Definition Linkbase Document | |
101.LAB | XBRL Taxonomy Extension Label Linkbase Document | |
101.PRE | XBRL Taxonomy Extension Presentation Linkbase Document | |
E-1