Attached files
| file | filename |
|---|---|
| 8-K - 8-K - KENTUCKY BANCSHARES INC /KY/ | f8-k.htm |
Exhibit 99.1
|
|
Kentucky Bancshares, Inc. Investor Presentation Louis Prichard, President and CEO Jim Braden, EVP and COO September 6, 2018 Trading Symbol: KTYB www.kybank.com |

|
|
Cautionary Statement Regarding Forward-Looking Statements Statements in this presentation relating to Kentucky Bancshares, Inc. (“KTYB”, the “Company”, “we”, “our” or “us”) contain forward-looking statements under the Private Securities Litigation Reform Act of 1995 that involve risks and uncertainties. We intend such forward-looking statements to be covered by the safe harbor provisions for forward-looking statements contained in the federal securities laws. These statements are not historical facts, but rather statements based on our current expectations regarding our business strategies and their intended results and our future performance. Forward-looking statements are preceded by terms such as “expects,” “believes,” “anticipates,” “intends,” “estimates,” “potential,” “may,” and similar expressions. These forward-looking statement are based on management’s current expectations. KTYB cautions readers that forward-looking statements are not guarantees of future performance and actual results may differ materially from those anticipated, projected or assumed in the forward-looking statements due to various risks and uncertainties. These and other risks and uncertainties are described in greater detail under “Risk Factors” in the From 10-K and subsequent periodic reports filed with the Securities and Exchange Commission. Investors are cautioned that many of the assumptions upon which KTYB's forward-looking statements are based are likely to change after the forward-looking statements are made due to uncertainties KTYB cannot control. The forward-looking statements in this presentation are made as of the date of the release and the Company does not assume any responsibility to update these statements. 2 |
|
|
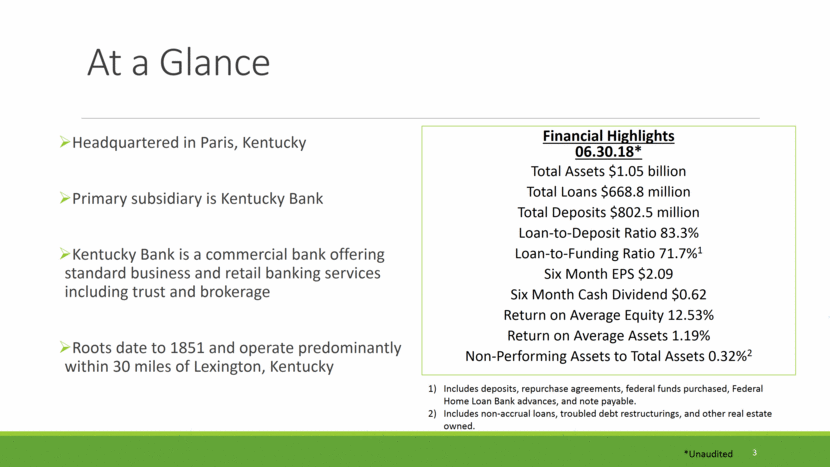
At a Glance Headquartered in Paris, Kentucky Primary subsidiary is Kentucky Bank Kentucky Bank is a commercial bank offering standard business and retail banking services including trust and brokerage Roots date to 1851 and operate predominantly within 30 miles of Lexington, Kentucky 3 Financial Highlights 06.30.18* Total Assets $1.05 billion Total Loans $668.8 million Total Deposits $802.5 million Loan-to-Deposit Ratio 83.3% Loan-to-Funding Ratio 71.7%1 Six Month EPS $2.09 Six Month Cash Dividend $0.62 Return on Average Equity 12.53% Return on Average Assets 1.19% Non-Performing Assets to Total Assets 0.32%2 *Unaudited Includes deposits, repurchase agreements, federal funds purchased, Federal Home Loan Bank advances, and note payable. Includes non-accrual loans, troubled debt restructurings, and other real estate owned. |
|
|
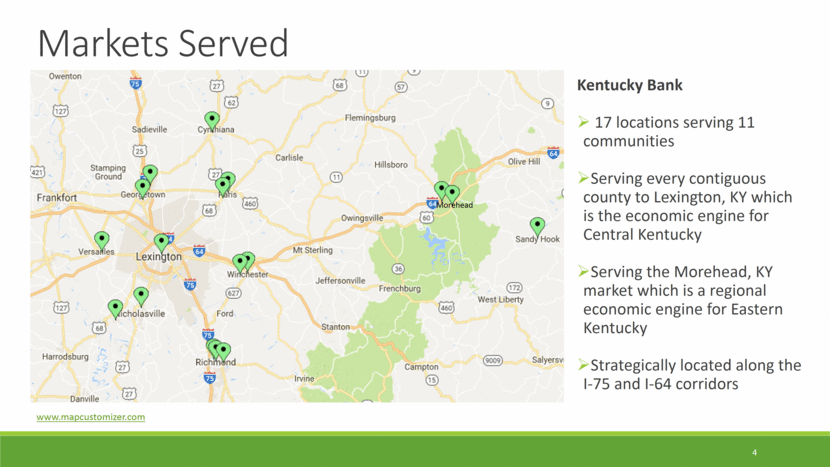
4 Markets Served www.mapcustomizer.com Kentucky Bank 17 locations serving 11 communities Serving every contiguous county to Lexington, KY which is the economic engine for Central Kentucky Serving the Morehead, KY market which is a regional economic engine for Eastern Kentucky Strategically located along the I-75 and I-64 corridors Morehead |
|
|
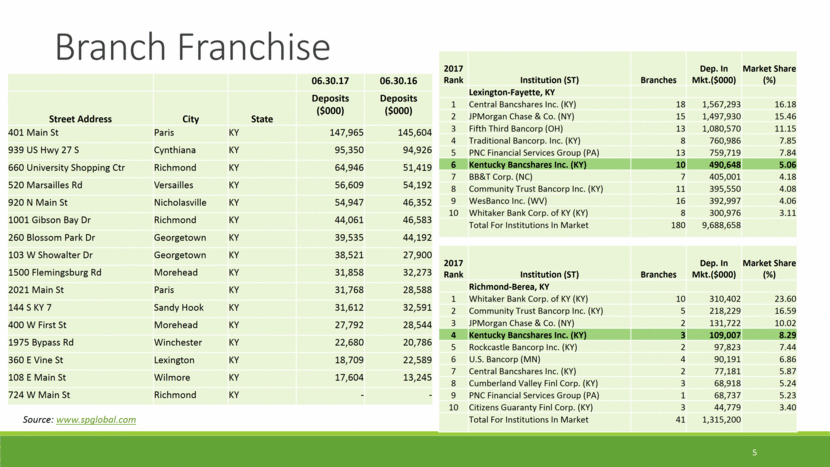
5 Branch Franchise Source: www.spglobal.com 2017 Rank Institution (ST) Branches Dep. In Mkt.($000) Market Share (%) Lexington-Fayette, KY 1 Central Bancshares Inc. (KY) 18 1,567,293 16.18 2 JPMorgan Chase & Co. (NY) 15 1,497,930 15.46 3 Fifth Third Bancorp (OH) 13 1,080,570 11.15 4 Traditional Bancorp. Inc. (KY) 8 760,986 7.85 5 PNC Financial Services Group (PA) 13 759,719 7.84 6 Kentucky Bancshares Inc. (KY) 10 490,648 5.06 7 BB&T Corp. (NC) 7 405,001 4.18 8 Community Trust Bancorp Inc. (KY) 11 395,550 4.08 9 WesBanco Inc. (WV) 16 392,997 4.06 10 Whitaker Bank Corp. of KY (KY) 8 300,976 3.11 Total For Institutions In Market 180 9,688,658 2017 Rank Institution (ST) Branches Dep. In Mkt.($000) Market Share (%) Richmond-Berea, KY 1 Whitaker Bank Corp. of KY (KY) 10 310,402 23.60 2 Community Trust Bancorp Inc. (KY) 5 218,229 16.59 3 JPMorgan Chase & Co. (NY) 2 131,722 10.02 4 Kentucky Bancshares Inc. (KY) 3 109,007 8.29 5 Rockcastle Bancorp Inc. (KY) 2 97,823 7.44 6 U.S. Bancorp (MN) 4 90,191 6.86 7 Central Bancshares Inc. (KY) 2 77,181 5.87 8 Cumberland Valley Finl Corp. (KY) 3 68,918 5.24 9 PNC Financial Services Group (PA) 1 68,737 5.23 10 Citizens Guaranty Finl Corp. (KY) 3 44,779 3.40 Total For Institutions In Market 41 1,315,200 06.30.17 06.30.16 Street Address City State Deposits ($000) Deposits ($000) 401 Main St Paris KY 147,965 145,604 939 US Hwy 27 S Cynthiana KY 95,350 94,926 660 University Shopping Ctr Richmond KY 64,946 51,419 520 Marsailles Rd Versailles KY 56,609 54,192 920 N Main St Nicholasville KY 54,947 46,352 1001 Gibson Bay Dr Richmond KY 44,061 46,583 260 Blossom Park Dr Georgetown KY 39,535 44,192 103 W Showalter Dr Georgetown KY 38,521 27,900 1500 Flemingsburg Rd Morehead KY 31,858 32,273 2021 Main St Paris KY 31,768 28,588 144 S KY 7 Sandy Hook KY 31,612 32,591 400 W First St Morehead KY 27,792 28,544 1975 Bypass Rd Winchester KY 22,680 20,786 360 E Vine St Lexington KY 18,709 22,589 108 E Main St Wilmore KY 17,604 13,245 724 W Main St Richmond KY - - |
|
|
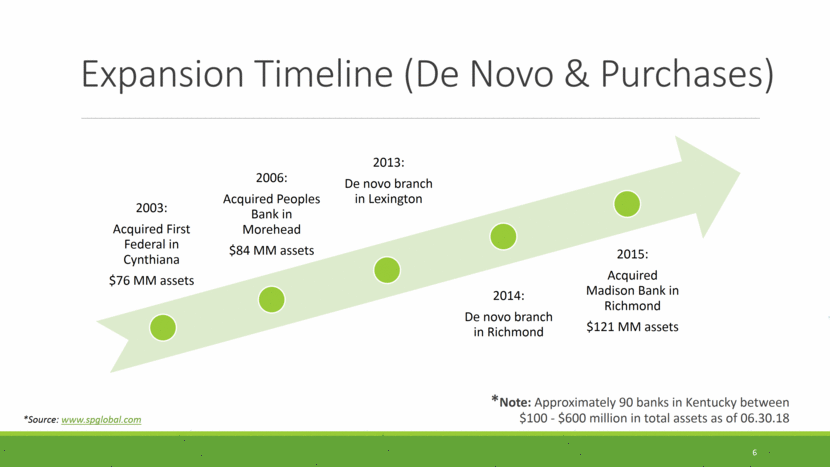
Expansion Timeline (De Novo & Purchases) 6 *Note: Approximately 90 banks in Kentucky between $100 - $600 million in total assets as of 06.30.18 *Source: www.spglobal.com 2003: Acquired First Federal in Cynthiana $76 MM assets 2006: Acquired Peoples Bank in Morehead $84 MM assets 2013: De novo branch in Lexington 2014: De novo branch in Richmond 2015: Acquired Madison Bank in Richmond $121 MM assets |
|
|
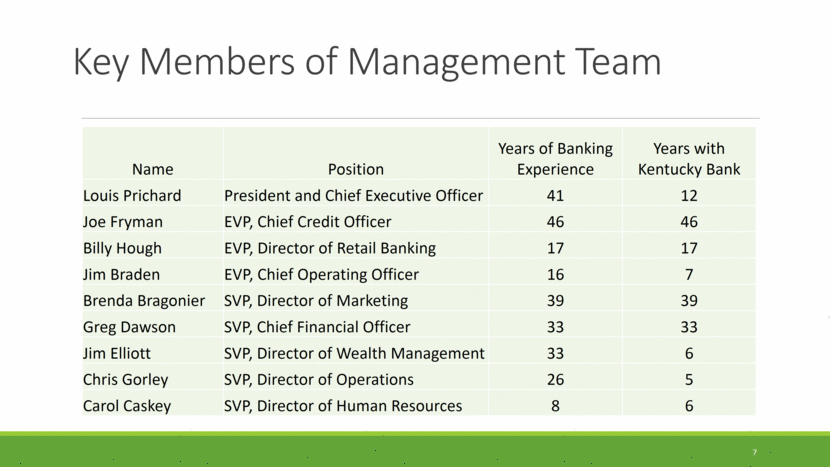
Key Members of Management Team 7 Name Position Years of Banking Experience Years with Kentucky Bank Louis Prichard President and Chief Executive Officer 41 12 Joe Fryman EVP, Chief Credit Officer 46 46 Billy Hough EVP, Director of Retail Banking 17 17 Jim Braden EVP, Chief Operating Officer 16 7 Brenda Bragonier SVP, Director of Marketing 39 39 Greg Dawson SVP, Chief Financial Officer 33 33 Jim Elliott SVP, Director of Wealth Management 33 6 Chris Gorley SVP, Director of Operations 26 5 Carol Caskey SVP, Director of Human Resources 8 6 |
|
|
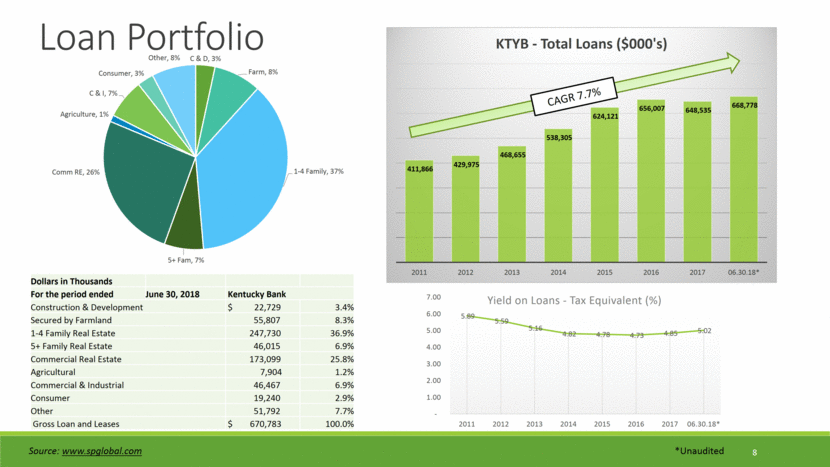
8 Loan Portfolio Source: www.spglobal.com *Unaudited Dollars in Thousands For the period ended June 30, 2018 Kentucky Bank Construction & Development $ 22,729 3.4% Secured by Farmland 55,807 8.3% 1-4 Family Real Estate 247,730 36.9% 5+ Family Real Estate 46,015 6.9% Commercial Real Estate 173,099 25.8% Agricultural 7,904 1.2% Commercial & Industrial 46,467 6.9% Consumer 19,240 2.9% Other 51,792 7.7% Gross Loan and Leases $ 670,783 100.0% CAGR 7.7% C & D , 3% Farm , 8% 1 - 4 Family , 37% 5+ Fam , 7% Comm RE , 26% Agriculture , 1% C & I , 7% Consumer , 3% Other , 8% 411,866 429,975 468,655 538,305 624,121 656,007 648,535 668,778 2011 2012 2013 2014 2015 2016 2017 06.30.18* KTYB - Total Loans ($000's) 5.89 5.59 5.16 4.82 4.78 4.73 4.85 5.02 - 1.00 2.00 3.00 4.00 5.00 6.00 7.00 2011 2012 2013 2014 2015 2016 2017 06.30.18* Yield on Loans - Tax Equivalent (%) |
|
|
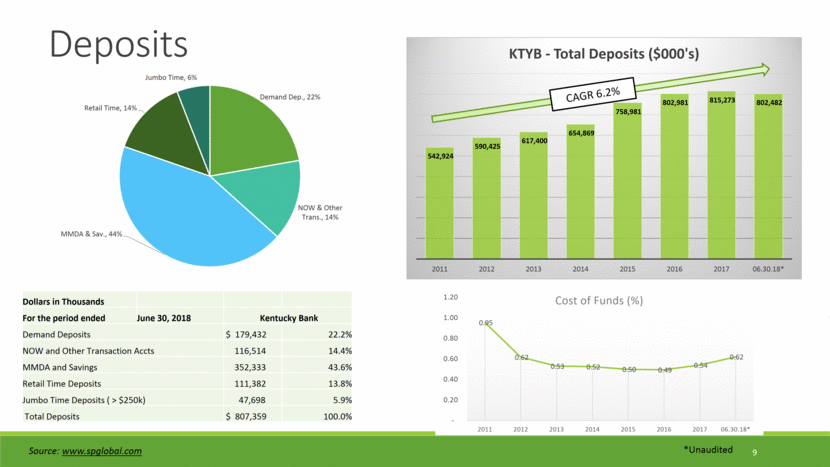
9 Deposits *Unaudited Source: www.spglobal.com Dollars in Thousands For the period ended June 30, 2018 Kentucky Bank Demand Deposits $ 179,432 22.2% NOW and Other Transaction Accts 116,514 14.4% MMDA and Savings 352,333 43.6% Retail Time Deposits 111,382 13.8% Jumbo Time Deposits ( > $250k) 47,698 5.9% Total Deposits $ 807,359 100.0% CAGR 6.2% Demand Dep. , 22% NOW & Other Trans. , 14% MMDA & Sav. , 44% Retail Time , 14% Jumbo Time , 6% 542,924 590,425 617,400 654,869 758,981 802,981 815,273 802,482 2011 2012 2013 2014 2015 2016 2017 06.30.18* KTYB - Total Deposits ($000's) 0.95 0.62 0.53 0.52 0.50 0.49 0.54 0.62 - 0.20 0.40 0.60 0.80 1.00 1.20 2011 2012 2013 2014 2015 2016 2017 06.30.18* Cost of Funds (%) |
|
|
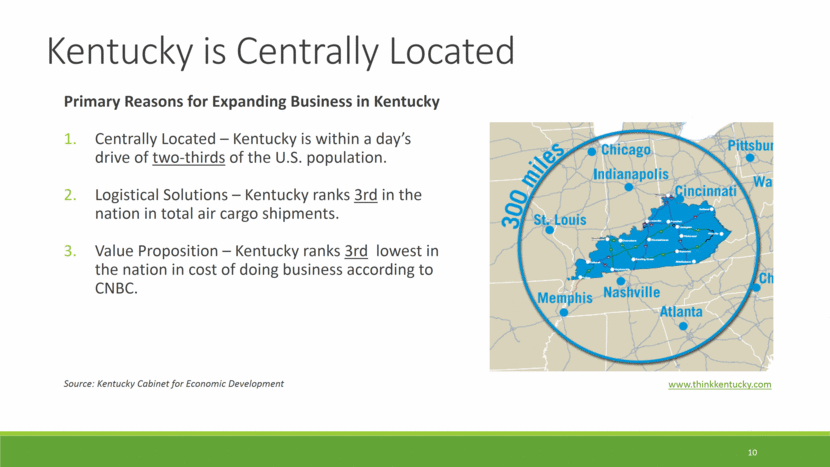
10 Kentucky is Centrally Located Primary Reasons for Expanding Business in Kentucky Centrally Located – Kentucky is within a day’s drive of two-thirds of the U.S. population. Logistical Solutions – Kentucky ranks 3rd in the nation in total air cargo shipments. Value Proposition – Kentucky ranks 3rd lowest in the nation in cost of doing business according to CNBC. Source: Kentucky Cabinet for Economic Development www.thinkkentucky.com |
|
|
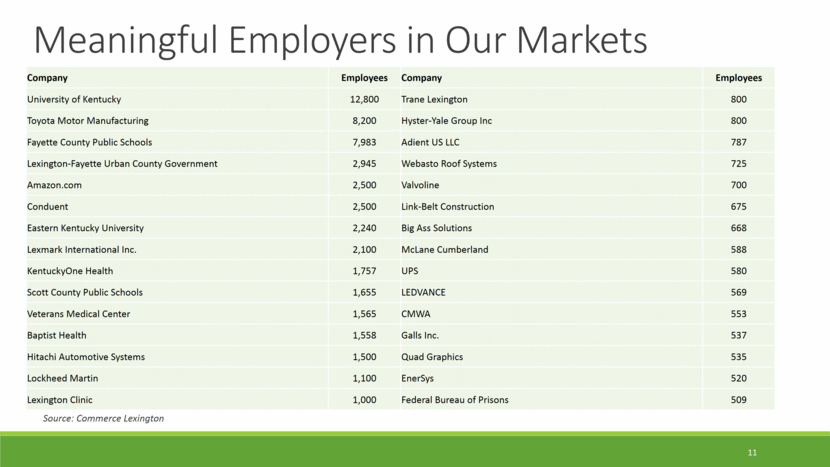
11 Meaningful Employers in Our Markets Source: Commerce Lexington Company Employees Company Employees University of Kentucky 12,800 Trane Lexington 800 Toyota Motor Manufacturing 8,200 Hyster-Yale Group Inc 800 Fayette County Public Schools 7,983 Adient US LLC 787 Lexington-Fayette Urban County Government 2,945 Webasto Roof Systems 725 Amazon.com 2,500 Valvoline 700 Conduent 2,500 Link-Belt Construction 675 Eastern Kentucky University 2,240 Big Ass Solutions 668 Lexmark International Inc. 2,100 McLane Cumberland 588 KentuckyOne Health 1,757 UPS 580 Scott County Public Schools 1,655 LEDVANCE 569 Veterans Medical Center 1,565 CMWA 553 Baptist Health 1,558 Galls Inc. 537 Hitachi Automotive Systems 1,500 Quad Graphics 535 Lockheed Martin 1,100 EnerSys 520 Lexington Clinic 1,000 Federal Bureau of Prisons 509 |
|
|
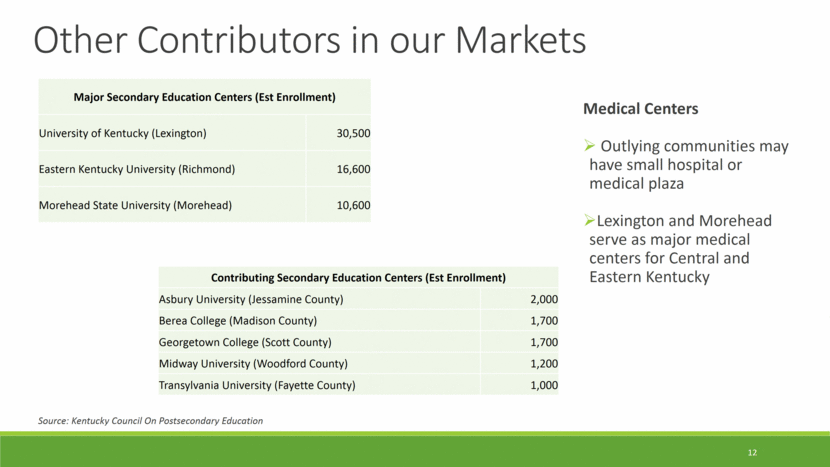
12 Other Contributors in our Markets Source: Kentucky Council On Postsecondary Education Major Secondary Education Centers (Est Enrollment) University of Kentucky (Lexington) 30,500 Eastern Kentucky University (Richmond) 16,600 Morehead State University (Morehead) 10,600 Medical Centers Outlying communities may have small hospital or medical plaza Lexington and Morehead serve as major medical centers for Central and Eastern Kentucky Contributing Secondary Education Centers (Est Enrollment) Asbury University (Jessamine County) 2,000 Berea College (Madison County) 1,700 Georgetown College (Scott County) 1,700 Midway University (Woodford County) 1,200 Transylvania University (Fayette County) 1,000 |
|
|
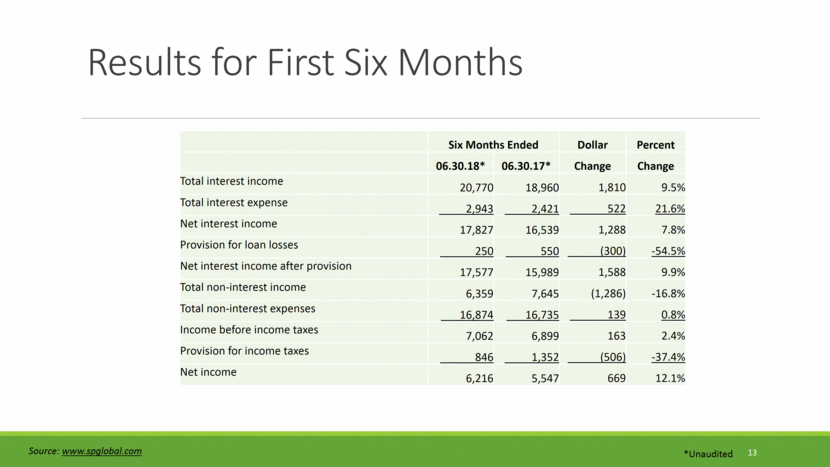
Results for First Six Months 13 *Unaudited Six Months Ended Dollar Percent 06.30.18* 06.30.17* Change Change Total interest income 20,770 18,960 1,810 9.5% Total interest expense 2,943 2,421 522 21.6% Net interest income 17,827 16,539 1,288 7.8% Provision for loan losses 250 550 (300) -54.5% Net interest income after provision 17,577 15,989 1,588 9.9% Total non-interest income 6,359 7,645 (1,286) -16.8% Total non-interest expenses 16,874 16,735 139 0.8% Income before income taxes 7,062 6,899 163 2.4% Provision for income taxes 846 1,352 (506) -37.4% Net income 6,216 5,547 669 12.1% Source: www.spglobal.com |
|
|
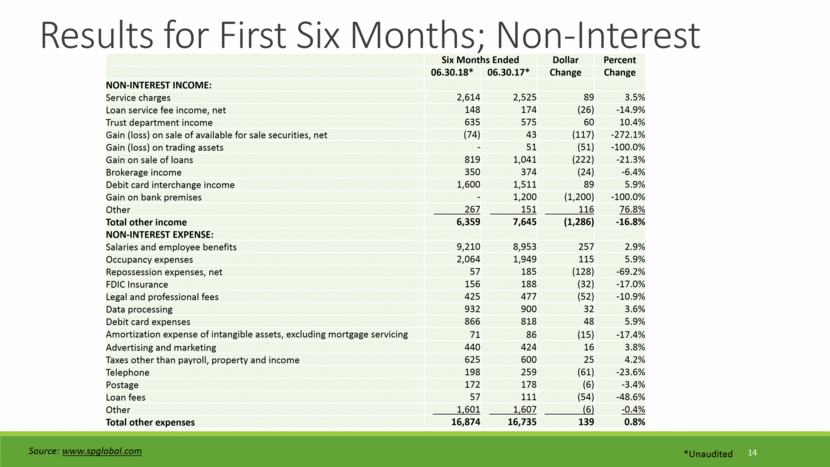
14 Results for First Six Months; Non-Interest *Unaudited Source: www.spglobal.com Six Months Ended Dollar Percent 06.30.18* 06.30.17* Change Change NON-INTEREST INCOME: Service charges 2,614 2,525 89 3.5% Loan service fee income, net 148 174 (26) -14.9% Trust department income 635 575 60 10.4% Gain (loss) on sale of available for sale securities, net (74) 43 (117) -272.1% Gain (loss) on trading assets - 51 (51) -100.0% Gain on sale of loans 819 1,041 (222) -21.3% Brokerage income 350 374 (24) -6.4% Debit card interchange income 1,600 1,511 89 5.9% Gain on bank premises - 1,200 (1,200) -100.0% Other 267 151 116 76.8% Total other income 6,359 7,645 (1,286) -16.8% NON-INTEREST EXPENSE: Salaries and employee benefits 9,210 8,953 257 2.9% Occupancy expenses 2,064 1,949 115 5.9% Repossession expenses, net 57 185 (128) -69.2% FDIC Insurance 156 188 (32) -17.0% Legal and professional fees 425 477 (52) -10.9% Data processing 932 900 32 3.6% Debit card expenses 866 818 48 5.9% Amortization expense of intangible assets, excluding mortgage servicing 71 86 (15) -17.4% Advertising and marketing 440 424 16 3.8% Taxes other than payroll, property and income 625 600 25 4.2% Telephone 198 259 (61) -23.6% Postage 172 178 (6) -3.4% Loan fees 57 111 (54) -48.6% Other 1,601 1,607 (6) -0.4% Total other expenses 16,874 16,735 139 0.8% |
|
|
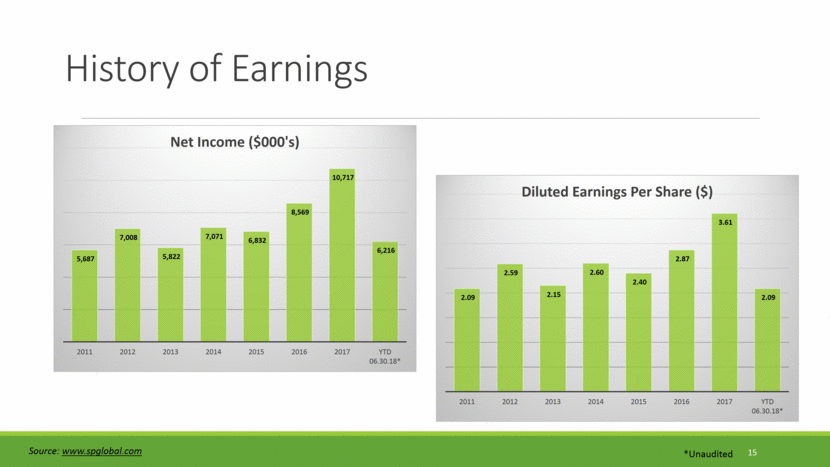
History of Earnings 15 *Unaudited Source: www.spglobal.com 2.09 2.59 2.15 2.60 2.40 2.87 3.61 2.09 2011 2012 2013 2014 2015 2016 2017 YTD 06.30.18* Diluted Earnings Per Share ($) 5,687 7,008 5,822 7,071 6,832 8,569 10,717 6,216 2011 2012 2013 2014 2015 2016 2017 YTD 06.30.18* Net Income ($000's) |
|
|
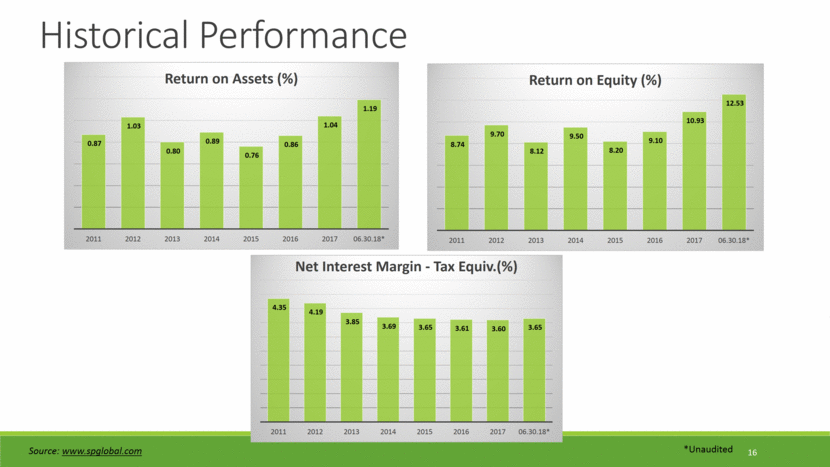
16 Historical Performance *Unaudited Source: www.spglobal.com 0.87 1.03 0.80 0.89 0.76 0.86 1.04 1.19 2011 2012 2013 2014 2015 2016 2017 06.30.18* Return on Assets (%) 8.74 9.70 8.12 9.50 8.20 9.10 10.93 12.53 2011 2012 2013 2014 2015 2016 2017 06.30.18* Return on Equity (%) 4.35 4.19 3.85 3.69 3.65 3.61 3.60 3.65 2011 2012 2013 2014 2015 2016 2017 06.30.18* Net Interest Margin - Tax Equiv. (%) |
|
|
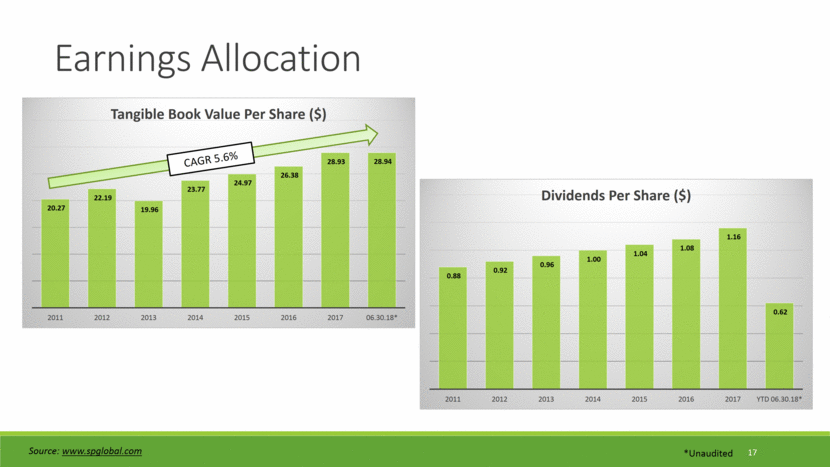
17 Earnings Allocation *Unaudited Source: www.spglobal.com CAGR 5.6% 0.88 0.92 0.96 1.00 1.04 1.08 1.16 0.62 2011 2012 2013 2014 2015 2016 2017 YTD 06.30.18* Dividends Per Share ($) 20.27 22.19 19.96 23.77 24.97 26.38 28.93 28.94 2011 2012 2013 2014 2015 2016 2017 06.30.18* Tangible Book Value Per Share ($) |
|
|
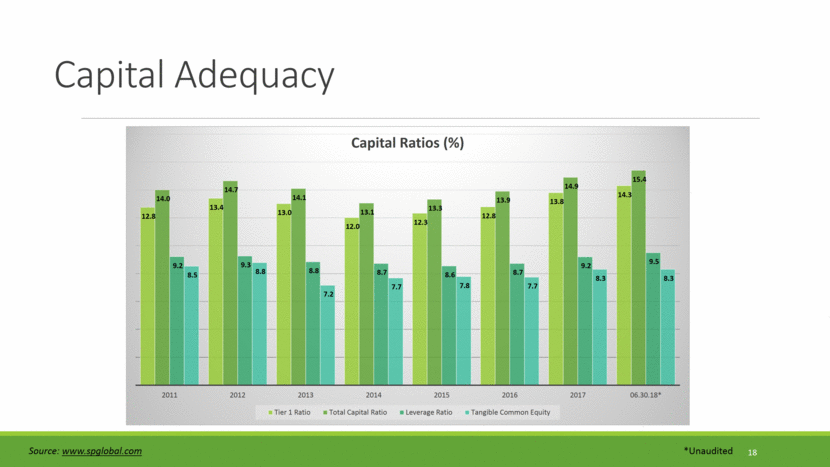
Capital Adequacy 18 *Unaudited Source: www.spglobal.com 12.8 13.4 13.0 12.0 12.3 12.8 13.8 14.3 14.0 14.7 14.1 13.1 13.3 13.9 14.9 15.4 9.2 9.3 8.8 8.7 8.6 8.7 9.2 9.5 8.5 8.8 7.2 7.7 7.8 7.7 8.3 8.3 2011 2012 2013 2014 2015 2016 2017 06.30.18* Capital Ratios (%) Tier 1 Ratio Total Capital Ratio Leverage Ratio Tangible Common Equity |
|
|
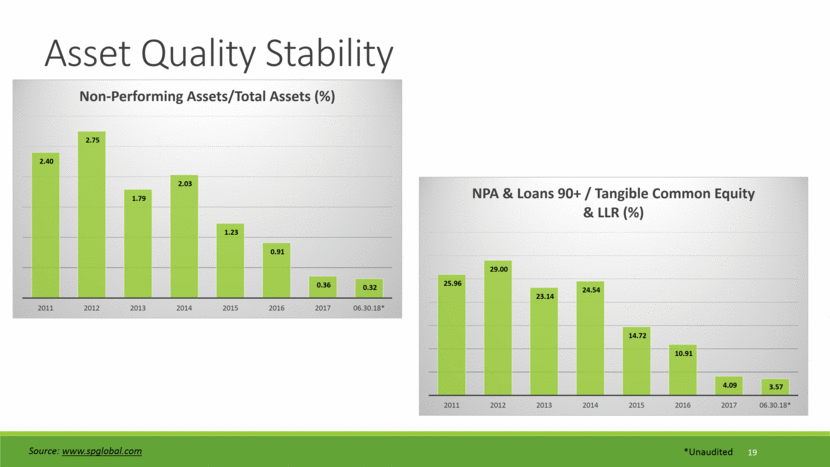
19 Asset Quality Stability *Unaudited Source: www.spglobal.com 2.40 2.75 1.79 2.03 1.23 0.91 0.36 0.32 2011 2012 2013 2014 2015 2016 2017 06.30.18* Non - Performing Assets/Total Assets (%) 25.96 29.00 23.14 24.54 14.72 10.91 4.09 3.57 2011 2012 2013 2014 2015 2016 2017 06.30.18* NPA & Loans 90 + / Tangible Common Equity & LLR (%) |
|
|
Current Strategic Pursuits Increase core profitability through relationship driven loan growth while maintaining asset quality standards with appropriate rate and structure qualifications 3.1% actual / 6.2% annualized loan growth from 12.31.17 to 06.30.18 0.32% non-performing assets to total assets as of 06.30.18 Increase core profitability through pursuit of market opportunities Deeper market penetration and wider geographic distribution Approximately 90 banks in Kentucky between $100 - $600 million in total assets as of 06.30.18 Increase core profitability through further diversification of income sources $10 million in Bank-Owned Life Insurance added in the first quarter of 2018 $20 million arbitrage leverage transaction structured in the third quarter of 2017 20 Source: www.spglobal.com |
|
|
Investment Considerations Attractive price-to-earnings ratio at 12.3* History of earnings and asset growth History of dividend growth History of stable and disciplined expansion Meaningful market player in central and eastern Kentucky Willingness to consider both de novo and acquisitive growth strategies 21 *Annualized six month earnings at $51.20 as of 08.31.18 |
|
|
Kentucky Bancshares, Inc. Trading Symbol: KTYB |