Attached files
| file | filename |
|---|---|
| 8-K - 8-K - Cactus, Inc. | f8-k.htm |
Exhibit 99.1
|
|
Barclays CEO Energy-Power Conference 2018 Cactus, Inc. (NYSE: WHD) September 5-6, 2018 |
|
|
Executive Team from the University of Texas at Austin in 2010 with a Master of Business Administration. 3 Mr. Tadlock has served as Vice President and Chief Administrative Officer since March 2018 and as VP of Corporate Services from June 2017 to March 2018. He has worked with Cactus LLC since its founding in 2011 as a Board observer on behalf of Cadent Energy Partners. Mr. Tadlock previously worked at Cadent Energy Partners from 2007 to 2017, where he served as a Partner from 2014 to 2017. Mr. Tadlock graduated from Princeton University in 2001 with a Bachelor of Science in Engineering and from the Wharton School at the University of Pennsylvania in 2007 with a Master of Business Administration. Steve Tadlock Vice President and Chief Administrative Officer Mr. Bender has served as VP of Operations of Cactus LLC since 2011. Mr. Bender previously was Rental Business Manager of Wood Group Pressure Control from 2005 to 2011. Mr. Bender graduated from Rice University in 2005 with a Bachelor of Arts in English and Hispanic Studies and Steven Bender Vice President of Operations Mr. Small has served as CFO of Cactus LLC since 2011. Mr. Small previously was Chief Financial Officer of Wood Group Pressure Control from 2000 to 2011. Mr. Small qualified as a Chartered Accountant in Scotland in 1980. Brian Small Chief Financial Officer Mr. Bender has served as COO since co-founding Cactus LLC in 2011. Mr. Bender previously was Senior Vice President of Wood Group Pressure Control from 2000 to 2011. Mr. Bender successfully built and monetized Ingram Cactus Company (sold to Cameron in 1996) and led Wood Group Pressure Control’s profitable expansion until its sale to General Electric in 2011. Mr. Bender graduated from Washington University in 1981 with a Bachelor of Science in Engineering and from the University of Houston in 1985 with a Master of Business Administration. Joel Bender Chief Operating Officer Scott Bender President & CEO Mr. Bender has served as President and CEO since co-founding Cactus Wellhead, LLC (“Cactus LLC”) in 2011. Mr. Bender previously was President of Wood Group Pressure Control from 2000 to 2011. Mr. Bender successfully built and monetized Ingram Cactus Company (sold to Cameron in 1996) and led Wood Group Pressure Control’s profitable expansion until its sale to General Electric in 2011. Mr. Bender graduated from Princeton University in 1975 with a Bachelor of Science in Engineering and from the University of Texas at Austin in 1977 with a Master of Business Administration. |
|
|
Investment Highlights Delivering Significant Growth Across All Businesses In 2018 And Poised For Growth In 2019 4 Highly Experienced Management and Operating 5Team with Strong Industry Relationships 4Substantial Cash Flow Generation 3Dynamic Manufacturing Capabilities Innovative Products with Exposure Across 2Major Basins Leading Pure Play Wellhead and Pressure Control 1Equipment Solutions Provider for U.S. Onshore |
|
|
Proprietary Equipment Across Drilling, Completion, and Production Phases of a Well Designed for pad drilling and intense completion environments Principal products: SafeDrill™ wellheads, frac stacks, zipper manifolds, and production trees Time savings can exceed 30 hours of rig time per well Completion (Frac) Drilling Production 5 Technically advanced wellhead and frac solutions deliver greater reliability and time savings |
|
|
Company Snapshot Revenue ($ in millions) LTM Q2 2018 Revenue by Type $454.5 $138.5 $221.4 $155.0 2014 2015 2016 2017 LTM Q2 2018 Adjusted EBITDA (1) ($ in millions) 37.1% 33.4% $167.0 (1) $55.1 $63.1 $32.2 *Product Revenue Includes Drilling and Production Consumables 2014 2015 2016 2017 LTM Q2 2018 Selected Active Basins Bakken DJ / Powder River Marcellus / Utica SCOOP / STACK Adjusted EBITDA(1) – Net Capital Expenditures(2) as % of Revenue Eagle Ford 26.6% 23.9% 17.9% Permian *Q2 revenue disproportionately weighted toward the Eagle Ford, SCOOP / STACK and Marcellus / Utica compared to the geographic distribution of the U.S. onshore rig count Source: Company filings. 2014 2015 2016 2017 LTM Q2 2018 6 1) EBITDA and Adjusted EBITDA are non-GAAP financial measures. Cactus defines Adjusted EBITDA as EBITDA excluding (gain) loss on debt extinguishment and stock-based compensation. The Appendix at the back of this presentation contains a reconciliation of EBITDA and Adjusted EBITDA to net income, the most comparable financial measure calculated in accordance with GAAP. Net Capital Expenditures equals net cash flows from investing activities. 2) NA 9.6% Adj. EBITDA(1) as % of34.7%28.5%20.8%32.9%36.7% Revenue $112.1 $90.1 Q2 2018 9 mos. ended 3/31/2018 Actual $111.8 $341.2 Q2 2018 $259.5 9 mos. ended 3/31/2018 Actual $315.9 Cactus designs, manufactures, sells and rents highly engineered products which yield greater pad drilling and completion efficiencies while enhancing safety |
|
|
Market Leader with Strong Growth Historical U.S. Onshore Market Share(1) Initiatives to Drive Growth Cactus Rigs Followed Market Share(1) Continuing new product development, innovation and investment including: SafeDrill™ 4T wellhead system for additional casing strings Cactus Completions 2.0 – four new rental equipment offerings for remote frac operations Development of additional frac tree rental equipment Infrastructure: Expanding Bossier City facility to accommodate products manufactured in Suzhou 26.6% 275 27.0% Expanding West Texas and New Mexico service centers Dec-11 Jun-12 Dec-12 Jun-13 Dec-13 Jun-14 Dec-14 Jun-15 Dec-15 Jun-16 Dec-16 Jun-17 Dec-17 Jun-18 Targeting majors and publicly traded E&Ps Rigs Source: Baker Hughes Rig Count Data, as published on the Friday on or immediately preceding the 15th day of each month presented, and Cactus analysis. 1) Represents the number of active U.S. onshore rigs Cactus followed divided by the total number of active U.S. onshore rigs, as of mid-month. The number of active U.S. onshore rigs Cactus followed represents the approximate number of active U.S. onshore drilling rigs to which Cactus was the primary provider of wellhead products and corresponding services during drilling, as of mid -month. Cactus believes that comparing the total number of active U.S. onshore rigs to which it is providing its products and service s at a given time to the total number of active U.S. onshore rigs on or about such time provides Cactus with a reasonable approximation of its market share with respect to its wellhead products sold and the corresponding services it provides. 7 Total 1,9311,8991,7291,6941,7031,7801,8208256843886019029091,035 24.4% 245 21.5% 220 17.5% 15814.4% 14.5% 129 119119 9.8% 757.0% 5.9%68 474.3% 2.5% 15 0.8% 179 1008.9%99 |
|
|
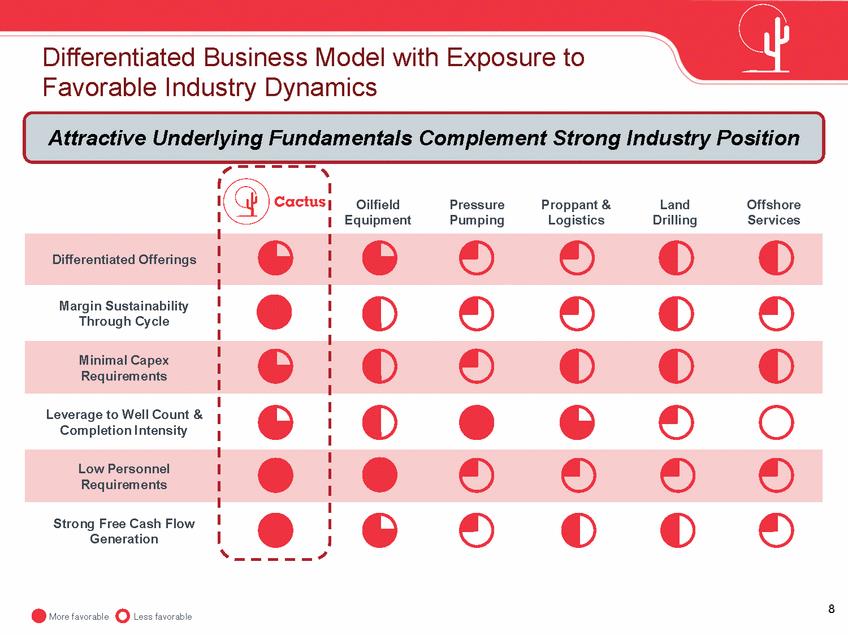
Differentiated Business Model with Exposure to Favorable Industry Dynamics Attractive Underlying Fundamentals Complement Strong Industry Position 8 More favorable Less favorable Cactus Oilfield Equipment Pressure Pumping Proppant & Logistics Land Drilling Offshore Services Differentiated Offerings Margin Sustainability Through Cycle Minimal Capex Requirements Leverage to Well Count & Completion Intensity Low Personnel Requirements Strong Free Cash Flow Generation |
|
|
Increasing Well Counts Drive Our Product Business Total U.S. Onshore Wells Drilled Bakken Powder River Basin 24,679 22,051 Marcellus Utica DJ / Niobrara SCOOP / STACK Barnett Permian Haynesville Gulf Coast Eagle Ford 2016A 2017A 2018E Source: Spears and Associates June Report. Average Active U.S. Onshore Rigs Operations 1,036 Well-diversified across all key producing basins Service centers support field services and provide equipment repair services Large service centers in the Bakken, Eagle Ford, Marcellus / Utica, Permian, and SCOOP / STACK regions 2016A 2017A 2018E Source: Baker Hughes for actuals and Spears and Associates June Report for estimates. 9 853 483 Legend Manufacturing Headquarters Service Centers Bossier City, Louisiana Manufacturing Facility 14,920 |
|
|
Technically Advanced Pad Drilling Wellhead Systems SafeDrillTM Advantages Conventional Wellhead Safety Reduced leak paths due to elimination of lock screws Time Savings Eliminates BOP Nipple up & Nipple down No waiting on cement No “hot work” required to cut casing with torch Quick connect BOP adaptors for initial Fewer trips into installs confined space (cellar) Entire system may be run through rotary table or riser Cactus SafeDrillTM No BOP manipulation after intermediate casing has been installed Mandrel hangers allow casing to be rotated through the lateral section Lower profile facilitates rig skidding Pack offs run and set through BOPs 10 |
|
|
Increasing Completions Intensity Rental Business Drives Our Largest growth opportunity for Cactus Priced on per diem basis Market share currently less than 10%(1) In the aggregate, less than 50% share of frac rentals for top 10 rental customers in Q1 and Q2 2018(1) Expanded capacity in Q1 and Q2 2018 to capture missed opportunities Further additions for remainder of 2018 have expected high utilization rates Developing new complementary rental items to reduce human intervention during completions process to save time and enhance safety; customer trials expected in Q4 2018 11 1) Management estimates. |
|
|
Cactus Completions Equipment Advantage SB Series Frac Valves Designs, manufactures, and rents a range of highly engineered and internally-developed products ▪ Built-for-purpose frac valve ▪ Designed for high-intensity frac applications ▪ Redundant sealing at pressure exposure Reliable equipment providers rewarded for reducing non-productive frac time ▪ Patented design reduces downtime and repair costs Larger pad sizes, longer laterals and more intensive fracs increase duration of rental time ▪ Increased up-time during high-intensity fracs 12 |
|
|
A Dynamic Manufacturing Advantage; Responsive, Highly Scalable and Lower Cost Responsive manufacturing in the U.S. supplemented by high volume production in China Bossier City Facility Suzhou Facility Industry Leading Product Quality (API 6A / ISO 9001) Highly Engineered Products Cactus Employees HSE Focus Rapid 48 Hour Order Turnaround 5-Axis CNC Machining Customer Responsiveness Pricing Optimization Highly Scalable High Volume Low Cost Forecasted Supply Chain Bossier City Facility Suzhou Facility Cactus sources most of its less time-sensitive, high-volume wellhead equipment in Suzhou, reducing costs Wholly foreign owned enterprise (WFOE) Expanded in 2017 Facility has 14 5-axis computer numerically controlled machines that facilitate rapid-response manufacturing of equipment “Just-in-time” product capabilities allow Cactus to offer fast delivery time for parachute orders Roofline expansion nearing completion 13 |
|
|
Highly Experienced and Well Incentivized Team with Strong Industry Relationships ▪ ▪ ▪ Management team is well incentivized as it owns greater than 30% of the business Track record of building and successfully monetizing similar businesses Strength of leadership is attested by management and operating teams that joined from past ventures Scott Bender, CEO 1986 Current Current 1986 Joel Bender, COO President and VP Operations, Cactus Company Brian Small, CFO Steven Bender VP, Operations Steve Tadlock VP, CAO 14 Managers that have followed Scott and Joel Bender to Cactus Scott and Joel Bender become respectively, of Ingram QA Director Chief Wellhead Engineer Chief Valve Engineer Sales Director Technical Manager Service Center Managers (2) Senior Salespeople (2) VP of Eastern Hemisphere Scott and Joel Bender appointed President and SVP, respectively, of Wood Group Pressure Control Chief Financial Officer VP of Operations HSE Director IT Director Field Services Manager Service Center Managers (6) Senior Salespeople (5) Design Engineers (2) Australia General Manager China Facility Manager Scott and Joel Bender found Cactus Wellhead LLC VP and Chief Administrative Officer U.S. Manufacturing Facility Manager |
|
|
Returns & Margins Have Last Reported EBITDA Margin (%) Outperformed Peers (1) 40.0% 30.0% 20.0% 10.0% ROCE(2) (2015 – 1H 2018) (%) 0.0% (10.0%) 0.0% 10.0% 20.0% 30.0% 40.0% Source: Company filings and Factset. Note: EBITDA Margins and ROCE for WHD, DRQ, FET, FTI, NCSM, NOV, OIS, SBO, and Weir as of Q2 2018. EBITDA Margin for HTG as of 1H 2018 and ROCE as of Q2 2018. 15 1) 2) Cactus EBIT = Adjusted EBITDA – depreciation and amortization. The Appendix at the back of this presentation contains a reconciliation of Adjusted EBITDA to net income, the most comparable financial measure calculated in accordance with GAAP. ROCE reflects average of 2015, 2016 , 2017, and 1H 2018 ROCEs. ROCE = EBIT / (Average of the subject year and preceding year capitalization including capital leases). OIS HTG NOV FET SBO FTI NCSM WEIR DRQ Cactus |
|
|
Continued to Execute on Our Plan Quarter over Quarter Performance Sequential Quarter Performance Q2 YTD 2018 Continued to Build on the Success of 2017 Revenue ($ in millions) U.S. onshore rigs followed(2) increased by 12% from December 2017 to June 2018 $138.5 $138.5 Accelerated investment in large-bore frac rental equipment which continues to be in high demand * Capital expenditures for infrastructure increased for 2018 due to high product and rental demand Q2 2017 Q2 2018 Product Q1 2018 Q2 2018 Rental Field Service & Other Adjusted EBITDA(1) ($ in millions) Margin profile improved sequentially Continued robust activity levels across all service centers $55.1 $55.1 Total Q2 2017 Q2 2018 Q1 2018 Q2 2018 Source: Company filings. 16 1) EBITDA and Adjusted EBITDA are non-GAAP financial measures. Cactus defines Adjusted EBITDA as EBITDA excluding (gain) loss on debt extinguishment and stock-based compensation. The Appendix at the back of this presentation contains a reconciliation of EBITDA and Adjusted EBITDA to net income, the most comparable financial measure calculated in accordance with GAAP. The number of active U.S. onshore rigs Cactus followed represents the approximate number of active U.S. onshore drilling rigs to which Cactus was the primary provider of wellhead products and corresponding services during drilling, as of mid -month. 2) $42.7 39.8% of Revenue 37.1% of Total Revenue $27.7 39.8% of Total Revenue 33.8% of Total Revenue +29% +99% $81.9 $30.3 $34.9 $17.8 $73.3 $18.8 $45.3 $115.1 $30.3 $27.0 $34.9 $29.2 $73.3 $58.9 +69% +20% |
|
|
Clean Balance Sheet & Low Capital Intensity Strong balance sheet with track record of cash flow generation Adjusted EBITDA(1) – Net Capital Expenditures(2) ($ in millions) $120.8 2015 2016 2017 LTM Q2 2018 Net Capital Expenditures(2) ($ in millions) $46.1 2015 2016 2017 LTM Q2 2018 Source: Company filings. 17 1) EBITDA and Adjusted EBITDA are non-GAAP financial measures. Cactus defines Adjusted EBITDA as EBITDA excluding (gain) loss on debt extinguishment and stock-based compensation. The Appendix at the back of this presentation contains a reconciliation of EBITDA and Adjusted EBITDA to net income, the most comparable financial measure calculated in accordance with GAAP. Net Capital Expenditures equals net cash flows from investing activities. 2) $30.7 $23.4 $17.4 $81.4 $39.7 $14.8 Balance Sheet & Capital Summary Q2 2018 cash balance of $28.4 million; no borrowings Liquidity and strong cash flows support future growth Closed new five-year, $75.0 million asset-based revolving facility in August 2018 Disciplined growth and financial prudence Current 2018 estimated capital expenditures of approximately $60 million Majority going to capture growing rental opportunities generating attractive returns and supported by robust demand Adding facility in Hobbs, NM in response to continued strength in demand and expanding warehouse at Bossier facility to accommodate growth |
|
|
Strong 2018 Results Expected; Preparing for 2019 Growth Current Performance Continued strong revenue performance across all business lines with sustained margin profile New frac capacity remains in high demand Robust activity levels across all service centers Outlook Customer profile and geographic diversity better positions business to deal with potential Permian takeaway issues Monitoring potential Chinese tariffs and conducting proactive discussions with customers and vendors to mitigate possible impact Expect to trial new frac rental innovations in Q4 2018 18 |
|
|
Qcactus Appendix |
|
|
Building a Leading Equipment Company Management team has built the foundation of this company over four decades with a proven track record of success. GE Oil and Gas Company (“ICC”) become President respectively, of (2018) 1959 1975 1980 1985 1990 1995 2000 2005 2010 2018 Bender found with 18 key (2011) leaves WGPC 20 Scott Bender (2010) Joel Bender appointed Vice President of CWE (1984) ICC sold to Cooper Cameron Corporation (1996) Scott and Joel Cactus LLC managers Scott and Joel Bender appointed President and SVP, respectively, of Wood Group Pressure Control (“WGPC”)—Brian Small joins WGPC as CFO Cactus, Inc. IPO Steven Bender appointed Rental Business Manager (2005) WGPC Sold to (2011) CWE Merges with Ingram Petroleum Services, forming Ingram Cactus Scott and Joel Bender and VP Operations, ICC (1986) Cactus Pipe founded (1959) Scott Bender appointed President of Cactus Wellhead Equipment (“CWE”), a subsidiary of Cactus Pipe (1977) |
|
|
Quarterly Financial Performance Adj. EBITDA(1) ($ in millions) & Adj. EBITDA(1) as % of Revenue Adjusted EBITDA(1) – Net Capital Expenditures(2) ($ in millions) Total Revenue ($ in millions) Sequential Quarters $138.5 $55.1 $39.5 Total ReTvoetnaul e Q1 2018 Q2 2018 Q1 2018 Q2 2018 Q1 2018 Q2 2018 Quarter-over-Quarter $138.5 $55.1 $39.5 Total Q2 2017 Q2 2018 Q2 2017 Q2 2018 Q2 2017 Q2 2018 Source: Company filings. 21 1) EBITDA and Adjusted EBITDA are non-GAAP financial measures. Cactus defines Adjusted EBITDA as EBITDA excluding (gain) loss on debt extinguishment and stock-based compensation. The subsequent pages in this presentation contain a reconciliation of EBITDA and Adjusted EBITDA to net income, the most comparable financial measure calculated in accordance with GAAP. Net Capital Expenditures equals net cash flows from investing activities. 2) $20.3 $27.7 39.8% of Revenue 33.8% of Total Revenue $81.9 +95% +99% +69% $27.0 $115.1 $42.7 39.8% of Total 3R9e.8ve%nuoef Revenue 37.1% of 37T.o1t%al of Revenue +46% +29% +20% |
|
|
Annual Financial Performance Total Revenue ($ in millions) Adjusted EBITDA(1) ($ in millions) $454.5 $167.0 2014 2015 2016 2017 LTM Q2 2018 2014 2015 2016 2017 LTM Q2 2018 Adj. EBITDA(2) – Net Capital Expenditures(2) ($ in millions) Adjusted EBITDA(1) as % of Revenue $120.8 36.7% 34.7% 2014 2015 2016 2017 LTM Q2 2018 2014 2015 2016 2017 LTM Q2 2018 Source: Company filings. 22 1) EBITDA and Adjusted EBITDA are non-GAAP financial measures. Cactus defines Adjusted EBITDA as EBITDA excluding (gain) loss on debt extinguishment and stock-based compensation. The subsequent pages in this presentation contain a reconciliation of EBITDA and Adjusted EBITDA to net income, the most comparable financial measure calculated in accordance with GAAP. Net Capital Expenditures equals net cash flows from investing activities. 2) 32.9% 28.5% 20.8% $81.4 $39.7 NA $14.8 $112.1 $90.1 $63.1 $32.2 $341.2 $259.5 $221.4 $155.0 |
|
|
Cactus Equipment Positioned on a 4-Well Pad Product Sold Product Sold Equipment Rented Equipment Rented Services Provided ▪ Wellheads are required by each well over production life One of the first pieces of equipment to be installed Cactus wellheads installed below surface ▪ Frac stacks are connected to the wellhead for the fracturing phase of a well Must reliably withstand all liquids and proppants that are pumped downhole to fracture ▪ Zipper manifolds used during the fracturing process Allow fracing to seamlessly shift from well to well without connecting and disconnecting high-pressure equipment ▪ Variety of equipment to install and service pressure control equipment, such as high-pressure flow iron, closing units, crane trucks, grease units and testing units ▪ Production trees (not pictured above) are installed on the wellhead after the frac stacks are removed Manage the production flow over the life of the well ▪ ▪ ▪ ▪ ▪ 23 4 3 2 1 4 1 3 4 4 2 1 |
|
|
Non-GAAP Reconciliation LTM June 30, 2018 Year Ended December 31, 2016 Three Months Ended March 31, 2018 ($ in thousands) December 31, 2017 December 31, 2015 June 30, 2018 June 30, 2017 Net income (loss) Interest expense, net Income tax expense EBIT Depreciation and amortization EBITDA (Gain) loss on debt extinguishment Stock-based compensation Adjusted EBITDA $113,065 13,695 7,435 $66,547 20,767 1,549 ($8,176) 20,233 809 $21,224 21,837 784 $41,542 248 4,697 $26,408 2,852 1,652 $16,578 5,186 309 134,195 26,357 88,863 23,271 12,866 21,241 43,845 20,580 46,487 7,367 30,912 6,621 22,073 5,589 $160,552 4,305 2,097 $112,134 ---- $34,107 (2,251) 361 $64,425 (1,640) 359 $53,854 --1,263 $37,533 4,305 834 $27,662 ---- $166,954 $112,134 $32,217 $63,144 $55,117 $42,672 $27,662 *For the year ended December 31, 2014, we had EBITDA of $88.8 million, representing net income of $59.1 million, excluding net interest expense of $11.2 million, income tax expense of $0.3 million and depreciation and amortization of $18.2 million. There was no early extinguishment of debt in 2014. Stock-based compensation was $1.3 million in 2014. Adjusted EBITDA was equal to $90.1 million. Important Disclosure Regarding Non-GAAP Measures EBITDA and Adjusted EBITDA are not measures calculated in accordance with GAAP. EBITDA and Adjusted EBITDA are supplemental non-GAAP financial measures that are used by management and external users of our consolidated financial statements, such as industry analysts, investors, lenders and rating agencies. We define EBITDA as net income excluding net interest expense, income tax and depreciation and amortization. We define Adjusted EBITDA as EBITDA excluding (gain) loss on debt extinguishment and stock-based compensation. Our management believes EBITDA and Adjusted EBITDA are useful, because they allow management to more effectively evaluate our operating performance and compare the results of our operations from period to period without regard to financing methods or capital structure, or other items that impact comparability of financial results from period to period. EBITDA and Adjusted EBITDA should not be considered as alternatives to, or more meaningful than, net income or any other measure as determined in accordance with GAAP. Our computations of EBITDA and Adjusted EBITDA may not be comparable to other similarly titled measures of other companies. We present EBITDA and Adjusted EBITDA, because we believe they provide useful information regarding the factors and trends affecting our business. 24 |
|
|
Investor Relations Contact John Fitzgerald Director of Corporate Development Investor Relations 713-904-4655 IR@CactusWHD.com & 25 |