Attached files
| file | filename |
|---|---|
| EX-99.1 - EX-99.1 - Focus Financial Partners Inc. | a18-22025_1ex99d1.htm |
| 8-K - 8-K - Focus Financial Partners Inc. | a18-22025_18k.htm |
Focus Financial Partners Q2 and Year-To-Date 2018 Earnings Release Supplement August 2018

Disclaimer Special Note Regarding Forward-Looking Statements Some of the information in this presentation may contain forward-looking statements. Forward-looking statements give our current expectations, contain projections of results of operations or of financial condition, or forecasts of future events. Words such as “may,” “assume,” “forecast,” “position,” “predict,” “strategy,” “expect,” “intend,” “plan,” “estimate,” “anticipate,” “believe,” “project,” “budget,” “potential,” “continue,” “will” and similar expressions are used to identify forward-looking statements. They can be affected by assumptions used or by known or unknown risks or uncertainties. Consequently, no forward-looking statements can be guaranteed. When considering these forward-looking statements, you should keep in mind the risk factors and other cautionary statements in this presentation. Actual results may vary materially. You are cautioned not to place undue reliance on any forward-looking statements. You should also understand that it is not possible to predict or identify all such factors and should not consider the following list to be a complete statement of all potential risks and uncertainties. Factors that could cause our actual results to differ materially from the results contemplated by such forward-looking statements include fluctuations in wealth management fees, regulatory assets under management, our reliance on our partner firms and the principals who manage their businesses, our ability to make successful acquisitions, unknown liabilities of or poor performance by acquired businesses, harm to our reputation, our inability to facilitate smooth succession planning at our partner firms, our inability to compete, our reliance on key personnel, our inability to attract, develop and retain talented wealth management professionals, our inability to retain clients following an acquisition, write down of goodwill and other intangible assets, our failure to maintain and properly safeguard an adequate technology infrastructure, cyber-attacks, our inability to recover from business continuity problems, inadequate insurance coverage, the termination of management agreements by management companies, our inability to generate sufficient cash to service all of our indebtedness, the failure of our partner firms to comply with applicable U.S. and non-U.S. regulatory requirements, legal proceedings and governmental inquiries and certain other factors. All forward-looking statements are expressly qualified in their entirety by the foregoing cautionary statements. Our forward-looking statements speak only as of the date of this presentation or as of the date as of which they are made. Except as required by applicable law, including federal securities laws, we do not intend to update or revise any forward-looking statements. Non-GAAP Financial Measures We analyze our performance using Adjusted Net Income and Adjusted Net Income Per Share. Adjusted Net Income and Adjusted Net Income Per Share are non-GAAP measures. We define Adjusted Net Income as net income (loss) excluding income tax expense (benefit), amortization of debt financing costs, intangible amortization and impairments, if any, non-cash equity compensation expense, non-cash changes in fair value of estimated contingent consideration, gain on sale of investment, loss on extinguishment of borrowings, delayed offering cost expense, management contract buyout, if any, and other one-time transaction expenses. The calculation of Adjusted Net Income also includes adjustments to reflect (i) a pro forma 27% income tax rate assuming all earnings of Focus Financial Partners, LLC (“Focus LLC”) were recognized by Focus Financial Partners Inc. (“Focus Inc.”) and no earnings were attributable to non-controlling interests and (ii) tax adjustments from intangible asset related income tax benefits from acquisitions based on a pro forma 27% tax rate. Adjusted Net Income per share is calculated by dividing Adjusted Net Income by the Adjusted Shares Outstanding. Adjusted Shares Outstanding includes all shares of Class A common stock issued in connection with the IPO and related transactions, assumes that all vested non-compensatory stock options and unvested compensatory stock options have been exercised (assuming vesting of unvested compensatory stock options and a then-current value of the Class A common stock equal to the $33.00 IPO price) and assumes that 100% of the Focus LLC common units and vested and unvested incentive units following the IPO have been exchanged for Class A common stock (assuming vesting of the unvested incentive units and a then-current value of the Focus LLC common units equal to the $33.00 IPO price). We believe that Adjusted Net Income and Adjusted Net Income Per Share, viewed in addition to, and not in lieu of, our reported GAAP results, provide additional useful information to investors regarding our performance and overall results of operations for various reasons, including the following: Non-cash equity grants made to employees or non-employees at a certain price and point in time do not necessarily reflect how our business is performing at any particular time; stock-based compensation expense is not a key measure of our operating performance; Contingent consideration or earn outs can vary substantially from company to company and depending upon each company’s growth metrics and accounting assumption methods; the non-cash changes in fair value of estimated contingent consideration is not considered a key measure in comparing our operating performance; and Amortization expenses can vary substantially from company to company and from period to period depending upon each company’s financing and accounting methods, the fair value and average expected life of acquired intangible assets and the method by which assets were acquired; the amortization of intangible assets obtained in acquisitions are not considered a key measure in comparing our operating performance. Adjusted Net Income and Adjusted Net Income Per Share do not purport to be an alternative to net income (loss) or cash flows from operating activities. The terms Adjusted Net Income and Adjusted Net Income Per Share are not defined under GAAP, and Adjusted Net Income and Adjusted Net Income Per Share are not a measure of net income (loss), operating income or any other performance or liquidity measure derived in accordance with GAAP. Therefore, Adjusted Net Income and Adjusted Net Income Per Share have limitations as an analytical tool and should not be considered in isolation or as a substitute for analysis of our results as reported under GAAP. Some of these limitations are: Adjusted Net Income and Adjusted Net Income Per Share do not reflect all cash expenditures, future requirements for capital expenditures or contractual commitments; Adjusted Net Income and Adjusted Net Income Per Share do not reflect changes in, or cash requirements for, working capital needs; and Other companies in the financial services industry may calculate Adjusted Net Income and Adjusted Net Income Per Share differently than we do, limiting its usefulness as a comparative measure. In addition, Adjusted Net Income and Adjusted Net Income Per Share can differ significantly from company to company depending on strategic decisions regarding capital structure, the tax jurisdictions in which companies operate and capital investments. We compensate for these limitations by relying also on the GAAP results and use Adjusted Net Income and Adjusted Net Income Per Share as supplemental information. A reconciliation of these measures to the most recent comparable GAAP measure is available in the appendix of this presentation. 2
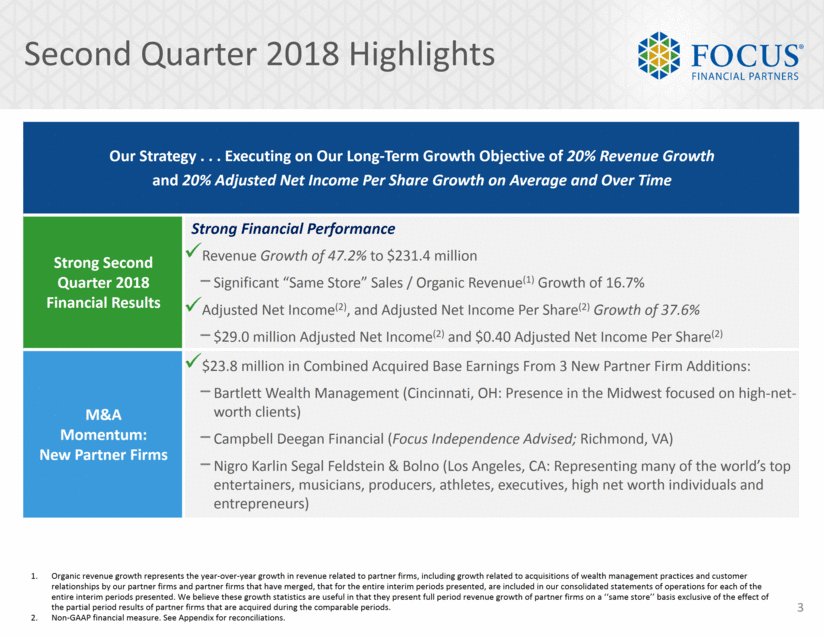
Second Quarter 2018 Highlights Organic revenue growth represents the year-over-year growth in revenue related to partner firms, including growth related to acquisitions of wealth management practices and customer relationships by our partner firms and partner firms that have merged, that for the entire interim periods presented, are included in our consolidated statements of operations for each of the entire interim periods presented. We believe these growth statistics are useful in that they present full period revenue growth of partner firms on a ‘‘same store’’ basis exclusive of the effect of the partial period results of partner firms that are acquired during the comparable periods. Non-GAAP financial measure. See Appendix for reconciliations. Our Strategy . . . Executing on Our Long-Term Growth Objective of 20% Revenue Growth and 20% Adjusted Net Income Per Share Growth on Average and Over Time Strong Second Quarter 2018 Financial Results Revenue Growth of 47.2% to $231.4 million Significant “Same Store” Sales / Organic Revenue(1) Growth of 16.7% Adjusted Net Income(2), and Adjusted Net Income Per Share(2) Growth of 37.6% $29.0 million Adjusted Net Income(2) and $0.40 Adjusted Net Income Per Share(2) M&A Momentum: New Partner Firms $23.8 million in Combined Acquired Base Earnings From 3 New Partner Firm Additions: Bartlett Wealth Management (Cincinnati, OH: Presence in the Midwest focused on high-net-worth clients) Campbell Deegan Financial (Focus Independence Advised; Richmond, VA) Nigro Karlin Segal Feldstein & Bolno (Los Angeles, CA: Representing many of the world’s top entertainers, musicians, producers, athletes, executives, high net worth individuals and entrepreneurs) 3 Strong Financial Performance
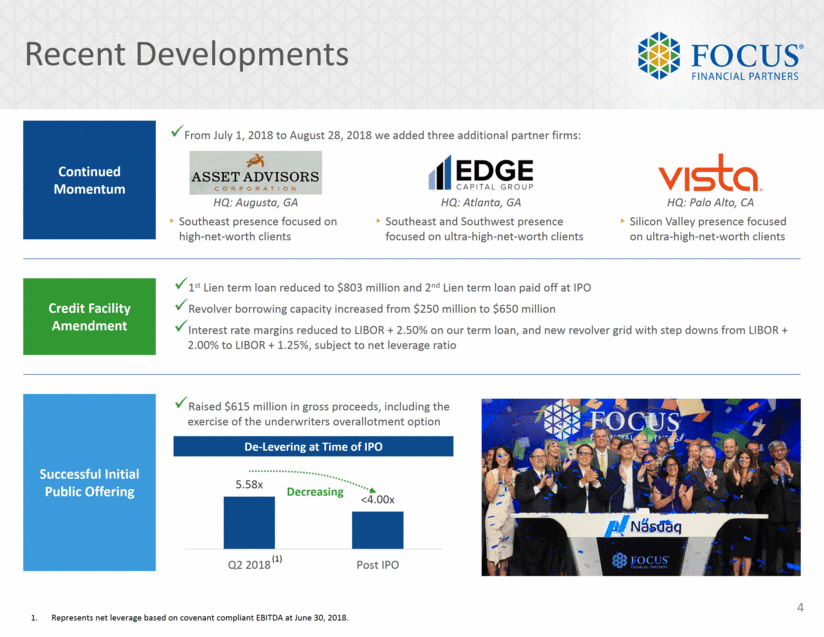
Recent Developments Represents net leverage based on covenant compliant EBITDA at June 30, 2018. Continued Momentum Credit Facility Amendment Successful Initial Public Offering De-Levering at Time of IPO From July 1, 2018 to August 28, 2018 we added three additional partner firms: HQ: Augusta, GA Southeast presence focused on high-net-worth clients HQ: Atlanta, GA Southeast and Southwest presence focused on ultra-high-net-worth clients HQ: Palo Alto, CA Silicon Valley presence focused on ultra-high-net-worth clients 1st Lien term loan reduced to $803 million and 2nd Lien term loan paid off at IPO Revolver borrowing capacity increased from $250 million to $650 million Interest rate margins reduced to LIBOR + 2.50% on our term loan, and new revolver grid with step downs from LIBOR + 2.00% to LIBOR + 1.25%, subject to net leverage ratio Raised $615 million in gross proceeds, including the exercise of the underwriters overallotment option Decreasing 4 (1) 5.58x <4.00x Q2 2018 Post IPO
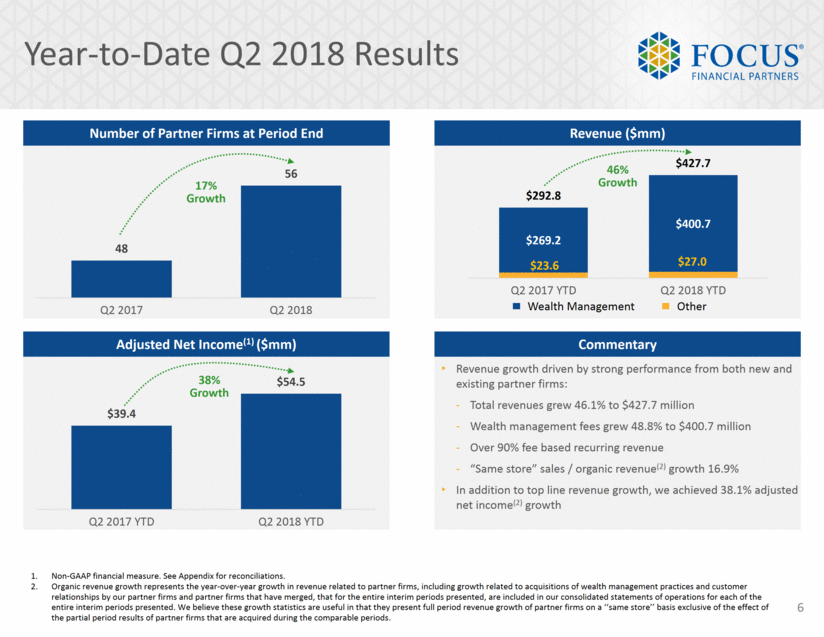
Q2 2018 Results Totals may not foot due to rounding. Non-GAAP financial measure. See Appendix for reconciliations. Organic revenue growth represents the year-over-year growth in revenue related to partner firms, including growth related to acquisitions of wealth management practices and customer relationships by our partner firms and partner firms that have merged, that for the entire interim periods presented, are included in our consolidated statements of operations for each of the entire interim periods presented. We believe these growth statistics are useful in that they present full period revenue growth of partner firms on a ‘‘same store’’ basis exclusive of the effect of the partial period results of partner firms that are acquired during the comparable periods. Number of Partner Firms at Period End Adjusted Net Income(2) ($mm) Revenue(1) ($mm) Commentary 17% Growth Wealth Management Other 47% Growth 38% Growth Revenue growth driven by strong performance from both new and existing partner firms: Total revenues grew 47.2% to $231.4 million Wealth management fees grew 48.8% to $216.3 million Over 90% fee based recurring revenue “Same store” sales / organic revenue(3) growth 16.7% In addition to top line revenue growth, we achieved 37.6% adjusted net income(2) growth 5 48 56 Q2 2017 Q2 2018 $11.9 $15.1 $145.4 $216.3 $157.2 $231.4 Q2 2017 Q2 2018 $21.1 $29.0 Q2 2017 Q2 2018
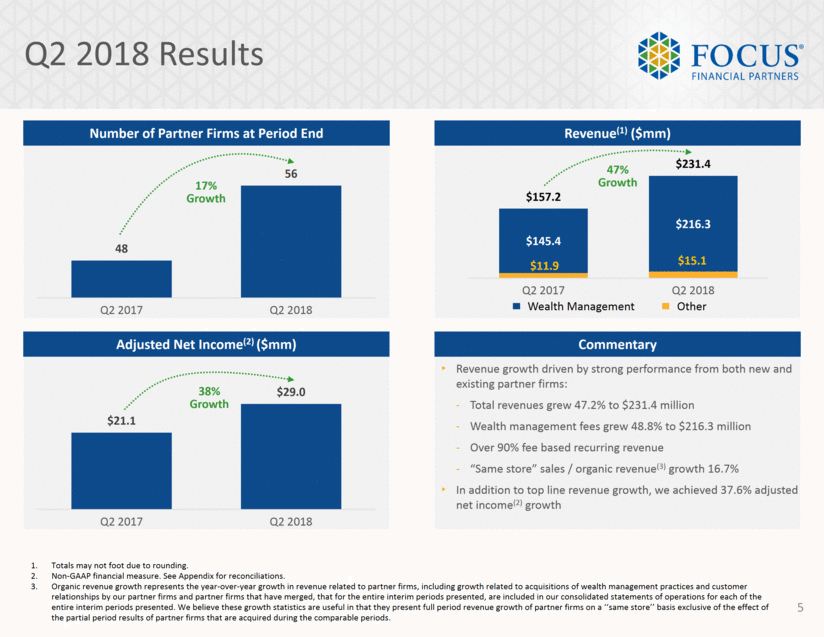
Year-to-Date Q2 2018 Results Non-GAAP financial measure. See Appendix for reconciliations. Organic revenue growth represents the year-over-year growth in revenue related to partner firms, including growth related to acquisitions of wealth management practices and customer relationships by our partner firms and partner firms that have merged, that for the entire interim periods presented, are included in our consolidated statements of operations for each of the entire interim periods presented. We believe these growth statistics are useful in that they present full period revenue growth of partner firms on a ‘‘same store’’ basis exclusive of the effect of the partial period results of partner firms that are acquired during the comparable periods. Number of Partner Firms at Period End Adjusted Net Income(1) ($mm) Revenue ($mm) Commentary 17% Growth Wealth Management Other 46% Growth 38% Growth 6 Revenue growth driven by strong performance from both new and existing partner firms: Total revenues grew 46.1% to $427.7 million Wealth management fees grew 48.8% to $400.7 million Over 90% fee based recurring revenue “Same store” sales / organic revenue(2) growth 16.9% In addition to top line revenue growth, we achieved 38.1% adjusted net income(2) growth 48 56 Q2 2017 Q2 2018 $23.6 $27.0 $269.2 $400.7 $292.8 $427.7 Q2 2017 YTD Q2 2018 YTD $39.4 $54.5 Q2 2017 YTD Q2 2018 YTD
Appendix

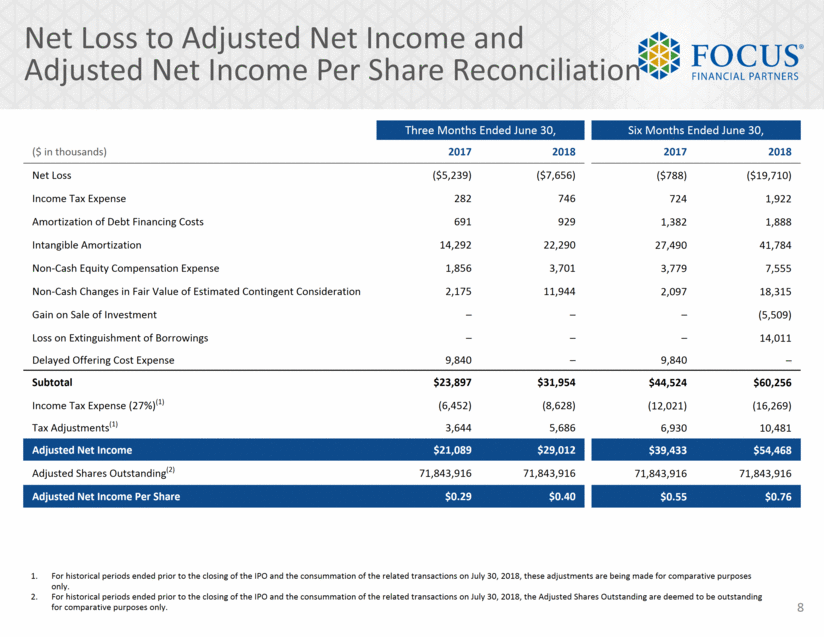
Net Loss to Adjusted Net Income and Adjusted Net Income Per Share Reconciliation For historical periods ended prior to the closing of the IPO and the consummation of the related transactions on July 30, 2018, these adjustments are being made for comparative purposes only. For historical periods ended prior to the closing of the IPO and the consummation of the related transactions on July 30, 2018, the Adjusted Shares Outstanding are deemed to be outstanding for comparative purposes only. Three Months Ended June 30, Six Months Ended June 30, ($ in thousands) 2017 2018 2017 2018 Net Loss ($5,239) ($7,656) ($788) ($19,710) Income Tax Expense 282 746 724 1,922 Amortization of Debt Financing Costs 691 929 1,382 1,888 Intangible Amortization 14,292 22,290 27,490 41,784 Non-Cash Equity Compensation Expense 1,856 3,701 3,779 7,555 Non-Cash Changes in Fair Value of Estimated Contingent Consideration 2,175 11,944 2,097 18,315 Gain on Sale of Investment – – – (5,509) Loss on Extinguishment of Borrowings – – – 14,011 Delayed Offering Cost Expense 9,840 – 9,840 – Subtotal $23,897 $31,954 $44,524 $60,256 Income Tax Expense (27%)(1) (6,452) (8,628) (12,021) (16,269) Tax Adjustments(1) 3,644 5,686 6,930 10,481 Adjusted Net Income $21,089 $29,012 $39,433 $54,468 Adjusted Shares Outstanding(2) 71,843,916 71,843,916 71,843,916 71,843,916 Adjusted Net Income Per Share $0.29 $0.40 $0.55 $0.76 8
