Attached files
| file | filename |
|---|---|
| EX-32.1 - EX-32.1 - Focus Financial Partners Inc. | focs-20191231ex321c7cd9b.htm |
| EX-31.2 - EX-31.2 - Focus Financial Partners Inc. | focs-20191231ex312ab3aae.htm |
| EX-31.1 - EX-31.1 - Focus Financial Partners Inc. | focs-20191231ex311db9c96.htm |
| EX-23.1 - EX-23.1 - Focus Financial Partners Inc. | focs-20191231ex231d9335d.htm |
| EX-21.1 - EX-21.1 - Focus Financial Partners Inc. | focs-20191231ex2114a48ff.htm |
| EX-10.32 - EX-10.32 - Focus Financial Partners Inc. | focs-20191231ex1032e3dbc.htm |
| EX-10.31 - EX-10.31 - Focus Financial Partners Inc. | focs-20191231ex1031896e6.htm |
| EX-10.19 - EX-10.19 - Focus Financial Partners Inc. | focs-20191231ex1019204ea.htm |
| EX-10.18 - EX-10.18 - Focus Financial Partners Inc. | focs-20191231ex1018fd12b.htm |
| EX-4.2 - EX-4.2 - Focus Financial Partners Inc. | focs-20191231ex42537e53e.htm |
UNITED STATES
SECURITIES AND EXCHANGE COMMISSION
WASHINGTON, D.C. 20549
FORM 10-K
(Mark One)
☒ ANNUAL REPORT PURSUANT TO SECTION 13 OR 15(d) OF THE SECURITIES EXCHANGE ACT OF 1934
For the fiscal year ended December 31, 2019
OR
☐ TRANSITION REPORT PURSUANT TO SECTION 13 OR 15(d) OF THE SECURITIES EXCHANGE ACT OF 1934
Commission File No. 001-38604
Focus Financial Partners Inc.
(Exact Name of Registrant as Specified in its Charter)
|
Delaware |
47‑4780811 |
|
(State or Other Jurisdiction |
(I.R.S. Employer |
|
|
|
|
875 Third Avenue, 28th Floor |
10022 |
|
(Address of Principal Executive Offices) |
(Zip Code) |
(646) 519‑2456
(Registrant’s Telephone Number, Including Area Code)
Securities registered pursuant to Section 12(b) of the Act:
|
Title of each class |
|
Trading Symbol(s) |
|
Name of each exchange on which registered |
|
Class A common stock, par value $0.01 per share |
|
FOCS |
|
Nasdaq Global Select Market |
Securities registered pursuant to Section 12(g) of the Act: None
Indicate by check mark if the registrant is a well-known seasoned issuer, as defined in Rule 405 of the Securities Act. ☒ Yes ☐ No
Indicate by check mark if the registrant is not required to file reports pursuant to Section 13 or Section 15(d) of the Act. ☐ Yes ☒ No
Indicate by check mark whether the registrant (1) has filed all reports to be filed by Section 13 or 15(d) of the Securities Exchange Act of 1934 during the preceding 12 months (or for such shorter period that the registrant was required to file such reports), and (2) has been subject to such filing requirements for the past 90 days. ☒ Yes ☐ No
Indicate by check mark whether the registrant has submitted electronically every Interactive Data File required to be submitted pursuant to Rule 405 of Regulation S -T (§232.405 of this chapter) during the preceding 12 months (or for such shorter period that the registrant was required to submit such files). ☒ Yes ☐ No
Indicate by check mark whether the registrant is a large accelerated filer, an accelerated filer, a non-accelerated filer, smaller reporting company, or an emerging growth company. See the definitions of “large accelerated filer,” “accelerated filer,” “smaller reporting company,” and “emerging growth company” in Rule 12b-2 of the Exchange Act.
|
Large accelerated filer ☒ |
Accelerated filer ☐ |
Non-accelerated filer ☐ |
Smaller reporting company ☐ |
|
|
|
|
Emerging growth company ☐ |
If an emerging growth company, indicate by check mark if the registrant has elected not to use the extended transition period for complying with any new or revised financial accounting standards provided pursuant to Section 13(a) of the Exchange Act. ☐
Indicate by check mark whether the registrant is a shell company (as defined in Rule 12b -2 of the Exchange Act): ☐ Yes ☒ No
The aggregate market value of the Class A common stock held by non-affiliates was $829,203,698 on June 28, 2019, the last business day of the registrant’s most recently completed second fiscal quarter.
As of February 20, 2020, the registrant had 47,421,315 shares of Class A common stock and 22,075,749 shares of Class B common stock outstanding.
Documents incorporated by reference:
The registrant’s definitive proxy statement relating to the annual meeting of shareholders (to be held June 3, 2020) will be filed with the Securities and Exchange Commission within 120 days after the close of the registrant’s fiscal year ended December 31, 2019 and is incorporated by reference in Part III to the extent described herein.
FOCUS FINANCIAL PARTNERS INC.
FOR THE YEAR ENDED DECEMBER 31, 2019
| 1 | ||
| 2 | ||
| 3 | ||
| 3 | ||
| 18 | ||
| 39 | ||
| 39 | ||
| 39 | ||
| 39 | ||
| 40 | ||
| 40 | ||
| 40 | ||
|
Management’s Discussion and Analysis of Financial Condition and Results of Operations |
42 | |
| 63 | ||
| 64 | ||
|
Changes in and Disagreements With Accountants on Accounting and Financial Disclosure |
64 | |
| 64 | ||
| 66 | ||
| 67 | ||
| 67 | ||
| 67 | ||
|
Security Ownership of Certain Beneficial Owners and Management and Related Stockholder Matters |
67 | |
|
Certain Relationships and Related Transactions, and Director Independence |
67 | |
| 67 | ||
|
PART IV |
|
|
| 67 | ||
| 71 | ||
|
F-1 |
||
i
CAUTIONARY STATEMENT REGARDING FORWARD‑LOOKING STATEMENTS
Some of the information in this Annual Report on Form 10‑K (this “Annual Report”) may contain forward‑looking statements. Forward‑looking statements give our current expectations, contain projections of results of operations or of financial condition, or forecasts of future events. Words such as “may,” “assume,” “forecast,” “position,” “predict,” “strategy,” “expect,” “intend,” “plan,” “estimate,” “anticipate,” “believe,” “project,” “budget,” “potential,” “continue,” “will” and similar expressions are used to identify forward‑looking statements. They can be affected by assumptions used or by known or unknown risks or uncertainties. Consequently, no forward‑looking statements can be guaranteed. When considering these forward‑looking statements, you should keep in mind the risk factors and other cautionary statements described under “Part I, Item 1A, Risk Factors.” Actual results may vary materially. You are cautioned not to place undue reliance on any forward‑looking statements. You should also understand that it is not possible to predict or identify all such factors and should not consider the following list to be a complete statement of all potential risks and uncertainties. Factors that could cause our actual results to differ materially from the results contemplated by such forward‑looking statements include:
|
· |
fluctuations in wealth management fees; |
|
· |
our reliance on our partner firms and the principals who manage their businesses; |
|
· |
our ability to make successful acquisitions; |
|
· |
unknown liabilities of or poor performance by acquired businesses; |
|
· |
harm to our reputation; |
|
· |
our inability to facilitate smooth succession planning at our partner firms; |
|
· |
our inability to compete; |
|
· |
our reliance on key personnel and principals; |
|
· |
our inability to attract, develop and retain talented wealth management professionals; |
|
· |
our inability to retain clients following an acquisition; |
|
· |
our reliance on key vendors; |
|
· |
write down of goodwill and other intangible assets; |
|
· |
our failure to maintain and properly safeguard an adequate technology infrastructure; |
|
· |
cyber‑attacks; |
|
· |
our inability to recover from business continuity problems; |
|
· |
inadequate insurance coverage; |
|
· |
the termination of management agreements by management companies; |
|
· |
our inability to generate sufficient cash to service all of our indebtedness or our ability to access additional capital; |
|
· |
the failure of our partner firms to comply with applicable U.S. and non‑U.S. regulatory requirements and the highly regulated nature of our business; |
|
· |
legal proceedings, governmental inquiries; and |
1
|
· |
other factors discussed in this Annual Report. |
All forward‑looking statements are expressly qualified in their entirety by the foregoing cautionary statements. Our forward‑looking statements speak only as of the date of this Annual Report or as of the date as of which they are made. Except as required by applicable law, including federal securities laws, we do not intend to update or revise any forward‑looking statements.
The following terms are used throughout this Annual Report:
Base Earnings. This is a percentage of the estimated operating cash flow earnings before partner compensation (i.e. Target Earnings) upon which we apply a multiple to determine acquisition prices. We retain a cumulative preferred position in Base Earnings.
Commission‑based. Commission‑based revenue is derived from commissions paid by clients or payments from third parties for sales of investment or insurance products.
Fee‑based. Fee‑based services are those for which a partner firm primarily charges a fee directly to the client for wealth management services, recordkeeping and administration services and other services rather than being primarily compensated through commissions from third parties for recommending financial products.
Fiduciary Duty. A fiduciary duty is a legal duty to act in another party’s interests, with utmost good faith, to make full and fair disclosure of all material facts and to exercise all reasonable care to avoid misleading clients.
GAAP. Accounting principles generally accepted in the United States of America.
High Net Worth. High net worth individuals are generally defined in the financial industry as those with liquid financial assets, excluding primary residence, in excess of $1 million.
Lift Out. The circumstance when a group of wealth management professionals, already working as a team, seeks to leave their current employer and join another employer or start their own registered investment advisor firm.
Open‑architecture. An investment platform that grants clients access to a wide range of investment funds and products offered by third parties. By contrast, a closed architecture is an investment platform that grants clients access only to proprietary investment funds and products.
Partnership. The term we use to refer to our business and relationship with our partner firms. It is not intended to describe a particular form of legal entity or a legal relationship.
Target Earnings. The estimated operating cash flow earnings before partner compensation.
Ultra‑High Net Worth. Ultra‑high net worth individuals are generally defined in the financial industry as those with liquid financial assets, excluding primary residence, in excess of $30 million.
Wealth Management. Comprehensive professional services that combine investment advice, financial and tax planning, consulting, tax return preparation, family office services and other services that help clients achieve their objectives regarding accumulation, preservation and distribution of long‑term wealth.
Wirehouse. Brokerage firm that provides a full range of investment, research, trading and wealth management services to clients. The term originated prior to the advent of modern wireless communications, when brokerage firms were connected to their branches primarily through telephone and telegraph wires.
2
Unless otherwise indicated or the context requires, all references to “we”, “us”, “our”, the “Company”, “Focus Inc.” and similar terms for periods prior to our initial public offering (“IPO”) and related reorganization transactions (the “Reorganization Transactions”) refer to Focus Financial Partners, LLC and its subsidiaries. For periods subsequent to the IPO and Reorganization Transactions, these terms refer to Focus Financial Partners Inc. and its consolidated subsidiaries. “Focus LLC” refers to Focus Financial Partners, LLC, a Delaware limited liability company and a consolidated subsidiary of ours following the IPO and Reorganization Transactions.
The term “partner firms” refers to our consolidated subsidiaries engaged in wealth management and related services, the businesses of which are typically managed by the principals. The term “principals” refers to the wealth management professionals who manage the businesses of our partner firms pursuant to the relevant management agreement. The term “our partnership” refers to our business and relationship with our partner firms and is not intended to describe a particular form of legal entity or a legal relationship.
Corporate Structure
Focus Inc. was incorporated as a Delaware corporation on July 29, 2015 for the purpose of completing the IPO and Reorganization Transactions. On July 30, 2018, we completed our IPO of 18,648,649 shares of Class A common stock, par value $0.01 per share. The shares began trading on the NASDAQ Global Select Market on July 26, 2018 under the ticker symbol “FOCS.” We used the proceeds from the IPO to purchase certain outstanding Focus LLC units, to reduce indebtedness under our credit facility and for acquisitions and general corporate business purposes.
In connection with the IPO and Reorganization Transactions, Focus Inc. became a holding company whose most significant asset is a membership interest in Focus LLC. Focus LLC directly or indirectly owns all of the outstanding equity interests in our partner firms. Focus Inc. is the sole managing member of Focus LLC and is responsible for all operational, management and administrative decisions of Focus LLC. Subject to certain restrictions, unitholders of Focus LLC (other than Focus Inc. and any of its subsidiaries) may receive shares of our Class A common stock pursuant to the exercise of an exchange right or a call right.
Our Company
We are a leading partnership of independent, fiduciary wealth management firms operating in the highly fragmented registered investment adviser (“RIA”) industry, with a footprint of over 60 partner firms primarily in the United States. We have achieved this market leadership by positioning ourselves as the partner of choice for many firms in an industry where a number of secular trends are driving consolidation. Our partner firms primarily service ultra‑high net worth and high net worth individuals and families by providing highly differentiated and comprehensive wealth management services. Our partner firms benefit from our intellectual and financial resources, operating as part of a scaled business model with aligned economic interests, while retaining their entrepreneurial culture and independence.
3
Our partnership is built on the following principles, which enable us to attract and retain high‑quality wealth management firms and accelerate their growth:
|
Entrepreneurship: |
Maintain the entrepreneurial spirit, independence and unique culture of each partner firm. |
|
|
|
|
Fiduciary Standard: |
Partner with wealth management firms that are held to the fiduciary standard in serving their clients. |
|
|
|
|
Alignment of Interests: |
Align principals’ interests with our interests through our differentiated partnership and economic model. |
|
|
|
|
Value‑Add Services: |
Empower our partner firms through collaboration on strategy, growth and acquisition opportunities, marketing, technology and operational expertise, best practices, cash and credit solutions. Provide access to world‑class intellectual resources and capital to fund expansion and acquisitions. |
We were founded by entrepreneurs and began revenue‑generating and acquisition activities in 2006. Since that time, we have:
|
· |
created a partnership of over 60 partner firms, the substantial majority of which are RIAs registered with the Securities and Exchange Commission (the “SEC”) pursuant to the Investment Advisers Act of 1940 (the “Advisers Act”); |
|
· |
built a business with revenues in excess of $1.2 billion for the year ended December 31, 2019; |
|
· |
increased revenues at a compound annual growth rate of 35.1% since 2006; |
|
· |
established an attractive revenue model whereby in excess of 95% of our revenues for the year ended December 31, 2019 were fee‑based and recurring in nature; |
|
· |
built a partnership currently comprised of approximately 4,000 wealth management‑focused principals and employees; and |
|
· |
established a national footprint across the United States and expanded our presence internationally with partner firms in the United Kingdom, Canada and Australia. |
We are in the midst of a fundamental shift in the growing wealth management services industry. The delivery of wealth management services is moving from traditional brokerage, commission‑based platforms to a fiduciary, open‑architecture and fee‑based structure. This shift has resulted in a significant transfer of client assets and wealth management professionals out of traditional brokerage, commission‑based platforms to independent wealth management practices. We believe that our leading partnership of independent, fiduciary wealth management firms positions us to benefit from these trends.
The independent wealth management industry, including RIAs, is highly fragmented, which we believe enables us to continue our growth strategy of acquiring high‑quality independent wealth management firms, directly and through acquisitions by our partner firms. We have a track record of enhancing the competitive position of our partner firms by providing them with access to the intellectual expertise, resources and network benefits of our large organization. Our scale enables us to help our partner firms achieve operational efficiencies and ensure organizational continuity. Additionally, our scale, resources and value‑added services increase our partner firms’ ability to achieve growth through a variety of tactical, operational and strategic initiatives, as well as the consummation of their own acquisitions. As our existing partner firms benefit from these growth initiatives, we continue to focus on acquisitions of new partner firms.
4
Our partnership is comprised of trusted professionals providing comprehensive wealth management services through a largely recurring, fee‑based model, which differentiates our partner firms from the traditional brokerage platforms whose revenues are largely derived from commissions. We derive a substantial majority of our revenues from wealth management fees for investment advice, financial and tax planning, consulting, tax return preparation, family office services and other services. We also generate other revenues from recordkeeping and administration service fees, commissions and distribution fees and outsourced services.
Our Growth Strategy
We believe we are well‑positioned to take advantage of favorable trends in the wealth management industry, including the migration of wealth management professionals from traditional brokerage, commission‑based platforms to a fiduciary, open‑architecture and fee‑based structure. We plan to grow our business through the growth of our existing partner firms and the expansion of our partnership.
Growth of Our Existing Partner Firms
High‑Quality, Growth‑Oriented Partner Firms
Our goal has been and continues to be to acquire high‑quality, entrepreneurial wealth management firms that have built their businesses through a proven track record of growth. We believe that our partner firms will continue to take advantage of the shift in client assets to the RIA space and grow organically through acquisitions of wealth management practices and customer relationships, by attracting new clients, adding new wealth management professionals, increasing client assets from existing clients and through financial market appreciation over time. The economic arrangements put in place at the time of acquisition through our management agreements incentivize the principals of our partner firms to continue executing on their growth plans.
Value‑Added Services
We have a team of over 80 professionals who support our partner firms by providing value‑added services, including marketing and business development support; human resources support, including adviser coaching and development and structuring compensation and incentive models, career path planning and succession planning advice; operational and technology expertise, cash and credit solutions, legal and regulatory support and providing negotiating leverage with vendors. Our value‑added services also include access to our M&A expertise, which facilitates acquisition opportunities for our partner firms through a proactive outreach program, structuring, executing and funding transactions and providing guidance to partner firms to facilitate their integration into our partnership as well as integration of mergers they execute. We assign a relationship leader to each partner firm who is responsible for coordinating our value‑added services to assist that partner firm in accelerating its growth. These services are provided to our partner firms at no additional cost. Our partner firms also have access to our intellectual expertise and partner firm network, which ultimately enhance their operations, enabling them to better serve their clients.
Some of our key value‑added services are described in detail below.
Marketing and Business Development. We offer marketing and business development coaching to our partner firms on topics including referral programs, revenue enhancement measures, communications, website and social media, brand strategy and public relations support. Our marketing team works closely with each of our partner firms to understand their unique value proposition and help them better market themselves to their clients and their centers of influence, including accounting and law firms who serve as potential referral sources. To further support our partner firms, in June 2018 we completed a minority investment in Financial Insight Technology, Inc. (known as SmartAsset), a New York‑based fintech company that connects prospective clients with financial advisers and provides tools to help individuals make more informed financial decisions.
Talent Management. We support the mentoring of next‑generation talent at each of our partner firms through continuous coaching programs that we organize and execute. These programs emphasize key learnings gained from observing top talent across our organization, allowing our firms to benefit from best practices across our talent pool.
5
Compensation Structures and Succession Planning. We help our partner firms align their compensation models to further incentivize their teams. We also facilitate wealth management professional career path planning and advise on principal promotions to the respective management company. These services allow our partner firms to attract and retain the highest quality wealth management professionals. Our acquisition structure facilitates succession planning by maintaining the partner firm and management company as separate entities, thereby allowing for the principals owning the management company to transition over time without disrupting client relationships at the partner firm.
Operations and Technology. We assist partner firms in selecting and implementing third‑party technology solutions that strengthen each firm’s operational performance. Our partner firms can request that our operations team conduct detailed operational assessments to determine their staffing and operating efficiency. Additionally, our operations team provides partner firms negotiating leverage with vendors and cost‑efficient access to third‑party technology.
Cash and Credit Solutions. Through Focus Client Solutions we have created a network of third-party banks and non-bank lenders to provide a competitive array of cash and credit solutions. These alternatives enable our partner firms to proactively help their clients achieve higher yields on cash, as well as unlock home equity and business opportunities through refinancing, commercial lending and other options.
Legal and Regulatory Support. We have an experienced team of legal professionals in place to help support our partner firms in fulfilling their regulatory responsibilities by providing subject matter guidance and expertise. We also have relationships with numerous legal and compliance advisers to help each of our partner firms maintain a robust compliance culture.
Sharing of Best Practices / Collaboration with Other Partner Firms. Our partner firms have access to networking opportunities, best practices roundtable discussions and training seminars. We offer offsite meetings, seminars and other forums for partner firms to learn and adopt best practices. We host partners meetings each year where wealth management professionals from our partner firms have opportunities to meet face to face to collaborate and share ideas. In addition we host periodic summits for chief investment officers, chief compliance officers, chief operating officers, chief financial officers and chief marketing officers, where our partner firms can gather and share specialized expertise and business development practices. Our partner firms are also encouraged to share best practices regularly in order to enhance their collective ability to better serve their clients.
Acquisitions by Our Partner Firms
We are instrumental and support the acquisition of wealth management practices and customer relationships by our partner firms to further expand their businesses. Partner firms pursue acquisitions for a variety of reasons, including geographic expansion, acquisition of new talent and/or specific expertise and succession planning. Acquisitions by our partner firms allow them to add new talent and services to better support their client base while simultaneously capturing synergies from the acquired businesses. We believe there are currently approximately 5,000 firms in the United States that are suitable targets for our partner firms. We have an experienced team of professionals with deep industry relationships to assist in identifying potential acquisition targets for our partner firms. Through our proprietary in‑house sourcing effort, we frequently identify acquisition opportunities for our partner firms. Additionally, many of our partner firms are well‑known in the industry and have developed extensive relationships. In recent years, principals and employees of our partner firms have identified attractive merger candidates, and we believe this trend will continue as our partner firms continue to build scale.
In addition to sourcing opportunities, we are actively involved through each stage of the process to provide legal, financial, tax, compliance and operational expertise to guide our partner firms through the acquisition due diligence process and execution. We provide the funding for acquisitions in the same manner that a parent company would typically fund acquisitions by its subsidiaries.
Our partner firms typically acquire substantially all of the assets of a target firm for cash or a combination of cash and equity and the right to receive contingent consideration. In certain situations, when the acquisition involves a merger with a corporation, and the consideration includes our Class A common stock, Focus Inc. may purchase all of the
6
equity of a target firm and then contribute the assets to our partner firm. In certain instances, our partner firms may acquire only the customer relationships. At the time a partner firm consummates an acquisition, we amend our management agreement with the partner firm to adjust Base Earnings and Target Earnings to reflect the projected post‑acquisition Earnings Before Partner Compensation (“EBPC”) of the partner firm.
Our partner firms completed 15 transactions in 2017, 17 transactions in 2018 and 28 transactions in 2019. With our approval and support, our partner firms may choose to merge with each other as well. Consolidation of our existing partner firms leads to efficiencies and incremental growth in our cash flows. Since January 2017, three partner firms have consummated mergers with other partner firms.
Expansion of Our Partnership
Acquisitions of New Partner Firms
Since inception, a fundamental aspect of our growth strategy has been the acquisition of high‑quality, independent wealth management firms to expand our partnership. We believe that there are approximately 1,000 firms in the United States that are high‑quality targets for future acquisitions. While most of our acquisitions have taken place in the United States, we also see opportunities in several countries where market and regulatory trends toward the fiduciary standard and open‑architecture access mirror those occurring in the United States. We have already begun expansion into the United Kingdom, Canada and Australia.
Our differentiated partnership model and track record have allowed us to grow and enhance our leadership position in the independent wealth management industry.
We are highly selective in choosing our partner firms and conduct extensive financial, legal, tax, operational and business due diligence. We evaluate a variety of criteria including the quality of the wealth management professionals, client characteristics, historical revenues and cash flows, the recurring nature of the revenues, compliance policies and procedures and the alignment of interests between wealth management professionals and clients. We focus on firms with owners who are committed to the long‑term management and growth of their businesses.
With limited exceptions, our partner firm acquisitions have been structured as acquisitions of substantially all of the assets of the firm we choose to partner with but only a portion of the underlying economics in order to align the principals’ interests with our own objectives. To determine the acquisition price, we first estimate the operating cash flow of the business based on current and projected levels of revenue and expense, before compensation and benefits to the selling principals or other individuals who become principals. We refer to the operating cash flow of the business as Earnings Before Partner Compensation or EBPC, and to this EBPC estimate as Target Earnings. In economic terms, we typically purchase 40% to 60% of the partner firm’s EBPC. We refer to the corresponding percentage of Target Earnings on which we base the purchase price as “Base Earnings.” Under a management agreement between our operating subsidiary and the management company and the principals, the management company is entitled to management fees typically consisting of all future EBPC of the acquired wealth management firm in excess of Base Earnings up to Target Earnings, plus a percentage of any EBPC in excess of Target Earnings. Through the management agreement, we create downside protection for ourselves by retaining a cumulative preferred position in Base Earnings.
7
Since 2006, when we began revenue‑generating and acquisition activities, we have grown to a partnership with over 60 partner firms. Acquisitions of partner firms to date have been structured as illustrated below, with limited exceptions. Subsidiary mergers at the partner firm level have been structured differently, and in the future we may structure acquisitions in foreign jurisdictions differently depending on legal and tax considerations.
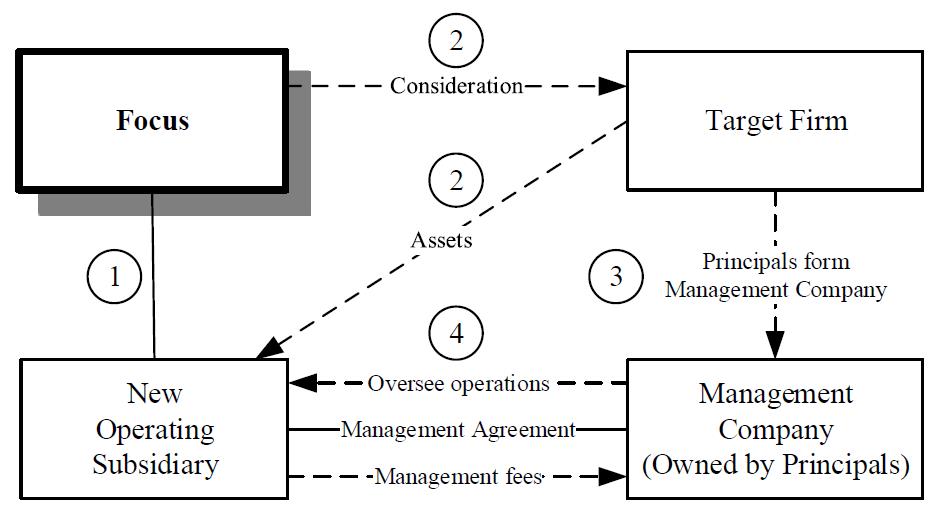
|
(1) |
Focus LLC forms a wholly owned subsidiary. |
|
(2) |
In exchange for cash or a combination of cash and equity and the right to receive contingent consideration, the new operating subsidiary acquires substantially all of the assets of the target firm, which is owned by the selling principals, and becomes the successor firm. |
|
(3) |
The selling principals form a management company. In addition to the selling principals, the management company may include non‑selling principals who become newly admitted in connection with the acquisition or thereafter. |
|
(4) |
The new operating subsidiary, the principals and the management company enter into a management agreement which typically has an initial term of six years subject to automatic renewals for consecutive one‑year terms, unless earlier terminated by either the management company or us in certain limited situations. Under the management agreement, the management company is entitled to management fees typically consisting of all future EBPC of the new operating subsidiary in excess of Base Earnings up to Target Earnings, plus a percentage of any EBPC in excess of Target Earnings. Pursuant to the management agreement, the management company provides the personnel who conduct the day‑to‑day operations of the new operating subsidiary. Through the management agreement, we create downside protection for ourselves by retaining a cumulative preferred position in each partner firm’s Base Earnings. |
In connection with a typical acquisition, we enter into an acquisition agreement with the target firm and its selling principals pursuant to which we purchase substantially all of the assets of the target firm. The purchase price is a multiple of Base Earnings, which is a percentage of Target Earnings. The purchase price is comprised of a base purchase price and a right to receive contingent consideration in the form of earn out payments. The contingent consideration for acquisitions of new partner firms is generally paid over a six-year period upon the satisfaction of specified growth thresholds in years three and six. These growth thresholds are typically tied to the compounded annual growth rate (“CAGR”) of the partner firm’s earnings. Such growth thresholds can be set annually over the six-year period as well. The contingent consideration for acquisitions made by our partner firms is paid upon the satisfaction of specified financial thresholds, which are typically annual. These thresholds are typically tied to revenue as adjusted for certain criteria or other operating metrics, based on the retention or growth of the business acquired. These arrangements may
8
result in the payment of additional purchase price consideration to the sellers for periods following the closing of an acquisition. Contingent consideration payments are typically payable in cash and, in some cases, equity.
The acquisition agreements contain customary representations and warranties of the parties, and closing is generally conditioned on the delivery of certain ancillary documents, including an executed management agreement, a confidentiality and non‑solicitation agreement, a non‑competition agreement and a notice issued by the acquired firm to its clients notifying them of the acquisition and requesting their consent for the assignment of any agreements to the successor firm.
In connection with the acquisition, management companies and selling principals agree to non‑competition and non‑solicitation provisions of the management agreement, as well as standalone non‑competition and non‑solicitation agreements required by the acquisition agreement. Such non‑competition and non‑solicitation agreements typically have five‑year terms. The non‑competition and non‑solicitation provisions of the management agreement continue during the term of the management agreement and for a period of two years thereafter.
Our partner firms are primarily overseen by the principals who own the management company formed concurrently with the acquisition. Our operating subsidiary, the management company and the principals enter into a long‑term management agreement pursuant to which the management company provides the personnel responsible for overseeing the day‑to‑day operations of the partner firm. The term of the management agreement is generally six years subject to automatic renewals for consecutive one‑year terms, unless earlier terminated by either the management company or us. Subject to applicable cure periods, we may terminate the management agreement upon the occurrence of an event of cause, which may include willful misconduct by the management company or any principal that is reasonably likely to result in a material adverse effect, the failure of the management company to comply with regulatory or other governmental compliance procedures or a material breach of the agreement by the management company or the principals. In some cases, we may have the right to terminate the agreement if any principal ceases to be involved on a full‑time basis in the management of the management company or the performance of services under the agreement. Generally, the management company may terminate the management agreement upon a material breach of the agreement by us and the expiration of the applicable cure period.
This ownership and management structure allows the principals to maintain their entrepreneurial spirit through autonomous day‑to‑day decision making, while gaining access to our extensive resources and preserving the principals’ long‑term economic incentive to continue to grow the business. The management company structure provides both flexibility to us and stability to our partner firms by permitting the principals to continue to build equity value in the management company as the partner firm grows and to control their internal economics and succession plans within the management company.
9
The following table provides an illustrative example of our economics, including management fees earned by the management company, for periods of projected revenues, +10% growth in revenues and −10% growth in revenues. This example assumes (i) Target Earnings of $3.0 million; (ii) Base Earnings acquired of 60% of Target Earnings or $1.8 million; and (iii) a percentage of earnings in excess of Target Earnings retained by the management company of 40%.
|
|
|
|
|
|
|
|
|
|
|
|
|
|
|
|
|
Projected |
|
+10% Growth |
|
−10% Growth |
|
|||
|
|
|
|
Revenues |
|
in Revenues |
|
in Revenues |
|
|||
|
|
|
|
(in thousands) |
|
|||||||
|
|
New Partner Firm |
|
|
|
|
|
|
|
|
|
|
|
|
New partner firm revenues |
|
$ |
5,000 |
|
$ |
5,500 |
|
$ |
4,500 |
|
|
|
Less: |
|
|
|
|
|
|
|
|
|
|
|
|
Operating expenses (excluding management fees) |
|
|
(2,000) |
|
|
(2,000) |
|
|
(2,000) |
|
|
|
EBPC |
|
$ |
3,000 |
|
$ |
3,500 |
|
$ |
2,500 |
|
|
|
Base Earnings to Focus Inc. (60%) |
|
|
1,800 |
|
|
1,800 |
|
|
1,800 |
|
|
|
Management fees to management company (40%) |
|
|
1,200 |
|
|
1,200 |
|
|
700 |
|
|
|
EBPC in excess of Target Earnings: |
|
|
|
|
|
|
|
|
|
|
|
|
To Focus Inc. (60%) |
|
|
— |
|
|
300 |
|
|
— |
|
|
|
To management company as management fees (40%) |
|
|
— |
|
|
200 |
|
|
— |
|
|
|
Focus Inc. |
|
|
|
|
|
|
|
|
|
|
|
|
Focus Inc. revenues |
|
$ |
5,000 |
|
$ |
5,500 |
|
$ |
4,500 |
|
|
|
Less: |
|
|
|
|
|
|
|
|
|
|
|
|
Operating expenses (excluding management fees) |
|
|
(2,000) |
|
|
(2,000) |
|
|
(2,000) |
|
|
|
Less: |
|
|
|
|
|
|
|
|
|
|
|
|
Management fees to management company |
|
|
(1,200) |
|
|
(1,400) |
|
|
(700) |
|
|
|
Operating income |
|
$ |
1,800 |
|
$ |
2,100 |
|
$ |
1,800 |
|
|
|
|
|
|
|
|
|
|
|
|
|
|
In certain circumstances, the structure of our relationship with partner firms may differ from the typical structure described above. In addition, our future international acquisitions may not be structured like our typical partner firm acquisitions. For example, the structure of our ownership interests in non‑U.S. partner firms may differ from the way in which we own our U.S. partner firms.
Lift Outs of Established Wealth Management Professionals
From time to time, through Focus Independence, we offer teams of wealth management professionals at traditional brokerage firms and wirehouses with attractive track records and books of business the opportunity to establish their own independent wealth management firm and ultimately join our partnership as a new partner firm. This program gives these professionals the opportunity to build a business largely unencumbered by the conflicts of interest they face at traditional brokerage firms and wirehouses and with more favorable economics. Focus Independence is a targeted approach to lift out teams of wealth management professionals from traditional brokerage firms and wirehouses with attractive track records and books of business and make them entrepreneurs within our partnership. The program has been successful, with the substantial majority of ultra‑high net worth and high net worth clients retained by the newly formed partner firm. We have completed 14 acquisitions of new partner firms through Focus Independence.
We work with each team of wealth management professionals to establish a new RIA business and provide consultation as needed on virtually everything needed to transition to and operate the new RIA as a full‑service firm, including technology, personnel and office space. With many teams, we enter into an option agreement, which provides us with the option to acquire substantially all of the assets of the RIA 12 to 13 months after the team’s resignation date from the brokerage firm or wirehouse. The option agreement provides a purchase price formula, typically equal to a multiple of the portion of the new RIA’s run-rate EBPC at the time of acquisition closing. The option agreement also
10
establishes the portion of the purchase price to be paid in cash and equity. Transactions with teams where we do not enter into an option agreement may be structured more like a typical acquisition.
Our Partner Firms
Our partner firms provide comprehensive wealth management services to ultra‑high net worth and high net worth individuals and families, as well as business entities, under a largely recurring, fee‑based model. Our partner firms provide these services across a diverse range of investment styles, asset classes and clients. The substantial majority of our partner firms are RIAs, and certain of our partner firms also have affiliated broker‑dealers and/or insurance brokers. Several of our partner firms and their principals have been recognized as leading wealth management firms and advisers by financial publications such as Barron’s, The Financial Times and Forbes.
Our partner firms derive a substantial majority of their revenues from wealth management fees for investment advice, financial and tax planning, consulting, tax return preparation, family office services and other services. Wealth management fees are primarily based either on a contractual percentage of the client assets, a flat fee, an hourly rate or a combination of such fees and are billed either in advance or arrears on a monthly, quarterly or semiannual basis. We also generate other revenue from recordkeeping and administration service fees, commissions and distribution fees and outsourced services.
We currently have over 60 partner firms. All of our partner firm acquisitions have been paid for with cash or a combination of cash and equity and the right to receive contingent consideration. We have to date, with limited exceptions, acquired substantially all of the assets of the firms we choose to partner with and have assumed only post‑closing contractual obligations, not any material existing liabilities.
11
The following is a list of our partner firms as of February 25, 2020:
|
|
|
|
|
Joined through |
|
Acquisition(s) |
|
|
|
Partner |
|
Focus |
|
Completed by |
|
Partner Firm |
|
Firm Since |
|
Independence |
|
Partner Firm |
|
|
|
2006 |
|
|
|
|
|
StrategicPoint |
|
January |
|
|
|
|
|
HoyleCohen |
|
May |
|
|
|
|
|
|
|
2007 |
|
|
|
|
|
Sentinel Benefits & Financial Group |
|
January |
|
|
|
|
|
Buckingham |
|
February |
|
|
|
|
|
Benefit Financial Services Group |
|
March |
|
|
|
|
|
JFS Wealth Advisors |
|
August |
|
|
|
|
|
Atlas Private Wealth Management |
|
September |
|
|
|
|
|
GW & Wade |
|
September |
|
|
|
|
|
|
|
2008 |
|
|
|
|
|
Greystone |
|
April |
|
|
|
|
|
WESPAC |
|
July |
|
|
|
|
|
|
|
2009 |
|
|
|
|
|
Joel Isaacson & Co. |
|
November |
|
|
|
|
|
Coastal Bridge Advisors |
|
December |
|
|
|
|
|
|
|
2010 |
|
|
|
|
|
Pettinga |
|
December |
|
|
|
|
|
|
|
2011 |
|
|
|
|
|
Sapient Private Wealth Management |
|
September |
|
|
|
|
|
The Colony Group |
|
October |
|
|
|
|
|
LVW Advisors |
|
October |
|
|
|
|
|
|
|
2012 |
|
|
|
|
|
Vestor Capital |
|
October |
|
|
|
|
|
Merriman |
|
December |
|
|
|
|
|
The Portfolio Strategy Group |
|
December |
|
|
|
|
|
|
|
2013 |
|
|
|
|
|
LaFleur & Godfrey |
|
August |
|
|
|
|
|
Telemus Capital |
|
August |
|
|
|
|
|
|
|
2014 |
|
|
|
|
|
Summit Financial |
|
April |
|
|
|
|
|
Flynn Family Office |
|
June |
|
|
|
|
|
Gratus Capital |
|
October |
|
|
|
|
|
Strategic Wealth Partners |
|
November |
|
|
|
|
|
|
|
2015 |
|
|
|
|
|
IFAM Capital |
|
February |
|
|
|
|
|
Dorchester Wealth Management |
|
April |
|
|
|
|
|
The Fiduciary Group |
|
April |
|
|
|
|
|
Quadrant Private Wealth |
|
July |
|
|
|
|
|
Relative Value Partners |
|
July |
|
|
|
|
|
Fort Pitt Capital Group |
|
October |
|
|
|
|
|
Patton Albertson Miller Group |
|
October |
|
|
|
|
|
|
|
2016 |
|
|
|
|
|
Douglas Lane & Associates |
|
January |
|
|
|
|
|
Kovitz Investment Group Partners |
|
January |
|
|
|
|
|
Waddell & Associates |
|
April |
|
|
|
|
|
Transform Wealth |
|
April |
|
|
|
|
|
GYL Financial Synergies |
|
August |
|
|
|
|
|
XML Financial Group |
|
October |
|
|
|
|
|
|
|
2017 |
|
|
|
|
|
Crestwood Advisors |
|
January |
|
|
|
|
|
CFO4Life |
|
February |
|
|
|
|
|
One Charles Private Wealth |
|
February |
|
|
|
|
|
Bordeaux Wealth Advisors |
|
March |
|
|
|
|
|
Gelfand, Rennert & Feldman |
|
April |
|
|
|
|
|
Lake Street Advisors |
|
April |
|
|
|
|
|
Financial Professionals |
|
May |
|
|
|
|
|
SCS Financial Services |
|
July |
|
|
|
|
|
Brownlie & Braden |
|
July |
|
|
|
|
|
Eton Advisors |
|
September |
|
|
|
|
|
|
|
2018 |
|
|
|
|
|
Cornerstone Wealth |
|
January |
|
|
|
|
|
Fortem Financial |
|
February |
|
|
|
|
|
Bartlett Wealth Management |
|
April |
|
|
|
|
|
Campbell Deegan Financial |
|
April |
|
|
|
|
|
Nigro, Karlin, Segal, Feldstein & Bolno (NKSFB) |
|
April |
|
|
|
|
|
TrinityPoint Wealth |
|
May |
|
|
|
|
|
Asset Advisors Investment Management |
|
July |
|
|
|
|
|
Edge Capital Group |
|
August |
|
|
|
|
|
Vista Wealth Management |
|
August |
|
|
|
|
|
|
|
2019 |
|
|
|
|
|
Altman, Greenfield & Selvaggi |
|
January |
|
|
|
|
|
Prime Quadrant |
|
February |
|
|
|
|
|
Foster, Dykema & Cabot |
|
March |
|
|
|
|
|
Escala Partners |
|
April |
|
|
|
|
|
Sound View Wealth Advisors |
|
April |
|
|
|
|
|
Williams Jones |
|
August |
|
|
|
|
|
|
|
2020 |
|
|
|
|
|
Nexus Investment Management |
|
February |
|
|
|
|
|
|
|
|
|
|
|
|
12
The following shows certain of the value‑added services we have provided to our partner firms through February 25, 2020:
|
|
|
Value‑Added Services |
||||||||
|
|
|
|
|
Operational |
|
|
|
|
|
|
|
|
|
Marketing and |
|
and |
|
Legal and |
|
|
|
|
|
|
|
Business |
|
Technology |
|
Compliance |
|
Talent |
|
Succession |
|
Partner Firm |
|
Development |
|
Enhancements |
|
Support |
|
Management |
|
Planning |
|
StrategicPoint |
|
|
|
|
|
|
|
|
|
|
|
HoyleCohen |
|
|
|
|
|
|
|
|
|
|
|
Sentinel Benefits & Financial Group |
|
|
|
|
|
|
|
|
|
|
|
Buckingham |
|
|
|
|
|
|
|
|
|
|
|
Benefit Financial Services Group |
|
|
|
|
|
|
|
|
|
|
|
JFS Wealth Advisors |
|
|
|
|
|
|
|
|
|
|
|
Atlas Private Wealth Management |
|
|
|
|
|
|
|
|
|
|
|
GW & Wade |
|
|
|
|
|
|
|
|
|
|
|
Greystone |
|
|
|
|
|
|
|
|
|
|
|
WESPAC |
|
|
|
|
|
|
|
|
|
|
|
Joel Isaacson & Co. |
|
|
|
|
|
|
|
|
|
|
|
Coastal Bridge Advisors |
|
|
|
|
|
|
|
|
|
|
|
Pettinga |
|
|
|
|
|
|
|
|
|
|
|
Sapient Private Wealth Management |
|
|
|
|
|
|
|
|
|
|
|
The Colony Group |
|
|
|
|
|
|
|
|
|
|
|
LVW Advisors |
|
|
|
|
|
|
|
|
|
|
|
Vestor Capital |
|
|
|
|
|
|
|
|
|
|
|
Merriman |
|
|
|
|
|
|
|
|
|
|
|
The Portfolio Strategy Group |
|
|
|
|
|
|
|
|
|
|
|
LaFleur & Godfrey |
|
|
|
|
|
|
|
|
|
|
|
Telemus Capital |
|
|
|
|
|
|
|
|
|
|
|
Summit Financial |
|
|
|
|
|
|
|
|
|
|
|
Flynn Family Office |
|
|
|
|
|
|
|
|
|
|
|
Gratus Capital |
|
|
|
|
|
|
|
|
|
|
|
Strategic Wealth Partners |
|
|
|
|
|
|
|
|
|
|
|
IFAM Capital |
|
|
|
|
|
|
|
|
|
|
|
Dorchester Wealth Management |
|
|
|
|
|
|
|
|
|
|
|
The Fiduciary Group |
|
|
|
|
|
|
|
|
|
|
|
Quadrant Private Wealth |
|
|
|
|
|
|
|
|
|
|
|
Relative Value Partners |
|
|
|
|
|
|
|
|
|
|
|
Fort Pitt Capital Group |
|
|
|
|
|
|
|
|
|
|
|
Patton Albertson Miller Group |
|
|
|
|
|
|
|
|
|
|
|
Douglas Lane & Associates |
|
|
|
|
|
|
|
|
|
|
|
Kovitz Investment Group Partners |
|
|
|
|
|
|
|
|
|
|
|
Waddell & Associates |
|
|
|
|
|
|
|
|
|
|
|
Transform Wealth |
|
|
|
|
|
|
|
|
|
|
|
GYL Financial Synergies |
|
|
|
|
|
|
|
|
|
|
|
XML Financial Group |
|
|
|
|
|
|
|
|
|
|
|
Crestwood Advisors |
|
|
|
|
|
|
|
|
|
|
|
CFO4Life |
|
|
|
|
|
|
|
|
|
|
|
One Charles Private Wealth |
|
|
|
|
|
|
|
|
|
|
|
Bordeaux Wealth Advisors |
|
|
|
|
|
|
|
|
|
|
|
Gelfand, Rennert & Feldman |
|
|
|
|
|
|
|
|
|
|
|
Lake Street Advisors |
|
|
|
|
|
|
|
|
|
|
|
Financial Professionals |
|
|
|
|
|
|
|
|
|
|
|
SCS Financial Services |
|
|
|
|
|
|
|
|
|
|
|
Brownlie & Braden |
|
|
|
|
|
|
|
|
|
|
|
Eton Advisors |
|
|
|
|
|
|
|
|
|
|
|
Cornerstone Wealth |
|
|
|
|
|
|
|
|
|
|
|
Fortem Financial |
|
|
|
|
|
|
|
|
|
|
|
Bartlett Wealth Management |
|
|
|
|
|
|
|
|
|
|
|
Campbell Deegan Financial |
|
|
|
|
|
|
|
|
|
|
|
Nigro, Karlin, Segal, Feldstein, & Bolno (NKSFB) |
|
|
|
|
|
|
|
|
|
|
|
TrinityPoint Wealth |
|
|
|
|
|
|
|
|
|
|
|
Asset Advisors Investment Management |
|
|
|
|
|
|
|
|
|
|
|
Edge Capital Group |
|
|
|
|
|
|
|
|
|
|
|
Vista Wealth Management |
|
|
|
|
|
|
|
|
|
|
|
Altman, Greenfield & Selvaggi |
|
|
|
|
|
|
|
|
|
|
|
Prime Quadrant |
|
|
|
|
|
|
|
|
|
|
|
Foster, Dykema & Cabot |
|
|
|
|
|
|
|
|
|
|
|
Escala Partners |
|
|
|
|
|
|
|
|
|
|
|
Sound View Wealth Advisors |
|
|
|
|
|
|
|
|
|
|
|
Williams Jones |
|
|
|
|
|
|
|
|
|
|
|
Nexus Investment Management |
|
|
|
|
|
|
|
|
|
|
13
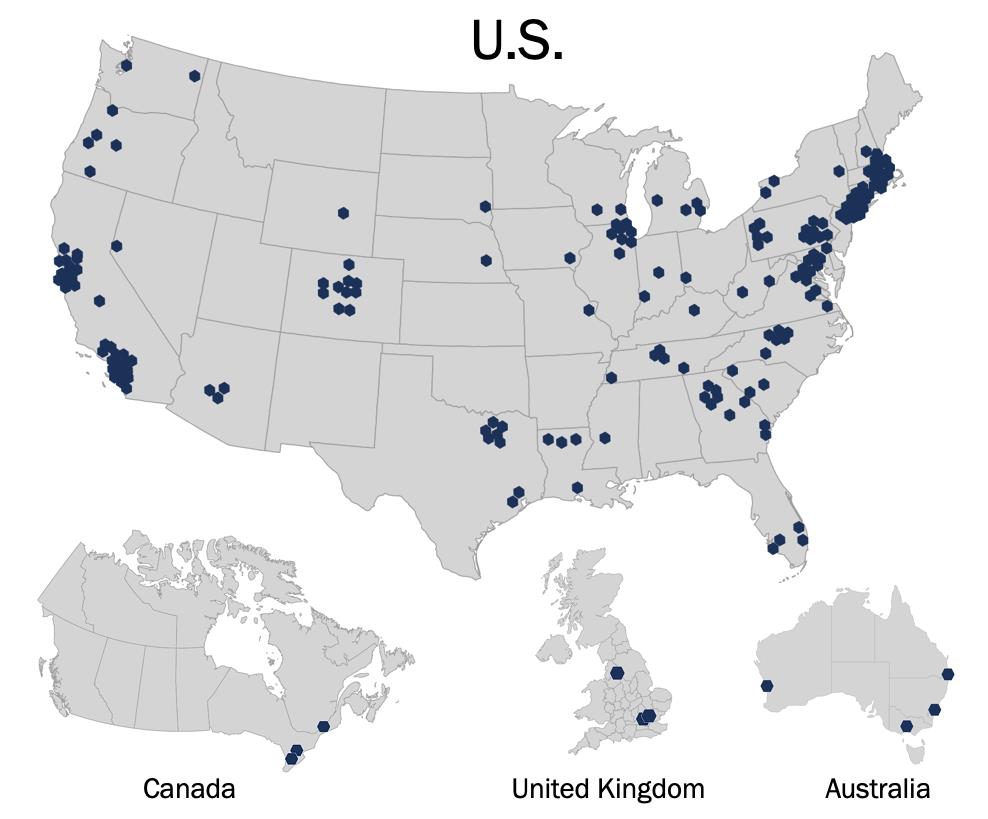
Our partner firms are primarily located in the United States. In addition, we have one partner firm, Greystone, in the United Kingdom, two partner firms, Dorchester Wealth Management and Prime Quadrant, in Canada and two partner firms, Escala Partners and Financial Professionals, in Australia. The following table shows our domestic and international revenues for the years ended December 31, 2017, 2018 and 2019:
|
|
|
Year Ended December 31, |
|
|||||||||||||
|
|
|
2017 |
|
2018 |
|
2019 |
|
|||||||||
|
|
|
(dollars in thousands) |
|
|||||||||||||
|
Domestic revenue |
|
$ |
643,077 |
|
97.0 |
% |
$ |
889,166 |
|
97.6 |
% |
$ |
1,170,169 |
|
96.0 |
% |
|
International revenue |
|
|
19,810 |
|
3.0 |
% |
|
21,714 |
|
2.4 |
% |
|
48,172 |
|
4.0 |
% |
|
Total revenue |
|
$ |
662,887 |
|
100.0 |
% |
$ |
910,880 |
|
100.0 |
% |
$ |
1,218,341 |
|
100.0 |
% |
In February 2020, we acquired an additional partner firm in Canada, Nexus Investment Management.
The maps below show the locations of our partner firms as of February 25, 2020. The majority of our partner firms operate multiple offices and in multiple states.
Upon joining our partnership, each partner firm transitions its operations to our common general ledger, payroll and cash management systems. Our common general ledger system provides us access to financial information of each partner firm and is designed to accommodate the varied needs of each individual business. We control payroll and payment of management fees for partner firms through a common disbursement process. The common payroll system allows us to effectively monitor compensation, new hires, terminations and other personnel changes. We employ a cash management system under which cash held by partner firms above a threshold is transferred into our centralized accounts. The cash management system enables us to control and secure our cash flow and more efficiently monitor partner firm earnings and financial position.
14
We and our partner firms devote substantial time and effort to remaining current on, and addressing, regulatory and compliance matters. Each of our registered partner firms has its own chief compliance officer and has established a compliance program to help detect and prevent compliance violations.
While the chief compliance officers at our partner firms are principally responsible for maintaining their respective compliance programs and for tailoring them to the specifics of their partner firms’ businesses, we have an experienced team of legal professionals in place at the holding company to support our partner firms in fulfilling their regulatory responsibilities by providing additional guidance and expertise. We collaborate with each of our partner firms in its completion of an annual compliance risk assessment, which is conducted by an outside law firm or a compliance consulting firm. We also engage third‑party firms to conduct periodic cybersecurity audits and help coordinate completion of certain other employee training. We also monitor how our partner firms address risk assessment recommendations and regulatory exam findings. We also work with our partner firms to assist them in identifying qualified legal and compliance advisers by leveraging our extensive relationships.
Competition
The wealth management industry is very competitive. We compete with a broad range of wealth management firms, including public and privately held investment advisers, traditional brokerage firms and wirehouses, firms associated with securities broker‑dealers, financial institutions, private equity firms and insurance companies. We believe that important factors affecting our partner firms’ ability to compete for clients include the ability to attract and retain key wealth management professionals, investment performance, wealth management fee rates, the quality of services provided to clients, the depth and continuity of client relationships, adherence to the fiduciary standard and reputation.
We strategically built a leading partnership of independent, fiduciary wealth management firms led by entrepreneurs through a unique, disciplined and proven acquisition strategy. Our differentiated partnership model has allowed us to grow and enhance our leadership position in the wealth management industry. As we continue our growth strategy of acquiring high‑quality partner firms, we believe that important factors affecting our ability to compete for future acquisitions include:
|
· |
the degree to which target wealth management firms view our partnership model as preferable, financially and operationally or otherwise, to acquisition or other arrangements offered by other potential purchasers; |
|
· |
the reputation and performance of our existing and future partner firms, by which target wealth management firms may judge us and our future prospects; and |
|
· |
the quality and breadth of our value‑added services. |
Employees
As of December 31, 2019, we had over 3,400 employees, 83 of whom were employed at the holding company.
Additionally, as of December 31, 2019, there were over 500 principals who were part of the management companies that oversaw partner firms and were not our employees.
Trademarks
We own many registered trademarks and service marks in the United States. We believe the Focus Financial Partners name and the many distinctive marks associated with it are of significant value and are very important to our business. Accordingly, as a general policy, we monitor the use of our marks and vigorously oppose any unauthorized use of them.
We register some of our copyrighted material and otherwise rely on common law protection of our copyrighted materials, but these are not material to our business.
15
Available Information
We are required to file annual, quarterly and current reports, proxy statements and certain other information with the SEC. The SEC maintains a website at www.sec.gov that contains reports, proxy and information statements and other information regarding registrants that file electronically with the SEC. Any documents filed by us with the SEC, including this Annual Report, can be downloaded from the SEC’s website.
We also make available free of charge through our website, www.focusfinancialpartners.com, electronic copies of certain documents that we file with the SEC, including our Annual Reports on Form 10‑K, Quarterly Reports on Form 10‑Q, Current Reports on Form 8‑K and amendments to those reports filed or furnished pursuant to Section 13(a) or 15(d) of the Securities Exchange Act of 1934, as amended (the “Exchange Act”), as soon as reasonably practicable after we electronically file such material with, or furnish it to, the SEC.
Regulatory Environment
Existing Regulation
Our partner firms are subject to extensive regulation in the United States. In addition, Greystone, Dorchester, Prime Quadrant, Nexus Investment Management, Financial Professionals and Escala are subject to extensive regulation in the United Kingdom, Canada and Australia, as applicable. In the United States, our partner firms are subject to regulation primarily at the federal level, including regulation by the SEC under the Advisers Act, by the U.S. Department of Labor (the “DOL”) under the Employee Retirement Income Security Act of 1974, as amended (“ERISA”), and by the SEC and the Financial Industry Regulatory Authority (“FINRA”) for our partner firm subsidiaries that are broker‑dealers. Our partner firms may also be subject to regulation by state regulators for insurance and several other aspects of our partner firms’ activities. Outside of the United States, Greystone is primarily regulated by the Financial Conduct Authority in the United Kingdom, Dorchester, Prime Quadrant and Nexus Investment Management are primarily regulated by the securities regulators of Canada’s provinces, and Financial Professionals and Escala are primarily regulated by the Australian Securities & Investments Commission (“ASIC”).
Our U.S. based partner firms that are investment advisers are registered with the SEC under the Advisers Act. The Advisers Act imposes numerous obligations on RIAs, including fiduciary duties, compliance and disclosure obligations, recordkeeping requirements and operational requirements. Certain of our partner firms sponsor unregistered and registered funds in the United States and certain foreign jurisdictions. These activities subject those partner firms to additional regulatory requirements in those jurisdictions. In addition, many state securities commissions impose filing requirements on investment advisers that operate or have places of business in their states. Similarly, many states require certain client facing employees of RIAs and FINRA‑registered broker‑dealers to become state-licensed.
Certain of our partner firms have affiliated SEC registered broker‑dealers for the purpose of distributing funds or other securities products or facilitating securities transactions. Broker‑dealers and their personnel are regulated, to a large extent, by the SEC and self‑regulatory organizations, principally FINRA. In addition, state regulators have supervisory authority over broker‑dealer activities conducted in their states. Broker‑dealers are subject to regulations which cover virtually all aspects of their business, including sales practices, trading practices, use and safekeeping of clients’ funds and securities, recordkeeping and the conduct of directors, officers, employees and representatives. Broker‑dealers are also subject to net capital rules that mandate that they maintain certain levels of capital. Certain partner firms have employees who are registered representatives with either affiliated or unaffiliated broker‑dealers.
Certain of our partner firms have licensed insurance affiliates. State insurance laws grant state insurance regulators broad administrative powers. These supervisory agencies regulate many aspects of the insurance business, including the licensing of insurance brokers and agents and other insurance intermediaries, and trade practices such as marketing, advertising and compensation arrangements entered into by insurance brokers and agents.
Our partner firms are also subject to regulation by the DOL under ERISA and related regulations with respect to investment advisory and management services provided to participants in retirement plans covered by ERISA and subject to regulation by the Internal Revenue Service (“IRS”) with respect to individual retirement accounts (“IRAs”)
16
pursuant to comparable provisions within the Internal Revenue Code (“IRC”). Among other requirements, ERISA and the IRC imposes duties on persons who are fiduciaries under ERISA and the IRC, respectively, and prohibit certain transactions involving related parties.
Additionally, we and our partner firms are subject to various state, federal and international data privacy and cybersecurity laws designed to protect client and employee personally identifiable information. These laws and regulations are increasing in complexity and number, which has resulted in greater compliance risk and cost for us. The unauthorized access, use, theft or destruction of client or employee personal, financial or other data could expose us to potential financial penalties and legal liability.
Additional Regulatory Reform
Our partner firms are subject to the numerous regulatory reform initiatives in the United States and in international jurisdictions where they operate. New laws or regulations, or changes in enforcement of existing laws or regulations, could have a material and adverse impact on the scope or profitability of our partner firms’ business activities or require us and/or our partner firms to change business practices and incur additional costs as well as potential reputational harm.
As examples, on June 5, 2019, the SEC adopted a package of rulemakings and interpretations that impose a best interest standard of conduct for broker‑dealers, requires investment advisers and broker-dealers to deliver short‑form disclosure documents to retail investors and clarifies the SEC’s views on the fiduciary duty that investment advisers owe to their clients. Our partner firms are developing their required short-form disclosure document by the June 30, 2020 compliance date. The impact of other elements of the rulemakings and interpretations on our partner firms and the industry is unclear at this time.
On November 4, 2019, the SEC proposed new rules regarding investment adviser advertisements and payments to solicitors. These proposed rules, if adopted, would largely replace the current advertising rules’ broad prohibitions and limitations with principles-based regulation. The rules would also extend the current solicitation rule to cover non-cash as well as cash compensation. While initially the impact of these rules appears positive for the business of our partner firms, the ultimate impact will be uncertain until any final rules are adopted and fully implemented.
On February 1, 2019, a Royal Commission in Australia issued a highly publicized report following a 12‑month inquiry of misconduct in the banking, superannuation and financial services industry. The report makes many recommendations that, if adopted into law or regulations, could impact our existing or any future Australian partner firms or investments. Some of the regulations include a new system of registration for financial advisers to be overseen by a new regulatory body and the repeal of carve‑outs and grandfathering of certain conflicted remuneration prohibitions.
In December 2019, the Canadian Securities Administrators adopted amendments to National Instrument 31-103 and its related Companion Policy which will impose new heightened requirements on our Canadian partner firms with respect to conflicts of interest, know your client, know your product and suitability obligations. In addition, in December 2019, our U.K. wealth management partner firm became subject to the new Senior Managers and Certification Regime which provides for additional firm and individual responsibilities and enhanced oversight by the U.K. Financial Conduct Authority.
Of the many data privacy and cybersecurity laws being enacted or considered, the California Consumer Privacy Act became effective on January 1, 2020. This act requires certain partner firms to review and enhance their governance regarding the collection and categorizing of certain personal information. They were also required to develop procedures to respond to consumer requests to be informed of their personal information that is collected and to have such information deleted if desired, among other elements.
In addition, financial regulators are increasing their enforcement and examination attention across a wide range of activities and business practices, including disclosure, conflicts of interest, cybersecurity, business continuity and succession planning. Such enhanced scrutiny may increase the likelihood of enforcement actions or violation findings, or
17
cause us or our partner firms to change business practices or incur additional costs. It is also not possible to predict how such changes may impact the businesses of our competitors and the competitive dynamics of the industry.
You should carefully consider the information in this Annual Report and the following risks. Our business, financial condition and results of operations could be materially and adversely affected by any of these risks. The risks described below are not the only ones facing us. Additional risks not presently known to us or which we consider immaterial also may adversely affect us.
Risks Related to Capital Markets and Competition
Our financial results largely depend on wealth management fees received by our partner firms, which are impacted by market fluctuations.
The substantial majority of our revenues are derived from the wealth management fees charged by our partner firms for providing clients with investment advice, financial and tax planning, consulting, tax return preparation, family office services and other services. A material portion of these wealth management fees are calculated based on a contractual percentage of the client’s assets. Wealth management fees may be adversely affected by prolonged declines in the capital markets because assets of clients may decline. Global economic conditions, exacerbated by changes in the equity or debt marketplaces, unanticipated changes in currency exchange rates, interest rates, inflation rates, the yield curve, financial crises, war, terrorism, natural disasters or other factors that are difficult to predict affect the capital markets. If unfavorable market conditions, actions taken by clients in response to market conditions (such as clients reducing or eliminating the amount of their assets with respect to which our partner firms provide advice) or volatility in the capital markets cause a decline in client assets overseen by our partner firms, such a decline could result in lower revenues from wealth management fees. If our partner firms’ revenues decline without a commensurate reduction in their expenses, their net income will be reduced and their business will be negatively affected, which may have an adverse effect on our results of operations and financial condition.
The historical returns of existing investment strategies of our partner firms may not be indicative of their future results or of the future results of investment strategies they may develop in the future.
The historical returns of our partner firms’ existing investment strategies should not be considered indicative of the future results of these strategies or of the results of any other strategies that our partner firms may develop in the future. The investment performance that our partner firms achieve for their clients varies over time, and the variance can be wide. The performance that our partner firms achieve as of a future date and for a future period may be higher or lower, and the difference may be material. During times of negative economic and market conditions, our partner firms may not be able to identify investment opportunities within their current or future strategies.
Our partner firms may not be able to maintain their current wealth management fee structure as a result of poor investment performance or competitive pressures or as a result of changes in their mix of wealth management services, which could have an adverse effect on our partner firms’ results of operations.
Our partner firms may not be able to maintain their current wealth management fee structure for any number of reasons, including as a result of poor investment performance, competitive pressures or changes in their mix of wealth management services. In order to maintain their fee structure in a competitive environment, our partner firms must be able to continue to provide clients with services that their clients believe justify their fees. Our partner firms may not succeed in providing the services that will allow them to maintain their current fee structure. If our partner firms’ investment strategies perform poorly, they may be forced to lower their fees in order to retain current, and attract additional, clients. Such decline in a partner firm’s revenue could have an adverse effect on our results of operations and financial condition.
18
The wealth management industry is very competitive.
We compete for acquisition opportunities and our partner firms compete for clients, advisers and other personnel with a broad range of wealth management firms, including public and privately held investment advisers, firms associated with securities broker‑dealers, financial institutions, private equity firms and insurance companies, many of whom have greater resources than we do. The wealth management industry is very competitive, with competition based on a variety of factors, including the ability to attract and retain key wealth management professionals, investment performance, wealth management fee rates, the quality of services provided to clients, the depth and continuity of client relationships and adherence to the fiduciary standard and reputation. A number of factors, including the following, serve to increase the competitive risks of our partner firms: (i) many competitors have greater financial, technical, marketing, name recognition and other resources and more personnel than our partner firms do, (ii) potential competitors have a relatively low cost of entering the wealth management industry, (iii) some competitors may invest according to different investment styles or in alternative asset classes that the markets may perceive as more attractive than the investment strategies our partner firms offer, (iv) some competitors charge lower fees for their wealth management services than our partner firms do and (v) some competitors may be able to engage in more widespread marketing activities or may have access to products and services to which our partner firms do not.
If we are unable to compete effectively, our results of operations and financial condition may be adversely affected.
Risks Related to Our Operations
Because clients can terminate their client service contracts at any time, poor wealth management service or performance of the investment strategies that our partner firms recommend may have an adverse effect on our results of operations and financial condition.
Our clients can generally terminate their client service contracts with us at any time. We cannot be certain that we will be able to retain our existing clients or attract new clients, and these client service contracts and client relationships may be terminated or not renewed for any number of reasons. In particular, poor wealth management service or performance of the investment strategies that our partner firms recommend relative to the performance of other wealth management firms could result in the loss of accounts. Moreover, certain clients specify guidelines regarding investment allocation and strategy that our partner firms are required to follow in managing their portfolios, and the failure to comply with any of these guidelines and other limitations could result in losses to clients, which could result in the obligation to make clients whole for such losses. If we believe that the circumstances do not justify a reimbursement, or our client believes that the reimbursement it was offered was insufficient, the client could seek to recover damages from us in addition to terminating its client service contract. Any of these events could adversely affect our results of operations and financial condition and harm our reputation.
Our results of operations could be adversely affected if we are unable to facilitate smooth succession planning.
We cannot predict with certainty how long the principals or employees of our partner firms will continue working, and upon the retirement or exit of a principal or employee, a partner firm’s business may be adversely affected. If we are not successful in facilitating succession planning of our partner firms, our results of operations and financial condition could be adversely affected.
If our reputation is harmed, we could suffer losses in our business and financial results.
Our business depends on earning and maintaining the trust and confidence of our partner firms and the clients of our partner firms. Our reputation is critical to our business and is vulnerable to threats that may be difficult or impossible to control and costly or impossible to remediate. For example, failure to comply with applicable laws, rules or regulations, errors in our public reports or litigation or the publicity surrounding these events, even if satisfactorily addressed, could adversely impact our reputation, our relationships with our partner firms and the clients of
19
our partner firms and our ability to negotiate acquisitions and partner firm‑level acquisitions with wealth management firms, as well as adversely affect our results of operations and financial condition.
Our reliance on our partner firms to report their results to us may make it difficult to respond quickly to negative business developments, which could adversely affect our results of operations and financial condition.
We rely on our partner firms to report their results to us on a monthly basis. We have implemented common general ledger, payroll and cash management systems that allow us to monitor the financial performance and overall operations of our partner firms. However, if our partner firms delay reporting results or informing us of negative business developments, we may not be able to address the situation on a timely basis, which could have an adverse effect on our results of operations and financial condition.
Our controls and procedures may fail or be circumvented, our risk management policies and procedures may be inadequate and operational risks could adversely affect our reputation and financial condition.
We and our partner firms have adopted various controls, procedures, policies and systems to monitor and manage risk in our business. Some of our risk evaluation methods depend upon information provided by our partner firms and others and public information regarding markets, clients or other matters. In some cases, however, that information may not be accurate, complete or up‑to‑date. While we currently believe that our operational controls are effective, we cannot provide assurance that those controls, procedures, policies and systems will always be adequate to identify and manage the internal and external risks in our business in a timely manner. Furthermore, we may have errors in our business processes or fail to implement proper procedures in operating our business, which may expose us to risk of financial loss. We are also subject to the risk that our employees or contractors, the employees or contractors of our partner firms or other third parties may deliberately seek to circumvent established controls to commit fraud or act in ways that are inconsistent with our and our partner firms’ controls, policies and procedures. The financial and reputational impact of control failures could be significant.
In addition, our businesses and the markets in which we operate are continuously evolving. If our risk framework is ineffective, either because it fails to keep pace with changes in the financial markets, regulatory requirements or our business, counterparties, clients or service providers or for other reasons, we could incur losses, suffer reputational damage or fall out of compliance with applicable regulatory or contractual mandates or expectations. Any of these events could adversely affect our reputation and financial condition.
The potential for human error in connection with the operational systems of Focus Inc. or its partner firms could disrupt operations, cause losses or lead to regulatory fines and may have an adverse effect on our results of operations, financial condition and reputation.
The operations of Focus Inc. and its partner firms are dependent on its employees and principals. From time‑to‑time, employees or principals may make mistakes that are not always immediately detected by systems and controls and policies and procedures intended to prevent and detect such errors. These can include calculation errors, errors in inputting orders, errors in software implementation, failure to ensure data security, follow processes, patch systems or report issues, follow regulations or internal compliance procedures or errors in judgment. Human errors, even if promptly discovered and remediated, may disrupt operations or result in regulatory fines or sanctions, breach of client contracts, reputational harm or legal liability, which, in turn, may adversely affect our results of operations and financial condition.
Failure to maintain and properly safeguard an adequate technology infrastructure and to protect against cyber‑attacks may limit our growth, result in losses or disrupt our business.
Our business is reliant upon financial, accounting and technology systems and networks to process, transmit and store information, including sensitive client and proprietary information, and to conduct many business activities and transactions with clients, advisers, vendors and other third parties. The failure to implement, maintain and safeguard an infrastructure commensurate with the size and scope of our business could impede our productivity and growth, which could adversely impact our results of operations and financial condition. Further, we rely heavily on third parties for
20
certain aspects of our business, including financial intermediaries and technology infrastructure and service providers, and these parties are also susceptible to similar risks.
Although we and our partner firms take protective measures and endeavor to modify them as circumstances warrant, our computer systems, software, networks and mobile devices, and those of third parties on whom we rely, have been subject to and may in the future be vulnerable to cyber‑attacks, breaches, unauthorized access, theft, including wire and check fraud, misuse, computer viruses or other malicious code and other events that could have a security impact. Further, our back‑up procedures, cyber defenses and capabilities in the event of a failure, interruption or breach of security may not be adequate. If any such events occur, it could jeopardize our, as well as our clients’, employees’ or counterparties’ confidential, proprietary and other sensitive information processed and stored in, and transmitted through, our or third‑party computer systems, networks and mobile devices or otherwise cause interruptions or malfunctions in our, as well as our clients’, employees’ or counterparties’ operations. Despite our efforts to ensure the integrity of our systems and networks, it is possible that we may not be able to anticipate or to implement effective preventive measures against all threats, especially because the techniques used change frequently and can originate from a wide variety of sources. As a result, we could experience business disruptions, significant losses, increased costs, reputational harm, regulatory actions or legal liability, any of which could have an adverse effect on our results of operations and financial condition. We may in the future be required to spend significant additional resources to modify existing protective measures or to investigate and remediate vulnerabilities or other exposures, including hiring third‑party technology service providers and additional information technology staff. Additionally, we may be subject to litigation and financial losses that are either not insured against fully or not fully covered through any insurance that we maintain.
Our inability to successfully recover from a disaster or other business continuity problem could cause material financial loss, regulatory actions, reputational harm or legal liability.
Should we experience a local or regional disaster or other business continuity problem, such as a terrorist attack, pandemic, security breach, power loss, telecommunications failure, earthquake, hurricane or other natural or man‑made disaster, our continued success will depend, in part, on the availability of personnel and office facilities, and the proper functioning of computer, telecommunication and other related systems and operations. Further, we could potentially lose client data or experience adverse interruptions to our operations or delivery of services to clients in a disaster recovery scenario, which could result in material financial loss, regulatory action, reputational harm or legal liability.
The failure of a key vendor to Focus or its partner firms to fulfill its obligations or a failure by Focus or its partner firms to maintain its relationships with key vendors could have a material adverse effect on our results of operations or financial condition.
Focus and its partner firms depend on a number of key vendors for various accounting, custody, brokerage and trading, software and technology systems and other operational needs. Moreover, while Focus and its partner firms perform diligence on its vendors in an effort to ensure they operate in accordance with expectations, to the extent any significant deficiencies are uncovered, there may be few, or no, alternative vendors available. In addition, Focus or its partner firms may from time to time transfer key contracts from one vendor to another. Key contract transfers may be costly and complex, and expose Focus or its partner firms to heightened operational risks. Any failure to mitigate such risks could result in reputational harm, as well as financial losses to Focus or its partner firms. The failure or inability of Focus or its partner firms to diversify its sources for key services or the failure of any key vendor to fulfill its obligations could have an adverse financial impact on Focus or its partner firms or lead to operational and regulatory issues for partner firms, which could result in reputational harm or legal liability, fines and/or sanctions and may have a material adverse effect on our results of operations or financial condition.
Our insurance coverage may be inadequate or expensive.
We maintain voluntary and required insurance coverage, including, among others, general liability, property, director and officer, errors and omissions, network security and privacy, fidelity bond and fiduciary liability insurance, and insurance required under ERISA. While we endeavor to purchase coverage that is appropriate to our assessment of
21
our risk, we are unable to predict with certainty the frequency, nature or magnitude of claims for direct or consequential damages. Our business may be negatively affected if in the future our insurance proves to be inadequate or unavailable. In addition, insurance claims may harm our reputation or divert management resources away from operating our business.
If our system of internal controls has flaws, weaknesses or otherwise is not effective, we may not be able to accurately report our financial results or prevent fraud. As a result, current and potential shareholders could lose confidence in our financial reporting, which would harm our business and the trading price of our Class A common stock.
Effective internal controls are necessary for us to provide reliable financial reports, prevent fraud and operate successfully as a public company. If we cannot provide reliable financial reports or prevent fraud, our reputation and operating results would be harmed. We cannot be certain that our efforts to develop and maintain our internal controls will be successful, that we will be able to maintain adequate controls over our financial processes and reporting in the future or that we will be able to comply with our obligations under Section 404 of the Sarbanes‑Oxley Act of 2002 (the “Sarbanes‑Oxley Act”). For example, Section 404 requires us, among other things, to annually review and report on, and our independent registered public accounting firm to attest to, the effectiveness of our internal controls over financial reporting. Any failure to develop or maintain effective internal controls, or difficulties encountered in implementing or improving our internal controls, could adversely affect our results of operations and financial condition or cause us to fail to meet our reporting obligations. Ineffective internal controls could also cause investors to lose confidence in our reported financial information, which would likely have a negative effect on the trading price of our Class A common stock.
Risks Related to Our Partnership Model and Growth Strategy
Our success depends, in part, on our ability to make successful acquisitions.
Our continued success will depend, in part, upon our ability to find suitable firms to acquire, either directly or on behalf of our existing partner firms, our ability to acquire such firms on acceptable terms and our ability to raise the capital necessary to finance such transactions. We compete with banks, outsourced service providers, private equity firms and other wealth management and advisory firms to acquire high‑quality wealth management firms. Some of our competitors may be able to outbid us for these acquisition targets. If we identify suitable acquisition targets, we may not be able to complete any such acquisition on terms that are commercially acceptable to us. If we are not successful in acquiring suitable acquisition candidates, it may have an adverse effect on our business and on our earnings and revenue growth.
Acquired businesses may not perform as expected, leading to an adverse effect on our earnings and revenue growth.
Acquisitions involve a number of risks, including the following, any of which could have an adverse effect on our partner firms’ and our earnings and revenue growth: (i) incurring costs in excess of, or achieving synergies less than, what we anticipated; (ii) potential loss of key wealth management professionals or other team members of the predecessor firm; (iii) inability to generate sufficient revenue to offset transaction costs; (iv) inability to retain clients following an acquisition; (v) incurring expenses associated with the amortization or impairment of intangible assets, particularly for goodwill and other intangible assets; and (vi) payment of more than fair market value for the assets of the partner firm.
While we intend that our completed acquisitions will improve profitability, past or future acquisitions may not be accretive to earnings or otherwise meet operational or strategic expectations. The failure of any partner firm to perform as expected after acquisition may have an adverse effect on our earnings and revenue growth.
22
Contingent consideration payments could result in a higher than expected impact on our future earnings.
We have typically incorporated into our acquisition structure contingent consideration paid to the sellers upon the achievement of specified financial thresholds. The contingent consideration for acquisitions of new partner firms is paid upon the satisfaction of specified growth thresholds typically over a six‑year period. The contingent consideration for acquisitions made by our partner firms is paid upon the satisfaction of specified financial thresholds, typically annual thresholds, tied to revenue as adjusted for certain criteria or other operating metrics based on the retention or growth of the business acquired. These arrangements may result in the payment of additional purchase price consideration to the sellers for periods following the closing of an acquisition. We anticipate that future acquisitions will continue to include contingent consideration. For business acquisitions, we recognize the fair value of estimated contingent consideration at the acquisition date and contingent consideration is remeasured to fair value at each reporting period until the contingency is resolved. Since the contingent consideration to be paid is based on the growth of forecasted financial performance levels over a number of years, we cannot calculate the maximum contingent consideration that may be payable under these arrangements. Contingent consideration could result in a higher than expected impact on our future earnings and payments may occur in periods subsequent to the periods in which the additional earnings or other specified financial thresholds are achieved.
We may incur debt, issue additional equity or use cash on hand to pay for future acquisitions, each of which could adversely affect our financial condition or the market price of our Class A common stock. Additionally, difficulty in obtaining debt, issuing equity or generating cash flow could affect our growth and financial condition and the market price of our Class A common stock.
We will finance future acquisitions through debt financing, including significant draws on our first lien revolving credit facility (the “First Lien Revolver”), issuance of additional term debt, the issuance of equity securities, the use of existing cash or cash equivalents or any combination of the foregoing. Acquisitions financed with debt could require us to dedicate a substantial portion of our cash flow to principal and interest payments. Acquisitions financed with the issuance of our equity securities would be dilutive to the share value and voting power of our existing Class A common stock, which could affect the market price of our Class A common stock. Future acquisitions financed with our own cash could deplete the cash and working capital available to fund our operations adequately. Difficulty borrowing funds, selling securities or generating sufficient cash from operations to finance our activities may have a material adverse effect on our results of operations and financial condition.
Our growth strategy depends, in part, upon continued growth from our existing partner firms. However, the significant growth we have experienced may be difficult to sustain in the future.
The continued growth of our business will depend on, among other things, the ability of our partner firms to grow through acquisitions, to retain key wealth management professionals and to devote sufficient resources to maintaining existing client relationships and developing new client relationships. Our business growth will also depend on their success in providing high‑quality wealth management services, as well as their ability to deal with changing market conditions, to maintain adequate financial and business controls and to comply with new regulatory requirements arising in response to both the increased sophistication of the wealth management industry and the significant market and economic events of the last few years. In the future, our partner firms may not contribute to our growth at their historical or currently anticipated levels.
Our acquisition due diligence process may not reveal all facts that are relevant in connection with an acquisition, which could subject us to unknown liabilities.
In connection with our acquisitions of new partner firms and acquisitions by existing partner firms, we conduct due diligence that we deem reasonable and appropriate based on the facts and circumstances applicable to such transactions and expect to use our resources to enhance the risk management functions and diligence of our business and our partner firms’ businesses going forward. When conducting due diligence, we evaluate important and complex business, financial, tax, accounting, legal and compliance issues. Outside consultants, legal advisers, accountants, regulatory experts and other third parties may be involved in the due diligence process in varying degrees depending on the type, size and complexity of the acquisition. When conducting due diligence and making an assessment regarding a
23
transaction, we have and will continue to rely on the resources available to us, including information provided by third parties. Our diligence efforts with respect to RIAs that were newly formed in connection with our Focus Independence program may be limited due to the short operating history of such firms.
Since commencing acquisition activities in 2006, there were certain instances where we discovered matters about acquired partner firms that were not uncovered during the due diligence process. These instances did not have a material impact on our financial position, results of operations or cash flows. Our acquisition agreements include standard sellers’ representations and warranties and indemnification provisions that provide us with some financial protection in the event of an undiscovered or undisclosed matter. However, the due diligence investigations that we have carried out or will carry out with respect to any transaction may not reveal or highlight all relevant facts that may be necessary or helpful in evaluating the transaction, which could subject us or our partner firms to unknown liabilities or reputational harm that could adversely affect our or our partner firms’ results of operations and financial condition.
The success of Focus Independence depends upon our ability to lift out teams of wealth management professionals from traditional brokerages and wirehouses.
Our ability to lift out teams of wealth management professionals from traditional brokerages and wirehouses depends on our ability to offer more favorable opportunities than those provided by their current employers, many of which have substantially greater financial resources and may be able to entice their employees to stay. If we are not successful in attracting and lifting out suitable wealth management professionals for our Focus Independence program, it may have an adverse effect on the growth of our revenues and earnings.
We may face operational risks associated with expanding internationally.
Our business strategy includes expanding our presence in non‑U.S. markets through acquisitions. This strategy presents a number of risks, including: (i) greater difficulties in supporting, or the need to hire additional personnel to support, the operations of foreign partner firms, (ii) language and cultural differences, (iii) unfavorable fluctuations in foreign currency exchange rates, (iv) higher operating costs, (v) unexpected changes in wealth management policies and other regulatory requirements, (vi) adverse tax consequences and (vii) more complex acquisition structures. If our international business increases relative to our total business, these factors could have a more pronounced effect on our results of operations and financial condition.
Risks Related to Our Business Model and Key Professionals
Our partner firms’ autonomy limits our ability to alter their management practices and policies, and our dependence on the principals who manage the businesses of our partner firms may have an adverse effect on our business.
Under the management agreements between our partner firms and the new management companies formed by the principals, the management companies provide the personnel who manage the partner firm’s day‑to‑day operations and oversee the provision of wealth management services, the implementation of employment policies, the negotiation, execution and delivery of contracts in connection with the management and operation of the partner firm’s business in the ordinary course and the implementation of policies and procedures to ensure compliance with all applicable laws, rules and regulations. Such individuals also maintain the primary relationships with clients and vendors. As a consequence, we are exposed to losses resulting from day‑to‑day decisions of the principals who manage our partner firm, and our financial condition and results of operations may be adversely affected by problems stemming from the day‑to‑day operations of a partner firm, where weaknesses or failures in internal processes or systems could lead to a disruption of the partner firm’s operations, liability to its clients or exposure to disciplinary action. Unsatisfactory performance by the principals could also hinder the partner firms’ ability to grow and could have an adverse effect on our business. Further, there is a risk of reputational harm to us if any of our partner firms, among other things, have engaged in, or in the future were to engage in, poor or non‑compliant business practices or were to experience adverse results.
24
We rely on our key personnel and principals.
We depend on the efforts of our executive officers, other management team members, employees and principals. Our executive officers, in particular, play an important role in the stability and growth of our business, including the growth and stability of existing partner firms and in identifying potential acquisition opportunities for us. However, there is no guarantee that these officers will remain with us. In addition, our partner firms depend heavily on the services of key principals, who in many cases have managed their predecessor firms for many years. Although we use a combination of economic incentives, transfer restrictions and non‑solicitation and non‑competition agreements in an effort to retain key management personnel, there is no guarantee that these principals will remain with the respective partner firms. The loss of key management personnel at our partner firms could have an adverse impact on our business.
In addition, compliance with public company requirements places significant additional demands on our senior management and has required us, and will continue to require us, to enhance our investor relations, legal, financial reporting, corporate communications and certain other functions. These additional efforts may strain our resources and divert management’s attention from other business concerns, which could adversely affect our business.
If a management company terminates its management agreement with us, our financial condition and results could be negatively affected.
At the time of the acquisition of a partner firm, we enter into a management agreement with the management company that is substantially owned by the selling principals. Pursuant to the management agreement, the management company provides the personnel who conduct the day‑to‑day management and operation of the partner firm. These management agreements can be terminated by the management company at the end of the initial term, which is typically six years. Termination of a management agreement could lead to a disruption of the partner firm’s operations, which could negatively affect our financial condition and results of operations.
If our partner firms are unable to maintain their client‑oriented, fiduciary‑minded culture or compensation levels for wealth management professionals, they may be unable to attract, develop and retain talented wealth management professionals, which could negatively impact our financial results and our ability to grow.
Attracting, developing and retaining talented wealth management professionals are essential components of the business strategy of our partner firms. To do so, it is critical that they continue to foster an environment and provide compensation that is attractive for their existing and prospective wealth management professionals. If they are unsuccessful in maintaining such an environment (for instance, because of changes in management structure, corporate culture or corporate governance arrangements) or compensation levels for any reason, their existing wealth management professionals may leave the firm or fail to produce their best work on a consistent, long‑term basis and/or our partner firms may be unsuccessful in attracting talented new wealth management professionals, any of which could negatively impact their financial results and our ability to grow and may have an adverse effect on our results of operations and financial condition.
Risks Related to Our Structure
Focus Inc. is a holding company. Focus Inc.’s most significant asset is its equity interest in Focus LLC, and Focus Inc. is accordingly dependent upon distributions from Focus LLC to pay taxes, make payments under the Tax Receivable Agreements and cover its corporate and other overhead expenses.
Focus Inc. is a holding company and its most significant asset is its equity interest in Focus LLC. Focus Inc. has no independent means of generating revenue. To the extent Focus LLC has available cash and subject to the terms of Focus LLC’s credit agreements and any other debt instruments, we have caused and intend to continue to cause Focus LLC to make (i) generally pro rata distributions to its unitholders, including Focus Inc., in an amount generally intended to allow the Focus LLC unitholders to satisfy their respective income tax liabilities with respect to their allocable share of the income of Focus LLC, based on certain assumptions and conventions, provided that the distribution will be sufficient to allow Focus Inc. to satisfy its actual tax liabilities and to make payments under its two Tax Receivable Agreements, entered into on July 30, 2018 in connection with the closing of the IPO (the “Tax
25
Receivable Agreements”), one with certain entities affiliated with our private equity investors and the other with certain other continuing and former owners of Focus LLC (the parties to the two agreements collectively, the “TRA holders”), and any subsequent tax receivable agreements that it may enter into in connection with future acquisitions by Focus LLC or issuances of units of Focus LLC to employees, principals and directors and (ii) non pro rata distributions to Focus Inc. in an amount at least sufficient to reimburse Focus Inc. for its corporate and other overhead expenses. We are limited, however, in our ability to cause Focus LLC and its subsidiaries to make these and other distributions to Focus Inc. due to the restrictions under our credit facilities entered into in July 2017, as amended (collectively, the “Credit Facility”). To the extent that Focus Inc. needs funds and Focus LLC or its subsidiaries are restricted from making such distributions under applicable law or regulation or under the terms of their financing arrangements or are otherwise unable to provide such funds, Focus Inc.’s liquidity and financial condition could be adversely affected.
Focus Inc. is required to make payments under the Tax Receivable Agreements for certain tax benefits it may claim, and the amounts of such payments could be significant.
The Tax Receivable Agreements generally provide for the payment by Focus Inc. to each TRA holder of 85% of the net cash savings, if any, in U.S. federal, state and local income and franchise tax that Focus Inc. actually realizes (computed using simplifying assumptions to address the impact of state and local taxes) or is deemed to realize in certain circumstances in periods after the IPO as a result of certain increases in tax basis and certain tax benefits attributable to imputed interest. We will retain the benefit of the remaining 15% of these cash savings.
The term of each Tax Receivable Agreement commenced upon the completion of the IPO will continue until all tax benefits that are subject to such Tax Receivable Agreement have been utilized or expired, unless we experience a change of control (as defined under the Tax Receivable Agreements, which includes certain mergers, asset sales and other forms of business combinations) or the Tax Receivable Agreements terminate early (at our election or as a result of our breach), and Focus Inc. makes the termination payments specified in the Tax Receivable Agreements. In addition, payments made under the Tax Receivable Agreements will be increased by any interest accrued from the due date (without extensions) of the corresponding tax return.
The payment obligations under the Tax Receivable Agreements are Focus Inc.’s obligations and not obligations of Focus LLC, and we expect that such payments required to be made under the Tax Receivable Agreements will be substantial. Estimating the amount and timing of payments that may become due under the Tax Receivable Agreements is by its nature imprecise. For purposes of the Tax Receivable Agreements, cash savings in tax generally are calculated by comparing Focus Inc.’s actual tax liability (determined by using the actual applicable U.S. federal income tax rate and an assumed combined state and local income and franchise tax rate) to the amount Focus Inc. would have been required to pay had it not been able to utilize any of the tax benefits subject to the Tax Receivable Agreements. The actual increases in tax basis, as well as the amount and timing of any payments under the Tax Receivable Agreements, will vary depending upon a number of factors, including the timing of any redemption of Focus LLC units, the price of our Class A common stock at the time of each redemption, the extent to which such redemptions are taxable transactions, the amount of Focus LLC’s assets that consist of equity in entities taxed as corporations at the time of each redemption, the amount and timing of the taxable income we generate in the future, the U.S. federal income tax rates then applicable, and the portion of the payments under the Tax Receivable Agreements that constitute imputed interest or give rise to depreciable or amortizable tax basis.
The payments under the Tax Receivable Agreements will not be conditioned upon a TRA holder having a continued ownership interest in Focus Inc. or Focus LLC. Please read “Part II, Item 7, Management’s Discussion and Analysis of Financial Condition and Results of Operations—Liquidity and Capital Resources—Tax Receivable Agreements.”
In certain cases, payments under the Tax Receivable Agreements may be accelerated and/or significantly exceed the actual benefits, if any, realized in respect of the tax attributes subject to the Tax Receivable Agreements.
If we experience a change of control (as defined under the Tax Receivable Agreements, which includes certain mergers, asset sales and other forms of business combinations) or the Tax Receivable Agreements terminate early (at our election or as a result of our breach), Focus Inc. could be required to make a substantial, immediate lump‑sum payment.
26
This payment would equal the present value of hypothetical future payments that could be required to be paid under the Tax Receivable Agreements (determined by applying a discount rate of one‑year London Interbank Offered Rate (“LIBOR”) plus 1.5%). The calculation of hypothetical future payments will be based upon certain assumptions and deemed events set forth in the Tax Receivable Agreements, including (i) that Focus Inc. has sufficient taxable income to fully utilize the tax benefits covered by the Tax Receivable Agreements and (ii) any Focus LLC units (other than those held by Focus Inc.) outstanding on the termination date are deemed to be redeemed on the termination date. Any early termination payments may be made significantly in advance of, and may materially exceed, the actual realization, if any, of the future tax benefits to which the termination payments relate.
If we experience a change of control (as defined under the Tax Receivable Agreements) or the Tax Receivable Agreements otherwise terminate early, Focus Inc.’s obligations under the Tax Receivable Agreements could have a substantial negative impact on our liquidity and could have the effect of delaying, deferring or preventing certain mergers, asset sales or other forms of business combinations or changes of control. For example, if the Tax Receivable Agreements were terminated immediately at December 31, 2019, the estimated termination payments would, in the aggregate, be approximately $198.7 million (calculated using a discount rate equal to one‑year LIBOR plus 1.5%, applied against an undiscounted liability of $277.1 million); this amount could be substantially larger if Focus Inc. enters into additional tax receivable agreements in connection with future acquisitions by Focus LLC or issuances of units of Focus LLC to employees, principals and directors . The foregoing amounts are merely estimates and the actual payments could differ materially. There can be no assurance that we will be able to finance any payments required to be made under the Tax Receivable Agreements.
Please read “Part II, Item 7, Management’s Discussion and Analysis of Financial Condition and Results of Operations—Liquidity and Capital Resources—Tax Receivable Agreements.”
In the event that payment obligations under the Tax Receivable Agreements are accelerated upon certain mergers, other forms of business combinations or other changes of control, the consideration payable to holders of our Class A common stock could be substantially reduced.
If we experience a change of control (as defined under the Tax Receivable Agreements, which includes certain mergers, asset sales and other forms of business combinations), Focus Inc. would be obligated to make a substantial, immediate lump‑sum payment, and such payment may be significantly in advance of, and may materially exceed, the actual realization, if any, of the future tax benefits to which the payment relates. As a result of this payment obligation, holders of our Class A common stock could receive substantially less consideration in connection with a change of control transaction than they would receive in the absence of such obligation. Further, any payment obligations under the Tax Receivable Agreements will not be conditioned upon the TRA holders’ having a continued interest in Focus Inc. or Focus LLC. Accordingly, the TRA holders’ interests may conflict with those of the holders of our Class A common stock. Please read “—In certain cases, payments under the Tax Receivable Agreements may be accelerated and/or significantly exceed the actual benefits, if any, realized in respect of the tax attributes subject to the Tax Receivable Agreements.” and “Part II, Item 7, Management’s Discussion and Analysis of Financial Condition and Results of Operations—Liquidity and Capital Resources—Tax Receivable Agreements.”
We will not be reimbursed for any payments made under the Tax Receivable Agreements in the event that any tax benefits are subsequently disallowed.
Payments under the Tax Receivable Agreements will be based on the tax reporting positions that we will determine. The TRA holders will not reimburse us for any payments previously made under the Tax Receivable Agreements if any tax benefits that have given rise to payments under the Tax Receivable Agreements are subsequently disallowed, except that excess payments made to any TRA holder will be netted against payments that would otherwise be made to such TRA holder, if any, after our determination of such excess. As a result, in such circumstances, we could make payments that are greater than our actual cash tax savings, if any, and may not be able to recoup those payments, which could adversely affect our liquidity.
27
If Focus LLC were to become a publicly traded partnership taxable as a corporation for U.S. federal income tax purposes, significant tax inefficiencies might result, and Focus Inc. would not be able to recover payments previously made by it under the Tax Receivable Agreements even if the corresponding tax benefits were subsequently determined to have been unavailable due to such status.
A number of aspects of our structure depend on the classification of Focus LLC as a partnership for U.S. federal income tax purposes. Subject to certain exceptions relating to the receipt of predominantly qualifying income for which we do not expect to qualify, a “publicly traded partnership” is taxable as a corporation for U.S. federal income tax purposes. The U.S. Treasury regulations provide that a “publicly traded partnership” is a partnership the interests of which are traded on an established securities market or are readily tradable on a secondary market or the substantial equivalent thereof. Under certain circumstances, exchanges of Focus LLC units pursuant to an exchange right (or the call right) or other transfers of Focus LLC units could cause Focus LLC to be treated as a publicly traded partnership. The U.S. Treasury regulations provide for certain safe harbors from treatment as a publicly traded partnership, and we intend to operate such that exchanges or other transfers of Focus LLC units qualify for one or more such safe harbors. For example, we intend to limit the number of unitholders of Focus LLC, and the Fourth Amended and Restated Operating Agreement of Focus LLC, as amended, (the “Fourth Amended and Restated Focus LLC Agreement”) provides for limitations on the ability of unitholders of Focus LLC to transfer their Focus LLC units and provides us, as managing member of Focus LLC, with the right to impose limitations and restrictions (in addition to those already in place), subject to certain consent rights, on the ability of unitholders of Focus LLC to exchange their Focus LLC units pursuant to an exchange right to the extent we believe it is necessary to ensure that Focus LLC will continue to be treated as a partnership for U.S. federal income tax purposes.
If Focus LLC were to become a publicly traded partnership, significant tax inefficiencies might result, including as a result of Focus Inc.’s inability to file a consolidated U.S. federal income tax return with Focus LLC. In addition, Focus Inc. would no longer have the benefit of the increases in tax basis covered under the Tax Receivable Agreements, and Focus Inc. would not be able to recover any payments previously made under the Tax Receivable Agreements, even if the corresponding tax benefits (including any claimed increase in the tax basis of Focus LLC’s assets) were subsequently determined to have been unavailable.
In certain circumstances, Focus LLC will be required to make tax distributions to the Focus LLC unitholders, including Focus Inc., and the tax distributions that Focus LLC will be required to make may be substantial. To the extent Focus Inc. receives tax distributions in excess of its tax liabilities and obligations to make payments under the Tax Receivable Agreements and retains such excess cash, the unitholders of Focus LLC would benefit from such accumulated cash balances if they exercise their exchange right.
Pursuant to the Fourth Amended and Restated Focus LLC Agreement, Focus LLC will make generally pro rata cash distributions, or tax distributions, to the Focus LLC unitholders, including Focus Inc., in an amount generally intended to allow the Focus LLC unitholders to satisfy their respective income tax liabilities with respect to their allocable share of the income of Focus LLC, based on certain assumptions and conventions, provided that the distribution will be sufficient to allow Focus Inc. to satisfy its actual tax liabilities and to make payments under the Tax Receivable Agreements and any subsequent tax receivable agreements that it may enter into in connection with future acquisitions by Focus LLC or issuances of units of Focus LLC to employees, principals and directors. Under applicable tax rules, Focus LLC is required to allocate net taxable income disproportionately to its members in certain circumstances. Because tax distributions will be made pro rata based on ownership and based on an assumed tax rate, Focus LLC will be required to make tax distributions that, in the aggregate, will likely exceed the amount of taxes that Focus LLC would have paid if it were taxed on its net income at the assumed rate. The pro rata distribution amounts will also be increased to the extent necessary, if any, to ensure that the amount distributed to Focus Inc. is sufficient to enable Focus Inc. to pay its actual tax liabilities and any amounts payable under the Tax Receivable Agreements.
Funds used by Focus LLC to satisfy its tax distribution obligations will not be available for reinvestment in our business. Moreover, the tax distributions Focus LLC will be required to make may be substantial, and may exceed (as a percentage of Focus LLC’s income) the overall effective tax rate applicable to a similarly situated corporate taxpayer. In addition, because these payments will be calculated with reference to an assumed tax rate, and because of the
28
disproportionate allocation of net taxable income, these payments may significantly exceed the actual tax liability for many of the Focus LLC unitholders.
As a result of potential differences in the amount of net taxable income allocable to Focus Inc. and to the other Focus LLC unitholders, as well as the use of an assumed tax rate in calculating Focus LLC’s tax distribution obligations, Focus Inc. may receive distributions significantly in excess of its tax liabilities and obligations to make payments under the Tax Receivable Agreements. If Focus Inc. retains such cash balances, the unitholders of Focus LLC would benefit from any value attributable to such accumulated cash balances as a result of their exercise of an exchange right. Focus Inc. intends to take steps to eliminate any material cash balances. Such steps could include distributing such cash balances as dividends on our Class A common stock, reinvesting such cash balances in Focus LLC for additional Focus LLC units (with an accompanying stock dividend with respect to our Class A common stock), and using such cash balances to effect buybacks of shares of our Class A common stock (with an accompanying conversion rate adjustment with respect to the exchange right).
Risks Related to Financing and Liquidity
We may not be able to generate sufficient cash to service all of our indebtedness and may be forced to take other actions to satisfy our obligations under applicable debt instruments, which may not be successful.
At December 31, 2019, we had outstanding borrowings under the Credit Facility of approximately $1.3 billion at stated value. Our ability to make scheduled payments on or to refinance our indebtedness, including the Credit Facility, depends on our financial condition and operating performance, which are subject to prevailing economic and competitive conditions and certain financial, business and other factors beyond our control. We may not be able to maintain a level of cash flow from operating activities sufficient to permit us to pay the principal and interest on our indebtedness.
If our cash flows and capital resources are insufficient to fund debt service obligations, we may be forced to reduce or delay acquisitions or partner firm‑level acquisitions and capital expenditures, sell assets, seek additional capital or restructure or refinance indebtedness. Our ability to restructure or refinance indebtedness will depend on the condition of the capital markets and our financial condition at such time. Any refinancing of indebtedness could be at higher interest rates and may require us to comply with more onerous covenants, which could further restrict business operations. The terms of existing or future debt instruments may restrict us from adopting some of these alternatives. In addition, any failure to make payments of interest and principal on outstanding indebtedness on a timely basis could harm our ability to incur additional indebtedness. In the absence of sufficient cash flows and capital resources, we could face substantial liquidity problems and might be required to dispose of material assets or operations to meet debt service and other obligations. The Credit Facility currently restricts our ability to dispose of assets and our use of the proceeds from such disposition. We may not be able to consummate those dispositions, and the proceeds of any such disposition may not be adequate to meet any debt service obligations then due. These alternative measures may not be successful and may not permit us to meet scheduled debt service obligations.
Our outstanding variable rate indebtedness uses LIBOR as a benchmark for establishing the interest rate. LIBOR is expected to be replaced by an alternative in 2021. While we expect any such alternative to be a reasonable replacement for LIBOR, at this time we cannot predict the implications of the use of such a new benchmark on the interest rates we pay.
Restrictions in our existing and future debt agreements could limit our growth and our ability to engage in certain activities.
The Credit Facility contains a number of customary covenants, including (i) incurring additional indebtedness or guarantees, (ii) creating liens or other encumbrances on property or granting negative pledges, (iii) entering into a merger or similar transaction, (iv) selling or transferring certain property and (v) declaring dividends or making other restricted payments.
29
In addition, the Credit Facility requires us to maintain certain financial ratios. These restrictions may also limit our ability to obtain future financings, to withstand a future downturn in our business or the economy in general, or to otherwise conduct necessary corporate activities. We may also be prevented from taking advantage of acquisitions or other business opportunities that arise because of the limitations that the restrictive covenants under the Credit Facility impose on us.
A breach of any covenant in the Credit Facility would result in a default under the applicable agreement after any applicable grace periods. A default, if not waived, could result in acceleration of the indebtedness outstanding under the Credit Facility. The accelerated indebtedness would become immediately due and payable. If that occurs, we may not be able to make all of the required payments or borrow on short notice sufficient funds to refinance such indebtedness. Even if new financing were available at that time, it may not be on terms that are acceptable to us.
Lack of liquidity or access to capital could impair our business and financial condition.
Liquidity, or ready access to funds, is essential to our business. We expend significant resources investing in our business, particularly with respect to acquisition activity. As a result, reduced levels of liquidity could have a significant negative effect on us and our partner firms. Some potential conditions that could negatively affect our liquidity or that of our partner firms include: (i) illiquid or volatile markets, (ii) diminished access to debt or capital markets, (iii) unforeseen cash or capital requirements or (iv) regulatory penalties or fines or adverse legal settlements or judgments.
The capital and credit markets continue to experience varying degrees of volatility and disruption. In some cases, the markets have exerted downward pressure on availability of liquidity and credit capacity. Without sufficient liquidity, we could be required to curtail our operations.
In the event current resources are insufficient to satisfy our needs or the needs of our partner firms, we may need to rely on financing sources such as bank debt. The availability of additional financing will depend on a variety of factors such as: (i) market conditions, (ii) the general availability of credit, including the availability of credit to the financial services industry, (iii) our credit ratings and credit capacity and (iv) the possibility that lenders could develop a negative perception of our or their long‑ or short‑term financial prospects if the level of business activity decreases due to a market downturn. Similarly, our access to funds may be impaired if regulatory authorities or rating organizations take negative actions against us or our partner firms.
Disruptions, uncertainty or volatility in the capital and credit markets may also limit our access to capital required to operate our businesses. Such market conditions may limit our ability to generate revenue to meet liquidity needs and access the capital necessary to grow our business. As such, we may be forced to delay raising capital, issue different types of capital than we would otherwise, less effectively deploy such capital or bear an unattractive cost of capital, which could decrease our profitability and significantly reduce our financial flexibility.
Risks Related to Regulation and Litigation
Our business is highly regulated.
Our partner firms are subject to extensive regulation by various regulatory and self‑regulatory authorities in the United States, the United Kingdom, Canada and Australia. In the United States, our partner firms are subject to regulation primarily at the federal level, including regulation by the SEC under the Advisers Act, by the DOL under ERISA, regulation of broker‑dealers by the SEC and FINRA, state insurance regulations and state securities regulation. As a publicly traded company with listed equity securities, we are subject to the rules and regulations of the SEC and The NASDAQ Stock Market LLC (“NASDAQ”).
Providing investment advice to clients is regulated on both the federal and state level in the United States. Our partner firms are predominantly investment advisers registered with the SEC under the Advisers Act. Each firm that is a federally registered investment adviser is regulated and subject to examination by the SEC. The Advisers Act imposes numerous obligations on RIAs, including fiduciary duties, disclosure obligations, recordkeeping and reporting
30
requirements, marketing restrictions and general anti‑fraud prohibitions. The failure to comply with the Advisers Act could cause the SEC to institute proceedings and impose sanctions for violations, including censure or terminating their SEC registrations and could also result in litigation or reputational harm. In addition, our partner firms who are investment advisers are subject to notice filings and the anti‑fraud rules of state securities regulators and individual advisers are subject to state registration in many instances under applicable state securities laws.
Our partner firms are also subject to regulation by the DOL under ERISA and related regulations with respect to investment advisory and management services provided to retirement plans and plan participants covered by ERISA and by the IRS with respect to IRAs pursuant to comparable provisions within the IRC. Among other requirements, ERISA and the IRC impose duties on persons who are fiduciaries under ERISA and the IRC, respectively, and prohibits certain transactions involving related parties.
The U.S. Office of Foreign Assets Control (“OFAC”) has also issued regulations requiring that we and our partner firms refrain from doing business in certain countries or with certain organizations or individuals on a list maintained by the U.S. government. Our partner firms rely on custodians to ensure compliance with OFAC regulation. A partner firm’s failure to comply with applicable laws or regulations could result in fines, censure, suspension of personnel or other sanctions, including revocation of the registration of the partner firm as an RIA.
Many of our partner firms also rely on exemptions from various requirements of the Securities Act of 1933, as amended (the “Securities Act”), the Exchange Act and ERISA (and parallel provisions of the IRC for IRAs). If for any reason these exemptions were to be revoked or challenged or otherwise become unavailable to us, our partner firms could be subject to regulatory action or third‑party claims, and our business could be materially and adversely affected. To the extent any of our partner firms manage investment vehicles, those partner firms could also be subject to additional disclosure and compliance requirements, or in the case of some compliance violations, be prevented from managing such investment vehicles. These laws and regulations impose requirements, restrictions and limitations on our business, and compliance with these laws and regulations results in significant cost and expense. If our partner firms were to fail to comply with applicable laws, rules or regulations or be named as a subject of an investigation or other regulatory action, the public announcement and potential publicity surrounding any such investigation or action could have an adverse effect on our stock price and result in increased costs even if our partner firms were found not to have violated such laws, rules or regulations. The failure of our partner firms to satisfy regulatory requirements could also result in the partner firms or us being subjected to civil liability, criminal liability or other sanctions that might materially impact our business.
Certain of our partner firms have affiliated SEC‑registered broker‑dealers. Broker‑dealers and their personnel are regulated, to a large extent, by the SEC and self‑regulatory organizations, principally FINRA. Broker‑dealers are subject to regulations which cover all aspects of the securities business, including sales practices, trading practices among broker‑dealers, use and safekeeping of clients’ funds and securities, capital structure, recordkeeping and the conduct of directors, officers, employees and representatives. Continued efforts by market regulators to increase transparency by requiring the disclosure of conflicts of interest have affected, and could continue to impact, our partner firms’ disclosures and our business.
Certain of our partner firms have licensed insurance affiliates. State insurance laws grant supervisory agencies, including state insurance departments, broad administrative authority. State insurance regulators and the National Association of Insurance Commissioners continually review existing laws and regulations, some of which affect certain partner firms who engage in the sale of insurance products through affiliated or unaffiliated entities. These supervisory agencies regulate many aspects of the insurance business, including the licensing of insurance brokers and agents and other insurance intermediaries, and trade practices, such as marketing, advertising and compensation arrangements entered into by insurance brokers and agents.
Additionally, we and our partner firms are subject to various data privacy and cybersecurity laws designed to protect client and employee personally identifiable information. These laws and regulations are increasing in complexity and number which has resulted in greater compliance risk and cost for us. The unauthorized access, use, theft or destruction of client or employee personal, financial or other data could expose us to potential financial penalties and legal liability.
31
Our international operations are subject to additional non‑U.S. regulatory requirements.
We have partner firms located in the United Kingdom, Canada and Australia. We may have partner firms located in other non‑U.S. jurisdictions in the future. Failure to comply with the applicable laws, rules, regulations, codes, directives, notices or guidelines in any jurisdiction outside of the United States could result in a wide range of penalties and disciplinary actions, including fines, censures and the suspension or expulsion from a particular jurisdiction or market or the revocation of licenses, any of which could adversely affect our reputation and operations and our partner firms in those jurisdictions. Regulators in jurisdictions outside of the United States could also change their policies or laws in a manner that might restrict or otherwise impede the ability of such partner firms to offer wealth management services in their respective markets, or they may be unable to keep up with, or adapt to, changing, complex regulatory requirements in such jurisdictions or markets, which could further negatively impact our business.
In the future, we may further expand our business outside of the markets in which we currently operate in such a way or to such an extent that we may be required to register with additional foreign regulatory agencies or otherwise comply with additional non‑U.S. laws and regulations that do not currently apply to us. Lack of compliance with any such non‑U.S. laws and regulations may increase our risk of becoming party to litigation and subject to regulatory actions. We are also subject to the enhanced risk that our differentiated partnership model might not be enforceable in some non‑U.S. jurisdictions.
We and our partner firms are subject to anticorruption laws, including the U.S. Foreign Corrupt Practices Act (“FCPA”), the U.K. Bribery Act (the “Bribery Act”) and the Canadian Corruption of Foreign Public Officials Act (the “CFPOA”). Certain of our partner firms are also subject to anti‑money laundering (“AML”) laws in the United States, the United Kingdom, Canada and Australia and may be subject to other anti‑corruption laws and AML laws, as well as sanctions laws and other laws governing our and our partner firms’ operations, to the extent our business expands to other non‑U.S. jurisdictions. If our partner firms fail to comply with these laws, they and we could be subject to civil or criminal penalties, other remedial measures, and legal expenses, which could adversely affect our results of operations and financial condition.
We continue to pursue investment opportunities outside of the United States. We and our partner firms are currently subject to anti‑corruption laws, including the FCPA, the Bribery Act and the CFPOA. To the extent we expand our international operations to other non‑U.S. jurisdictions, our prospective partner firms may be subject to additional anti‑corruption laws that apply in countries where they are doing business. The FCPA, the Bribery Act, the CFPOA and other applicable anti‑corruption laws generally prohibit our partner firms, employees and intermediaries from bribing, being bribed or making other prohibited payments to government officials or other persons to obtain or retain business or gain some other business advantage. Our partner firms may also participate in collaborations and relationships with third parties whose actions could potentially subject them to liability under the FCPA, the Bribery Act, the CFPOA or other jurisdictions’ anti‑corruption laws. In addition, we and our partner firms cannot predict the nature, scope or effect of future regulatory requirements to which their internal operations might be subject or the manner in which existing laws might be administered or interpreted.
Our partner firms that are SEC‑registered broker‑dealers are also subject to AML laws and related compliance obligations under the USA PATRIOT Act and the Bank Secrecy Act (“BSA”) that require that these partner firms maintain an AML compliance program covering certain of their business activities. While currently there are no comparable AML-related compliance obligations with respect to the activities of RIAs, there have been proposals that, if adopted, would subject our partner firms that are RIAs to the requirements of the BSA. Our partner firms that conduct business in non‑U.S. jurisdictions, such as the United Kingdom and Canada, are also subject to specific AML and counter terrorist financing requirements that require them to develop and maintain AML and counter terrorist financing policies and procedures.
There is no assurance that we will be completely effective in ensuring our partner firms’ compliance with all applicable anti‑corruption laws, including the FCPA, the Bribery Act and the CFPOA and AML laws in the United States, the United Kingdom, Canada and Australia. If we or our partner firms are not in compliance with the FCPA, the Bribery Act, the CFPOA or other anti‑corruption laws or AML laws, they may be subject to criminal and civil penalties, disgorgement and other sanctions and remedial measures, and legal expenses, which could have an adverse impact on
32
our results of operations and financial condition. Likewise, any investigation of any potential violations of the FCPA, the Bribery Act, the CFPOA or other anti‑corruption laws or AML laws by authorities in the United States, the United Kingdom, Canada, Australia or other jurisdictions where we conduct business could also have an adverse impact on our reputation, results of operations and financial condition.
The regulatory environment in which our partner firms operate is subject to continuous change, and regulatory developments designed to increase oversight may adversely affect our business.
The legislative and regulatory environment in which our partner firms operate has undergone significant changes in the recent past, including additional filings with the SEC required by investment advisory firms, which have resulted in increased costs to us. Regulatory review or the issuance of interpretations of existing laws and regulations may result in the enactment of new laws and regulations that could adversely affect our operations or our ability to conduct business profitably. We are unable to predict whether any such laws or regulations will be enacted and to what extent such laws and regulations would affect our business.
As examples, in the United States, on June 5, 2019, the SEC proposed a package of rulemakings and interpretations that impose a best interest standard of conduct for broker‑dealers, require investment advisers and broker-dealers to deliver short form disclosure documents to retail investors and clarifies the SEC’s views on the fiduciary duty that investment advisers owe to their clients. On November 4, 2019, the SEC also proposed new rules regarding investment adviser advertisements and payments to solicitors. In the United Kingdom, our partner firm became subject to the new Senior Managers and Certification Regime, which provides for additional firm and individual responsibilities and enhanced oversight by the U.K. Financial Conduct Authority. Our business in the United Kingdom may also be impacted by financial services reform initiatives enacted or under consideration in the European Union or by the United Kingdom’s withdrawal from the European Union. In Australia, a Royal Commission issued a highly publicized report on February 1, 2019 following a 12‑month inquiry of misconduct in the banking, superannuation and financial services industry. The report makes many recommendations that, if adopted into law or regulations, could impact our existing or any future Australian partner firms or investments. In December 2019, the Canadian Securities Administrators adopted amendments to National Instrument 31-103 and its related Companion Policy, which will impose new heightened requirements on our Canadian partner firms with respect to conflicts of interest, know your client, know your product and suitability obligations. Additionally, we and our partner firms are subject to various state, federal and international data privacy and cybersecurity laws designed to protect client and employee personally identifiable information. These laws and regulations are increasing in complexity and number. Compliance with these new laws and regulations may also result in increased compliance costs and expenses, and non‑compliance may result in fines, penalties and potentially civil litigation.
We believe that significant regulatory changes in the wealth management industry are likely to continue, which is likely to subject industry participants to additional, more costly and generally more detailed regulation. New laws or regulations, or changes in the enforcement of existing laws or regulations, applicable to our partner firms may adversely affect our business. Our continued ability to function in this environment will depend on our ability to monitor and promptly react to legislative and regulatory changes. Changes in laws or regulatory requirements, or the interpretation or application of such laws and regulatory requirements by regulatory authorities, can occur without notice and could have an adverse impact on our results of operations and financial condition.
Our business is subject to risks related to legal proceedings and governmental inquiries.
Our business is subject to litigation, regulatory investigations and claims arising in the normal course of operations. The risks associated with these matters often may be difficult to assess or quantify and the existence and magnitude of potential claims often remain unknown for substantial periods of time.
Our partner firms depend to a large extent on their network of relationships and on their reputation to attract and retain clients. The principals and other wealth management professionals at our partner firms make investment decisions on behalf of clients that could result in substantial losses. If clients suffer significant losses, or are otherwise dissatisfied with wealth management services, we could be subject to the risk of legal liabilities or actions alleging negligent misconduct, breach of contract, unjust enrichment and/or fraud. Moreover, our partner firms are predominantly RIAs and
33
have a legal obligation to operate under the fiduciary standard, a heightened standard as compared to the standard of conduct applicable to broker‑dealers. These risks are often difficult to assess or quantify and their existence and magnitude often remain unknown for substantial periods of time, even after an action has been commenced.
Our involvement in any investigations and lawsuits would cause us to incur additional legal and other costs and, if we were found to have violated any laws, we could be required to pay fines, damages and other costs, perhaps in material amounts. Regardless of final costs, these matters could have an adverse effect on our business by exposing us to negative publicity, reputational damage, harm to our partner firms’ client relationships or diversion of personnel and management resources.
Principal or employee misconduct could expose us to significant legal liability and reputational harm.
We are vulnerable to reputational harm because our partner firms operate in an industry in which personal relationships, integrity and the confidence of clients are of critical importance. The principals and employees at our partner firms could engage in misconduct that adversely affects our business. For example, if a principal or employee were to engage in illegal or suspicious activities, a partner firm could be subject to regulatory sanctions and we could suffer serious harm to our reputation (as a consequence of the negative perception resulting from such activities), our financial position, our partner firms’ client relationships and their ability to attract new clients.
The wealth management business often requires that we deal with confidential information. If principals or employees at our partner firms were to improperly use or disclose this information, even if inadvertently, we or our partner firms could be subject to legal action and suffer serious harm to our reputation, financial position and current and future business relationships or those of our partner firms. It is not always possible to deter misconduct, and the precautions we take to detect and prevent this activity may not always be effective. Misconduct by principals or employees at our partner firms, or even unsubstantiated allegations of misconduct, could result in an adverse effect on our reputation and our business.
Failure to properly disclose conflicts of interest and comply with fiduciary duty requirements could harm our reputation, business and results of operations.
Some of our partner firms have affiliated SEC‑registered broker‑dealers and licensed insurance affiliates, which create conflicts of interests. Certain of our partner firms also have compensation arrangements pursuant to which they receive payments based on client assets invested in certain third‑party mutual funds. Such arrangements allow a partner firm to receive payments from multiple parties based on the same client asset and can incentivize a partner firm to act in a manner contrary to the best interests of its clients. As investment advisers subject to a legal obligation to operate under the fiduciary standard, these partner firms must fully disclose any conflicts between their interests and those of their clients. The SEC and other regulators have increased their scrutiny of potential conflicts of interest, and our partner firms have implemented policies and procedures to mitigate conflicts of interest. However, if our partner firms fail to fully disclose conflicts of interest or if their policies and procedures are not effective, they could face reputational damage, litigation or regulatory proceedings or penalties, any of which may adversely affect our reputation, business and results of operations.
Acquisitions of newly established RIA firms formed by teams of wealth management professionals formerly employed at traditional brokerages and wirehouses expose us to litigation risk.
As part of the Focus Independence program, we have to date, with limited exceptions, acquired substantially all of the assets of new RIA firms formed by teams of wealth management professionals formerly employed at traditional brokerages and wirehouses. These acquisitions may expose us to the risk of legal actions alleging misappropriation of confidential information, including client information, unfair competition, breach of contract and tortious interference with contracts between the lift out wealth management teams and the brokerage or wirehouse. Additionally, in November 2017 two larger brokerage firms withdrew from an industry agreement known as the Protocol for Broker Recruiting or the “Broker Protocol.” These withdrawals, and any additional withdrawals by signatories to the Broker Protocol, may increase the potential for such legal actions. These risks are often difficult to assess or quantify and their existence and magnitude often remain unknown for substantial periods of time, even after an action has been
34
commenced. We may incur significant legal expenses in defending against litigation commenced by a brokerage or wirehouse. Substantial legal liability could have an adverse effect on our business, results of operations or financial condition or cause significant reputational harm to us.
In the event of a change of control of our company, we may be required to obtain the consent of our partner firms’ advisory clients to the change of control, and any failure to obtain these consents could adversely affect our results of operations, financial condition or business.
As required by the Advisers Act, the investment advisory agreements entered into by our investment adviser subsidiaries provide that an “assignment” of the agreement may not be made without the client’s consent. Under the Investment Company Act of 1940 (the “Investment Company Act”), advisory agreements with registered funds provide that they terminate automatically upon “assignment” and the board of directors and the shareholders of the registered fund must approve a new agreement for advisory services to continue. Under both the Advisers Act and the Investment Company Act, a change of ownership may constitute such an “assignment” if it is a change of control. For example, under certain circumstances, an assignment may be deemed to occur if a controlling block of voting securities is transferred, if any party acquires control, or, in certain circumstances, if a controlling party gives up control. Under the Investment Company Act, a 25% voting interest is presumed to constitute control. An assignment or a change of control could be deemed to occur in the future if we, or one of our investment adviser subsidiaries, were to gain or lose a controlling person, or in other situations that may depend significantly on facts and circumstances. In any such case we would seek to obtain the consent of our advisory clients, including any funds, to the assignment. To the extent of any failure to obtain these consents, our results of operations, financial condition or business could be adversely affected.
Risks Related to Our Class A Common Stock, Ownership and Governance
An active, liquid and orderly trading market for our Class A common stock may not be maintained, and our stock price may be volatile.
Prior to July 2018, our Class A common stock was not traded on any market. An active, liquid and orderly trading market for our Class A common stock may not be maintained. Active, liquid and orderly trading markets usually result in less price volatility and more efficiency in carrying out investors’ purchase and sale orders. The market price of our Class A common stock could vary significantly as a result of a number of factors, some of which are beyond our control. In the event of a drop in the market price of our Class A common stock, you could lose a substantial part or all of your investment in our Class A common stock.
If our operating and financial performance in any given period does not meet the guidance that we have provided to the public or the expectations of our investors and analysts, our stock price may decline.
We provide public guidance on our expected operating and financial results for future periods, including at times revenue and Adjusted Net Income per share growth and leverage target ranges. Although we believe that this guidance provides investors and analysts with a better understanding of management’s expectations for the future and is useful to our stockholders and potential stockholders, such guidance is comprised of forward-looking statements subject to the risks and uncertainties described in this report and in our other public filings and public statements. Our actual results may not always be in line with or exceed the guidance we have provided or the expectations of our investors and analysts, especially in times of economic uncertainty. In the past, when results have differed from such guidance or expectations, the market price of our common stock has declined. If, in the future, our operating or financial results for a particular period do not meet our guidance or the expectations of our investors and analysts or if we reduce our guidance for future periods, the market price of our common stock may decline.
Investment vehicles affiliated with our private equity investors own a substantial percentage of the voting power of our common stock.
Holders of Class A common stock and Class B common stock vote together as a single class on all matters presented to our shareholders for their vote or approval, except as otherwise required by applicable law or our certificate of incorporation. As of February 20, 2020, investment vehicles affiliated with Stone Point Capital LLC (together with its
35
affiliates, “Stone Point”) and Kohlberg Kravis Roberts & Co. L.P. (together with its affiliates, “KKR” or, together with Stone Point, the “PE Holders”) collectively owned approximately 35.1% of our Class A common stock (representing 35.1% of the economic interest and 23.9% of the voting power) and 64.7% of our Class B common stock (representing 0% of the economic interest and 20.6% of the voting power).
Although the PE Holders are entitled to act separately in their own respective interests with respect to their stock in us, they together hold almost enough voting power to elect all of the members of our board of directors and thereby to control our management and affairs. Additionally, the PE Holders have the right to nominate an aggregate of three members of our board of directors for so long as they maintain certain ownership stakes. The PE Holders are likely able to determine the outcome of all matters requiring shareholder approval, including mergers and other material transactions, and are able to cause or prevent a change in the composition of our board of directors or a change in control of our company that could deprive our shareholders of an opportunity to receive a premium for their shares of Class A common stock as part of a sale of our company. The existence of significant shareholders may also have the effect of deterring hostile takeovers, delaying or preventing changes in control or changes in management, or limiting the ability of our other shareholders to approve transactions that they may deem to be in the best interests of our company.
Moreover, this concentration of stock ownership may also adversely affect the trading price of our Class A common stock to the extent investors perceive a disadvantage in owning stock of our company.
The interests of the PE Holders may differ from those of our public shareholders.
So long as the PE Holders continue to control a significant amount of our common stock, they will continue to be able to strongly influence all matters requiring shareholder approval, regardless of whether or not other shareholders believe that a potential transaction is in their own best interests. In any of these matters, the interests of the PE Holders (including their interests, if any, as TRA holders) may differ or conflict with the interests of our other shareholders. For example, the PE Holders may have different tax positions from us which could influence their decisions regarding whether and when to dispose of assets, whether and when to incur new or refinance existing indebtedness, especially in light of the existence of the Tax Receivable Agreements, and whether and when Focus Inc. should terminate the Tax Receivable Agreements and accelerate its obligations thereunder; provided that any decision to terminate the Tax Receivable Agreements and accelerate the obligations thereunder would also require the approval of a majority of the disinterested directors of Focus Inc. In addition, the structuring of future transactions may take into consideration the PE Holders’ tax or other considerations even where no similar benefit would accrue to us. See “Part II, Item 7, Management’s Discussion and Analysis of Financial Condition and Results of Operations—Liquidity and Capital Resources—Tax Receivable Agreements.”
Our certificate of incorporation and bylaws, as well as Delaware law, contain provisions that could discourage acquisition bids or merger proposals, which may adversely affect the market price of our Class A common stock.
Our certificate of incorporation authorizes our board of directors to issue one or more classes or series of preferred stock, the terms of which may be established and the shares of which may be issued without shareholder approval, and which may include super voting, special approval, dividend, repurchase rights, liquidation preferences or other rights or preferences superior to the rights of the holders of Class A common stock. The terms of one or more classes or series of preferred stock could adversely impact the value or our Class A common stock. Furthermore, if our board of directors elects to issue preferred stock it could be more difficult for a third party to acquire us. For example, our board of directors may grant holders of preferred stock the right to elect some number of our directors in all events or upon the occurrence of specified events or the right to veto specified transactions.
In addition, some provisions of our certificate of incorporation and bylaws could make it more difficult for a third party to acquire control of us, even if the change of control would be beneficial to our shareholders, including: (i) prohibiting us from engaging in any business combination with any interested shareholder for a period of three years following the time that the shareholder became an interested shareholder, subject to certain exceptions, (ii) establishing advance notice provisions with regard to shareholder proposals relating to the nomination of candidates for election as directors or new business to be brought before meetings of our shareholders, (iii) providing that the authorized number
36
of directors may be changed only by resolution of the board of directors, (iv) providing that all vacancies in our board of directors may, except as otherwise be required, be filled by the affirmative vote of a majority of directors then in office, even if less than a quorum, (v) providing that our amended and restated certificate of incorporation and amended and restated bylaws may be amended by the affirmative vote of the holders of at least two‑thirds of our then outstanding voting stock, (vi) providing for our board of directors to be divided into three classes of directors, (vii) providing that our amended and restated bylaws can be amended by the board of directors, (viii) limitations on the ability of shareholders to call special meetings, (ix) limitations on the ability of shareholders to act by written consent, (x) requiring the affirmative vote of the holders of a majority of the voting stock held by affiliates of Stone Point and KKR, for so long as they collectively own at least 25% of our outstanding voting stock, to amend, alter, repeal or rescind certain provisions in our amended and restated certificate of incorporation and (xi) renouncing any reasonable expectancy interest that we have in, or right to be offered an opportunity to participate in, any corporate or business opportunities that are from time to time presented to Stone Point, KKR, directors affiliated with these parties and their respective affiliates.
In addition, certain change of control events have the effect of accelerating the payments due under the Tax Receivable Agreements, which could result in a substantial, immediate lump‑sum payment that could serve as a disincentive to a potential acquirer of us, please see “Risks Related to Our Structure—In certain cases, payments under the Tax Receivable Agreements may be accelerated and/or significantly exceed the actual benefits, if any, realized in respect of the tax attributes subject to the Tax Receivable Agreements.”
Our amended and restated certificate of incorporation designates the Court of Chancery of the State of Delaware as the sole and exclusive forum for certain types of actions and proceedings that may be initiated by our shareholders, which could limit our shareholders’ ability to obtain a favorable judicial forum for disputes with us or our directors, officers, employees or agents.
Our amended and restated certificate of incorporation provides that, unless we consent in writing to the selection of an alternative forum, the Court of Chancery of the State of Delaware will, to the fullest extent permitted by applicable law, be the sole and exclusive forum for (i) any derivative action or proceeding brought on our behalf, (ii) any action asserting a claim of breach of a fiduciary duty owed by any of our directors, officers, employees, agents or trustees to us or our shareholders, (iii) any action asserting a claim against us or any director or officer or other employee of ours arising pursuant to any provision of the Delaware General Corporation Law (the “DGCL”), our amended and restated certificate of incorporation or our bylaws or (iv) any action asserting a claim against us or any director or officer or other employee of ours that is governed by the internal affairs doctrine, in each such case subject to such Court of Chancery having personal jurisdiction over the indispensable parties named as defendants therein. Unless we consent in writing to the selection of an alternative forum, to the fullest extent permitted by law, the federal district courts of the United States will be the exclusive forum for resolving any complaint asserting a cause of action arising under the federal securities laws of the United States. Any person or entity purchasing or otherwise acquiring any interest in shares of our capital stock will be deemed to have notice of, and consented to, the provisions of our amended and restated certificate of incorporation described in the preceding sentence. This choice of forum provision may limit a shareholder’s ability to bring a claim in a judicial forum that it finds favorable for disputes with us or our directors, officers, employees or agents, which may discourage such lawsuits against us and such persons. Alternatively, if a court were to find these provisions of our amended and restated certificate of incorporation inapplicable to, or unenforceable in respect of, one or more of the specified types of actions or proceedings, we may incur additional costs associated with resolving such matters in other jurisdictions, which could adversely affect our results of operations and financial condition.
Claims for indemnification by our directors and officers may reduce our available funds to satisfy successful third‑party claims against us and may reduce the amount of money available to us.
Our amended and restated certificate of incorporation and bylaws provide that we will indemnify our directors and officers to the fullest extent permitted by Delaware law. Our amended and restated bylaws also permit us to purchase insurance on behalf of any officer, director, employee or other agent for any liability arising out of that person’s actions as our officer, director, employee or agent, regardless of whether Delaware law would permit indemnification. We entered into indemnification agreements with each of our directors and officers. These agreements require us to indemnify these individuals to the fullest extent permitted under Delaware law against liability that may
37
arise by reason of their service to us and to advance expenses incurred as a result of any proceeding against them as to which they could be indemnified.
In addition, our amended and restated certificate of incorporation limits the liability of our directors for monetary damages for breach of their fiduciary duty as directors, except for liability that cannot be eliminated under the DGCL. Delaware law provides that directors of a company will not be personally liable for monetary damages for breach of their fiduciary duty as directors, except for liabilities:
|
· |
for any breach of their duty of loyalty to us or our shareholders; |
|
· |
for acts or omissions not in good faith or which involve intentional misconduct or a knowing violation of law; |
|
· |
for unlawful payment of dividend or unlawful stock repurchase or redemption, as provided under Section 174 of the DGCL; or |
|
· |
for any transaction from which the director derived an improper personal benefit. |
The above limitations on liability and our indemnification obligations limit the personal liability of our directors and officers for monetary damages for breach of their fiduciary duty as directors by shifting the burden of such losses and expenses to us. Certain liabilities or expenses covered by our indemnification obligations may not be covered by our directors’ and officers’ liability insurance or the coverage limitation amounts may be exceeded. As a result, any claims for indemnification by our directors and officers may reduce our available funds to satisfy successful third‑party claims against us and may reduce the amount of money available to us.
We do not have any current plans to pay dividends on our Class A common stock. Consequently, your only opportunity to achieve a return on your investment in our Class A common stock is if the price of our Class A common stock appreciates.
We do not have any current plans to declare dividends on shares of our Class A common stock in the foreseeable future. Consequently, your only opportunity to achieve a return on your investment in our Class A common stock will be if you sell your shares of Class A common stock at a price greater than you may pay for them. There is no guarantee that the price of our Class A common stock will ever exceed the price that you may pay for them.
Future sales of our Class A common stock in the public market could reduce our stock price, and any additional capital raised by us through the sale of equity or convertible securities may dilute your ownership in us.
Unitholders of Focus LLC (other than Focus Inc. and any of its subsidiaries) may receive shares of our Class A common stock pursuant to the exercise of an exchange right or the call right and then sell those shares of Class A common stock. Additionally, we may issue additional shares of Class A common stock or convertible securities in subsequent offerings or as consideration for future acquisitions. As of February 20, 2020, we had 47,421,315 outstanding shares of Class A common stock. Except as otherwise permitted by the Fourth Amended and Restated Focus LLC Agreement, Focus LLC unitholders are only permitted to exercise their exchange rights on quarterly exchange dates and only with respect to up to one‑twelfth of the units held by them at the closing of the IPO, with an ability to carry forward unused exchange rights to subsequent exchange dates. The foregoing volume restrictions apply to the PE Holders as an aggregate limitation on their ability to sell Focus LLC units or the shares of Class A common stock received in connection with the Reorganization Transactions. The PE Holders and all Focus LLC unitholders are parties to a registration rights agreement with us that requires us to effect the registration of their shares of Class A common stock in certain circumstances, without being subject to the preceding limitations.
We have 6,600,000 shares of our Class A common stock registered under our registration statement on Form S‑8 that are available for resale in the public market without restriction upon issuance under our equity incentive plan, subject to the satisfaction of vesting, the requirements of Rule 144 and any other conditions.
38
We cannot predict the size of future issuances of our Class A common stock or securities convertible into Class A common stock or the effect, if any, that future issuances and sales of shares of our Class A common stock will have on the market price of our Class A common stock. Sales of substantial amounts of our Class A common stock (including shares issued in connection with an acquisition), or the perception that such sales could occur, may adversely affect prevailing market prices of our Class A common stock.
We have and may in the future finance acquisitions of partner firms by issuing equity securities that could be dilutive to shareholders.
We have and may in the future finance acquisitions through the issuance of equity securities, including Focus LLC common units and our Class A common stock. Acquisitions financed with the issuance of Focus LLC common units could significantly reduce our percentage ownership of Focus LLC. Furthermore, the new holders of Focus LLC common units may receive shares of our Class A common stock pursuant to the exercise of an exchange right or the call right, which could impact shareholders.
Acquisitions financed with the issuance of our Class A common stock could be dilutive to the share value and voting power of our existing Class A common stock, which could affect the market price of our Class A common stock.
Item 1B. Unresolved Staff Comments
None.
We and our partner firms conduct our operations using leased office facilities. While we believe we have suitable office space currently, we will continue to evaluate our office space requirements and will complement these facilities as necessary.
Our corporate headquarters is located at 875 Third Avenue, New York, New York, where we occupy approximately 29,700 square feet of space under a lease, the term of which expires in 2035. In addition, each of our partner firms leases office space in the city or cities in which it conducts business.
We are, from time to time, involved in various legal claims and regulatory matters arising out of our operations in the normal course of business. After consultation with legal counsel, we do not believe that the resolutions of any such matters we are currently involved in, individually or in the aggregate, will have a material adverse impact on our consolidated financial statements. However, we can provide no assurance that any pending or future matters will not have a material effect on our financial condition, results of operations or cash flows in future reporting periods.
From time to time, our partner firms receive requests for information from governmental authorities regarding business activities. We have cooperated and will continue to cooperate fully with all governmental agencies. We continue to believe that the resolution of any governmental inquiry will not have a material impact on our financial condition, results of operations or cash flows.
Item 4. Mine Safety Disclosures
Not applicable
39
Item 5. Market For Registrant’s Common Equity, Related Stockholder Matters and Issuer Purchases of Equity Securities
Market Information and Holders
Our Class A common stock began trading on the Nasdaq Global Select Market under the symbol “FOCS” on July 26, 2018. Prior to that, there was no public market for our Class A common stock.
As of February 20, 2020, we had approximately 70 holders of record of our Class A common stock. This number excludes owners for whom Class A common stock may be held in “street” name.
There is no public market for our Class B common stock. As of February 20, 2020, we had 33 holders of record of our Class B common stock.
Dividends
We do not have any current plans to declare dividends on shares of our Class A common stock in the foreseeable future. We currently intend to retain future earnings, if any, to finance the growth of our business. Our future dividend policy is within the discretion of our board of directors and will depend upon then‑existing conditions, including our results of operations, financial condition, capital requirements, investment opportunities, statutory restrictions on our ability to pay dividends and other factors our board of directors may deem relevant. In addition, the Credit Facility contains certain restrictions on our ability to pay cash dividends.
Securities Authorized for Issuance Under Equity Compensation Plans
The information relating to our equity compensation plans required by Item 5 is incorporated by reference to such information as set forth in “Part III, Item 12, Security Ownership of Certain Beneficial Owners and Management and Related Stockholder Matters.”
Recent Sales of Unregistered Securities
During the three months ended December 31, 2019, we issued an aggregate of 163,959 shares of our Class A common stock and retired 122,916 shares of our Class B common stock and 70,572 incentive units in Focus LLC and acquired 163,959 common units in Focus LLC, in each case as part of our regular quarterly exchanges offered to holders of units in Focus LLC.
Each Focus LLC common unit, together with a corresponding share of Class B common stock, and Focus LLC incentive unit (after conversion into a number of common units taking into account the then current value of the common units and such incentive unit’s aggregate hurdle amount) is exchangeable, pursuant to the terms and subject to the conditions set forth in the Operating Agreement, for one share of our Class A common stock, or, if either we or Focus LLC so elects, cash.
The issuance of such securities was made in reliance upon an exemption from the registration requirements of the Securities Act of 1933, as amended, pursuant to Section 4(a)(2) thereof.
Item 6. Selected Financial Data
Focus Inc. was formed in July 2015 and did not have any historical financial or operating results prior to the IPO. Following the IPO, Focus Inc. became the sole managing member of Focus LLC. As a result, Focus Inc. consolidates the financial results of Focus LLC and its subsidiaries. For periods prior to the completion of the IPO, the accompanying consolidated financial statements reflect the historical financial position and results of operations of Focus LLC, our predecessor.
40
You should read the following table in conjunction with “Part II, Item 7, Management’s Discussion and Analysis of Financial Condition and Results of Operations” and our audited consolidated financial statements included in “Part II, Item 8, Financial Statements and Supplementary Data.”
|
|
|
|
|
|
|
|
|
|
|
|
|
|
|
|
|
|
|
|
|
|
|
|
|
|
|
|
|
|
|
|
|
|
|
|
|
|
|
Focus Financial Partners, LLC |
|
|
Focus Financial Partners Inc. |
|
||||||||||
|
|
|
Year Ended December 31, |
|
|||||||||||||
|
|
|
2015 |
|
2016 |
|
2017 |
|
2018 |
|
2019 |
|
|||||
|
|
|
(dollars in thousands, except per share data) |
|
|||||||||||||
|
Consolidated Statements of Operations Data: |
|
|
|
|
|
|
|
|
|
|
|
|
|
|
|
|
|
Revenues |
|
$ |
382,347 |
|
$ |
485,444 |
|
$ |
662,887 |
|
$ |
910,880 |
|
$ |
1,218,341 |
|
|
Operating expenses |
|
|
361,030 |
|
|
447,161 |
|
|
657,134 |
|
|
866,446 |
|
|
1,150,695 |
|
|
Income from operations |
|
|
21,317 |
|
|
38,283 |
|
|
5,753 |
|
|
44,434 |
|
|
67,646 |
|
|
Other expense, net |
|
|
(11,347) |
|
|
(21,580) |
|
|
(55,613) |
|
|
(76,071) |
|
|
(72,622) |
|
|
Income (loss) before income tax |
|
|
9,970 |
|
|
16,703 |
|
|
(49,860) |
|
|
(31,637) |
|
|
(4,976) |
|
|
Income tax expense (benefit) |
|
|
649 |
|
|
981 |
|
|
(1,501) |
|
|
9,450 |
|
|
7,049 |
|
|
Net income (loss) |
|
$ |
9,321 |
|
$ |
15,722 |
|
$ |
(48,359) |
|
$ |
(41,087) |
|
$ |
(12,025) |
|
|
Non-controlling interest |
|
|
|
|
|
|
|
|
|
|
|
40,497 |
|
|
(847) |
|
|
Net loss attributable to common shareholders |
|
|
|
|
|
|
|
|
|
|
$ |
(590) |
|
$ |
(12,872) |
|
|
Loss per share of Class A common stock: |
|
|
|
|
|
|
|
|
|
|
|
|
|
|
|
|
|
Basic |
|
|
|
|
|
|
|
|
|
|
$ |
(0.01) |
|
$ |
(0.28) |
|
|
Diluted |
|
|
|
|
|
|
|
|
|
|
$ |
(0.01) |
|
$ |
(0.28) |
|
|
Consolidated Balance Sheet Data (at period end): |
|
|
|
|
|
|
|
|
|
|
|
|
|
|
|
|
|
Cash and cash equivalents |
|
$ |
15,499 |
|
$ |
16,508 |
|
$ |
51,455 |
|
$ |
33,213 |
|
$ |
65,178 |
|
|
Total assets |
|
|
550,670 |
|
|
752,941 |
|
|
1,234,837 |
|
|
1,937,778 |
|
|
2,653,629 |
|
|
Total liabilities |
|
|
418,871 |
|
|
562,339 |
|
|
1,148,749 |
|
|
1,125,258 |
|
|
1,849,659 |
|
|
Total mezzanine equity |
|
|
405,347 |
|
|
452,485 |
|
|
864,749 |
|
|
— |
|
|
— |
|
|
Total deficit/equity |
|
|
(273,548) |
|
|
(261,883) |
|
|
(778,661) |
|
|
812,520 |
|
|
803,970 |
|
|
Other Financial Data: |
|
|
|
|
|
|
|
|
|
|
|
|
|
|
|
|
|
Revenue Metrics: |
|
|
|
|
|
|
|
|
|
|
|
|
|
|
|
|
|
Revenue growth(1) from prior period |
|
|
17.4 |
% |
|
27.0 |
% |
|
36.6 |
% |
|
37.4 |
% |
|
33.8 |
% |
|
Organic revenue growth(2) from prior period |
|
|
5.5 |
% |
|
5.2 |
% |
|
13.4 |
% |
|
13.0 |
% |
|
15.1 |
% |
|
Management Fees Metrics (operating expense): |
|
|
|
|
|
|
|
|
|
|
|
|
|
|
|
|
|
Management fees growth(3) from prior period |
|
|
13.4 |
% |
|
28.0 |
% |
|
42.5 |
% |
|
42.2 |
% |
|
30.9 |
% |
|
Organic management fees growth(4) from prior period |
|
|
1.9 |
% |
|
3.6 |
% |
|
23.0 |
% |
|
14.3 |
% |
|
10.2 |
% |
|
Adjusted EBITDA Metrics: |
|
|
|
|
|
|
|
|
|
|
|
|
|
|
|
|
|
Adjusted EBITDA(5) |
|
$ |
75,442 |
|
$ |
103,038 |
|
$ |
145,226 |
|
$ |
203,402 |
|
$ |
269,834 |
|
|
Adjusted EBITDA growth(5) from prior period |
|
|
11.3 |
% |
|
36.6 |
% |
|
40.9 |
% |
|
40.1 |
% |
|
32.7 |
% |
|
Adjusted Net Income Metrics: |
|
|
|
|
|
|
|
|
|
|
|
|
|
|
|
|
|
Adjusted Net Income(5)(6) |
|
$ |
52,273 |
|
$ |
68,569 |
|
$ |
86,701 |
|
$ |
125,348 |
|
$ |
178,578 |
|
|
Adjusted Net Income growth(5)(6) from prior period |
|
|
11.9 |
% |
|
31.2 |
% |
|
26.4 |
% |
|
44.6 |
% |
|
42.5 |
% |
|
Adjusted Net Income Per Share Metrics: |
|
|
|
|
|
|
|
|
|
|
|
|
|
|
|
|
|
Adjusted Net Income Per Share(5)(6) |
|
$ |
0.73 |
|
$ |
0.95 |
|
$ |
1.21 |
|
$ |
1.74 |
|
$ |
2.38 |
|
|
Adjusted Net Income Per Share growth(5)(6) from prior period |
|
|
11.9 |
% |
|
31.2 |
% |
|
26.4 |
% |
|
43.8 |
% |
|
36.8 |
% |
|
Other Metrics: |
|
|
|
|
|
|
|
|
|
|
|
|
|
|
|
|
|
Acquired Base Earnings(7) |
|
$ |
15,586 |
|
$ |
23,217 |
|
$ |
44,191 |
|
$ |
37,750 |
|
$ |
35,138 |
|
|
Number of partner firms at period end(8) |
|
|
36 |
|
|
42 |
|
|
51 |
|
|
58 |
|
|
63 |
|
|
(1) |
Represents period‑over‑period growth in our GAAP revenue. |
|
(2) |
Organic revenue growth represents the period‑over‑period growth in revenue related to partner firms, including growth related to acquisitions of wealth management practices and customer relationships by our partner firms and partner firms that have merged, that for the entire periods presented, are included in our consolidated statements of operations for each of the entire periods presented. We believe these growth statistics are useful in that they present full‑period revenue growth of partner firms on a “same store” basis exclusive of the effect of the partial period results of partner firms that are acquired during the comparable periods. |
|
(3) |
The terms of our management agreements entitle the management companies to management fees typically consisting of all EBPC in excess of Base Earnings up to Target Earnings, plus a percentage of any EBPC in excess of Target Earnings. Management fees growth represents the period‑over‑period growth in GAAP |
41
management fees earned by management companies. While an expense, we believe that growth in management fees reflect the strength of the partnership. |
|
(4) |
Organic management fees growth represents the period‑over‑period growth in management fees earned by management companies related to partner firms, including growth related to acquisitions of wealth management practices and customer relationships by our partner firms and partner firms that have merged, that for the entire periods presented, are included in our consolidated statements of operations for each of the entire periods presented. We believe that these growth statistics are useful in that they present full‑period growth of management fees on a “same store” basis exclusive of the effect of the partial period results of partner firms that are acquired during the comparable periods. |
|
(5) |
Adjusted EBITDA, Adjusted Net Income and Adjusted Net Income Per Share are non‑GAAP financial measures. For definitions of Adjusted EBITDA, Adjusted Net Income and Adjusted Net Income Per Share and reconciliations to our most directly comparable financial measure calculated and presented in accordance with GAAP, please read “Part II, Item 7, Management’s Discussion and Analysis of Financial Condition and Results of Operations—How We Evaluate Our Business.” |
|
(6) |
For periods ended prior to the closing of the IPO and the consummation of the Reorganization Transactions on July 30, 2018, certain tax related adjustments are made and Adjusted Shares Outstanding of 71,843,916 are deemed to be outstanding for comparative purposes only. |
|
(7) |
The terms of our management agreements entitle the management companies to management fees typically consisting of all future EBPC of the acquired wealth management firm in excess of Base Earnings up to Target Earnings, plus a percentage of any EBPC in excess of Target Earnings. Acquired Base Earnings is equal to our retained cumulative preferred position in Base Earnings. We are entitled to receive these earnings notwithstanding any earnings that we are entitled to receive in excess of Target Earnings. Base Earnings may change in future periods for various business or contractual matters. For example, from time to time when a partner firm consummates an acquisition, the management agreement among the partner firm, the management company and the principals is amended to adjust Base Earnings and Target Earnings to reflect the projected post‑acquisition earnings of the partner firm. |
|
(8) |
Represents the number of partner firms on the last day of the period presented. The number includes new partner firms acquired during the period reduced by any partner firms that merged with existing partner firms prior to the last day of the period. |
Item 7. Management’s Discussion and Analysis of Financial Condition and Results of Operations
You should read this discussion and analysis of our financial condition and results of operations in conjunction with “Part II, Item 6, Selected Financial Data” and the historical financial statements and related notes included elsewhere in this Annual Report. The information in this section contains forward‑looking statements. Please read “Cautionary Statement Regarding Forward‑Looking Statements.” Our actual results may differ significantly from the results suggested by these forward‑looking statements and from our historical results. Some factors that may cause our results to differ are described in “Part I, Item 1A, Risk Factors.” The historical financial data discussed below reflects the historical results of operations and financial position of Focus Inc., including consolidation of its investment in Focus LLC, since July 30, 2018. Prior to July 30, 2018, the closing date of the IPO, the historical financial data discussed below represents the historical results of operations and financial position of Focus LLC.
Overview
We are a leading partnership of independent, fiduciary wealth management firms operating in the highly fragmented RIA industry, with a footprint of over 60 partner firms primarily in the United States. We have achieved this market leadership by positioning ourselves as the partner of choice for many firms in an industry where a number of secular trends are driving consolidation. Our partner firms primarily service ultra‑high net worth and high net worth individuals and families by providing highly differentiated and comprehensive wealth management services. Our partner
42
firms benefit from our intellectual and financial resources, operating as part of a scaled business model with aligned economic interests, while retaining their entrepreneurial culture and independence.
Our partnership is comprised of trusted professionals providing comprehensive wealth management services through a largely recurring, fee‑based model, which differentiates our partner firms from the traditional brokerage platforms whose revenues are largely derived from commissions. We derive a substantial majority of our revenues from wealth management fees for investment advice, financial and tax planning, consulting, tax return preparation, family office services and other services. We also generate other revenues primarily from recordkeeping and administration service fees, commissions and distribution fees and outsourced services.
Since we began revenue‑generating and acquisition activities in 2006, we have created a partnership of over 60 partner firms, the substantial majority of which are RIAs registered with the SEC and built a business with revenues in excess of $1.2 billion for the year ended December 31, 2019. For the year ended December 31, 2019, in excess of 95% of our revenues were fee‑based and recurring in nature. We have established a national footprint across the United States and expanded our international footprint into the United Kingdom, Canada and Australia.
Sources of Revenue
Our partner firms provide comprehensive wealth management services through a largely recurring, fee‑based model. We derive a substantial majority of our revenue from wealth management fees, which are comprised of fees earned from wealth management services, including investment advice, financial and tax planning, consulting, tax return preparation, family office services and other services. Fees are primarily based either on a contractual percentage of the client’s assets, a flat fee, an hourly rate or a combination of such fees and are billed either in advance or arrears on a monthly, quarterly or semiannual basis. In certain cases, such wealth management fees may be subject to minimum fee levels depending on the services performed. We also generate other revenues, which primarily include recordkeeping and administration service fees, commissions and distribution fees and outsourced services. The following table summarizes our sources of revenue:
|
|
|
Year Ended December 31, |
|
|||||||||||||
|
|
|
2017 |
|
2018 |
|
2019 |
|
|||||||||
|
|
|
|
|
|
% of Total |
|
|
|
|
% of Total |
|
|
|
|
% of Total |
|
|
|
|
Revenues |
|
Revenues |
|
Revenues |
|
Revenues |
|
Revenues |
|
Revenues |
|
|||
|
|
|
(dollars in thousands) |
|
|||||||||||||
|
Wealth management fees |
|
$ |
617,124 |
|
93.1 |
% |
$ |
853,033 |
|
93.6 |
% |
$ |
1,149,655 |
|
94.4 |
% |
|
Other |
|
|
45,763 |
|
6.9 |
% |
|
57,847 |
|
6.4 |
% |
|
68,686 |
|
5.6 |
% |
|
Total revenues |
|
$ |
662,887 |
|
100.0 |
% |
$ |
910,880 |
|
100.0 |
% |
$ |
1,218,341 |
|
100.0 |
% |
During the years ended December 31, 2017, 2018 and 2019, our wealth management fees were impacted by the acquisitions of new partner firms and the growth of existing partner firms, which includes the acquisitions of wealth management practices and customer lists by our existing partner firms. In 2017, 2018 and 2019, we completed acquisitions of ten, eight and six partner firms, respectively. In 2017, the new partner firms were Crestwood Advisors, CFO4Life, One Charles Private Wealth, Bordeaux Wealth Advisors, Gelfand, Rennert & Feldman, Lake Street Advisors, Financial Professionals, SCS Financial Services, Brownlie & Braden and Eton Advisors. In 2018, the new partner firms were Cornerstone Wealth, Fortem Financial, Bartlett Wealth Management, Campbell Deegan Financial, Nigro Karlin Segal Feldstein & Bolno, Asset Advisors Investment Management, Edge Capital Group and Vista Wealth Management. In 2019, the new partner firms were Altman Greenfield & Selvaggi, Prime Quadrant, Foster Dykema & Cabot, Escala Partners, Sound View Wealth Advisors and Williams Jones.
In 2017, 2018 and 2019, our partner firms completed 15, 17 and 28 transactions, respectively, consisting of business acquisitions accounted for in accordance with Accounting Standard Codification (“ASC”) Topic 805: Business Combinations and asset acquisitions.
See Note 5 to our consolidated financial statements for additional information about our acquisitions.
43
For the year ended December 31, 2019, in excess of 95% of our revenues were fee‑based and recurring in nature. Although the substantial majority of our revenues are fee‑based and recurring, our revenues can fluctuate due to macroeconomic factors and the overall state of the financial markets, particularly in the United States. Our partner firms’ wealth management fees are primarily based either on a contractual percentage of the client’s assets, a flat fee, an hourly rate or a combination of such fees and are billed either in advance or arrears on a monthly, quarterly or semiannual basis. Because of the variety of billing practices across our partner firms, the timing of any impact of short‑term financial market movements on revenues will vary. We estimate that approximately 29% of our revenues for the year ended December 31, 2019 were not directly correlated to the financial markets. Of the 71% of our revenues that were directly correlated to the financial markets, primarily equities and fixed income, for the year ended December 31, 2019, we estimate that approximately 70% of such revenues were generated from advance billings. We estimate that approximately 29% of our revenues for the three months ended December 31, 2019 were not directly correlated to the financial markets. Of the 71% of our revenues that were directly correlated to the financial markets, primarily equities and fixed income, for the three months ended December 31, 2019, we estimate that approximately 70% of such revenues were generated from advance billings. These revenues are impacted by market movements and generally result in a one quarter lagged effect on our revenues. Longer term trends in the financial markets may favorably or unfavorably impact our total revenues, but not in a linear relationship. For example, during 2017, 2018 and 2019, the Standard & Poor’s 500 Index had a total return of 21.8%, (4.4)% and 31.5%, respectively, and the Barclays U.S. Aggregate Bond Index had a total return for the same periods of 3.5%, 0.0% and 8.7% respectively. By comparison, for the same periods our organic revenue growth was 13.4%, 13.0% and 15.1%, respectively. For additional information, please read “—How We Evaluate our Business.”
Operating Expenses
Our operating expenses consist of compensation and related expenses, management fees, selling, general and administrative expenses, management contract buyout, intangible amortization, non‑cash changes in fair value of estimated contingent consideration and depreciation and other amortization expense.
Compensation and Related Expenses
Compensation and related expenses include salaries, wages, related employee benefits and taxes for employees at our partner firms and employees at the Focus LLC company level. Compensation and related expenses also include non‑cash compensation expense, associated with both Focus Inc.’s and Focus LLC’s equity grants to employees and non‑employees, including management company principals.
Management Fees
While we have to date, with limited exceptions, acquired substantially all of the assets of a target firm, following our acquisition of a new partner firm, the partner firm continues to be primarily managed by its principals through their 100% ownership of a new management company formed by them concurrently with the acquisition. Our operating subsidiary, the management company and the principals enter into a management agreement that provides for the payment of ongoing management fees to the management company. The terms of the management agreements are generally six years subject to automatic renewals for consecutive one‑year terms, unless earlier terminated by either the management company or us in certain limited situations. Under the management agreement, the management company is entitled to management fees typically consisting of all EBPC in excess of Base Earnings up to Target Earnings, plus a percentage of EBPC in excess of Target Earnings.
We retain a cumulative preferred position in Base Earnings. To the extent earnings of an acquired business in any year are less than Base Earnings, in the following year we are entitled to receive Base Earnings together with the prior years’ shortfall before any management fees are earned by the management company.
The following table provides an illustrative example of our economics, including management fees earned by the management company, for periods of projected revenues, +10% growth in revenues and −10% growth in revenues. This example assumes (i) Target Earnings of $3.0 million; (ii) Base Earnings acquired of 60% of Target Earnings or
44
$1.8 million; and (iii) a percentage of earnings in excess of Target Earnings retained by the management company of 40%.
|
|
|
|
|
|
|
|
|
|
|
|
|
|
|
|
|
Projected |
|
+10% Growth in |
|
−10% Growth |
|
|||
|
|
|
|
Revenues |
|
Revenues |
|
in Revenues |
|
|||
|
|
|
|
(in thousands) |
|
|||||||
|
|
New Partner Firm |
|
|
|
|
|
|
|
|
|
|
|
|
New partner firm revenues |
|
$ |
5,000 |
|
$ |
5,500 |
|
$ |
4,500 |
|
|
|
Less: |
|
|
|
|
|
|
|
|
|
|
|
|
Operating expenses (excluding management fees) |
|
|
(2,000) |
|
|
(2,000) |
|
|
(2,000) |
|
|
|
EBPC |
|
$ |
3,000 |
|
$ |
3,500 |
|
$ |
2,500 |
|
|
|
Base Earnings to Focus Inc. (60%) |
|
|
1,800 |
|
|
1,800 |
|
|
1,800 |
|
|
|
Management fees to management company (40%) |
|
|
1,200 |
|
|
1,200 |
|
|
700 |
|
|
|
EBPC in excess of Target Earnings: |
|
|
|
|
|
|
|
|
|
|
|
|
To Focus Inc. (60%) |
|
|
— |
|
|
300 |
|
|
— |
|
|
|
To management company as management fees (40%) |
|
|
— |
|
|
200 |
|
|
— |
|
|
|
Focus Inc. |
|
|
|
|
|
|
|
|
|
|
|
|
Focus Inc. revenues |
|
$ |
5,000 |
|
$ |
5,500 |
|
$ |
4,500 |
|
|
|
Less: |
|
|
|
|
|
|
|
|
|
|
|
|
Operating expenses (excluding management fees) |
|
|
(2,000) |
|
|
(2,000) |
|
|
(2,000) |
|
|
|
Less: |
|
|
|
|
|
|
|
|
|
|
|
|
Management fees to management company |
|
|
(1,200) |
|
|
(1,400) |
|
|
(700) |
|
|
|
Operating income |
|
$ |
1,800 |
|
$ |
2,100 |
|
$ |
1,800 |
|
|
|
|
|
|
|
|
|
|
|
|
|
|
As a result of our economic arrangements with the various management company entities, 100% of management fees are variable expenses.
Selling, General and Administrative
Selling, general and administrative expenses include rent, insurance premiums, professional fees, travel and entertainment and other costs.
Management Contract Buyout
Management contract buyout represents cash consideration to buyout a management agreement with one of our retiring principals whereby the business operations of the relevant partner firm were transitioned to one of our other partner firms.
Intangible Amortization
Amortization of intangibles consists primarily of the amortization of intangibles we acquired through our various acquisitions of new partner firms and acquisitions by our partner firms.
Non‑Cash Changes in Fair Value of Estimated Contingent Consideration
We have typically incorporated into our acquisition structure contingent consideration paid to the sellers upon the satisfaction of specified financial thresholds, and the purchase price for a typical acquisition is comprised of a base purchase price and the right to receive such contingent consideration in the form of earn out payments. The contingent consideration for acquisitions of new partner firms is generally paid over a six-year period upon the satisfaction of
45
specified growth thresholds, in years three and six. These growth thresholds are typically tied to the compounded annual growth rate (“CAGR”) of the partner firm’s earnings. Such growth thresholds can be set annually over the six-year period as well. The contingent consideration for acquisitions made by our partner firms is paid upon the satisfaction of specified financial thresholds, which are typically annually. These thresholds are generally tied to revenue as adjusted for certain criteria or other operating metrics based on the retention or growth of the business acquired. These arrangements may result in the payment of additional purchase price consideration to the sellers for periods following the closing of an acquisition. Contingent consideration payments are typically payable in cash and, in some cases, equity.
For business acquisitions, we recognize the fair value of estimated contingent consideration at the acquisition date as part of the consideration transferred in exchange for substantially all of the assets of the wealth management firm. The contingent consideration is remeasured to fair value at each reporting date until the contingency is resolved. Any changes in fair value are recognized each reporting period in non‑cash changes in fair value of estimated contingent consideration in our consolidated statements of operations.
Depreciation and Other Amortization
Depreciation and other amortization expense primarily represents the benefits we received from using long‑lived assets such as computers and equipment, leasehold improvements and furniture and fixtures. Those assets primarily consist of purchased fixed assets as well as fixed assets acquired through our acquisitions.
Business Acquisitions
We completed 23, 19 and 31 business acquisitions during the years ended December 31, 2017, 2018 and 2019, respectively, consisting of both new partner firms and acquisitions by our partner firms. Such business acquisitions were accounted for in accordance with ASC Topic 805: Business Combinations.
The purchase price is comprised of a base purchase price and a right to receive contingent consideration in the form of earn out payments. The base purchase price typically consists of an upfront cash payment and may include equity. The contingent consideration for acquisitions of new partner firms generally consists of earn outs over a six year period following the closing, with payment upon the satisfaction of specified growth thresholds in years three and six. The growth thresholds are typically tied to the CAGR of the partner firm’s earnings. Such growth thresholds can be set annually over the six-year period as well. The contingent consideration for acquisitions made by our partner firms generally is earned upon the satisfaction of specified financial thresholds, typically annually. These thresholds are generally tied to revenue as adjusted for certain criteria or other operating metrics based on the retention or growth of the business acquired. The contingent consideration is typically payable in cash and, in some cases, equity.
The following table summarizes our business acquisitions for the years ended December 31, 2017, 2018 and 2019 (dollars in thousands):
|
|
|
2017 |
|
2018 |
|
2019 |
|||
|
Number of business acquisitions closed |
|
|
23 |
|
|
19 |
|
|
31 |
|
Consideration: |
|
|
|
|
|
|
|
|
|
|
Cash and option premium |
|
$ |
362,524 |
|
$ |
408,478 |
|
$ |
507,498 |
|
Cash due subsequent to closing at net present value and estimated working capital adjustment |
|
|
188 |
|
|
39,134 |
|
|
4,341 |
|
Fair market value of Focus LLC common units issued |
|
|
64,728 |
|
|
51,456 |
|
|
— |
|
Fair market value of Class A common stock issued |
|
|
— |
|
|
112,461 |
|
|
— |
|
Fair market value of estimated contingent consideration |
|
|
37,551 |
|
|
42,086 |
|
|
82,781 |
|
Total consideration |
|
$ |
464,991 |
|
$ |
653,615 |
|
$ |
594,620 |
In addition, we completed two, six and three acquisitions during the years ended December 31, 2017, 2018 and 2019, respectively, that did not meet the definition of a business under ASC Topic 805: Business Combinations. These acquisitions primarily related to the acquisition of customer lists.
46
Substantially all of our acquisitions have been paid for with a combination of cash flow from operations, proceeds from the IPO, proceeds from borrowings under our Credit Facility and equity, valued at the then‑fair market value.
Recent Developments
From January 1, 2020 to February 25, 2020, we completed 2 business acquisitions (accounted for in accordance with ASC Topic 805: Business Combinations) and 2 asset acquisitions, consisting of a new partner firm and acquisitions by our partner firms. The Acquired Base Earnings associated with the acquisition of the new partner firm during this period was approximately $3.2 million. Furthermore, we have signed a definitive purchase agreement to acquire an additional partner firm with associated Acquired Base Earnings of approximately $1.0 million. This pending transaction is generally on terms and in a structure consistent with past transactions, and the closings are subject to customary closing conditions. Among other risks and uncertainties, there can be no guarantee that these acquisitions will be completed.
How We Evaluate Our Business
We focus on several key financial metrics in evaluating the success of our business, the success of our partner firms and our resulting financial position and operating performance. Key metrics include the following:
|
|
|
|
|
|
|
|
|
|
|
|
|
|
|
Year Ended December 31, |
|
|||||||
|
|
|
2017 |
|
2018 |
|
2019 |
|
|||
|
|
|
(dollars in thousands, except per share data) |
|
|||||||
|
Revenue Metrics: |
|
|
|
|
|
|
|
|
|
|
|
Revenues |
|
$ |
662,887 |
|
$ |
910,880 |
|
$ |
1,218,341 |
|
|
Revenue growth (1) from prior period |
|
|
36.6 |
% |
|
37.4 |
% |
|
33.8 |
% |
|
Organic revenue growth (2) from prior period |
|
|
13.4 |
% |
|
13.0 |
% |
|
15.1 |
% |
|
Management Fees Metrics (operating expense): |
|
|
|
|
|
|
|
|
|
|
|
Management fees |
|
$ |
163,617 |
|
$ |
232,703 |
|
$ |
304,701 |
|
|
Management fees growth (3) from prior period |
|
|
42.5 |
% |
|
42.2 |
% |
|
30.9 |
% |
|
Organic management fees growth (4) from prior period |
|
|
23.0 |
% |
|
14.3 |
% |
|
10.2 |
% |
|
Adjusted EBITDA Metrics: |
|
|
|
|
|
|
|
|
|
|
|
Adjusted EBITDA (5) |
|
$ |
145,226 |
|
$ |
203,402 |
|
$ |
269,834 |
|
|
Adjusted EBITDA growth (5) from prior period |
|
|
40.9 |
% |
|
40.1 |
% |
|
32.7 |
% |
|
Adjusted Net Income Metrics: |
|
|
|
|
|
|
|
|
|
|
|
Adjusted Net Income (5) |
|
$ |
86,701 |
|
$ |
125,348 |
|
$ |
178,578 |
|
|
Adjusted Net Income growth (5) from prior period |
|
|
26.4 |
% |
|
44.6 |
% |
|
42.5 |
% |
|
Adjusted Net Income Per Share Metrics: |
|
|
|
|
|
|
|
|
|
|
|
Adjusted Net Income Per Share (5) |
|
$ |
1.21 |
|
$ |
1.74 |
|
$ |
2.38 |
|
|
Adjusted Net Income Per Share growth (5) from prior period |
|
|
26.4 |
% |
|
43.8 |
% |
|
36.8 |
% |
|
Adjusted Shares Outstanding (5) |
|
|
71,843,916 |
|
|
71,960,540 |
|
|
75,039,357 |
|
|
Other Metrics: |
|
|
|
|
|
|
|
|
|
|
|
Net Leverage Ratio (6) at period end |
|
|
5.60x |
|
|
3.33x |
|
|
4.00x |
|
|
Acquired Base Earnings (7) |
|
$ |
44,191 |
|
$ |
37,750 |
|
$ |
35,138 |
|
|
Number of partner firms at period end (8) |
|
|
51 |
|
|
58 |
|
|
63 |
|
|
(1) |
Represents period‑over‑period growth in our GAAP revenue. |
|
(2) |
Organic revenue growth represents the period‑over‑period growth in revenue related to partner firms, including growth related to acquisitions of wealth management practices and customer relationships by our partner firms and partner firms that have merged, that for the entire periods presented, are included in our consolidated statements of operations for each of the entire periods presented. We believe these growth statistics are useful in that they present full‑period revenue growth of partner firms on a “same store” basis exclusive of the effect of the partial results of partner firms that are acquired during the comparable periods. |
47
|
(3) |
The terms of our management agreements entitle the management companies to management fees typically consisting of all EBPC in excess of Base Earnings up to Target Earnings, plus a percentage of any EBPC in excess of Target Earnings. Management fees growth represents the period‑over‑period growth in GAAP management fees earned by management companies. While an expense, we believe that growth in management fees reflect the strength of the partnership. |
|
(4) |
Organic management fees growth represents the period‑over‑period growth in management fees earned by management companies related to partner firms, including growth related to acquisitions of wealth management practices and customer relationships by our partner firms and partner firms that have merged, that for the entire periods presented, are included in our consolidated statements of operations for each of the entire periods presented. We believe that these growth statistics are useful in that they present full‑period growth of management fees on a “same store” basis exclusive of the effect of the partial period results of partner firms that are acquired during the comparable periods. |
|
(5) |
For additional information regarding Adjusted EBITDA, Adjusted Net Income, Adjusted Net Income Per Share and Adjusted Shares Outstanding, including a reconciliation of Adjusted EBITDA, Adjusted Net Income and Adjusted Net Income Per Share to the most directly comparable GAAP financial measure, please read “—Adjusted EBITDA” and “—Adjusted Net Income and Adjusted Net Income Per Share.” |
|
(6) |
Net Leverage Ratio represents the First Lien Leverage Ratio (as defined in the Credit Facility), and means the ratio of amounts outstanding under the First Lien Term Loan and First Lien Revolver plus other outstanding debt obligations secured by a lien on the assets of Focus LLC (excluding letters of credit other than unpaid drawings thereunder) minus unrestricted cash and cash equivalents to Consolidated EBITDA (as defined in the Credit Facility). |
|
(7) |
The terms of our management agreements entitle the management companies to management fees typically consisting of all future EBPC of the acquired wealth management firm in excess of Base Earnings up to Target Earnings, plus a percentage of any EBPC in excess of Target Earnings. Acquired Base Earnings is equal to our retained cumulative preferred position in Base Earnings. We are entitled to receive these earnings notwithstanding any earnings that we are entitled to receive in excess of Target Earnings. Base Earnings may change in future periods for various business or contractual matters. For example, from time to time when a partner firm consummates an acquisition, the management agreement among the partner firm, the management company and the principals is amended to adjust Base Earnings and Target Earnings to reflect the projected post‑acquisition earnings of the partner firm. |
|
(8) |
Represents the number of partner firms on the last day of the period presented. The number includes new partner firms acquired during the period reduced by any partner firms that merged with existing partner firms prior to the last day of the period. |
Adjusted EBITDA
Adjusted EBITDA is a non‑GAAP measure. Adjusted EBITDA is defined as net income (loss) excluding interest income, interest expense, income tax expense (benefit), amortization of debt financing costs, intangible amortization, depreciation and other amortization, non‑cash equity compensation expense, non‑cash changes in fair value of estimated contingent consideration, gain on sale of investment, loss on extinguishment of borrowings, other expense/income, net, impairment of equity method investment, management contract buyout, delayed offering cost expense, and other one‑time transaction expenses. We believe that Adjusted EBITDA, viewed in addition to and not in lieu of, our reported GAAP results, provides additional useful information to investors regarding our performance and overall results of operations for various reasons, including the following:
|
· |
non‑cash equity grants made to employees or non‑employees at a certain price and point in time do not necessarily reflect how our business is performing at any particular time; stock‑based compensation expense is not a key measure of our operating performance; |
48
|
· |
contingent consideration or earn outs can vary substantially from company to company and depending upon each company’s growth metrics and accounting assumption methods; the non‑cash changes in fair value of estimated contingent consideration is not considered a key measure in comparing our operating performance; and |
|
· |
amortization expenses can vary substantially from company to company and from period to period depending upon each company’s financing and accounting methods, the fair value and average expected life of acquired intangible assets and the method by which assets were acquired; the amortization of intangible assets obtained in acquisitions are not considered a key measure in comparing our operating performance. |
We use Adjusted EBITDA:
|
· |
as a measure of operating performance; |
|
· |
for planning purposes, including the preparation of budgets and forecasts; |
|
· |
to allocate resources to enhance the financial performance of our business; and |
|
· |
to evaluate the effectiveness of our business strategies. |
Adjusted EBITDA does not purport to be an alternative to net income (loss) or cash flows from operating activities. The term Adjusted EBITDA is not defined under GAAP, and Adjusted EBITDA is not a measure of net income (loss), operating income or any other performance or liquidity measure derived in accordance with GAAP. Therefore, Adjusted EBITDA has limitations as an analytical tool and should not be considered in isolation or as a substitute for analysis of our results as reported under GAAP. Some of these limitations are:
|
· |
Adjusted EBITDA does not reflect all cash expenditures, future requirements for capital expenditures or contractual commitments; |
|
· |
Adjusted EBITDA does not reflect changes in, or cash requirements for, working capital needs; and |
|
· |
Adjusted EBITDA does not reflect the interest expense on our debt or the cash requirements necessary to service interest or principal payments. |
In addition, Adjusted EBITDA can differ significantly from company to company depending on strategic decisions regarding capital structure, the tax jurisdictions in which companies operate and capital investments. We compensate for these limitations by also relying on the GAAP results and using Adjusted EBITDA as supplemental information.
49
Set forth below is a reconciliation of net loss to Adjusted EBITDA:
|
|
|
|
|
|
|
|
|
|
|
|
|
|
Year Ended December 31, |
|||||||
|
|
|
2017 |
|
2018 |
|
2019 |
|||
|
|
|
(in thousands) |
|||||||
|
Net loss |
|
$ |
(48,359) |
|
$ |
(41,087) |
|
$ |
(12,025) |
|
Interest income |
|
|
(222) |
|
|
(1,266) |
|
|
(1,164) |
|
Interest expense |
|
|
41,861 |
|
|
56,448 |
|
|
58,291 |
|
Income tax expense (benefit) |
|
|
(1,501) |
|
|
9,450 |
|
|
7,049 |
|
Amortization of debt financing costs |
|
|
4,084 |
|
|
3,498 |
|
|
3,452 |
|
Intangible amortization |
|
|
64,367 |
|
|
90,381 |
|
|
130,718 |
|
Depreciation and other amortization |
|
|
6,686 |
|
|
8,370 |
|
|
10,675 |
|
Non‑cash equity compensation expense |
|
|
34,879 |
|
|
44,468 |
|
|
18,329 |
|
Non‑cash changes in fair value of estimated contingent consideration |
|
|
22,294 |
|
|
6,638 |
|
|
38,797 |
|
Gain on sale of investment |
|
|
— |
|
|
(5,509) |
|
|
— |
|
Loss on extinguishment of borrowings |
|
|
8,106 |
|
|
21,071 |
|
|
— |
|
Other expense (income), net |
|
|
3,191 |
|
|
2,350 |
|
|
1,049 |
|
Impairment of equity method investment |
|
|
— |
|
|
— |
|
|
11,749 |
|
Management contract buyout |
|
|
— |
|
|
— |
|
|
1,428 |
|
Delayed offering cost expense |
|
|
9,840 |
|
|
— |
|
|
— |
|
Other one‑time transaction expenses |
|
|
— |
|
|
8,590 |
|
|
1,486 |
|
Adjusted EBITDA |
|
$ |
145,226 |
|
$ |
203,402 |
|
$ |
269,834 |
Adjusted Net Income and Adjusted Net Income Per Share
We analyze our performance using Adjusted Net Income and Adjusted Net Income Per Share. Adjusted Net Income and Adjusted Net Income Per Share are non‑GAAP measures. We define Adjusted Net Income as net income (loss) excluding income tax expense (benefit), amortization of debt financing costs, intangible amortization, non‑cash equity compensation expense, non‑cash changes in fair value of estimated contingent consideration, gain on sale of investment, loss on extinguishment of borrowings, impairment of equity method investment, delayed offering cost expense, management contract buyout, and other one‑time transaction expenses. The calculation of Adjusted Net Income also includes adjustments to reflect (i) a pro forma 27% income tax rate assuming all earnings of Focus LLC were recognized by Focus Inc. and no earnings were attributable to non‑controlling interests and (ii) tax adjustments from intangible asset related income tax benefits from acquisitions based on a pro forma 27% tax rate.
Adjusted Net Income Per Share for the year ended December 31, 2018 and 2019 is calculated by dividing Adjusted Net Income by the Adjusted Shares Outstanding. Adjusted Shares Outstanding for the year ended December 31, 2018 and 2019 includes: (i) the weighted average shares of Class A common stock outstanding during the period, (ii) the weighted average incremental shares of Class A common stock related to stock options and unvested Class A common stock, and for the year ended December 31, 2019 restricted stock units, outstanding during the period, (iii) the weighted average number of Focus LLC common units outstanding during the period (assuming that 100% of such Focus LLC common units have been exchanged for Class A common stock) and (iv) the weighted average number of common unit equivalents of Focus LLC vested and unvested incentive units outstanding during the period based on the closing price of our Class A common stock on the last trading day of the period (assuming that 100% of such Focus LLC common units have been exchanged for Class A common stock).
Adjusted Net Income Per Share for the year ended December 31, 2017 is calculated by dividing Adjusted Net Income by the Adjusted Shares Outstanding. Adjusted Shares Outstanding for the year ended December 31, 2017 was 71,843,916 and includes all vested and unvested shares of Class A common stock issued in connection with the IPO and Reorganization Transactions, assumes that all vested non‑compensatory stock options and unvested compensatory stock options outstanding at the closing of the IPO have been exercised (assuming vesting of unvested compensatory stock options and a then‑current value of the Class A common stock equal to the $33.00 IPO price) and assumes that 100% of the Focus LLC common units and vested and unvested incentive units outstanding at the closing of the IPO have been
50
exchanged for Class A common stock (assuming vesting of the unvested incentive units and a then‑current value of the Focus LLC common units equal to the $33.00 IPO price).
We believe that Adjusted Net Income and Adjusted Net Income Per Share, viewed in addition to and not in lieu of, our reported GAAP results, provide additional useful information to investors regarding our performance and overall results of operations for various reasons, including the following:
|
· |
non‑cash equity grants made to employees or non‑employees at a certain price and point in time do not necessarily reflect how our business is performing at any particular time; stock‑based compensation expense is not a key measure of our operating performance; |
|
· |
contingent consideration or earn outs can vary substantially from company to company and depending upon each company’s growth metrics and accounting assumption methods; the non‑cash changes in fair value of estimated contingent consideration is not considered a key measure in comparing our operating performance; and |
|
· |
amortization expenses can vary substantially from company to company and from period to period depending upon each company’s financing and accounting methods, the fair value and average expected life of acquired intangible assets and the method by which assets were acquired; the amortization of intangible assets obtained in acquisitions are not considered a key measure in comparing our operating performance. |
Adjusted Net Income and Adjusted Net Income Per Share do not purport to be an alternative to net income (loss) or cash flows from operating activities. The terms Adjusted Net Income and Adjusted Net Income Per Share are not defined under GAAP, and Adjusted Net Income and Adjusted Net Income Per Share are not a measure of net income (loss), operating income or any other performance or liquidity measure derived in accordance with GAAP. Therefore, Adjusted Net Income and Adjusted Net Income Per Share have limitations as an analytical tool and should not be considered in isolation or as a substitute for analysis of our results as reported under GAAP. Some of these limitations are:
|
· |
Adjusted Net Income and Adjusted Net Income Per Share do not reflect all cash expenditures, future requirements for capital expenditures or contractual commitments; |
|
· |
Adjusted Net Income and Adjusted Net Income Per Share do not reflect changes in, or cash requirements for, working capital needs; and |
|
· |
Other companies in the financial services industry may calculate Adjusted Net Income and Adjusted Net Income Per Share differently than we do, limiting its usefulness as a comparative measure. |
In addition, Adjusted Net Income and Adjusted Net Income Per Share can differ significantly from company to company depending on strategic decisions regarding capital structure, the tax jurisdictions in which companies operate and capital investments. We compensate for these limitations by relying also on the GAAP results and use Adjusted Net Income and Adjusted Net Income Per Share as supplemental information.
51
Set forth below is a reconciliation of net loss to Adjusted Net Income and Adjusted Net Income Per Share:
|
|
|
Year Ended December 31, |
|||||||
|
|
|
2017 |
|
2018 |
|
2019 |
|||
|
|
|
(dollars in thousands, except per share data) |
|||||||
|
Net loss |
|
$ |
(48,359) |
|
$ |
(41,087) |
|
$ |
(12,025) |
|
Income tax expense (benefit) |
|
|
(1,501) |
|
|
9,450 |
|
|
7,049 |
|
Amortization of debt financing costs |
|
|
4,084 |
|
|
3,498 |
|
|
3,452 |
|
Intangible amortization |
|
|
64,367 |
|
|
90,381 |
|
|
130,718 |
|
Non‑cash equity compensation expense |
|
|
34,879 |
|
|
44,468 |
|
|
18,329 |
|
Non‑cash changes in fair value of estimated contingent consideration |
|
|
22,294 |
|
|
6,638 |
|
|
38,797 |
|
Gain on sale of investment |
|
|
— |
|
|
(5,509) |
|
|
— |
|
Loss on extinguishment of borrowings |
|
|
8,106 |
|
|
21,071 |
|
|
— |
|
Impairment of equity method investment |
|
|
— |
|
|
— |
|
|
11,749 |
|
Delayed offering cost expense |
|
|
9,840 |
|
|
— |
|
|
— |
|
Management contract buyout |
|
|
— |
|
|
— |
|
|
1,428 |
|
Other one‑time transaction expenses(1) |
|
|
2,843 |
|
|
11,529 |
|
|
1,486 |
|
Subtotal |
|
|
96,553 |
|
|
140,439 |
|
|
200,983 |
|
Pro forma income tax expense (27%)(2) |
|
|
(26,069) |
|
|
(37,919) |
|
|
(54,265) |
|
Tax Adjustments(2)(3) |
|
|
16,217 |
|
|
22,828 |
|
|
31,860 |
|
Adjusted Net Income |
|
$ |
86,701 |
|
$ |
125,348 |
|
$ |
178,578 |
|
Adjusted Shares Outstanding(4) |
|
|
71,843,916 |
|
|
71,960,540 |
|
|
75,039,357 |
|
Adjusted Net Income Per Share |
|
$ |
1.21 |
|
$ |
1.74 |
|
$ |
2.38 |
|
Calculation of Adjusted Shares Outstanding(4): |
|
|
|
|
|
|
|
|
|
|
Weighted average shares of Class A common stock outstanding—basic(5) |
|
|
— |
|
|
43,122,782 |
|
|
46,792,389 |
|
Adjustments: |
|
|
|
|
|
|
|
|
|
|
Shares of Class A common stock issued in connection with the IPO and Reorganization Transactions (6) |
|
|
42,529,651 |
|
|
— |
|
|
— |
|
Weighted average incremental shares of Class A common stock related to stock options and unvested Class A common stock and restricted stock units(7) |
|
|
— |
|
|
102,549 |
|
|
20,428 |
|
Weighted average Focus LLC common units outstanding(8) |
|
|
22,499,665 |
|
|
22,630,668 |
|
|
22,424,378 |
|
Weighted average common unit equivalent of Focus LLC incentive units outstanding(9) |
|
|
6,814,600 |
|
|
6,104,541 |
|
|
5,802,162 |
|
Adjusted Shares Outstanding(4) |
|
|
71,843,916 |
|
|
71,960,540 |
|
|
75,039,357 |
|
(1) |
In 2017, relates to one‑time transaction expenses, which were recorded in other (expense) income‑net, related to insurance fees associated with the investment by our private equity investors. In 2018, primarily relates to one‑time expenses related to (a) Loring Ward severance cash compensation of $507 during the three months ended December 31, 2018, which was recorded in compensation and related expenses, and IPO and Reorganization Transaction cash compensation expenses of $5,926 during the three months ended September 30, 2018, which were recorded in compensation and related expenses, (b) transaction expenses of $1,762, which were recorded in selling, general and administrative expenses, associated with the acquisition of Loring Ward, of which $1,114 were incurred during the three months ended December 31, 2018 and $648 were incurred during the three months ended September 30, 2018 and (c) other expenses, net of $2,373 during the three months ended December 31, 2018, which were recorded in other (expense) income‑net, primarily related to the loss on sale of a tax customer list and related receivables. In 2019, relates to one time expenses related to (a) Loring Ward severance cash compensation of $280 during the three months ended March 31, 2019, which were recorded in compensation and related expenses and (b) transaction expenses of $786 and $420, associated with the acquisition of Loring Ward, which were recorded in selling, general and administrative expenses during the three months ended March 31, 2019 and June 30, 2019, respectively. |
|
(2) |
For periods ended prior to the closing of the IPO and the consummation of the Reorganization Transactions on July 30, 2018, certain tax related adjustments are being made for comparative purposes only. |
52
|
(3) |
As of December 31, 2019, the estimated tax adjustments from intangible asset related income tax benefits from closed acquisitions based on a pro forma 27% tax rate for the next 12 months is approximately $35,017. |
|
(4) |
For periods ended prior to the closing of the IPO and the consummation of the Reorganization Transactions on July 30, 2018, the Adjusted Shares Outstanding are deemed to be outstanding for comparative purposes only. |
|
(5) |
Represents our GAAP weighted average Class A common stock outstanding—basic. |
|
(6) |
The issuance of Class A common stock that occurred upon closing of the IPO and the consummation of the Reorganization Transactions on July 30, 2018 is assumed to have occurred as of January 1, 2017 for comparative purposes. |
|
(7) |
The incremental shares for the year ended December 31, 2018 and 2019 related to stock options and unvested Class A common stock and restricted stock units as calculated using the treasury stock method were not included in the calculation of weighted average shares of Class A common stock—diluted as the result would have been anti‑dilutive. |
|
(8) |
Assumes that 100% of the Focus LLC common units were exchanged for Class A common stock. |
|
(9) |
Assumes that 100% of the vested and unvested Focus LLC incentive units were converted into Focus LLC common units based on the closing price of our Class A common stock at the end of the respective period and such Focus LLC common units were exchanged for Class A common stock. For the periods ending prior to July 30, 2018, the conversion to Focus LLC common units was based on the $33.00 IPO price. |
Factors Affecting Comparability
Our future results of operations may not be comparable to our historical results of operations, principally for the following reasons:
Tax Treatment
As a flow‑through entity, Focus LLC is generally not and has not been subject to U.S. federal and certain state income taxes at the entity level, although it has been subject to the New York City Unincorporated Business Tax. Instead, for U.S. federal and certain state income tax purposes, taxable income was and is passed through to its unitholders, which, after the IPO on July 30, 2018, now includes Focus Inc. Focus Inc. is subject to U.S. federal and certain state income taxes applicable to corporations. Accordingly, our effective tax rate, and the absolute dollar amount of our tax expense, has increased as a result of the IPO.
Public Company Expenses
Our operating expenses have increased as a result of being a publicly traded company, including expenses related to annual and quarterly report preparation, tax return preparation, independent auditor fees, investor relations activities, transfer agent fees, incremental director and officer liability insurance costs and independent director compensation. Our accounting, legal, tax and personnel‑related expenses have increased as we supplemented our compliance and governance functions, maintained and reviewed internal controls over financial reporting and prepared and distributed periodic reports as required by the rules and regulations of the SEC.
53
Results of Operations
Year Ended December 31, 2017 Compared to Year Ended December 31, 2018
For a comparison of the years ended December 31, 2017 and 2018, see Part II. Item 7, Management’s Discussion and Analysis of Financial Condition and Results of Operations, in our Form 10-K for the year ended December 31, 2018.
Year Ended December 31, 2018 Compared to Year Ended December 31, 2019
The following discussion presents an analysis of our results of operations for the years ended December 31, 2018 and 2019. Where appropriate, we have identified specific events and changes that affect comparability or trends and, where possible and practical, have quantified the impact of such items.
|
|
|
Year Ended |
|
|
|
|
|
|
||||
|
|
|
December 31, |
|
|
|
|
|
|
||||
|
|
|
2018 |
|
2019 |
|
$ Change |
|
% Change |
|
|||
|
|
|
(dollars in thousands) |
|
|||||||||
|
Revenues: |
|
|
|
|
|
|
|
|
|
|
|
|
|
Wealth management fees |
|
$ |
853,033 |
|
$ |
1,149,655 |
|
$ |
296,622 |
|
34.8 |
% |
|
Other |
|
|
57,847 |
|
|
68,686 |
|
|
10,839 |
|
18.7 |
% |
|
Total revenues |
|
|
910,880 |
|
|
1,218,341 |
|
|
307,461 |
|
33.8 |
% |
|
Operating expenses: |
|
|
|
|
|
|
|
|
|
|
|
|
|
Compensation and related expenses |
|
|
358,084 |
|
|
431,465 |
|
|
73,381 |
|
20.5 |
% |
|
Management fees |
|
|
232,703 |
|
|
304,701 |
|
|
71,998 |
|
30.9 |
% |
|
Selling, general and administrative |
|
|
170,270 |
|
|
232,911 |
|
|
62,641 |
|
36.8 |
% |
|
Management contract buyout |
|
|
— |
|
|
1,428 |
|
|
1,428 |
|
* |
|
|
Intangible amortization |
|
|
90,381 |
|
|
130,718 |
|
|
40,337 |
|
44.6 |
% |
|
Non‑cash changes in fair value of estimated contingent consideration |
|
|
6,638 |
|
|
38,797 |
|
|
32,159 |
|
484.5 |
% |
|
Depreciation and other amortization |
|
|
8,370 |
|
|
10,675 |
|
|
2,305 |
|
27.5 |
% |
|
Total operating expenses |
|
|
866,446 |
|
|
1,150,695 |
|
|
284,249 |
|
32.8 |
% |
|
Income from operations |
|
|
44,434 |
|
|
67,646 |
|
|
23,212 |
|
52.2 |
% |
|
Other income (expense): |
|
|
|
|
|
|
|
|
|
|
|
|
|
Interest income |
|
|
1,266 |
|
|
1,164 |
|
|
(102) |
|
(8.1) |
% |
|
Interest expense |
|
|
(56,448) |
|
|
(58,291) |
|
|
(1,843) |
|
(3.3) |
% |
|
Amortization of debt financing costs |
|
|
(3,498) |
|
|
(3,452) |
|
|
46 |
|
1.3 |
% |
|
Gain on sale of investments |
|
|
5,509 |
|
|
— |
|
|
(5,509) |
|
* |
|
|
Loss on extinguishment of borrowings |
|
|
(21,071) |
|
|
— |
|
|
21,071 |
|
* |
|
|
Other income (expense)—net |
|
|
(2,350) |
|
|
(1,049) |
|
|
1,301 |
|
* |
|
|
Income from equity method investments |
|
|
521 |
|
|
755 |
|
|
234 |
|
* |
|
|
Impairment of equity method investment |
|
|
— |
|
|
(11,749) |
|
|
(11,749) |
|
* |
|
|
Total other expense—net |
|
|
(76,071) |
|
|
(72,622) |
|
|
3,449 |
|
4.5 |
% |
|
Loss before income tax |
|
|
(31,637) |
|
|
(4,976) |
|
|
26,661 |
|
84.3 |
% |
|
Income tax expense |
|
|
9,450 |
|
|
7,049 |
|
|
2,401 |
|
25.4 |
% |
|
Net loss |
|
$ |
(41,087) |
|
$ |
(12,025) |
|
$ |
29,062 |
|
70.7 |
% |
* Not meaningful
Revenues
Wealth management fees increased $296.6 million, or 34.8%, for the year ended December 31, 2019 compared to the year ended December 31, 2018. New partner firms added subsequent to the year ended December 31, 2018 that are included in our results of operations for the year ended December 31, 2019 include Altman Greenfield & Selvaggi,
54
Prime Quadrant, Foster Dykema & Cabot, Escala Partners, Sound View Wealth Advisors and Williams Jones. Additionally, our partner firms completed 28 acquisitions subsequent to the year ended December 31, 2018. The new partner firms contributed approximately $82.4 million in wealth management fees during the year ended December 31, 2019. The balance of the increase of $214.2 million was due to the revenue growth at our existing partner firms associated with wealth management services and partner firm‑level acquisitions as well as a full period of revenue recognized during the year ended December 31, 2019 for partner firms that were acquired during the year ended December 31, 2018.
Other revenues increased $10.8 million, or 18.7%, for the year ended December 31, 2019 compared to the year ended December 31, 2018. The increase related to new partner firms was approximately $2.6 million. The balance of the increase of $8.2 million was due primarily to an increase in outsourced services revenue.
Operating Expenses
Compensation and related expenses increased $73.4 million, or 20.5%, for the year ended December 31, 2019 compared to the year ended December 31, 2018. The increase related to new partner firms was approximately $17.6 million. The balance of the increase of $55.8 million was due to an increase of $81.9 million in salaries and related expense, in part the result of a full period of expense recognized during the year ended December 31, 2019 for partner firms acquired and partner firm-level acquisitions during the year ended December 31, 2018 and partner firm-level acquisitions during the year ended December 31, 2019. The increase was offset in part by a decrease of $26.1 million in non‑cash compensation expense primarily related to the recognition of expenses associated with the modification and vesting of certain Focus LLC common units and incentive units during the year ended December 31, 2018 that occurred in connection with the IPO and Reorganization transactions.
Management fees increased $72.0 million, or 30.9%, for the year ended December 31, 2019 compared to the year ended December 31, 2018. The increase related to the new partner firms was approximately $26.2 million. Management fees are variable and a function of earnings during the period. The balance of the increase of $45.8 million was due to the increase in earnings during the year ended December 31, 2019 compared to the year ended December 31, 2018, in part the result of a full period of earnings recognized during the year ended December 31, 2019 for partner firms acquired and partner firm-level acquisitions during the year ended December 31, 2018, and new partner promotions and partner firm-level acquisitions during the year ended December 31, 2019.
Selling, general and administrative expenses increased $62.6 million, or 36.8%, for the year ended December 31, 2019 compared to the year ended December 31, 2018. The increase related to new partner firms was approximately $16.2 million. The balance of the increase of $46.4 million was in part the result of a full period of expense recognized during the year ended December 31, 2019 for partner firms acquired and partner firm-level acquisitions during the year ended December 31, 2018, and in part due to an increase in expenses related to rent, subadvisory fees, information technology, and travel related to the growth of our existing partner firms and our acquisition of new partner firms, as well as partner firm-level acquisitions during the year ended December 31, 2019.
Management contract buyout of $1.4 million for the year ended December 31, 2019 was related to cash consideration for the buyout of a management agreement with one of our retiring principals whereby the business operations of the relevant partner firm were transitioned to one of our other partner firms.
Intangible amortization increased $40.3 million, or 44.6%, for the year ended December 31, 2019 compared to the year ended December 31, 2018. The increase related to new partner firms was approximately $12.8 million. The balance of the increase of $27.5 million was due in part to a full period of amortization during the year ended December 31, 2019 for partner firms acquired and partner firm-level acquisitions during the year ended December 31, 2018, and in part to partner firm-level acquisitions during the year ended December 31, 2019.
Non‑cash changes in fair value of estimated contingent consideration increased $32.2 million or 484.5%, for the year ended December 31, 2019 compared to the year ended December 31, 2018. During the year ended December 31, 2019 the probability that certain contingent consideration payments would be achieved increased resulting in an increase in the fair value of the contingent consideration liability.
55
Depreciation and other amortization expense increased $2.3 million, or 27.5%, for the year ended December 31, 2019 compared to the year ended December 31, 2018. The increase was primarily related to a full period of depreciation and other amortization for fixed assets acquired in 2018, and partner firm-level acquisitions during the year ended December 31, 2019.
Other income (expense)
Interest expense increased $1.8 million, or 3.3%, for the year ended December 31, 2019 compared to the year ended December 31, 2018. The increase was related to higher average outstanding borrowings under our Credit Facility during the year ended December 31, 2019 due to acquisition activity, offset in part by a decrease in interest expense as a result of the repayment of our $207.0 million Second Lien Term Loan in connection with our IPO in July 2018.
During the year ended December 31, 2018, we recognized a gain on sale of investment of $5.5 million related to an investment in a financial service company previously carried at cost.
During the year ended December 31, 2018, a loss on extinguishment of borrowings of $21.1 million was recognized in connection with the Credit Facility.
During the year ended December 31, 2019, we recognized an impairment of an equity method investment of $11.8 million due to an other-than-temporary decline in the fair value of the investment. This investment contributed $0.3 million and $0.5 million to income from equity method investments during the year ended December 31, 2018 and 2019 respectively.
Income Tax Expense
Income tax expense decreased $2.4 million, or 25.4%, for the year ended December 31, 2019 compared to the year ended December 31, 2018. For the year ended December 31, 2019, we recorded a tax expense of approximately $7.0 million based on the estimated annual effective tax rate of (141.7)%. The estimated annual effective tax rate is primarily related to federal, state and local income taxes imposed on Focus Inc.’s allocable portion of taxable income from Focus LLC as a result of the IPO and Reorganization Transactions.
Liquidity and Capital Resources
Sources of Liquidity
During the year ended December 31, 2019, we met our cash and liquidity needs primarily through cash generated by our operations and borrowings under our Credit Facility. Over the next twelve months, and in the longer term, we expect that our cash and liquidity needs will continue to be met by cash generated by our ongoing operations as well as the Credit Facility, especially for acquisition activities. If our acquisition activity continues at an accelerated pace, or for larger acquisition opportunities, we may decide to issue equity either as consideration or in an offering. For information regarding the Credit Facility, please read “—Credit Facilities.”
Tax Receivable Agreements
In July 2018, in connection with the closing of the IPO, Focus Inc. entered into two Tax Receivable Agreements with the TRA holders. The agreements generally provide for the payment by Focus Inc. to each TRA holder of 85% of the net cash savings, if any, in U.S. federal, state and local income and franchise tax that Focus Inc. actually realizes (computed using simplifying assumptions to address the impact of state and local taxes) or is deemed to realize in certain circumstances in periods after the IPO as a result of certain increases in tax basis and certain tax benefits attributable to imputed interest. Focus Inc. will retain the benefit of the remaining 15% of these cash savings.
The payment obligations under the Tax Receivable Agreements are Focus Inc.’s obligations and not obligations of Focus LLC, and we expect that such payments required to be made under the Tax Receivable Agreements will be substantial. Estimating the amount and timing of payments that may become due under the Tax Receivable Agreements
56
is by its nature imprecise. For purposes of the Tax Receivable Agreements, cash savings in tax generally are calculated by comparing Focus Inc.’s actual tax liability (determined by using the actual applicable U.S. federal income tax rate and an assumed combined state and local income and franchise tax rate) to the amount Focus Inc. would have been required to pay had it not been able to utilize any of the tax benefits subject to the Tax Receivable Agreements. As of December 31, 2019, we expect that future payments to the TRA holders will be $48.4 million, in aggregate. Future payments under the Tax Receivable Agreements in respect of subsequent exchanges will be in addition to this amount.
The actual increases in tax basis, as well as the amount and timing of any payments under the Tax Receivable Agreements, will vary depending upon a number of factors, including the timing of any redemption of units, the price of our Class A common stock at the time of each redemption, the extent to which such redemptions are taxable transactions, the amount of Focus LLC’s assets that consist of equity in entities taxed as corporations at the time of each redemption, the amount and timing of the taxable income we generate in the future, the U.S. federal income tax rates then applicable and the portion of the payments under the Tax Receivable Agreements that constitute imputed interest or give rise to depreciable or amortizable tax basis.
The foregoing amount of expected future payments to TRA holders is merely an estimate and the actual payments could differ materially. It is possible that future transactions or events could increase or decrease the actual tax benefits realized and the corresponding payments under the Tax Receivable Agreements as compared to the foregoing estimates. Moreover, there may be a negative impact on our liquidity if, as a result of timing discrepancies or otherwise, (i) the payments under the Tax Receivable Agreements exceed the actual benefits realized in respect of the tax attributes subject to the Tax Receivable Agreements and/or (ii) distributions to Focus Inc. by Focus LLC are not sufficient to permit Focus Inc. to make payments under the Tax Receivable Agreements after it has paid its taxes and other obligations.
The payments under the Tax Receivable Agreements will not be conditioned upon a TRA holder’s having a continued ownership interest in either Focus Inc. or Focus LLC.
We expect that future unitholders may become party to one or more tax receivable agreements entered into in connection with future acquisitions by Focus LLC or issuances of units of Focus LLC to employees, partners and directors.
Cash Flows
The following table presents information regarding our cash flows and cash and cash equivalents for the year ended December 31, 2018 compared to the year ended December 31, 2019. For information regarding our cash flows and cash and cash equivalents for the year ended December 31, 2017 compared to the year ended December 31, 2018, see Part II. Item 7, Management’s Discussion and Analysis of Financial Condition and Results of Operations, in our Form 10-K for the year ended December 31, 2018:
|
|
|
Year Ended |
|
|
|
|
|
|
||||
|
|
|
December 31, |
|
|
|
|
|
|
||||
|
|
|
2018 |
|
2019 |
|
$ Change |
|
% Change |
|
|||
|
|
|
|
|
|
|
|
|
|
|
|
|
|
|
Cash provided by (used in): |
|
|
|
|
|
|
|
|
|
|
|
|
|
Operating activities |
|
$ |
105,919 |
|
$ |
194,774 |
|
$ |
88,855 |
|
83.9 |
% |
|
Investing activities |
|
|
(446,450) |
|
|
(556,455) |
|
|
(110,005) |
|
(24.6) |
% |
|
Financing activities |
|
|
322,487 |
|
|
393,567 |
|
|
71,080 |
|
22.0 |
% |
|
Cash and cash equivalents—end of period |
|
|
33,213 |
|
|
65,178 |
|
|
31,965 |
|
96.2 |
% |
Operating Activities
Net cash provided by operating activities includes net income (loss) adjusted for non‑cash expenses such as intangible amortization, depreciation and other amortization, amortization of debt financing costs, non‑cash equity compensation expense, non‑cash changes in fair value of estimated contingent consideration, other non‑cash items and
57
changes in cash resulting from changes in operating assets and liabilities. Operating assets and liabilities include receivables from our clients, prepaid expenses and other assets, accounts payable and accrued expenses, deferred revenues and other assets and liabilities.
Net cash provided by operating activities increased $88.9 million, or 83.9%, for the year ended December 31, 2019 compared to the year ended December 31, 2018. The increase was primarily related to a decrease in net loss of $29.1 million, an increase in adjustments to reconcile net loss of $37.7 million due primarily to an increase in intangible amortization, non-cash changes in fair value of estimated contingent consideration and the impairment of equity method investment, offset in part by a decrease in non-cash equity compensation expense and loss on extinguishment of borrowings, and an increase in operating assets and liabilities of $22.1 million.
Investing Activities
Net cash used in investing activities increased $110.0 million, or 24.6%, for the year ended December 31, 2019 compared to the year ended December 31, 2018. The increase was primarily due to an increase of $119.5 million in cash paid for acquisitions and contingent consideration and an increase in purchases of fixed assets of $16.4 million, due primarily to our new corporate headquarters. The increase in net cash used was partially offset by a decrease in investment and other of $25.8 million during the year ended December 31, 2019 compared to the year ended December 31, 2018 due primarily to the $20.0 million minority interest investment in a technology firm during the year ended December 31, 2018.
Financing Activities
Net cash provided by financing activities for the year ended December 31, 2019 increased $71.1 million, or 22.0%, compared to the year ended December 31, 2018. The increase was primarily due to an increase in net borrowings made under the Credit Facility of $600.4 million which were partially offset by the decrease in proceeds from issuance of common stock net of payments in connection with unit redemption of $503.6 million that occurred as a result of the IPO and Reorganization transactions, an increase in distributions for unitholders of $17.9 million and an increase in contingent consideration paid of $9.5 million during the year ended December 31, 2019 compared to the year ended December 31, 2018.
Adjusted Free Cash Flow
To supplement our statements of cash flows presented on a GAAP basis, we use a non-GAAP liquidity measure on a trailing 4-quarter basis to analyze cash flows generated from our operations. We consider adjusted free cash flow to be a liquidity measure that provides useful information to investors about the amount of cash generated by the business and is one factor in evaluating the amount of cash available to pay contingent consideration, make strategic acquisitions and repay outstanding borrowings. Adjusted free cash flow does not represent our residual cash flow available for discretionary expenditures as it does not deduct our mandatory debt service requirements and other non-discretionary expenditures. We define adjusted free cash flow as net cash provided by operating activities, less purchase of fixed assets, distributions for Focus LLC unitholders and payments under tax receivable agreements (if any). Adjusted free cash flow is not defined under GAAP and should not be considered as an alternative to net cash from operating, investing or financing activities. Adjusted free cash flow may not be calculated the same for us as for other companies. The table below reconciles net cash provided by operating activities, as reflected on our cash flow statement, to our adjusted free cash flow.
|
|
|
Trailing 4-Quarters Ended December 31, |
||||
|
|
|
2018 |
|
2019 |
||
|
|
|
(in thousands) |
||||
|
Net cash provided by operating activities (1) |
|
$ |
105,919 |
|
$ |
194,774 |
|
Purchase of fixed assets |
|
|
(9,106) |
|
|
(25,472) |
|
Distributions for unitholders |
|
|
(2,744) |
|
|
(20,641) |
|
Payments under tax receivable agreements |
|
|
— |
|
|
— |
|
Adjusted Free Cash Flow |
|
$ |
94,069 |
|
$ |
148,661 |
58
|
(1) |
A portion of contingent consideration paid is classified as operating cash outflows in accordance with GAAP, with the balance reflected in investing and financing cash flows. Contingent consideration paid classified as operating cash outflows for each quarter in the trailing 4-quarters ended December 31, 2018 was $1.5 million, $1.6 million, $4.6 million and $3.6 million, respectively, totaling $11.3 million for the trailing 4-quarters ended December 31, 2018. Contingent consideration paid classified as operating cash outflows for each quarter in the trailing 4-quarters ended December 31, 2019 was $9.2 million, $4.0 million, $0.8 million and $0.8 million, respectively, totaling $14.8 million for the trailing 4-quarters ended December 31, 2019. See Note 8 to our consolidated financial statements for additional information. |
Contractual Obligations
The following table describes our contractual obligations as of December 31, 2019:
|
|
|
|
|
|
Less than |
|
|
|
|
|
|
|
More than |
||
|
|
|
Total |
|
1 Year |
|
1 - 3 Years |
|
3 - 5 Years |
|
5 Years |
|||||
|
|
|
(in thousands) |
|||||||||||||
|
Credit Facility maturities |
|
$ |
1,279,188 |
|
$ |
11,565 |
|
$ |
23,130 |
|
$ |
1,244,493 |
|
$ |
— |
|
Credit Facility interest |
|
|
241,709 |
|
|
56,255 |
|
|
110,769 |
|
|
74,685 |
|
|
— |
|
Credit Facility letters of credit |
|
|
7,038 |
|
|
7,038 |
|
|
— |
|
|
— |
|
|
— |
|
Operating lease obligations |
|
|
253,578 |
|
|
45,006 |
|
|
71,067 |
|
|
52,462 |
|
|
85,043 |
|
Amounts due pursuant to tax receivable agreements |
|
|
48,399 |
|
|
— |
|
|
6,757 |
|
|
6,103 |
|
|
35,539 |
|
Finance lease obligations |
|
|
455 |
|
|
162 |
|
|
257 |
|
|
36 |
|
|
— |
|
Total |
|
$ |
1,830,367 |
|
$ |
120,026 |
|
$ |
211,980 |
|
$ |
1,377,779 |
|
$ |
120,582 |
Off‑Balance Sheet Arrangements
We have no off‑balance sheet arrangements.
Credit Facilities
In July 2019, we expanded our First Lien Term Loan by $350.0 million and incurred approximately $3.7 million in debt financing costs. The debt was issued at a discount of 0.25%, or $0.9 million, which is being amortized to interest expense over the remaining term of the First Lien Term Loan.
As of December 31, 2019, our Credit Facility consisted of a $1.15 billion First Lien Term Loan and a $650.0 million First Lien Revolver.
The First Lien Term Loan has a maturity date of July 2024 and requires quarterly installment repayments of approximately $2.9 million, as amended in July 2019. As of December 31, 2019, the First Lien Term Loan bore interest (at our option) at: (i) LIBOR plus a margin of 2.50% or (ii) the lender’s Base Rate (as defined in the Credit Facility) plus a margin of 1.50%. In January 2020, we amended our First Lien Term Loan to reduce its interest rate to LIBOR plus a margin of 2.00% or the lender’s Base Rate plus a margin of 1.00%.
The First Lien Revolver has a maturity date of July 2023. Up to $30.0 million of the First Lien Revolver is available for the issuance of letters of credit, subject to certain limitations. The First Lien Revolver bears interest at LIBOR plus a margin of 2.00% with step downs to 1.75%, 1.50% and 1.25% or the lender’s Base Rate plus a margin of 1.00% with step downs to 0.75%, 0.50% and 0.25%, based on achievement of a specified First Lien Leverage Ratio. The First Lien Revolver unused commitment fee is 0.50% with step downs to 0.375% and 0.25% based on achievement of a specified First Lien Leverage Ratio.
59
Our obligations under the Credit Facility are collateralized by the majority of our assets. The Credit Facility contains various customary covenants, including, but not limited to: (i) incurring additional indebtedness or guarantees, (ii) creating liens or other encumbrances on property or granting negative pledges, (iii) entering into a merger or similar transaction, (iv) selling or transferring certain property and (v) declaring dividends or making other restricted payments.
We are required to maintain a First Lien Leverage Ratio (as defined in the Credit Facility) of not more than 6.25:1.00 as of the last day of each fiscal quarter. At December 31, 2019, our First Lien Leverage Ratio was 4.00:1.00, which satisfied the maximum ratio of 6.25:1.00. First Lien Leverage Ratio means the ratio of amounts outstanding under the First Lien Term Loan and First Lien Revolver plus other outstanding debt obligations secured by a lien on the assets of Focus LLC (excluding letters of credit other than unpaid drawings thereunder) minus unrestricted cash and cash equivalents to Consolidated EBITDA (as defined in the Credit Facility). Consolidated EBITDA for purposes of the Credit Facility was $303.3 million at December 31, 2019. Focus LLC is also subject on an annual basis to contingent principal payments based on an excess cash flow calculation (as defined in the Credit Facility) for any fiscal year if the First Lien Leverage Ratio exceeds 3.75:1.00. No contingent principal payments were required to be made in 2019. Based on the excess cash flow calculation for the year ended December 31, 2019, no contingent principal payments are required to be made in 2020.
We defer and amortize our debt financing costs over the respective terms of the First Lien Term Loan and First Lien Revolver. The debt financing costs related to the First Lien Term Loan are recorded as reduction of the carrying amount of the First Lien Term Loan in the consolidated balance sheets. The debt financing costs related to the First Lien Revolver are recorded in debt financing costs‑net in the consolidated balance sheets.
At December 31, 2019, outstanding stated value borrowings under the Credit Facility were approximately $1.3 billion. The weighted‑average interest rate for outstanding borrowings was approximately 5% for the year ended December 31, 2019. As of December 31, 2019, the First Lien Revolver available unused commitment line was $503.0 million. At December 31, 2019, we had outstanding letters of credit in the amount of $7.0 million bearing interest at an annual rate of approximately 2%.
Critical Accounting Policies
Our financial statements are prepared in accordance with GAAP. Our financial statements include the accounts of Focus Inc. and our subsidiaries. Intercompany transactions and balances are eliminated in consolidation. Critical accounting policies are those that are the most important to the preparation our financial condition and results of operations and that require our most difficult, subjective and complex judgments as a result of the need to make estimates about the effect of matters that are inherently uncertain. While our significant accounting policies are described in more detail in the Note 2 to our financial statements, our most critical accounting policies are discussed below. The preparation of the consolidated financial statements in conformity with GAAP requires management to make estimates and assumptions that affect the amounts reported in our financial statements and the accompanying notes. Management believes that the estimates utilized in preparing the financial statements are reasonable and prudent. Actual results could differ from those estimates.
Revenue Recognition
Wealth Management Fees
We recognize revenue when earned from wealth management fees, which are primarily comprised of fees earned from wealth management services, including investment advice, financial and tax planning, consulting, tax return preparation, family office services and other services. Client arrangements may contain a single or multiple performance obligations, each of which are separately identifiable and accounted for as the related services are provided and consumed over time. Fees are primarily based either on a contractual percentage of the client’s assets, a flat fee, an hourly rate or a combination of such fees and are billed either in advance or arrears on a monthly, quarterly, or semiannual basis and such fees earned as the services are performed over time. Revenue for wealth management and operational support services provided to third‑party wealth management firms is presented net since these services are performed in an agent capacity. Wealth management fees are recorded when: (i) an arrangement with a client has been
60
identified; (ii) the performance obligations have been identified; (iii) the fee or other transaction price has been determined; (iv) the fee or other transaction price has been allocated to each performance obligation; and (v) we have satisfied the applicable performance obligation.
Other
Other revenue primarily includes recordkeeping and administration service fees, commissions and distribution fees and outsourced services. Client arrangements may contain a single or multiple performance obligations, each of which are separately identifiable and accounted for as the related services are provided and consumed over time. Recordkeeping and administration and outsourced services revenue, in accordance with the same five criteria above, are recognized over the period in which services are provided. Commissions and distribution fees are recognized when earned.
Business Acquisitions
Business acquisitions are accounted for in accordance with ASC Topic 805: Business Combinations. Business acquisitions are accounted for by allocating the purchase price consideration to the fair value of assets acquired and liabilities assumed. Goodwill is recognized as the excess of the purchase price consideration over the fair value of net assets of the business acquired. All transaction costs are expensed as incurred.
We have incorporated contingent consideration into the structure of our partner firm acquisitions. These arrangements may result in the payment of additional purchase price consideration to the sellers based on the growth of certain financial thresholds for periods following the closing of the respective acquisition. The additional purchase price consideration is payable in the form of cash and, in some cases, equity.
For business acquisitions, we recognize the fair value of estimated contingent consideration at the acquisition date as part of the consideration transferred in exchange for the acquired wealth management firm. The contingent consideration is remeasured to fair value at each reporting date until the contingency is resolved. Any changes in fair value are recognized each reporting period in non‑cash changes in fair value of estimated contingent consideration in the consolidated statements of operations.
The results of the acquired wealth management firms are included in our consolidated financial statements from the respective dates of acquisition.
Goodwill, Intangible Assets and Other Long‑Lived Assets
Goodwill is deemed to have an indefinite useful life and is not amortized. Intangible assets are amortized over their respective estimated useful lives. We have no indefinite‑lived intangible assets.
Goodwill is tested annually for impairment as of October 1, or more frequently if events and circumstances change that would more likely than not reduce the fair value of a reporting unit below its carrying amount. A two‑step impairment test is performed on goodwill. In the first step, we compare the fair value of the reporting unit to the carrying value of the net assets of the reporting unit. The fair value of the reporting unit is determined using a market approach. If the fair value of the reporting unit exceeds the carrying value of the net assets of the reporting unit in the first step, no further testing is performed. If the carrying value exceeds the fair value of the reporting unit in the first step, then we perform the second step of the impairment test to determine the implied fair value of goodwill and compare the implied fair value of goodwill to the carrying value of goodwill to determine the extent of the impairment, if any.
Intangible assets and other long‑lived assets are reviewed for impairment whenever events or changes in circumstances indicate that the asset might be impaired or that the estimated useful life should be changed prospectively. If impairment indicators are present, the recoverability of these assets is measured by a comparison of the carrying amount of the asset to estimated undiscounted future cash flows expected to be generated by the asset. If the carrying amount of the asset exceeds its estimated undiscounted future cash flows, an impairment charge is recognized by the amount by which the carrying amount of the asset exceeds the fair value of the asset, which is determined using a discounted cash flow approach.
61
Income Taxes and Tax Receivable Agreements
In connection with the IPO and Reorganization Transactions, Focus Inc. became a holding company whose most significant asset is a membership interest in Focus LLC, and, as a result, Focus Inc. became subject to U.S. federal, state and local income taxes on Focus Inc.’s allocable portion of taxable income from Focus LLC. Focus LLC is treated as a partnership for U.S. federal income tax purposes. Accordingly, Focus LLC is generally not and has not been subject to U.S. federal and certain state income taxes at the entity level, although it has been subject to the New York City Unincorporated Business Tax and certain of its subsidiaries have been subject to U.S. federal and certain state and local or foreign income taxes. Instead, for U.S. federal and certain state income tax purposes, the income, deductions, losses and credits of Focus LLC are passed through to its unitholders, which after the IPO includes Focus Inc. Focus LLC has historically made tax distribution payments in accordance with its Third Amended and Restated Operating Agreement, which was replaced by the Fourth Amended and Restated Focus LLC Agreement on July 30, 2018, and Focus Inc. intends to cause Focus LLC to continue to make tax distribution payments, to the extent of available cash, in accordance with the Fourth Amended and Restated Focus LLC Agreement. Focus Inc. files income tax returns with the U.S. federal government as well as various state and local jurisdictions.
We apply the asset and liability method for deferred income taxes. Deferred tax assets and liabilities are recognized for future tax consequences attributable to differences between the financial statement carrying amounts of existing assets and liabilities and their respective tax basis. Deferred tax assets and liabilities are measured using tax rates expected to apply to taxable income in years in which those temporary differences are expected to be recovered or settled. Valuation allowances, if any, are recorded to reduce the deferred tax assets to an amount that is more likely than not to be realized.
We review and evaluate tax positions in our major tax jurisdictions and determine whether or not there are uncertain tax positions that require financial statement recognition. Based on this review, we have recorded no reserves for uncertain tax positions at December 31, 2018 and December 31, 2019.
We have entered into two Tax Receivable Agreements with the TRA holders. The agreements generally provide for the payment by us to each TRA holder of 85% of the net cash savings, if any, in U.S. federal, state and local income and franchise tax that we actually realize (computed using simplifying assumptions to address the impact of state and local taxes) or are deemed to realize in certain circumstances in connection with the Reorganization Transactions and in periods after the IPO, as a result of certain increases in tax bases and certain tax benefits attributable to imputed interest. We will retain the benefit of the remaining 15% of these cash savings.
As a result of the Reorganization Transactions and the exchange of certain units of Focus LLC, as of December 31, 2019, Focus Inc. had a liability of $48.4 million relating to its obligations under the Tax Receivable Agreements. The foregoing amount of expected future payments to TRA holders is merely an estimate and the actual payments could differ materially. It is possible that future transactions or events could increase or decrease the actual tax benefits realized and the corresponding payments under the Tax Receivable Agreements as compared to the foregoing estimates.
Consolidation Considerations
ASC Topic 810, Consolidation, requires an entity to perform a qualitative analysis to determine whether its variable interests give it a controlling financial interest in a variable interest entity (“VIE”). Under the standard, an enterprise has a controlling financial interest when it has (a) the power to direct the activities of a VIE that most significantly impact the entity’s economic performance and (b) the obligation to absorb losses of the entity or the right to receive benefits from the entity that could potentially be significant to the VIE. An enterprise that holds a controlling financial interest is deemed to be the primary beneficiary and is required to consolidate the VIE.
Certain of our subsidiaries have management agreements with the respective management company, which causes these operating subsidiaries to be VIEs. We have assessed whether or not we are the primary beneficiary for these operating subsidiaries and have concluded that we are the primary beneficiary. Accordingly, the results of these subsidiaries have been consolidated.
62
Certain of our subsidiaries have variable interests in certain investment funds that are deemed voting interest entities. Due to substantive kick‑out rights possessed by the limited partners of these funds, we do not consolidate the investment funds.
From time to time, we enter into option agreements with wealth management firms (each, an “Optionee”) and their owners. In exchange for payment of an option premium, the option agreement allows us, at our sole discretion, to acquire substantially all of the assets of the Optionee at a predetermined time and at a predetermined purchase price formula. If we choose to exercise our option, the acquisition and the corresponding management agreement would be executed in accordance with our typical acquisition structure. If we choose not to exercise the option, the option premium would be recorded as a loss on investment in the consolidated statements of operations in the period that the option expires. We have determined that the respective option agreements with the Optionees qualify the Optionees as VIEs. We have determined that we are not the primary beneficiary of the Optionees and do not consolidate the results of the Optionees.
Stock Based Compensation Costs
Compensation cost for unit and stock based awards is measured based on the fair value of the unit and stock based awards determined by the Black‑Scholes option pricing model or the Monte Carlo Simulation Model on the date that the unit‑based awards are issued or modified, and is adjusted for the estimated number of awards that are expected to be forfeited. Compensation cost for unvested Class A common stock and restricted stock units is measured based on the market value of the Company’s Class A common stock on the date that the awards are granted and is adjusted for the estimated number of awards that are expected to be forfeited. The compensation cost is recognized on a straight‑line basis over the requisite service period.
Leases
In February 2016, the Financial Accounting Standards Board (“FASB”) issued Accounting Standards Update (“ASU”) No. 2016-02, “Leases (Topic 842).” ASU No. 2016-02, as amended, requires lessees to put most leases on their balance sheets but recognize the expenses in their income statements in a manner similar to current practice. ASU 2016-02 states that a lessee would recognize a lease liability for the obligation to make lease payments and a right of use asset for the right to use the underlying asset for the lease term. ASU No. 2016-02 was effective for the Company for interim and annual periods beginning January 1, 2019. The Company adopted ASU No. 2016-02 effective January 1, 2019 using a modified retrospective method and therefore has not restated comparative periods. The Company elected to use the package of practical expedients to assist in the transition, which includes not reassessing the identification and classification of leases, among other things. Based on the portfolio of leases as of January 1, 2019, the Company recognized approximately $144.0 million of lease liabilities and $134.0 million of right of use assets (which reflects the reclassification of previous deferred rent balances into the right of use asset as required under the transition guidance) on the balance sheet, primarily related to operating leases for real estate. There was no material impact to the consolidated statement of operations and comprehensive income (loss) or consolidated statement of cash flows as a result of adoption of this new guidance.
Recent Accounting Pronouncements
See Note 2 to our consolidated financial statements.
Item 7A. Quantitative and Qualitative Disclosures about Market Risk
Market Risk
Our exposure to market risk is primarily related to our partner firms’ wealth management services. For the year ended December 31, 2019, over 95% of our revenues were fee‑based and recurring in nature. Although the substantial majority of our revenues are fee‑based and recurring, our revenues can fluctuate due to macroeconomic factors and the overall state of the financial markets, particularly in the United States. The substantial majority of our revenues are
63
derived from the wealth management fees charged by our partner firms for providing clients with investment advice, financial and tax planning, consulting, tax return preparation, family office services and other services. The majority of our wealth management fees are based on the value of the client assets and we expect those fees to increase over time as the assets increase. A decrease in the aggregate value of client assets across our partner firms may cause our revenue and income to decline.
Interest Rate Risk
Interest payable on our Credit Facility is variable. Interest rate changes will therefore affect the amount of our interest payments, future earnings and cash flows. As of December 31, 2019, we had total stated value borrowings outstanding under our Credit Facility of approximately $1.3 billion. If LIBOR based interest rates increased by 1.0% on this amount, our interest expense for the year ended December 31, 2019 would have increased by approximately $13.0 million.
Our outstanding variable rate indebtedness uses LIBOR as a benchmark for establishing the interest rate. LIBOR is expected to be replaced by an alternative in 2021. While we expect any such alternative to be a reasonable replacement for LIBOR, at this time we cannot predict the implications of the use of such a new benchmark on the interest rates we pay.
Item 8. Financial Statements and Supplementary Data
Our financial statements and supplementary data are included in this Annual Report beginning on page F‑1 and incorporated by reference herein.
Item 9. Changes in and Disagreements With Accountants on Accounting and Financial Disclosure
None.
Item 9A. Controls and Procedures
Conclusion Regarding the Effectiveness of Disclosure Controls and Procedures
Our management, with the participation of our principal executive officer and principal financial officer, evaluated the effectiveness of the design and operation of our disclosure controls and procedures (as such term is defined in Rules 13a‑15(e) and 15d‑15(e) under the Exchange Act) as of December 31, 2019. Our disclosure controls and procedures are designed to provide reasonable assurance that information required to be disclosed in the reports we file or submit under the Exchange Act is recorded, processed, summarized and reported within the time periods specified in the SEC’s rules and forms and that such information is accumulated and communicated to management, including the principal executive officer and principal financial officer, to allow timely decisions regarding required disclosure. Based on such evaluation, our principal executive officer and principal financial officer concluded that, as of December 31, 2019, our disclosure controls and procedures were effective, at the reasonable assurance level. Any controls and procedures, no matter how well designed and operated can only provide reasonable assurance of achieving the desired control objective and management necessarily applies its judgment in evaluating the cost‑benefit relationship of all possible controls and procedures.
Management’s Report on Internal Control Over Financial Reporting
The Company’s management is responsible for establishing and maintaining adequate internal control over financial reporting for the Company. Management assessed the effectiveness of the Company’s internal control over financial reporting as of December 31, 2019. Based on management’s assessment, management has concluded that the Company’s internal control over financial reporting was effective as of December 31, 2019 using the criteria set forth in Internal Control—Integrated Framework issued by the Committee of Sponsoring Organizations of the Treadway Commission (2013 framework).
64
Under guidelines established by the SEC, companies are permitted to exclude acquired businesses from management’s report on internal control over financial reporting for up to one year from the date of the acquisition while integrating the acquired operations. Accordingly, internal control over financial reporting of certain acquired businesses have been excluded from management’s report on internal control over financial reporting as of December 31, 2019. These acquired businesses represent approximately 7% of our consolidated revenues for the year ended December 31, 2019 and approximately 1% of our consolidated assets as of December 31, 2019.
Our internal control over financial reporting is designed to provide reasonable, but not absolute, assurance regarding the reliability of financial reporting and the preparation of financial statements in accordance with U.S. generally accepted accounting principles. There are inherent limitations to the effectiveness of any system of internal control over financial reporting. These limitations include the possibility of human error, the circumvention or overriding of the system and reasonable resource constraints. Because of its inherent limitations, our internal control over financial reporting may not prevent or detect misstatements. Projections of any evaluation of effectiveness to future periods are subject to the risks discussed in Part I Item 1A—Risk Factors of this report.
The effectiveness of our internal control over financial reporting as of December 31, 2019, has been audited by Deloitte & Touche LLP, an independent registered public accounting firm and is below.
REPORT OF INDEPENDENT REGISTERED PUBLIC ACCOUNTING FIRM
To the shareholders and the Board of Directors of Focus Financial Partners Inc.
Opinion on Internal Control over Financial Reporting
We have audited the internal control over financial reporting of Focus Financial Partners Inc. and subsidiaries (the “Company”) as of December 31, 2019, based on criteria established in Internal Control — Integrated Framework (2013) issued by the Committee of Sponsoring Organizations of the Treadway Commission (COSO). In our opinion, the Company maintained, in all material respects, effective internal control over financial reporting as of December 31, 2019, based on criteria established in Internal Control — Integrated Framework (2013) issued by COSO.
We have also audited, in accordance with the standards of the Public Company Accounting Oversight Board (United States) (PCAOB), the consolidated financial statements as of and for the year ended December 31, 2019, of the Company and our report dated February 25, 2020, expressed an unqualified opinion on those consolidated financial statements.
As described in the Management’s Report on Internal Controls Over Financial Reporting, management excluded from its assessment the internal control over financial reporting at certain acquired businesses during the 12-month period ending December 31, 2019, and whose financial statements constitute approximately 1% of total assets and 7% of total revenues of the consolidated financial statement amounts as of and for the year ended December 31, 2019. Accordingly, our audit did not include the internal control over financial reporting at these acquired businesses.
Basis for Opinion
The Company’s management is responsible for maintaining effective internal control over financial reporting and for its assessment of the effectiveness of internal control over financial reporting, included in the accompanying Management’s Report on Internal Controls Over Financial Reporting. Our responsibility is to express an opinion on the Company’s internal control over financial reporting based on our audit. We are a public accounting firm registered with the PCAOB and are required to be independent with respect to the Company in accordance with the U.S. federal securities laws and the applicable rules and regulations of the Securities and Exchange Commission and the PCAOB.
We conducted our audit in accordance with the standards of the PCAOB. Those standards require that we plan and perform the audit to obtain reasonable assurance about whether effective internal control over financial reporting was maintained in all material respects. Our audit included obtaining an understanding of internal control over financial reporting, assessing the risk that a material weakness exists, testing and evaluating the design and operating effectiveness of internal control based on the assessed risk, and performing such other procedures as we considered necessary in the circumstances. We believe that our audit provides a reasonable basis for our opinion.
65
Definition and Limitations of Internal Control over Financial Reporting
A company’s internal control over financial reporting is a process designed to provide reasonable assurance regarding the reliability of financial reporting and the preparation of financial statements for external purposes in accordance with generally accepted accounting principles. A company’s internal control over financial reporting includes those policies and procedures that (1) pertain to the maintenance of records that, in reasonable detail, accurately and fairly reflect the transactions and dispositions of the assets of the company; (2) provide reasonable assurance that transactions are recorded as necessary to permit preparation of financial statements in accordance with generally accepted accounting principles, and that receipts and expenditures of the company are being made only in accordance with authorizations of management and directors of the company; and (3) provide reasonable assurance regarding prevention or timely detection of unauthorized acquisition, use, or disposition of the company’s assets that could have a material effect on the financial statements.
Because of its inherent limitations, internal control over financial reporting may not prevent or detect misstatements. Also, projections of any evaluation of effectiveness to future periods are subject to the risk that controls may become inadequate because of changes in conditions, or that the degree of compliance with the policies or procedures may deteriorate.
/s/ DELOITTE & TOUCHE LLP
New York, New York
February 25, 2020
Changes in Internal Control over Financial Reporting
In preparation for management’s report on internal control over financial reporting, we documented and tested the design and operating effectiveness of our internal control over financial reporting. There were no significant changes in our internal controls over financial reporting that occurred during the year ended December 31, 2019, that have materially affected, or are reasonably likely to materially affect, the Company’s internal control over financial reporting.
None.
66
Item 10. Directors, Executive Officers and Corporate Governance
Information as to Item 10 will be set forth in the Proxy Statement for the Annual Meeting of Shareholders to be held on June 3, 2020 (the “Annual Meeting”) and is incorporated herein by reference.
Our board of directors has adopted a Code of Business Conduct and Ethics applicable to all of our directors, officers and employees, including our principal executive officer, principal financial officer, principal accounting officer and controller or persons performing similar functions, as well as to directors, principals, officers and employees of each of our subsidiary and a Financial Code of Ethics, applicable to our chief executive officer, chief financial officer and principal accounting officer, in accordance with applicable U.S. federal securities laws and corporate governance rules of NASDAQ. Our Code of Business Conduct and Ethics and our Financial Code of Ethics are available on our website at www.focusfinancialpartners.com under “Corporate Governance” within the “Investor Relations” section. We will provide copies of these documents to any person, without charge, upon request, by writing to us at Focus Financial Partners Inc., Attn: Investor Relations, 875 Third Avenue, 28th Floor, New York, NY. We intend to satisfy the disclosure requirement under Item 406(b) of Regulation S‑K regarding amendments to, or waivers from, provisions of our Code of Business Conduct and Ethics and our Financial Code of Ethics by posting such information on our website at the address and the location specified above.
Item 11. Executive Compensation
Information as to Item 11 will be set forth in the Proxy Statement for the Annual Meeting and is incorporated herein by reference.
Item 12. Security Ownership of Certain Beneficial Owners and Management and Related Stockholder Matters
Information as to Item 12 will be set forth in the Proxy Statement for the Annual Meeting and is incorporated herein by reference.
Item 13. Certain Relationships and Related Transactions, and Director Independence
Information as to Item 13 will be set forth in the Proxy Statement for the Annual Meeting and is incorporated herein by reference.
Item 14. Principal Accountant Fees and Services
Information as to Item 14 will be set forth in the Proxy Statement for the Annual Meeting and is incorporated herein by reference.
Financial Statements
The consolidated financial statements of Focus Inc. and Subsidiaries and the Report of Independent Registered Public Accounting Firm are included in “Part II, Item 8, Financial Statements and Supplementary Data.” Reference is made to the accompanying Index to Financial Statements.
Financial Statement Schedules
All financial statement schedules have been omitted because they are not applicable or the required information is presented in the financial statements or the notes thereto.
67
Index to Exhibits
The exhibits required to be filed or furnished pursuant to Item 601 of Regulation S‑K are set forth below.
|
Exhibit |
|
|
|
Number |
|
Description |
|
|
|
|
| 3.1 |
|
Amended and Restated Certificate of Incorporation of Focus Financial Partners Inc.(1) |
| 3.2 |
|
Amended and Restated Bylaws of Focus Financial Partners Inc.(1) |
| 4.1 |
|
|
| 4.2 |
* |
Description of Securities registered under Section 12 of the Securities Exchange Act Of 1934 |
| 10.1 |
|
|
| 10.2 |
|
|
| 10.3 |
|
Fourth Amended and Restated Operating Agreement of Focus Financial Partners, LLC(1) |
| 10.4 |
|
|
| 10.5 |
|
|
| 10.6 |
|
|
|
10.7† |
|
Focus Financial Partners Inc. 2018 Omnibus Incentive Plan(1) |
| 10.8 |
|
|
| 10.9 |
|
|
| 10.10 |
|
|
| 10.11 |
|
|
| 10.12 |
|
|
| 10.13 |
|
|
| 10.14 |
|
|
|
10.15† |
|
68
|
Exhibit |
|
|
|
Number |
|
Description |
|
|
|
|
|
10.16† |
|
|
|
10.17† |
|
|
| 10.18 |
†* |
Employment Agreement, by and between Leonard R. Chang and Focus Financial Partners, LLC |
| 10.19 |
†* |
|
|
10.20† |
|
|
| 10.21 |
|
|
| 10.22 |
|
|
| 10.23 |
|
|
| 10.24 |
|
|
| 10.25 |
|
|
| 10.26 |
|
|
| 10.27 |
|
|
| 10.28 |
|
|
| 10.29 |
|
|
| 10.30 |
|
|
| 10.31 |
* |
|
| 10.32 |
* |
|
|
21.1* |
|
|
|
23.1* |
|
|
|
31.1* |
|
Certification of Chief Executive Officer pursuant to Section 302 of the Sarbanes‑Oxley Act of 2002 |
|
31.2* |
|
Certification of Chief Financial Officer pursuant to Section 302 of the Sarbanes‑Oxley Act of 2002 |
|
32.1* |
|
|
|
101.INS* |
|
XBRL Instance Document |
|
101.SCH* |
|
XBRL Taxonomy Extension Schema Document |
|
101.CAL* |
|
XBRL Taxonomy Extension Calculation Linkbase Document |
|
101.LAB* |
|
XBRL Taxonomy Extension Label Linkbase Document |
|
101.PRE* |
|
XBRL Taxonomy Extension Presentation Linkbase Document |
|
101.DEF* |
|
XBRL Taxonomy Extension Definition Linkbase Document |
* Filed or furnished herewith.
† Compensation, plan or arrangement.
|
(1) |
Incorporated by reference to the Registrant’s Current Report on Form 8‑K (File No. 001‑38604) filed with the SEC on July 31, 2018. |
69
|
(2) |
Incorporated by reference to the Registrant’s Registration Statement on Form S‑1 (File No. 333‑225166) filed with the SEC on May 24, 2018. |
|
(3) |
Incorporated by reference to the Registrant’s Registration Statement on Form S‑1 (File No. 333‑225166) filed with the SEC on June 29, 2018. |
|
(4) |
Incorporated by reference to the Registrant’s Quarterly Report on Form 10-Q (File No. 001-38604) filed with the SEC on May 9, 2019. |
|
(5) |
Incorporated by reference to the Registrant’s Current Report on Form 8 K (File No. 001-38604) filed with the SEC on July 26, 2019. |
|
(6) |
Incorporated by reference to the Registrant’s Current Report on Form 8 K (File No. 001-38604) filed with the SEC on January 27, 2020. |
70
Pursuant to the requirements of Section 13 or 15(d) of the Securities Exchange Act of 1934, the registrant has duly caused this report to be signed on its behalf by the undersigned, thereunto duly authorized.
|
|
FOCUS FINANCIAL PARTNERS INC. |
|
|
|
|
|
|
|
|
|
|
|
By: |
/s/ RUEDIGER ADOLF |
|
|
|
Ruediger Adolf |
|
|
|
Chairman and Chief Executive Officer |
|
|
|
(Principal Executive Officer) |
|
|
|
|
|
|
|
|
|
Date: February 25, 2020 |
|
|
|
|
By: |
/s/ JAMES SHANAHAN |
|
|
|
James Shanahan |
|
|
|
Chief Financial Officer |
|
|
|
(Principal Financial Officer and Principal Accounting Officer) |
Pursuant to the requirements of the Securities Exchange Act of 1934, this report has been signed below by the following persons on behalf of the registrant and in the capacities and on the dates indicated.
|
Signature |
|
Title |
|
Date |
|
|
|
|
|
|
|
/s/ RUEDIGER ADOLF |
|
Chief Executive Officer and Chairman (Principal Executive Officer) |
|
February 25, 2020 |
|
Ruediger Adolf |
|
|||
|
|
|
|
|
|
|
/s/ JAMES SHANAHAN |
|
Chief Financial Officer (Principal Financial Officer and Principal Accounting Officer) |
|
February 25, 2020 |
|
James Shanahan |
|
|||
|
|
|
|
|
|
|
/s/ JAMES D. CAREY |
|
Director |
|
February 25, 2020 |
|
James D. Carey |
|
|||
|
|
|
|
|
|
|
/s/ JOSEPH FELICIANI JR. |
|
Director |
|
February 25, 2020 |
|
Joseph Feliciani Jr. |
||||
|
|
|
|
|
|
|
/s/ NOAH GOTTDIENER |
|
Director |
|
February 25, 2020 |
|
Noah Gottdiener |
|
|
||
|
|
|
|
|
|
|
/s/ CHRISTOPHER J. HARRINGTON |
|
Director |
|
February 25, 2020 |
|
Christopher J. Harrington |
|
|||
|
|
|
|
|
|
|
/s/ RAJINI SUNDAR KODIALAM |
|
Director |
|
February 25, 2020 |
|
Rajini Sundar Kodialam |
|
|||
|
|
|
|
|
|
|
/s/ DEBORAH D. MCWHINNEY |
|
Director |
|
February 25, 2020 |
|
Deborah D. McWhinney |
|
|||
|
|
|
|
|
|
|
/s/ FAYEZ S. MUHTADIE |
|
Director |
|
February 25, 2020 |
|
Fayez S. Muhtadie |
|
71
FOCUS FINANCIAL PARTNERS INC.
|
|
|
Page |
|
Consolidated Financial Statements as of December 31, 2018 and 2019 and for the Years Ended December 31, 2017, 2018 and 2019 |
|
|
|
|
F-2 |
|
|
|
F-5 |
|
|
Statements of operations for the years ended December 31, 2017, 2018 and 2019 |
|
F-6 |
|
Statements of comprehensive loss for the years ended December 31, 2017, 2018 and 2019 |
|
F-7 |
|
Statements of cash flows for the years ended December 31, 2017, 2018 and 2019 |
|
F-8 |
|
|
F-9 |
|
|
|
F-10 |
F-1
REPORT OF INDEPENDENT REGISTERED PUBLIC ACCOUNTING FIRM
To the shareholders and the Board of Directors of Focus Financial Partners Inc.
Opinion on the Financial Statements
We have audited the accompanying consolidated balance sheets of Focus Financial Partners Inc. and subsidiaries (the "Company") as of December 31, 2019 and 2018, the related consolidated statements of operations, comprehensive loss, cash flows and members’ deficit/shareholders' equity, for each of the three years in the period ended December 31, 2019, and the related notes (collectively referred to as the "financial statements"). In our opinion, the financial statements present fairly, in all material respects, the financial position of the Company as of December 31, 2019 and 2018, and the results of its operations and its cash flows for each of the three years in the period ended December 31, 2019, in conformity with accounting principles generally accepted in the United States of America.
We have also audited, in accordance with the standards of the Public Company Accounting Oversight Board (United States) (PCAOB), the Company's internal control over financial reporting as of December 31, 2019, based on criteria established in Internal Control — Integrated Framework (2013) issued by the Committee of Sponsoring Organizations of the Treadway Commission and our report dated February 25, 2020, expressed an unqualified opinion on the Company's internal control over financial reporting.
Basis for Opinion
These financial statements are the responsibility of the Company's management. Our responsibility is to express an opinion on the Company's financial statements based on our audits. We are a public accounting firm registered with the PCAOB and are required to be independent with respect to the Company in accordance with the U.S. federal securities laws and the applicable rules and regulations of the Securities and Exchange Commission and the PCAOB.
We conducted our audits in accordance with the standards of the PCAOB. Those standards require that we plan and perform the audit to obtain reasonable assurance about whether the financial statements are free of material misstatement, whether due to error or fraud. Our audits included performing procedures to assess the risks of material misstatement of the financial statements, whether due to error or fraud, and performing procedures that respond to those risks. Such procedures included examining, on a test basis, evidence regarding the amounts and disclosures in the financial statements. Our audits also included evaluating the accounting principles used and significant estimates made by management, as well as evaluating the overall presentation of the financial statements. We believe that our audits provide a reasonable basis for our opinion.
Critical Audit Matters
The critical audit matters communicated below are matters arising from the current-period audit of the financial statements that were communicated or required to be communicated to the audit committee and that (1) relate to accounts or disclosures that are material to the financial statements and (2) involved our especially challenging, subjective, or complex judgments. The communication of critical audit matters does not alter in any way our opinion on the financial statements, taken as a whole, and we are not, by communicating the critical audit matters below, providing a separate opinions on the critical audit matters or on the accounts or disclosures to which they relate.
Goodwill and Other Intangible Assets — Refer to Notes 2, 5 and 6 to the financial statements
Critical Audit Matter Description
The Company acquires businesses throughout the year in transactions which qualify as business acquisitions pursuant to relevant accounting literature. The Company also separately purchases customer relationships and other intangible assets in asset acquisitions that do not qualify as business acquisitions pursuant to relevant accounting literature.
F-2
The purchase price associated with each business acquisition consists of cash, may include equity, and contingent consideration. The purchase price is allocated across the estimated fair value of tangible assets acquired, liabilities assumed, the fair value of intangible assets, with the excess purchase price allocated to goodwill.
The fair value of other intangible assets and goodwill involves significant management judgment in estimating projections, forecasting growth rates used to produce financial projections for the acquired entities, and the selection of unobservable inputs and other assumptions. The inputs used in establishing the fair value are in most cases unobservable and reflect the Company’s own judgments about the assumptions market participants would use in pricing the asset.
Auditing the fair value of other intangible assets and goodwill involves a high degree of auditor judgment and an increased extent of effort, including the need to involve our fair value specialists for certain acquisitions, when performing audit procedures to evaluate the reasonableness of management’s forecasts of future growth rates and the selection of the unobservable inputs used in the models.
How the Critical Audit Matter Was Addressed in the Audit
Our audit procedures related to the purchase price allocation for business acquisitions occurring during the year included the following, utilizing fair value specialists for certain procedures and transactions:
1.We tested the effectiveness of controls over the purchase price allocation, including understanding management’s processes and management’s controls over the valuation of other intangible assets and the underlying assumptions used for estimating the fair value of assets acquired and liabilities assumed.
2.We evaluated management’s policies and methodology for establishing the fair values used in the purchase price allocations and the prospective financial information, including testing the completeness and accuracy of underlying data.
3.We evaluated the reasonableness of the unobservable inputs, and other key judgments made by management to determine the reasonableness of the fair value of the other intangible assets and goodwill.
4.We evaluated the reasonableness of management’s revenue and operating margin forecasts by comparing the forecasts to:
Actual historical revenues and operating margins of the target partner firm
Internal communications to management and the Board of Directors
Forecasted information included in Company press releases, analyst and industry reports for the Company, market trends, and certain of its guideline companies.
5.We evaluated the future revenue growth rates used by the Company to determine forecasted revenues and operating margins, by comparing them to industry benchmarks and data, as well as evaluated the relevance and reliability of third-party market data points used to develop the future revenue growth rates.
6.We evaluated the reasonableness of management’s assumptions through independent analysis using publicly available market data for comparable entities and comparison to industry benchmark and data.
Contingent Consideration — Refer to Notes 2, 5 and 8 to the financial statements
Critical Audit Matter Description
The purchase price associated with acquisitions consist of cash and may include equity and/or the right of the seller to receive contingent consideration. For business acquisitions, the Company recognizes the fair value of estimated contingent consideration at the acquisition date as part of purchase price allocation. Contingent consideration is paid upon the satisfaction of specified financial performance targets. The performance targets are typically tied to the partner firm’s revenues or earnings. The estimated contingent consideration is remeasured to fair value at each reporting date until the contingency is resolved. Any changes in fair value are recognized each reporting period in non-cash changes in fair value of estimated contingent consideration. In determining fair value of the estimated contingent consideration, the acquired business's future performance is estimated using financial projections for the acquired businesses. The
F-3
Company uses the Monte Carlo Simulation Model to determine the fair value of the Company's estimated contingent consideration given the non-linear nature of the arrangements.
The fair value of the estimated contingent consideration involves significant management judgment in forecasting growth rates used to produce financial projections for the acquired businesses and selecting unobservable inputs and other assumptions used in the Monte Carlo Simulation.
We identified the valuation of estimated contingent consideration at acquisition and the remeasurement thereafter as a critical audit matter because of the significant estimates and assumptions management makes related to the unobservable inputs and financial projections. This required a high degree of auditor judgment and an increased extent of effort, including the need to involve our fair value specialists for certain acquisitions and year-end estimates, when performing audit procedures to evaluate the reasonableness of the financial projections and the selection of the unobservable inputs used in the Monte Carlo Simulation.
How the Critical Audit Matter Was Addressed in the Audit
Our audit procedures related to the valuation of contingent consideration included the following, utilizing fair value specialists for certain procedures and transactions:
1.We tested the effectiveness of controls over the valuation of contingent consideration including understanding management processes and controls in forecasting future revenues and operating margins as well as those over the estimation process for inputs used in the Monte Carlo Simulation.
2.We evaluated management’s policies and methodology for establishing the valuation of estimated contingent consideration.
3.We evaluated the reasonableness of the unobservable inputs, and other key judgments made by management as well as independently running the Monte Carlo Simulations to calculate an independent estimate of fair value. We compared the results of our estimate of fair value of the contingent consideration liabilities to the Company’s fair value estimate.
4.We evaluated the reasonableness of management’s revenue and operating margin forecasts of the acquired businesses by comparing the forecasts to:
Actual historical revenues and operating margins
Internal communications to management and the Board of Directors
Performing sensitivity analysis and evaluating potential effect of changes in certain assumptions.
5.We evaluated management’s ability to accurately estimate fair value by comparing management’s historical estimates to subsequent results.
6.We evaluated the reasonableness of management’s assumptions through independent analysis using publicly available market data for comparable entities and comparison to industry benchmark and data.
/s/ DELOITTE & TOUCHE LLP
New York, New York
February 25, 2020
We have served as the Company's auditor since 2008.
F-4
FOCUS FINANCIAL PARTNERS INC.
AS OF DECEMBER 31, 2018 AND DECEMBER 31, 2019
(In thousands, except share and per share amounts)
|
|
|
2018 |
|
2019 |
||
|
ASSETS |
|
|
|
|
|
|
|
Cash and cash equivalents |
|
$ |
33,213 |
|
$ |
65,178 |
|
Accounts receivable less allowances of $576 at 2018 and $684 at 2019 |
|
|
98,596 |
|
|
129,337 |
|
Prepaid expenses and other assets |
|
|
76,150 |
|
|
58,581 |
|
Fixed assets—net |
|
|
24,780 |
|
|
41,634 |
|
Operating lease assets |
|
|
— |
|
|
180,114 |
|
Debt financing costs—net |
|
|
12,340 |
|
|
9,645 |
|
Deferred tax assets—net |
|
|
70,009 |
|
|
75,453 |
|
Goodwill |
|
|
860,495 |
|
|
1,090,231 |
|
Other intangible assets—net |
|
|
762,195 |
|
|
1,003,456 |
|
TOTAL ASSETS |
|
$ |
1,937,778 |
|
$ |
2,653,629 |
|
LIABILITIES AND EQUITY |
|
|
|
|
|
|
|
LIABILITIES |
|
|
|
|
|
|
|
Accounts payable |
|
$ |
8,935 |
|
$ |
8,077 |
|
Accrued expenses |
|
|
36,252 |
|
|
41,442 |
|
Due to affiliates |
|
|
39,621 |
|
|
58,600 |
|
Deferred revenue |
|
|
6,215 |
|
|
7,839 |
|
Other liabilities |
|
|
158,497 |
|
|
215,878 |
|
Operating lease liabilities |
|
|
— |
|
|
196,425 |
|
Borrowings under credit facilities (stated value of $838,985 and $1,279,188 at December 31, 2018 and December 31, 2019, respectively) |
|
|
836,582 |
|
|
1,272,999 |
|
Tax receivable agreements obligations |
|
|
39,156 |
|
|
48,399 |
|
TOTAL LIABILITIES |
|
|
1,125,258 |
|
|
1,849,659 |
|
COMMITMENTS AND CONTINGENCIES (Note 14) |
|
|
|
|
|
|
|
EQUITY |
|
|
|
|
|
|
|
Class A common stock, par value $0.01, 500,000,000 shares authorized; 46,265,903 and 47,421,315 shares issued and outstanding at December 31, 2018 and December 31, 2019, respectively |
|
|
462 |
|
|
474 |
|
Class B common stock, par value $0.01, 500,000,000 shares authorized; 22,823,272 and 22,075,749 shares issued and outstanding at December 31, 2018 and December 31, 2019, respectively |
|
|
228 |
|
|
221 |
|
Additional paid-in capital |
|
|
471,386 |
|
|
498,186 |
|
Accumulated deficit |
|
|
(590) |
|
|
(13,462) |
|
Accumulated other comprehensive loss |
|
|
(1,824) |
|
|
(1,299) |
|
Total shareholders' equity |
|
|
469,662 |
|
|
484,120 |
|
Non-controlling interest |
|
|
342,858 |
|
|
319,850 |
|
Total equity |
|
|
812,520 |
|
|
803,970 |
|
TOTAL LIABILITIES AND EQUITY |
|
$ |
1,937,778 |
|
$ |
2,653,629 |
See notes to consolidated financial statements
F-5
FOCUS FINANCIAL PARTNERS INC.
CONSOLIDATED STATEMENTS OF OPERATIONS
FOR THE YEARS ENDED DECEMBER 31, 2017, 2018 AND 2019
(In thousands, except share and per share amounts)
|
|
|
|
|
|
|
|
|
|
|
|
|
|
|
|
|
|
|
|
|
|
|
|
|
2017 |
|
2018 |
|
2019 |
|||
|
REVENUES: |
|
|
|
|
|
|
|
|
|
|
Wealth management fees |
|
$ |
617,124 |
|
$ |
853,033 |
|
$ |
1,149,655 |
|
Other |
|
|
45,763 |
|
|
57,847 |
|
|
68,686 |
|
Total revenues |
|
|
662,887 |
|
|
910,880 |
|
|
1,218,341 |
|
OPERATING EXPENSES: |
|
|
|
|
|
|
|
|
|
|
Compensation and related expenses |
|
|
265,555 |
|
|
358,084 |
|
|
431,465 |
|
Management fees |
|
|
163,617 |
|
|
232,703 |
|
|
304,701 |
|
Selling, general and administrative |
|
|
134,615 |
|
|
170,270 |
|
|
232,911 |
|
Management contract buyout |
|
|
— |
|
|
— |
|
|
1,428 |
|
Intangible amortization |
|
|
64,367 |
|
|
90,381 |
|
|
130,718 |
|
Non-cash changes in fair value of estimated contingent consideration |
|
|
22,294 |
|
|
6,638 |
|
|
38,797 |
|
Depreciation and other amortization |
|
|
6,686 |
|
|
8,370 |
|
|
10,675 |
|
Total operating expenses |
|
|
657,134 |
|
|
866,446 |
|
|
1,150,695 |
|
INCOME FROM OPERATIONS |
|
|
5,753 |
|
|
44,434 |
|
|
67,646 |
|
OTHER INCOME (EXPENSE): |
|
|
|
|
|
|
|
|
|
|
Interest income |
|
|
222 |
|
|
1,266 |
|
|
1,164 |
|
Interest expense |
|
|
(41,861) |
|
|
(56,448) |
|
|
(58,291) |
|
Amortization of debt financing costs |
|
|
(4,084) |
|
|
(3,498) |
|
|
(3,452) |
|
Gain on sale of investment |
|
|
— |
|
|
5,509 |
|
|
— |
|
Loss on extinguishment of borrowings |
|
|
(8,106) |
|
|
(21,071) |
|
|
— |
|
Other (expense) income—net |
|
|
(3,191) |
|
|
(2,350) |
|
|
(1,049) |
|
Income from equity method investments |
|
|
1,407 |
|
|
521 |
|
|
755 |
|
Impairment of equity method investment |
|
|
— |
|
|
— |
|
|
(11,749) |
|
Total other expense—net |
|
|
(55,613) |
|
|
(76,071) |
|
|
(72,622) |
|
LOSS BEFORE INCOME TAX |
|
|
(49,860) |
|
|
(31,637) |
|
|
(4,976) |
|
INCOME TAX EXPENSE (BENEFIT) |
|
|
(1,501) |
|
|
9,450 |
|
|
7,049 |
|
NET LOSS |
|
$ |
(48,359) |
|
$ |
(41,087) |
|
$ |
(12,025) |
|
Non-controlling interest |
|
|
|
|
|
40,497 |
|
|
(847) |
|
NET LOSS ATTRIBUTABLE TO COMMON SHAREHOLDERS |
|
|
|
|
$ |
(590) |
|
$ |
(12,872) |
|
Loss per share of Class A common stock: |
|
|
|
|
|
|
|
|
|
|
Basic |
|
|
|
|
$ |
(0.01) |
|
$ |
(0.28) |
|
Diluted |
|
|
|
|
$ |
(0.01) |
|
$ |
(0.28) |
|
Weighted average shares of Class A common stock outstanding: |
|
|
|
|
|
|
|
|
|
|
Basic |
|
|
|
|
|
43,122,782 |
|
|
46,792,389 |
|
Diluted |
|
|
|
|
|
43,122,782 |
|
|
46,792,389 |
See notes to consolidated financial statements
F-6
FOCUS FINANCIAL PARTNERS INC.
CONSOLIDATED STATEMENTS OF COMPREHENSIVE LOSS
FOR THE YEARS ENDED DECEMBER 31, 2017, 2018 AND 2019
(In thousands)
|
|
|
|
|
|
|
|
|
|
|
|
|
|
|
|
|
|
|
|
|
|
|
|
|
2017 |
|
2018 |
|
2019 |
|||
|
Net loss |
|
$ |
(48,359) |
|
$ |
(41,087) |
|
$ |
(12,025) |
|
Other comprehensive income (loss), net of tax: |
|
|
|
|
|
|
|
|
|
|
Foreign currency translation adjustments |
|
|
2,470 |
|
|
(4,509) |
|
|
768 |
|
Comprehensive loss |
|
$ |
(45,889) |
|
$ |
(45,596) |
|
$ |
(11,257) |
|
Less: Comprehensive (income) loss attributable to noncontrolling interest |
|
|
|
|
|
43,182 |
|
|
(1,090) |
|
Comprehensive loss attributable to common shareholders |
|
|
|
|
$ |
(2,414) |
|
$ |
(12,347) |
See notes to consolidated financial statements
F-7
FOCUS FINANCIAL PARTNERS INC.
CONSOLIDATED STATEMENTS OF CASH FLOWS
FOR THE YEARS ENDED DECEMBER 31, 2017, 2018 AND 2019
(In thousands)
|
|
|
2017 |
|
2018 |
|
2019 |
|||
|
CASH FLOWS FROM OPERATING ACTIVITIES: |
|
|
|
|
|
|
|
|
|
|
Net loss |
|
$ |
(48,359) |
|
$ |
(41,087) |
|
$ |
(12,025) |
|
Adjustments to reconcile net loss to net cash provided by operating activities—net of effect of acquisitions: |
|
|
|
|
|
|
|
|
|
|
Intangible amortization |
|
|
64,367 |
|
|
90,381 |
|
|
130,718 |
|
Depreciation and other amortization |
|
|
6,686 |
|
|
8,370 |
|
|
10,675 |
|
Amortization of debt financing costs |
|
|
4,084 |
|
|
3,498 |
|
|
3,452 |
|
Non-cash equity compensation expense |
|
|
34,879 |
|
|
44,468 |
|
|
18,329 |
|
Non-cash changes in fair value of estimated contingent consideration |
|
|
22,294 |
|
|
6,638 |
|
|
38,797 |
|
Income from equity method investments |
|
|
(1,407) |
|
|
(521) |
|
|
(755) |
|
Impairment of equity method investment |
|
|
— |
|
|
— |
|
|
11,749 |
|
Distributions received from equity method investments |
|
|
984 |
|
|
1,118 |
|
|
751 |
|
Deferred taxes and other non-cash items |
|
|
(3,960) |
|
|
6,655 |
|
|
3,555 |
|
Loss on extinguishment of borrowings |
|
|
8,106 |
|
|
19,001 |
|
|
— |
|
Changes in cash resulting from changes in operating assets and liabilities: |
|
|
|
|
|
|
|
|
|
|
Accounts receivable |
|
|
(30,209) |
|
|
(23,747) |
|
|
(29,562) |
|
Prepaid expenses and other assets |
|
|
9,889 |
|
|
(10,401) |
|
|
3,796 |
|
Accounts payable |
|
|
(1,210) |
|
|
2,341 |
|
|
(1,172) |
|
Accrued expenses |
|
|
(4,671) |
|
|
4,302 |
|
|
8,276 |
|
Due to affiliates |
|
|
9,700 |
|
|
6,706 |
|
|
18,989 |
|
Other liabilities |
|
|
(3,686) |
|
|
(10,322) |
|
|
(10,487) |
|
Deferred revenue |
|
|
1,603 |
|
|
(1,481) |
|
|
(312) |
|
Net cash provided by operating activities |
|
|
69,090 |
|
|
105,919 |
|
|
194,774 |
|
CASH FLOWS FROM INVESTING ACTIVITIES: |
|
|
|
|
|
|
|
|
|
|
Cash paid for acquisitions and contingent consideration—net of cash acquired |
|
|
(365,698) |
|
|
(413,044) |
|
|
(532,513) |
|
Purchase of fixed assets |
|
|
(10,518) |
|
|
(9,106) |
|
|
(25,472) |
|
Investment and other |
|
|
(500) |
|
|
(24,300) |
|
|
1,530 |
|
Net cash used in investing activities |
|
|
(376,716) |
|
|
(446,450) |
|
|
(556,455) |
|
CASH FLOWS FROM FINANCING ACTIVITIES: |
|
|
|
|
|
|
|
|
|
|
Borrowings under credit facilities |
|
|
1,181,936 |
|
|
300,000 |
|
|
969,125 |
|
Repayments of borrowings under credit facilities |
|
|
(641,987) |
|
|
(461,026) |
|
|
(529,796) |
|
Proceeds from issuance of common stock, net |
|
|
— |
|
|
565,160 |
|
|
— |
|
Proceeds from issuance of convertible preferred units, net |
|
|
643,272 |
|
|
— |
|
|
— |
|
Payments of preferred dividends |
|
|
(3,063) |
|
|
— |
|
|
— |
|
Payments in connection with unit redemption, net |
|
|
(795,894) |
|
|
(61,539) |
|
|
— |
|
Contingent consideration paid |
|
|
(6,224) |
|
|
(12,554) |
|
|
(22,040) |
|
Payments of debt financing costs |
|
|
(32,612) |
|
|
(4,612) |
|
|
(3,743) |
|
Proceeds from exercise of stock options |
|
|
— |
|
|
— |
|
|
838 |
|
Payments on finance lease obligations |
|
|
(271) |
|
|
(198) |
|
|
(176) |
|
Distributions for unitholders |
|
|
(2,754) |
|
|
(2,744) |
|
|
(20,641) |
|
Net cash provided by financing activities |
|
|
342,403 |
|
|
322,487 |
|
|
393,567 |
|
EFFECT OF EXCHANGE RATES ON CASH AND CASH EQUIVALENTS |
|
|
170 |
|
|
(198) |
|
|
79 |
|
CHANGE IN CASH AND CASH EQUIVALENTS |
|
|
34,947 |
|
|
(18,242) |
|
|
31,965 |
|
CASH AND CASH EQUIVALENTS: |
|
|
|
|
|
|
|
|
|
|
Beginning of period |
|
|
16,508 |
|
|
51,455 |
|
|
33,213 |
|
End of period |
|
$ |
51,455 |
|
$ |
33,213 |
|
$ |
65,178 |
See Note 17 for Supplemental Cash Flow Disclosure
See notes to consolidated financial statements
F-8
FOCUS FINANCIAL PARTNERS INC.
CONSOLIDATED STATEMENTS OF MEMBERS’ DEFICIT/SHAREHOLDERS’ EQUITY
FOR THE YEARS ENDED DECEMBER 31, 2017, 2018 AND 2019
(Dollars in thousands)
|
|
|
|
|
|
|
|
|
|
|
|
|
|
|
|
|
|
|
|
|
|
|
|
|
|
Total |
|
|
|
|
|
|
|
|
|
|
|
|
|
|
|
|
|
|
|
|
|
|
|
|
|
|
|
Accumulated |
|
|
|
|
Members’ |
|
|
|
|
|
|
||
|
|
|
Class A |
|
Class B |
|
Additional |
|
Accumulated |
|
Other |
|
|
|
|
Deficit/ |
|
Non- |
|
|
|
||||||||||||
|
|
|
Common Stock |
|
Common Stock |
|
Paid-In |
|
Earnings |
|
Comprehensive |
|
Common |
|
Shareholders' |
|
controlling |
|
Total |
||||||||||||||
|
|
|
Shares |
|
Amount |
|
Shares |
|
Amount |
|
Capital |
|
(Deficit) |
|
Income (Loss) |
|
Units |
|
Equity |
|
Interest |
|
Equity |
||||||||||
|
MEMBERS' DEFICIT—January 1, 2017 |
|
— |
|
$ |
— |
|
|
— |
|
$ |
— |
|
$ |
— |
|
$ |
(405,526) |
|
$ |
(10,739) |
|
$ |
154,382 |
|
$ |
(261,883) |
|
|
— |
|
$ |
(261,883) |
|
Net loss |
|
— |
|
|
— |
|
|
— |
|
|
— |
|
|
— |
|
|
(48,359) |
|
|
— |
|
|
— |
|
|
(48,359) |
|
|
— |
|
|
(48,359) |
|
Issuance of restricted common units in connection with acquisitions and contingent consideration |
|
— |
|
|
— |
|
|
— |
|
|
— |
|
|
— |
|
|
— |
|
|
— |
|
|
27,125 |
|
|
27,125 |
|
|
— |
|
|
27,125 |
|
Accretion of senior preferred units return |
|
— |
|
|
— |
|
|
— |
|
|
— |
|
|
(788) |
|
|
(5,461) |
|
|
— |
|
|
— |
|
|
(6,249) |
|
|
— |
|
|
(6,249) |
|
Accretion of senior preferred units to estimated redemption value |
|
— |
|
|
— |
|
|
— |
|
|
— |
|
|
(2,207) |
|
|
(15,256) |
|
|
— |
|
|
— |
|
|
(17,463) |
|
|
— |
|
|
(17,463) |
|
Accretion of junior preferred units return |
|
— |
|
|
— |
|
|
— |
|
|
— |
|
|
(85) |
|
|
(587) |
|
|
— |
|
|
— |
|
|
(672) |
|
|
— |
|
|
(672) |
|
Accretion of junior preferred units to estimated redemption value |
|
— |
|
|
— |
|
|
— |
|
|
— |
|
|
(1,068) |
|
|
(7,384) |
|
|
— |
|
|
— |
|
|
(8,452) |
|
|
— |
|
|
(8,452) |
|
Issuance of convertible preferred units, redemption, retirement and recapitalization of units, net |
|
— |
|
|
— |
|
|
— |
|
|
— |
|
|
— |
|
|
(320,739) |
|
|
— |
|
|
(177,160) |
|
|
(497,899) |
|
|
— |
|
|
(497,899) |
|
Non-cash equity compensation expense—net of related forfeitures, related to restricted common and incentive units |
|
— |
|
|
— |
|
|
— |
|
|
— |
|
|
34,879 |
|
|
— |
|
|
— |
|
|
— |
|
|
34,879 |
|
|
— |
|
|
34,879 |
|
Currency translation adjustment—net of tax |
|
— |
|
|
— |
|
|
— |
|
|
— |
|
|
— |
|
|
— |
|
|
2,470 |
|
|
— |
|
|
2,470 |
|
|
— |
|
|
2,470 |
|
Distributions for unitholders |
|
— |
|
|
— |
|
|
— |
|
|
— |
|
|
— |
|
|
(2,158) |
|
|
— |
|
|
— |
|
|
(2,158) |
|
|
— |
|
|
(2,158) |
|
MEMBERS’ DEFICIT—December 31, 2017 |
|
— |
|
$ |
— |
|
|
— |
|
$ |
— |
|
$ |
30,731 |
|
$ |
(805,470) |
|
$ |
(8,269) |
|
$ |
4,347 |
|
$ |
(778,661) |
|
$ |
— |
|
$ |
(778,661) |
|
Net loss |
|
— |
|
|
— |
|
|
— |
|
|
— |
|
|
— |
|
|
(47,821) |
|
|
— |
|
|
— |
|
|
(47,821) |
|
|
— |
|
|
(47,821) |
|
Issuance of restricted common units in connection with acquisitions and contingent consideration |
|
— |
|
|
— |
|
|
— |
|
|
— |
|
|
— |
|
|
— |
|
|
— |
|
|
40,389 |
|
|
40,389 |
|
|
— |
|
|
40,389 |
|
Non-cash equity compensation expense |
|
— |
|
|
— |
|
|
— |
|
|
— |
|
|
24,987 |
|
|
— |
|
|
— |
|
|
— |
|
|
24,987 |
|
|
— |
|
|
24,987 |
|
Currency translation adjustment—net of tax |
|
— |
|
|
— |
|
|
— |
|
|
— |
|
|
— |
|
|
— |
|
|
(1,398) |
|
|
— |
|
|
(1,398) |
|
|
— |
|
|
(1,398) |
|
Retirement of treasury stock |
|
— |
|
|
— |
|
|
— |
|
|
— |
|
|
(2,067) |
|
|
— |
|
|
— |
|
|
(842) |
|
|
(2,909) |
|
|
— |
|
|
(2,909) |
|
Distributions for unitholders |
|
— |
|
|
— |
|
|
— |
|
|
— |
|
|
— |
|
|
(2,224) |
|
|
— |
|
|
— |
|
|
(2,224) |
|
|
— |
|
|
(2,224) |
|
Reorganization of equity structure—July 30, 2018 |
|
23,881,002 |
|
|
239 |
|
|
22,499,665 |
|
|
225 |
|
|
(271,307) |
|
|
855,515 |
|
|
9,667 |
|
|
(43,894) |
|
|
550,445 |
|
|
258,670 |
|
|
809,115 |
|
Balance post-reorganization |
|
23,881,002 |
|
|
239 |
|
|
22,499,665 |
|
|
225 |
|
|
(217,656) |
|
|
— |
|
|
— |
|
|
— |
|
|
(217,192) |
|
|
258,670 |
|
|
41,478 |
|
Net loss |
|
— |
|
|
— |
|
|
— |
|
|
— |
|
|
— |
|
|
(590) |
|
|
— |
|
|
— |
|
|
(590) |
|
|
7,324 |
|
|
6,734 |
|
Issuance of common stock |
|
18,648,649 |
|
|
186 |
|
|
— |
|
|
— |
|
|
564,974 |
|
|
— |
|
|
— |
|
|
— |
|
|
565,160 |
|
|
— |
|
|
565,160 |
|
Issuance of common stock in connection with acquisitions and contingent consideration |
|
3,736,252 |
|
|
37 |
|
|
323,607 |
|
|
3 |
|
|
112,424 |
|
|
— |
|
|
— |
|
|
— |
|
|
112,464 |
|
|
— |
|
|
112,464 |
|
Change in non-controlling interest allocation |
|
— |
|
|
— |
|
|
— |
|
|
— |
|
|
(56,222) |
|
|
— |
|
|
— |
|
|
— |
|
|
(56,222) |
|
|
78,151 |
|
|
21,929 |
|
Non-cash equity compensation expenses |
|
— |
|
|
— |
|
|
— |
|
|
— |
|
|
5,412 |
|
|
— |
|
|
— |
|
|
— |
|
|
5,412 |
|
|
— |
|
|
5,412 |
|
Currency translation adjustment—net of tax |
|
— |
|
|
— |
|
|
— |
|
|
— |
|
|
— |
|
|
— |
|
|
(1,824) |
|
|
— |
|
|
(1,824) |
|
|
(1,287) |
|
|
(3,111) |
|
Adjustments of deferred taxes, net of amounts payable under tax receivable agreements and changes from Focus LLC interest transactions |
|
— |
|
|
— |
|
|
— |
|
|
— |
|
|
62,454 |
|
|
— |
|
|
— |
|
|
— |
|
|
62,454 |
|
|
— |
|
|
62,454 |
|
SHAREHOLDERS' EQUITY—December 31, 2018 |
|
46,265,903 |
|
$ |
462 |
|
|
22,823,272 |
|
$ |
228 |
|
$ |
471,386 |
|
$ |
(590) |
|
$ |
(1,824) |
|
$ |
— |
|
$ |
469,662 |
|
$ |
342,858 |
|
$ |
812,520 |
|
Net loss |
|
— |
|
|
— |
|
|
— |
|
|
— |
|
|
— |
|
|
(12,872) |
|
|
— |
|
|
— |
|
|
(12,872) |
|
|
847 |
|
|
(12,025) |
|
Issuance (cancellation) of common stock in connection with exercise of Focus LLC common unit exchange rights |
|
747,523 |
|
|
8 |
|
|
(747,523) |
|
|
(7) |
|
|
22,279 |
|
|
— |
|
|
— |
|
|
— |
|
|
22,280 |
|
|
— |
|
|
22,280 |
|
Issuance of common stock in connection with exercise of Focus LLC incentive unit exchange rights |
|
394,814 |
|
|
4 |
|
|
— |
|
|
— |
|
|
11,963 |
|
|
— |
|
|
— |
|
|
— |
|
|
11,967 |
|
|
— |
|
|
11,967 |
|
Forfeiture of unvested Class A common stock |
|
(12,500) |
|
|
— |
|
|
— |
|
|
— |
|
|
(412) |
|
|
— |
|
|
— |
|
|
— |
|
|
(412) |
|
|
— |
|
|
(412) |
|
Exercise of stock options |
|
25,575 |
|
|
— |
|
|
— |
|
|
— |
|
|
838 |
|
|
— |
|
|
— |
|
|
— |
|
|
838 |
|
|
— |
|
|
838 |
|
Change in non-controlling interest allocation |
|
— |
|
|
— |
|
|
— |
|
|
— |
|
|
(10,895) |
|
|
— |
|
|
— |
|
|
— |
|
|
(10,895) |
|
|
(24,098) |
|
|
(34,993) |
|
Non-cash equity compensation expenses |
|
— |
|
|
— |
|
|
— |
|
|
— |
|
|
3,490 |
|
|
— |
|
|
— |
|
|
— |
|
|
3,490 |
|
|
— |
|
|
3,490 |
|
Currency translation adjustment—net of tax |
|
— |
|
|
— |
|
|
— |
|
|
— |
|
|
— |
|
|
— |
|
|
525 |
|
|
— |
|
|
525 |
|
|
243 |
|
|
768 |
|
Adjustments of deferred taxes, net of amounts payable under tax receivable agreements and changes from Focus LLC interest transactions |
|
— |
|
|
— |
|
|
— |
|
|
— |
|
|
(463) |
|
|
— |
|
|
— |
|
|
— |
|
|
(463) |
|
|
— |
|
|
(463) |
|
SHAREHOLDERS' EQUITY—December 31, 2019 |
|
47,421,315 |
|
$ |
474 |
|
|
22,075,749 |
|
$ |
221 |
|
$ |
498,186 |
|
$ |
(13,462) |
|
$ |
(1,299) |
|
$ |
— |
|
$ |
484,120 |
|
$ |
319,850 |
|
$ |
803,970 |
See notes to consolidated financial statements
F-9
FOCUS FINANCIAL PARTNERS INC.
NOTES TO CONSOLIDATED FINANCIAL STATEMENTS
FOR THE YEARS ENDED DECEMBER 31, 2017, 2018 AND 2019
(In thousands, except unit data, share and per share amounts)
Organization
Focus Financial Partners Inc. (“Focus Inc.”) was formed as a Delaware corporation on July 29, 2015 for the sole purpose of completing its initial public offering (the "IPO") and related reorganization transactions (the "Reorganization Transactions") in order to carry on the business of Focus Financial Partners, LLC and its subsidiaries (“Focus LLC”). On July 30, 2018, Focus Inc. became the managing member of Focus LLC and operates and controls the businesses and affairs of Focus LLC.
Focus LLC is a Delaware limited liability company that was formed in November 2004. Focus LLC’s subsidiaries commenced revenue generating and acquisition activities in January 2006. Focus LLC’s activities were governed by its Third Amended and Restated Operating Agreement, as amended, through July 30, 2018 and then its Fourth Amended and Restated Operating Agreement, as amended (the “Operating Agreement”), effective on July 30, 2018.
The consolidated financial statements for periods prior to July 30, 2018 reflect the historical results of operations and financial position of Focus LLC. The consolidated financial statements for periods after July 30, 2018 reflect the results of operations and financial position of Focus Financial Partners Inc. and its subsidiaries (the “Company”).
Business
The Company is in the business of acquiring and overseeing independent fiduciary wealth management and related businesses. The Company typically acquires 100% of the net assets of the wealth management businesses on terms that are generally consistent for each acquisition. To determine the acquisition price, the Company first estimates the operating cash flow of the business to be acquired based on current and projected levels of revenue and expense. For this purpose, the Company defines operating cash flow as cash revenue of the business, less cash expenses, other than compensation and benefits to the selling entrepreneurs or individuals who typically become principals of the management entities discussed below. The Company refers to the estimated operating cash flow earnings before partner compensation as target earnings (“Target Earnings”). The acquisition price is a multiple of a portion of the Target Earnings, referred to as base earnings (“Base Earnings”).
At the date of each of the respective acquisitions, the Company typically enters into a management agreement (“Management Agreement”) with a management company (“Management Company”) that is owned substantially by the selling principals of the acquired businesses. The Management Company earns management fees to manage the daily operations of the acquired business. The terms of the Management Agreements are generally six years with automatic renewals for consecutive one-year terms, unless terminated by either the Management Company or the Company. Under the Management Agreement, the Management Company is entitled to management fees typically consisting of all future earnings of the acquired business in excess of the Base Earnings up to Target Earnings, plus a percentage of any earnings in excess of Target Earnings. The Company, through its respective operating subsidiary, retains a cumulative preferred position in the Base Earnings. To the extent earnings of an acquired business in any year are less than the Base Earnings, in the following year the Company, through its respective operating subsidiary, is entitled to receive the Base Earnings together with the prior years’ shortfall before any management fees are earned by the Management Company. Since each Management Company is neither acquired nor consolidated, management fees are included in the Company’s consolidated statements of operations as operating expenses. Estimated management fees due are included in due to affiliates in the accompanying consolidated balance sheets.
F-10
FOCUS FINANCIAL PARTNERS INC.
NOTES TO CONSOLIDATED FINANCIAL STATEMENTS
FOR THE YEARS ENDED DECEMBER 31, 2017, 2018 AND 2019
(In thousands, except unit data, share and per share amounts)
2. SUMMARY OF SIGNIFICANT ACCOUNTING POLICIES
Basis of Presentation
The accompanying consolidated financial statements have been prepared in accordance with accounting principles generally accepted in the United States of America (“U.S. GAAP”). The consolidated financial statements include the accounts of the Company and its subsidiaries. The Company consolidates Focus LLC and its subsidiaries' financial statements and records the interests in Focus LLC consisting of common units and the common unit equivalent of incentive units of Focus LLC that the Company does not own as non-controlling interests, see Note 4. Non-controlling interests were measured initially at the proportionate share of Focus LLC's identifiable net assets at the date of the IPO. Intercompany transactions and balances have been eliminated in consolidation.
Use of Estimates
The preparation of the consolidated financial statements in conformity with U.S. GAAP requires management to make estimates and assumptions that affect the reported amounts of assets and liabilities and disclosure of contingent assets and liabilities at the date of the financial statements and the reported amounts of revenue and expenses during the reporting period. Actual results could differ from those estimates.
Loss Per Share
Loss per share is computed in accordance with Accounting Standards Codification ("ASC") Topic 260, Earnings Per Share. Basic loss per share is computed by dividing the net loss attributable to common shareholders by the weighted average number of shares outstanding for that period. Diluted loss per share is calculated by dividing the net loss attributable to common shareholders by the diluted weighted average shares outstanding for that period. Diluted loss per share includes the determinants of the basic loss per share and, in addition, if the effect is dilutive, reflects the dilutive effect of shares of common stock related to the Company's share based compensation plans, with no adjustments to net loss attributable to common shareholders for dilutive potential common shares.
Revenue Recognition
Wealth Management Fees
The Company recognizes revenue from wealth management fees, which are primarily comprised of fees earned for advising on the assets of clients, financial and tax planning fees, consulting fees, tax return preparation fees, fees for family office services, and fees for wealth management and operational support services provided to third-party wealth management firms. Client arrangements may contain a single or multiple performance obligations, each of which are separately identifiable and accounted for as the related services are provided and consumed over time. Fees are primarily based either on a contractual percentage of the client’s assets, a flat fee, an hourly rate or a combination of such fees and are billed either in advance or arrears on a monthly, quarterly, or semiannual basis and such fees earned as the services are performed over time. Revenue for wealth management and operational support services provided to third-party wealth management firms is presented net since these services are performed in an agent capacity. Wealth management fees are recorded when: (i) an arrangement with a client has been identified; (ii) the performance obligations have been identified; (iii) the fee or other transaction price has been determined; (iv) the fee or other transaction price has been allocated to each performance obligation; and (v) the Company has satisfied the applicable performance obligation.
F-11
FOCUS FINANCIAL PARTNERS INC.
NOTES TO CONSOLIDATED FINANCIAL STATEMENTS
FOR THE YEARS ENDED DECEMBER 31, 2017, 2018 AND 2019
(In thousands, except unit data, share and per share amounts)
Other
Other revenue includes fees earned for recordkeeping and administration services provided to employee benefit plans as well as commissions and distribution fees and outsourced services. Client arrangements may contain a single or multiple performance obligations, each of which are separately identifiable and accounted for as the related services are provided and consumed over time. Recordkeeping and administration and outsourced services revenue, in accordance with the same five criteria above, are recognized over the period in which services are provided. Commissions and distribution fees are recognized when earned.
The Company disaggregates revenue based on the above two categories. The Company does not allocate revenue by the type of service provided in connection with providing holistic wealth management client services. The Company generally manages its business based on the operating results of the enterprise taken as a whole, not by geographic region. The following table disaggregates the revenues based on the location of the partner firm legal entities that generate the revenues and therefore may not be reflective of the geography in which clients are located for the years ended December 31, 2017, 2018 and 2019:
|
|
|
|
|
|
|
|
|
|
|
|
|
|
|
|
|
|
|
|
|
|
|
|
|
2017 |
|
2018 |
|
2019 |
|||
|
Domestic revenue |
|
$ |
643,077 |
|
$ |
889,166 |
|
$ |
1,170,169 |
|
International revenue |
|
|
19,810 |
|
|
21,714 |
|
|
48,172 |
|
Total revenue |
|
$ |
662,887 |
|
$ |
910,880 |
|
$ |
1,218,341 |
International revenue consists of revenue generated by partner firm legal entities in the United Kingdom, Canada and Australia.
Deferred Revenue
Fees collected in advance are deferred and recognized in revenue over the period earned with the unrecognized portion of fees collected in advance recorded as deferred revenue in the accompanying consolidated balance sheets.
Cash and Cash Equivalents
The Company considers all highly liquid instruments with a maturity of three months or less when purchased to be cash equivalents.
Accounts Receivable
Accounts receivable are stated at their net realizable value. Allowances for uncollectible accounts are maintained for estimated losses resulting from the inability of customers to make required payments. In determining these estimates, historical write-offs, the aging of the receivables and other factors, such as overall economic conditions, are considered.
Fixed Assets
Fixed assets are initially recorded at cost and are depreciated using the straight-line method over their estimated useful lives. The estimated useful lives for fixed assets, primarily consisting of computers, equipment, and furniture and fixtures, are generally between three to seven years. Leasehold improvements are amortized over the shorter of their
F-12
FOCUS FINANCIAL PARTNERS INC.
NOTES TO CONSOLIDATED FINANCIAL STATEMENTS
FOR THE YEARS ENDED DECEMBER 31, 2017, 2018 AND 2019
(In thousands, except unit data, share and per share amounts)
estimated economic useful lives or the terms of the leases. The costs of improvements that extend the life of a fixed asset are capitalized, while the costs of repairs and maintenance are expensed as incurred.
The Company capitalizes costs related to computer software obtained or developed for internal use. Costs incurred in the application development phase are capitalized and amortized over their useful lives, which are generally three to five years.
Debt Financing Costs
Direct costs incurred with obtaining debt financing are capitalized or recorded as a reduction of the underlying debt. The costs are amortized over the respective term of the underlying debt and are included in amortization of debt financing costs in the accompanying consolidated statements of operations.
Business Acquisitions
Business acquisitions are accounted for in accordance with ASC Topic 805: Business Combinations. Business acquisitions are accounted for by allocating the purchase price consideration to the fair value of assets acquired and liabilities assumed. Goodwill is recognized as the excess of the purchase price consideration over the fair value of net assets of the business acquired. All transaction costs are expensed as incurred.
The Company has incorporated contingent consideration, or earn out provisions, into the structure of its business acquisitions. These arrangements may result in the payment of additional purchase price consideration to the sellers based on the growth of certain financial thresholds for periods following the closing of the respective acquisition. The additional purchase price consideration is payable in the form of cash and, in some cases, equity.
The Company recognizes the fair value of estimated contingent consideration at the acquisition date as part of the consideration transferred in exchange for the acquired business. The contingent consideration is remeasured to fair value at each reporting date until the contingency is resolved. Any changes in fair value are recognized each reporting period in non-cash changes in fair value of estimated contingent consideration in the accompanying consolidated statements of operations.
The results of the acquired businesses have been included in the Company’s consolidated financial statements from the respective dates of acquisition.
Equity Method Investments
The Company applies the equity method of accounting to investments where the Company has the ability to exercise significant influence over operating and financial matters. Equity method investments are periodically reviewed for impairment. The Company’s equity method investments are included in prepaid expenses and other assets in the consolidated balance sheets.
Goodwill, Intangible Assets and Other Long-Lived Assets
Goodwill is deemed to have an indefinite useful life and is not amortized. Intangible and other long-lived assets are amortized over their respective estimated useful lives. The Company has no indefinite-lived intangible assets.
Goodwill is tested annually for impairment as of October 1, or more frequently if events and circumstances change that would more likely than not reduce the fair value of a reporting unit below its carrying amount. A two-step impairment test is performed on goodwill. In the first step, the Company compares the fair value of the reporting unit to
F-13
FOCUS FINANCIAL PARTNERS INC.
NOTES TO CONSOLIDATED FINANCIAL STATEMENTS
FOR THE YEARS ENDED DECEMBER 31, 2017, 2018 AND 2019
(In thousands, except unit data, share and per share amounts)
the carrying value of the net assets of the reporting unit. The fair value of the reporting unit is determined using a market approach. If the fair value of the reporting unit exceeds the carrying value of the net assets of the reporting unit in the first step, no further testing is performed. If the carrying value exceeds the fair value of the reporting unit in the first step, then the Company performs the second step of the impairment test to determine the implied fair value of goodwill and compares the implied fair value of goodwill to the carrying value of goodwill to determine the extent of the impairment, if any.
In March 2018, the Company modified the manner in which it assesses goodwill for impairment. The Company determined for the purpose of its annual goodwill impairment test that its reporting units should be aggregated into one reporting unit. The Company’s determination was based on the Company’s reporting units having similar economic and business characteristics, and the services performed by the reporting units are wealth management related and that the reporting units are subject to a similar regulatory framework. The Company believes that the resulting change in accounting principle related to the reporting unit utilized in the annual goodwill impairment test did not delay, accelerate or avoid an impairment charge. The Company determined that the change in accounting principle related to the reporting unit used in the Company’s annual impairment test is appropriate based on the nature of the Company’s business. The change would not have had an impact on the results of the Company’s impairment test for 2017.
Intangible assets and other long-lived assets are reviewed for impairment whenever events or changes in circumstances indicate that the asset might be impaired or that the estimated useful life should be changed prospectively. If impairment indicators are present, the recoverability of these assets is measured by a comparison of the carrying amount of the asset to estimated undiscounted future cash flows expected to be generated by the asset. If the carrying amount of the asset exceeds its estimated undiscounted future cash flows, an impairment charge is recognized by the amount by which the carrying amount of the asset exceeds the fair value of the asset, which is determined using a discounted cash flow approach.
Fair Value of Financial Instruments
The carrying amounts of substantially all of the Company’s financial assets and liabilities are considered to approximate their fair values because of their short-term nature. The carrying amount of revolver borrowings under the Credit Facility (as defined below) approximates fair value, as the debt bears interest at selected short-term variable market rates. The Company measures the implied fair value of its First Lien Term Loan (as defined below) using trading levels obtained from a third-party service provider; accordingly, these borrowings are classified within Level 2 of the valuation hierarchy. See Note 8 for further information regarding the Company’s fair value measurements.
Income Taxes
In connection with the IPO and Reorganization Transactions, Focus Inc. became a holding company whose most significant asset is a membership interest in Focus LLC, and, as a result, Focus Inc. became subject to U.S. federal, state and local income taxes on Focus Inc.'s allocable portion of taxable income from Focus LLC. Focus LLC is treated as a partnership for U.S. federal income tax purposes. Accordingly, Focus LLC is generally not and has not been subject to U.S. federal and certain state income taxes at the entity level, although it has been subject to the New York City Unincorporated Business Tax and certain of its subsidiaries have been subject to U.S. federal and certain state and local or foreign income taxes. Instead, for U.S. federal and certain state income tax purposes, the income, deductions, losses and credits of Focus LLC are passed through to its unitholders, which after the IPO includes Focus Inc. Focus LLC has historically made tax distribution payments in accordance with its Third Amended and Restated Operating Agreement, which was replaced by the Operating Agreement on July 30, 2018, and Focus Inc. intends to cause Focus LLC to continue to make tax distribution payments, to the extent of available cash, in accordance with the Operating Agreement. Focus Inc. files income tax returns with the U.S. federal government as well as various state and local jurisdictions.
F-14
FOCUS FINANCIAL PARTNERS INC.
NOTES TO CONSOLIDATED FINANCIAL STATEMENTS
FOR THE YEARS ENDED DECEMBER 31, 2017, 2018 AND 2019
(In thousands, except unit data, share and per share amounts)
The asset and liability method is applied for deferred income taxes. Deferred tax assets and liabilities are recognized on a net basis for each tax paying component for future tax consequences attributable to differences between the financial statement carrying amounts of existing assets and liabilities and their respective tax basis. Deferred tax assets and liabilities are measured using tax rates expected to apply to taxable income in years in which those temporary differences are expected to be recovered or settled. Valuation allowances, if any, are recorded to reduce the deferred tax assets to an amount that is more likely than not to be realized.
The Company reviews and evaluates tax positions in its major tax jurisdictions and determines whether or not there are uncertain tax positions that require financial statement recognition. Based on this review, no reserves for uncertain tax positions were recorded at December 31, 2018 and 2019.
Segment Reporting
Management has determined that the Company operates in one operating segment, as a wealth management focused organization, which is consistent with its structure and how the Company manages the business. The Company’s acquired businesses have similar economic and business characteristics. The services provided are wealth management related and the Company's businesses are subject to a similar regulatory framework. Furthermore, the Company’s Chief Operating Decision Maker, which is the Company’s Chief Executive Officer, monitors and reviews financial information at a consolidated level for assessing operating results and the allocation of resources.
Translation of Non-U.S. Currency Amounts
Assets and liabilities of non-U.S. subsidiaries and equity method investments that have a foreign currency as their functional currency are re-measured to U.S. dollars at year-end exchange rates, and revenues and expenses are re-measured at average rates of exchange prevailing during the year. The resulting translation adjustments are recorded in accumulated other comprehensive income (loss). Gains or losses resulting from foreign currency transactions are included in other (expense) income—net in the consolidated statements of operations.
Consolidation Considerations
ASC Topic 810, Consolidations, requires an entity to perform a qualitative analysis to determine whether its variable interests give it a controlling financial interest in a variable interest entity (“VIE”). Under the standard, an enterprise has a controlling financial interest when it has (a) the power to direct the activities of a VIE that most significantly impact the entity’s economic performance and (b) the obligation to absorb losses of the entity or the right to receive benefits from the entity that could potentially be significant to the VIE. An enterprise that holds a controlling financial interest is deemed to be the primary beneficiary and is required to consolidate the VIE.
The Company’s subsidiaries have Management Agreements with the respective Management Company, which causes these Company subsidiaries to be VIEs. The Company has assessed whether or not it is the primary beneficiary for these subsidiaries and has concluded that it is the primary beneficiary. Accordingly, the results of these subsidiaries have been consolidated.
Certain of the Company’s subsidiaries have variable interests in certain investment funds that are deemed voting interest entities. Due to substantive kick-out rights possessed by the limited partners of these funds, the Company does not consolidate the investment funds.
From time to time, the Company enters into option agreements with wealth management businesses (the “Optionee”). In exchange for payment of an option premium, the option agreement allows the Company, at its sole discretion, to acquire the Optionee at a predetermined time and at a predetermined purchase price formula. If the
F-15
FOCUS FINANCIAL PARTNERS INC.
NOTES TO CONSOLIDATED FINANCIAL STATEMENTS
FOR THE YEARS ENDED DECEMBER 31, 2017, 2018 AND 2019
(In thousands, except unit data, share and per share amounts)
Company chooses to exercise its option to acquire the Optionee, the acquisition and the corresponding Management Agreement would be executed in accordance with the Company’s typical acquisition structure as discussed in Note 1. If the Company chooses not to exercise the option, the option premium would be recorded as a loss on investment in the consolidated statements of operations in the period that the option expires. Option premiums paid by the Company of $4,300 and $0 are included in prepaid expenses and other assets in the consolidated balance sheets as of December 31, 2018 and 2019, respectively. The Company has determined that the respective option agreements with the Optionees qualify the Optionees as VIEs. The Company has determined that it is not the primary beneficiary of the Optionees and does not consolidate the results of the Optionees.
Stock Based Compensation Costs
Compensation cost for unit and stock based awards is measured based on the fair value of the unit and stock based awards determined by the Black-Scholes option pricing model or the Monte Carlo Simulation Model on the date that the unit and stock based awards are granted or modified, and is adjusted for the estimated number of awards that are expected to be forfeited. Compensation cost for unvested Class A common stock and restricted stock units are measured based on the market value of the Company’s Class A common stock on the date that the awards are granted and is adjusted for the estimated number of awards that are expected to be forfeited. The compensation cost is recognized on a straight-line basis over the requisite service period. Non-cash equity compensation expense, associated with employees and non-employees, including principals in the management companies, is included in compensation and related expenses in the consolidated statements of operations. The Company estimates forfeitures at the time of the respective grant and revises those estimates in subsequent periods if actual forfeitures differ materially from those estimates. The Company uses historical data to estimate forfeitures and records non-cash equity compensation expense only for those awards that are expected to vest.
Leases
The Company leases office space in various locations under noncancelable lease agreements. Many of these lease agreements provide for tenant improvement allowances, rent increases, and/or rent-free periods. Rent expense is recognized on a straight-line basis commencing with the possession date of the property, which is typically the earlier of the lease commencement date or the date when the Company takes possession of the property. Rent expense is included in selling, general and administrative expenses in the consolidated statements of operations.
In February 2016, the Financial Accounting Standards Board (“FASB”) issued Accounting Standards Update (“ASU”) No. 2016-02, “Leases (Topic 842).” ASU No. 2016-02, as amended, requires lessees to put most leases on their balance sheets but recognize the expenses in their income statements in a manner similar to current practice. ASU 2016-02 states that a lessee would recognize a lease liability for the obligation to make lease payments and a right of use asset for the right to use the underlying asset for the lease term. ASU No. 2016-02 was effective for the Company for interim and annual periods beginning January 1, 2019. The Company adopted ASU No. 2016-02 effective January 1, 2019 using a modified retrospective method and therefore has not restated comparative periods. The Company elected to use the package of practical expedients to assist in the transition, which includes not reassessing the identification and classification of leases, among other things. Based on the portfolio of leases as of January 1, 2019, the Company recognized approximately $144,000 of lease liabilities and $134,000 of right of use assets (which reflects the reclassification of previous deferred rent balances into the right of use asset as required under the transition guidance) on the balance sheet, primarily related to operating leases for real estate. There was no material impact to the consolidated statement of operations and comprehensive loss or consolidated statement of cash flows as a result of adoption of this new guidance. Refer to Note 13 for further information regarding leases.
F-16
FOCUS FINANCIAL PARTNERS INC.
NOTES TO CONSOLIDATED FINANCIAL STATEMENTS
FOR THE YEARS ENDED DECEMBER 31, 2017, 2018 AND 2019
(In thousands, except unit data, share and per share amounts)
Recent Accounting Pronouncements
In January 2017, the FASB issued ASU No. 2017-04, “Simplifying the Test for Goodwill Impairment,” which removes the second step of the goodwill impairment test that requires a hypothetical purchase price allocation. A goodwill impairment will now be the amount by which a reporting unit’s carrying value exceeds its fair value, not to exceed the carrying amount of goodwill. ASU No. 2017-04 is effective for interim and annual reporting periods beginning after December 15, 2019 and will be applied prospectively, early adoption is permitted. ASU No. 2017-04 is not expected to have a material effect on the Company’s consolidated financial statements.
In June 2018, the FASB issued ASU No. 2018-07, "Improvements to Nonemployee Share-Based Payment Accounting," which simplifies the accounting for share-based payments to nonemployees by aligning it with the accounting for share-based payments to employees, with certain exceptions. ASU No. 2018-07 was effective for fiscal years beginning after December 15, 2018, including interim periods within that fiscal year. The adoption of ASU No. 2018-07 on January 1, 2019 did not have a material effect on the Company's consolidated financial statements.
In December 2019, the FASB issued ASU No. 2019-12, “Simplifying the Accounting for Income Taxes,” which simplifies the accounting for income taxes, eliminates certain exceptions within ASC 740, Income Taxes, and clarifies certain aspects of the current guidance to promote consistency among reporting entities. ASU No. 2019-12 is effective for fiscal years beginning after December 15, 2020, with early adoption permitted. Most amendments within the standard are required to be applied on a prospective basis, while certain amendments must be applied on a retrospective or modified retrospective basis. The Company is currently evaluating the impacts of the provisions of ASU No. 2019-12 on the Company's consolidated financial statements.
3. IPO, REORGANIZATION TRANSACTIONS AND USE OF PROCEEDS
Initial Public Offering
On July 30, 2018, the Company completed its IPO of 18,648,649 shares of its Class A common stock, par value $0.01 per share, including 2,432,432 shares of Class A common stock sold in connection with the full exercise of the option to purchase additional shares granted to the underwriters, at a price to the public of $33.00 per share. The shares began trading on the NASDAQ Global Select Market on July 26, 2018 under the ticker symbol “FOCS.”
Reorganization Transactions
In connection with the IPO, Focus LLC completed the Reorganization Transactions. The equity interests in Focus LLC at the date of the IPO consisted of convertible preferred units (the “Convertible Preferred Units”), common units and incentive units, each incentive unit having a hurdle amount similar to the exercise price of a stock option. The owners of Focus LLC units immediately prior to the IPO (“Existing Owners”) primarily included (i) affiliates of Focus LLC’s private equity investors (“Private Equity Investors”), (ii) members of management of Focus LLC, (iii) current and former principals of independent fiduciary wealth management and related businesses acquired by Focus LLC and (iv) current and former employees of Focus LLC.
The following steps were implemented in connection with the Reorganization Transactions:
|
· |
Focus LLC purchased, utilizing existing working capital, all common units held by Existing Owners who were non-accredited investors, as defined by Rule 501 of Regulation D, at a purchase price per unit equal to 1.25 times the IPO price of $33.00 per share (“Gross IPO Price”). Focus LLC accelerated the vesting of |
F-17
FOCUS FINANCIAL PARTNERS INC.
NOTES TO CONSOLIDATED FINANCIAL STATEMENTS
FOR THE YEARS ENDED DECEMBER 31, 2017, 2018 AND 2019
(In thousands, except unit data, share and per share amounts)
all unvested incentive units held by Existing Owners who were non-accredited investors and converted the incentive units of each such holder into a number of common units equal to (i) the number of such incentive units times the Gross IPO Price, minus the aggregate hurdle amount of such incentive units, divided by (ii) the Gross IPO Price (the “Appropriate Conversion Number”). Focus LLC then purchased all common units issued upon such conversion at a purchase price per unit equal to 1.25 times the Gross IPO Price. Focus LLC paid a total of $26,001 to Existing Owners who were non-accredited investors. |
|
· |
Existing Owners who were accredited investors and held fewer than 85,000 common units and incentive units in the aggregate are referred to as “Mandatorily Exchanging Owners.” Focus LLC converted all vested and unvested incentive units of Mandatorily Exchanging Owners into the Appropriate Conversion Number of vested and unvested common units, respectively. Mandatorily Exchanging Owners were given an election to sell up to 100% of their vested common units (after giving effect to such conversion) to the Company at the Gross IPO Price less the underwriting discount (the “Net IPO Price”), subject to cut‑backs depending on the proceeds available from the IPO. The vested and unvested common units of a Mandatorily Exchanging Owner not sold were exchanged for an equal number of shares of vested Class A common stock and unvested Class A common stock of the Company. Mandatorily Exchanging Owners of vested common units issued upon conversion of vested incentive units and not sold received (i) vested non‑compensatory stock options of the Company to purchase a number of shares of Class A common stock of the Company equal to (A) the number of vested incentive units that were converted into such vested common units minus (B) the number of shares of vested Class A common stock issued in such exchange and (ii) cash in an amount equal to 65% of the fair market value of such non‑compensatory stock options. Mandatorily Exchanging Owners of unvested common units issued upon conversion of unvested incentive units and not sold received unvested compensatory stock options of the Company to purchase a number of shares of Class A common stock of the Company equal to (i) the number of unvested incentive units that were converted into such unvested common units minus (ii) the number of shares of unvested Class A common stock issued in such exchange. |
|
· |
Existing Owners who were accredited investors and held 85,000 or more common units and incentive units in the aggregate were given an election to sell up to 100% of their vested common units and vested incentive units (after conversion into the Appropriate Conversion Number of common units) to the Company at the Net IPO Price, subject to cut-backs depending on the proceeds available from the IPO. These Existing Owners were also given an election to exchange all or a portion of their remaining common units and incentive units for vested and unvested Class A common stock of the Company. These Existing Owners continue to hold their common units and incentive units of Focus LLC remaining after any such sale or exchange. |
|
· |
All outstanding Convertible Preferred Units were converted into common units on a one-for-one basis. The common units held by certain affiliates of the Company’s private equity investors were distributed to their owners, some of which were entities treated as corporations for U.S. federal income tax purposes, which are referred to as “blockers.” Each blocker then merged with a separate newly formed subsidiary of Focus Inc., with the blocker as the surviving entity. Each owner of each blocker received consideration in the merger equal to one share of Class A common stock for each common unit held. Certain of the common units not held by blockers were exchanged for shares of Class A common stock of the Company. |
Existing Owners who hold common units of Focus LLC after the Reorganization Transactions ("continuing owners") received shares of Class B common stock of the Company. Shares of Class B common stock do not entitle their holders to any economic rights. Holders of Class A common stock and Class B common stock of the Company vote together as a single class on all matters presented to the shareholders of the Company for their vote or approval, except as otherwise required by applicable law. Each share of Class B common stock entitles its holder to one vote.
F-18
FOCUS FINANCIAL PARTNERS INC.
NOTES TO CONSOLIDATED FINANCIAL STATEMENTS
FOR THE YEARS ENDED DECEMBER 31, 2017, 2018 AND 2019
(In thousands, except unit data, share and per share amounts)
In connection with the Reorganization Transactions, the Company issued an aggregate of 23,881,002 shares of Class A common stock, non-compensatory stock options to purchase an aggregate of 386,832 shares of Class A common stock, compensatory stock options to purchase an aggregate of 348,577 shares of Class A common stock and an aggregate of 22,499,665 shares of Class B common stock. Due to certain post-closing adjustments, the Company cancelled 240,457 shares of Class A common stock and issued 240,457 shares of Class B common stock effective as of the closing date of the IPO.
Use of Proceeds
The Company received $565,160 of net proceeds from the sale of the Class A common stock in the IPO including $74,651 in connection with the full exercise of the option to purchase additional shares granted to the underwriters. The Company used $11,137 of the net proceeds to pay Mandatorily Exchanging Owners who elected to sell their units of Focus LLC and $24,400 to pay other Existing Owners who elected to sell their units of Focus LLC. The Company contributed $529,623 of the net proceeds from the IPO to Focus LLC in exchange for 17,583,947 common units of Focus LLC. Focus LLC used $392,535 of such contribution to reduce indebtedness under its Credit Facility (as defined below). The remaining $137,088 of such contribution was used by Focus LLC for acquisitions and general corporate business purposes.
4. NON-CONTROLLING INTERESTS AND LOSS PER SHARE
Historical loss per share information is not applicable for reporting periods prior to the consummation of the IPO. Net loss attributable to common shareholders is the net loss recorded by the Company based on its interest in Focus LLC during the respective period after the IPO.
The calculation of controlling and non-controlling interest is as follows as of December 31, 2018 and 2019:
|
|
|
2018 |
|
|
2019 |
|
|
Focus LLC common units held by continuing owners |
|
22,823,272 |
|
|
22,075,749 |
|
|
Common unit equivalents of outstanding vested and unvested incentive units held by continuing owners(1) |
|
5,139,653 |
|
|
5,731,995 |
|
|
Total common units and common unit equivalents attributable to non-controlling interest |
|
27,962,925 |
|
|
27,807,744 |
|
|
Total common units and common unit equivalents of incentive units outstanding |
|
74,228,828 |
|
|
75,229,059 |
|
|
Non-controlling interest allocation |
|
37.7 |
% |
|
37.0 |
% |
|
Company’s interest in Focus LLC |
|
62.3 |
% |
|
63.0 |
% |
|
(1) |
Focus LLC common units issuable upon conversion of 18,597,474 and 19,754,450 (see Note 10) vested and unvested Focus LLC incentive units outstanding as of December 31, 2018 and 2019, respectively, were calculated using the common unit equivalent of vested and unvested Focus LLC incentive units based on the closing price of the Company’s Class A common stock on the last trading day of the period. |
F-19
FOCUS FINANCIAL PARTNERS INC.
NOTES TO CONSOLIDATED FINANCIAL STATEMENTS
FOR THE YEARS ENDED DECEMBER 31, 2017, 2018 AND 2019
(In thousands, except unit data, share and per share amounts)
The below table contains a reconciliation of net loss to net loss attributable to common shareholders for the years ended December 31, 2018 and 2019:
|
|
|
2018 |
|
2019 |
|
||
|
Net loss |
|
$ |
(41,087) |
|
$ |
(12,025) |
|
|
Net loss attributable to members of Focus LLC (for the respective period through the IPO) |
|
|
47,821 |
|
|
— |
|
|
Non-controlling interest subsequent to the IPO |
|
|
(7,324) |
|
|
(847) |
|
|
Net loss attributable to common shareholders |
|
$ |
(590) |
|
$ |
(12,872) |
|
The calculation of basic and diluted loss per share is described below:
Basic loss per share is calculated utilizing net loss attributable to common shareholders divided by the weighted average number of shares of Class A common stock outstanding during the same period:
|
|
|
Period July 30, |
|
|
|
|
|
|
|
|
|
2018 through |
|
|
Year Ended |
|
||
|
|
|
December 31, 2018 |
|
|
December 31, 2019 |
|
||
|
Basic loss per share: |
|
|
|
|
|
|
|
|
|
Net loss attributable to common shareholders |
|
$ |
(590) |
|
|
$ |
(12,872) |
|
|
Weighted average shares of Class A common stock outstanding |
|
|
43,122,782 |
|
|
|
46,792,389 |
|
|
Basic loss per share |
|
$ |
(0.01) |
|
|
$ |
(0.28) |
|
Diluted loss per share is calculated utilizing net loss attributable to common shareholders divided by the weighted average number of shares of Class A common stock outstanding during the same period plus the effect, if any, of the potentially dilutive shares of the Company’s Class A common stock from stock options, unvested Class A common stock and restricted stock units as calculated using the treasury stock method.
|
|
|
Period July 30, |
|
|
||
|
|
|
2018 through |
|
Year Ended |
||
|
|
|
December 31, 2018 |
|
December 31, 2019 |
||
|
Diluted loss per share: |
|
|
|
|
|
|
|
Net loss attributable to common shareholders |
|
$ |
(590) |
|
$ |
(12,872) |
|
Weighted average shares of Class A common stock outstanding |
|
|
43,122,782 |
|
|
46,792,389 |
|
Effect of dilutive stock options |
|
|
— |
|
|
— |
|
Effect of dilutive unvested Class A common stock and restricted stock units |
|
|
— |
|
|
— |
|
Total |
|
|
43,122,782 |
|
|
46,792,389 |
|
Diluted loss per share |
|
$ |
(0.01) |
|
$ |
(0.28) |
Diluted loss per share for the period July 30, 2018 through December 31, 2018 excludes incremental shares of 52,555 related to time-based stock options and incremental shares of 49,994 related to unvested Class A common stock, since the effect would be antidilutive. Diluted loss per share for the period July 30, 2018 through December 31, 2018 also excludes shares related to 155,000 market-based stock options that vest on the fifth anniversary of the pricing of the IPO if the volume weighted average per share price for any ninety calendar day period within such five year period immediately following the pricing of the IPO reaches at least $100. Such market-based criteria were not met at December 31, 2018.
F-20
FOCUS FINANCIAL PARTNERS INC.
NOTES TO CONSOLIDATED FINANCIAL STATEMENTS
FOR THE YEARS ENDED DECEMBER 31, 2017, 2018 AND 2019
(In thousands, except unit data, share and per share amounts)
Diluted loss per share for the year ended December 31, 2019 excludes incremental shares of 373 related to time-based stock options and incremental shares of 20,055 related to unvested Class A common stock and restricted stock units, since the effect would be antidilutive. Diluted loss per share for the year ended December 31, 2019 also excludes shares related to 155,000 market-based stock options that vest on the fifth anniversary of the pricing of the IPO if the volume weighted average per share price for any ninety calendar day period within such five year period immediately following the pricing of the IPO reaches at least $100. Such market-based criteria were not met at December 31, 2019.
Focus LLC common and incentive units may be exchanged for Class A common stock, subject to certain limitations (see Note 10). Such exchange is not reflected in diluted loss per share as the assumed exchange is not dilutive.
5. ACQUISITIONS
Business Acquisitions
The purchase price associated with business acquisitions and the allocation thereof during the years ended December 31, 2017, 2018 and 2019, is summarized as follows:
|
|
|
2017 |
|
2018 |
|
2019 |
|||
|
Number of business acquisitions closed |
|
|
23 |
|
|
19 |
|
|
31 |
|
Consideration: |
|
|
|
|
|
|
|
|
|
|
Cash and option premium |
|
$ |
362,524 |
|
$ |
408,478 |
|
$ |
507,498 |
|
Cash due subsequent to closing at net present value and estimated working capital adjustment |
|
|
188 |
|
|
39,134 |
|
|
4,341 |
|
Fair market value of Focus LLC common units issued |
|
|
64,728 |
|
|
51,456 |
|
|
— |
|
Fair market value of Class A common stock issued |
|
|
— |
|
|
112,461 |
|
|
— |
|
Fair market value of estimated contingent consideration |
|
|
37,551 |
|
|
42,086 |
|
|
82,781 |
|
Total consideration |
|
$ |
464,991 |
|
$ |
653,615 |
|
$ |
594,620 |
|
Allocation of purchase price: |
|
|
|
|
|
|
|
|
|
|
Total tangible assets |
|
$ |
6,095 |
|
$ |
14,817 |
|
$ |
50,761 |
|
Total liabilities assumed |
|
|
(12,273) |
|
|
(34,411) |
|
|
(53,394) |
|
Customer relationships |
|
|
244,289 |
|
|
294,785 |
|
|
349,447 |
|
Management contracts |
|
|
27,890 |
|
|
30,080 |
|
|
17,284 |
|
Goodwill |
|
|
198,546 |
|
|
347,496 |
|
|
229,799 |
|
Other acquired intangibles |
|
|
444 |
|
|
848 |
|
|
723 |
|
Total allocated consideration |
|
$ |
464,991 |
|
$ |
653,615 |
|
$ |
594,620 |
Management believes approximately $508,547 of tax goodwill and intangibles related to 2019 business acquisitions will be deductible for tax purposes. Additional tax goodwill may be deductible when estimated contingent consideration is earned and paid.
The accompanying consolidated statement of operations for the year ended December 31, 2019 includes revenue and income from operations for business acquisitions that are new subsidiary partner firms from the date they were acquired of $85,025 and $7,999, respectively.
F-21
FOCUS FINANCIAL PARTNERS INC.
NOTES TO CONSOLIDATED FINANCIAL STATEMENTS
FOR THE YEARS ENDED DECEMBER 31, 2017, 2018 AND 2019
(In thousands, except unit data, share and per share amounts)
Asset Acquisitions
The Company also separately purchases customer relationships and other intangible assets. These purchases are accounted for as asset acquisitions as they do not qualify as business acquisitions pursuant to ASC Topic 805, Business Combinations. The Company completed two, six and three asset acquisitions during the years ended December 31, 2017, 2018 and 2019, respectively. Total purchase consideration for asset acquisitions during the year ended December 31, 2017 was $0. Total purchase consideration, inclusive of transaction costs, for asset acquisitions during the year ended December 31, 2018 was $4,577 in cash and installment payments. Total purchase consideration, inclusive of transaction costs, for asset acquisitions during the year ended December 31, 2019 was $850 in cash. Certain asset acquisitions include contingent consideration provisions. The Company records the contingent consideration as additional purchase consideration when the outcome of the contingency is determinable. During the years ended December 31, 2017, 2018 and 2019, the Company paid $7,713, $2,007 and $3,452, respectively, of additional purchase price consideration related to asset acquisitions.
Intangible assets acquired in asset acquisitions for the years ended December 31, 2017, 2018 and 2019 were as follows:
|
|
|
2017 |
|
2018 |
|
2019 |
|||
|
Customer relationships |
|
$ |
— |
|
$ |
4,352 |
|
$ |
808 |
|
Management contracts |
|
|
— |
|
|
— |
|
|
12 |
|
Other acquired intangibles |
|
|
— |
|
|
225 |
|
|
30 |
|
Total |
|
$ |
— |
|
$ |
4,577 |
|
$ |
850 |
The weighted-average useful life of intangibles acquired during the years ended December 31, 2017, 2018 and 2019 through business acquisitions and asset acquisitions are as follows:
|
|
|
|
|
|
|
|
|
|
|
2017 |
|
2018 |
|
2019 |
|
Management contracts |
|
19 |
|
20 |
|
18 |
|
Customer relationships |
|
10 |
|
10 |
|
9 |
|
Other acquired intangibles |
|
5 |
|
5 |
|
5 |
|
Weighted-average useful life of all intangibles acquired |
|
11 |
|
11 |
|
9 |
In June 2018, the Company purchased a minority equity interest in a technology firm in the United States for approximately $20,000 in cash that is accounted for using the cost method of accounting. This cost method investment is included in prepaid expenses and other assets in the consolidated balance sheet as of December 31, 2018 and 2019.
From January 1, 2020, to February 25, 2020, the Company completed wealth management business acquisitions for cash consideration of $46,041, plus contingent consideration.
F-22
FOCUS FINANCIAL PARTNERS INC.
NOTES TO CONSOLIDATED FINANCIAL STATEMENTS
FOR THE YEARS ENDED DECEMBER 31, 2017, 2018 AND 2019
(In thousands, except unit data, share and per share amounts)
6. GOODWILL AND OTHER INTANGIBLE ASSETS
The following table summarizes the change in the goodwill balances for the years ended December 31, 2017, 2018 and 2019:
|
|
|
2017 |
|
2018 |
|
2019 |
|||
|
Balance beginning of period: |
|
|
|
|
|
|
|
|
|
|
Goodwill |
|
$ |
339,129 |
|
$ |
538,113 |
|
$ |
883,119 |
|
Cumulative impairment losses |
|
|
(22,624) |
|
|
(22,624) |
|
|
(22,624) |
|
|
|
|
316,505 |
|
|
515,489 |
|
|
860,495 |
|
Goodwill acquired |
|
|
198,546 |
|
|
347,496 |
|
|
229,799 |
|
Other |
|
|
438 |
|
|
(2,490) |
|
|
(63) |
|
|
|
|
198,984 |
|
|
345,006 |
|
|
229,736 |
|
Balance end of period: |
|
|
|
|
|
|
|
|
|
|
Goodwill |
|
|
538,113 |
|
|
883,119 |
|
|
1,112,855 |
|
Cumulative impairment losses |
|
|
(22,624) |
|
|
(22,624) |
|
|
(22,624) |
|
|
|
$ |
515,489 |
|
$ |
860,495 |
|
$ |
1,090,231 |
There were no goodwill impairment losses during the years ended December 31, 2017, 2018 and 2019.
The following table summarizes the amortizing acquired intangible assets at December 31, 2018:
|
|
|
Gross Carry |
|
Accumulated |
|
Net Book |
|||
|
|
|
Amount |
|
Amortization |
|
Value |
|||
|
Customer relationships |
|
$ |
1,008,186 |
|
$ |
(349,125) |
|
$ |
659,061 |
|
Management contracts |
|
|
133,112 |
|
|
(31,911) |
|
|
101,201 |
|
Other acquired intangibles |
|
|
4,402 |
|
|
(2,469) |
|
|
1,933 |
|
Total |
|
$ |
1,145,700 |
|
$ |
(383,505) |
|
$ |
762,195 |
The following table summarizes the amortizing acquired intangible assets at December 31, 2019:
|
|
|
Gross Carry |
|
Accumulated |
|
Net Book |
|||
|
|
|
Amount |
|
Amortization |
|
Value |
|||
|
Customer relationships |
|
$ |
1,362,104 |
|
$ |
(471,361) |
|
$ |
890,743 |
|
Management contracts |
|
|
150,464 |
|
|
(39,888) |
|
|
110,576 |
|
Other acquired intangibles |
|
|
5,157 |
|
|
(3,020) |
|
|
2,137 |
|
Total |
|
$ |
1,517,725 |
|
$ |
(514,269) |
|
$ |
1,003,456 |
Management contracts and other acquired intangibles are amortized on a straight-line basis over their estimated useful lives ranging from 2 to 20 years. Customer relationships are amortized on a straight-line basis over their estimated useful lives of 4 to 10 years.
F-23
FOCUS FINANCIAL PARTNERS INC.
NOTES TO CONSOLIDATED FINANCIAL STATEMENTS
FOR THE YEARS ENDED DECEMBER 31, 2017, 2018 AND 2019
(In thousands, except unit data, share and per share amounts)
Estimated amortization expense for each of the next five years is as follows:
|
Years Ending December 31, |
|
Amount |
|
|
2020 |
|
$ |
139,474 |
|
2021 |
|
|
136,573 |
|
2022 |
|
|
131,532 |
|
2023 |
|
|
123,734 |
|
2024 |
|
|
111,253 |
7. FIXED ASSETS
Fixed assets consist of the following at December 31, 2018 and 2019:
|
|
|
2018 |
|
2019 |
||
|
Computers, software development and equipment |
|
$ |
31,172 |
|
$ |
34,462 |
|
Leasehold improvements |
|
|
20,710 |
|
|
36,699 |
|
Furniture and fixtures |
|
|
12,405 |
|
|
16,805 |
|
Subtotal |
|
|
64,287 |
|
|
87,966 |
|
Less accumulated depreciation and amortization |
|
|
(39,507) |
|
|
(46,332) |
|
Total |
|
$ |
24,780 |
|
$ |
41,634 |
8. FAIR VALUE MEASUREMENTS
ASC Topic 820, Fair Value Measurement establishes a hierarchy for inputs used in measuring fair value that maximizes the use of observable inputs and minimizes the use of unobservable inputs by requiring that the most observable inputs be used when available. Observable inputs reflect the assumptions market participants would use in pricing the asset or liability, developed based on market data obtained from sources independent of the Company. Unobservable inputs reflect the Company’s own assumptions about the assumptions market participants would use in pricing the asset or liability, developed based on the best information available in the circumstances.
The fair value hierarchy prioritizes the inputs to valuation techniques used to measure fair value into three broad levels, as follows:
Level 1—Unadjusted price quotations in active markets for identical assets or liabilities.
Level 2—Observable inputs other than Level 1 prices, such as quoted prices for similar assets or liabilities, or other inputs that are observable or can be corroborated by observable market data for substantially the full term of the assets or liabilities.
Level 3—Significant unobservable inputs that are not corroborated by market data.
The implied fair value of the Company’s First Lien Term Loan (as defined below) based on Level 2 inputs is as follows as of December 31, 2018 and 2019:
|
|
|
December 31, 2018 |
|
December 31, 2019 |
||||||||
|
|
|
Stated |
|
Fair |
|
Stated |
|
Fair |
||||
|
|
|
Value |
|
Value |
|
Value |
|
Value |
||||
|
First Lien Term Loan |
|
$ |
798,985 |
|
$ |
773,018 |
|
$ |
1,139,188 |
|
$ |
1,146,307 |
F-24
FOCUS FINANCIAL PARTNERS INC.
NOTES TO CONSOLIDATED FINANCIAL STATEMENTS
FOR THE YEARS ENDED DECEMBER 31, 2017, 2018 AND 2019
(In thousands, except unit data, share and per share amounts)
For business acquisitions, the Company recognizes the fair value of goodwill and other acquired intangible assets, and estimated contingent consideration at the acquisition date as part of purchase price. This fair value measurement is based on unobservable (Level 3) inputs.
The following table represents changes in the fair value of estimated contingent consideration for business acquisitions for the years ended December 31, 2018 and 2019:
|
|
|
2018 |
|
2019 |
||
|
Balance at January 1, |
|
$ |
76,677 |
|
$ |
98,905 |
|
Additions to estimated contingent consideration |
|
|
42,086 |
|
|
82,781 |
|
Payments of contingent consideration |
|
|
(26,237) |
|
|
(36,862) |
|
Non-cash changes in fair value of estimated contingent consideration |
|
|
6,638 |
|
|
38,797 |
|
Other |
|
|
(259) |
|
|
(53) |
|
Balance at December 31, |
|
$ |
98,905 |
|
$ |
183,568 |
Estimated contingent consideration is included in other liabilities in the accompanying consolidated balance sheets.
During the year ended December 31, 2018, the Company paid $23,816 in cash and issued $2,421 of restricted common units as contingent consideration associated with business acquisitions. During the year ended December 31, 2019, the Company paid $36,862 in cash as contingent consideration associated with business acquisitions.
In determining fair value of the estimated contingent consideration, the acquired business’s future performance is estimated using financial projections for the acquired businesses. These financial projections, as well as alternative scenarios of financial performance, are measured against the performance targets specified in each respective acquisition agreement. In addition, discount rates are established based on the cost of debt and the cost of equity. The Company uses the Monte Carlo Simulation Model to determine the fair value of the Company’s estimated contingent consideration.
The significant unobservable inputs used in the fair value measurement of the Company’s estimated contingent consideration is the forecasted growth rates over the measurement period and discount rates. Significant increases or decreases in the Company’s forecasted growth rates over the measurement period or discount rates would result in a higher or lower fair value measurement.
Inputs used in the fair value measurement of estimated contingent consideration at December 31, 2018 and 2019 are summarized below:
|
|
|
Quantitative Information About Level 3 |
|
|||||
|
|
|
Fair Value Measurements |
|
|||||
|
Fair Value at |
|
Valuation |
|
Unobservable |
|
|
|
|
|
December 31, 2018 |
|
Techniques |
|
Inputs |
|
Ranges |
|
|
|
$ |
98,905 |
|
Monte Carlo Simulation Model |
|
Forecasted growth rates |
|
(16.2)% - 18.7 |
% |
|
|
|
|
|
|
Discount rates |
|
12% - 18 |
% |
|
|
|
Quantitative Information About Level 3 |
|
|||||
|
|
|
Fair Value Measurements |
|
|||||
|
Fair Value at |
|
Valuation |
|
Unobservable |
|
|
|
|
|
December 31, 2019 |
|
Techniques |
|
Inputs |
|
Ranges |
|
|
|
$ |
183,568 |
|
Monte Carlo Simulation Model |
|
Forecasted growth rates |
|
(10.7)% - 51.1 |
% |
|
|
|
|
|
|
Discount rates |
|
11% - 17 |
% |
F-25
FOCUS FINANCIAL PARTNERS INC.
NOTES TO CONSOLIDATED FINANCIAL STATEMENTS
FOR THE YEARS ENDED DECEMBER 31, 2017, 2018 AND 2019
(In thousands, except unit data, share and per share amounts)
9. CREDIT FACILITY
In July 2019, Focus LLC expanded its first lien term loan (the “First Lien Term Loan”) by $350,000 and incurred $3,743 in debt financing costs. The debt was issued at a discount of 0.25% or $875 which is being amortized to interest expense over the remaining term of the First Lien Term Loan.
As of December 31, 2019, Focus LLC’s credit facility (the “Credit Facility”) consisted of a $1,153,000 First Lien Term Loan and a $650,000 first lien revolving credit facility (the “First Lien Revolver”).
The First Lien Term Loan has a maturity date of July 2024 and requires quarterly installment repayments of $2,891, as amended in July 2019. As of December 31, 2019, the First Lien Term Loan bore interest (at Focus LLC’s option) at: (i) the London InterBank Offered Rate (“LIBOR”) plus a margin of 2.50% or (ii) the lender’s Base Rate (as defined in the Credit Facility) plus a margin of 1.50%. In January 2020, Focus LLC amended its First Lien Term Loan to reduce its interest rate to LIBOR plus a margin of 2.00% or the lender’s Base Rate plus a margin of 1.00%.
The First Lien Revolver has a maturity date of July 2023. Up to $30,000 of the First Lien Revolver is available for the issuance of letters of credit, subject to certain limitations. The First Lien Revolver bears interest at LIBOR plus a margin of 2.00% with step downs to 1.75%, 1.50% and 1.25% or the lender’s Base Rate plus a margin of 1.00% with step downs to 0.75%, 0.50% and 0.25%, based on achievement of a specified First Lien Leverage Ratio. The First Lien Revolver unused commitment fee is 0.50% with step downs to 0.375% and 0.25% based on achievement of a specified First Lien Leverage Ratio.
Focus LLC’s obligations under the Credit Facility are collateralized by the majority of Focus LLC’s assets. The Credit Facility contains various customary covenants, including, but not limited to: (i) incurring additional indebtedness or guarantees, (ii) creating liens or other encumbrances on property or granting negative pledges, (iii) entering into a merger or similar transaction, (iv) selling or transferring certain property and (v) declaring dividends or making other restricted payments.
Focus LLC is required to maintain a First Lien Leverage Ratio (as defined in the Credit Facility) of not more than 6.25:1.00 as of the last day of each fiscal quarter. At December 31, 2019, Focus LLC's First Lien Leverage Ratio was 4.00:1.00, which satisfied the maximum ratio of 6.25:1.00. First Lien Leverage Ratio means the ratio of amounts outstanding under the First Lien Term Loan and First Lien Revolver plus other outstanding debt obligations secured by a lien on the assets of Focus LLC (excluding letters of credit other than unpaid drawings thereunder) minus unrestricted cash and cash equivalents to Consolidated EBITDA (as defined in the Credit Facility). Consolidated EBITDA for purposes of the Credit Facility was $303,319 at December 31, 2019. Focus LLC is also subject on an annual basis to contingent principal payments based on an excess cash flow calculation (as defined in the Credit Facility) for any fiscal year if the First Lien Leverage Ratio exceeds 3.75:1.00. No contingent principal payments were required to be made in 2019. Based on the excess cash flow calculation for the year ended December 31, 2019, no contingent principal payments are required to be made in 2020.
The Company defers and amortizes its debt financing costs over the respective terms of the First Lien Term Loan and First Lien Revolver. The debt financing costs related to the First Lien Term Loan are recorded as a reduction of the carrying amount of the First Lien Term Loan in the consolidated balance sheets. The debt financing costs related to the First Lien Revolver are recorded in debt financing costs-net in the consolidated balance sheets.
F-26
FOCUS FINANCIAL PARTNERS INC.
NOTES TO CONSOLIDATED FINANCIAL STATEMENTS
FOR THE YEARS ENDED DECEMBER 31, 2017, 2018 AND 2019
(In thousands, except unit data, share and per share amounts)
The following is a reconciliation of principal amounts outstanding under the Credit Facility to borrowings under the Credit Facility recorded in the consolidated balance sheets at December 31, 2018 and 2019:
|
|
|
2018 |
|
2019 |
||
|
First Lien Term Loan |
|
$ |
798,985 |
|
$ |
1,139,188 |
|
First Lien Revolver |
|
|
40,000 |
|
|
140,000 |
|
Unamortized debt financing costs |
|
|
(2,403) |
|
|
(5,389) |
|
Unamortized discount |
|
|
— |
|
|
(800) |
|
Total |
|
$ |
836,582 |
|
$ |
1,272,999 |
At December 31, 2018 and 2019, unamortized debt financing costs associated with the First Lien Revolver of $12,340 and $9,645, respectively, were recorded in debt financing costs-net in the consolidated balance sheets.
Weighted‑average interest rates for borrowings were approximately 6% for the year ended December 31, 2018 and 5% for the year ended December 31, 2019.
As of December 31, 2018 and 2019, the First Lien Revolver available unused commitment line was $605,793 and $502,962 respectively.
As of December 31, 2018 and 2019, Focus LLC was contingently obligated for letters of credit in the amount of $4,207 and $7,038, respectively, each bearing interest at an annual rate of approximately 1% and 2%, respectively.
In connection with a January 2018 amendment to the First Lien Term Loan to reduce its interest rate and the repayment of the $207,000 Second Lien Term Loan in July 2018, the Company recognized an aggregate loss on extinguishment of borrowings of $21,071 during the year ended December 31, 2018.
10. EQUITY
The following is a summary of the capital stock of the Company:
Class A Common Stock
Voting Rights
Holders of shares of the Company's Class A common stock are entitled to one vote per share held of record on all matters to be voted upon by the shareholders. The holders of Class A common stock do not have cumulative voting rights in the election of directors.
Dividend Rights
Holders of shares of the Company’s Class A common stock are entitled to ratably receive dividends when and if declared by the Company’s Board of Directors (the “Board”) out of funds legally available for that purpose, subject to any statutory or contractual restrictions on the payment of dividends and to any prior rights and preferences that may be applicable to any outstanding preferred stock.
F-27
FOCUS FINANCIAL PARTNERS INC.
NOTES TO CONSOLIDATED FINANCIAL STATEMENTS
FOR THE YEARS ENDED DECEMBER 31, 2017, 2018 AND 2019
(In thousands, except unit data, share and per share amounts)
Liquidation Rights
Upon the Company’s liquidation, dissolution, distribution of assets or other winding up, the holders of Class A common stock are entitled to receive ratably the assets available for distribution to the shareholders after payment of liabilities and the liquidation preference of any of the Company's outstanding shares of preferred stock.
Other Matters
The shares of the Company's Class A common stock have no preemptive or conversion rights and are not subject to further calls or assessment by the Company. There are no redemption or sinking fund provisions applicable to the Class A common stock. All outstanding shares of the Company’s Class A common stock are fully paid and non‑assessable.
Class B Common Stock
Voting Rights
Holders of shares of the Company’s Class B common stock are entitled to one vote per share held of record on all matters to be voted upon by the shareholders. Holders of shares of the Company’s Class A common stock and Class B common stock vote together as a single class on all matters presented to the Company’s shareholders for their vote or approval, except the amendment of certain provisions of the Company’s certificate of incorporation that would alter or change the powers, preferences or special rights of the Class B common stock so as to affect them adversely must be approved by a majority of the votes entitled to be cast by the holders of the shares affected by the amendment, voting as a single class, or as otherwise required by applicable law.
Dividend and Liquidation Rights
Holders of the Company’s Class B common stock do not have any right to receive dividends, unless the dividend consists of shares of the Company’s Class B common stock or of rights, options, warrants or other securities convertible or exercisable into or exchangeable for shares of Class B common stock paid proportionally with respect to each outstanding share of our Class B common stock and a dividend consisting of shares of Class A common stock or of rights, options, warrants or other securities convertible or exercisable into or exchangeable for shares of Class A common stock on equivalent terms is simultaneously paid to the holders of Class A common stock. Holders of the Company’s Class B common stock do not have any right to receive a distribution upon a liquidation, dissolution or winding up of the Company.
F-28
FOCUS FINANCIAL PARTNERS INC.
NOTES TO CONSOLIDATED FINANCIAL STATEMENTS
FOR THE YEARS ENDED DECEMBER 31, 2017, 2018 AND 2019
(In thousands, except unit data, share and per share amounts)
Preferred Stock
The Company’s certificate of incorporation authorizes the Board, subject to any limitations prescribed by law, without further shareholder approval, to establish and to issue from time to time one or more classes or series of preferred stock, par value $0.01 per share, covering up to an aggregate of 500,000,000 shares of preferred stock. Each class or series of preferred stock will cover the number of shares and will have the powers, preferences, rights, qualifications, limitations and restrictions determined by the Board, which may include, among others, dividend rights, liquidation preferences, voting rights, conversion rights, preemptive rights and redemption rights. Except as provided by law or in a preferred stock designation, the holders of preferred stock will not be entitled to vote at or receive notice of any meeting of shareholders.
2018 Omnibus Incentive Plan
On July 30, 2018, the Board adopted the Focus Financial Partners Inc. 2018 Omnibus Incentive Plan (the “Omnibus Plan”) for the employees, consultants and the directors of the Company and its affiliates who perform services for it. The Omnibus Plan provides for potential grants of the following awards with respect to shares of the Company’s Class A common stock, to the extent applicable: (i) incentive stock options qualified as such under U.S. federal income tax laws; (ii) non-qualified stock options or any other form of stock options; (iii) restricted stock awards; (iv) phantom stock awards; (v) restricted stock units; (vi) bonus stock; (vii) performance awards; (viii) annual cash incentive awards; (ix) any of the foregoing award types (other than incentive stock options) as awards related to Focus LLC’s units; and (x) incentive units in Focus LLC.
The maximum aggregate number of shares of the Company's Class A common stock that may be issued pursuant to awards under the Omnibus Plan shall not exceed 6,000,000 shares (including such number of Focus LLC's units or other securities which can be exchanged or converted into shares of Class A common stock). The reserve pool is subject to adjustment due to recapitalization or reorganization, or related to forfeitures or the expiration of awards, as provided under the Omnibus Plan. If the shares or units subject to any award are not issued or transferred, or cease to be issuable or transferable for any reason, including (but not exclusively) because shares or units are withheld or surrendered in payment of taxes or any exercise or purchase price relating to an award or because an award is forfeited, terminated, expires unexercised, is settled in cash or is otherwise terminated without a delivery of shares or units, those shares or units will again be available for issue, transfer or exercise pursuant to awards under the Omnibus Plan to the extent allowable by law. The Omnibus Plan also contains a provision that will add an additional number of shares of Class A common stock equal to the lesser of (a) 3,000,000 shares, (b) 5% of the outstanding (vested and unvested) shares of Class A common stock and Focus LLC units on the last day of the previous year, and (c) an amount determined by the Board, each year between 2019 and 2028.
In connection with the IPO and Reorganization Transactions described in Note 3, the Company granted: (i) fully vested non-compensatory stock options to purchase an aggregate of 386,832 shares of Class A common stock, (ii) compensatory stock options to purchase an aggregate of 348,577 shares of Class A common stock which vest in three equal installments on December 31, 2018, 2019 and 2020, (iii) 178,608 shares of unvested Class A common stock valued at $33.00 per share which vest in three equal installments on December 31, 2018, 2019 and 2020 and (iv) market-based stock options to purchase an aggregate of 155,000 shares of Class A common stock that vest on the fifth anniversary of the pricing of the IPO if the volume weighted average per share price for any ninety calendar day period within such five year period immediately following the pricing of the IPO reaches at least $100.
Stock options granted subsequent to the IPO during the year ended December 31, 2018 and 2019 generally vest ratably over a four-year period.
Restricted stock units granted during the year ended December 31, 2019 vest ratably over a four-year period.
F-29
FOCUS FINANCIAL PARTNERS INC.
NOTES TO CONSOLIDATED FINANCIAL STATEMENTS
FOR THE YEARS ENDED DECEMBER 31, 2017, 2018 AND 2019
(In thousands, except unit data, share and per share amounts)
The following table provides information relating to the status of, and changes in, the Company's stock options granted during years ended December 31, 2018 and 2019:
|
|
|
Stock |
|
Weighted Average |
|
|
|
|
Options |
|
Exercise Price |
|
|
Outstanding—January 1, 2018 |
|
— |
|
$ |
— |
|
Granted |
|
1,401,276 |
|
|
31.34 |
|
Exercised |
|
— |
|
|
— |
|
Forfeited |
|
— |
|
|
— |
|
Outstanding—December 31, 2018 |
|
1,401,276 |
|
|
31.34 |
|
Vested—December 31, 2018 |
|
503,014 |
|
|
33.00 |
|
Granted |
|
558,021 |
|
|
28.19 |
|
Exercised |
|
(25,575) |
|
|
32.75 |
|
Forfeited |
|
(100,756) |
|
|
30.31 |
|
Outstanding—December 31, 2019 |
|
1,832,966 |
|
|
30.42 |
|
Vested—December 31, 2019 |
|
698,805 |
|
|
32.01 |
For the purpose of calculating equity-based compensation expense for time-based stock option awards, the grant date fair value was determined using the Black-Scholes model with the following weighted average assumptions for the years ended December 31, 2018 and 2019:
|
|
|
2018 |
|
|
2019 |
|
||
|
Expected term |
|
|
7.3 |
years |
|
|
6.2 |
years |
|
Expected stock price volatility |
|
|
32 |
% |
|
|
29 |
% |
|
Risk-free interest rate |
|
|
2.81 |
% |
|
|
1.76 |
% |
|
Expected dividend yield |
|
|
— |
% |
|
|
— |
% |
|
Weighted average grant date fair value |
|
$ |
12.56 |
|
|
$ |
9.03 |
|
For the purpose of calculating equity-based compensation expense for market condition-based awards granted during the year ended December 31, 2018, the grant date fair value was determined through the application of the Monte Carlo Simulation Model with the following weighted average assumptions:
|
Expected term |
|
|
5.0 |
years |
|
Expected unit price volatility |
|
|
30 |
% |
|
Risk-free interest rate |
|
|
2.78 |
% |
|
Expected dividend yield |
|
|
— |
% |
|
Weighted average grant date fair value |
|
$ |
3.97 |
|
F-30
FOCUS FINANCIAL PARTNERS INC.
NOTES TO CONSOLIDATED FINANCIAL STATEMENTS
FOR THE YEARS ENDED DECEMBER 31, 2017, 2018 AND 2019
(In thousands, except unit data, share and per share amounts)
The following table provides information relating to the status of, and changes in, the Company's unvested Class A common stock during the years ended December 31, 2018 and 2019:
|
|
|
|
|
Weighted |
|
|
|
|
|
|
Average |
|
|
|
|
Unvested Class A |
|
Grant Date |
|
|
|
|
Common Stock |
|
Fair Value |
|
|
|
|
|
|
|
|
|
Outstanding—January 1, 2018 |
|
— |
|
$ |
— |
|
Granted |
|
178,608 |
|
|
33.00 |
|
Forfeited |
|
— |
|
|
— |
|
Vested |
|
(59,530) |
|
|
33.00 |
|
Outstanding—December 31, 2018 |
|
119,078 |
|
|
33.00 |
|
Granted |
|
— |
|
|
— |
|
Forfeited |
|
(12,500) |
|
|
33.00 |
|
Vested |
|
(53,285) |
|
|
33.00 |
|
Outstanding—December 31, 2019 |
|
53,293 |
|
|
33.00 |
The following table provides information relating to the status of, and changes in, the Company's restricted stock units granted during the year ended December 31, 2019:
|
|
|
|
|
Weighted |
|
|
|
|
|
|
Average |
|
|
|
|
|
|
Grant Date |
|
|
|
|
Restricted Stock Units |
|
Fair Value |
|
|
|
|
|
|
|
|
|
Outstanding—January 1, 2019 |
|
— |
|
$ |
— |
|
Granted |
|
98,061 |
|
|
27.90 |
|
Forfeited |
|
— |
|
|
— |
|
Vested |
|
— |
|
|
— |
|
Outstanding—December 31, 2019 |
|
98,061 |
|
|
27.90 |
The Company recognized $7,725 of non-cash equity compensation expense in relation to stock options and unvested Class A common stock during the year ended December 31, 2018 inclusive of a one-time non-cash equity compensation expense of $4,504 in connection with the IPO and Reorganization Transactions.
The Company recognized $4,247 of non-cash equity compensation expense in relation to stock options, unvested Class A common stock and restricted stock units during the year ended December 31, 2019.
Total unrecognized expense, adjusted for estimated forfeitures, related to unvested stock options at December 31, 2019 was $8,911 and is expected to be recognized over a weighted-average period of 3.2 years.
Total unrecognized expense, adjusted for estimated forfeitures, related to unvested Class A common stock at December 31, 2019 was $1,621, and is expected to be recognized over a period of 1.0 year.
F-31
FOCUS FINANCIAL PARTNERS INC.
NOTES TO CONSOLIDATED FINANCIAL STATEMENTS
FOR THE YEARS ENDED DECEMBER 31, 2017, 2018 AND 2019
(In thousands, except unit data, share and per share amounts)
Total unrecognized expense, adjusted for estimated forfeitures, related to restricted stock units at December 31, 2019 was $2,569, and is expected to be recognized over a period of 4.0 years.
Focus LLC Common Units
As of December 31, 2019, Focus LLC had 22,075,749 common units that had a corresponding share of the Company's Class B common stock outstanding.
Each common unit holder and incentive unitholder of Focus LLC (other than the Company), subject to certain limitations, has the right to cause Focus LLC to redeem all or a portion of their vested common units and vested incentive units (“Exchange Right”). Upon an exercise of an Exchange Right with respect to vested incentive units, such incentive units will first be converted into a number of common units that takes into account the then‑current value of the common units and such incentive units’ aggregate hurdle amount. Upon an exercise of an Exchange Right with respect to vested common units, and immediately after the conversion of vested incentive units into common units, Focus LLC will acquire each tendered common unit for, at its election, (i) one share of Class A common stock, subject to conversion rate adjustments for stock splits, stock dividends, reclassification and other similar transactions, or (ii) an equivalent amount of cash. In addition, in connection with any redemption of vested common units (other than common units received upon a conversion of incentive units as described in this paragraph), the corresponding shares of Class B common stock will be cancelled. Alternatively, upon the exercise of any Exchange Right, the Company (instead of Focus LLC) will have the right to acquire each tendered common unit (and corresponding share of Class B common stock, as applicable) from the exchanging unitholder for, at its election, (i) one share of Class A common stock, subject to conversion rate adjustments for stock splits, stock dividends, reclassification and other similar transactions, or (ii) an equivalent amount of cash. The Exchange Rights are subject to certain limitations and restrictions intended to ensure that Focus LLC will continue to be treated as a partnership for U.S. federal income tax purposes.
In March 2019, the Company issued an aggregate of 403,712 shares of Class A common stock and retired 254,441 shares of Class B common stock and 217,730 incentive units in Focus LLC and acquired 403,712 common units in Focus LLC, in each case as part of the regular quarterly exchanges offered to holders of units in Focus LLC.
In June 2019, the Company issued an aggregate of 423,985 shares of Class A common stock and retired 260,385 shares of Class B common stock and 248,142 incentive units in Focus LLC and acquired 423,985 common units in Focus LLC, in each case as part of the regular quarterly exchanges offered to holders of units in Focus LLC
In September 2019, the Company issued an aggregate of 150,681 shares of Class A common stock and retired 109,781 shares of Class B common stock and 81,673 incentive units in Focus LLC and acquired 150,681 common units in Focus LLC, in each case as part of the regular quarterly exchanges offered to holders of units in Focus LLC.
In December 2019, the Company issued an aggregate of 163,959 shares of Class A common stock and retired 122,916 shares of Class B common stock and 70,572 incentive units in Focus LLC and acquired 163,959 common units in Focus LLC, in each case as part of the regular quarterly exchanges offered to holders of units in Focus LLC.
During the year ended December 31, 2017 Focus LLC recorded $263 of non-cash equity compensation expense for certain common units that met time-based vesting criteria.
Focus LLC Incentive Units
Focus LLC’s Operating Agreement provides for the granting of incentive units. Grants are designed as profits interests, which entitle a holder to receive distributions in excess of a specific hurdle amount, subject to the provisions of Focus LLC’s Operating Agreement. Incentive unit vesting provisions are either time-based or market-based.
F-32
FOCUS FINANCIAL PARTNERS INC.
NOTES TO CONSOLIDATED FINANCIAL STATEMENTS
FOR THE YEARS ENDED DECEMBER 31, 2017, 2018 AND 2019
(In thousands, except unit data, share and per share amounts)
The Company uses the Black-Scholes option-pricing model to determine the fair value of time-based incentive units. The determination of the fair value using the Black-Scholes option-pricing model is affected by the Company’s estimated common unit price, as well as by assumptions regarding a number of complex and subjective variables. These variables include the Company’s expected unit price volatility over the term of the incentive unit, expected term, risk-free interest rates and expected dividend yield.
The estimated grant-date fair values of the 2017, 2018 and 2019 time-based incentive unit grants were calculated based on the following weighted-average assumptions:
|
|
|
2017 |
|
|
2018 |
|
|
2019 |
|
|||
|
Expected term |
|
|
4.0 |
|
years |
|
4.0 |
|
years |
|
4.0 |
years |
|
Expected unit price volatility |
|
|
37 |
|
% |
|
31 |
|
% |
|
29 |
% |
|
Risk-free interest rate |
|
|
1.79 |
|
% |
|
2.53 |
|
% |
|
1.64 |
% |
|
Expected dividend yield |
|
|
— |
|
% |
|
— |
|
% |
|
— |
% |
|
Weighted average grant date fair value |
|
$ |
6.64 |
|
|
$ |
7.71 |
|
|
$ |
7.15 |
|
In connection with IPO and Reorganization Transactions described in Note 3, Focus LLC (i) granted 3,845,000 market-based incentive units with a hurdle rate of $33.00 that vest on the fifth anniversary of the pricing of the IPO if the average per share price for any ninety calendar day period within such five year period immediately following the pricing of the IPO reaches at least $100, (ii) amended, effective on pricing of the IPO, 3,000,000 incentive units with a hurdle rate of $21.00 such that the first fifty percent vest if the Company’s weighted average price per share is at least $35.00 for the first ninety days following the pricing of the IPO. Following that ninety day period, all incentive units that remain unvested will be eligible to vest on the three year anniversary of the IPO if the weighted average per share price for the ninety day period immediately preceding the third anniversary of the IPO is: (i) less than $42.00, then no remaining unvested incentive units will vest; (ii) greater than $63.00, then all remaining unvested incentive units will become vested; and (iii) if between $42.00 and $63.00, then (x) fifty percent of the remaining unvested incentive units will vest and (y) the remaining fifty percent of the remaining unvested incentive units will vest linearly based on where the price falls within the range of $42.00 and $63.00. The weighted average price of the Company’s Class A common stock for the ninety days following the pricing of the IPO exceeded the $35.00 threshold, accordingly, the first fifty percent or 1,500,000 incentive units vested in October 2018.
For the purpose of calculating equity-based compensation expense for these market condition-based incentive units, the grant date fair value during the year ended December 31, 2018 was determined through the application of the Monte Carlo Simulation Model with the following weighted average assumptions:
|
Expected term |
|
|
4.1 |
years |
|
Expected unit price volatility |
|
|
30 |
% |
|
Risk-free interest rate |
|
|
2.74 |
% |
|
Expected dividend yield |
|
|
— |
% |
|
Weighted average grant date fair value |
|
$ |
5.05 |
|
The Company has recorded $10,247, $36,743 and $14,082 of non-cash equity compensation expense for incentive units during the years ended December 31, 2017, 2018 and 2019, respectively.
Non-cash equity compensation expense for the year ended December 31, 2017 includes non-cash equity compensation expense related to time and performance based incentive units that were vested in connection with the issuance of Convertible Preferred Units as described below.
F-33
FOCUS FINANCIAL PARTNERS INC.
NOTES TO CONSOLIDATED FINANCIAL STATEMENTS
FOR THE YEARS ENDED DECEMBER 31, 2017, 2018 AND 2019
(In thousands, except unit data, share and per share amounts)
Non-cash equity compensation expense for the year ended December 31, 2018 includes one-time non-cash equity compensation expense of $14,756 related to certain time-based incentive units that were modified and vested or exchanged for Focus LLC common units in connection with the IPO and Reorganization Transactions described in Note 3.
Total unrecognized expense, adjusted for estimated forfeitures, related to unvested incentive units at December 31, 2019, was $44,693 and is expected to be recognized over a weighted-average period of 3.1 years.
The following table provides information relating to the status of, and changes in, Focus LLC incentive units granted during the years ended December 31, 2017, 2018 and 2019:
|
|
|
|
|
Weighted Average |
|
|
|
|
Incentive Units |
|
Hurdle Price |
|
|
|
|
|
|
|
|
|
Outstanding—January 1, 2017 |
|
12,234,283 |
|
$ |
10.97 |
|
Granted |
|
6,193,042 |
|
|
21.30 |
|
Forfeited |
|
(392,375) |
|
|
16.50 |
|
Redeemed |
|
(2,805,911) |
|
|
8.25 |
|
Outstanding—December 31, 2017 |
|
15,229,039 |
|
|
15.53 |
|
Vested—December 31, 2017 |
|
8,237,146 |
|
|
11.22 |
|
|
|
|
|
|
|
|
Outstanding—January 1, 2018 |
|
15,229,039 |
|
|
15.53 |
|
Granted |
|
6,426,715 |
|
|
30.73 |
|
Forfeited |
|
(311,625) |
|
|
22.26 |
|
Redeemed |
|
(2,746,655) |
|
|
15.79 |
|
Outstanding—December 31, 2018 |
|
18,597,474 |
|
|
20.63 |
|
Vested—December 31, 2018 |
|
9,910,399 |
|
|
14.19 |
|
|
|
|
|
|
|
|
Outstanding—January 1, 2019 |
|
18,597,474 |
|
|
20.63 |
|
Granted |
|
2,106,131 |
|
|
28.01 |
|
Exchanged |
|
(618,117) |
|
|
11.24 |
|
Forfeited |
|
(331,038) |
|
|
27.80 |
|
Outstanding—December 31, 2019 |
|
19,754,450 |
|
|
21.59 |
|
Vested—December 31, 2019 |
|
10,288,263 |
|
|
15.37 |
F-34
FOCUS FINANCIAL PARTNERS INC.
NOTES TO CONSOLIDATED FINANCIAL STATEMENTS
FOR THE YEARS ENDED DECEMBER 31, 2017, 2018 AND 2019
(In thousands, except unit data, share and per share amounts)
Incentive units outstanding and vested at December 31, 2019 were as follows:
|
|
|
Number |
|
Vested |
|
Hurdle Rates |
|
Outstanding |
|
Units |
|
$1.42 |
|
175,421 |
|
175,421 |
|
5.50 |
|
97,798 |
|
97,798 |
|
6.00 |
|
56,702 |
|
56,702 |
|
7.00 |
|
482,545 |
|
482,545 |
|
9.00 |
|
1,984,779 |
|
1,984,779 |
|
11.00 |
|
1,148,023 |
|
1,148,023 |
|
12.00 |
|
520,000 |
|
520,000 |
|
13.00 |
|
831,416 |
|
831,416 |
|
14.00 |
|
56,205 |
|
56,205 |
|
16.00 |
|
168,552 |
|
168,552 |
|
17.00 |
|
80,000 |
|
72,500 |
|
19.00 |
|
865,633 |
|
859,383 |
|
21.00 |
|
3,975,500 |
|
2,475,500 |
|
22.00 |
|
1,289,667 |
|
657,960 |
|
23.00 |
|
524,828 |
|
262,414 |
|
26.26 |
|
25,000 |
|
— |
|
27.00 |
|
29,484 |
|
7,371 |
|
27.90 |
|
2,051,131 |
|
— |
|
28.50 |
|
1,646,766 |
|
411,694 |
|
33.00 |
|
3,715,000 |
|
20,000 |
|
36.64 |
|
30,000 |
|
— |
|
|
|
19,754,450 |
|
10,288,263 |
Focus LLC Convertible Preferred Units
In July 2017, pursuant to a series of transactions and a tender offer, investors acquired 30,918,280 of the Company’s Convertible Preferred Units at a price of $21 per unit for $649,284. Such funds, together with a portion of the proceeds from the Credit Facility, were used primarily to create cash liquidity for existing holders of the Company’s then outstanding senior preferred units, junior preferred units, common units and incentive units. In connection with the transactions, accrued preferred return of $44,815 related to the senior preferred units and junior preferred units was converted, redeemed or recapitalized and $3,063 of accrued preferred return was paid in cash. The Convertible Preferred Units were recorded at $21 per unit, their fair value on the effective date of the transactions, net of transaction expenses of $2,012.
The investors acquired the senior preferred units and junior preferred units from certain of Focus LLC’s existing preferred unitholders for $207,014, net of transaction expenses, and from Focus LLC for $442,270. Through a tender offer, Focus LLC subsequently retired 17,195,412 senior preferred units, 10,332,956 junior preferred units, 6,521,720 common units, and 2,767,911 incentive units. The price per unit paid for senior preferred units, junior preferred units and common units was $21 per unit reduced by an allocation of transaction expenses of $15,500 (borne by the selling unitholders). The price per unit paid for incentive units was $21 per unit reduced by an allocation of transaction expenses of $15,500 (borne by the selling unitholders) and the applicable hurdle rate of the incentive units. The Company accounted for the units acquired in the tender offer as a repurchase and retirement of the respective units with the difference between the cash paid and the carrying amount of the respective units, if any, recorded in
F-35
FOCUS FINANCIAL PARTNERS INC.
NOTES TO CONSOLIDATED FINANCIAL STATEMENTS
FOR THE YEARS ENDED DECEMBER 31, 2017, 2018 AND 2019
(In thousands, except unit data, share and per share amounts)
accumulated deficit. Senior preferred units of 2,380,952 and junior preferred units of 58,495 that were not tendered by the investors were recapitalized as 2,439,447 of Convertible Preferred Units.
In connection with the issuance of the Convertible Preferred Units, the Company recognized additional non-cash equity compensation expense of $24,369 related to certain common units and incentive units that were modified or contractually vested as a result of the transactions.
The Company incurred certain legal, audit, tax and other professional fee costs in connection with the planned initial public offering that were initially capitalized. As a result of the Convertible Preferred Unit transaction, the planned initial public offering was delayed. Accordingly, the Company expensed $9,840 of costs initially capitalized in connection with the planned initial public offering in selling, general and administrative expenses in the accompanying consolidated statement of operations for the year ended December 31, 2017.
In connection with the Reorganization Transactions described in Note 3, on July 30, 2018, outstanding Convertible Preferred Units were converted into common units on a one-for-one basis.
Cash compensation expense
In connection with the payment of cash of 25% in excess of the Gross IPO Price to Existing Owners who were not accredited investors and the payment of cash of 65% of the fair market value of non-compensatory stock options to Mandatorily Exchanging Owners in the Reorganization Transactions described in Note 3, the Company recognized a one-time cash compensation expense of $5,926 during the year ended December 31, 2018.
11. INCOME TAXES
In connection with the IPO and Reorganization Transactions, Focus Inc. became a holding company whose most significant asset is a membership interest in Focus LLC, and, as a result, Focus Inc. became subject to U.S. federal, state and local income taxes on Focus Inc.’s allocable portion of taxable income from Focus LLC. Focus LLC is treated as a partnership for U.S. federal income tax purposes. Accordingly, Focus LLC is generally not and has not been subject to U.S. federal and certain state income taxes at the entity level, although it has been subject to the New York City Unincorporated Business Tax, and certain of its subsidiaries have been subject to U.S. federal, state and local or foreign income taxes. Instead, for U.S. federal and certain state income tax purposes, the income, deductions, losses and credits of Focus LLC are passed through to its unitholders, which after the IPO includes Focus Inc. Focus LLC has historically made tax distribution payments in accordance with its Third Amended and Restated Operating Agreement, which was replaced by the Operating Agreement on July 30, 2018, and Focus Inc. intends to cause Focus LLC to continue to make tax distribution payments, to the extent of available cash, in accordance with the Operating Agreement.
For tax years beginning on or after January 1, 2018, Focus LLC is subject to partnership audit rules enacted as part of the Bipartisan Budget Act of 2015 (the "Centralized Partnership Audit Regime"). Under the Centralized Partnership Audit Regime, any IRS audit of Focus LLC would be conducted at the partnership level and, if the IRS determines an adjustment, the default rule is that Focus LLC would pay an "imputed underpayment" including interest and penalties, if applicable. Focus LLC may instead elect to make a "push-out" election, in which case the partners for the year that is under audit would be required to take into account the adjustments on their own personal income tax returns. Our partnership agreement provides that if Focus LLC receives an imputed underpayment, a "push-out" election may be made. Any payments that the Company ultimately makes on behalf of its current partners will be reflected as a distribution, rather than tax expense, at the time that such distribution is declared.
On December 22, 2017, the Tax Cuts and Jobs Act (the "Tax Act") was enacted. Among other things, the Tax Act reduced the U.S. federal corporate income tax rate from a maximum rate of 35%, to a rate of 21%, effective January
F-36
FOCUS FINANCIAL PARTNERS INC.
NOTES TO CONSOLIDATED FINANCIAL STATEMENTS
FOR THE YEARS ENDED DECEMBER 31, 2017, 2018 AND 2019
(In thousands, except unit data, share and per share amounts)
1, 2018. The change in the U.S. federal corporate income tax rate resulted in the remeasurement of certain of the Company's deferred tax assets and liabilities during the year ended December 31, 2017, based on the reduction in the tax rate at which they are expected to reverse. Such remeasurement resulted in an income tax benefit of $2,653 for the year ended December 31, 2017.
Income tax expense for year ended December 31, 2019 is primarily related to U.S. federal, state and local income taxes imposed on Focus Inc.'s allocable portion of taxable income from Focus LLC. The allocable portion of taxable income primarily differs from the net loss attributable to Focus Inc. due to permanent differences such as non-deductible equity-based compensation expense of Focus LLC.
The following represents the U.S. and foreign components of income (loss) before income tax for the years ended December 31, 2017, 2018 and 2019:
|
|
|
2017 |
|
2018 |
|
2019 |
|||
|
Income (loss) before income tax: |
|
|
|
|
|
|
|
|
|
|
United States |
|
$ |
(52,276) |
|
$ |
(41,636) |
|
$ |
(7,828) |
|
Foreign |
|
|
2,416 |
|
|
9,999 |
|
|
2,852 |
|
Total income (loss) before income tax |
|
$ |
(49,860) |
|
$ |
(31,637) |
|
$ |
(4,976) |
The following represents the U.S. and foreign components of income tax expense (benefit) for the years ended December 31, 2017, 2018 and 2019:
|
|
|
2017 |
|
2018 |
|
2019 |
|||
|
Current provision: |
|
|
|
|
|
|
|
|
|
|
Federal |
|
$ |
1,020 |
|
$ |
1,511 |
|
$ |
1,201 |
|
State and local |
|
|
477 |
|
|
1,080 |
|
|
1,579 |
|
Foreign |
|
|
980 |
|
|
2,132 |
|
|
2,419 |
|
Subtotal |
|
|
2,477 |
|
|
4,723 |
|
|
5,199 |
|
Deferred provision (benefit): |
|
|
|
|
|
|
|
|
|
|
Federal |
|
|
(3,455) |
|
|
3,932 |
|
|
2,293 |
|
State and local |
|
|
(49) |
|
|
954 |
|
|
435 |
|
Foreign |
|
|
(474) |
|
|
(159) |
|
|
(878) |
|
Subtotal |
|
|
(3,978) |
|
|
4,727 |
|
|
1,850 |
|
Total income tax expense (benefit) |
|
$ |
(1,501) |
|
$ |
9,450 |
|
$ |
7,049 |
F-37
FOCUS FINANCIAL PARTNERS INC.
NOTES TO CONSOLIDATED FINANCIAL STATEMENTS
FOR THE YEARS ENDED DECEMBER 31, 2017, 2018 AND 2019
(In thousands, except unit data, share and per share amounts)
At December 31, 2018 and 2019, tax effects of book/tax temporary differences give rise to deferred tax assets (liabilities) as follows:
|
|
|
2018 |
|
2019 |
||
|
Deferred tax assets: |
|
|
|
|
|
|
|
Investment in Focus LLC |
|
$ |
62,618 |
|
$ |
74,415 |
|
Net operating loss carryforwards |
|
|
5,842 |
|
|
429 |
|
Business interest carryforwards |
|
|
1,219 |
|
|
— |
|
Intangible assets |
|
|
532 |
|
|
586 |
|
Deferred rent and other |
|
|
410 |
|
|
629 |
|
Gross deferred tax assets |
|
|
70,621 |
|
|
76,059 |
|
Deferred tax liabilities: |
|
|
|
|
|
|
|
Intangible assets |
|
|
(6,248) |
|
|
(13,184) |
|
Fixed assets and other |
|
|
(288) |
|
|
(270) |
|
Gross deferred tax liabilities |
|
|
(6,536) |
|
|
(13,454) |
|
Net deferred tax assets |
|
$ |
64,085 |
|
$ |
62,605 |
At December 31, 2018, $5,924 of deferred tax liabilities were recorded as other liabilities in the consolidated balance sheets. At December 31, 2019, $12,848 of deferred tax liabilities were recorded as other liabilities in the consolidated balance sheets.
A reconciliation of the differences between the U.S. federal statutory tax rate and the effective tax rate for the years ended December 31, 2017, 2018 and 2019 is as follows:
|
|
|
2017 |
|
2018 |
|
2019 |
|
|
U.S. federal statutory tax rate |
|
35.0 |
% |
21.0 |
% |
21.0 |
% |
|
Income passed through to individual members |
|
(36.8) |
|
(31.9) |
|
(11.3) |
|
|
Foreign income taxes |
|
(1.0) |
|
(6.2) |
|
(31.0) |
|
|
Non-cash equity compensation expense |
|
— |
|
(5.8) |
|
(41.8) |
|
|
Impairment of equity method investment |
|
— |
|
— |
|
(31.0) |
|
|
Other non-deductible expenses |
|
(0.3) |
|
(1.6) |
|
(19.2) |
|
|
Valuation allowance |
|
1.6 |
|
0.1 |
|
— |
|
|
State and local income taxes, net of U.S. federal tax benefit |
|
(0.7) |
|
(6.1) |
|
(32.6) |
|
|
Remeasurement of deferred taxes |
|
5.3 |
|
— |
|
— |
|
|
Other |
|
(0.1) |
|
0.6 |
|
4.2 |
|
|
Effective income tax rate |
|
3.0 |
% |
(29.9) |
% |
(141.7) |
% |
At December 31, 2019, the Company had approximately $620 of U.S. federal net operating loss carryforwards and a comparable amount of state net operating losses generated from the same losses and deductions. U.S. federal net operating losses have an indefinite carryforward period. Certain state net operating losses expire in various years between 2023 and 2038, while certain state net operating losses have an indefinite carryforward period. In addition, at December 31, 2019, a corporate subsidiary of Focus LLC had U.S. federal net operating loss carryforwards of $1,344 which will begin to expire in 2033.
In assessing the realizability of deferred tax assets, management considers whether it is more likely than not that some portion or all of the deferred tax assets will be realized. The ultimate realization of deferred tax assets is dependent upon the generation of future taxable income. Based on this assessment, no valuation allowances were recorded at December 31, 2018 and 2019, respectively.
F-38
FOCUS FINANCIAL PARTNERS INC.
NOTES TO CONSOLIDATED FINANCIAL STATEMENTS
FOR THE YEARS ENDED DECEMBER 31, 2017, 2018 AND 2019
(In thousands, except unit data, share and per share amounts)
The Company files tax returns in U.S. federal, local and state jurisdictions and certain of the Company’s subsidiaries file income tax returns in foreign jurisdictions. The Company is no longer subject to income tax examinations for years prior to 2016. In addition, open tax years related to local, state and foreign jurisdictions remain subject to examination, but are not considered material to the Company’s consolidated financial position, results of operations or cash flows. The Company is not aware of any tax position for which it is reasonably possible that the total amount of unrecognized benefits will change materially in the next 12 months.
12. TAX RECEIVABLE AGREEMENTS
In connection with the Reorganization Transactions and the closing of the IPO, Focus Inc. entered into two Tax Receivable Agreements ( the "Tax Receivable Agreements"): one with certain entities affiliated with the Private Equity Investors and the other with certain other continuing and former owners of Focus LLC (the parties to the two agreements collectively, the “TRA holders”). The agreements generally provide for the payment by the Company to each TRA holder of 85% of the net cash savings, if any, in U.S. federal, state and local income and franchise tax that the Company actually realizes (computed using simplifying assumptions to address the impact of state and local taxes) or is deemed to realize in certain circumstances in connection with the Reorganization Transactions and in periods after the IPO, as a result of certain increases in tax bases and certain tax benefits attributable to imputed interest. The Company will retain the benefit of the remaining 15% of these cash savings.
As a result of the Reorganization Transactions and the exchange of certain units of Focus LLC, Focus Inc. had a liability of $39,156 and $48,399 relating to its obligations under the Tax Receivable Agreements as of December 31, 2018 and 2019, respectively. The Company does not expect any payments to be made under the Tax Receivable Agreements in the next twelve months.
13. LEASES
The Company rents office space under operating leases with various expiration dates. The Company determines if a contract contains a lease at inception. Leases with an initial term of 12 months or less, which are immaterial to the consolidated financial statements, are not recorded on the balance sheet. The lease terms may include options to extend or terminate the lease when it is reasonably certain that the Company will exercise that option. Operating lease expense is recorded on a straight-line basis over the lease term. The Company has a limited number of finance leases which are not material to the consolidated financial statements.
Operating lease costs are recorded within selling, general and administrative expenses. The implicit discount rates used to determine the present value of the Company’s leases are not readily determinable. Therefore, an incremental borrowing rate is used which is estimated based on the Company’s cost of borrowing for the relevant terms of each lease. The weighted average discount rate used to determine the Company’s operating lease liabilities was approximately 6.6% at December 31, 2019. The weighted average remaining lease term at December 31, 2019 was 7.4 years.
F-39
FOCUS FINANCIAL PARTNERS INC.
NOTES TO CONSOLIDATED FINANCIAL STATEMENTS
FOR THE YEARS ENDED DECEMBER 31, 2017, 2018 AND 2019
(In thousands, except unit data, share and per share amounts)
The future minimum lease payments under operating leases in place as of December 31, 2019 were as follows:
|
Year ending December 31, |
|
Amount |
|
|
2020 |
|
$ |
45,006 |
|
2021 |
|
|
38,484 |
|
2022 |
|
|
32,583 |
|
2023 |
|
|
27,957 |
|
2024 |
|
|
24,505 |
|
2025 and thereafter |
|
|
85,043 |
|
|
|
|
253,578 |
|
Less: present value discount |
|
|
(57,153) |
|
Operating lease liabilities at December 31, 2019 |
|
$ |
196,425 |
Other information pertaining to leases consists of the following:
|
|
|
Year Ended |
|
|
|
|
December 31, 2019 |
|
|
Operating lease costs included in selling, general and administrative expenses |
|
$ |
44,213 |
|
Operating cash flows from operating leases |
|
|
41,333 |
|
Operating lease assets obtained in exchange for operating lease obligations |
|
|
68,891 |
In accordance with ASC 840 future minimum lease payments under operating leases in place at December 31, 2018 were as follows:
|
Year Ending December 31, |
|
Amount |
|
|
2019 |
|
$ |
35,426 |
|
2020 |
|
|
31,695 |
|
2021 |
|
|
24,813 |
|
2022 |
|
|
20,906 |
|
2023 |
|
|
16,743 |
|
2024 and thereafter |
|
|
50,045 |
|
Total minimum lease payments |
|
$ |
179,628 |
14. COMMITMENTS AND CONTINGENCIES
Credit Risk
The Company’s broker‑dealer subsidiaries clear all transactions through clearing brokers on a fully disclosed basis. Pursuant to the terms of the agreements between the Company’s broker‑dealer subsidiaries and their clearing brokers, the clearing brokers have the right to charge the Company’s broker‑dealer subsidiaries for losses that result from a counterparty’s failure to fulfill its contractual obligations. This right applies to all trades executed through its clearing brokers, and therefore, the Company believes there is no maximum amount assignable to the right of the
F-40
FOCUS FINANCIAL PARTNERS INC.
NOTES TO CONSOLIDATED FINANCIAL STATEMENTS
FOR THE YEARS ENDED DECEMBER 31, 2017, 2018 AND 2019
(In thousands, except unit data, share and per share amounts)
clearing brokers. Accordingly, at December 31, 2018 and 2019, the Company had recorded no liabilities in connection with this right.
In addition, the Company has the right to pursue collection or performance from the counterparties who do not perform under their contractual obligations. The Company monitors the credit standing of the clearing brokers and counterparties with which they conduct business.
The Company is exposed to credit risk for accounts receivable from clients. Such credit risk is limited to the amount of accounts receivable. The Company is also exposed to credit risk for changes in the benchmark interest rate (LIBOR or base rate) in connection with its Credit Facility.
The Company maintains its cash in bank depository accounts, which, at times, may exceed federally insured limits. The Company selects depository institutions based, in part, upon management’s review of the financial stability of the institution. At December 31, 2018 and 2019, a significant portion of cash and cash equivalents were held at a single institution.
Contingent Consideration Arrangements
As discussed in Notes 2 and 8, contingent consideration is payable in the form of cash, and in some cases, equity. Since the contingent consideration to be paid is based on forecasted growth rates over the measurement period, the Company cannot calculate the maximum contingent consideration that may be payable under these arrangements.
Legal and Regulatory Matters
In the ordinary course of business, the Company is involved in lawsuits and other claims. The Company has insurance to cover certain losses that arise in such matters; however, this insurance may not be sufficient to cover these losses. Management, after consultation with legal counsel, currently does not anticipate that the aggregate liability, if any, arising out of any existing legal matters will have a material effect on the Company’s consolidated financial position, results of operations or cash flows.
From time to time, the Company’s subsidiaries receive requests for information from governmental authorities regarding business activities. The Company has cooperated and will continue to cooperate fully with all governmental agencies. The Company continues to believe that the resolution of any governmental inquiry will not have a material impact on the Company’s consolidated financial position, results of operations or cash flows.
Indemnifications
In the ordinary course of business, the Company enters into contracts pursuant to which it may agree to indemnify third parties in certain circumstances. The terms of these indemnities vary from contract to contract and the amount of indemnification liability, if any, cannot be determined.
Management believes that the likelihood of any liability arising under these indemnification provisions is remote. Management cannot estimate any potential maximum exposure due to both the remoteness of any potential claims and the fact that items that would be included within any such calculated claim would be beyond the control of the Company. Consequently, no liability has been recorded in the consolidated balance sheets.
F-41
FOCUS FINANCIAL PARTNERS INC.
NOTES TO CONSOLIDATED FINANCIAL STATEMENTS
FOR THE YEARS ENDED DECEMBER 31, 2017, 2018 AND 2019
(In thousands, except unit data, share and per share amounts)
15. EMPLOYEE BENEFIT PLANS
The Company and its subsidiaries have defined contribution retirement plans, including 401(k) and profit-sharing plans covering eligible employees. During the years ended December 31, 2017, 2018 and 2019, the amounts recorded in expense relating to these plans were $7,485, $8,329 and $10,235, respectively, and are included in compensation and related expenses in the consolidated statements of operations.
16. NET CAPITAL REQUIREMENTS
Certain of the Company’s regulated subsidiaries are subject to minimum net capital requirements. As of December 31, 2018 and 2019, all regulated subsidiaries subject to minimum net capital requirements individually had net capital in excess of minimum net capital requirements. As of December 31, 2018, these subsidiaries had aggregate net capital of $12,990, which was $11,880 in excess of aggregate minimum net capital requirements of $1,110. As of December 31, 2019, these subsidiaries had aggregate net capital of $14,142, which was $11,439 in excess of aggregate minimum net capital requirements of $2,703.
|
|
|
Year Ended |
|||||||
|
|
|
December 31, |
|||||||
|
|
|
2017 |
|
2018 |
|
2019 |
|||
|
Supplemental disclosures of cash flow information—cash paid for: |
|
|
|
|
|
|
|
|
|
|
Interest |
|
$ |
41,840 |
|
$ |
56,584 |
|
$ |
57,344 |
|
Income taxes |
|
$ |
3,357 |
|
$ |
6,149 |
|
$ |
7,775 |
|
Supplemental non-cash cash flow information: |
|
|
|
|
|
|
|
|
|
|
Fair market value of estimated contingent consideration in connection with acquisitions |
|
$ |
37,551 |
|
$ |
42,086 |
|
$ |
82,781 |
|
Fair market value of restricted common units in connection with acquisitions and contingent consideration |
|
$ |
65,064 |
|
$ |
53,877 |
|
$ |
— |
|
Fair market value of Class A common stock in connection with acquisitions |
|
$ |
— |
|
$ |
112,461 |
|
$ |
— |
|
Accretion of senior preferred units return |
|
$ |
6,249 |
|
$ |
— |
|
$ |
— |
|
Accretion of senior preferred units to estimated redemption value |
|
$ |
17,463 |
|
$ |
— |
|
$ |
— |
|
Accretion of junior preferred units return |
|
$ |
672 |
|
$ |
— |
|
$ |
— |
|
Accretion of junior preferred units to estimated redemption value |
|
$ |
8,452 |
|
$ |
— |
|
$ |
— |
|
Net tangible liabilities acquired in connection with business acquisitions |
|
$ |
(6,178) |
|
$ |
(19,594) |
|
$ |
(2,633) |
|
Discount on proceeds from Credit Facility |
|
$ |
3,064 |
|
$ |
— |
|
$ |
875 |
|
Purchase price installments related to acquisitions |
|
$ |
— |
|
$ |
39,134 |
|
$ |
— |
|
Deferred taxes and tax receivable agreements |
|
$ |
— |
|
$ |
62,454 |
|
$ |
(463) |
|
Operating lease assets |
|
$ |
— |
|
$ |
— |
|
$ |
180,114 |
|
Operating lease liabilities |
|
$ |
— |
|
$ |
— |
|
$ |
196,425 |
|
Other |
|
$ |
188 |
|
$ |
228 |
|
$ |
— |
18. RELATED PARTIES
The Company’s Chief Executive Officer, through an entity owned and controlled by him, owns a personal aircraft that was acquired without Company resources that he uses for business travel. The Company reimburses the Company’s Chief Executive Officer for certain costs and third‑party payments associated with the use of his personal
F-42
FOCUS FINANCIAL PARTNERS INC.
NOTES TO CONSOLIDATED FINANCIAL STATEMENTS
FOR THE YEARS ENDED DECEMBER 31, 2017, 2018 AND 2019
(In thousands, except unit data, share and per share amounts)
aircraft for Company‑related business travel. The Company also pays pilot fees for such business travel flights. During the years ended December 31, 2017, 2018 and 2019, the Company recognized expenses of $770, $1,712 and $1,906, respectively, related to these reimbursements. Given the geography of the Company’s partner firms and prospects, the Company believes that the use of private aircraft creates efficiencies to enhance the productivity of the Company’s Chief Executive Officer and certain other authorized personnel.
Affiliates of certain holders of the Company's Class A common stock and Class B common stock received underwriting fees of $6,244 in connection with the Company’s IPO during the year ended December 31, 2018.
Affiliates of certain holders of the Company's Class A common stock and Class B common stock are lenders under the First Lien Term Loan. In July 2019, affiliates of certain holders of the Company’s Class A common stock and Class B common stock received $135 in fees in connection with the amendment and expansion of the Company’s First Lien Term Loan.
19. OTHER
In March 2018, the Company recognized a gain on sale of investment of $5,509 related to an investment in a financial service company previously carried at cost. The gain on sale of investment is presented in other income (expense) in the Company’s consolidated statement of operations for the year ended December 31, 2018.
In February 2019, the Company recorded a management contract buyout expense of $1,428 related to cash consideration for the buyout of a management agreement with one of the Company’s retiring principals whereby the business operations of the relevant partner firm were transitioned to one of the Company’s other partner firms.
In December 2019, the Company evaluated a minority interest investment in a financial services company accounted for using the equity method for impairment and determined that the impairment was an other-than temporary loss in fair value. The Company recognized an impairment in the fair value of the equity method investment of $11,749. The impairment is presented within other income (expense) in the Company’s consolidated statement of operations for the year ended December 31, 2019.
F-43
FOCUS FINANCIAL PARTNERS INC.
NOTES TO CONSOLIDATED FINANCIAL STATEMENTS
FOR THE YEARS ENDED DECEMBER 31, 2017, 2018 AND 2019
(In thousands, except unit data, share and per share amounts)
20. SUPPLEMENTAL FINANCIAL INFORMATION
Consolidated Quarterly Results of Operations (Unaudited):
|
|
|
For the Three Months Ended |
||||||||||
|
|
|
March 31, |
|
June 30, |
|
September 30, |
|
December 31, |
||||
|
|
|
2018 |
|
2018 |
|
2018 |
|
2018 |
||||
|
|
|
(in thousands, except per share data) |
||||||||||
|
Revenues |
|
$ |
196,229 |
|
$ |
231,435 |
|
$ |
235,701 |
|
$ |
247,515 |
|
Operating expenses |
|
|
183,683 |
|
|
219,721 |
|
|
249,958 |
|
|
213,084 |
|
Income (loss) from operations |
|
|
12,546 |
|
|
11,714 |
|
|
(14,257) |
|
|
34,431 |
|
Net income (loss) |
|
$ |
(12,054) |
|
$ |
(7,656) |
|
|
(38,924) |
|
|
17,547 |
|
Non-controlling interests(1) |
|
|
N/A |
|
|
N/A |
|
|
28,726 |
|
|
(7,939) |
|
Net income (loss) attributable to Common Shareholders(1) |
|
|
N/A |
|
|
N/A |
|
$ |
(10,198) |
|
$ |
9,608 |
|
Income (loss) per share of Class A common stock(1): |
|
|
|
|
|
|
|
|
|
|
|
|
|
Basic |
|
|
N/A |
|
|
N/A |
|
$ |
(0.24) |
|
$ |
0.22 |
|
Diluted |
|
|
N/A |
|
|
N/A |
|
$ |
(0.24) |
|
$ |
0.22 |
|
|
|
|
|
|
|
|
|
|
|
|
|
|
|
|
|
For the Three Months Ended |
||||||||||
|
|
|
March 31, |
|
June 30, |
|
September 30, |
|
December 31, |
||||
|
|
|
2019 |
|
2019 |
|
2019 |
|
2019 |
||||
|
|
|
(in thousands, except per share data) |
||||||||||
|
Revenues |
|
$ |
259,924 |
|
$ |
301,545 |
|
$ |
316,641 |
|
$ |
340,231 |
|
Operating expenses |
|
|
250,607 |
|
|
282,012 |
|
|
303,736 |
|
|
314,340 |
|
Income from operations |
|
|
9,317 |
|
|
19,533 |
|
|
12,905 |
|
|
25,891 |
|
Net income (loss) |
|
|
(2,828) |
|
|
3,102 |
|
|
392 |
|
|
(12,691) |
|
Non-controlling interests |
|
|
(114) |
|
|
(2,306) |
|
|
881 |
|
|
692 |
|
Net income (loss) attributable to Common Shareholders |
|
$ |
(2,942) |
|
$ |
796 |
|
$ |
1,273 |
|
$ |
(11,999) |
|
Income (loss) per share of Class A common stock: |
|
|
|
|
|
|
|
|
|
|
|
|
|
Basic |
|
$ |
(0.06) |
|
$ |
0.02 |
|
$ |
0.03 |
|
$ |
(0.25) |
|
Diluted |
|
$ |
(0.06) |
|
$ |
0.02 |
|
$ |
0.03 |
|
$ |
(0.25) |
|
(1) |
Not applicable for periods prior to the date of the Company’s IPO in July 2018. |
Income (loss) per share of Class A common stock for the quarterly periods may not sum to Income (loss) per share of Class A common stock for the respective yearly period due to rounding.
F-44