Attached files
| file | filename |
|---|---|
| EX-99.2 - PRESS RELEASE - Glatfelter Corp | ss104486_ex9902.htm |
| 8-K - CURRENT REPORT - Glatfelter Corp | ss104486_8k.htm |
Exhibit 99.1
Sale of Specialty Papers August 21, 2018 NYSE: GLT |
 |
Forward-Looking Statements and Use of Non-GAAP Financial Measures Any statements included in this presentation which pertain to future financial and business matters are "forward-looking statements" within the meaning of the safe harbor provisions of the United States Private Securities Litigation Reform Act of 1995. The Company uses words such as "anticipates"; "believes"; "expects"; "future"; "intends" and similar expressions to identify forward-looking statements. Any such statements are based on management's current expectations and are subject to numerous risks, uncertainties and other unpredictable or uncontrollable factors that could cause future results to differ materially from those expressed in the forward-looking statements Including, but not limited to: changes in industry, business, market, political and economic conditions in the U.S. and other countries in which the Company does business, demand for or pricing of its products, changes in tax legislation, governmental laws, regulations and policies, initiatives of regulatory authorities, technological changes and innovations, market growth rates, and cost reduction initiatives. In light of these risks, uncertainties and other factors, the forward-looking matters discussed in this presentation may not occur and readers are cautioned not to place undue reliance on these forward-looking statements. The forward looking statements speak only as of the date of this presentation and Glatfelter undertakes no obligation, and does not intend, to update these forward-looking statements to reflect events or circumstances occurring after the date of this presentation. More information about these factors is contained in Glatfelter's filings with the U.S. Securities and Exchange Commission, which are available at www.glatfelter.com. During the course of this presentation, certain non-U.S. GAAP financial measures will be presented. A reconciliation of these measures to U.S. GAAP financial measures is included in the appendix of this presentation. 2 |
 |
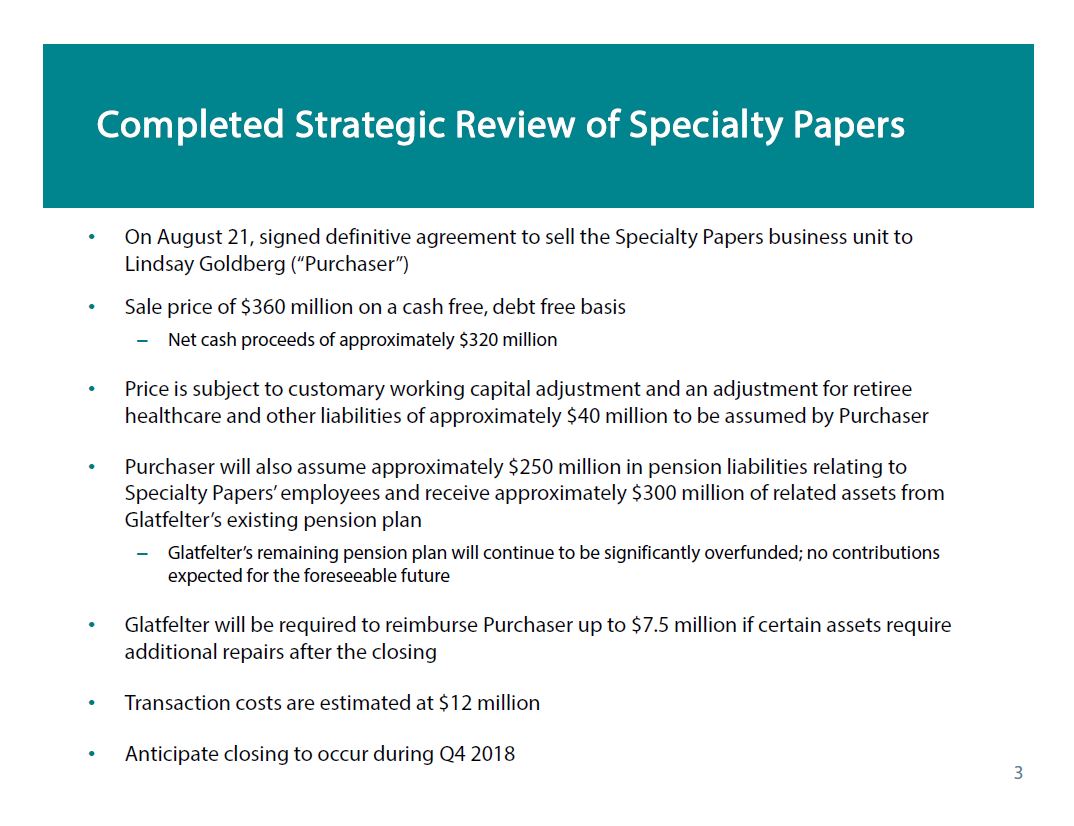
 Completed Strategic Review of Specialty
   Papers

On August 21, signed definitive agreement to sell the
Specialty Papers business unit to Lindsay Goldberg

("Purchaser")

Sale price of $360 million on a cash free, debt free basis
Net cash proceeds of approximately $320 million Price is
subject to customary working capital adjustment and an
adjustment for retiree healthcare and other liabilities of
approximately $40 million to be assumed by Purchaser
Purchaser will also assume approximately $250 million in
pension liabilities relating to Specialty Papers' employees
and receive approximately $300 million of related assets
from Glatfelter's existing pension plan Glatfelter's
remaining pension plan will continue to be significantly
overfunded; no contributions expected for the foreseeable
future Glatfelter will be required to reimburse Purchaser up
to $7.5 million if certain assets require additional repairs
after the closing Transaction costs are estimated at $12
million Anticipate closing to occur during Q4 2018

3
|
 |
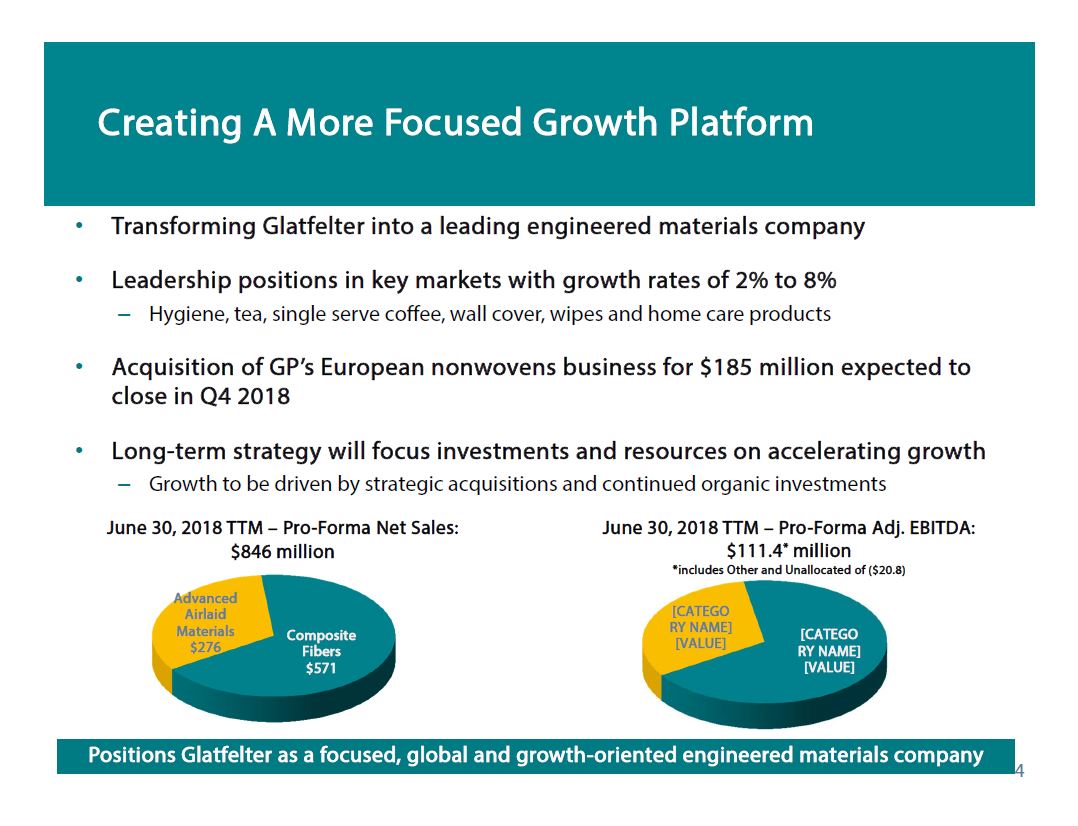
Creating A More Focused Growth Platform Transforming Glatfelter into a leading engineered materials company Leadership positions in key markets with growth rates of 2% to 8% Hygiene, tea, single serve coffee, wall cover, wipes and home care products Acquisition of GP's European nonwovens business for $185 million expected to close in Q4 2018 Long-term strategy will focus investments and resources on accelerating growth Growth to be driven by strategic acquisitions and continued organic investments June 30, 2018 TTM - Pro-Forma Net Sales: $846 million Advanced Airlaid Materials $276 Composite Fibers $571 June 30, 2018 TTM - Pro-Forma Adj. EBITDA: $111.4* million *includes Other and Unallocated of ($20.8) [CATEGORY NAME] [VALUE] [CATEGORY NAME] [VALUE] Positions Glatfelter as a focused, global and growth-oriented engineered materials company 4 |
 |
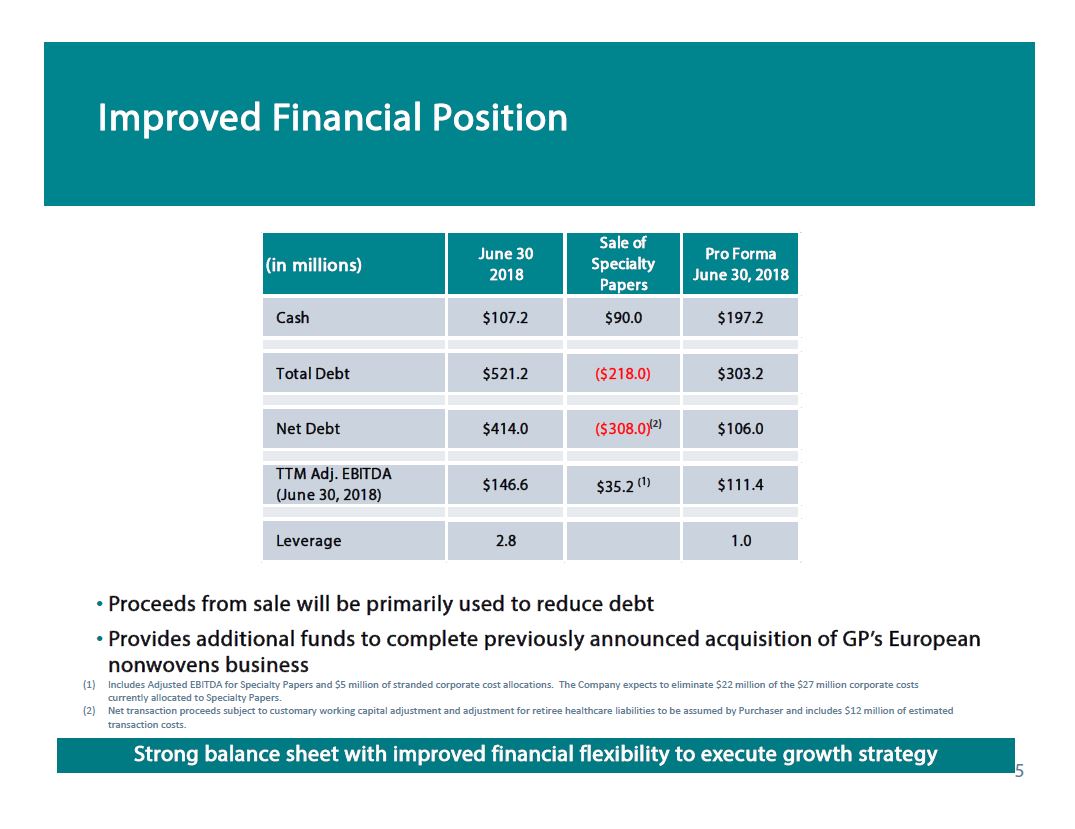
Improved Financial Position (in millions) Cash Total Debt Net Debt TTM Adj. EBITDA (June 30, 2018) Leverage June 30 2018 $107.2 $521.2 $414.0 $146.6 2.8 Sale of Specialty Papers $90.0 ($218.0) ($308.0)(2) $35.2(1) Pro Forma June 30, 2018 $197.2 $303.2 $106.0 $111.4 1.0 Proceeds from sale will be primarily used to reduce debt Provides additional funds to complete previously announced acquisition of GP's European nonwovens business (1) Includes Adjusted EBITDA for Specialty Papers and $5 million of stranded corporate cost allocations. The Company expects to eliminate $22 million of the $27 million corporate costs currently allocated to Specialty Papers. (2) Net transaction proceeds subject to customary working capital adjustment and adjustment for retiree healthcare liabilities to be assumed by Purchaser and includes $12 million of estimated transaction costs. Strong balance sheet with improved financial flexibility to execute growth strategy 5 |
 |
Appendix 6 |
 |
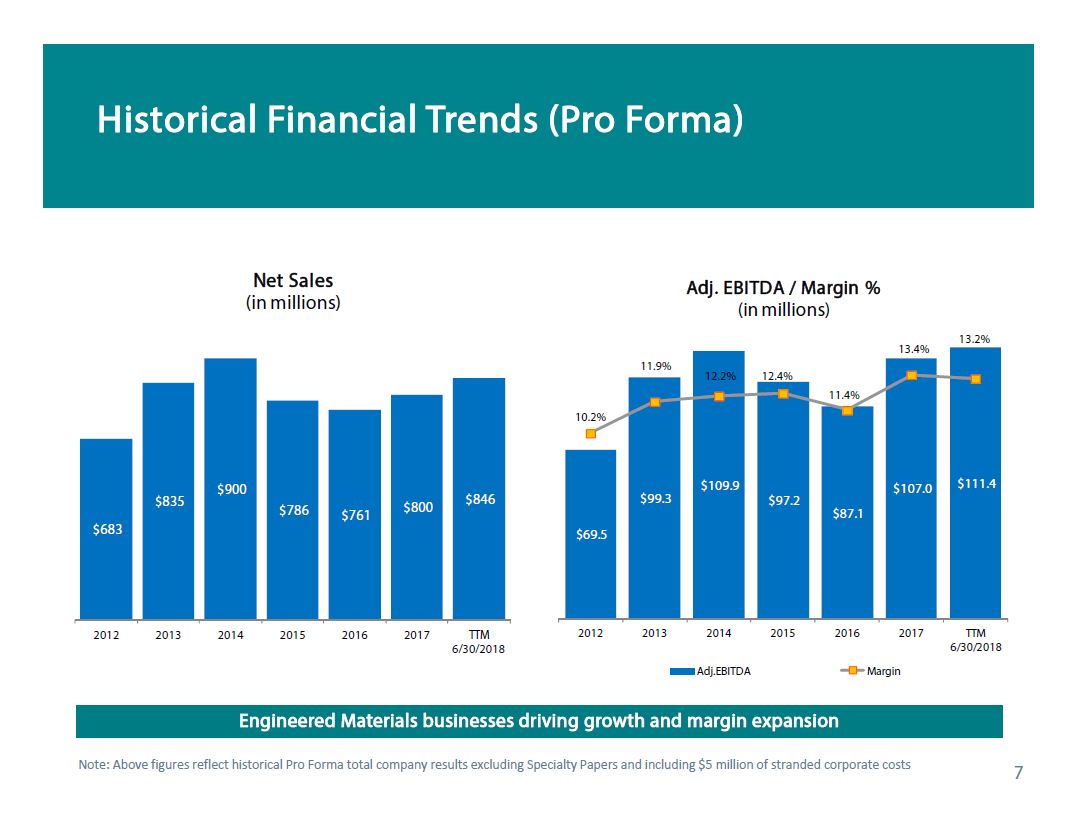
Historical Financial Trends (Pro Forma) Net Sales (in millions) $683 2012 $835 2013 $900 2014 $786 2015 $761 2016 $800 2017 $846 TIM 6/30/2108 Adj. EBITDA/Margin % (in millions) 10.2% $69.5 2012 11.9% $99.3 2013 12.2% $109.9 2014 12.4% $97.2 2015 11.4% $87.1 2016 13.4% $107.0 2017 13.2% $111.4 TIM 6/30/2018 Adj. EBITDA Margin Engineered Materials businesses driving growth and margin expansion Note: Above figures reflect historical Pro Forma total company results excluding Specialty Papers and including $5 million of stranded corporate costs 7 |
 |
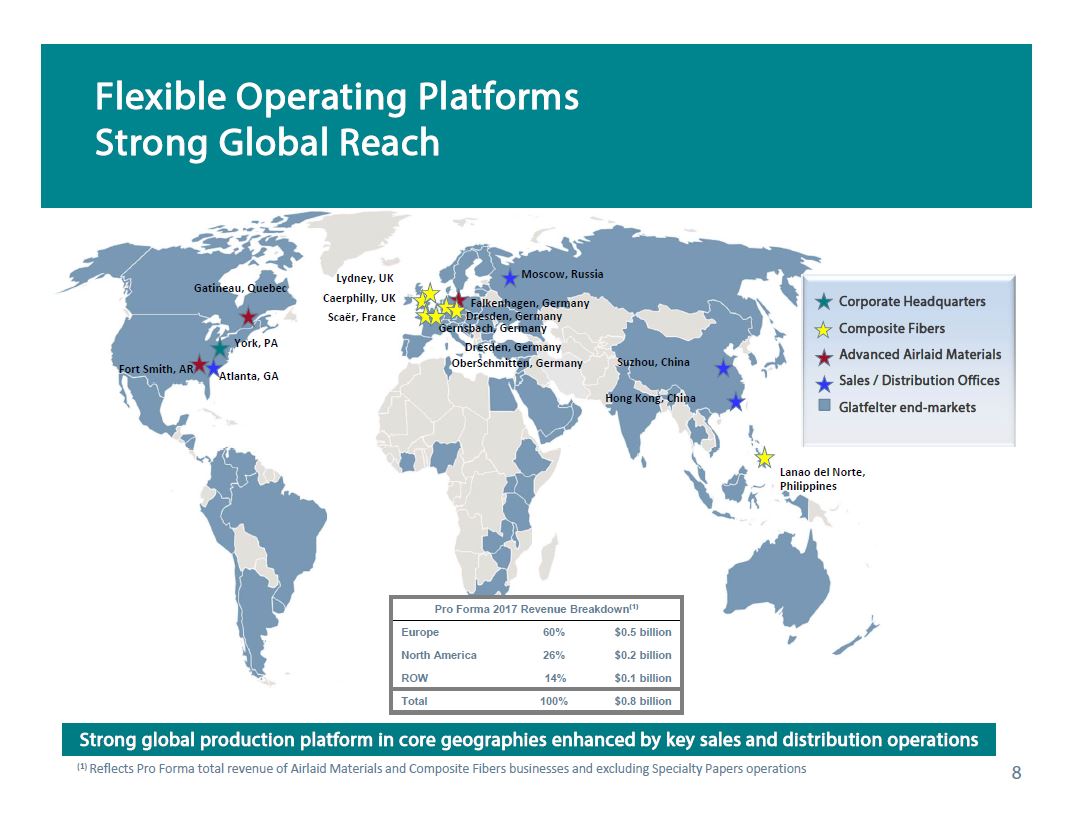
Flexible Operating Platforms Strong Global Reach Gatineau, Quebec York, PA Fort Smith, AR Atlanta, GA Lydney, UK Caerphilly, UK Scaer, France Moscow, Russia Falkenhagen, Germany Dresden, Germany Gernsbach, Germany Dresden, Germany OberSchmitten, Germany Suzhou, China Hong Kong, China Lanao del Norte, Philippines Corporate Headquarters Composite Fibers Advanced Airlaid Materials Sales / Distribution Offices Glatfelter end-markets Pro Forma 2017 Revenue Breakdown(1) Europe North America ROW Total 60% 26% 14% 100% $0.5 billion $0.2 billion $0.1 billion $0.8 billion Strong global production platform in core geographies enhanced by key sales and distribution operations (1) Reflects Pro Forma total revenue of Airlaid Materials and Composite Fibers businesses and excluding Specialty Papers operations 8 |
 |
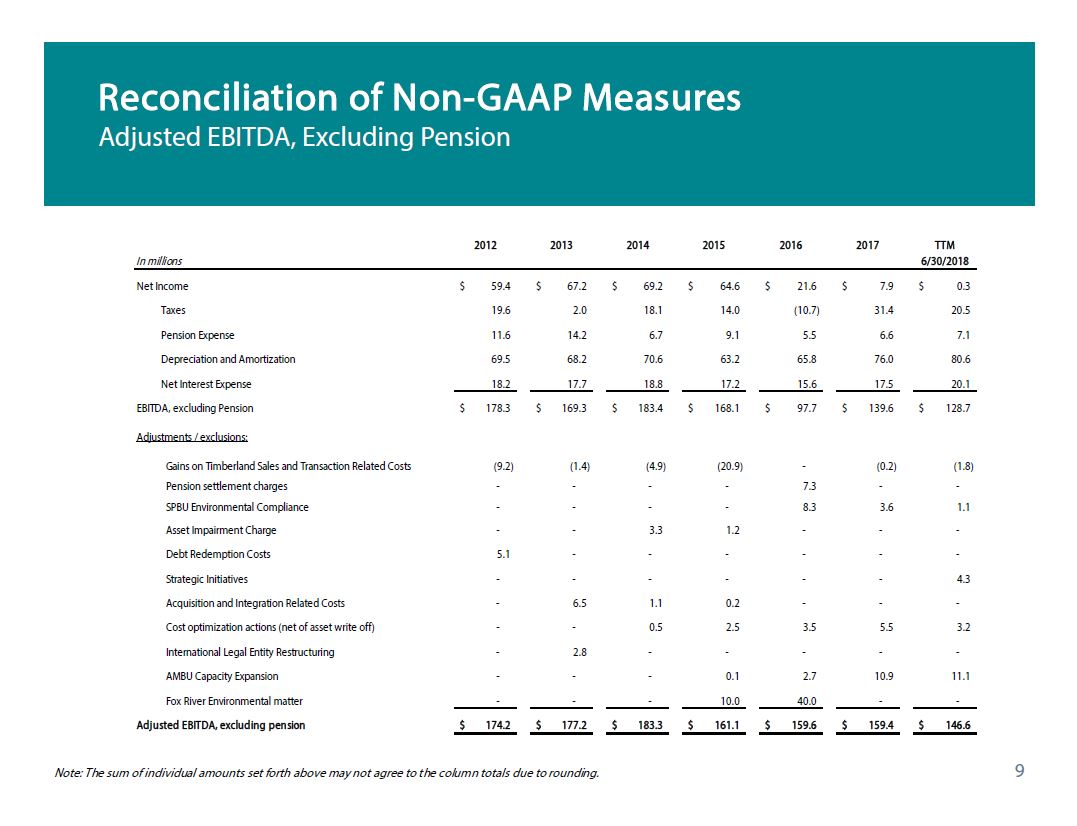
Reconciliation of Non-GAAP Measures Adjusted EBITDA, Excluding Pension In millions Net income Taxes Pension Expense Depreciation and Amortization Net Interest Expense EBITDA, exclusion Pension Adjustments / exclusions Gains on Timberland Sales and Transaction Related Costs Pension settlement charges SPBU Environmental Compliance Asset Impairment Charge Debt Redemption Costs Strategic Initiatives Acquisition and Integration Related Costs Cost optimization actions (net of asset write off) International Legal Entity Restructuring AMBU Capacity Expansion Fox River Environmental Matter Adjusted EBITDA, excluding pension 2012 $59.4 19.6 11.6 69.5 18.2 178.3 (9.2) - - 5.1 - - - $174.2 2013 $67.2 2.0 14.2 68.2 17.7 $169.3 (1.4) - - - 6.5 - 2.8 - $177.2 2014 $69.2 18.1 6.7 70.6 18.8 $183.4 (4.9) - 3.3 - 1.1 0.5 - - $183.3 2015 $64.6 14.0 9.1 63.2 17.2 $168.1 (20.9) - 1.2 - 0.2 2.5 - 0.1 10.0 $161.1 2016 $21.6 (10.7) 5.5 65.8 15.6 $97.7 - 7.3 8.3 - - - 3.5 - 2.7 40.0 $159.6 2017 $7.9 31.4 6.6 76.0 17.5 139.6 (0.2) - 3.6 - - 5.5 - 10.9 - $159.4 TTM 6/30/2018 $0.3 20.5 7.1 80.6 20.1 $128.7 (1.8) - 1.1 - 4.3 - 3.2 - 11.1 - $146.6 Note: The sum of individual amounts set forth above may not agree to the column totals due to rounding. 9 |
 |
Reconciliation of Non-GAAP Measures Adjusted EBITDA, Excluding Pension in millions Composite Fibers Operating Profit Addback: Depreciation & Amortization Composite Fibers EBITDA Advanced Airlaid Materials Operating Profit Addback: Depreciation & Amortization Advanced Airlaid Materials EBITDA Speciality Papers Operating Profit Addback: Depreciation & Amortization Specialty Papers EBITDA 2012 $36.1 23.5 $59.6 $18.0 8.7 $26.7 $67.3 32.4 $99.7 2013 $62.4 24.8 $87.2 $21.4 8.9 $30.4 $39.7 33.2 $72.9 2014 $68.2 29.7 $97.9 $25.3 9.1 $34.4 $38.6 29.9 $68.4 2015 $61.3 26.2 $87.6 $21.2 8.8 $30.0 $33.0 26.0 $58.9 2016 $54.2 27.8 $82.1 $26.3 9.0 $35.3 $41.2 26.3 $67.5 2017 $62.3 28.3 $90.6 $30.1 9.6 $39.7 $16.6 30.8 $47.3 TTM 6/30/2018 $61.7 29.1 $90.8 $30.2 11.3 $41.5 ($2.0) 32.2 $30.2 Note: The sum of individual amounts set forth above may not agree to the column totals due to rounding. 10 |
 |
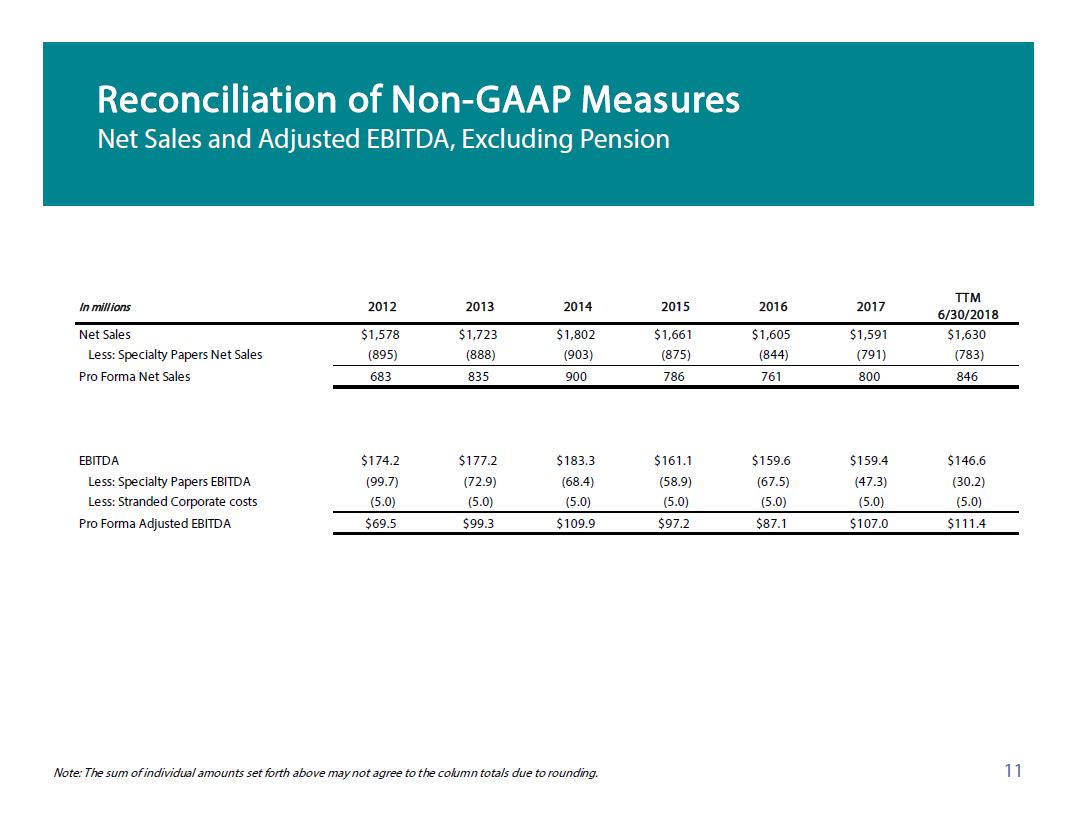
Reconciliation of Non-GAAP Measures Net Sales and Adjusted EBITDA, Excluding Pension In millions Net Sales Less: Specialty Papers Net Sales Pro Forma Net Sales EBITDA Less: Specialty Papers EBITDA Less: Stranded Corporate costs Pro Forma Adjusted EBITDA 2012 $1,578 (895) 683 $174.2 (99.7) (5.0) $69.5 2013 $1,723 (888) 835 $177.2 (72.9) (5.0) $99.3 2014 $1,802 (903) 900 $183.3 (68.4) (5.0) $109.9 2015 $1,661 (875) 786 $161.1 (58.9) (5.0) $97.2 2016 $1,605 (844) 761 $159.6 (67.5) (5.0) $87.1 2017 $1,591 (791) 800 $159.4 (47.3) (5.0) $107.0 TTM 6/30/18 $1,630 (783) 846 $146.6 (30.2) (5.0) $111.4 Note: The sum of individual amounts set forth above may not agree to the column totals due to rounding. 11 |
 |
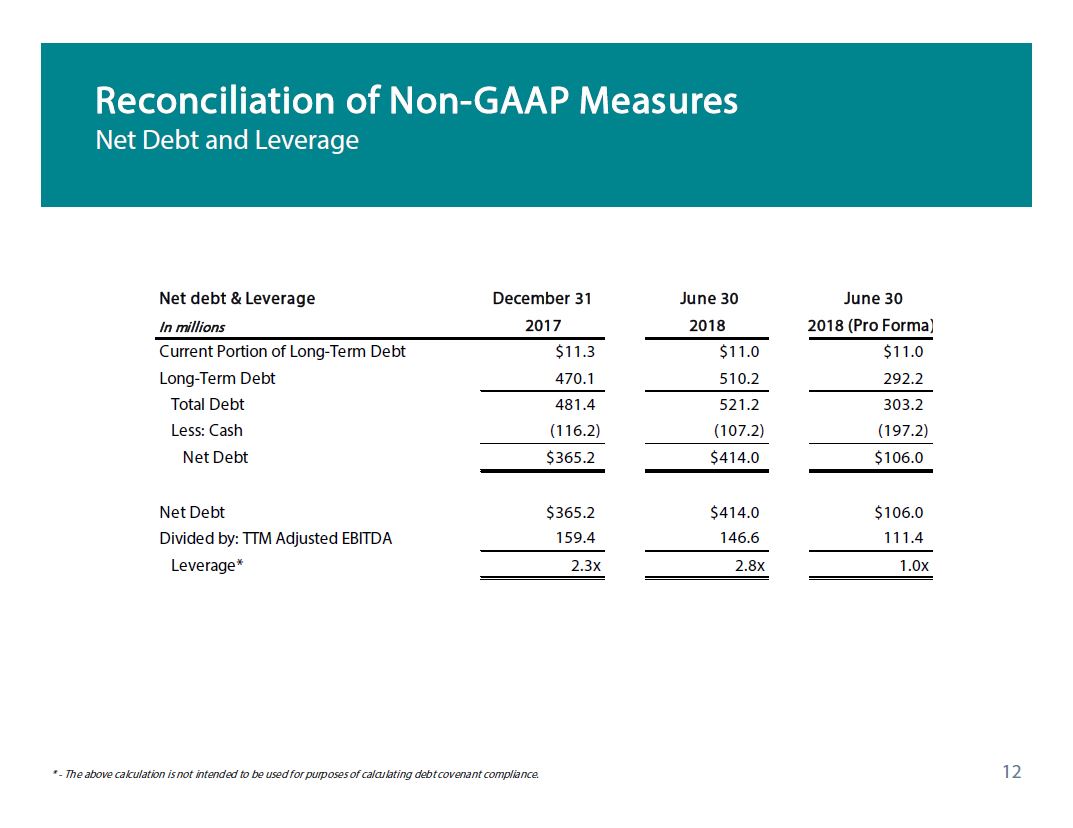
Reconciliation of Non-GAAP Measures Net Debt and Leverage Net debt & Leverage In millions Current Portion of Long-Term Debt Long-Term Debt Total Debt Less: Cash Net Debt Net Debt Divided by: TTM Adjusted EBITDA Leverage* December 31 2017 $11.3 470.1 481.4 (116.2) $365.2 $365.2 159.4 2.3x June 30 2018 $11.0 510.2 521.2 (107.2) $414.0 $414.0 146.6 2.8x June 30 2018 (Pro Forma) $11.0 292.2 303.2 (197.2) $106.0 $106.0 111.4 1.0x * - The above calculation is not intended to be used for purposes of calculating debt covenant compliance. 12 |
 |