Attached files
| file | filename |
|---|---|
| 8-K - FORM 8-K - SEACOAST BANKING CORP OF FLORIDA | tv501384_8k.htm |
Exhibit 99.1
Contact: (email) Chuck.Shaffer@SeacoastBank.com (phone) 772.221.7003 (web) www.SeacoastBanking.com Investor Presentation Q2 - 2018
Cautionary Notice Regarding Forward - Looking Statements 2 This press release contains "forward - looking statements" within the meaning, and protections, of Section 27 A of the Securities Act of 1933 and Section 21 E of the Securities Exchange Act of 1934 , including, without limitation, statements about future financial and operating results, cost savings, enhanced revenues, economic and seasonal conditions in our markets, and improvements to reported earnings that may be realized from cost controls, tax law changes, and for integration of banks that we have acquired, or expect to acquire, as well as statements with respect to Seacoast's objectives, strategic plans, including Vision 2020 , expectations and intentions and other statements that are not historical facts . Actual results may differ from those set forth in the forward - looking statements . Forward - looking statements include statements with respect to our beliefs, plans, objectives, goals, expectations, anticipations, estimates and intentions, and involve known and unknown risks, uncertainties and other factors, which may be beyond our control, and which may cause the actual results, performance or achievements of Seacoast to be materially different from future results, performance or achievements expressed or implied by such forward - looking statements . You should not expect us to update any forward - looking statements . You can identify these forward - looking statements through our use of words such as “may,” “will,” “anticipate,” “assume,” “should,” “support”, “indicate,” “would,” “believe,” “contemplate,” “expect,” “estimate,” “continue,” “further”, “point to,” “project,” “could,” “intend” or other similar words and expressions of the future . These forward - looking statements may not be realized due to a variety of factors, including, without limitation : the effects of future economic and market conditions, including seasonality ; governmental monetary and fiscal policies, as well as legislative, tax and regulatory changes ; changes in accounting policies, rules and practices ; the risks of changes in interest rates on the level and composition of deposits, loan demand, liquidity and the values of loan collateral, securities, and interest sensitive assets and liabilities ; interest rate risks, sensitivities and the shape of the yield curve ; the effects of competition from other commercial banks, thrifts, mortgage banking firms, consumer finance companies, credit unions, securities brokerage firms, insurance companies, money market and other mutual funds and other financial institutions operating in our market areas and elsewhere, including institutions operating regionally, nationally and internationally, together with such competitors offering banking products and services by mail, telephone, computer and the Internet ; and the failure of assumptions underlying the establishment of reserves for possible loan losses . The risks of mergers and acquisitions, include, without limitation : unexpected transaction costs, including the costs of integrating operations ; the risks that the businesses will not be integrated successfully or that such integration may be more difficult, time - consuming or costly than expected ; the potential failure to fully or timely realize expected revenues and revenue synergies, including as the result of revenues following the merger being lower than expected ; the risk of deposit and customer attrition ; any changes in deposit mix ; unexpected operating and other costs, which may differ or change from expectations ; the risks of customer and employee loss and business disruption, including, without limitation, as the result of difficulties in maintaining relationships with employees ; increased competitive pressures and solicitations of customers by competitors ; as well as the difficulties and risks inherent with entering new markets . All written or oral forward - looking statements attributable to us are expressly qualified in their entirety by this cautionary notice, including, without limitation, those risks and uncertainties described in our annual report on Form 10 - K for the year ended December 31 , 2017 under “Special Cautionary Notice Regarding Forward - Looking Statements” and “Risk Factors”, and otherwise in our SEC reports and filings . Such reports are available upon request from the Company, or from the Securities and Exchange Commission, including through the SEC’s Internet website at http : //www . sec . gov .
Agenda 3 ABOUT SEACOAST BANK 1 COMPANY PERFORMANCE 2 SEACOAST’S DIFFERENTIATED STRATEGY 3 OUTLOOK 4
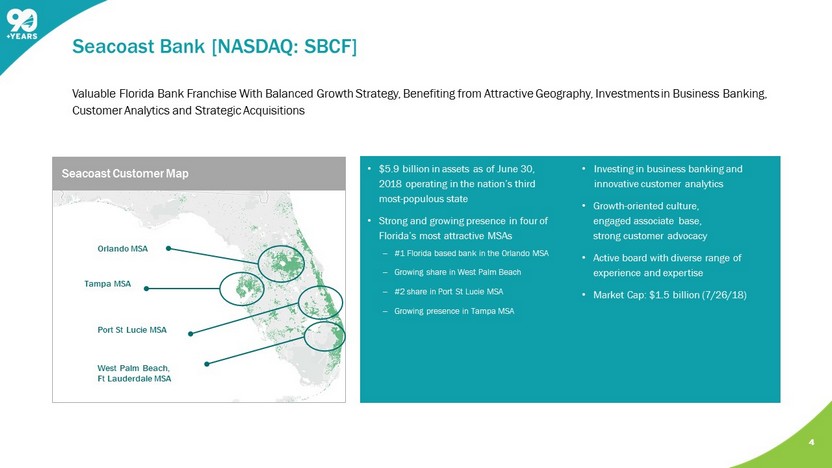
• $5.9 billion in assets as of June 30, 2018 operating in the nation’s third most - populous state • Strong and growing presence in four of Florida’s most attractive MSAs ‒ #1 Florida based bank in the Orlando MSA ‒ Growing share in West Palm Beach ‒ #2 share in Port St Lucie MSA ‒ Growing presence in Tampa MSA • Investing in business banking and innovative customer analytics • Growth - oriented culture, engaged associate base, strong customer advocacy • Active board with diverse range of experience and expertise • Market Cap: $1.5 billion (7/26/18) Valuable Florida Bank Franchise With Balanced Growth Strategy, Benefiting from Attractive Geography, Investments in Business Banking, Customer Analytics and Strategic Acquisitions 4 Seacoast Bank [NASDAQ: SBCF ] Orlando MSA West Palm Beach, Ft Lauderdale MSA Port St Lucie MSA Tampa MSA Seacoast Customer Map
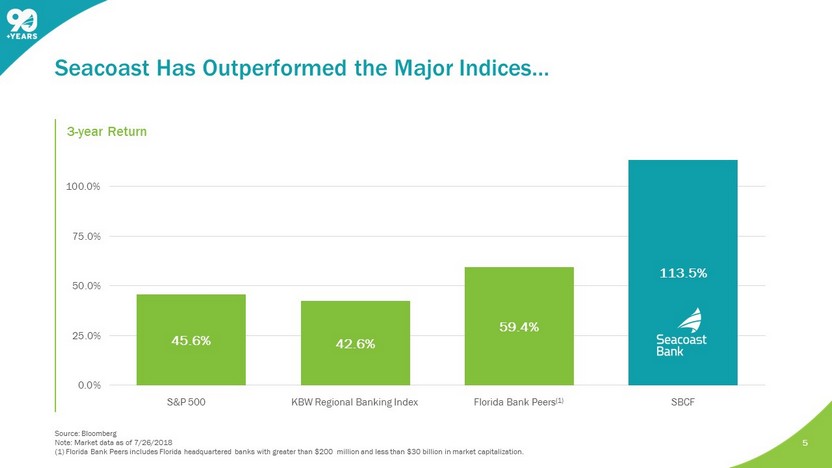
Florida Bank Peers (1) 5 Seacoast Has Outperformed the Major Indices … S&P 500 SBC F KBW Regional Banking Index Source: Bloomberg Note: Market data as of 7/26/2018 (1) Florida Bank Peers includes Florida headquartered banks with greater than $200 m illion and less than $30 billion in market capitalization. 3 - year Return 45.6% 42.6% 59.4% 113.5% 0.0% 25.0% 50.0% 75.0% 100.0%
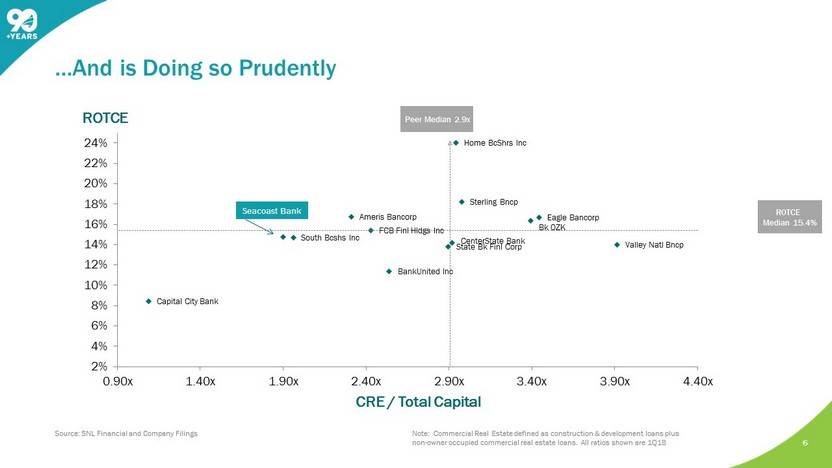
FCB Finl Hldgs Inc CenterState Bank State Bk Finl Corp BankUnited Inc Capital City Bank Home BcShrs Inc South Bcshs Inc Sterling Bncp Ameris Bancorp Eagle Bancorp Valley Natl Bncp Bk OZK 2% 4% 6% 8% 10% 12% 14% 16% 18% 20% 22% 24% 0.90x 1.40x 1.90x 2.40x 2.90x 3.40x 3.90x 4.40x CRE / Total Capital ROTCE Seacoast Bank 6 …And is Doing so Prudently Source: SNL Financial and Company Filings Note: Commercial Real Estate defined as construction & development loans plus non - owner occupied commercial real estate loans. All ratios shown are 1Q18 ROTCE Median 15.4% Peer Median 2.9x
Agenda 7 ABOUT SEACOAST BANK 1 COMPANY PERFORMANCE 2 SEACOAST’S DIFFERENTIATED STRATEGY 3 OUTLOOK 4
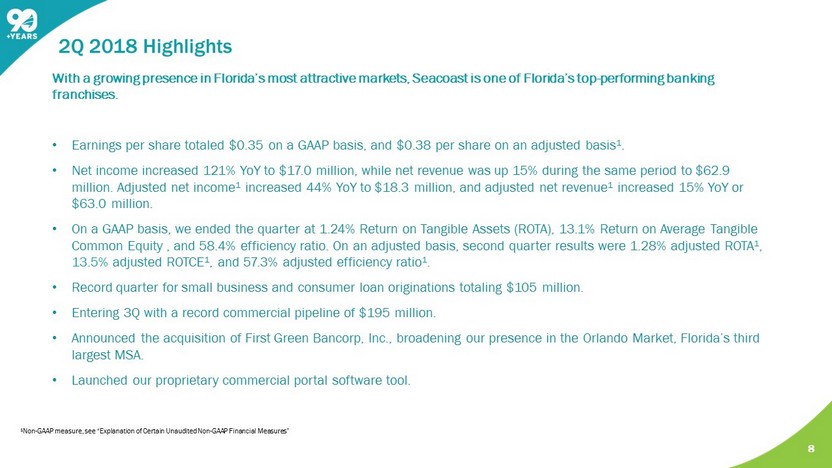
8 2 Q 2018 Highlights With a growing presence in Florida’s most attractive markets, Seacoast is one of Florida’s top - performing banking franchises. • Earnings per share totaled $0.35 on a GAAP basis, and $0.38 per share on an adjusted basis 1 . • Net income increased 121% YoY to $17.0 million, while net revenue was up 15% during the same period to $62.9 million. Adjusted net income 1 increased 44% YoY to $18.3 million, and adjusted net revenue 1 increased 15% YoY or $63.0 million. • On a GAAP basis, we ended the quarter at 1.24% Return on Tangible Assets (ROTA), 13.1% Return on Average Tangible Common Equity , and 58.4% efficiency ratio. On an adjusted basis, second quarter results were 1.28% adjusted ROTA 1 , 13.5% adjusted ROTCE 1 , and 57.3% adjusted efficiency ratio 1 . • Record quarter for small business and consumer loan originations totaling $105 million. • Entering 3Q with a record commercial pipeline of $195 million . • Announced the acquisition of First Green Bancorp, Inc., broadening our presence in the Orlando Market, Florida’s third largest MSA. • Launched our proprietary commercial portal software tool. 1 Non - GAAP measure, see “Explanation of Certain Unaudited Non - GAAP Financial Measures ”
Notable Items Impacting Results by $0.05 per share in the Second Quarter 9 • $0.5 million reduction in accretion from discounts on acquired loans quarter over quarter . • Experienced higher prepayments quarter over quarter on the nonacquired originated loan portfolio which reduced loan growth by 3 %. • Recognized $1.7 million in net charge offs in the quarter . • Recognized $0.3 million in losses on the sale of other real estate owned during the quarter.
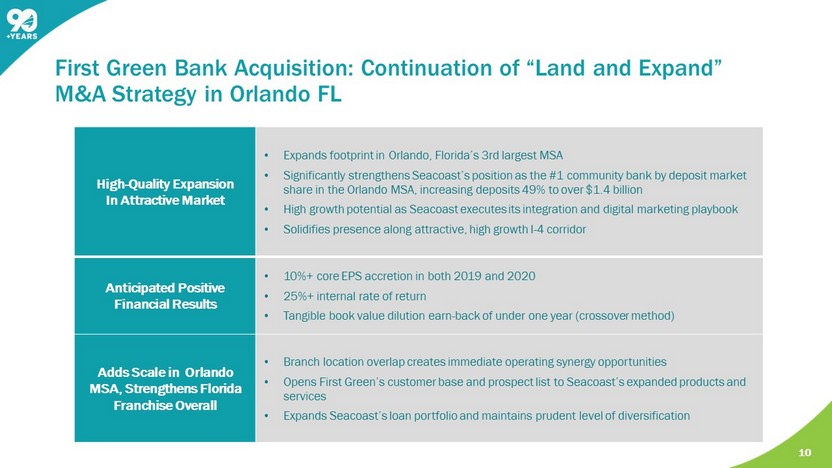
First Green Bank Acquisition: Continuation of “Land and Expand” M&A Strategy in Orlando FL 10 High - Quality Expansion In Attractive Market • Expands footprint in Orlando, Florida’s 3rd largest MSA • Significantly strengthens Seacoast’s position as the #1 community bank by deposit market share in the Orlando MSA, increasing deposits 49% to over $1.4 billion • High growth potential as Seacoast executes its integration and digital marketing playbook • Solidifies presence along attractive, high growth I - 4 corridor Anticipated Positive Financial Results • 10%+ core EPS accretion in both 2019 and 2020 • 25%+ internal rate of return • Tangible book value d ilution earn - back of under one year (crossover method) Adds Scale in Orlando MSA, Strengthens Florida Franchise Overall • Branch location overlap creates immediate operating synergy opportunities • Opens First Green’s customer base and prospect list to Seacoast’s expanded products and services • Expands Seacoast’s loan portfolio and maintains prudent level of diversification
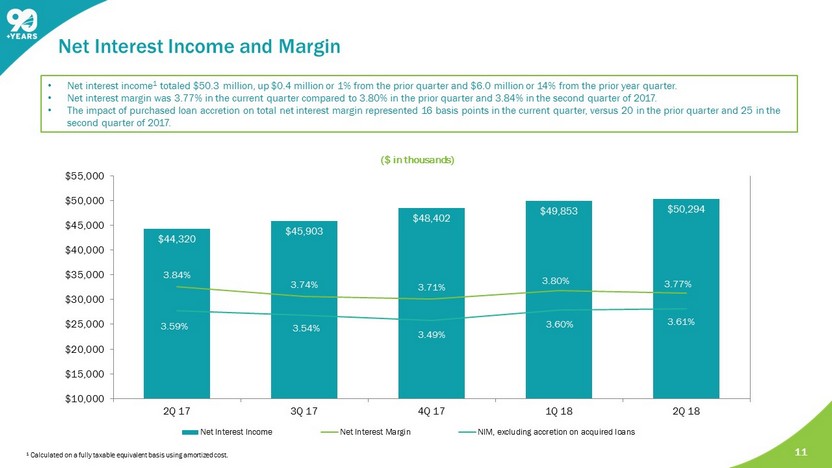
11 ($ in thousands) • Net interest income 1 totaled $50.3 million, up $0.4 million or 1 % from the prior quarter and $6.0 million or 14% from the prior year quarter. • Net interest margin was 3.77% in the current quarter compared to 3.80% in the prior quarter and 3.84% in the second quarter of 2017. • The impact of purchased loan accretion on total net interest margin represented 16 basis points in the current quarter, versus 20 in the pr ior quarter and 25 in the second quarter of 2017. 1 Calculated on a fully taxable equivalent basis using amortized cost . Net Interest Income and Margin $44,320 $45,903 $48,402 $49,853 $50,294 3.84% 3.74% 3.71% 3.80% 3.77% 3.59% 3.54% 3.49% 3.60% 3.61% $10,000 $15,000 $20,000 $25,000 $30,000 $35,000 $40,000 $45,000 $50,000 $55,000 2Q 17 3Q 17 4Q 17 1Q 18 2Q 18 Net Interest Income Net Interest Margin NIM, excluding accretion on acquired loans
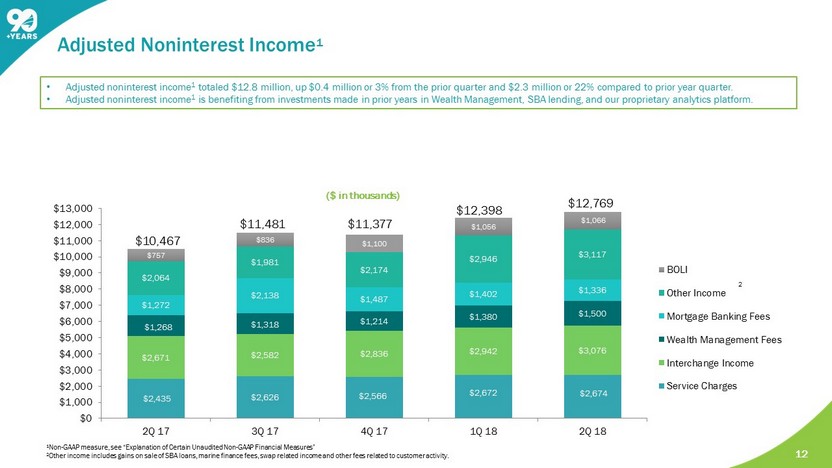
12 $2,435 $2,626 $2,566 $2,672 $2,674 $2,671 $2,582 $2,836 $2,942 $3,076 $1,268 $1,318 $1,214 $1,380 $1,500 $1,272 $2,138 $1,487 $1,402 $1,336 $2,064 $1,981 $2,174 $2,946 $3,117 $757 $836 $1,100 $1,056 $1,066 $0 $1,000 $2,000 $3,000 $4,000 $5,000 $6,000 $7,000 $8,000 $9,000 $10,000 $11,000 $12,000 $13,000 2Q 17 3Q 17 4Q 17 1Q 18 2Q 18 BOLI Other Income Mortgage Banking Fees Wealth Management Fees Interchange Income Service Charges 2 $10,467 • Adjusted noninterest income 1 totaled $12.8 million, up $0.4 million or 3% from the prior quarter and $2.3 million or 22% compared to prior year quarter. • Adjusted noninterest income 1 is benefiting from investments made in prior years in Wealth Management, SBA lending, and our proprietary analytics platform. $11,481 $11,377 $12,398 $12,769 Adjusted Noninterest Income 1 1 Non - GAAP measure, see “Explanation of Certain Unaudited Non - GAAP Financial Measures” 2 Other income includes gains on sale of SBA loans, marine finance fees, swap related income and other fees related to customer ac tivity. ($ in thousands)
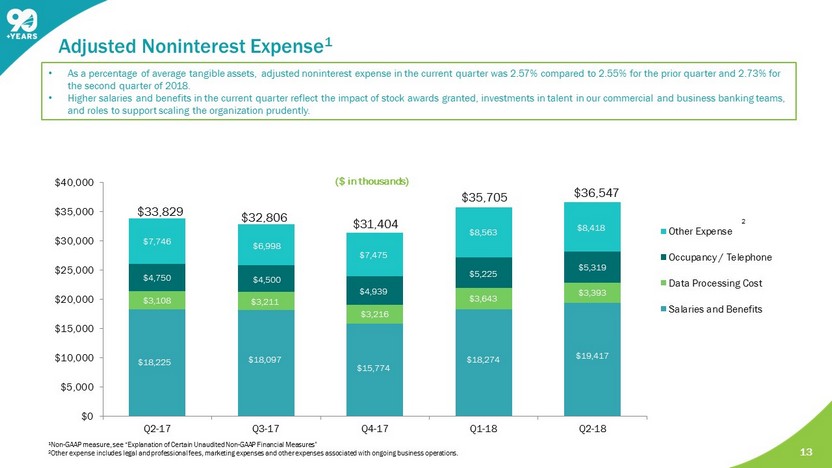
13 $18,225 $18,097 $15,774 $18,274 $19,417 $3,108 $3,211 $3,216 $3,643 $3,393 $4,750 $4,500 $4,939 $5,225 $5,319 $7,746 $6,998 $7,475 $8,563 $8,418 $0 $5,000 $10,000 $15,000 $20,000 $25,000 $30,000 $35,000 $40,000 Q2-17 Q3-17 Q4-17 Q1-18 Q2-18 Other Expense Occupancy / Telephone Data Processing Cost Salaries and Benefits 2 $36,547 $33,829 $32,806 $31,404 $35,705 • As a percentage of average tangible assets, adjusted noninterest expense in the current quarter was 2.57% compared to 2.55% for the prior quarter and 2.73% for the second quarter of 2018. • Higher salaries and benefits in the current quarter reflect the impact of stock awards granted, investments in talent in our commercial and business banking teams, and roles to support scaling the organization prudently . 1 Non - GAAP measure, see “Explanation of Certain Unaudited Non - GAAP Financial Measures ” 2 Other expense includes legal and professional fees, marketing expenses and other expenses associated with ongoing business op era tions. Adjusted Noninterest Expense 1 ($ in thousands)
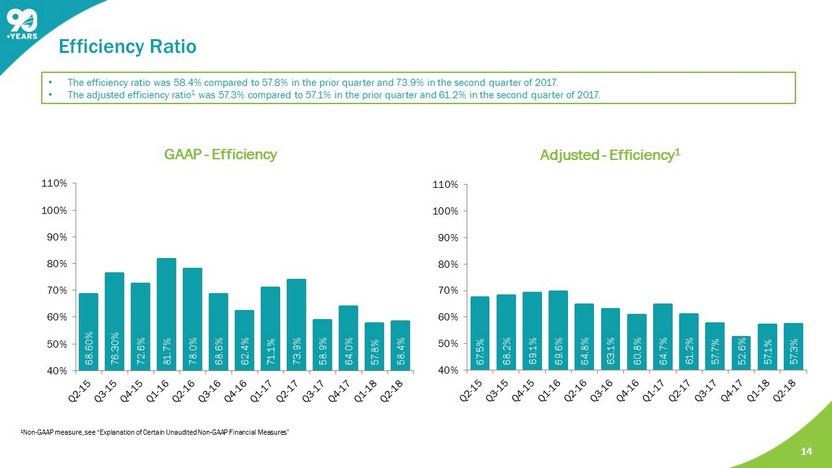
14 68.60% 76.30% 72.6% 81.7% 78.0% 68.6% 62.4% 71.1% 73.9% 58.9% 64.0% 57.8% 58.4% 40% 50% 60% 70% 80% 90% 100% 110% GAAP - Efficiency 67.5% 68.2% 69.1% 69.6% 64.8% 63.1% 60.8% 64.7% 61.2% 57.7% 52.6% 57.1% 57.3% 40% 50% 60% 70% 80% 90% 100% 110% Adjusted - Efficiency 1 1 Non - GAAP measure, see “Explanation of Certain Unaudited Non - GAAP Financial Measures ” • The efficiency ratio was 58.4% compared to 57.8% in the prior quarter and 73.9% in the second quarter of 2017. • The adjusted efficiency ratio 1 was 57.3% compared to 57.1% in the prior quarter and 61.2% in the second quarter of 2017. Efficiency Ratio
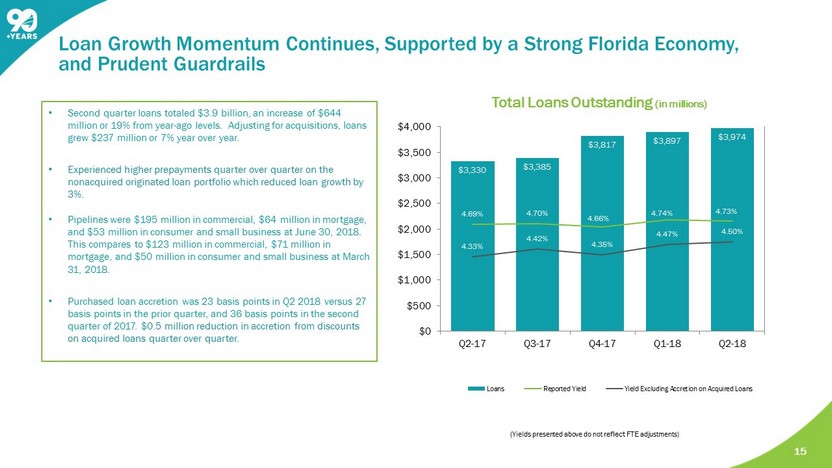
15 Total Loans Outstanding (in millions) • Second quarter loans totaled $3.9 billion, an increase of $644 million or 19% from year - ago levels. Adjusting for acquisitions, loans grew $237 million or 7% year over year . • Experienced higher prepayments quarter over quarter on the nonacquired originated loan portfolio which reduced loan growth by 3%. • Pipelines were $195 million in commercial, $64 million in mortgage, and $53 million in consumer and small business at June 30, 2018 . This compares to $123 million in commercial, $71 million in mortgage, and $50 million in consumer and small business at March 31, 2018. • Purchased loan accretion was 23 basis points in Q2 2018 versus 27 basis points in the prior quarter, and 36 basis points in the second quarter of 2017. $0.5 million reduction in accretion from discounts on acquired loans quarter over quarter. $3,330 $3,385 $3,817 $3,897 $3,974 4.69% 4.70% 4.66% 4.74% 4.73% 4.33% 4.42% 4.35% 4.47% 4.50% $0 $500 $1,000 $1,500 $2,000 $2,500 $3,000 $3,500 $4,000 Q2-17 Q3-17 Q4-17 Q1-18 Q2-18 Loans Reported Yield Yield Excluding Accretion on Acquired Loans Loan Growth Momentum Continues, Supported by a Strong Florida Economy, and Prudent Guardrails (Yields presented above do not reflect FTE adjustments)
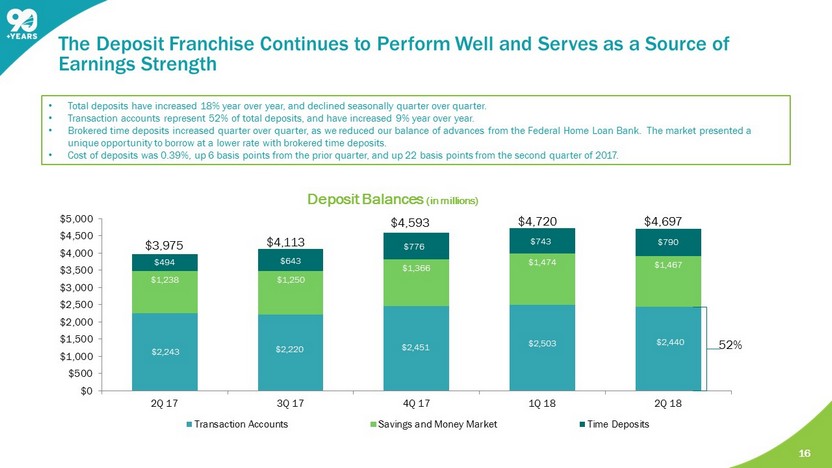
16 • Total deposits have increased 18% year over year, and declined seasonally quarter over quarter. • Transaction accounts represent 52% of total deposits, and have increased 9 % year over year. • Brokered time deposits increased quarter over quarter, as we reduced our balance of advances from the Federal Home Loan Bank. T he market presented a unique opportunity to borrow at a lower rate with brokered time deposits. • Cost of deposits was 0.39%, up 6 basis points from the prior quarter, and up 22 basis points from the second quarter of 2017. $2,243 $2,220 $2,451 $2,503 $2,440 $1,238 $1,250 $1,366 $1,474 $1,467 $494 $643 $776 $743 $790 $0 $500 $1,000 $1,500 $2,000 $2,500 $3,000 $3,500 $4,000 $4,500 $5,000 2Q 17 3Q 17 4Q 17 1Q 18 2Q 18 Transaction Accounts Savings and Money Market Time Deposits Deposit Balances (in millions) $4,697 $3,975 $4,113 $4,593 52% $4,720 The Deposit Franchise Continues to Perform Well and Serves as a Source of Earnings Strength
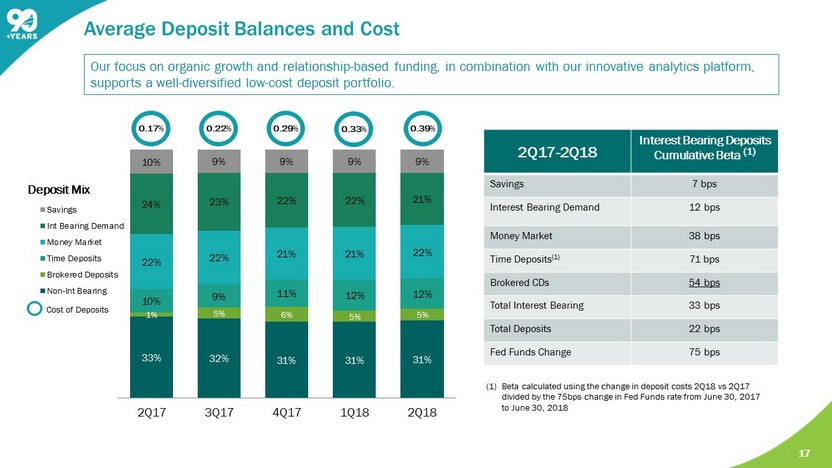
17 (1) Beta calculated using the change in deposit costs 2Q18 vs 2Q17 divided by the 75bps change in Fed Funds rate from June 30, 2017 to June 30, 2018 Average Deposit Balances and Cost Our focus on organic growth and relationship - based funding, in combination with our innovative analytics platform, supports a well - diversified low - cost deposit portfolio. 33% 32% 31% 31% 31% 1% 5% 6% 5% 5% 10% 9% 11% 12% 12% 22% 22% 21% 21% 22% 24% 23% 22% 22% 21% 10% 9% 9% 9% 9% 2Q17 3Q17 4Q17 1Q18 2Q18 Savings Int Bearing Demand Money Market Time Deposits Brokered Deposits Non-Int Bearing Cost of Deposits Deposit Mix 0.39 % 2Q17 - 2Q18 Interest Bearing Deposits Cumulative Beta (1) Savings 7 bps Interest Bearing Demand 12 bps Money Market 38 bps Time Deposits (1) 71 bps Brokered CDs 54 bps Total Interest Bearing 33 bps Total Deposits 22 bps Fed Funds Change 75 bps 0.33 % 0.29 % 0.22 % 0.17 %
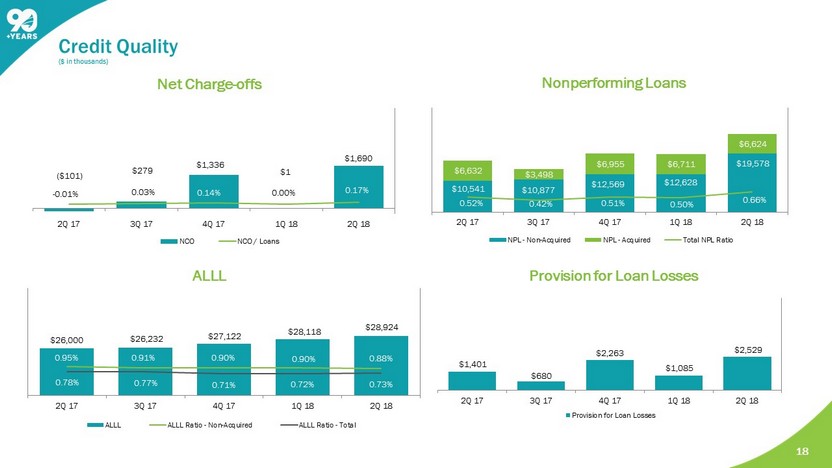
18 Net Charge - offs Nonperforming Loans ALLL $26,000 $26,232 $27,122 $28,118 $28,924 0.95% 0.91% 0.90% 0.90% 0.88% 0.78% 0.77% 0.71% 0.72% 0.73% 2Q 17 3Q 17 4Q 17 1Q 18 2Q 18 ALLL ALLL Ratio - Non-Acquired ALLL Ratio - Total Provision for Loan Losses $279 ($101) $1,336 $1 $1,690 - 0.01% 0.03% 0.14% 0.00% 0.17% 2Q 17 3Q 17 4Q 17 1Q 18 2Q 18 NCO NCO / Loans $10,541 $10,877 $12,569 $12,628 $19,578 $6,632 $3,498 $6,955 $6,711 $6,624 0.52% 0.42% 0.51% 0.50% 0.66% 2Q 17 3Q 17 4Q 17 1Q 18 2Q 18 NPL - Non-Acquired NPL - Acquired Total NPL Ratio Credit Quality ($ in thousands) $1,401 $680 $2,263 $1,085 $2,529 2Q 17 3Q 17 4Q 17 1Q 18 2Q 18 Provision for Loan Losses
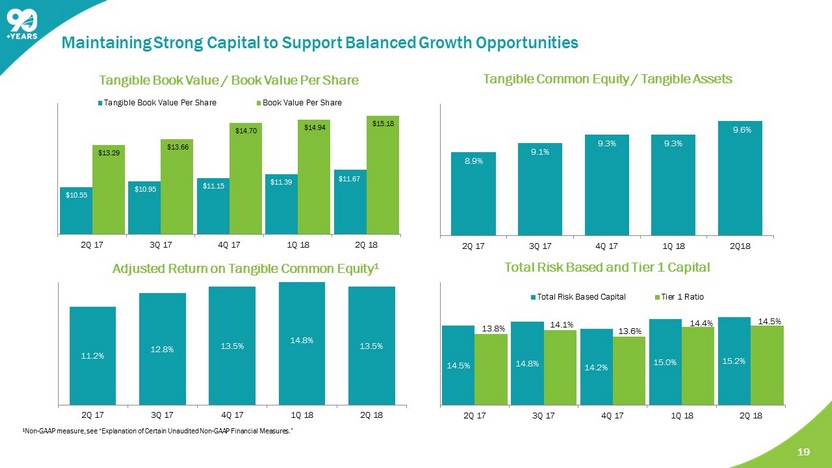
Maintaining Strong Capital to Support Balanced Growth Opportunities 19 Tangible Book Value / Book Value Per Share $10.55 $10.95 $11.15 $11.39 $11.67 $13.29 $13.66 $14.70 $14.94 $15.18 2Q 17 3Q 17 4Q 17 1Q 18 2Q 18 Tangible Book Value Per Share Book Value Per Share 11.2% 12.8% 13.5% 14.8% 13.5% 2Q 17 3Q 17 4Q 17 1Q 18 2Q 18 Adjusted Return on Tangible Common Equity 1 14.5% 14.8% 14.2% 15.0% 15.2% 13.8% 14.1% 13.6% 14.4% 14.5% 2Q 17 3Q 17 4Q 17 1Q 18 2Q 18 Total Risk Based Capital Tier 1 Ratio Total Risk Based and Tier 1 Capital Tangible Common Equity / Tangible Assets 8.9% 9.1% 9.3% 9.3% 9.6% 2Q 17 3Q 17 4Q 17 1Q 18 2Q18 1 Non - GAAP measure, see “Explanation of Certain Unaudited Non - GAAP Financial Measures.”
Agenda 20 ABOUT SEACOAST BANK 1 COMPANY PERFORMANCE 2 SEACOAST’S DIFFERENTIATED STRATEGY 3 OUTLOOK 4
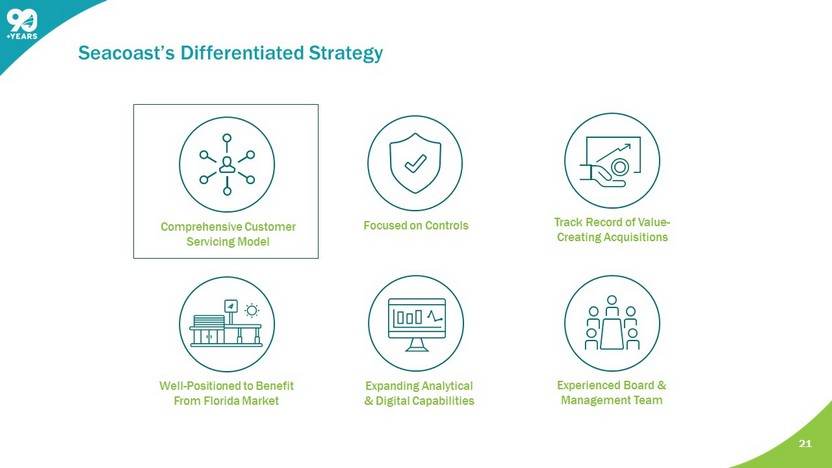
21 Experienced Board & Management Team Comprehensive Customer Servicing Model Track Record of Value - Creating Acquisitions Expanding Analytical & Digital Capabilities Well - Positioned to Benefit From Florida Market Focused on Controls Seacoast’s Differentiated Strategy
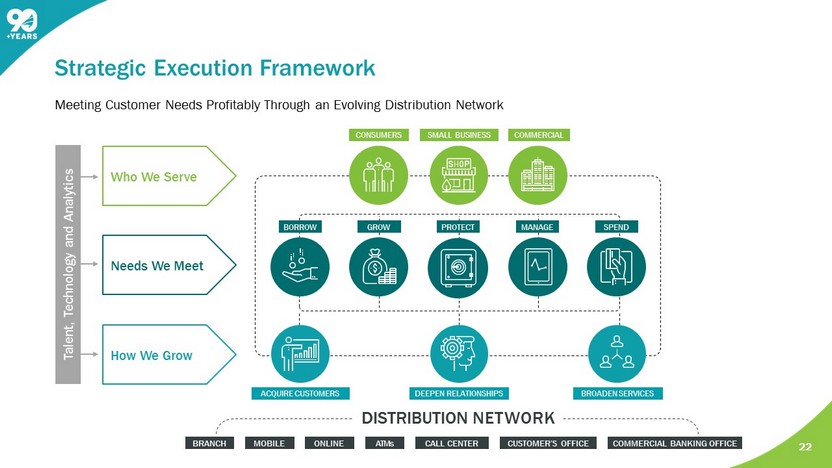
DISTRIBUTION NETWORK 22 Meeting Customer Needs Profitably Through an Evolving Distribution Network Strategic Execution Framework BRANCH COMMERCIAL BANKING OFFICE MOBILE ONLINE ATMs CALL CENTER CUSTOMER’S OFFICE Talent, Technology and Analytics ACQUIRE CUSTOMERS DEEPEN RELATIONSHIPS BROADEN SERVICES Who We Serve Needs We Meet How We Grow COMMERCIAL SMALL BUSINESS CONSUMERS BORROW GROW PROTECT MANAGE SPEND
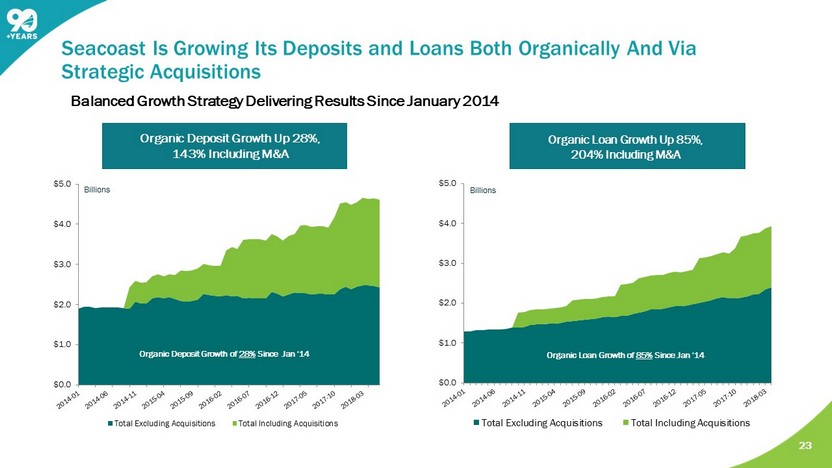
23 $0.0 $1.0 $2.0 $3.0 $4.0 $5.0 Total Excluding Acquisitions Total Including Acquisitions $0.0 $1.0 $2.0 $3.0 $4.0 $5.0 Total Excluding Acquisitions Total Including Acquisitions Organic Deposit Growth Up 28%, 143% Including M&A Organic Loan Growth Up 85%, 204% Including M&A Balanced Growth Strategy Delivering Results Since January 2014 Billions Seacoast Is Growing Its Deposits and Loans Both Organically And Via Strategic Acquisitions Organic Loan Growth of 85% Since Jan ‘14 Organic Deposit Growth of 28% Since Jan ‘14 Billions
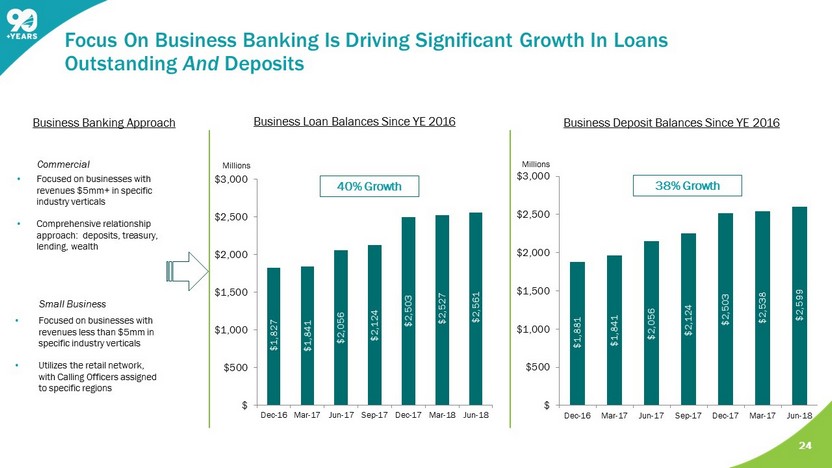
24 $1,827 $1,841 $2,056 $2,124 $2,503 $2,527 $2,561 $ $500 $1,000 $1,500 $2,000 $2,500 $3,000 Dec-16 Mar-17 Jun-17 Sep-17 Dec-17 Mar-18 Jun-18 $1,881 $1,841 $2,056 $2,124 $2,503 $2,538 $2,599 $ $500 $1,000 $1,500 $2,000 $2,500 $3,000 Dec-16 Mar-17 Jun-17 Sep-17 Dec-17 Mar-17 Jun-18 Focus On Business Banking Is Driving Significant Growth In Loans Outstanding And Deposits • Focused on businesses with revenues $5mm+ in specific industry verticals • Comprehensive relationship approach: deposits, treasury, lending, wealth Investor Presentation • Focused on businesses with revenues less than $5mm in specific industry verticals • Utilizes the retail network, with Calling Officers assigned to specific regions Business Loan Balances S ince YE 2016 M illions 40% Growth Business Deposit Balances S ince YE 2016 M illions 38% Growth Commercial Small Business Business Banking Approach
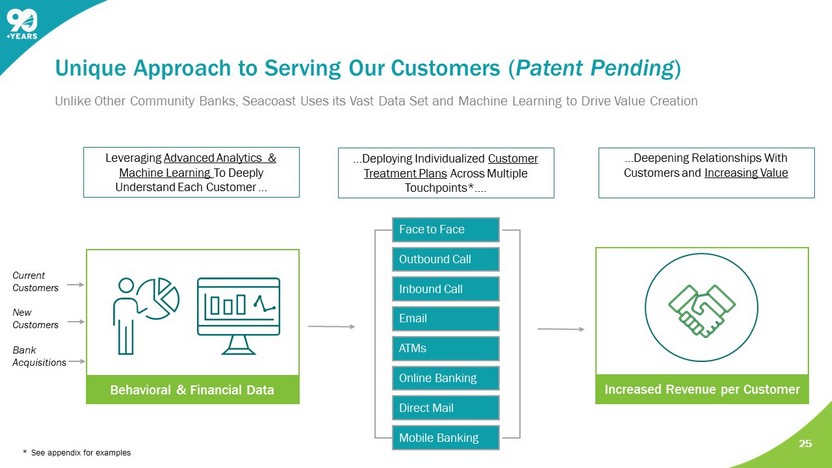
Unlike Other Community Banks, Seacoast Uses its Vast Data Set and Machine Learning to Drive Value Creation Face to Face Outbound Call Inbound Call Email ATMs Online Banking Direct Mail Mobile Banking 25 Unique Approach to Serving Our Customers ( Patent Pending ) Behavioral & Financial Data Leveraging Advanced Analytics & Machine Learning To Deeply Understand Each Customer … …Deploying Individualized Customer Treatment Plans Across Multiple Touchpoints*…. …Deepening Relationships With Customers and Increasing Value Increased Revenue per Customer * See appendix for examples Current Customers New Customers Bank Acquisitions
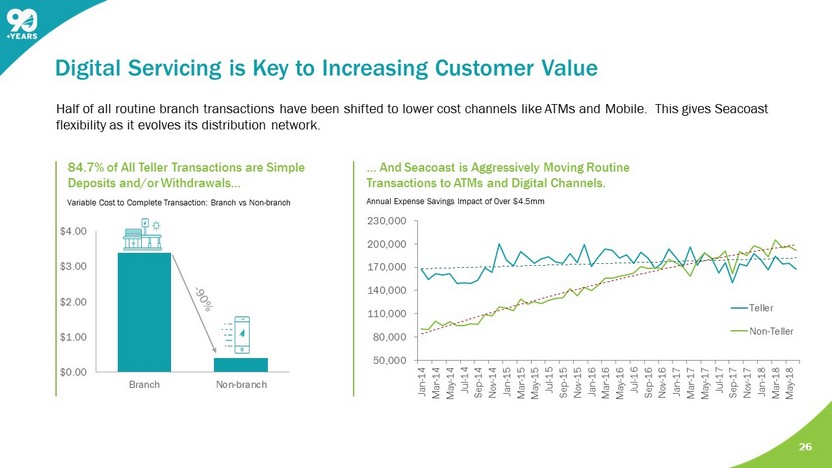
26 Half of all routine branch transactions have been shifted to lower cost channels like ATMs and Mobile. This gives Seacoast flexibility as it evolves its distribution network. Digital Servicing is Key to Increasing Customer Value … And Seacoast is Aggressively Moving Routine Transactions to ATMs and Digital Channels. Annual Expense Savings Impact of Over $4.5mm 84.7% of All Teller Transactions are Simple Deposits and/or Withdrawals… 50,000 80,000 110,000 140,000 170,000 200,000 230,000 Jan-14 Mar-14 May-14 Jul-14 Sep-14 Nov-14 Jan-15 Mar-15 May-15 Jul-15 Sep-15 Nov-15 Jan-16 Mar-16 May-16 Jul-16 Sep-16 Nov-16 Jan-17 Mar-17 May-17 Jul-17 Sep-17 Nov-17 Jan-18 Mar-18 May-18 Teller Non-Teller $0.00 $1.00 $2.00 $3.00 $4.00 Branch Non-branch Variable Cost to Complete Transaction: Branch vs Non - branch
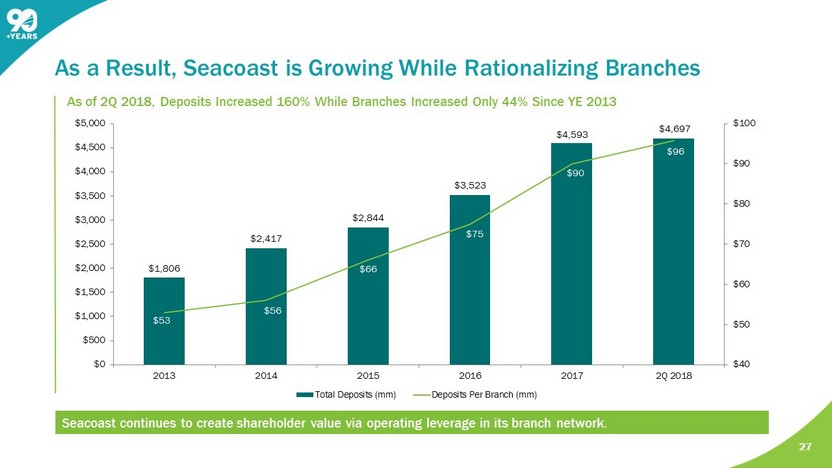
As a Result, Seacoast is Growing While Rationalizing Branches Seacoast continues to create shareholder value via operating leverage in its branch network. As of 2Q 2018, Deposits Increased 160% While Branches Increased Only 4 4% S ince YE 2013 27 $1,806 $2,417 $2,844 $3,523 $ 4,593 $4,697 $53 $56 $66 $75 $90 $96 $40 $50 $60 $70 $80 $90 $100 $0 $500 $1,000 $1,500 $2,000 $2,500 $3,000 $3,500 $4,000 $4,500 $5,000 2013 2014 2015 2016 2017 2Q 2018 Total Deposits (mm) Deposits Per Branch (mm)
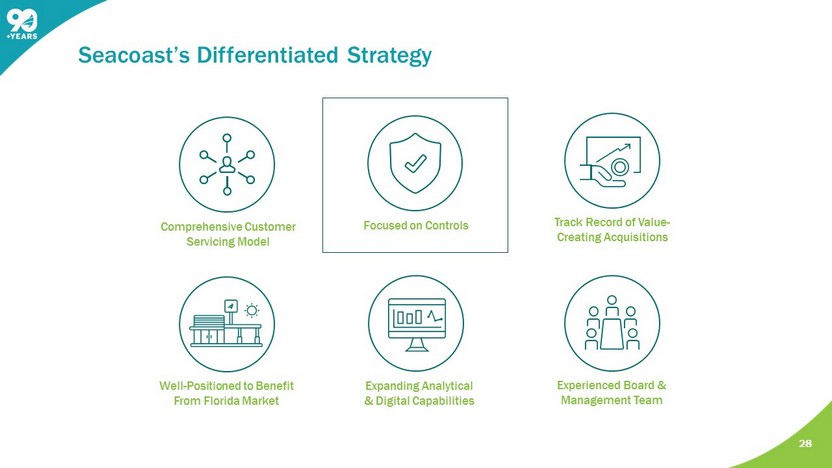
28 Experienced Board & Management Team Comprehensive Customer Servicing Model Track Record of Value - Creating Acquisitions Expanding Analytical & Digital Capabilities Well - Positioned to Benefit From Florida Market Focused on Controls Seacoast’s Differentiated Strategy
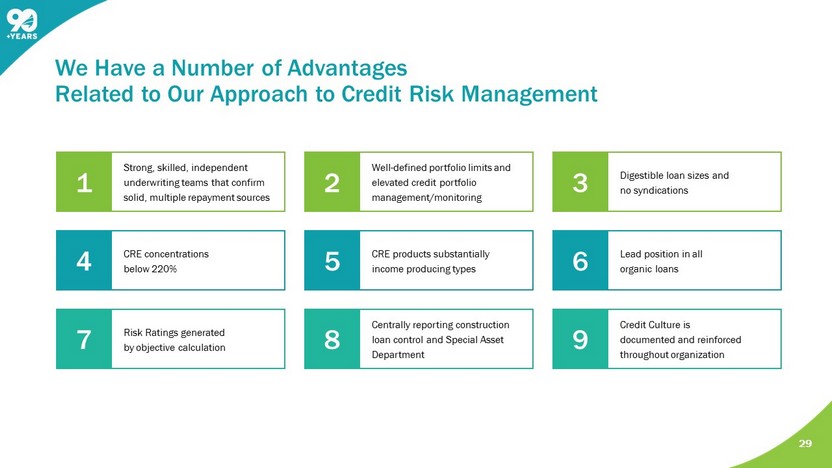
29 We Have a Number of Advantages Related to Our Approach to Credit Risk Management 1 Strong, skilled, independent underwriting teams that confirm solid, multiple repayment sources 2 Well - defined portfolio limits and elevated credit portfolio management/monitoring 3 Digestible loan sizes and no syndications 4 CRE concentrations below 220% 5 CRE products substantially income producing types 6 Lead position in all organic loans 7 Risk Ratings generated by objective calculation 8 Centrally reporting construction loan control and Special Asset Department 9 Credit Culture is documented and reinforced throughout organization
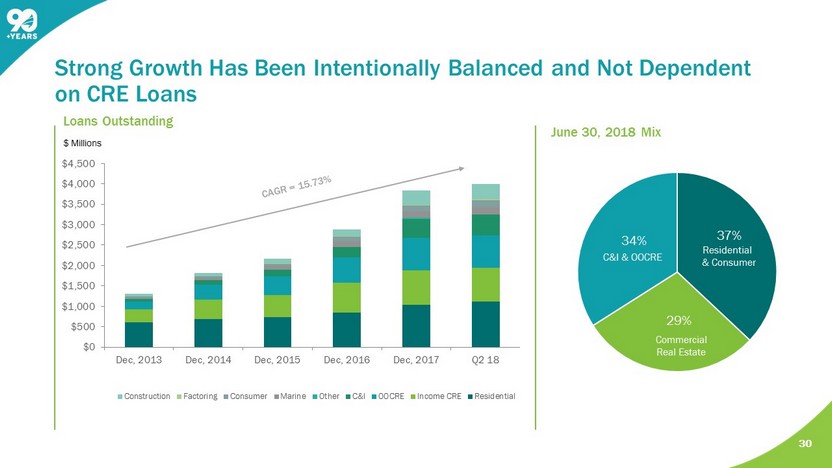
$0 $500 $1,000 $1,500 $2,000 $2,500 $3,000 $3,500 $4,000 $4,500 Dec, 2013 Dec, 2014 Dec, 2015 Dec, 2016 Dec, 2017 Q2 18 Construction Factoring Consumer Marine Other C&I OOCRE Income CRE Residential 30 Strong Growth Has Been Intentionally Balanced and Not Dependent on CRE Loans Loans Outstanding $ Millions June 30, 2018 Mix 37% 29% 34% Residential & Consumer C&I & OOCRE Commercial Real Estate
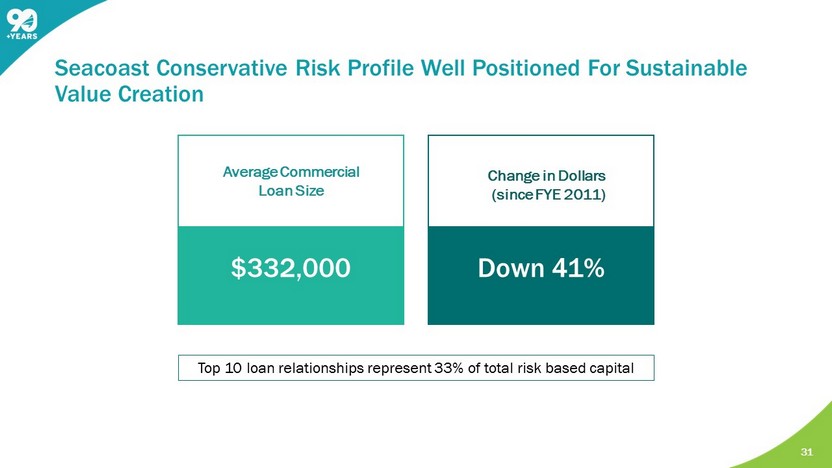
31 Investor Presentation Top 10 loan relationships represent 33% of total risk based capital Seacoast Conservative Risk Profile Well Positioned For Sustainable Value Creation $332,000 Down 41% Average Commercial Loan Size Change in Dollars (since FYE 2011)
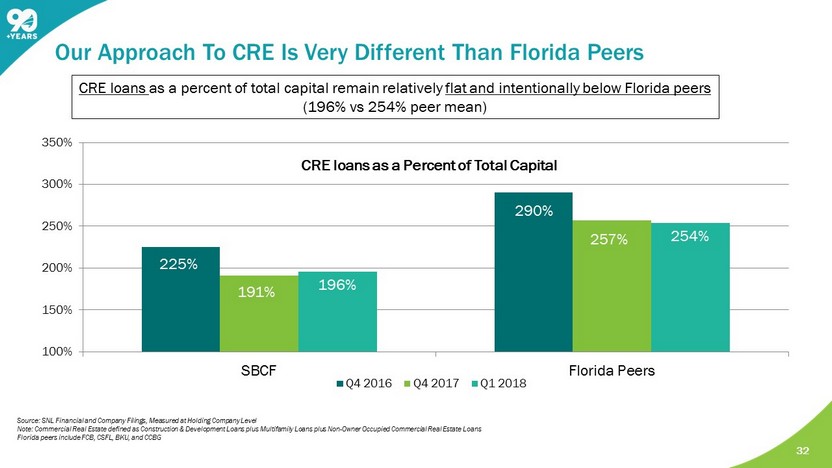
32 Investor Presentation CRE loans as a percent of total capital remain relatively flat and intentionally below Florida peers (196% vs 254% peer mean) 225% 290% 191% 257% 196% 254% 100% 150% 200% 250% 300% 350% SBCF Florida Peers Q4 2016 Q4 2017 Q1 2018 CRE loans as a Percent of T otal C apital Source : SNL Financial and Company Filings, Measured at Holding Company Level Note: Commercial Real Estate defined as Construction & Development Loans plus Multifamily Loans plus Non - Owner Occupied Commercial Real Estate Loans Florida peers include FCB, CSFL, BKU, and CCBG Our Approach To CRE Is Very Different Than Florida Peers
33 Experienced Board & Management Team Comprehensive Customer Servicing Model Track Record of Value - Creating Acquisitions Expanding Analytical & Digital Capabilities Well - Positioned to Benefit From Florida Market Focused on Controls Seacoast’s Differentiated Strategy
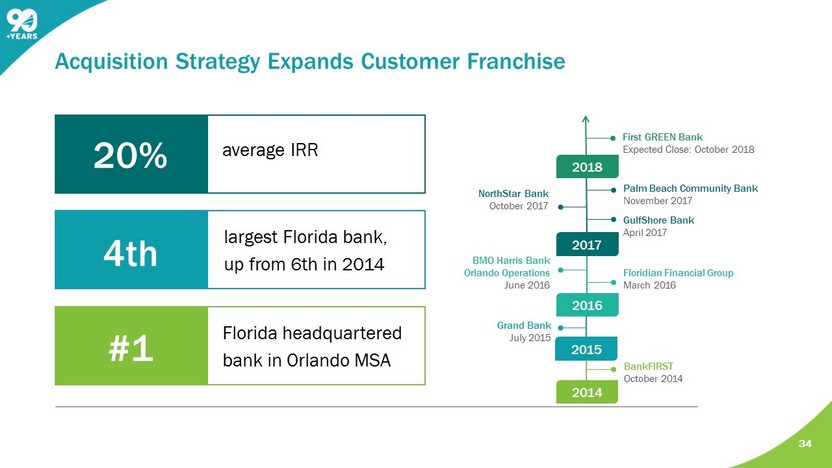
34 Acquisition Strategy Expands Customer Franchise GulfShore Bank April 2017 BMO Harris Bank Orlando Operations June 2016 Floridian Financial Group March 2016 Grand Bank July 2015 BankFIRST October 2014 2014 2015 2016 2017 20% a verage IRR 4th largest Florida bank, up from 6th in 2014 #1 Florida headquartered bank in Orlando MSA NorthStar Bank October 2017 Palm Beach Community Bank November 2017 First GREEN Bank Expected Close: October 2018 2018
35 Experienced Board & Management Team Comprehensive Customer Servicing Model Track Record of Value - Creating Acquisitions Expanding Analytical & Digital Capabilities Well - Positioned to Benefit From Florida Market Focused on Controls Seacoast’s Differentiated Strategy
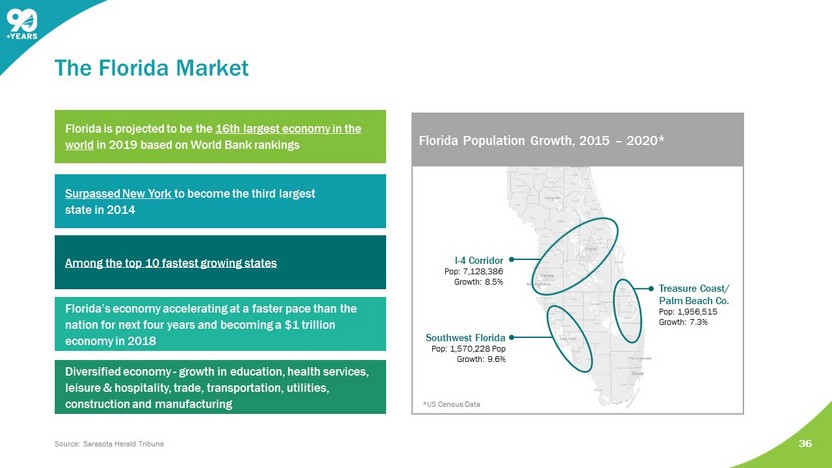
Southwest Florida Pop: 1,570,228 Pop Growth: 9.6% Treasure Coast/ Palm Beach Co. Pop: 1,956,515 Growth: 7.3% I - 4 Corridor Pop: 7,128,386 Growth: 8.5% *US Census Data Among the top 10 fastest growing states Surpassed New York to become the third largest state in 2014 Florida’s economy accelerating at a faster pace than the nation for next four years and becoming a $1 trillion economy in 2018 Florida is projected to be the 16th largest economy in the world in 2019 based on World Bank rankings Diversified economy - growth in education, health services, leisure & hospitality, trade, transportation, utilities, construction and manufacturing Florida Population Growth, 2015 – 2020* 36 The Florida Market Source: Sarasota Herald Tribune
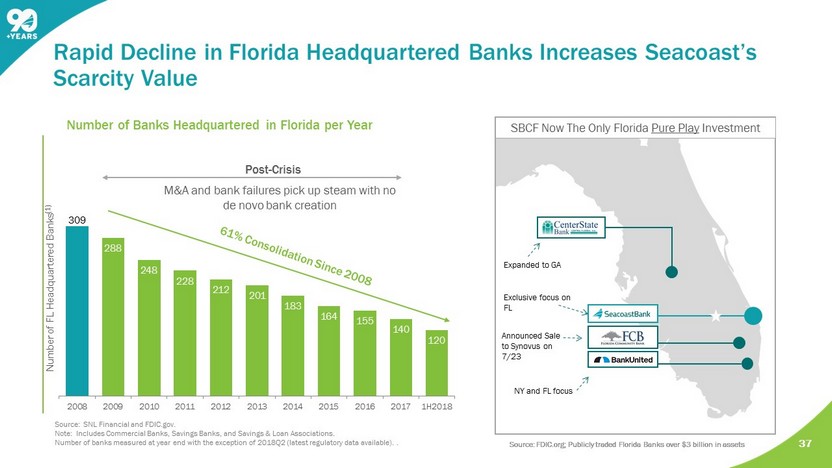
37 Number of Banks Headquartered in Florida per Year Rapid Decline in Florida Headquartered Banks Increases Seacoast’s Scarcity Value Source: SNL Financial and FDIC.gov. Note: Includes Commercial Banks, Savings Banks, and Savings & Loan Associations. Number of banks measured at year end with the exception of 2018Q2 (latest regulatory data available). . Source: FDIC.org; Publicly traded Florida Banks over $3 billion in assets 309 288 248 228 212 201 183 164 155 140 120 2008 2009 2010 2011 2012 2013 2014 2015 2016 2017 1H2018 Post - Crisis M&A and bank failures pick up steam with no de novo bank creation Number of FL Headquartered Banks (1) Source: FDIC.org; Publicly traded Florida Banks over $3 billion in assets Announced Sale to Synovus on 7/23 SBCF Now The Only Florida Pure Play Investment Expanded to GA NY and FL focus Exclusive focus on FL
38 Experienced Board & Management Team Comprehensive Customer Servicing Model Track Record of Value - Creating Acquisitions Expanding Analytical & Digital Capabilities Well - Positioned to Benefit From Florida Market Focused on Controls Seacoast’s Differentiated Strategy
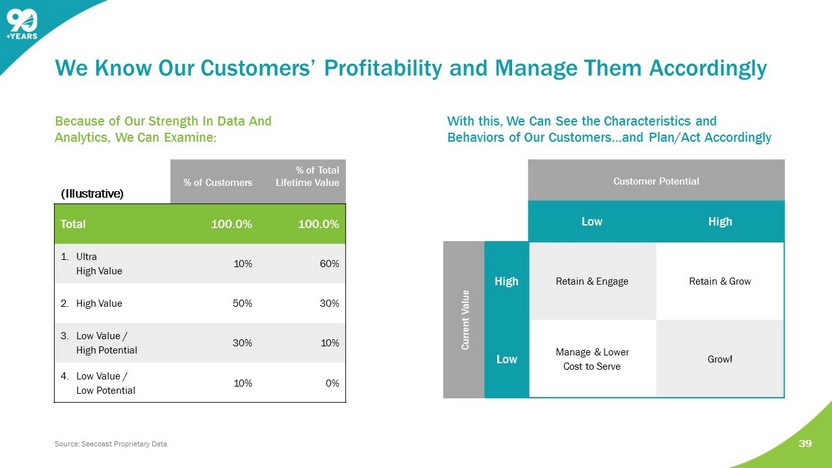
39 Because of Our Strength In Data And Analytics, We Can Examine: We Know Our Customers’ Profitability and Manage Them Accordingly Customer Potential Low High Current Value High Retain & Engage Retain & Grow Low Manage & Lower Cost to Serve Grow! With this, We Can See the Characteristics and Behaviors of Our Customers…and Plan/Act Accordingly (Illustrative) % of Customers % of Total Lifetime Value Total 100.0% 100.0% 1. Ultra High Value 10% 60% 2. High Value 50% 30% 3. Low Value / High Potential 30% 10% 4. Low Value / Low Potential 10% 0% Source: Seacoast Proprietary Data
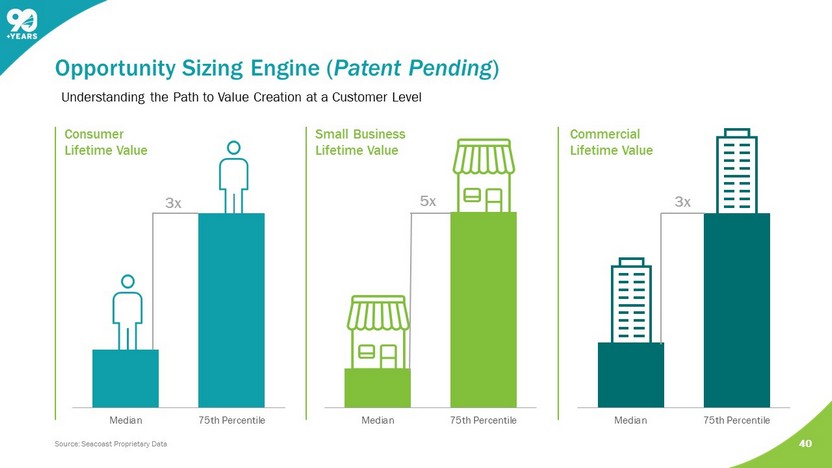
Median 75th Percentile 40 Opportunity Sizing Engine ( Patent Pending ) Consumer Lifetime Value Small Business Lifetime Value 3x Median 75th Percentile 5x Median 75th Percentile 3x Commercial Lifetime Value Source: Seacoast Proprietary Data Understanding the Path to Value Creation at a Customer Level
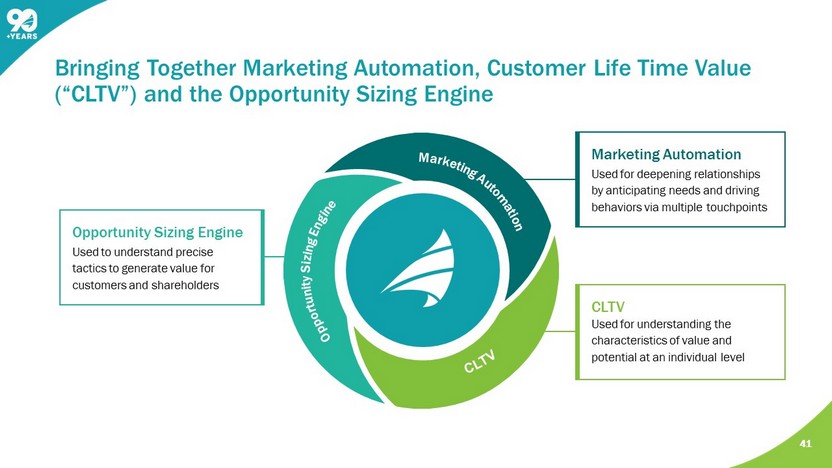
Opportunity Sizing Engine Used to understand precise tactics to generate value for customers and shareholders 41 Bringing Together Marketing Automation, Customer Life Time Value (“CLTV”) and the Opportunity Sizing Engine CLTV Used for understanding the characteristics of value and potential at an individual level Marketing Automation Used for deepening relationships by anticipating needs and driving behaviors via multiple touchpoints

42 Experienced Board & Management Team Comprehensive Customer Servicing Model Track Record of Value - Creating Acquisitions Expanding Analytical & Digital Capabilities Well - Positioned to Benefit From Florida Market Focused on Controls Seacoast’s Differentiated Strategy
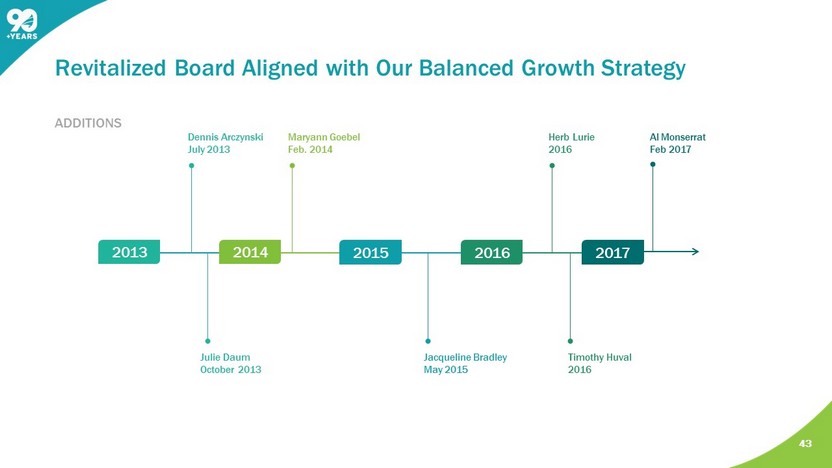
43 Revitalized Board Aligned with Our Balanced Growth Strategy ADDITIONS Herb Lurie 2016 Jacqueline Bradley May 2015 Maryann Goebel Feb. 2014 Julie Daum October 2013 Dennis Arczynski July 2013 Timothy Huval 2016 2013 2014 2015 2016 2017 Al Monserrat Feb 201 7
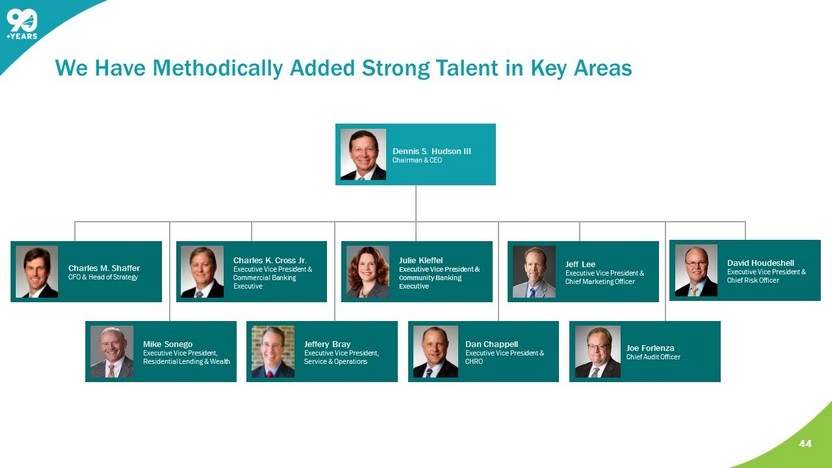
44 We Have Methodically Added Strong Talent in Key Areas Dennis S. Hudson III Chairman & CEO Charles M. Shaffer CFO & Head of Strategy Charles K. Cross Jr. Executive Vice President & Commercial Banking Executive Julie Kleffel Executive Vice President & Community Banking Executive Joe Forlenza Chief Audit Officer Mike Sonego Executive Vice President, Residential Lending & Wealth David Houdeshell Executive Vice President & Chief Risk Officer Jeff Lee Executive Vice President & Chief Marketing Officer Dan Chappell Executive Vice President & CHRO Jeffery Bray Executive Vice President, Service & Operations
Agenda 45 ABOUT SEACOAST BANK 1 COMPANY PERFORMANCE 2 SEACOAST’S DIFFERENTIATED STRATEGY 3 OUTLOOK 4
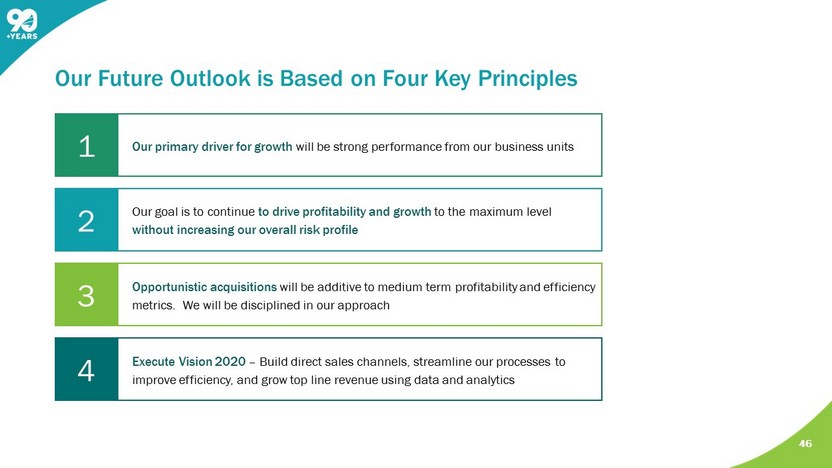
46 Our Future Outlook is Based on Four Key Principles 1 Our primary driver for growth will be strong performance from our business units 2 Our goal is to continue to drive profitability and growth to the maximum level without increasing our overall risk profile 3 Opportunistic acquisitions will be additive to medium term profitability and efficiency metrics. We will be disciplined in our approach 4 Execute Vision 2020 – Build direct sales channels, streamline our processes to improve efficiency, and grow top line revenue using data and analytics
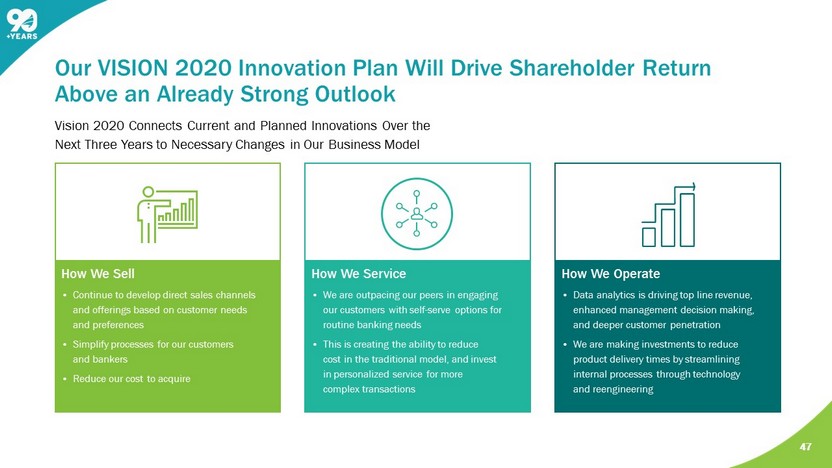
How We Sell • Continue to develop direct sales channels and offerings based on customer needs and preferences • Simplify processes for our customers and bankers • Reduce our cost to acquire How We Service • We are outpacing our peers in engaging our customers with self - serve options for routine banking needs • This is creating the ability to reduce cost in the traditional model, and invest in personalized service for more complex transactions How We Operate • Data analytics is driving top line revenue, enhanced management decision making, and deeper customer penetration • We are making investments to reduce product delivery times by streamlining internal processes through technology and reengineering Vision 2020 Connects Current and Planned Innovations Over the Next Three Years to Necessary Changes in Our Business Model 47 Our VISION 2020 Innovation Plan Will Drive Shareholder Return Above an Already Strong Outlook
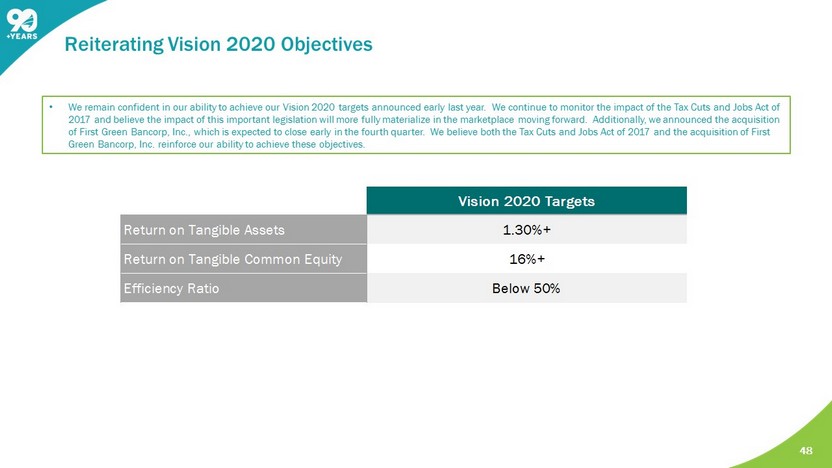
Reiterating Vision 2020 Objectives 48 • We remain confident in our ability to achieve our Vision 2020 targets announced early last year. We continue to monitor the imp act of the Tax Cuts and Jobs Act of 2017 and believe the impact of this important legislation will more fully materialize in the marketplace moving forward. Add iti onally, we announced the acquisition of First Green Bancorp, Inc., which is expected to close early in the fourth quarter. We believe both the Tax Cuts and Jobs Act of 2017 and the acquisition of First Green Bancorp, Inc. reinforce our ability to achieve these objectives. Vision 2020 Targets Return on Tangible Assets 1.30%+ Return on Tangible Common Equity 16%+ Efficiency Ratio Below 50%
Charles M. Shaffer Executive Vice President Chief Financial Officer (772) 221 - 7003 Chuck.Shaffer@seacoastbank.com INVESTOR RELATIONS www.SeacoastBanking.com NASDAQ: SBCF Contact Details: Seacoast Banking Corporation of Florida 49

This presentation contains financial information determined by methods other than Generally Accepted Accounting Principles (“GAAP”) . The financial highlights provide reconciliations between GAAP net income and adjusted net income, GAAP income and adjusted pretax, preprovision income . Management uses these non - GAAP financial measures in its analysis of the Company’s performance and believes these presentations provide useful supplemental information, and a clearer understanding of the Company’s performance . The Company believes the non - GAAP measures enhance investors’ understanding of the Company’s business and performance and if not provided would be requested by the investor community . These measures are also useful in understanding performance trends and facilitate comparisons with the performance of other financial institutions . The limitations associated with operating measures are the risk that persons might disagree as to the appropriateness of items comprising these measures and that different companies might calculate these measures differently . The Company provides reconciliations between GAAP and these non - GAAP measures . These disclosures should not be considered an alternative to GAAP . Explanation of Certain Unaudited Non - GAAP Financial Measures 51
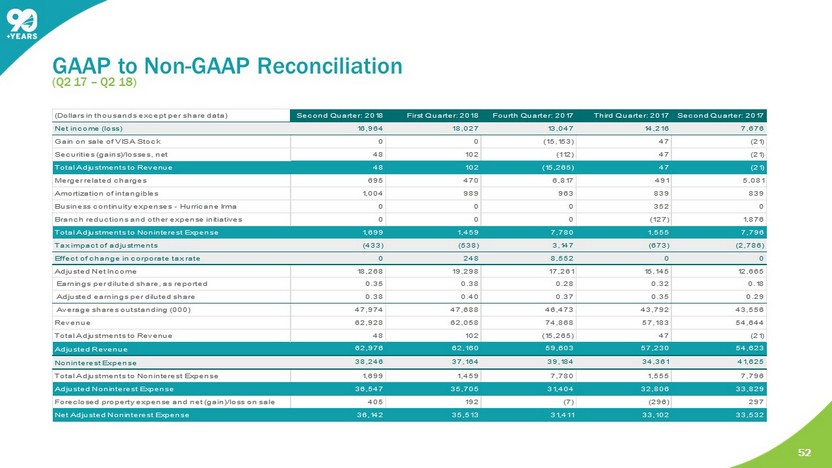
( Q2 17 – Q2 18) GAAP to Non - GAAP Reconciliation 52 (Dollars in thousands except per share data) Second Quarter: 2018 First Quarter: 2018 Fourth Quarter: 2017 Third Quarter: 2017Second Quarter: 2017 Net income (loss) 16,964 18,027 13,047 14,216 7,676 Gain on sale of VISA Stock 0 0 (15,153) 47 (21) Securities (gains)/losses, net 48 102 (112) 47 (21) Total Adjustments to Revenue 48 102 (15,265) 47 (21) Merger related charges 695 470 6,817 491 5,081 Amortization of intangibles 1,004 989 963 839 839 Business continuity expenses - Hurricane Irma 0 0 0 352 0 Branch reductions and other expense initiatives 0 0 0 (127) 1,876 Total Adjustments to Noninterest Expense 1,699 1,459 7,780 1,555 7,796 Tax impact of adjustments (433) (538) 3,147 (673) (2,786) Effect of change in corporate tax rate 0 248 8,552 0 0 Adjusted Net Income 18,268 19,298 17,261 15,145 12,665 Earnings per diluted share, as reported 0.35 0.38 0.28 0.32 0.18 Adjusted earnings per diluted share 0.38 0.40 0.37 0.35 0.29 Average shares outstanding (000) 47,974 47,688 46,473 43,792 43,556 Revenue 62,928 62,058 74,868 57,183 54,644 Total Adjustments to Revenue 48 102 (15,265) 47 (21) Adjusted Revenue 62,976 62,160 59,603 57,230 54,623 Noninterest Expense 38,246 37,164 39,184 34,361 41,625 Total Adjustments to Noninterest Expense 1,699 1,459 7,780 1,555 7,796 Adjusted Noninterest Expense 36,547 35,705 31,404 32,806 33,829 Foreclosed property expense and net (gain)/loss on sale 405 192 (7) (296) 297 Net Adjusted Noninterest Expense 36,142 35,513 31,411 33,102 33,532
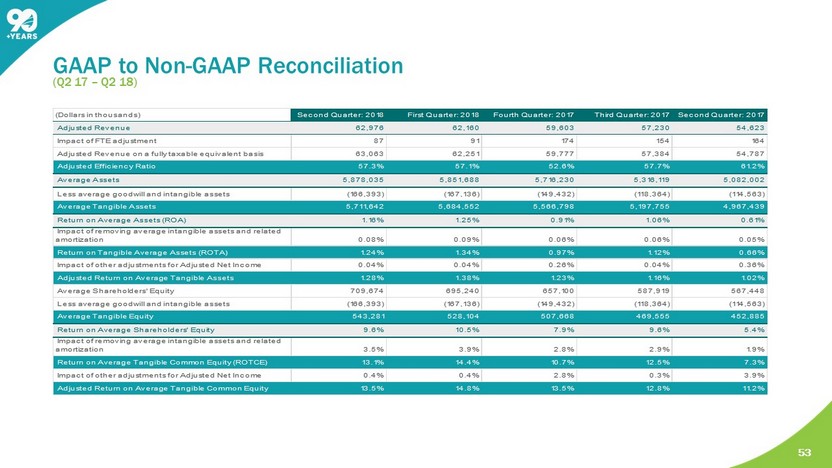
GAAP to Non - GAAP Reconciliation ( Q2 17 – Q2 18) 53 (Dollars in thousands) Second Quarter: 2018 First Quarter: 2018 Fourth Quarter: 2017 Third Quarter: 2017Second Quarter: 2017 Adjusted Revenue 62,976 62,160 59,603 57,230 54,623 Impact of FTE adjustment 87 91 174 154 164 Adjusted Revenue on a fully taxable equivalent basis 63,063 62,251 59,777 57,384 54,787 Adjusted Efficiency Ratio 57.3% 57.1% 52.6% 57.7% 61.2% Average Assets 5,878,035 5,851,688 5,716,230 5,316,119 5,082,002 Less average goodwill and intangible assets (166,393) (167,136) (149,432) (118,364) (114,563) Average Tangible Assets 5,711,642 5,684,552 5,566,798 5,197,755 4,967,439 Return on Average Assets (ROA) 1.16% 1.25% 0.91% 1.06% 0.61% Impact of removing average intangible assets and related amortization 0.08% 0.09% 0.06% 0.06% 0.05% Return on Tangible Average Assets (ROTA) 1.24% 1.34% 0.97% 1.12% 0.66% Impact of other adjustments for Adjusted Net Income 0.04% 0.04% 0.26% 0.04% 0.36% Adjusted Return on Average Tangible Assets 1.28% 1.38% 1.23% 1.16% 1.02% Average Shareholders' Equity 709,674 695,240 657,100 587,919 567,448 Less average goodwill and intangible assets (166,393) (167,136) (149,432) (118,364) (114,563) Average Tangible Equity 543,281 528,104 507,668 469,555 452,885 Return on Average Shareholders' Equity 9.6% 10.5% 7.9% 9.6% 5.4% Impact of removing average intangible assets and related amortization 3.5% 3.9% 2.8% 2.9% 1.9% Return on Average Tangible Common Equity (ROTCE) 13.1% 14.4% 10.7% 12.5% 7.3% Impact of other adjustments for Adjusted Net Income 0.4% 0.4% 2.8% 0.3% 3.9% Adjusted Return on Average Tangible Common Equity 13.5% 14.8% 13.5% 12.8% 11.2%
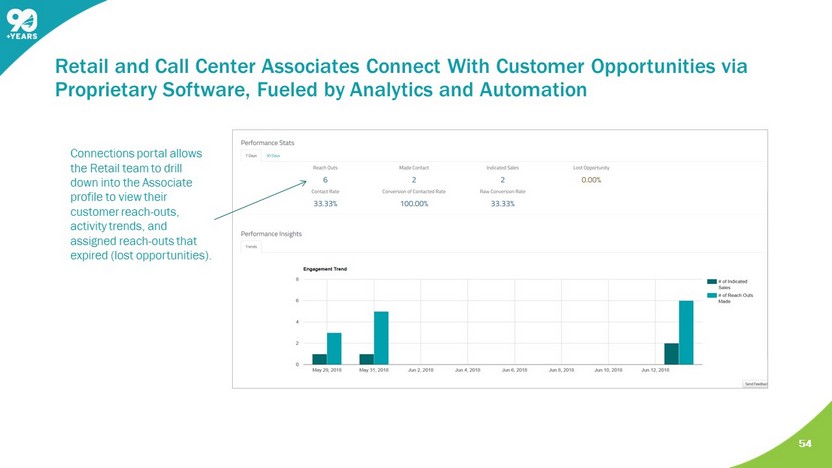
54 Retail and Call Center Associates Connect With Customer Opportunities via Proprietary Software, Fueled by Analytics and Automation Connections portal allows the Retail team to drill down into the Associate profile to view their customer reach - outs, activity trends, and assigned reach - outs that expired (lost opportunities).
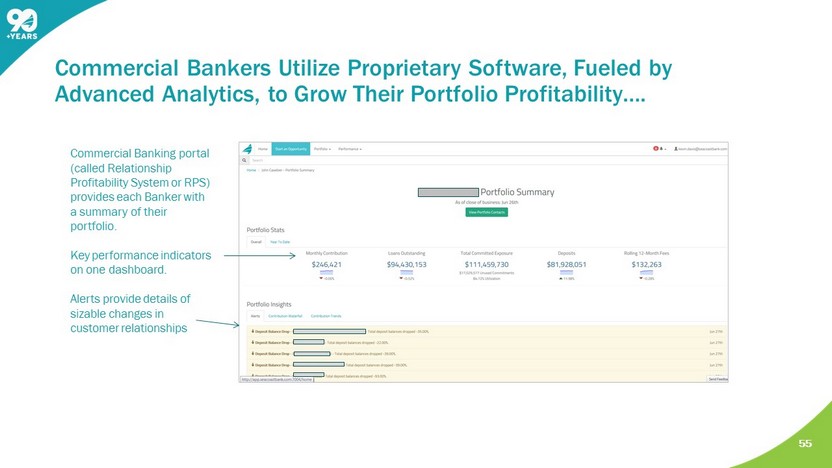
55 Commercial Bankers Utilize Proprietary Software, Fueled by Advanced Analytics, to Grow Their Portfolio Profitability…. Commercial Banking portal (called Relationship Profitability System or RPS) provides each Banker with a summary of their portfolio. K ey performance indicators on one dashboard. Alerts provide details of sizable changes in customer relationships
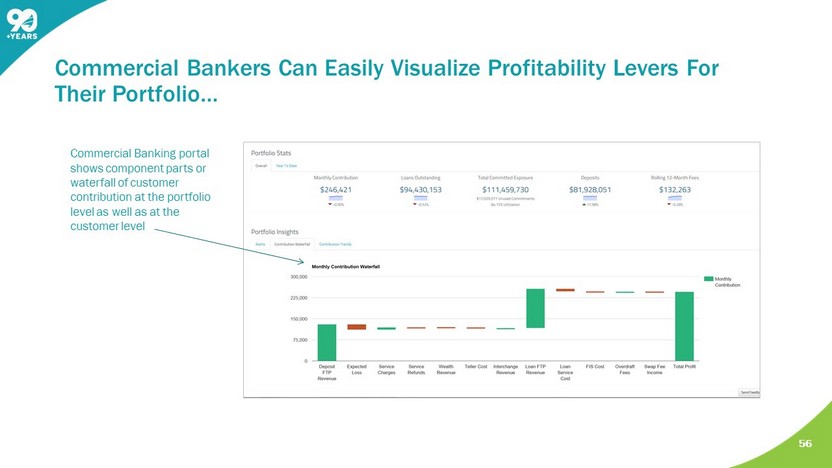
56 Commercial Bankers Can Easily Visualize Profitability Levers For Their Portfolio… Commercial Banking portal shows component parts or waterfall of customer contribution at the portfolio level as well as at the customer level
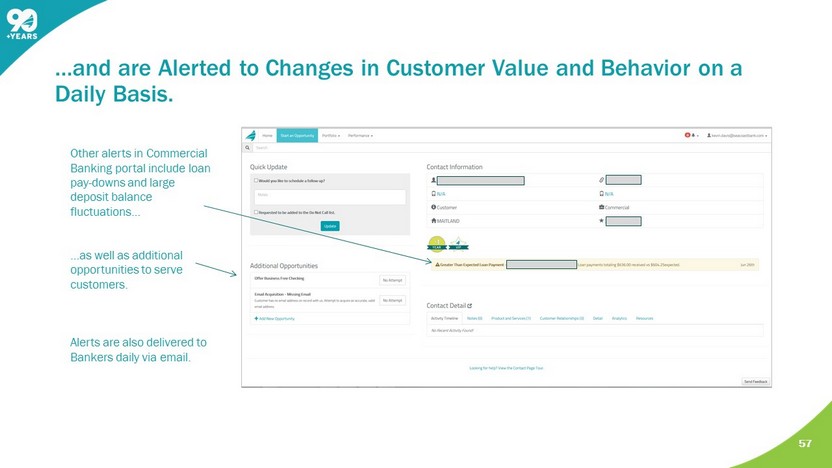
57 …and are Alerted to Changes in Customer V alue and Behavior on a Daily B asis. Other alerts in Commercial Banking portal include loan pay - downs and large deposit balance fluctuations… …as well as additional opportunities to serve customers. Alerts are also delivered to Bankers daily via email.