Attached files
| file | filename |
|---|---|
| EX-99.1 - EX-99.1 - MYRIAD GENETICS INC | mygn-ex991_6.htm |
| 8-K - 8-K-Q418 - EARNINGS RELEASE - MYRIAD GENETICS INC | mygn-8k_20180821.htm |

Myriad Genetics Fiscal Fourth-Quarter 2018 Earnings Call 08/21/2018 Exhibit 99.2
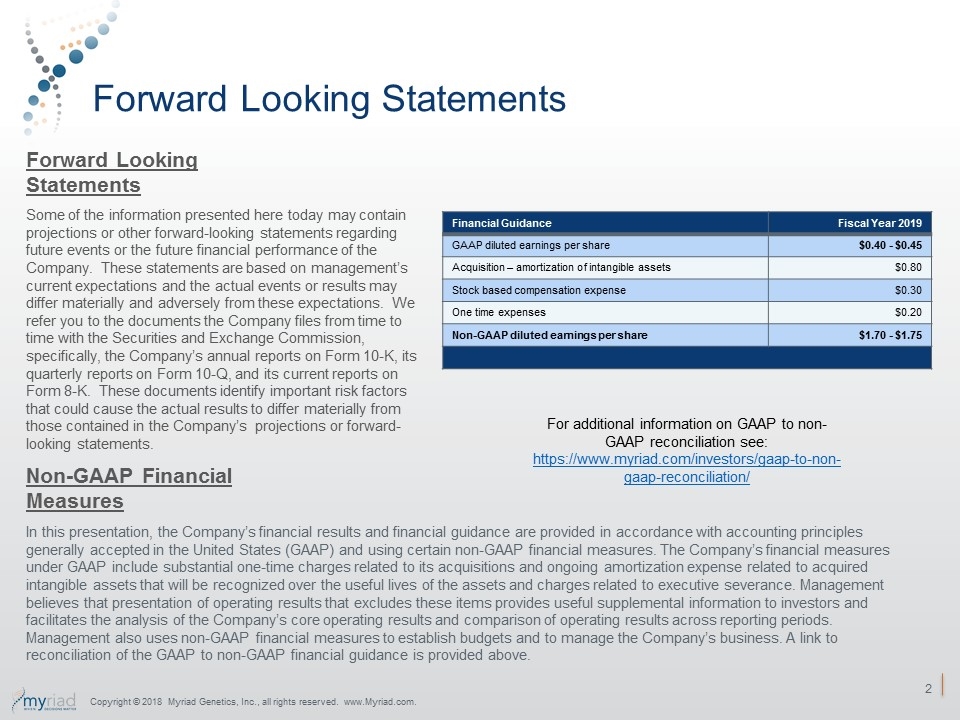
Forward Looking Statements Some of the information presented here today may contain projections or other forward-looking statements regarding future events or the future financial performance of the Company. These statements are based on management’s current expectations and the actual events or results may differ materially and adversely from these expectations. We refer you to the documents the Company files from time to time with the Securities and Exchange Commission, specifically, the Company’s annual reports on Form 10-K, its quarterly reports on Form 10-Q, and its current reports on Form 8-K. These documents identify important risk factors that could cause the actual results to differ materially from those contained in the Company’s projections or forward-looking statements. In this presentation, the Company’s financial results and financial guidance are provided in accordance with accounting principles generally accepted in the United States (GAAP) and using certain non-GAAP financial measures. The Company’s financial measures under GAAP include substantial one-time charges related to its acquisitions and ongoing amortization expense related to acquired intangible assets that will be recognized over the useful lives of the assets and charges related to executive severance. Management believes that presentation of operating results that excludes these items provides useful supplemental information to investors and facilitates the analysis of the Company’s core operating results and comparison of operating results across reporting periods. Management also uses non-GAAP financial measures to establish budgets and to manage the Company’s business. A link to reconciliation of the GAAP to non-GAAP financial guidance is provided above. Forward Looking Statements Non-GAAP Financial Measures Financial Guidance Fiscal Year 2019 GAAP diluted earnings per share $0.40 - $0.45 Acquisition – amortization of intangible assets $0.80 Stock based compensation expense $0.30 One time expenses $0.20 Non-GAAP diluted earnings per share $1.70 - $1.75 For additional information on GAAP to non-GAAP reconciliation see: https://www.myriad.com/investors/gaap-to-non-gaap-reconciliation/ Copyright © 2018 Myriad Genetics, Inc., all rights reserved. www.Myriad.com.
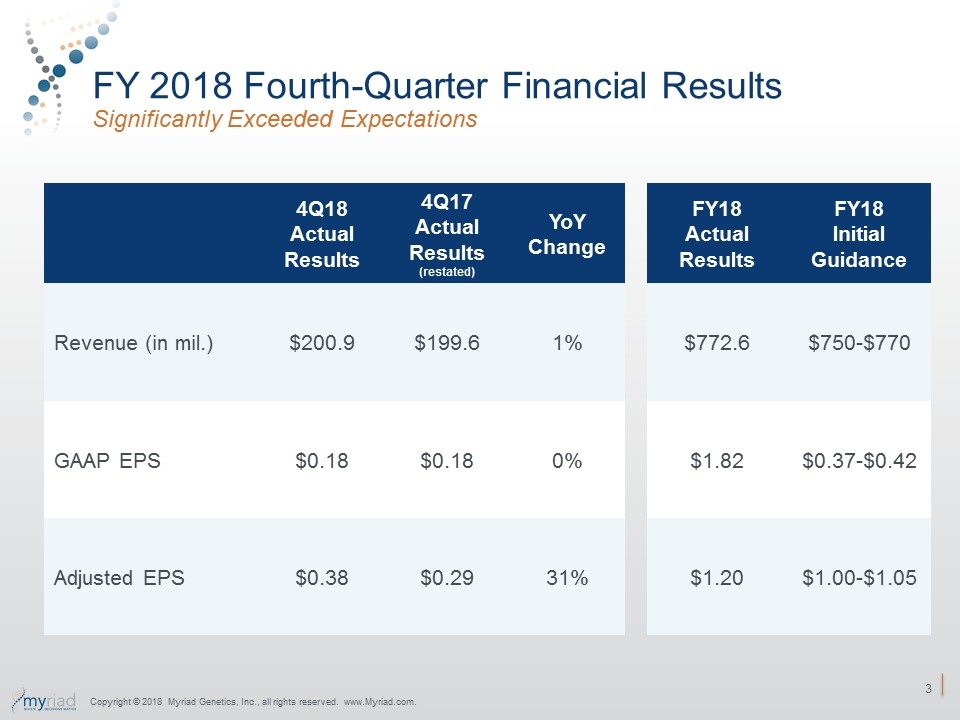
FY 2018 Fourth-Quarter Financial Results Significantly Exceeded Expectations 4Q18 Actual Results 4Q17 Actual Results (restated) YoY Change FY18 Actual Results FY18 Initial Guidance Revenue (in mil.) $200.9 $199.6 1% $772.6 $750-$770 GAAP EPS $0.18 $0.18 0% $1.82 $0.37-$0.42 Adjusted EPS $0.38 $0.29 31% $1.20 $1.00-$1.05 Copyright © 2018 Myriad Genetics, Inc., all rights reserved. www.Myriad.com.
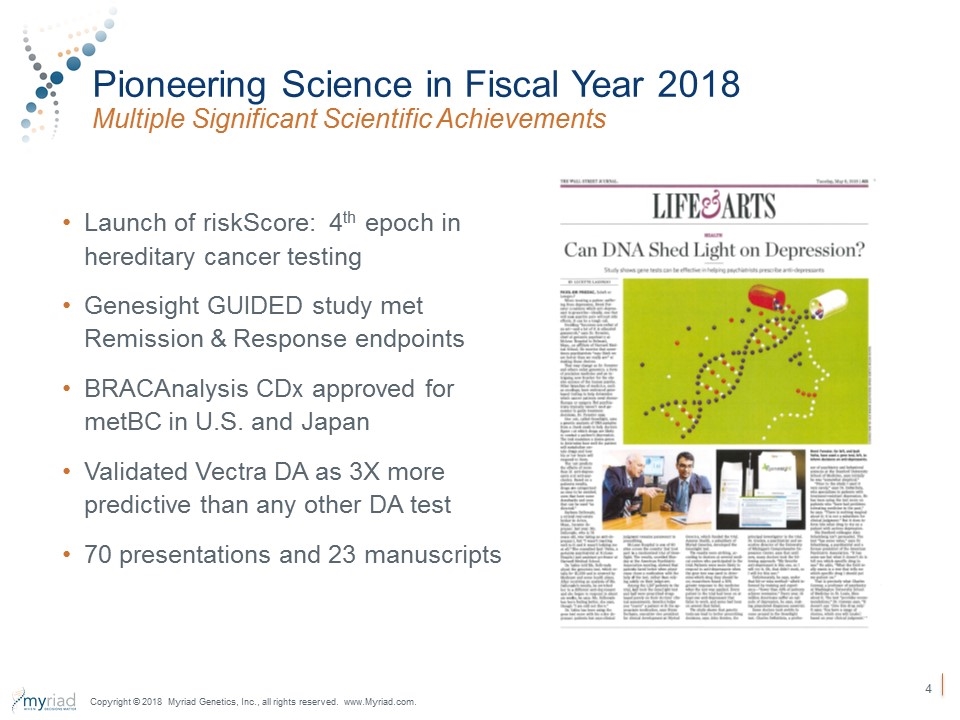
Pioneering Science in Fiscal Year 2018 Multiple Significant Scientific Achievements Copyright © 2018 Myriad Genetics, Inc., all rights reserved. www.Myriad.com. Launch of riskScore: 4th epoch in hereditary cancer testing Genesight GUIDED study met Remission & Response endpoints BRACAnalysis CDx approved for metBC in U.S. and Japan Validated Vectra DA as 3X more predictive than any other DA test 70 presentations and 23 manuscripts
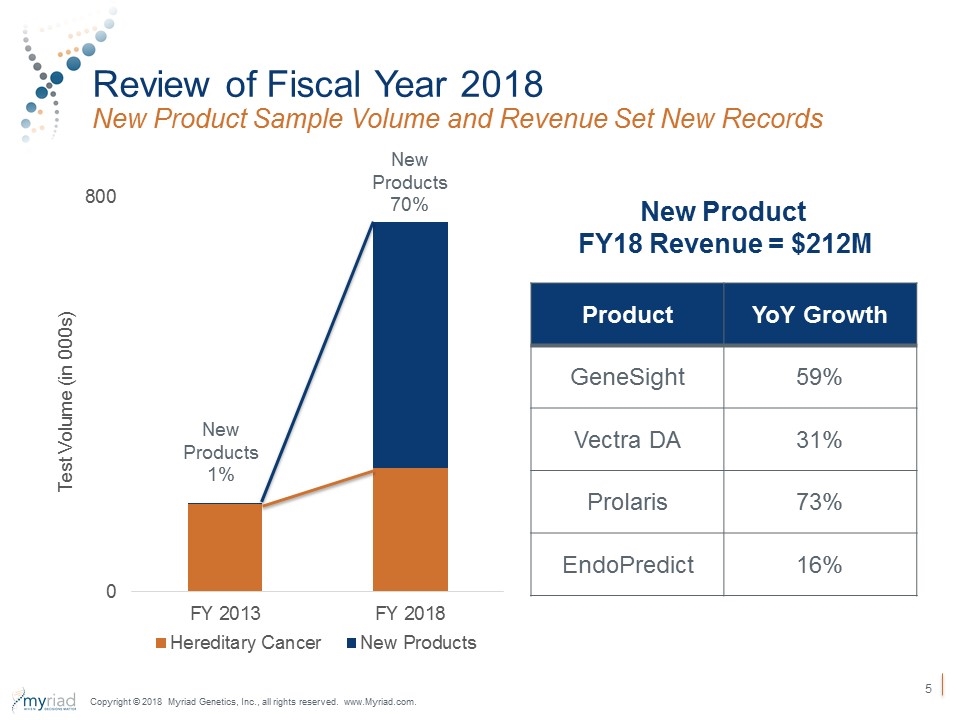
Review of Fiscal Year 2018 New Product Sample Volume and Revenue Set New Records Copyright © 2018 Myriad Genetics, Inc., all rights reserved. www.Myriad.com. New Product FY18 Revenue = $212M Product YoY Growth GeneSight 59% Vectra DA 31% Prolaris 73% EndoPredict 16% New Products 1% New Products 70%
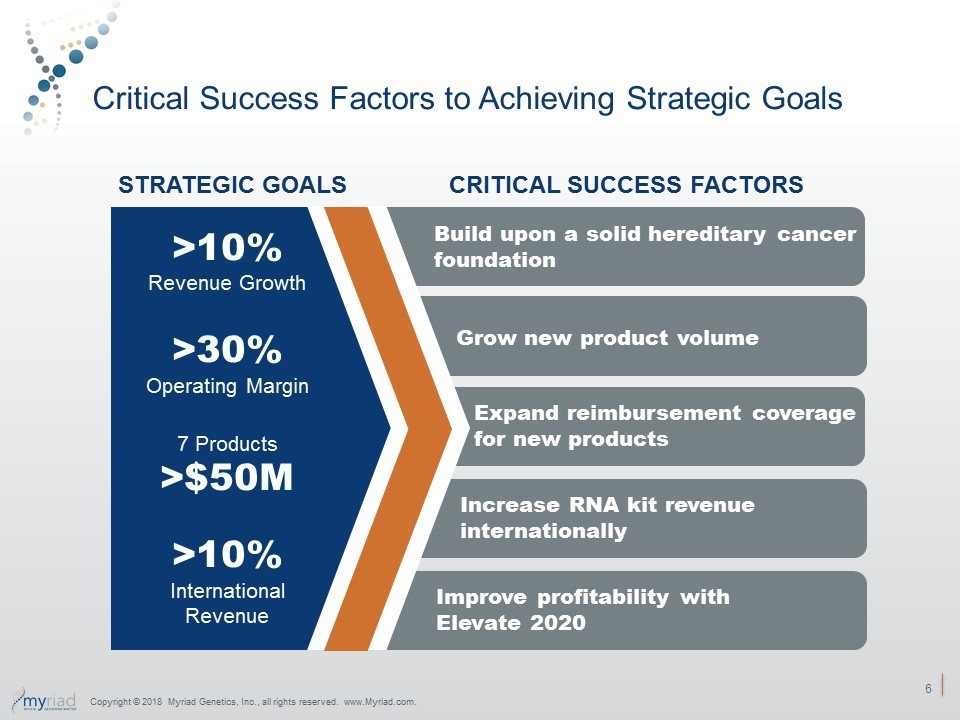
Critical Success Factors to Achieving Strategic Goals Grow new product volume STRATEGIC GOALS CRITICAL SUCCESS FACTORS >10% Revenue Growth >30% Operating Margin 7 Products >$50M >10% International Revenue Expand reimbursement coverage for new products Increase RNA kit revenue internationally Improve profitability with Elevate 2020 Copyright © 2018 Myriad Genetics, Inc., all rights reserved. www.Myriad.com. Build upon a solid hereditary cancer foundation
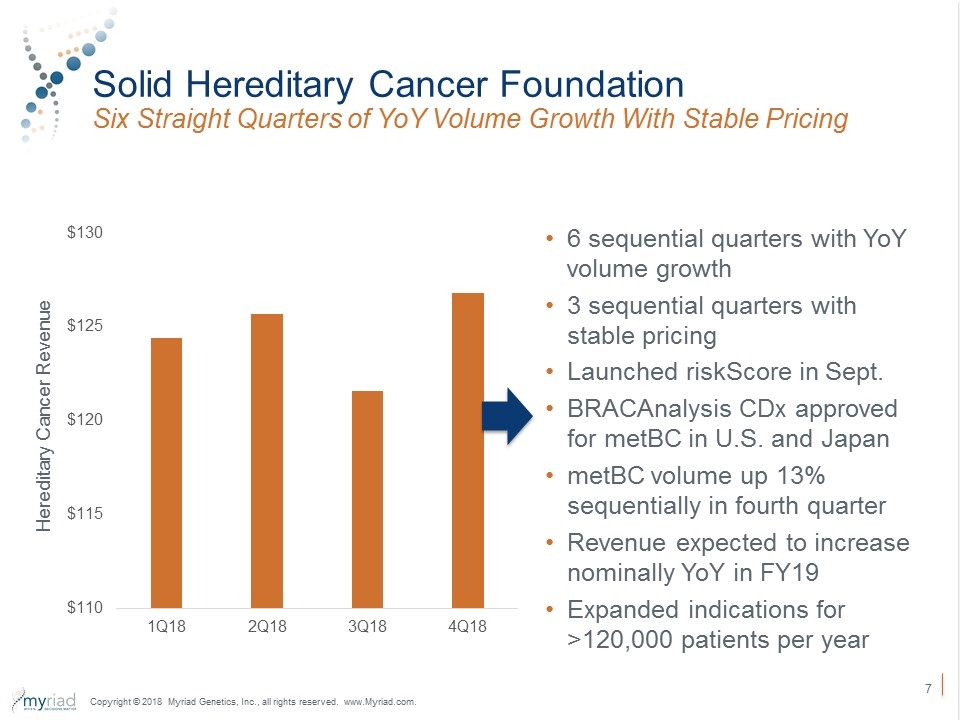
Solid Hereditary Cancer Foundation Six Straight Quarters of YoY Volume Growth With Stable Pricing Copyright © 2018 Myriad Genetics, Inc., all rights reserved. www.Myriad.com. Hereditary Cancer Revenue 6 sequential quarters with YoY volume growth 3 sequential quarters with stable pricing Launched riskScore in Sept. BRACAnalysis CDx approved for metBC in U.S. and Japan metBC volume up 13% sequentially in fourth quarter Revenue expected to increase nominally YoY in FY19 Expanded indications for >120,000 patients per year
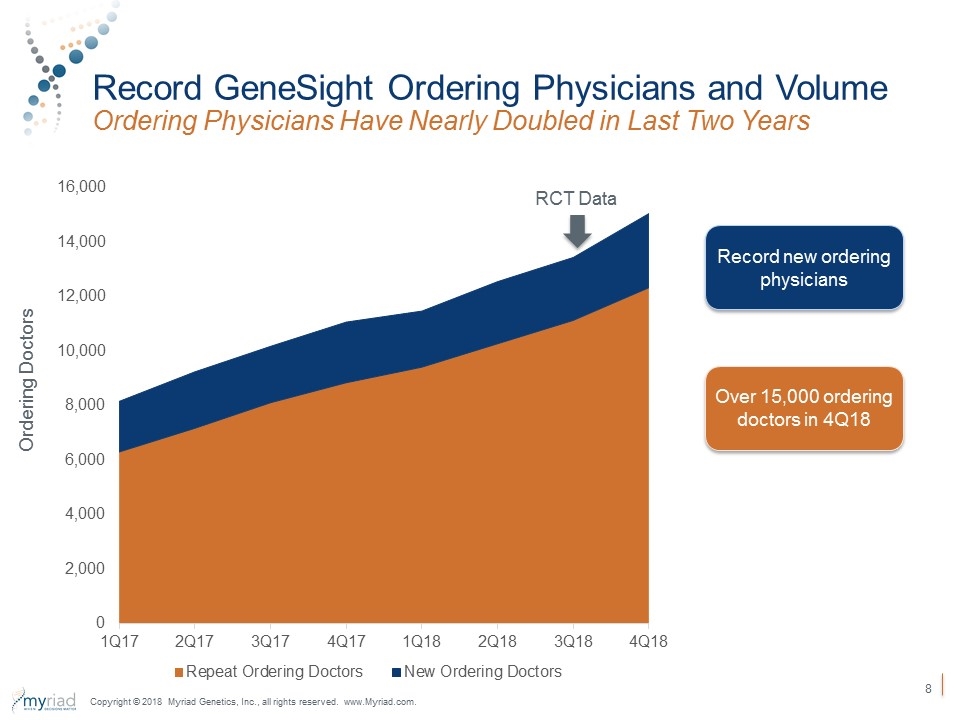
Record GeneSight Ordering Physicians and Volume Ordering Physicians Have Nearly Doubled in Last Two Years Copyright © 2018 Myriad Genetics, Inc., all rights reserved. www.Myriad.com. Ordering Doctors Over 15,000 ordering doctors in 4Q18 Record new ordering physicians RCT Data
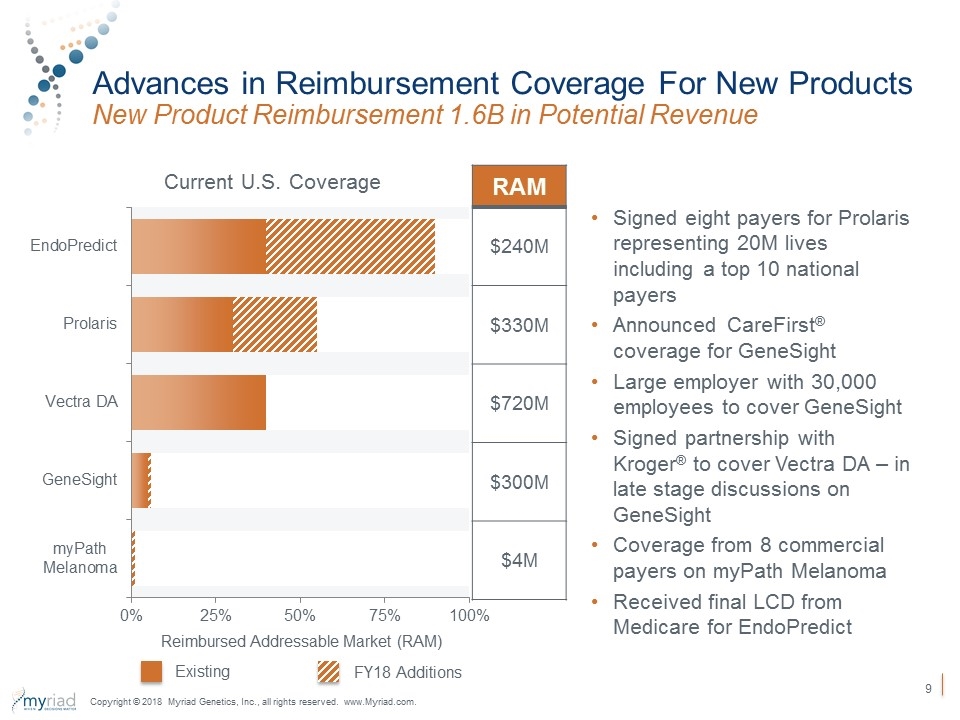
Advances in Reimbursement Coverage For New Products New Product Reimbursement 1.6B in Potential Revenue Current U.S. Coverage Signed eight payers for Prolaris representing 20M lives including a top 10 national payers Announced CareFirst® coverage for GeneSight Large employer with 30,000 employees to cover GeneSight Signed partnership with Kroger® to cover Vectra DA – in late stage discussions on GeneSight Coverage from 8 commercial payers on myPath Melanoma Received final LCD from Medicare for EndoPredict Copyright © 2018 Myriad Genetics, Inc., all rights reserved. www.Myriad.com. Reimbursed Addressable Market (RAM) Existing FY18 Additions RAM $240M $330M $720M $300M $4M
International Developments Kit-Based Strategy With Restructuring to Global LDT Laboratory Revised NICE draft guidance document on breast cancer prognostics recommends EndoPredict as one of three diagnostic tests Received pre market approval for BRACAnalysis CDx in Japan for HER2- metastatic breast cancer = 15,000 patients per year Selling German clinic and closing Munich laboratory Shift LDT testing to single U.S. based laboratory Continue with kit manufacturing and laboratory in Cologne Germany Copyright © 2018 Myriad Genetics, Inc., all rights reserved. www.Myriad.com.
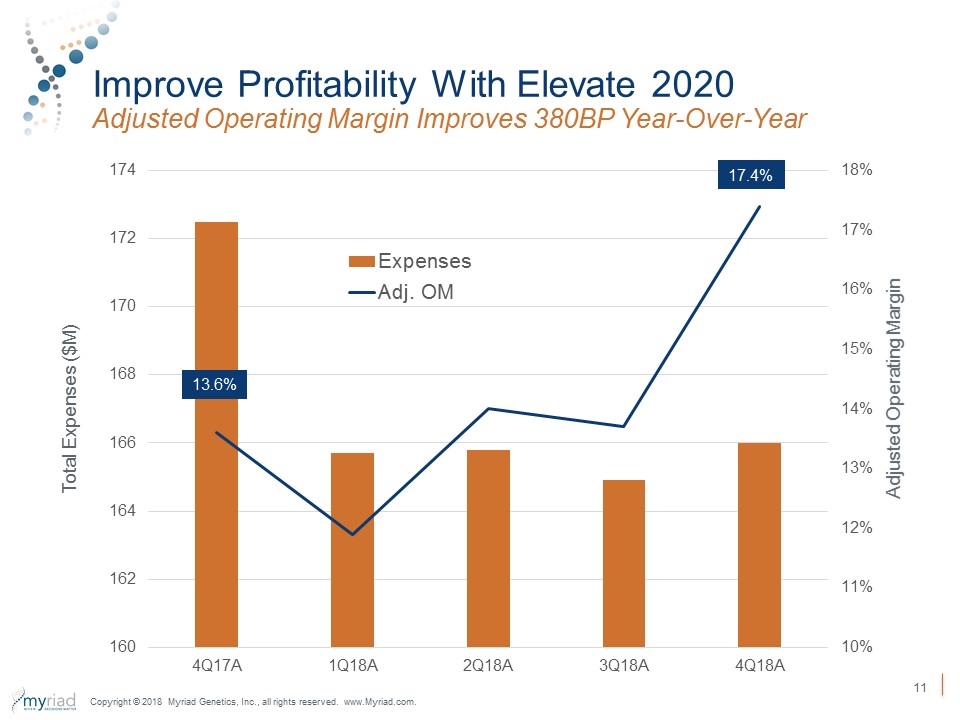
Improve Profitability With Elevate 2020 Adjusted Operating Margin Improves 380BP Year-Over-Year Total Expenses ($M) FY18 Targeted Savings = $17M Copyright © 2018 Myriad Genetics, Inc., all rights reserved. www.Myriad.com. Adjusted Operating Margin 13.6% 17.4%
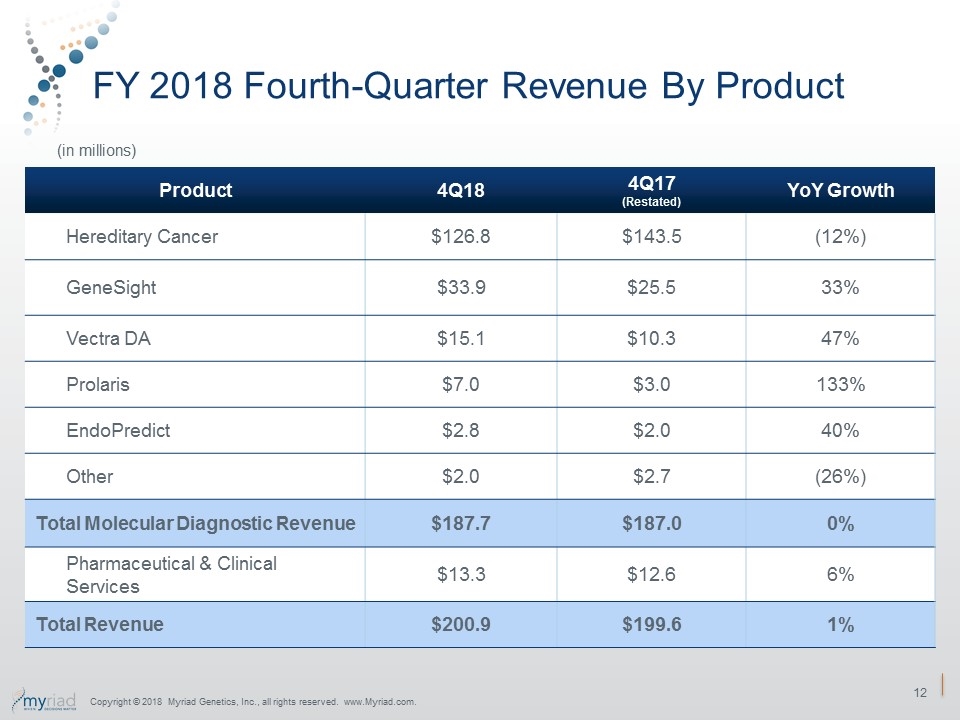
FY 2018 Fourth-Quarter Revenue By Product Product 4Q18 4Q17 (Restated) YoY Growth Hereditary Cancer $126.8 $143.5 (12%) GeneSight $33.9 $25.5 33% Vectra DA $15.1 $10.3 47% Prolaris $7.0 $3.0 133% EndoPredict $2.8 $2.0 40% Other $2.0 $2.7 (26%) Total Molecular Diagnostic Revenue $187.7 $187.0 0% Pharmaceutical & Clinical Services $13.3 $12.6 6% Total Revenue $200.9 $199.6 1% (in millions) Copyright © 2018 Myriad Genetics, Inc., all rights reserved. www.Myriad.com.
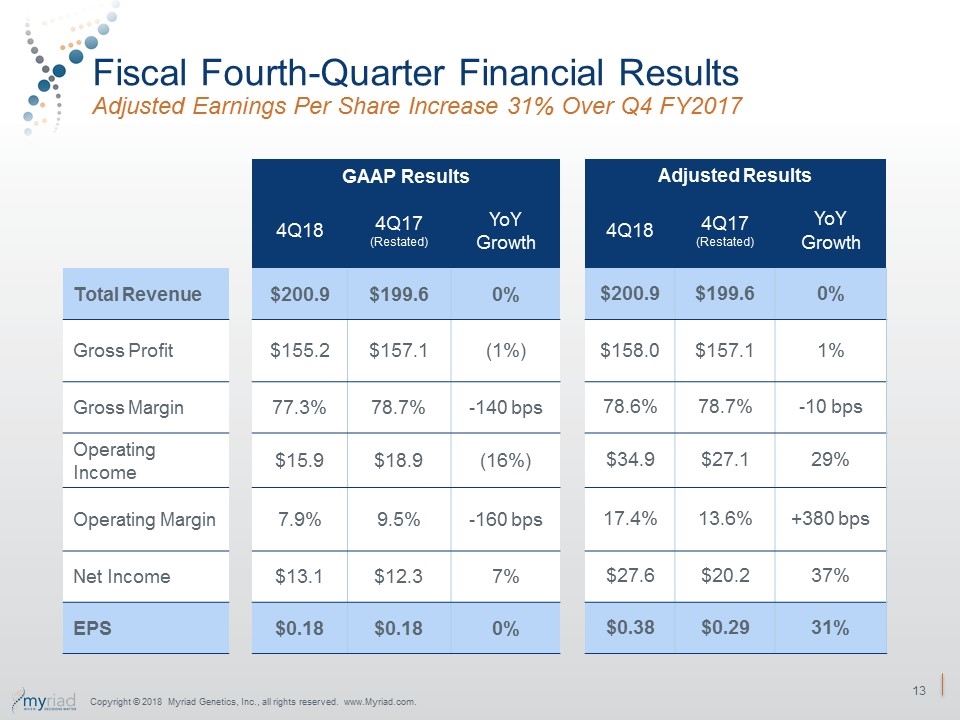
Fiscal Fourth-Quarter Financial Results Adjusted Earnings Per Share Increase 31% Over Q4 FY2017 GAAP Results Adjusted Results 4Q18 4Q17 (Restated) YoY Growth 4Q18 4Q17 (Restated) YoY Growth Total Revenue $200.9 $199.6 0% $200.9 $199.6 0% Gross Profit $155.2 $157.1 (1%) $158.0 $157.1 1% Gross Margin 77.3% 78.7% -140 bps 78.6% 78.7% -10 bps Operating Income $15.9 $18.9 (16%) $34.9 $27.1 29% Operating Margin 7.9% 9.5% -160 bps 17.4% 13.6% +380 bps Net Income $13.1 $12.3 7% $27.6 $20.2 37% EPS $0.18 $0.18 0% $0.38 $0.29 31% Copyright © 2018 Myriad Genetics, Inc., all rights reserved. www.Myriad.com.
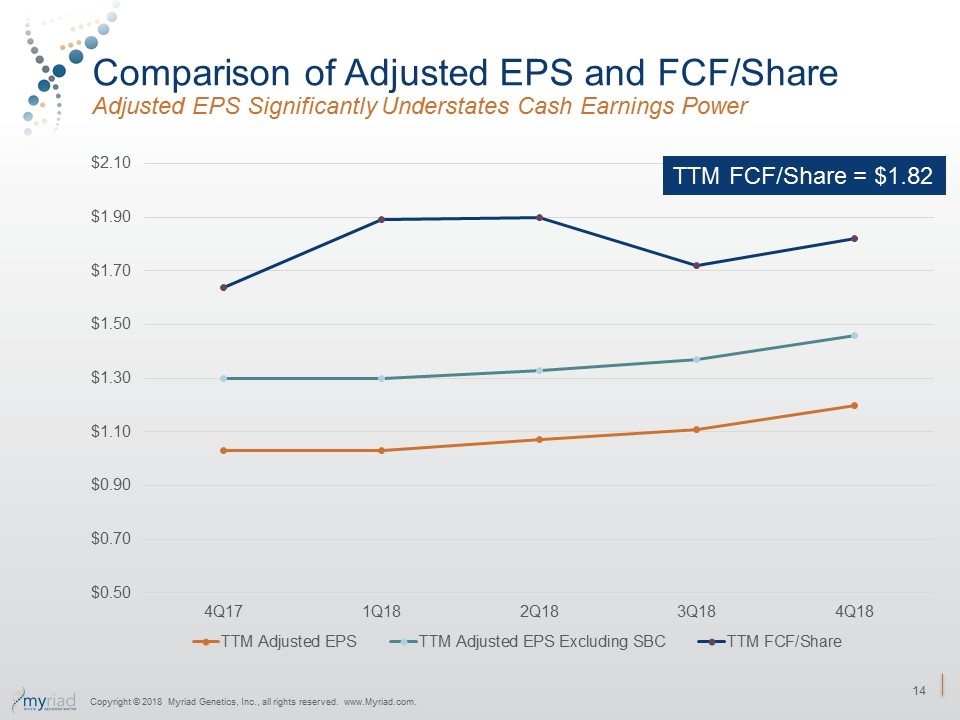
Comparison of Adjusted EPS and FCF/Share Adjusted EPS Significantly Understates Cash Earnings Power Copyright © 2018 Myriad Genetics, Inc., all rights reserved. www.Myriad.com. TTM FCF/Share = $1.82
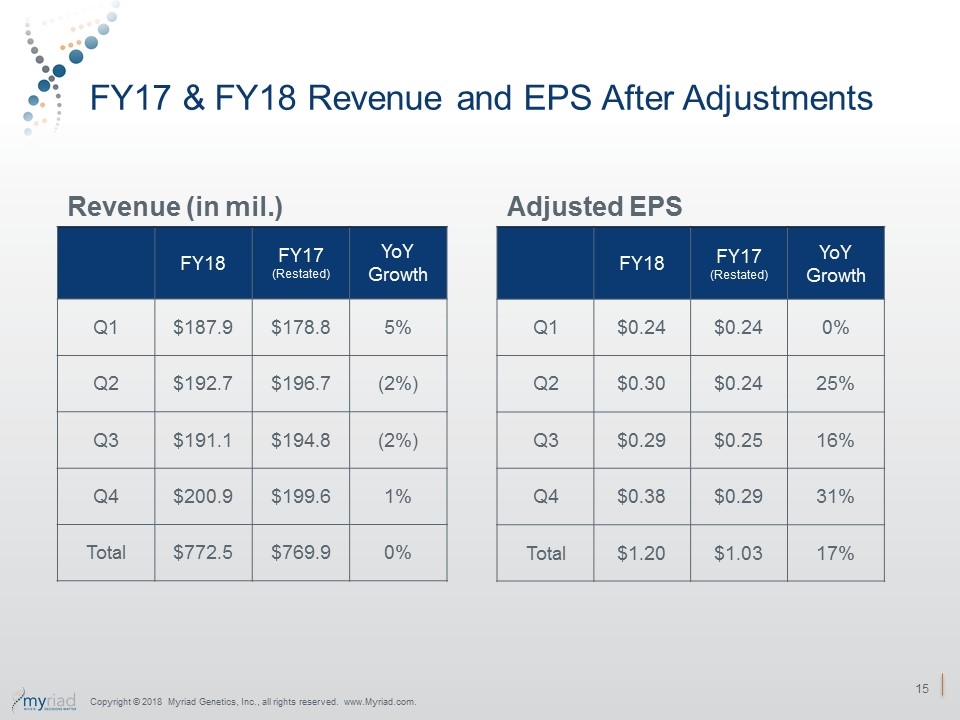
FY17 & FY18 Revenue and EPS After Adjustments Copyright © 2018 Myriad Genetics, Inc., all rights reserved. www.Myriad.com. Revenue (in mil.) FY18 FY17 (Restated) YoY Growth Q1 $187.9 $178.8 5% Q2 $192.7 $196.7 (2%) Q3 $191.1 $194.8 (2%) Q4 $200.9 $199.6 1% Total $772.5 $769.9 0% Adjusted EPS FY18 FY17 (Restated) YoY Growth Q1 $0.24 $0.24 0% Q2 $0.30 $0.24 25% Q3 $0.29 $0.25 16% Q4 $0.38 $0.29 31% Total $1.20 $1.03 17%
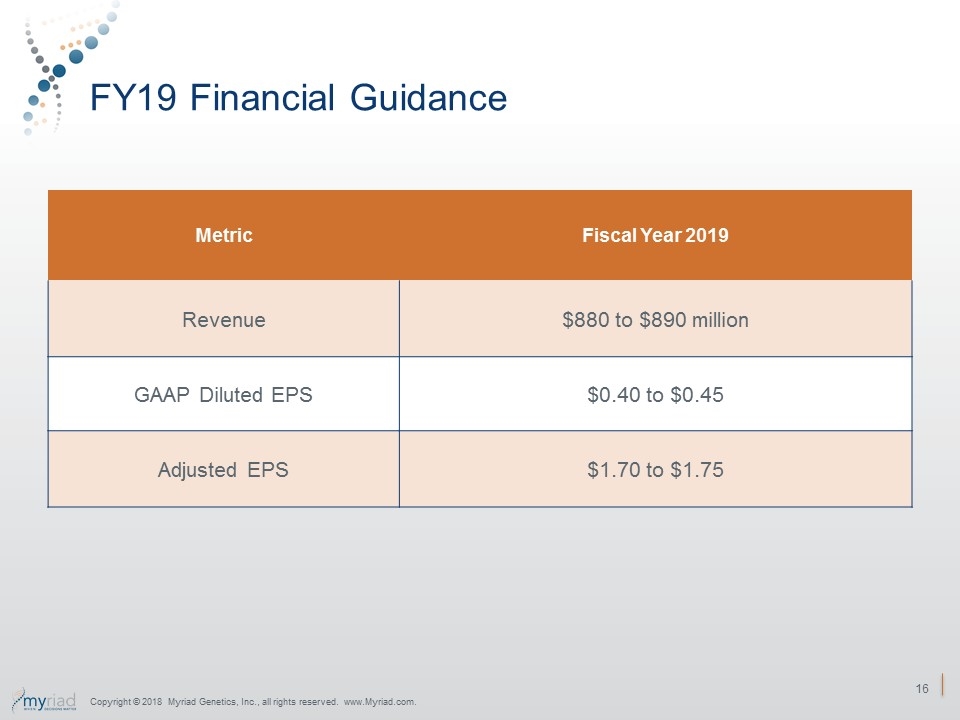
FY19 Financial Guidance Metric Fiscal Year 2019 Revenue $880 to $890 million GAAP Diluted EPS $0.40 to $0.45 Adjusted EPS $1.70 to $1.75 Copyright © 2018 Myriad Genetics, Inc., all rights reserved. www.Myriad.com.
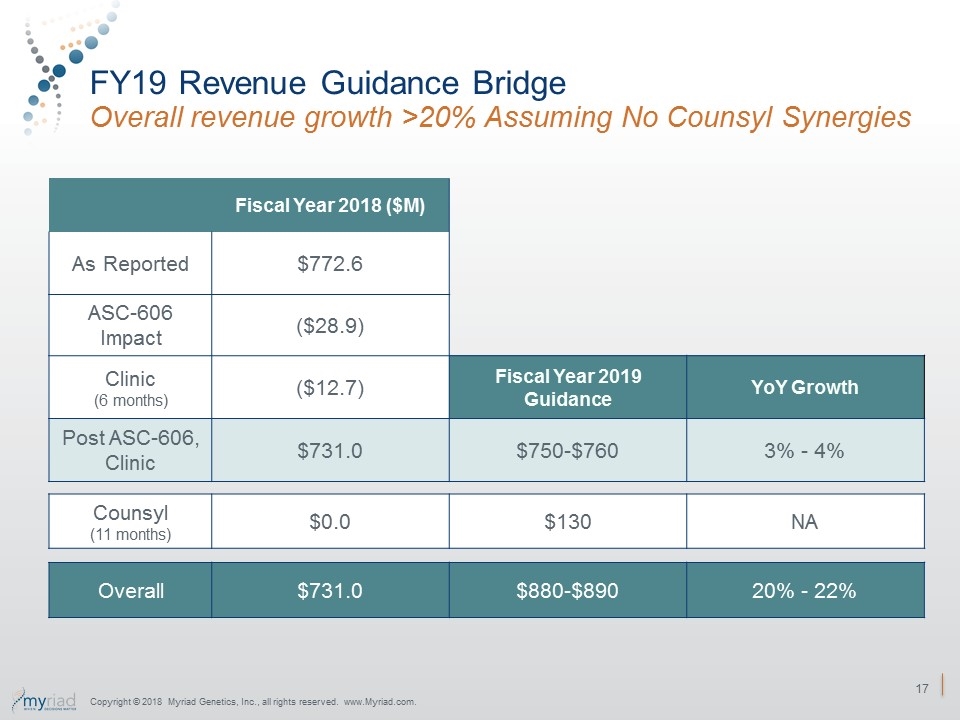
FY19 Revenue Guidance Bridge Overall revenue growth >20% Assuming No Counsyl Synergies Fiscal Year 2018 ($M) As Reported $772.6 ASC-606 Impact ($28.9) Clinic (6 months) ($12.7) Fiscal Year 2019 Guidance YoY Growth Post ASC-606, Clinic $731.0 $750-$760 3% - 4% Copyright © 2018 Myriad Genetics, Inc., all rights reserved. www.Myriad.com. Counsyl (11 months) $0.0 $130 NA Overall $731.0 $880-$890 20% - 22%
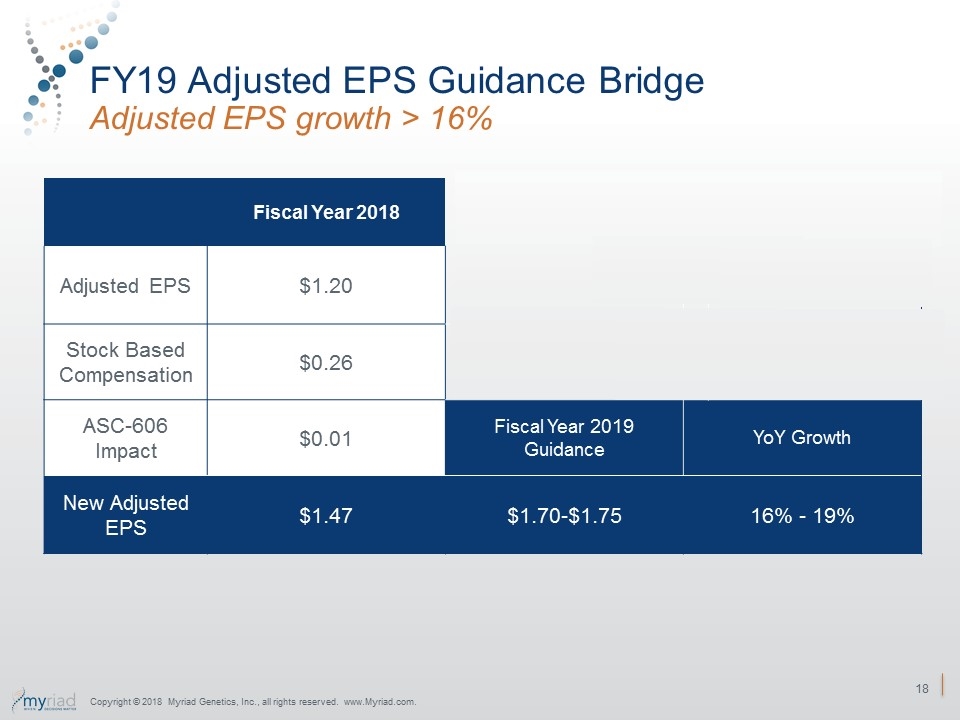
FY19 Adjusted EPS Guidance Bridge Adjusted EPS growth > 16% Fiscal Year 2018 Adjusted EPS $1.20 Stock Based Compensation $0.26 ASC-606 Impact $0.01 Fiscal Year 2019 Guidance YoY Growth New Adjusted EPS $1.47 $1.70-$1.75 16% - 19% Copyright © 2018 Myriad Genetics, Inc., all rights reserved. www.Myriad.com.
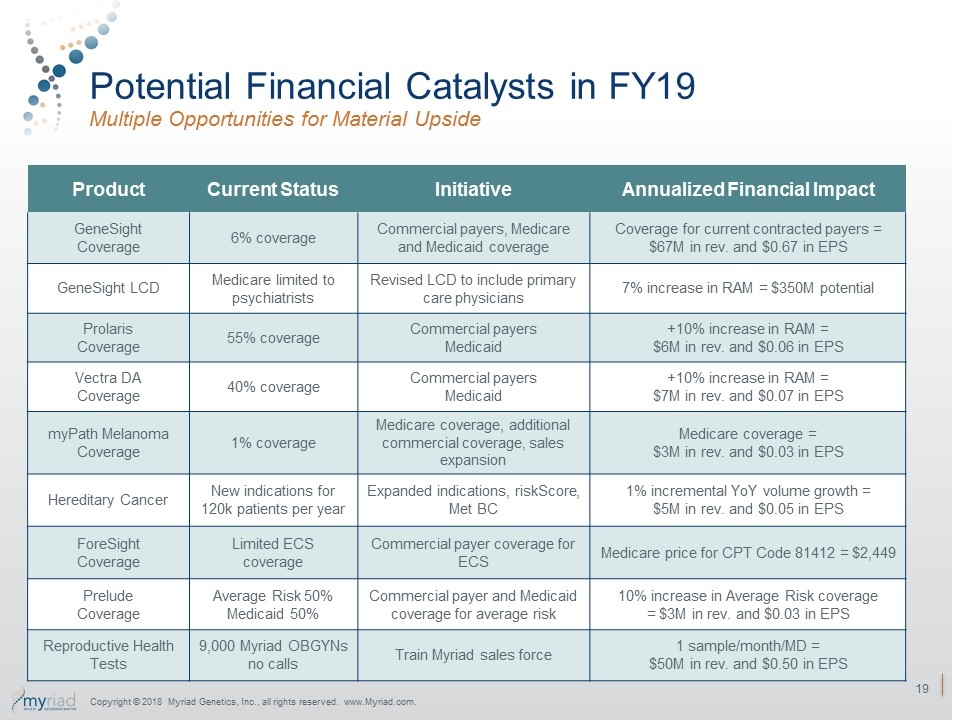
Potential Financial Catalysts in FY19 Multiple Opportunities for Material Upside Copyright © 2018 Myriad Genetics, Inc., all rights reserved. www.Myriad.com. Product Current Status Initiative Annualized Financial Impact GeneSight Coverage 6% coverage Commercial payers, Medicare and Medicaid coverage Coverage for current contracted payers = $67M in rev. and $0.67 in EPS GeneSight LCD Medicare limited to psychiatrists Revised LCD to include primary care physicians 7% increase in RAM = $350M potential Prolaris Coverage 55% coverage Commercial payers Medicaid +10% increase in RAM = $6M in rev. and $0.06 in EPS Vectra DA Coverage 40% coverage Commercial payers Medicaid +10% increase in RAM = $7M in rev. and $0.07 in EPS myPath Melanoma Coverage 1% coverage Medicare coverage, additional commercial coverage, sales expansion Medicare coverage = $3M in rev. and $0.03 in EPS Hereditary Cancer New indications for 120k patients per year Expanded indications, riskScore, Met BC 1% incremental YoY volume growth = $5M in rev. and $0.05 in EPS ForeSight Coverage Limited ECS coverage Commercial payer coverage for ECS Medicare price for CPT Code 81412 = $2,449 Prelude Coverage Average Risk 50% Medicaid 50% Commercial payer and Medicaid coverage for average risk 10% increase in Average Risk coverage = $3M in rev. and $0.03 in EPS Reproductive Health Tests 9,000 Myriad OBGYNs no calls Train Myriad sales force 1 sample/month/MD = $50M in rev. and $0.50 in EPS
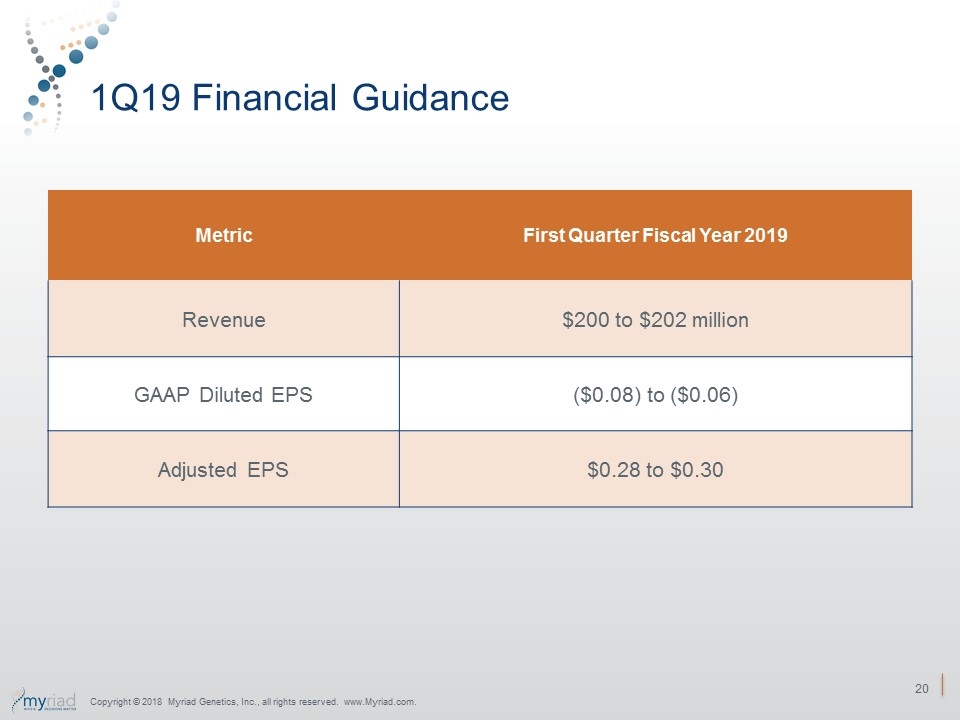
1Q19 Financial Guidance Metric First Quarter Fiscal Year 2019 Revenue $200 to $202 million GAAP Diluted EPS ($0.08) to ($0.06) Adjusted EPS $0.28 to $0.30 Copyright © 2018 Myriad Genetics, Inc., all rights reserved. www.Myriad.com.
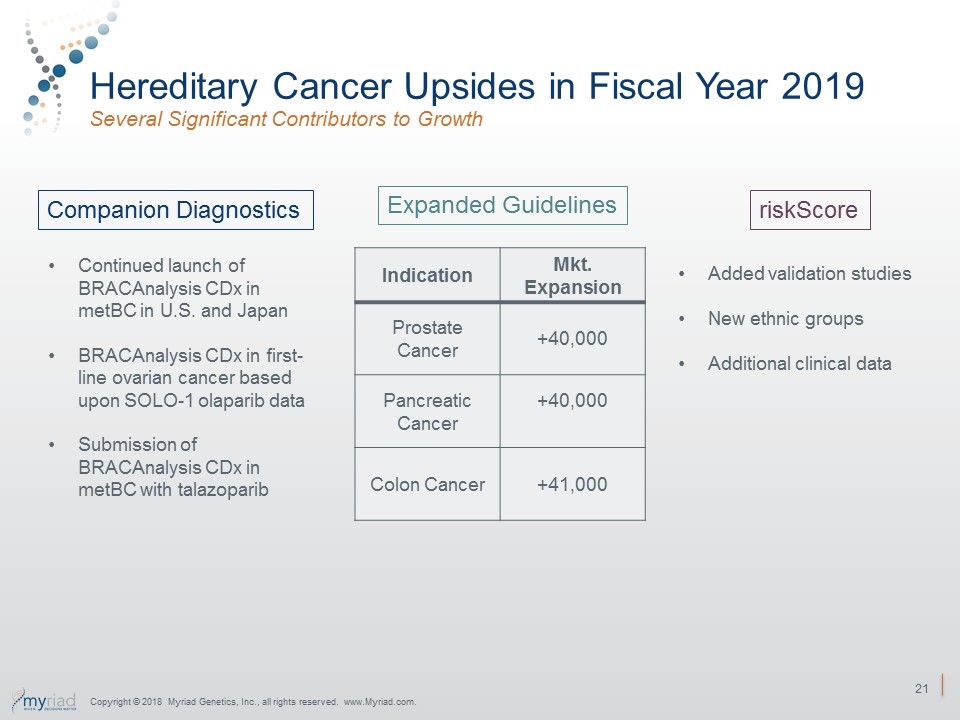
Hereditary Cancer Upsides in Fiscal Year 2019 Several Significant Contributors to Growth Copyright © 2018 Myriad Genetics, Inc., all rights reserved. www.Myriad.com. Companion Diagnostics Expanded Guidelines riskScore Continued launch of BRACAnalysis CDx in metBC in U.S. and Japan BRACAnalysis CDx in first-line ovarian cancer based upon SOLO-1 olaparib data Submission of BRACAnalysis CDx in metBC with talazoparib Indication Mkt. Expansion Prostate Cancer +40,000 Pancreatic Cancer +40,000 Colon Cancer +41,000 Added validation studies New ethnic groups Additional clinical data
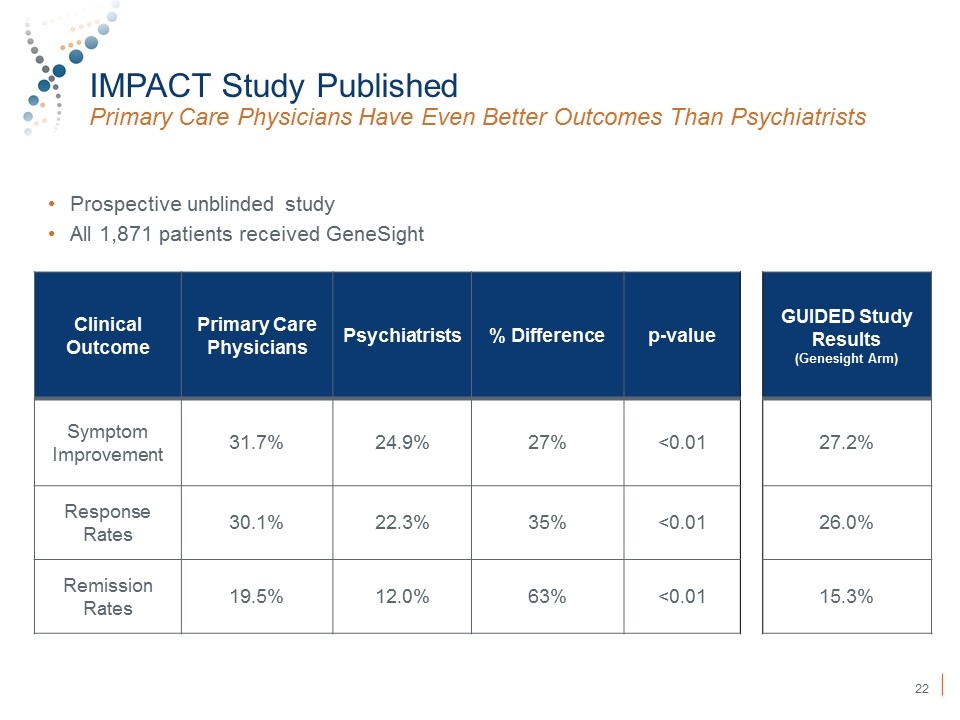
Copyright © 2018 Myriad Genetics, Inc., all rights reserved. www.Myriad.com. IMPACT Study Published Primary Care Physicians Have Even Better Outcomes Than Psychiatrists Clinical Outcome Primary Care Physicians Psychiatrists % Difference p-value GUIDED Study Results (Genesight Arm) Symptom Improvement 31.7% 24.9% 27% <0.01 27.2% Response Rates 30.1% 22.3% 35% <0.01 26.0% Remission Rates 19.5% 12.0% 63% <0.01 15.3% Prospective unblinded study All 1,871 patients received GeneSight
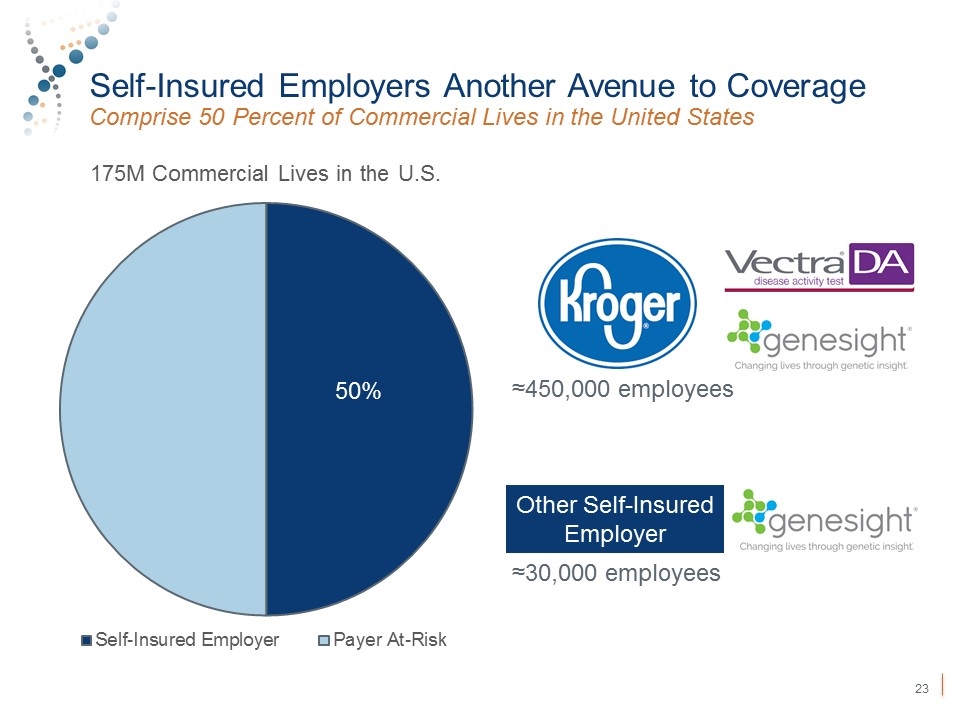
Copyright © 2018 Myriad Genetics, Inc., all rights reserved. www.Myriad.com. Self-Insured Employers Another Avenue to Coverage Comprise 50 Percent of Commercial Lives in the United States 50% ≈30,000 employees ≈450,000 employees Other Self-Insured Employer
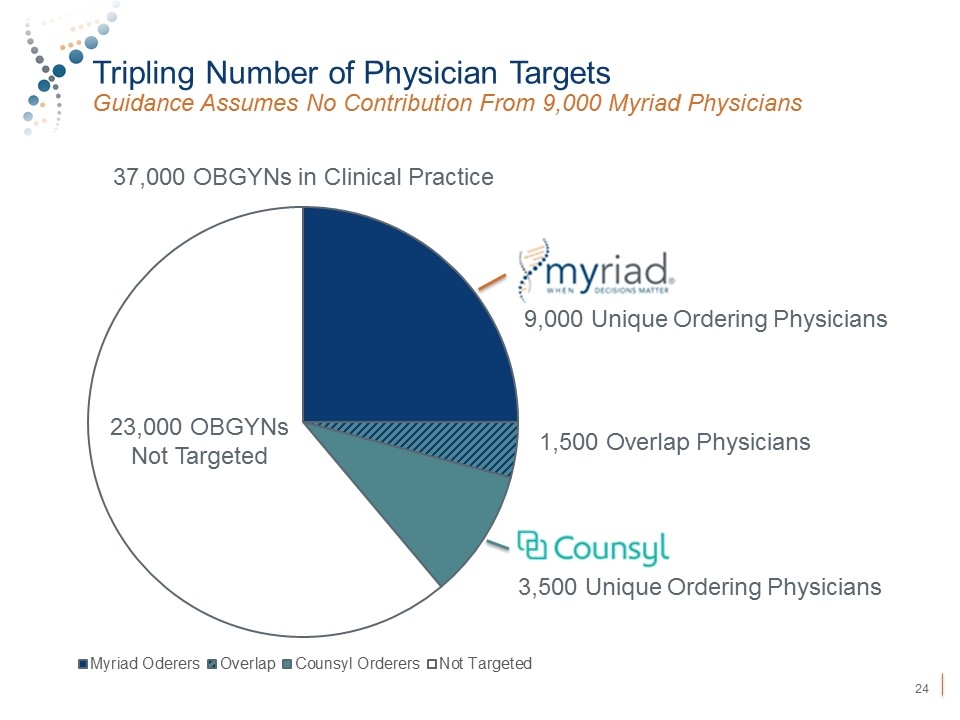
Tripling Number of Physician Targets Guidance Assumes No Contribution From 9,000 Myriad Physicians Copyright © 2018 Myriad Genetics, Inc., all rights reserved. www.Myriad.com. 16,000 Women’s Health Call Points 37,000 OBGYNs in Clinical Practice 9,000 Unique Ordering Physicians 3,500 Unique Ordering Physicians 1,500 Overlap Physicians 23,000 OBGYNs Not Targeted
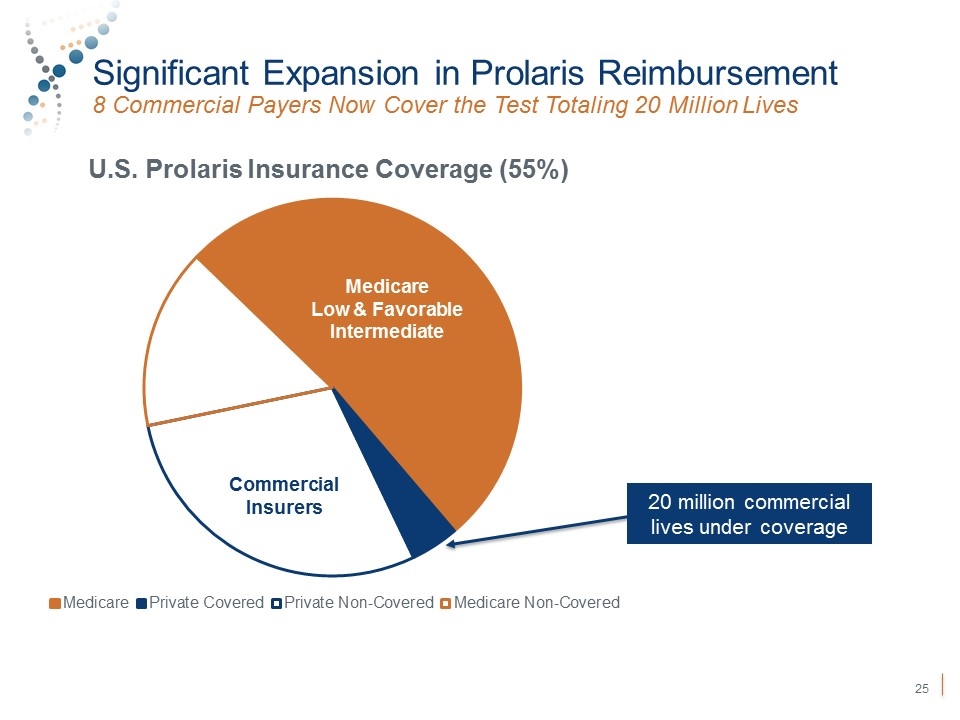
Significant Expansion in Prolaris Reimbursement 8 Commercial Payers Now Cover the Test Totaling 20 Million Lives 225 Sales Reps 80 Sales Reps Copyright © 2018 Myriad Genetics, Inc., all rights reserved. www.Myriad.com. Commercial Insurers 20 million commercial lives under coverage Medicare Low & Favorable Intermediate
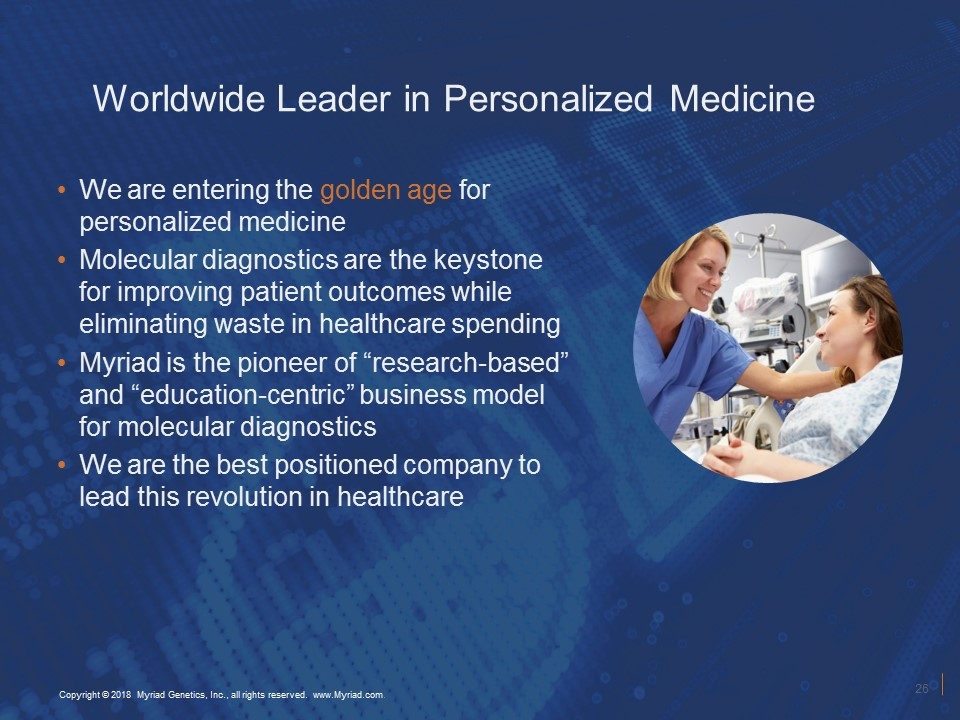
Worldwide Leader in Personalized Medicine We are entering the golden age for personalized medicine Molecular diagnostics are the keystone for improving patient outcomes while eliminating waste in healthcare spending Myriad is the pioneer of “research-based” and “education-centric” business model for molecular diagnostics We are the best positioned company to lead this revolution in healthcare Copyright © 2018 Myriad Genetics, Inc., all rights reserved. www.Myriad.com.
