Attached files
| file | filename |
|---|---|
| EX-99.1 - EXHIBIT 99.1 - Griffin Capital Essential Asset REIT, Inc. | gcear-06302018earningsrele.htm |
| 8-K - 8-K - Griffin Capital Essential Asset REIT, Inc. | gcearform8-kre2q2018earnin.htm |
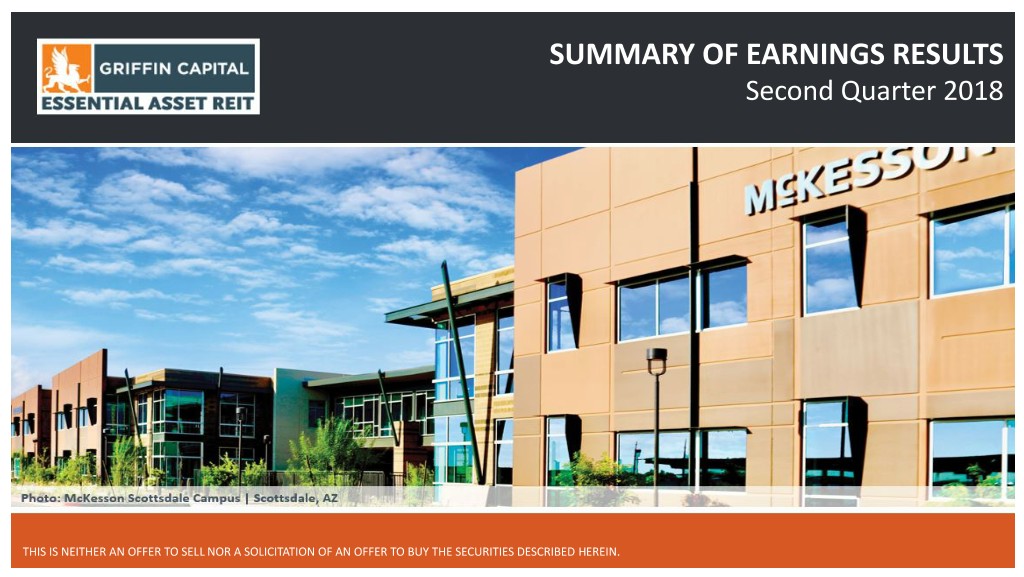
SUMMARY OF EARNINGS RESULTS Second Quarter 2018 THIS IS NEITHER AN OFFER TO SELL NOR A SOLICITATION OF AN OFFER TO BUY THE SECURITIES DESCRIBED HEREIN.
Conference Call Agenda TOPIC SPEAKER Introduction and Portfolio Characteristics Michael Escalante | President & CIO Portfolio Update Michael Escalante | President & CIO Financial Performance Review Javier Bitar | Chief Financial Officer Questions & Answers Michael Escalante & Javier Bitar GRIFFIN CAPITAL 2
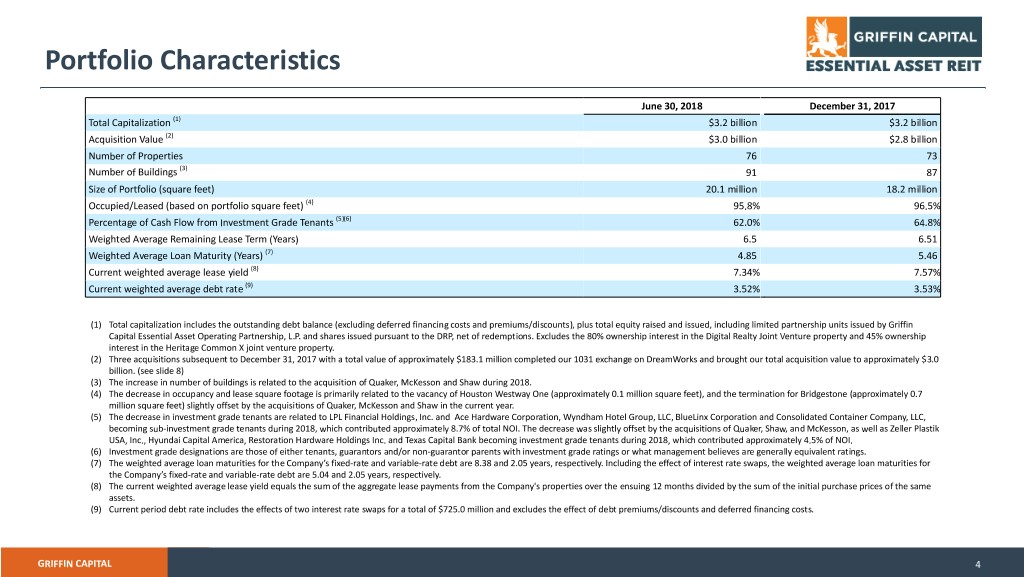
Portfolio Characteristics June 30, 2018 December 31, 2017 Total Capitalization (1) $3.2 billion $3.2 billion Acquisition Value (2) $3.0 billion $2.8 billion Number of Properties 76 73 Number of Buildings (3) 91 87 Size of Portfolio (square feet) 20.1 million 18.2 million Occupied/Leased (based on portfolio square feet) (4) 95.8% 96.5% Percentage of Cash Flow from Investment Grade Tenants (5)(6) 62.0% 64.8% Weighted Average Remaining Lease Term (Years) 6.5 6.51 Weighted Average Loan Maturity (Years) (7) 4.85 5.46 Current weighted average lease yield (8) 7.34% 7.57% Current weighted average debt rate (9) 3.52% 3.53% (1) Total capitalization includes the outstanding debt balance (excluding deferred financing costs and premiums/discounts), plus total equity raised and issued, including limited partnership units issued by Griffin Capital Essential Asset Operating Partnership, L.P. and shares issued pursuant to the DRP, net of redemptions. Excludes the 80% ownership interest in the Digital Realty Joint Venture property and 45% ownership interest in the Heritage Common X joint venture property. (2) Three acquisitions subsequent to December 31, 2017 with a total value of approximately $183.1 million completed our 1031 exchange on DreamWorks and brought our total acquisition value to approximately $3.0 billion. (see slide 8) (3) The increase in number of buildings is related to the acquisition of Quaker, McKesson and Shaw during 2018. (4) The decrease in occupancy and lease square footage is primarily related to the vacancy of Houston Westway One (approximately 0.1 million square feet), and the termination for Bridgestone (approximately 0.7 million square feet) slightly offset by the acquisitions of Quaker, McKesson and Shaw in the current year. (5) The decrease in investment grade tenants are related to LPL Financial Holdings, Inc. and Ace Hardware Corporation, Wyndham Hotel Group, LLC, BlueLinx Corporation and Consolidated Container Company, LLC, becoming sub-investment grade tenants during 2018, which contributed approximately 8.7% of total NOI. The decrease was slightly offset by the acquisitions of Quaker, Shaw, and McKesson, as well as Zeller Plastik USA, Inc., Hyundai Capital America, Restoration Hardware Holdings Inc. and Texas Capital Bank becoming investment grade tenants during 2018, which contributed approximately 4.5% of NOI. (6) Investment grade designations are those of either tenants, guarantors and/or non-guarantor parents with investment grade ratings or what management believes are generally equivalent ratings. (7) The weighted average loan maturities for the Company’s fixed-rate and variable-rate debt are 8.38 and 2.05 years, respectively. Including the effect of interest rate swaps, the weighted average loan maturities for the Company’s fixed-rate and variable-rate debt are 5.04 and 2.05 years, respectively. (8) The current weighted average lease yield equals the sum of the aggregate lease payments from the Company's properties over the ensuing 12 months divided by the sum of the initial purchase prices of the same assets. (9) Current period debt rate includes the effects of two interest rate swaps for a total of $725.0 million and excludes the effect of debt premiums/discounts and deferred financing costs. GRIFFIN CAPITAL 4
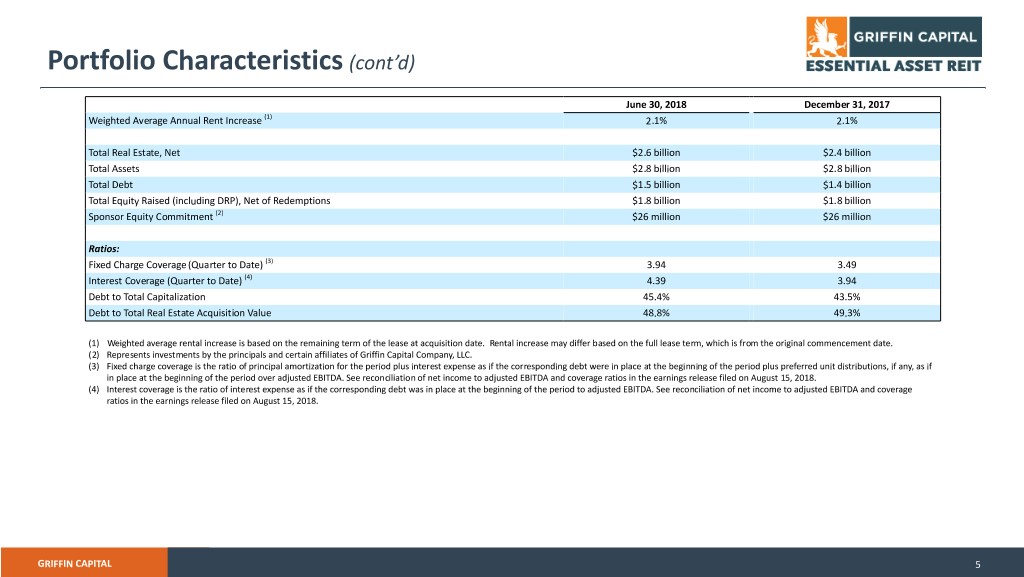
Portfolio Characteristics (cont’d) June 30, 2018 December 31, 2017 Weighted Average Annual Rent Increase (1) 2.1% 2.1% Total Real Estate, Net $2.6 billion $2.4 billion Total Assets $2.8 billion $2.8 billion Total Debt $1.5 billion $1.4 billion Total Equity Raised (including DRP), Net of Redemptions $1.8 billion $1.8 billion Sponsor Equity Commitment (2) $26 million $26 million Ratios: Fixed Charge Coverage (Quarter to Date) (3) 3.94 3.49 Interest Coverage (Quarter to Date) (4) 4.39 3.94 Debt to Total Capitalization 45.4% 43.5% Debt to Total Real Estate Acquisition Value 48.8% 49.3% (1) Weighted average rental increase is based on the remaining term of the lease at acquisition date. Rental increase may differ based on the full lease term, which is from the original commencement date. (2) Represents investments by the principals and certain affiliates of Griffin Capital Company, LLC. (3) Fixed charge coverage is the ratio of principal amortization for the period plus interest expense as if the corresponding debt were in place at the beginning of the period plus preferred unit distributions, if any, as if in place at the beginning of the period over adjusted EBITDA. See reconciliation of net income to adjusted EBITDA and coverage ratios in the earnings release filed on August 15, 2018. (4) Interest coverage is the ratio of interest expense as if the corresponding debt was in place at the beginning of the period to adjusted EBITDA. See reconciliation of net income to adjusted EBITDA and coverage ratios in the earnings release filed on August 15, 2018. GRIFFIN CAPITAL 5
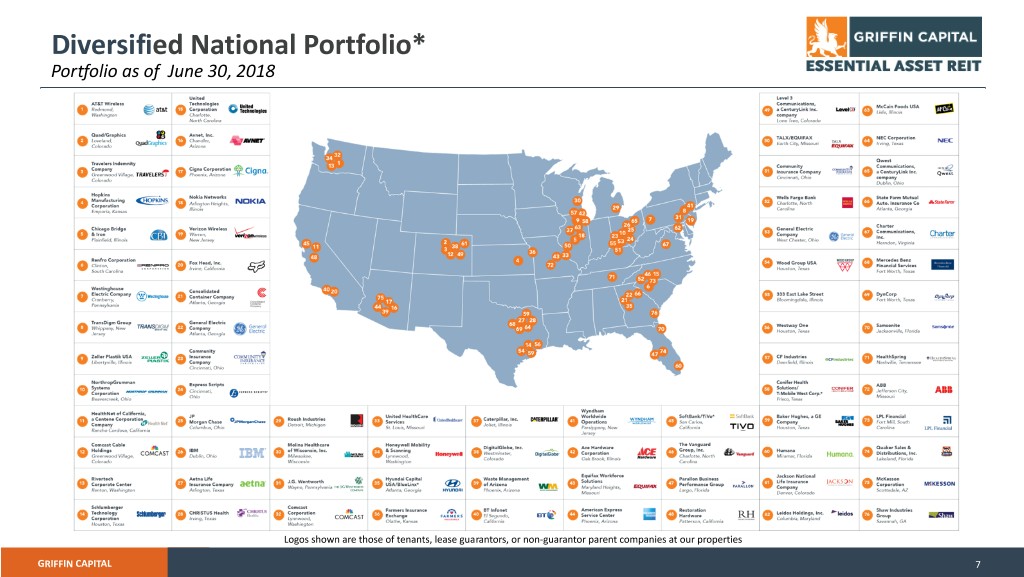
Diversified National Portfolio* Portfolio as of June 30, 2018 Logos shown are those of tenants, lease guarantors, or non-guarantor parent companies at our properties GRIFFIN CAPITAL 7
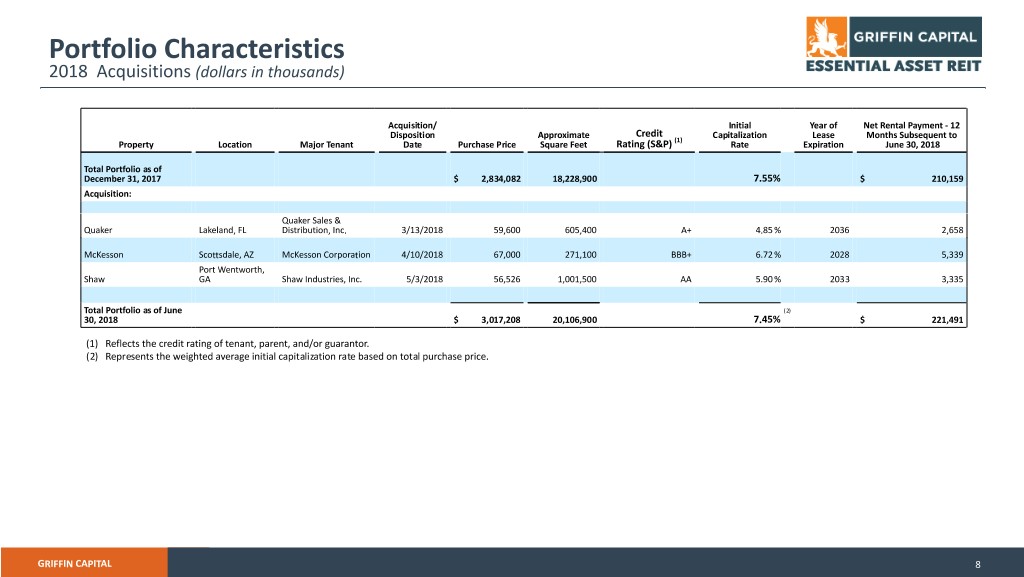
Portfolio Characteristics 2018 Acquisitions (dollars in thousands) Acquisition/ Initial Year of Net Rental Payment - 12 Disposition Approximate Credit Capitalization Lease Months Subsequent to Property Location Major Tenant Date Purchase Price Square Feet Rating (S&P) (1) Rate Expiration June 30, 2018 Total Portfolio as of December 31, 2017 $ 2,834,082 18,228,900 7.55% $ 210,159 Acquisition: Quaker Sales & Quaker Lakeland, FL Distribution, Inc. 3/13/2018 59,600 605,400 A+ 4.85% 2036 2,658 McKesson Scottsdale, AZ McKesson Corporation 4/10/2018 67,000 271,100 BBB+ 6.72% 2028 5,339 Port Wentworth, Shaw GA Shaw Industries, Inc. 5/3/2018 56,526 1,001,500 AA 5.90% 2033 3,335 Total Portfolio as of June (2) 30, 2018 $ 3,017,208 20,106,900 7.45% $ 221,491 (1) Reflects the credit rating of tenant, parent, and/or guarantor. (2) Represents the weighted average initial capitalization rate based on total purchase price. GRIFFIN CAPITAL 8

Shaw Distribution Center Savannah, GA GRIFFIN CAPITAL 9

McKesson Scottsdale Campus Scottsdale, AZ GRIFFIN CAPITAL 10
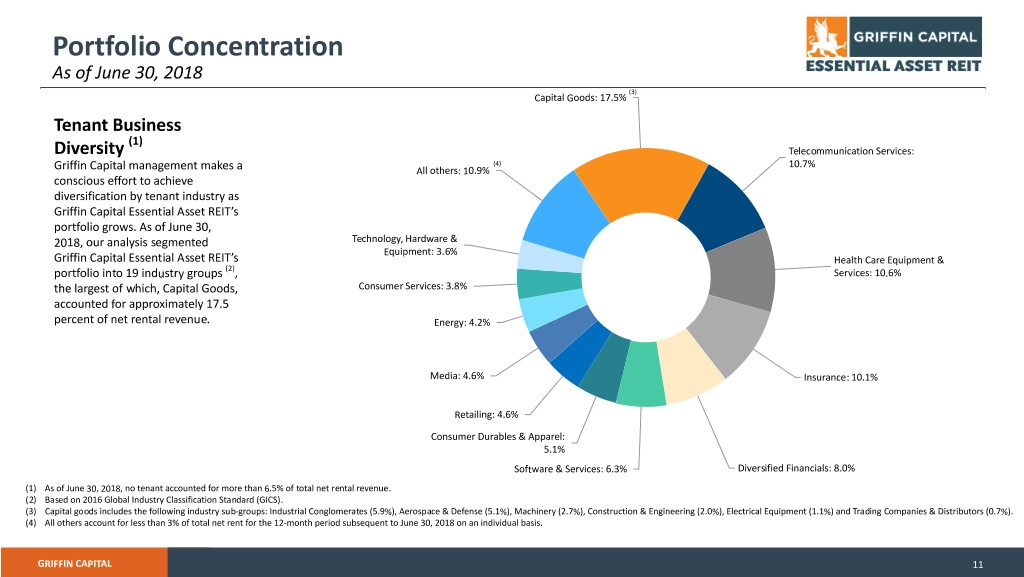
Portfolio Concentration As of June 30, 2018 (3) Capital Goods: 17.5% Tenant Business (1) Diversity Telecommunication Services: (4) 10.7% Griffin Capital management makes a All others: 10.9% conscious effort to achieve diversification by tenant industry as Griffin Capital Essential Asset REIT’s portfolio grows. As of June 30, 2018, our analysis segmented Technology, Hardware & Equipment: 3.6% Griffin Capital Essential Asset REIT’s Health Care Equipment & portfolio into 19 industry groups (2), Services: 10.6% the largest of which, Capital Goods, Consumer Services: 3.8% accounted for approximately 17.5 percent of net rental revenue. Energy: 4.2% Media: 4.6% Insurance: 10.1% Retailing: 4.6% Consumer Durables & Apparel: 5.1% Software & Services: 6.3% Diversified Financials: 8.0% (1) As of June 30, 2018, no tenant accounted for more than 6.5% of total net rental revenue. (2) Based on 2016 Global Industry Classification Standard (GICS). (3) Capital goods includes the following industry sub-groups: Industrial Conglomerates (5.9%), Aerospace & Defense (5.1%), Machinery (2.7%), Construction & Engineering (2.0%), Electrical Equipment (1.1%) and Trading Companies & Distributors (0.7%). (4) All others account for less than 3% of total net rent for the 12-month period subsequent to June 30, 2018 on an individual basis. GRIFFIN CAPITAL 11
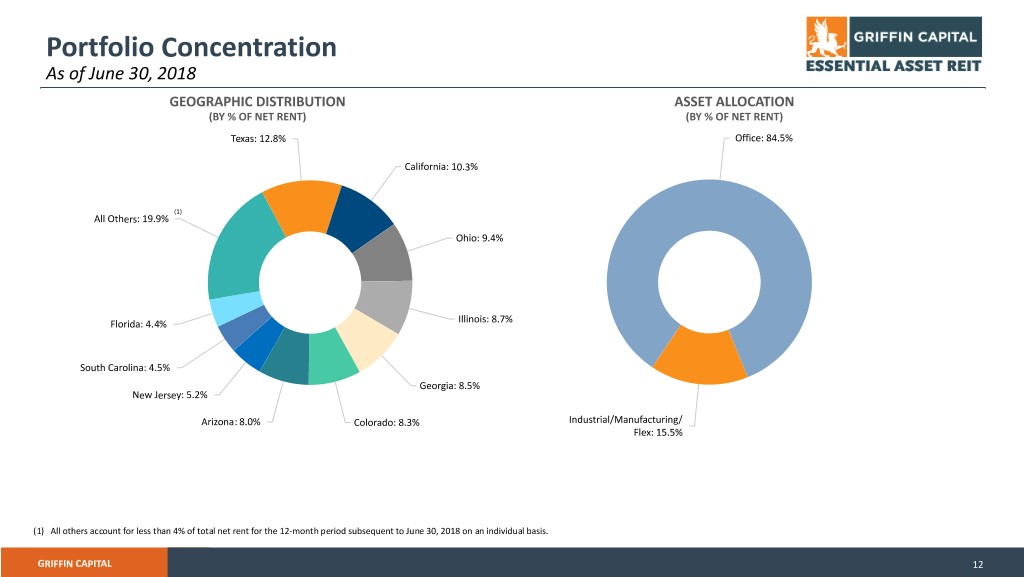
Portfolio Concentration As of June 30, 2018 GEOGRAPHIC DISTRIBUTION ASSET ALLOCATION (BY % OF NET RENT) (BY % OF NET RENT) Texas: 12.8% Office: 84.5% California: 10.3% (1) All Others: 19.9% Ohio: 9.4% Florida: 4.4% Illinois: 8.7% South Carolina: 4.5% Georgia: 8.5% New Jersey: 5.2% Arizona: 8.0% Colorado: 8.3% Industrial/Manufacturing/ Flex: 15.5% (1) All others account for less than 4% of total net rent for the 12-month period subsequent to June 30, 2018 on an individual basis. GRIFFIN CAPITAL 12
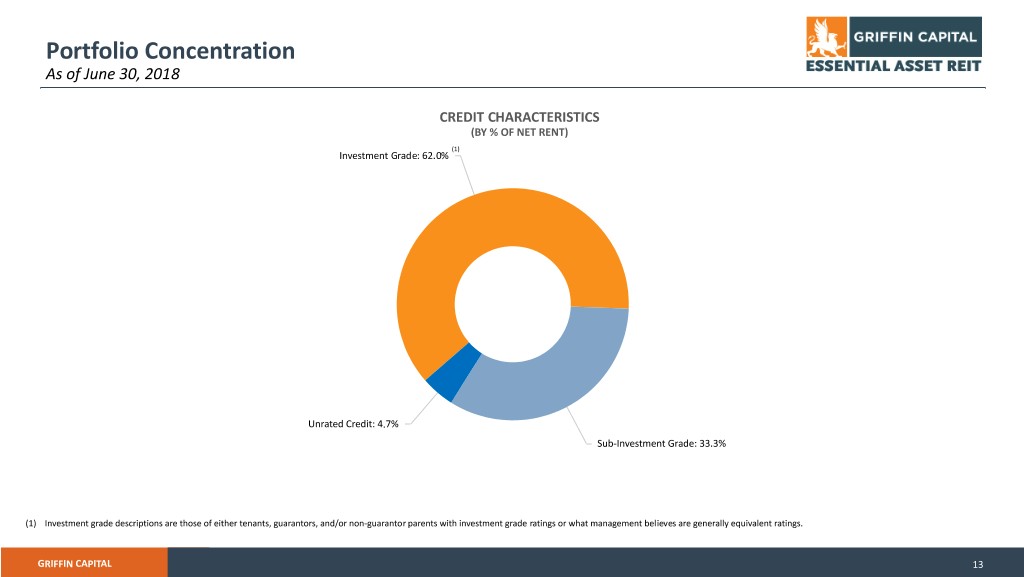
Portfolio Concentration As of June 30, 2018 CREDIT CHARACTERISTICS (BY % OF NET RENT) (1) Investment Grade: 62.0% Unrated Credit: 4.7% Sub-Investment Grade: 33.3% (1) Investment grade descriptions are those of either tenants, guarantors, and/or non-guarantor parents with investment grade ratings or what management believes are generally equivalent ratings. GRIFFIN CAPITAL 13
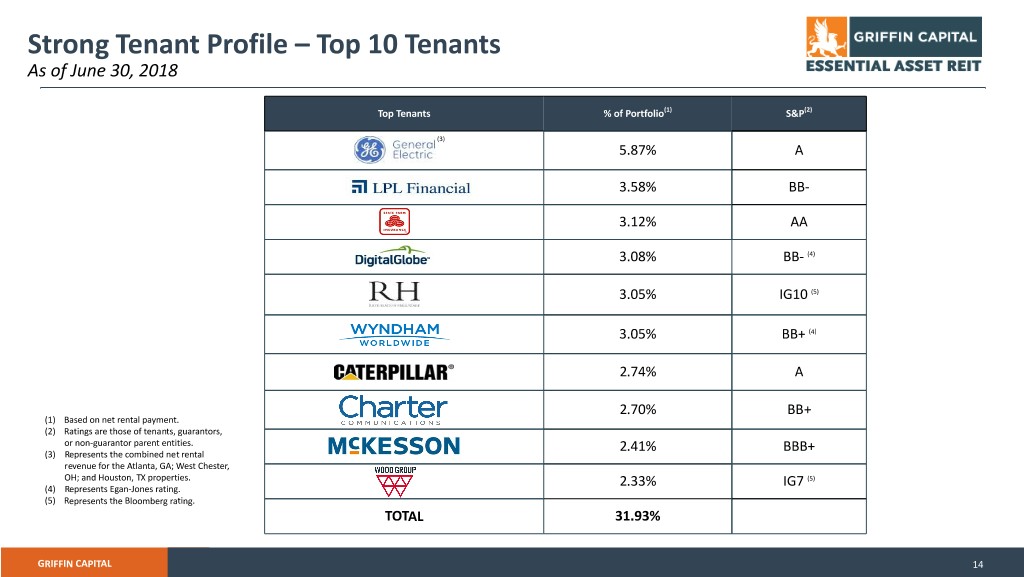
Strong Tenant Profile – Top 10 Tenants As of June 30, 2018 Top Tenants % of Portfolio(1) S&P(2) (3) 5.87% A 3.58% BB- 3.12% AA 3.08% BB- (4) 3.05% IG10 (5) 3.05% BB+ (4) 2.74% A 2.70% BB+ (1) Based on net rental payment. (2) Ratings are those of tenants, guarantors, or non-guarantor parent entities. 2.41% BBB+ (3) Represents the combined net rental revenue for the Atlanta, GA; West Chester, OH; and Houston, TX properties. 2.33% IG7 (5) (4) Represents Egan-Jones rating. (5) Represents the Bloomberg rating. TOTAL 31.93% GRIFFIN CAPITAL 14
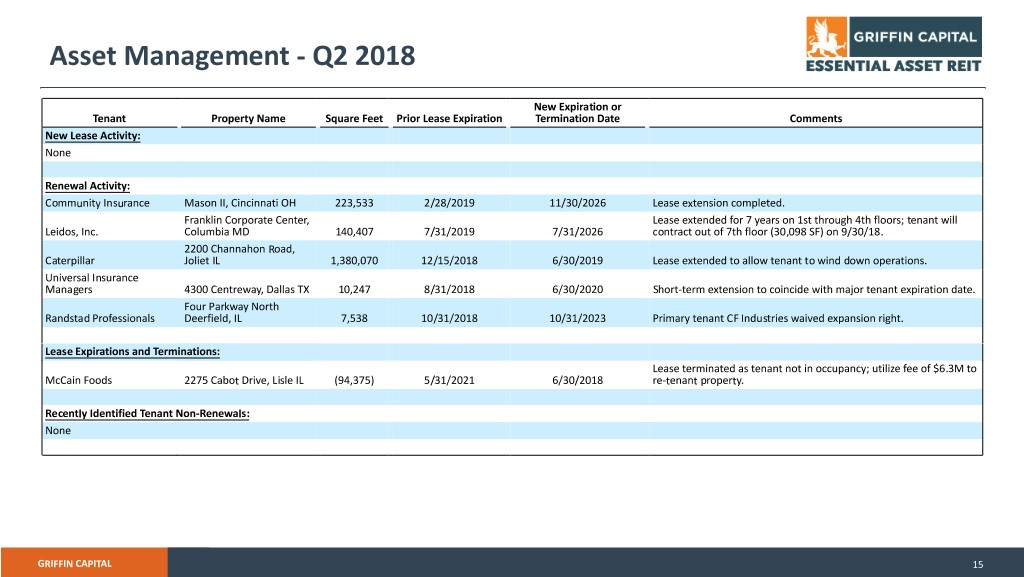
Asset Management - Q2 2018 New Expiration or Tenant Property Name Square Feet Prior Lease Expiration Termination Date Comments New Lease Activity: None Renewal Activity: Community Insurance Mason II, Cincinnati OH 223,533 2/28/2019 11/30/2026 Lease extension completed. Franklin Corporate Center, Lease extended for 7 years on 1st through 4th floors; tenant will Leidos, Inc. Columbia MD 140,407 7/31/2019 7/31/2026 contract out of 7th floor (30,098 SF) on 9/30/18. 2200 Channahon Road, Caterpillar Joliet IL 1,380,070 12/15/2018 6/30/2019 Lease extended to allow tenant to wind down operations. Universal Insurance Managers 4300 Centreway, Dallas TX 10,247 8/31/2018 6/30/2020 Short-term extension to coincide with major tenant expiration date. Four Parkway North Randstad Professionals Deerfield, IL 7,538 10/31/2018 10/31/2023 Primary tenant CF Industries waived expansion right. Lease Expirations and Terminations: Lease terminated as tenant not in occupancy; utilize fee of $6.3M to McCain Foods 2275 Cabot Drive, Lisle IL (94,375) 5/31/2021 6/30/2018 re-tenant property. Recently Identified Tenant Non-Renewals: None GRIFFIN CAPITAL 15
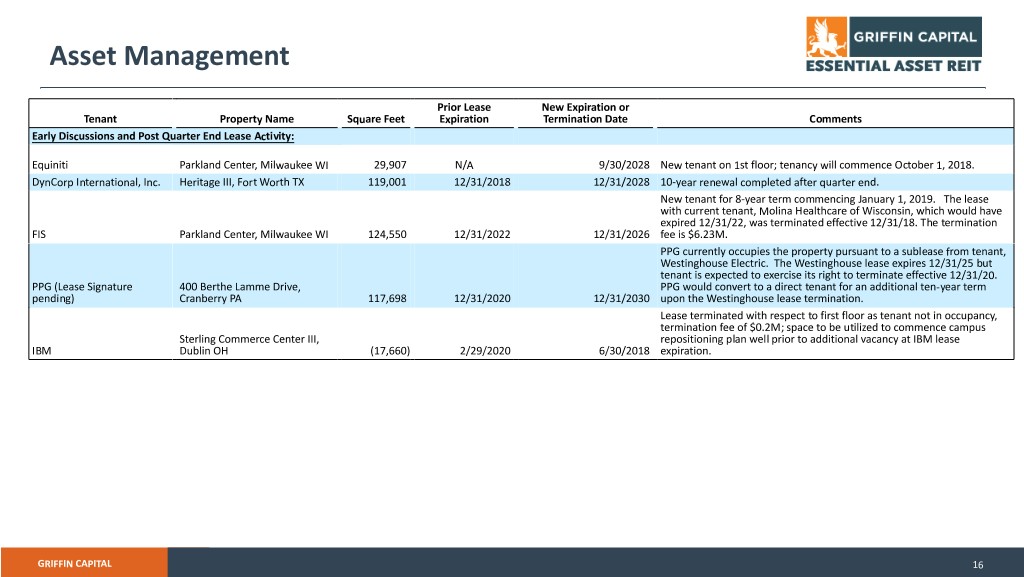
Asset Management Prior Lease New Expiration or Tenant Property Name Square Feet Expiration Termination Date Comments Early Discussions and Post Quarter End Lease Activity: Equiniti Parkland Center, Milwaukee WI 29,907 N/A 9/30/2028 New tenant on 1st floor; tenancy will commence October 1, 2018. DynCorp International, Inc. Heritage III, Fort Worth TX 119,001 12/31/2018 12/31/2028 10-year renewal completed after quarter end. New tenant for 8-year term commencing January 1, 2019. The lease with current tenant, Molina Healthcare of Wisconsin, which would have expired 12/31/22, was terminated effective 12/31/18. The termination FIS Parkland Center, Milwaukee WI 124,550 12/31/2022 12/31/2026 fee is $6.23M. PPG currently occupies the property pursuant to a sublease from tenant, Westinghouse Electric. The Westinghouse lease expires 12/31/25 but tenant is expected to exercise its right to terminate effective 12/31/20. PPG (Lease Signature 400 Berthe Lamme Drive, PPG would convert to a direct tenant for an additional ten-year term pending) Cranberry PA 117,698 12/31/2020 12/31/2030 upon the Westinghouse lease termination. Lease terminated with respect to first floor as tenant not in occupancy, termination fee of $0.2M; space to be utilized to commence campus Sterling Commerce Center III, repositioning plan well prior to additional vacancy at IBM lease IBM Dublin OH (17,660) 2/29/2020 6/30/2018 expiration. GRIFFIN CAPITAL 16
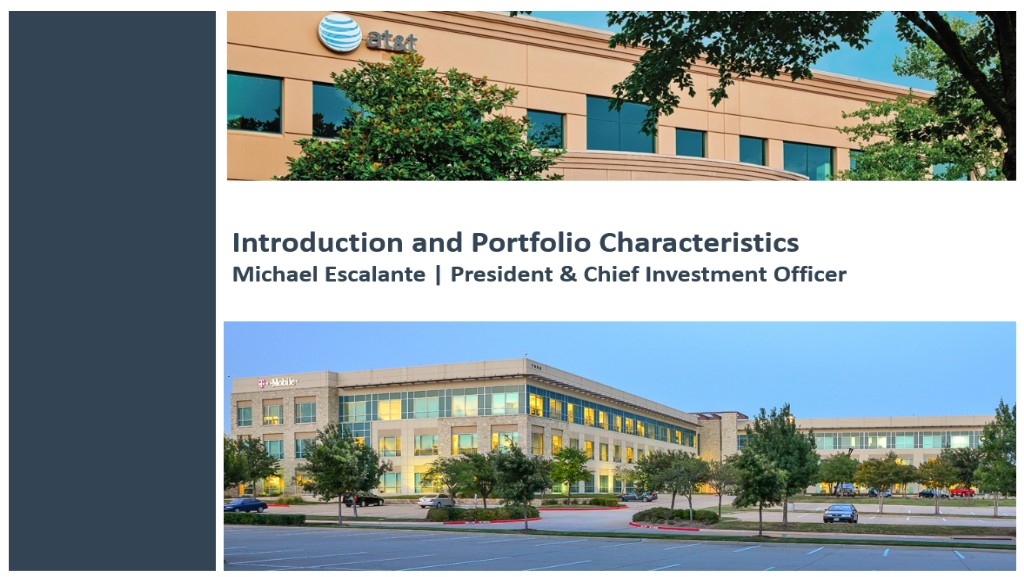
Financial Performance Review Javier Bitar | Chief Financial Officer

Financial Performance (in thousands, except per share amounts) Six Months Ended June 30, Three Months Ended June 30, 2018 2017 2018 2017 Total Revenue $ 166,390 $ 179,480 $ 85,991 $ 82,772 Net Income Attributable to Common Stockholders $ 13,750 $ 22,482 $ 7,431 $ 8,756 Net Income Attributable to Common Stockholders, Per Share, Basic and Diluted $ 0.08 $ 0.13 $ 0.04 $ 0.05 Adjusted EBIDTA (per facility agreement) (1) $ 114,621 $ 114,738 $ 59,819 $ 56,557 FFO (2) $ 73,682 $ 86,617 $ 39,101 $ 35,421 AFFO (3) $ 67,625 $ 77,212 $ 33,263 $ 38,985 Distributions (4) Cash Distributions $ 35,706 $ 35,278 $ 17,831 $ 17,777 Distribution Reinvestment Plan (DRP) 22,653 25,070 11,219 12,516 Total Distributions $ 58,359 $ 60,348 $ 29,050 $ 30,293 (1) See reconciliation of net income to adjusted EBITDA and coverage ratios in the earnings release filed on August 15, 2018. (2) FFO reflects distributions paid to noncontrolling interests. (3) Beginning with the three months ended March 31, 2018, the Company is using Adjusted Funds from Operations (“AFFO”) as a non-GAAP financial measure to evaluate the Company's operating performance. The Company previously used Modified Funds from Operations as a non-GAAP measure of operating performance. See reconciliation of AFFO in the earnings release filed on August 15, 2018. No adjustments were required to the prior periods for this change. (4) Represents distributions paid and declared to common stockholders. GRIFFIN CAPITAL 18
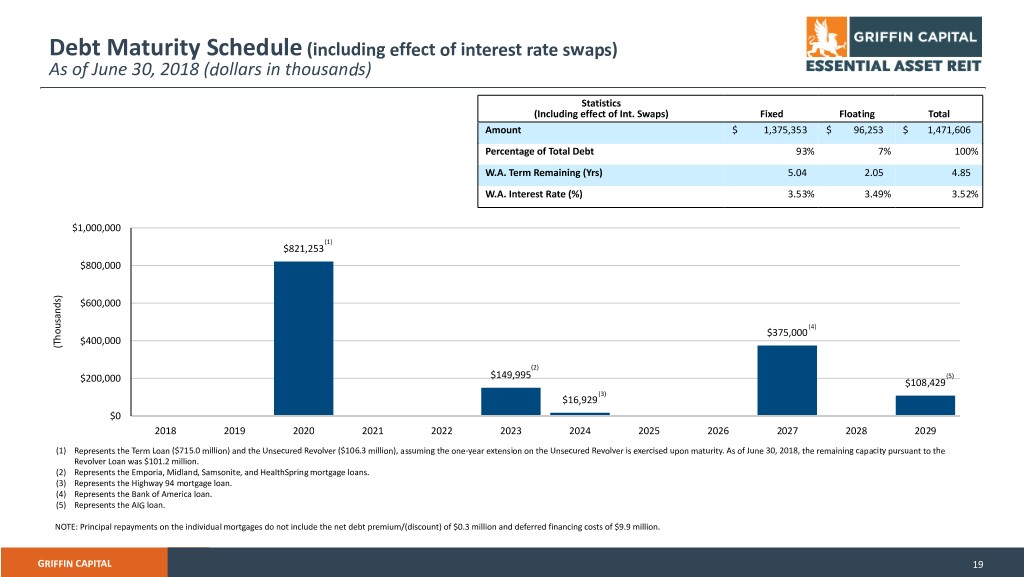
Debt Maturity Schedule (including effect of interest rate swaps) As of June 30, 2018 (dollars in thousands) Statistics (Including effect of Int. Swaps) Fixed Floating Total Amount $ 1,375,353 $ 96,253 $ 1,471,606 Percentage of Total Debt 93% 7% 100% W.A. Term Remaining (Yrs) 5.04 2.05 4.85 W.A. Interest Rate (%) 3.53% 3.49% 3.52% $1,000,000 (1) $821,253 $800,000 ) s d $600,000 n a s u (4) o $375,000 h T $400,000 ( (2) $149,995 (5) $200,000 $108,429 (3) $16,929 $0 2018 2019 2020 2021 2022 2023 2024 2025 2026 2027 2028 2029 (1) Represents the Term Loan ($715.0 million) and the Unsecured Revolver ($106.3 million), assuming the one-year extension on the Unsecured Revolver is exercised upon maturity. As of June 30, 2018, the remaining capacity pursuant to the Revolver Loan was $101.2 million. (2) Represents the Emporia, Midland, Samsonite, and HealthSpring mortgage loans. (3) Represents the Highway 94 mortgage loan. (4) Represents the Bank of America loan. (5) Represents the AIG loan. NOTE: Principal repayments on the individual mortgages do not include the net debt premium/(discount) of $0.3 million and deferred financing costs of $9.9 million. GRIFFIN CAPITAL 19

Preferred Stock Issuance On August 8, 2018, the Company issued $125 million of Series A Cumulative Perpetual Convertible Preferred Stock in a private exempt offering. The closing is the first tranche of a total of $250 million of Perpetual Preferred, the balance of which the Company anticipates will be issued within sixty days. The holders of the Series A Preferred Shares will receive an initial annual distribution of 6.55 percent and the holder(s), at its option, has the right to convert its shares into common stock of the Company any time after five years from the issuance thereof. The Series A Preferred Shares were purchased in their entirety by SHBNPP Global Professional Investment Type Private Real Estate Trust No. 13 (H), a trust sponsored by Hana Financial Investment, the sole bookrunner. The lead investor in the trust is NH Investment & Securities and Shinhan BNP Paribas Asset Management is the trust asset manager. The Company currently intends to leverage the $125 million of preferred equity to purchase approximately $200 million of additional net-leased real estate assets. GRIFFIN CAPITAL 20
