Attached files
| file | filename |
|---|---|
| 8-K - FORM 8-K - Manitex International, Inc. | d597426d8k.htm |
Exhibit 99.1
MANITEX INTERNATIONAL, INC. (NASDAQ: MNTX) Corporate Presentation August 2018
FORWARD-LOOKING STATEMENT & NON-GAAP MEASURES Safe Harbor Statement under the U.S. Private Securities Litigation Reform Act of 1995: This presentation contains statements that are forward-looking in nature which express the beliefs and expectations of management including statements regarding the Company’s expected results of operations or liquidity; statements concerning projections, predictions, expectations, estimates or forecasts as to our business, financial and operational results and future economic performance; and statements of management’s goals and objectives and other similar expressions concerning matters that are not historical facts. In some cases, you can identify forward-looking statements by terminology such as “anticipate,” “estimate,” “plan,” “project,” “continuing,” “ongoing,” “expect,” “webelieve,” “we intend,” “may,” “will,” “should,” “could,” and similar expressions. Such statements are based on current plans, estimatesand expectations and involve a number of known and unknown risks, uncertainties and other factors that could cause the Company’s future results, performance or achievements to differ significantly from the results, performance or achievements expressed or implied by such forward-looking statements. These factors and additional information are discussed in the Company’s filings with the Securities and Exchange Commission and statements in this presentation should be evaluated in light of these important factors. Althoughwe believe that these statements are based upon reasonable assumptions, we cannot guarantee future results. Forward-looking statements speak only as of the date on which they are made, and the Company undertakes no obligation to update publicly or revise any forward-looking statement, whether as a result of new information, future developments or otherwise. Non-GAAP Measures: Manitex International from time to time refers to various non-GAAP (generally accepted accounting principles) financial measures in this presentation. Manitex believes that this information is useful to understanding its operating results without the impact of special items. See Manitex’sQ4 2017 earnings release on the Investor Relations section of our website www.manitexinternational.com for a description and/or reconciliation of these measures. NASDAQ : MNTX 2
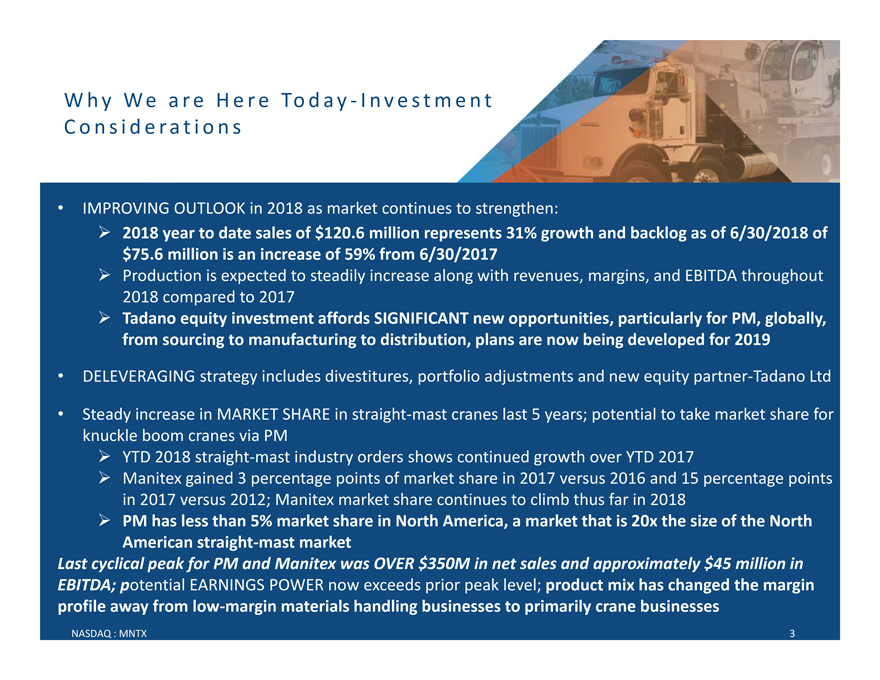
Why We are Here Today-Investment Considerations • IMPROVING OUTLOOK in 2018 as market continues to strengthen: ïƒ~ 2018 year to date sales of $120.6 million represents 31% growth and backlog as of 6/30/2018 of $75.6 million is an increase of 59% from 6/30/2017 ïƒ~ Production is expected to steadily increase along with revenues, margins, and EBITDA throughout 2018 compared to 2017 ïƒ~ Tadano equity investment affords SIGNIFICANT new opportunities, particularly for PM, globally, from sourcing to manufacturing to distribution, plans are now being developed for 2019 • DELEVERAGING strategy includes divestitures, portfolio adjustments and new equity partner-Tadano Ltd • Steady increase in MARKET SHARE in straight-mast cranes last 5 years; potential to take market share for knuckle boom cranes via PM ïƒ~ YTD 2018 straight-mast industry orders shows continued growth over YTD 2017 ïƒ~ Manitexgained 3 percentage points of market share in 2017 versus 2016 and 15 percentage points in 2017 versus 2012; Manitexmarket share continues to climb thus far in 2018 ïƒ~ PM has less than 5% market share in North America, a market that is 20x the size of the North American straight-mast market Last cyclical peak for PM and Manitex was OVER $350M in net sales and approximately $45 million in EBITDA; potential EARNINGS POWER now exceeds prior peak level; product mix has changed the margin profile away from low-margin materials handling businesses to primarily crane businesses NASDAQ : MNTX 3
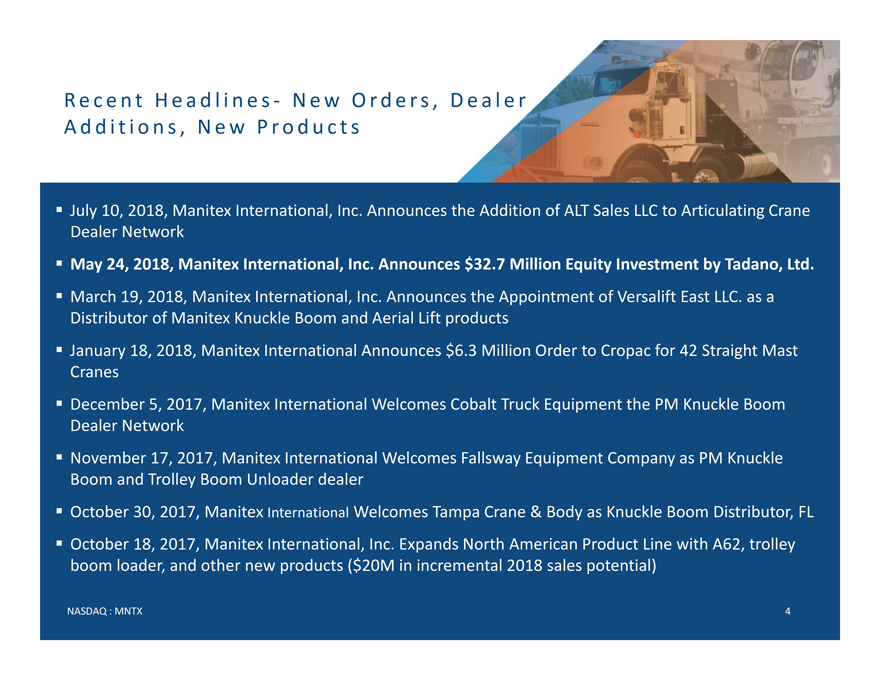
Recent Headlines- New Orders, Dealer Additions, New Products ï,§ July 10, 2018, ManitexInternational, Inc. Announces the Addition of ALT Sales LLC to Articulating Crane Dealer Network ï,§ May 24, 2018, ManitexInternational, Inc. Announces $32.7 Million Equity Investment by Tadano, Ltd. ï,§ March 19, 2018, ManitexInternational, Inc. Announces the Appointment of VersaliftEast LLC. as a Distributor of ManitexKnuckle Boom and Aerial Lift productsï,§ January 18, 2018, ManitexInternational Announces $6.3 Million Order to Cropacfor 42 Straight Mast Cranesï,§ December 5, 2017, ManitexInternational Welcomes Cobalt Truck Equipment the PM Knuckle Boom Dealer Networkï,§ November 17, 2017, ManitexInternational Welcomes FallswayEquipment Company as PM Knuckle Boom and Trolley Boom Unloader dealerï,§ October 30, 2017, Manitex International Welcomes Tampa Crane & Body as Knuckle Boom Distributor, FLï,§ October 18, 2017, Manitex International, Inc. Expands North American Product Line with A62, trolley boom loader, and other new products ($20M in incremental 2018 sales potential) NASDAQ : MNTX 4
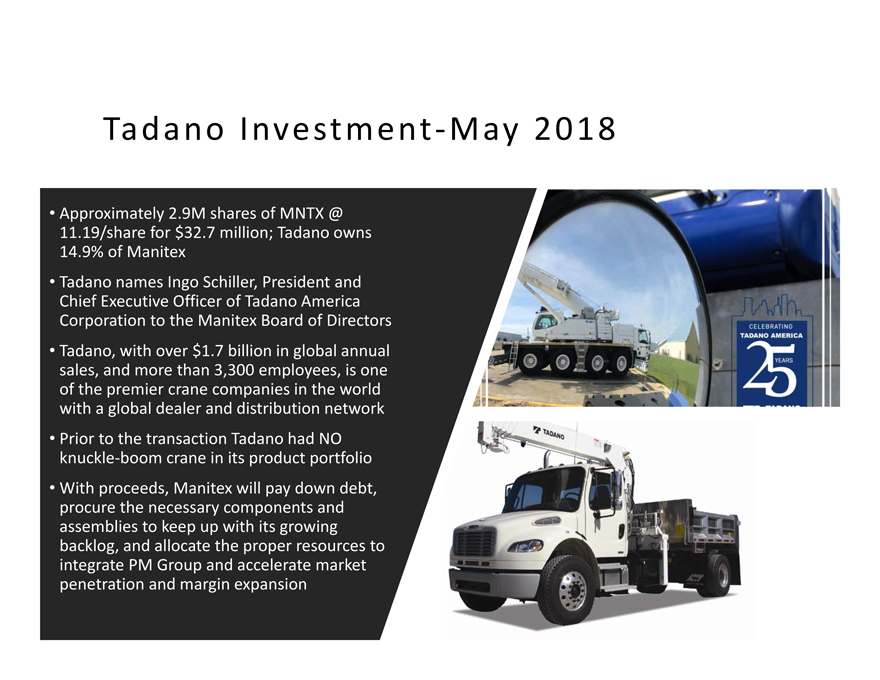
Tadano Investment-May 2018 •Approximately 2.9M shares of MNTX @ 11.19/share for $32.7 million; Tadano owns 14.9% of Manitex •Tadano names Ingo Schiller, President and Chief Executive Officer of Tadano America Corporation to the ManitexBoard of Directors •Tadano, with over $1.7 billion in global annual sales, and more than 3,300 employees, is one of the premier crane companies in the world with a global dealer and distribution network •Prior to the transaction Tadano had NO knuckle-boom crane in its product portfolio •With proceeds, Manitexwill pay down debt, procure the necessary components and assemblies to keep up with its growing backlog, and allocate the proper resources to integrate PM Group and accelerate market penetration and margin expansion NASDAQ : MNTX 5
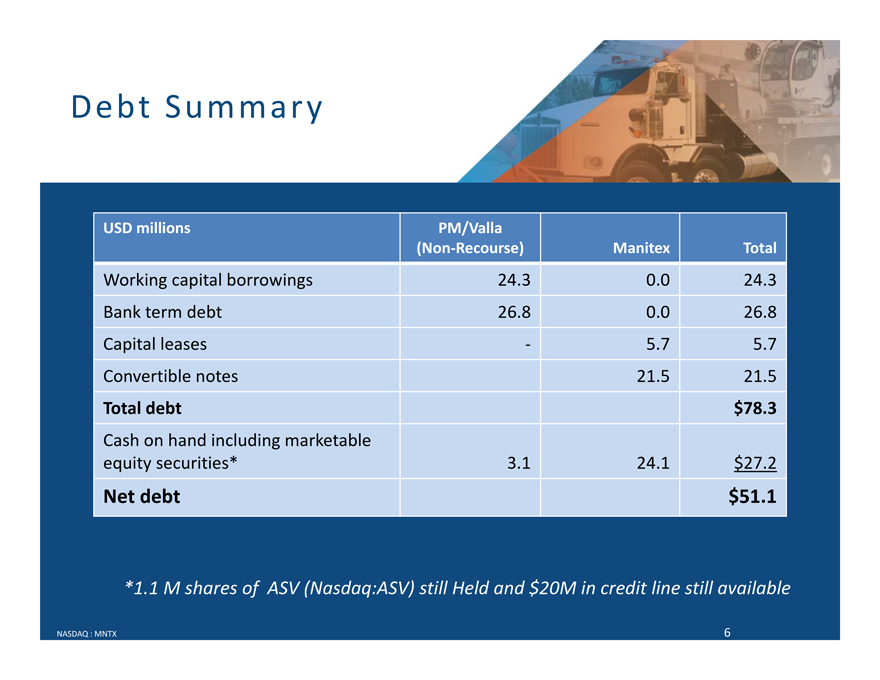
Debt Summary USD millions PM/Valla (Non-Recourse) Manitex Total Working capital borrowings 24.3 0.0 24.3 Bank termdebt 26.8 0.0 26.8 Capital leases—5.7 5.7 Convertible notes 21.5 21.5 Total debt $78.3 Cash on hand including marketable equity securities* 3.1 24.1 $27.2 Net debt $51.1 *1.1 M shares of ASV (Nasdaq:ASV) still Held and $20M in credit line still available NASDAQ : MNTX 6
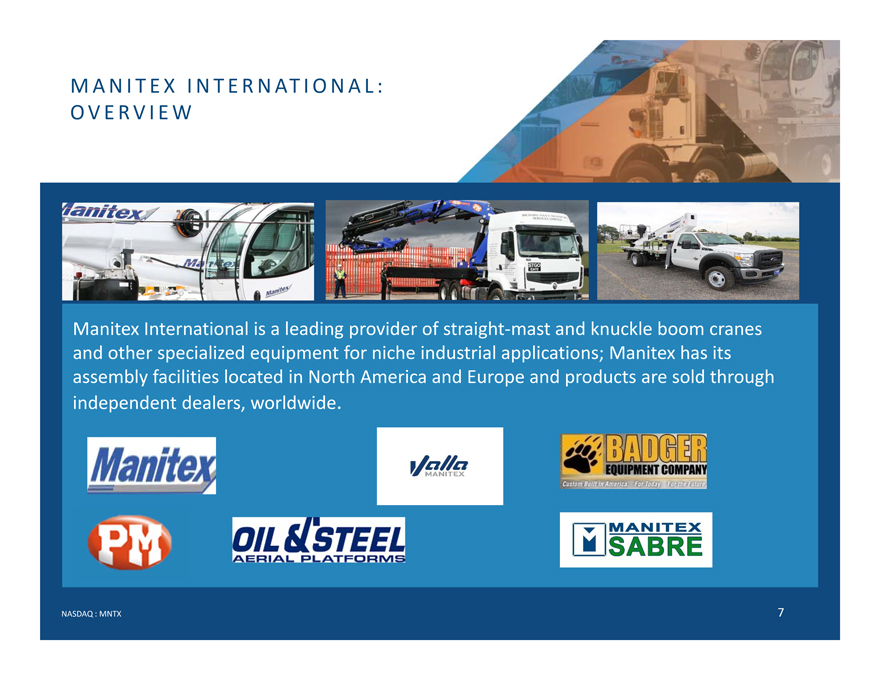
MANITEX INTERNATIONAL: OVERVIEW Manitex International is a leading provider of straight-mast and knuckle boom cranes and other specialized equipment for niche industrial applications; Manitex has its assembly facilities located in North America and Europe and products are sold through independent dealers, worldwide. NASDAQ : MNTX 7
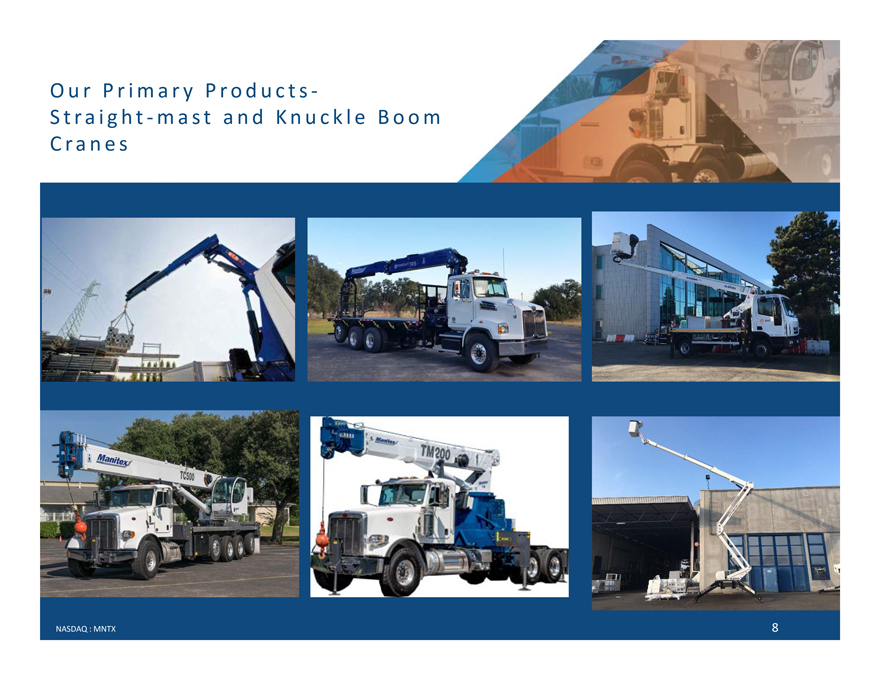
Our Primary Products-Straight-mast and Knuckle Boom Cranes NASDAQ : MNTX 8
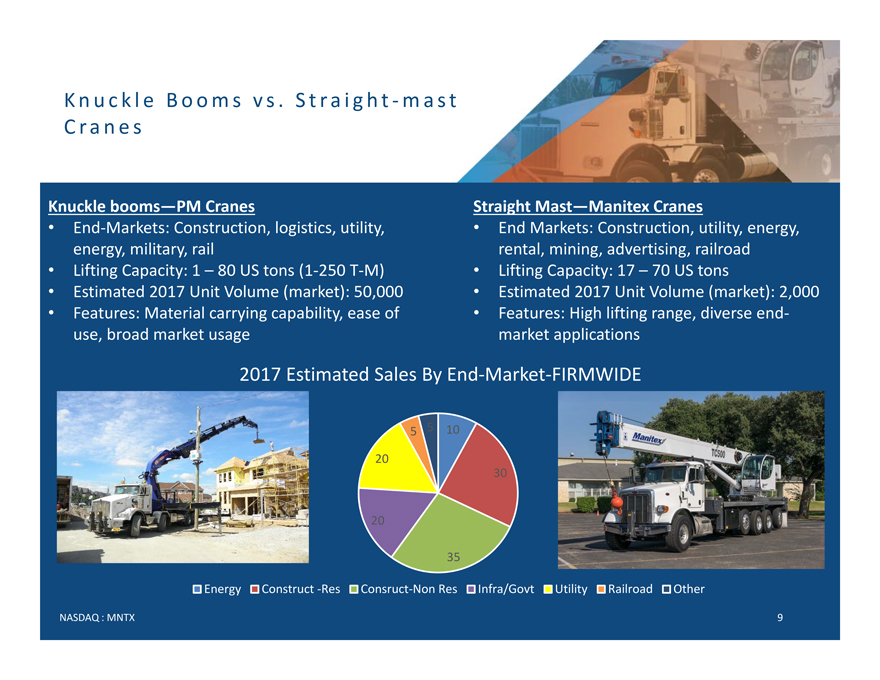
Knuckle Booms vs. Straight-mast Cranes Knuckle booms—PM Cranes Straight Mast—Manitex Cranes • End-Markets: Construction, logistics, utility, • End Markets: Construction, utility, energy, energy, military, rail rental, mining, advertising, railroad • Lifting Capacity: 1 –80 US tons (1-250 T-M) • Lifting Capacity: 17 –70 US tons • Estimated 2017 Unit Volume (market): 50,000 • Estimated 2017 Unit Volume (market): 2,000 • Features: Material carrying capability, ease of • Features: High lifting range, diverse end-use, broad market usage market applications 2017 Estimated Sales By End-Market-FIRMWIDE 5 5 10 20 30 20 35 Energy Construct -Res Consruct-Non Res Infra/Govt Utility Railroad Other NASDAQ : MNTX 9
Sales Increase and Margin Expansion in 2018 and Beyond Sales: • Crane backlog growth should add gradually to Manitex International sales into 2018 • Peak level for remaining businesses* was > $350M (and EBITDA of approx. $45M) * Remaining businesses = Manitex, C&M, Badger, Sabre, Valla, PM and O&S Margin Profile Improves in 2018 from non-crane divestitures with <4% EBITDA margin: • Sales reduction $90M • EBITDA reduction $4M Over $15 million in cost reductions achieved through sourcing and operating efficiency initiatives 2015-2017; additional efficiencies planned for 2018 10%-Plus EBITDA margin goal with continued crane market recovery and execution NASDAQ : MNTX 10
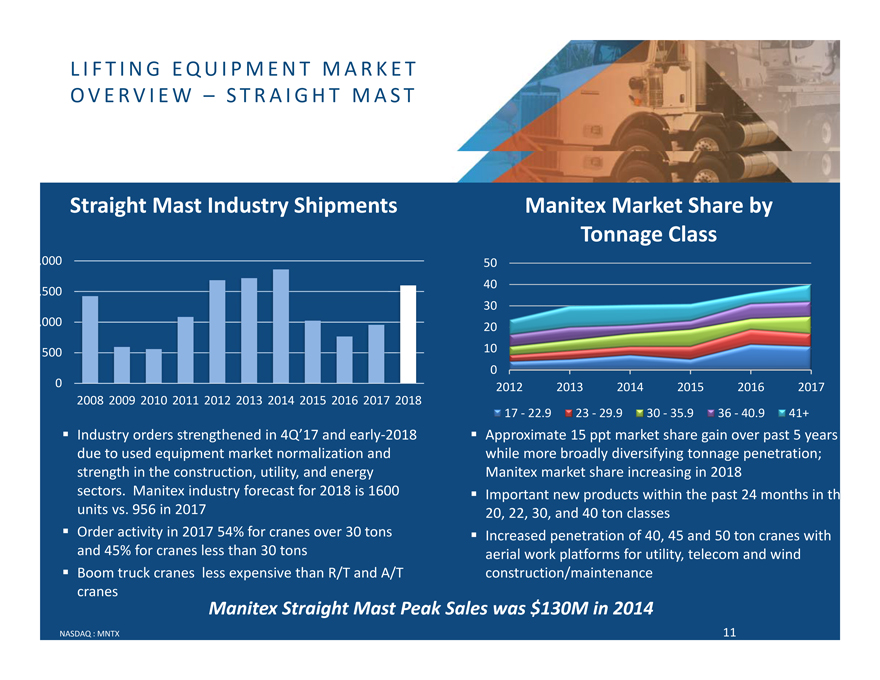
LIFTING EQUIPMENT MARKET OVERVIEW – STRAIGHT MAST Straight Mast Industry Shipments ManitexMarket Share by Tonnage Class ,000 50 40 ,500 30 ,000 20 500 10 0 0 2012 2013 2014 2015 2016 2017 2008 2009 2010 2011 2012 2013 2014 2015 2016 2017 2018 17—22.9 23—29.9 30—35.9 36—40.9 41+ ï,§ Industry orders strengthened in 4Q’17 and early-2018 ï,§ Approximate 15 ppt market share gain over past 5 years due to used equipment market normalization and while more broadly diversifying tonnage penetration; strength in the construction, utility, and energy Manitex market share increasing in 2018 sectors. Manitex industry forecast for 2018 is 1600ï,§ Important new products within the past 24 months in th units vs. 956 in 2017 20, 22, 30, and 40 ton classesï,§ Order activity in 2017 54% for cranes over 30 tonsï,§ Increased penetration of 40, 45 and 50 ton cranes with and 45% for cranes less than 30 tons aerial work platforms for utility, telecom and windï,§ Boom truck cranes less expensive than R/T and A/T construction/maintenance cranes ManitexStraight Mast Peak Sales was $130M in 2014 NASDAQ : MNTX 11
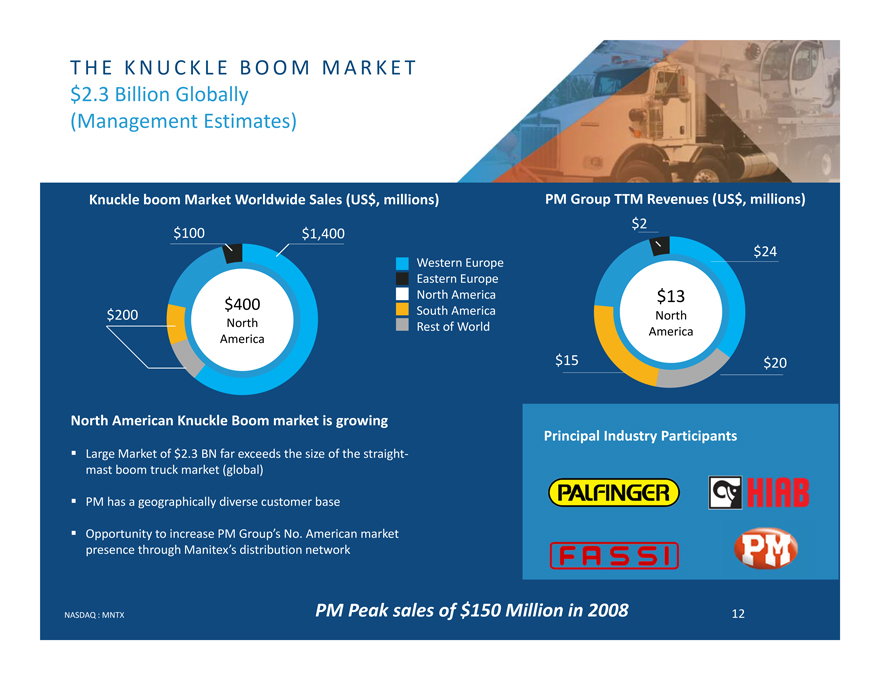
THE KNUCKLE BOOM MARKET $2.3 Billion Globally (Management Estimates) Knuckle boom Market Worldwide Sales (US$, millions) PM Group TTM Revenues (US$, millions) $2 $100 $1,400 Western Europe $24 Eastern Europe North America $13 $400 South America North $200 North Rest of World America America $15 $20 North American Knuckle Boom market is growing Principal Industry Participants ï,§ Large Market of $2.3 BN far exceeds the size of the straight-mast boom truck market (global) ï,§ PM has a geographically diverse customer base ï,§ Opportunity to increase PM Group’s No. American market presence through Manitex’sdistribution network NASDAQ : MNTX PM Peak sales of $150 Million in 2008 12
REPLACEMENTS PARTS&SERVICE Consistent recurring revenue stream throughout the cycle ï,§ Typically generates 10%-20% of net sales in a quarter/yearï,§ Typically carry 2x gross margin of core equipment business Spares relate to swing drives, rotating components, & booms among others, many of which are proprietary ï,§ Serve additional brandsï,§ Service team for crane equipmentï,§ Automated proprietary system implemented in principal operations NASDAQ : MNTX 13
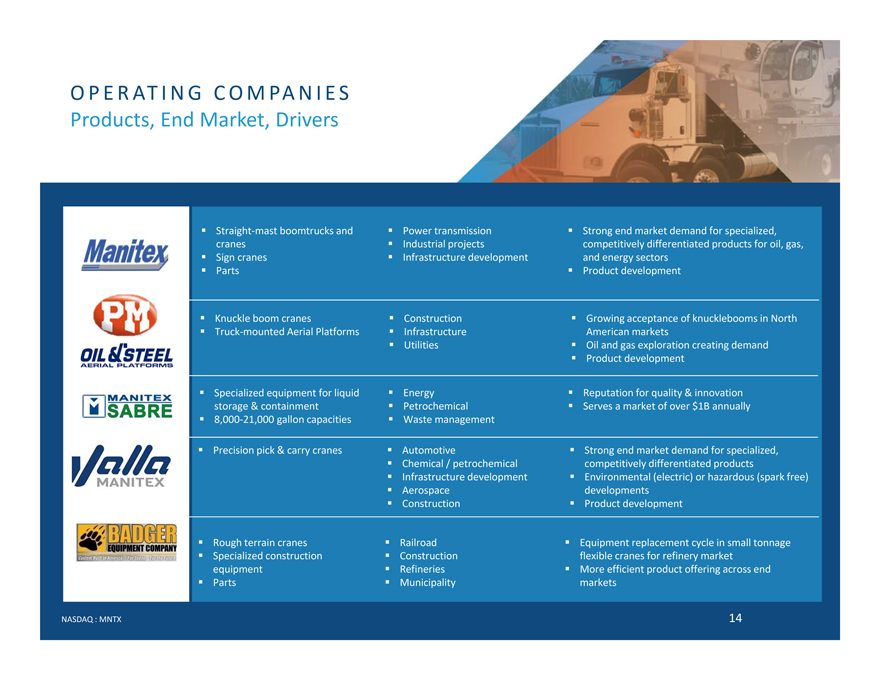
OPERATING COMPANIES Products, End Market, Drivers ï,§ Straight-mast boomtrucksandï,§ Power transmissionï,§ Strong end market demand for specialized, cranesï,§ Industrial projects competitively differentiated products for oil, gas,ï,§ Sign cranesï,§ Infrastructure development and energy sectorsï,§ Partsï,§ Product development ï,§ Knuckle boom cranesï,§ Constructionï,§ Growing acceptance of knuckleboomsin Northï,§ Truck-mounted Aerial Platformsï,§ Infrastructure American marketsï,§ Utilitiesï,§ Oil and gas exploration creating demandï,§ Product development ï,§ Specialized equipment for liquidï,§ Energyï,§ Reputation for quality & innovation storage & containmentï,§ Petrochemicalï,§ Serves a market of over $1B annuallyï,§ 8,000-21,000 gallon capacitiesï,§ Waste management ï,§ Precision pick & carry cranesï,§ Automotiveï,§ Strong end market demand for specialized,ï,§ Chemical / petrochemical competitively differentiated productsï,§ Infrastructure developmentï,§ Environmental (electric) or hazardous (spark free)ï,§ Aerospace developmentsï,§ Constructionï,§ Product development ï,§ Rough terrain cranesï,§ Railroadï,§ Equipment replacement cycle in small tonnageï,§ Specialized constructionï,§ Construction flexible cranes for refinery market equipmentï,§ Refineriesï,§ More efficient product offering across endï,§ Partsï,§ Municipality markets NASDAQ : MNTX 14
EXPERIENCED MANAGEMENT TEAM David Langevin, Chairman & CEO 20+ years principally with Terex Steve Kiefer, President & COO 25+ years principally with Eaton Corp. and Hendrickson International Laura Yu, VP Finance and Corporate Controller 20+ years in senior-level executive corporate finance for public Fortune 500 industrial companies Sherman Jung, Vice President of Financial Reporting 20+ years in financial operations and SEC Reporting Scott Rolston, SVP Strategic Planning 30+ years principally with Manitex and Manitowoc Jim Peterson, Executive Vice President, Operations 35+ years in manufacturing operations Luigi Fucili, CEO PM Group 10+ years principally with PM Group NASDAQ : MNTX 15
MANITEX INTERNATIONAL, INC. FINANCIAL OVERVIEW August 2018
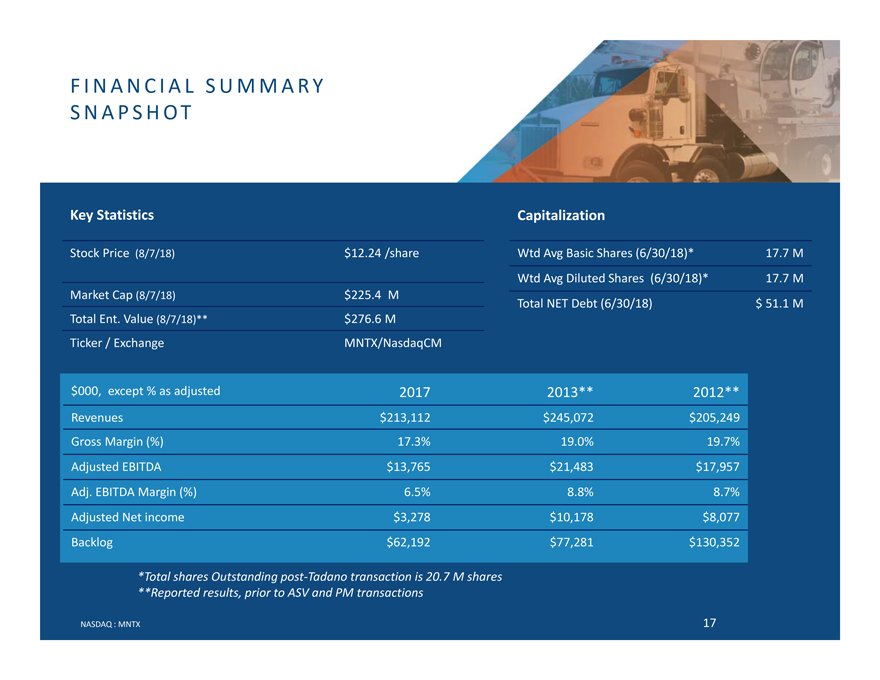
FINANCIAL SUMMARY SNAPSHOT Key Statistics Capitalization Stock Price (8/7/18) $12.24 /share WtdAvg Basic Shares (6/30/18)* 17.7 M WtdAvg Diluted Shares (6/30/18)* 17.7 M Market Cap (8/7/18) $225.4 M Total NET Debt (6/30/18) $ 51.1 M Total Ent. Value (8/7/18)** $276.6 M Ticker / Exchange MNTX/NasdaqCM $000, except % as adjusted 2017 2013** 2012** Revenues $213,112 $245,072 $205,249 Gross Margin (%) 17.3% 19.0% 19.7% Adjusted EBITDA $13,765 $21,483 $17,957 Adj. EBITDA Margin (%) 6.5% 8.8% 8.7% Adjusted Net income $3,278 $10,178 $8,077 Backlog $62,192 $77,281 $130,352 *Total shares Outstanding post-Tadano transaction is 20.7 M shares **Reported results, prior to ASV and PM transactions NASDAQ : MNTX 17
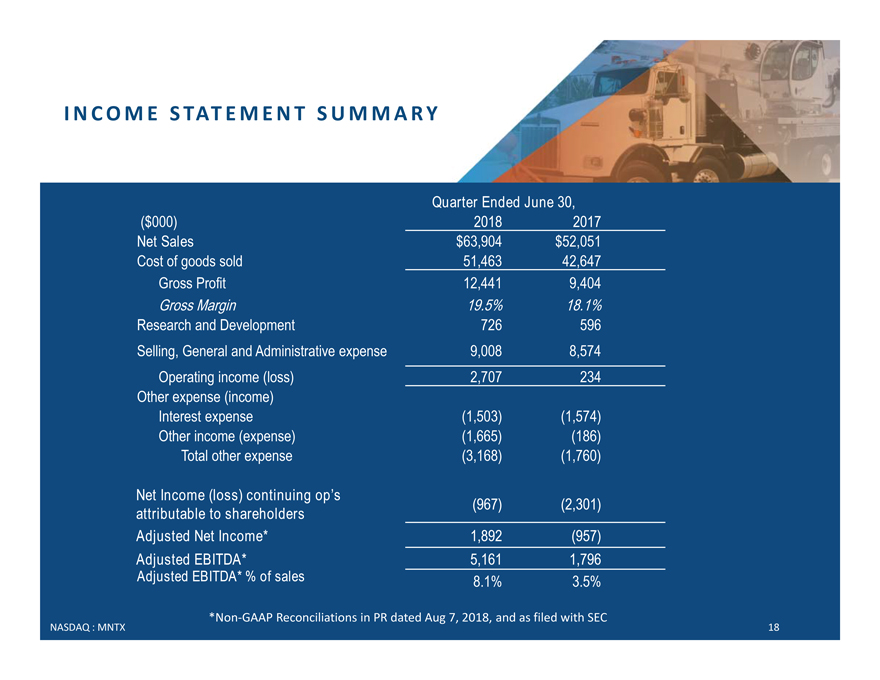
INCOME STATEMENT SUMMARY Quarter Ended June 30, ($000) 2018 2017 Net Sales $63,904 $52,051 Cost of goods sold 51,463 42,647 Gross Profit 12,441 9,404 Gross Margin 19.5% 18.1% Research and Development 726 596 Selling, General and Administrative expense 9,008 8,574 Operating income (loss) 2,707 234 Other expense (income) Interest expense (1,503) (1,574) Other income (expense) (1,665) (186) Total other expense (3,168) (1,760) Net Income (loss) continuing op’s (967) (2,301) attributable to shareholders Adjusted Net Income* 1,892 (957) Adjusted EBITDA* 5,161 1,796 Adjusted EBITDA* % of sales 8.1% 3.5% *Non-GAAP Reconciliations in PR dated Aug 7, 2018, and as filed with SEC NASDAQ : MNTX 18
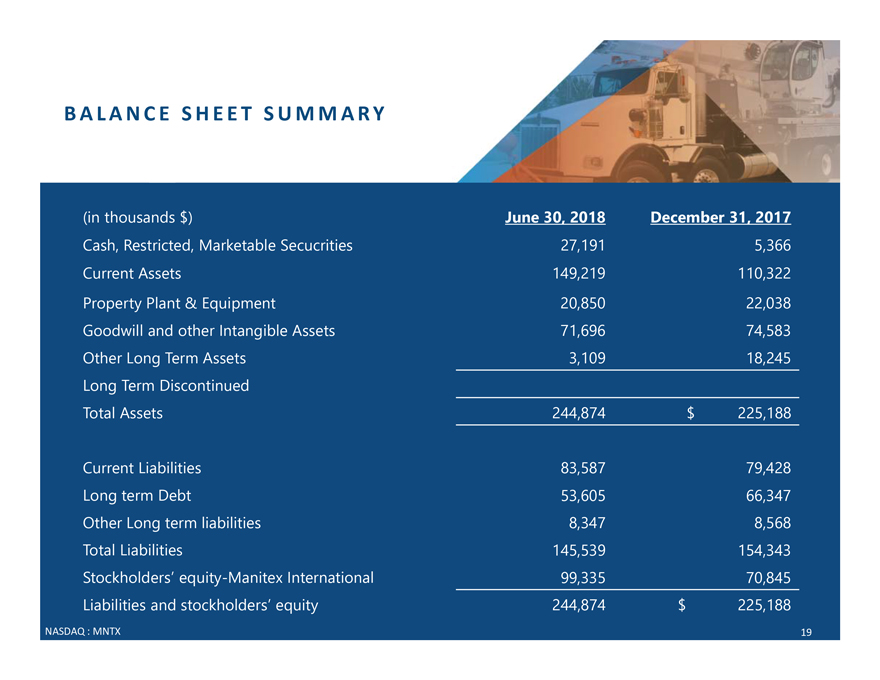
BALANCE SHEET SUMMARY (in thousands $) June 30, 2018 December 31, 2017 Cash, Restricted, Marketable Secucrities 27,191 5,366 Current Assets 149,219 110,322 Property Plant & Equipment 20,850 22,038 Goodwill and other Intangible Assets 71,696 74,583 Other Long Term Assets 3,109 18,245 Long Term Discontinued Total Assets 244,874 $225,188 Current Liabilities 83,587 79,428 Long term Debt 53,605 66,347 Other Long term liabilities 8,347 8,568 Total Liabilities 145,539 154,343 Stockholders’ equity-Manitex International 99,335 70,845 Liabilities and stockholders’ equity 244,874 $225,188
MANITEX INTERNATIONAL, INC. (NASDAQ: MNTX) August 2018 Steve Kiefer, Pres., COO Manitex International 708-237-2065 skiefer@manitex.com Peter Seltzberg, IR Darrow Associates, Inc. 516-419-9915 pseltzberg@darrowir.com