Attached files
| file | filename |
|---|---|
| EX-31.1 - EX-31.1 - Manitex International, Inc. | d854645dex311.htm |
| EX-31.2 - EX-31.2 - Manitex International, Inc. | d854645dex312.htm |
| EX-32.1 - EX-32.1 - Manitex International, Inc. | d854645dex321.htm |
| EX-21.1 - EX-21.1 - Manitex International, Inc. | d854645dex211.htm |
| EX-23.1 - EX-23.1 - Manitex International, Inc. | d854645dex231.htm |
| EXCEL - IDEA: XBRL DOCUMENT - Manitex International, Inc. | Financial_Report.xls |
Table of Contents
UNITED STATES
SECURITIES AND EXCHANGE COMMISSION
Washington, D.C. 20549
FORM 10-K
ANNUAL REPORT
PURSUANT TO SECTION 13 OR 15(d)
OF THE SECURITIES EXCHANGE ACT OF 1934
FOR THE FISCAL YEAR ENDED DECEMBER 31, 2014
Commission File No.: 001-32401
MANITEX INTERNATIONAL, INC.
(Exact name of registrant as specified in its charter)
| Michigan | 42-1628978 | |
| (State of incorporation) | (I.R.S. Employer Identification No.) | |
| 9725 Industrial Drive Bridgeview, Illinois |
60455 | |
| (Address of principal executive offices) | (Zip Code) |
Registrant’s telephone number, including area code: (708) 430-7500
Securities registered pursuant to Section 12(b) of the Act:
| Title of each class |
Name of each exchange on which registered | |
| Common Stock, no par value | The NASDAQ Stock Market LLC | |
| Preferred Share Purchase Rights | The NASDAQ Stock Market LLC |
Securities registered pursuant to Section 12(g) of the Act:
None
Indicate by check mark if the registrant is a well-known seasoned issuer, as defined in Rule 405 of the Securities Act. Yes ¨ No x
Indicate by check mark if the registrant is not required to file reports pursuant to Section 13 or Section 15(d) of the Act. Yes ¨ No x
Indicate by check mark whether the registrant: (1) has filed all reports required to be filed by Section 13 or 15(d) of the Securities Exchange Act of 1934 during the preceding 12 months (or for such shorter period that the registrant was required to file such reports), and (2) has been subject to such filing requirements for the past 90 days. Yes x No ¨
Indicate by check mark whether the registrant has submitted electronically and posted on its corporate Web site, if any, every Interactive Data File required to be submitted and posted pursuant to Rule 405 of Regulation S-T during the preceding 12 months (or for such shorter period that the registrant was required to submit and post such files). Yes x No ¨
Indicate by check mark if disclosure of delinquent filers pursuant to Item 405 of Regulation S-K is not contained herein, and will not be contained, to the best of registrant’s knowledge, in definitive proxy or information statements incorporated by reference in Part III of this Form 10-K or any amendment to this Form 10-K. ¨
Indicate by check mark whether the registrant is a large accelerated filer, an accelerated filer, a non-accelerated filer, or a smaller reporting company. See the definitions of “large accelerated filer”, “accelerated filer” and “smaller reporting company” in Rule 12b-2 of the Exchange Act.
Large Accelerated Filer ¨ Accelerated Filer x Non-Accelerated Filer ¨ Smaller reporting company ¨
Indicate by check mark whether the registrant is a shell company (as defined in Rule 12b-2 of the Act). Yes ¨ No x
The aggregate market value of the shares of common stock, no par value (“Common Stock”), held by non-affiliates of the registrant as of June 30, 2014 was approximately $176 million based upon the closing price for the Common Stock of $16.24 on the NASDAQ Stock Market on such date.
The number of shares of the registrant’s common stock outstanding as of March 11, 2015 was 15,984,177.
DOCUMENTS INCORPORATED BY REFERENCE
Part III of this Annual Report on Form 10-K incorporates by reference information (to the extent specific sections are referred to herein) from the registrant’s Proxy Statement for its 2015 Annual Meeting (the “2015 Proxy Statement”) to be filed with the Commission within 120 days after the end of the fiscal year ended December 31, 2014.
Table of Contents
| 1 | ||||||
| BUSINESS | 2 | |||||
| RISK FACTORS | 15 | |||||
| UNRESOLVED STAFF COMMENTS | 22 | |||||
| PROPERTIES | 22 | |||||
| LEGAL PROCEEDINGS | 22 | |||||
| MINE SAFETY DISCLOSURES | 23 | |||||
| 24 | ||||||
| MARKET FOR REGISTRANT’S COMMON EQUITY, RELATED STOCKHOLDER MATTERS AND ISSUER PURCHASES OF EQUITY SECURITIES | 24 | |||||
| SELECTED FINANCIAL DATA | 26 | |||||
| MANAGEMENT’S DISCUSSION AND ANALYSIS OF FINANCIAL CONDITION AND RESULTS OF OPERATIONS | 26 | |||||
| QUANTITATIVE AND QUALITATIVE DISCLOSURES ABOUT MARKET RISK | 45 | |||||
| FINANCIAL STATEMENTS AND SUPPLEMENTARY DATA | 46 | |||||
| CHANGES IN AND DISAGREEMENTS WITH ACCOUNTANTS ON ACCOUNTING AND FINANCIAL DISCLOSURE | 100 | |||||
| CONTROLS AND PROCEDURES | 100 | |||||
| OTHER INFORMATION | 101 | |||||
| 101 | ||||||
| DIRECTORS, EXECUTIVE OFFICERS AND CORPORATE GOVERNANCE | 101 | |||||
| EXECUTIVE COMPENSATION | 102 | |||||
| SECURITY OWNERSHIP OF CERTAIN BENEFICIAL OWNERS AND MANAGEMENT AND RELATED STOCKHOLDER MATTERS | 102 | |||||
| CERTAIN RELATIONSHIPS AND RELATED TRANSACTIONS, AND DIRECTOR INDEPENDENCE | 102 | |||||
| PRINCIPAL ACCOUNTANT FEES AND SERVICES | 102 | |||||
| 102 | ||||||
| EXHIBITS, AND FINANCIAL STATEMENT SCHEDULES | 102 | |||||
| 103 | ||||||
i
Table of Contents
References to the “Company,” “we,” “our” and “us” refer to Manitex International, Inc., together in each case with our subsidiaries and any predecessor entities unless the context suggests otherwise.
Forward-Looking Statements
When reading this section of this Annual Report on Form 10-K, it is important that you also read the financial statements and related notes thereto. This Annual Report on Form 10-K and certain information incorporated herein by reference contain forward-looking statements within the “safe harbor” provisions of the Private Securities Litigation Reform Act of 1995. All statements contained in this Annual Report on Form 10-K, other than statements that are purely historical, are forward-looking statements and are based upon management’s present expectations, objectives, anticipations, plans, hopes, beliefs, intentions or strategies regarding the future. We use words such as “anticipate,” “estimate,” “plan,” “project,” “continuing,” “ongoing,” “expect,” “believe,” “intend,” “may,” “will,” “should,” “could,” and similar expressions to identify forward-looking statements. Forward-looking statements in this Annual Report on Form 10-K include, without limitation: (1) projections of revenue, earnings, capital structure and other financial items, (2) statements of our plans and objectives, (3) statements regarding the capabilities and capacities of our business operations, (4) statements of expected future economic conditions and the effect on us and on our customers, (5) expected benefits of our cost reduction measures, and (6) assumptions underlying statements regarding us or our business. Our actual results may differ from information contained in these forward looking-statements for many reasons, including those described below and in the section entitled “Item 1A. Risk Factors”:
| (1) | a future substantial deterioration in economic conditions, especially in the United States and Europe; |
| (2) | our customers’ diminished liquidity and credit availability; |
| (3) | difficulties in implementing new systems, integrating acquired businesses, managing anticipated growth, and responding to technological change; |
| (4) | our ability to negotiate extensions of our credit agreements and to obtain additional debt or equity financing when needed. |
| (5) | the cyclical nature of the markets we operate in; |
| (6) | increases in interest rates; |
| (7) | government spending; fluctuations in the construction industry, and capital expenditures in the oil and gas industry; |
| (8) | the performance of our competitors; |
| (9) | shortages in supplies and raw materials or the increase in costs of materials; |
| (10) | our level of indebtedness and our ability to meet financial covenants required by our debt agreements; |
| (11) | product liability claims, intellectual property claims, and other liabilities; |
| (12) | the volatility of our stock price; |
| (13) | future sales of our common stock; |
| (14) | the willingness of our stockholders and directors to approve mergers, acquisitions, and other business transactions; |
| (15) | currency transaction (foreign exchange) risks and the risk related to forward currency contracts; |
| (16) | certain provisions of the Michigan Business Corporation Act and the Company’s Articles of Incorporation, as amended, Amended and Restated Bylaws, and the Company’s Preferred Stock Purchase Rights may discourage or prevent a change in control of the Company; |
1
Table of Contents
| (17) | a substantial portion of our revenues are attributed to limited number of customers which may decrease or cease purchasing any time; and |
| (18) | a disruption or breach in our information technology systems. |
The risks described in our Annual Report on Form 10-K are not the only risks facing our Company. Additional risks and uncertainties not currently known to us or that we currently deem to be immaterial also may materially adversely affect our business, financial condition or operating results. We do not undertake, and expressly disclaim, any obligation to update this forward-looking information, except as required under applicable law.
| ITEM 1. | BUSINESS |
Our Business
The Company is a leading provider of engineered specialty lifting and loading products. The Company operates in three business segments: the Lifting Equipment segment, the ASV segment and the Equipment Distribution segment.
Lifting Equipment Segment
The Company is a leading provider of engineered lifting solutions. The Company designs, manufactures and distributes a diverse group of products that serve different functions and are used in a variety of industries. Through its Manitex, Inc. subsidiary it markets a comprehensive line of boom trucks, truck cranes and sign cranes. Manitex’s boom trucks and crane products are primarily used for industrial projects, energy exploration and infrastructure development, including, roads, bridges and commercial construction.
CVS Ferrari, srl (“CVS”) designs and manufactures a range of reach stackers and associated lifting equipment for the global container handling market that are sold through a broad dealer network. On November 30, 2013, CVS acquired the assets of Valla SpA (“Valla”) located in Piacenza, Italy. Valla offers a full range of precision pick and carry cranes from 2 to 90 tons, using electric, diesel, and hybrid power options. Its cranes offer wheeled or tracked, and fixed or swing boom configurations, with special applications designed specifically to meet the needs of its customers.
Manitex Liftking ULC (“Manitex Liftking” or “Liftking”) sells a complete line of rough terrain forklifts, a line of stand-up electric forklifts, cushioned tired forklifts with lifting capacities from 18 thousand to 40 thousand pounds, and special mission oriented vehicles, as well as other specialized carriers, heavy material handling transporters and steel mill equipment. Manitex Liftking’s rough terrain forklifts are used in both commercial and military applications. Specialty mission oriented vehicles and specialized carriers are designed and built to meet the Company’s unique customer needs and requirements. The Company’s specialized lifting equipment has met the particular needs of customers in various industries that include the utility, ship building and steel mill industries.
Badger Equipment Company (“Badger”) is a manufacturer of specialized rough terrain cranes and material handling products. Badger primarily serves the needs of the construction, municipality, and railroad industries.
Manitex Load King, Inc. (“Load King”) manufactures specialized custom trailers and hauling systems typically used for transporting heavy equipment. Load King trailers serve niche markets in the commercial construction, railroad, military, and equipment rental industries through a dealer network.
Manitex Sabre, Inc. (“Sabre”), which is located in Knox, Indiana, manufactures a comprehensive line of specialized mobile tanks for liquid and solid storage and containment solutions with capacities from 8,000 to 21,000 gallons. Its mobile tanks are sold to specialized independent tank rental companies and through the Company’s existing dealer network. The tanks are used in a variety of end markets such as petrochemical, waste management and oil and gas drilling.
2
Table of Contents
In January of 2015, The Company acquired PM Group S.p.A. (“PM”) which is based in San Cesario sul Panaro, Modena, Italy. PM is a leading Italian manufacturer of truck mounted hydraulic knuckle boom cranes with a 50-year history of technology and innovation, and a product range spanning more than 50 models. Its largest subsidiary, Oil & Steel (“O&S”), is a manufacturer of truck-mounted aerial platforms with a diverse product line and an international client base. Combined, O&S and PM occupy 510,000 square feet of assembly and manufacturing space, spread between its two locations in San Cesario S/P, Modena, and in Arad, Romania, and sell to a broad, worldwide dealer network. Since this acquisition occurred after December 31, 2014, PM’s financial statements are not incorporated into the Company’s consolidated financial statements for the year ending December 31, 2014. Nonetheless, the foregoing description of PM is included to provide a complete description of the Company’s business as it currently exists.
ASV Segment
On December 19, 2014, the Company acquired 51% of A.S.V., Inc. from Terex Corporation (“Terex”). In connection with the acquisition, ASV was converted to an LLC and its name was changed to A.S.V., LLC (ASV). ASV located in Grand Rapids, Minnesota manufactures a line of high quality compact rubber tracked and skid steer loaders. The ASV products will be distributed through the Terex distribution channels as well as through Manitex and other independent dealers. The products are used in the site clearing, general construction, forestry, golf course maintenance and landscaping industries, with general construction being the largest market.
ASV’s financial results are included in the Company’s consolidated results beginning on December 20, 2014.
Equipment Distribution Segment
The Equipment Distribution segment comprises the operations of Crane & Machinery (“C&M”), a division of Manitex International. The segment markets products used primarily for infrastructure development and commercial construction applications that include road and bridge construction, general contracting, roofing, scrap handling and sign construction and maintenance. C&M is a distributor of Terex rough terrain and truck cranes, and supplies repair parts for a wide variety of medium to heavy duty construction equipment and sells domestically and internationally, predominately to end users, including the rental market. It also provides crane equipment repair services in the Chicago area. C&M uses the trade name North American Equipment Exchange to market previously-owned construction and heavy equipment, both domestically and internationally and provides a wide range of used lifting and construction equipment of various ages and condition. It also has the capability to refurbish equipment to the customers’ specification. C&M also operates as the North American sales organization for our Italian based PM knuckle boom cranes and Valla pick and carry crane products.
Recent Acquisitions
On January 15, 2015, the Company acquired PM Group S.p.A. (“PM”) which is based in San Cesario sul Panaro, Modena, Italy. PM is a leading Italian manufacturer of truck mounted hydraulic knuckle boom cranes with a 50-year history of technology and innovation, and a product range spanning more than 50 models. Its largest subsidiary, Oil & Steel, (“O&S”), is a manufacturer of truck-mounted aerial platforms with a diverse product line and an international client base. Combined, O&S and PM occupy 510,000 square feet of assembly and manufacturing space, spread between its two locations in San Cesario S/P, Modena, and in Arad, Romania, and sell to a broad, worldwide dealer network. Since this acquisition occurred after December 31, 2014, PM’s financial statements are not incorporated into the Company’s consolidated financial statements for the year ending December 31, 2014.
On December 19, 2014 the Company completed an agreement with Terex and has become the majority owner of ASV, which is located in Grand Rapids, Minnesota. As a result of the transaction, the Company owns 51% of ASV and Terex owns 49% of ASV. ASV’s financial results are included in the consolidated results beginning on December 20, 2014. ASV manufactures and sells a line of high quality compact rubber track and skid steer loaders.
3
Table of Contents
On December 16, 2014, the Company, BGI USA Inc. (“BGI”), Movedesign SRL and R & S Advisory S.r.l., entered into an operating agreement (the “Operating Agreement”) for Lift Ventures LLC (“Lift Ventures”), a joint venture entity. The purposes for which Lift Ventures is organized are the manufacturing and selling of certain products and components, including the Schaeff line of electric forklifts and certain LiftKing products. Pursuant to the Operating Agreement, the Company was granted a 25% equity stake in the Lift Ventures in exchange for the contribution of certain inventory and a license of certain intellectual property related to the Company’s products.
On November 30, 2013, CVS Ferrari Srl., an Italian corporation and a wholly subsidiary of Manitex International, Inc., purchased the assets of Valla SpA. Valla develops mobile cranes from 2 to 90 tons, using electric, diesel and hybrid power options. Its cranes offer wheeled or tracked, fixed or swing boom configurations, with special applications designed specifically to meet the needs of its customers.
On August 19, 2013, Manitex Sabre, Inc. (“Sabre”) acquired the assets of Sabre Manufacturing, LLC, which is located in Knox, Indiana. Sabre manufactures a comprehensive line of specialized mobile tanks for liquid and solid storage and containment solutions with capacities from 8,000 to 21,000 gallons. Its mobile tanks will be sold to specialized independent tank rental companies and through the Company’s existing dealer network. The tanks are used in a variety of end markets such as petrochemical, waste management and oil and gas drilling.
General Corporate Information
The Company’s principal executive offices are located at 9725 Industrial Drive, Bridgeview, Illinois 60455 and our telephone number is (708) 430-7500. The Company’s website address is www.manitexinternational.com. Information contained on our website is not incorporated by reference into this report and such information should not be considered to be part of this report.
4
Table of Contents
FINANCIAL INFORMATION ABOUT BUSINESS SEGMENTS
The following is financial information about our Lifting Equipment, ASV and Equipment Distribution segments for the years ending December 31, 2014, 2013 and 2012. The accounting policies of the segments are the same as those described in the summary of significant accounting policies in the Notes to the Consolidated Financial Statements included in Item 8 of this Form 10-K, except corporate expenses are not allocated to segments. The Company evaluates segment performance based upon operating income before corporate expenses. Amounts shown are in thousands of dollars.
(in Thousands)
| AS OF OR FOR THE YEARS ENDED DECEMBER 31, |
||||||||||||
| 2014 | 2013 | 2012 | ||||||||||
| Revenues: |
||||||||||||
| Lifting Equipment |
$ | 245,435 | $ | 228,772 | $ | 188,792 | ||||||
| ASV |
2,264 | — | — | |||||||||
| Equipment Distribution |
21,104 | 16,951 | 17,090 | |||||||||
| Inter-segment Eliminations |
(4,722 | ) | (651 | ) | (633 | ) | ||||||
|
|
|
|
|
|
|
|||||||
| Total |
$ | 264,081 | $ | 245,072 | $ | 205,249 | ||||||
|
|
|
|
|
|
|
|||||||
| Operating income: |
||||||||||||
| Lifting Equipment |
$ | 21,640 | $ | 23,311 | $ | 19,880 | ||||||
| ASV |
(121 | ) | — | — | ||||||||
| Equipment Distribution |
374 | 628 | 222 | |||||||||
| Corporate expense |
(7,968 | ) | (6,391 | ) | (5,613 | ) | ||||||
| Elimination of inter-segment profit in inventory |
11 | (10 | ) | (30 | ) | |||||||
|
|
|
|
|
|
|
|||||||
| Total |
$ | 13,936 | $ | 17,538 | $ | 14,459 | ||||||
|
|
|
|
|
|
|
|||||||
| Total assets: |
||||||||||||
| Lifting Equipment |
$ | 172,306 | $ | 170,692 | $ | 143,749 | ||||||
| ASV |
126,547 | — | — | |||||||||
| Equipment Distribution |
15,634 | 10,847 | 7,562 | |||||||||
| Corporate |
1,636 | 1,075 | 193 | |||||||||
|
|
|
|
|
|
|
|||||||
| Total |
$ | 316,123 | $ | 182,614 | $ | 151,504 | ||||||
|
|
|
|
|
|
|
|||||||
Lifting Equipment Segment
Boom Trucks
A boom truck is a straight telescopic boom crane outfitted with a hook and winch which is mounted on a standard flatbed commercial (Class 7 or 8) truck chassis. Relative to other lifting equipment, boom trucks provide increased versatility and are capable of transporting relatively large payloads from site to site at highway speeds. A boom truck is usually sold with outriggers, pads and devices for reinforcing the chassis in order to improve safety and stability. Although produced in a wide range of models and sizes, boom trucks can be broadly distinguished by their normal lifting capability as light, medium, and heavy-cranes. Various models of medium or heavy-lift boom trucks can safely lift loads from 15 to 70 tons and operating radii can exceed 200 feet. Another advantage of the boom truck is the ability to provide occasional man lift capabilities at a very low cost to height ratio. While it is not uncommon to see a very old boom truck, most replacement cycles seem to trend to seven years. The market for boom trucks has historically been cyclical.
Although the Company offers a complete line of boom trucks from light to heavy capacity cranes much of our efforts have been devoted to the development of higher capacity boom trucks specifically designed to meet the
5
Table of Contents
particular needs of customers including those in energy production and power distribution. We believe it is an advantage to be skewed towards the heavier lifting capacity, since the heavier capacity cranes have somewhat higher margins.
Markets that drive demand for boom trucks include power distribution, oil and gas recovery, infrastructure and new home, commercial and industrial construction. The new home construction market, which uses lower capacity cranes, is probably the most cyclical. We believe that oil and gas extraction and power distribution offer the best chance for long-term growth and are markets where the Manitex subsidiary’s products are well represented.
The Company sells its boom trucks through a network of over forty full service dealers in the United States, Canada, Mexico, South America, and the Middle East. A number of our dealers maintain a rental fleet of their own. Boom trucks can be rented for either short or long-term periods.
In 2011, the overall market for boom trucks strengthened considerably. It was, however, still considerably below previous market peaks. In 2011, the Company unit sales increased approximately 60%. The Company believes its 2011 percent unit sales growth is lower than the overall industry growth in 2011. Much of the industry’s unit sales growth occurred in the lower lifting capacity boom truck segment, a market segment where we traditionally have our lowest market share.
In 2012, the market for boom trucks again showed considerable improvement with total industry unit sales approaching pre-2008 levels. The market dynamics are, however, considerably different than they previously were. Much of the current demand is being driven by niche market sectors, i.e., oil and gas exploration and power line construction. The demand from the general construction market although slowly improving is still not approaching pre-2008 levels. The Company’s boom truck unit sales for 2012 increased by approximately 65% as compared to the prior year. The increase in unit sales reflects the Company’s strategic initiatives which have emphasized the development of boom trucks with higher lifting capacities that target the oil and gas and power line distribution market segments.
In 2013, the overall market for boom truck was marginally down from the prior year. However, revenues generated from boom truck sales by the Company increased by approximately 30% in 2013. Accordingly, the Company’s market share was also up. The revenue increase is principally attributed to an increase in production capacity. This increase in capacity allowed us to reduce the backlog that existed at December 31, 2012 and to more aggressively promote the sale of our lower tonnage cranes. A significant portion of the December 2012 backlog was for higher tonnage cranes used in niche market segments particularly the North American energy sector. During the current year, there has been a softening in the demand for our products which are related to the energy sector. The Company believes the decrease in demand during 2013 from the energy sector is temporary, and that the North American energy sector will continue to grow and, in turn, will drive future demand for our products. In 2014, the Company has seen orders for cranes with higher lifting capacities that serve niche markets, including the North American energy sector slowdown from prior years largely as a result of the fall in oil prices. Demand for smaller capacity cranes did however increase reflecting the continued growth of general construction activity in North America. The Company believes the slowdown in demand from the oil and gas sector is temporary.
Sign Cranes
A sign crane is similar to a boom truck in that it is a straight telescopic boom crane mounted on a commercially available chassis, but has a man-basket attached to the end of the boom. Three companies control the large majority of the business and each possesses several hundred units in its fleet. Sales to any of these three customers are performed on a direct basis and not through a dealer network. Currently, the Company has no contracts to supply sign cranes to any of these three companies. Instead, the Company offers its sign cranes through a network of dealers who sell to family run and smaller sized businesses.
6
Table of Contents
The market for sign cranes is small and has been depressed the last several years as both large and small customers have been deferring the purchase of sign cranes. The Company expects the market for sign cranes to gradually improve if general economic conditions continue on a positive trajectory. The Company has not generated significant revenues from the sale of sign cranes in the last 3 years. Even if the Company were to obtain a contract to supply sign cranes to one of the three large customers, it would still only have a modest impact on future revenues.
Industrial Cranes and Forklifts
Our subsidiary, Badger, sells specialized industrial cranes through a network of dealers. The Badger product line includes lattice cranes with 20 to 30 ton lifting capacity marketed under the Little Giant trade name, and specialized 15 and 30 ton industrial cranes sold under the Badger and Manitex names. The 30 ton industrial crane was launched in 2009 and was the first in a new line of specialized high quality industrial cranes. During the fourth quarter of 2012, Badger expanded the product line by launching a 15 ton rough terrain crane which is also sold under the Badger and Manitex name.
The Little Giant line has five lattice boom models, three of which are dedicated rail cranes. In addition to the rail cranes, Badger sells a 30 ton truck crane and a 25 ton crawler crane. Although Badger end customers include states and municipalities, our sales are predominately to railroads. The Company has an advantage over its competitors in selling to railroads as it is the only crane manufacturer that has integrated the installation of rail gear into its production process. Competitors send their cranes to a third party to have rail gear added which both increases cost and delays deliveries.
Badger continues to work on broadening the market for the crane to include non-railroad applications. The Company’s effort to broaden its customer base has been hampered by weak demand from several potential customer bases due to general economic conditions. Nevertheless, Badger has been successful in selling a number of cranes which are being used in non-railroad applications. Our efforts to expand the customer base are continuing and we expect that in the future significant revenues from non-railroad customers can be generated. These revenues are expected to come from states, municipalities, mining and oil refineries.
Our Valla product line of industrial cranes is a full range of precision pick and carry cranes from 2 to 90 tons, using electric, diesel, and hybrid power options. Its cranes offer wheeled or tracked, and fixed or swing boom configurations, with special applications designed specifically to meet the needs of its customers. The product is sold internationally through dealers and into the rental distribution channel.
The Lowry range of cushion tired forklifts have capacities from 18,000 pounds to 45,000 pounds and are powered by propane or diesel clean burn engines. Designed with a low profile and compact footprint they serve industrial customers’requirements and are also sold through a dealer network.
Specialized Highly Engineered Trailers
Load King designs and sells build-to-order specialized, highly engineered low-bed, heavy-haul, bottom-dump, and platform trailers and hauling systems. The trailers, except for the bottom-dump, are typically used for transporting heavy equipment. Additionally, Load King has recently launched a trailer refurbishment service. Our trailers are utilized by commercial construction firms, equipment rental companies, oil field service companies, the railroad industry, the U.S. military, the mining industry and other end users to safely and efficiently haul specialized equipment. The Company routinely customizes its trailers and/or innovates new features to address specific customer, end-market or application needs. Manitex Load King markets its products through a network of dealers.
Rough Terrain Forklifts
Manitex Liftking manufactures a complete range of straight mast forklifts with capacities from 6,000 to 50,000 lbs. and lift heights from 10 to 32 feet. All Manitex Liftking straight mast forklifts feature exceptional ground
7
Table of Contents
clearance, easy access to service points, ergonomic controls and easy operation. The Company also produces a series of tag along forklifts that mount to trucks with lifting capacity ranging from 4,000 to 6,000 pounds. These mounted forklifts are ideal for bricklaying, landscaping, construction or any other application that requires a forklift to tag along. The forklifts feature an easy to mount system, which allows an operator to securely mount or dismount the forklift quickly.
Manitex Liftking forklifts include four rough terrain forklifts, in several configurations, which are sold under the Noble trade name. The Noble product line was originally designed and marketed by Caterpillar in 1983 and subsequently sold through Eagle Pitcher’s dealers. Noble has a reputation for providing durable, innovative and high quality products, and as a result, the Noble product has benefited from very strong distribution, and has a large installed base giving rise to a healthy after-market parts business. The Noble rough terrain forklifts are currently distributed through the Caterpillar dealer network.
The Company sells its rough terrain forklifts through a network of approximately fifty dealers in the United States and Canada.
Military Forklifts
Manitex Liftking military forklifts are used worldwide during both periods of conflict and peace. Manitex Liftking military units are working for national militaries including the United States, Canada, and Britain. The Company’s exported military products (including products sold to the U.S.) are sold through the Canadian Commercial Corporation which has direct contracts with various foreign (outside of Canada) government agencies. The U.S. Department of Defense alone has hundreds of Manitex Liftking vehicles in the Navy, Army and Air Force that they depend on daily. These vehicles range from small shipboard approved forklifts to the biggest articulating, rough-terrain forklift in the world.
Manitex Liftking military forklifts have innovative features that allow them to meet strict military standards and perform in almost any terrain. These features include the patented hydraulically removable counterweight that permits aircraft transportability of the forklift without exceeding the load limits of the aircraft. The water fording capability of some Manitex Liftking vehicles allow continuous operation in water depths of up to 5 feet (1.5 meters), providing true all-terrain operation. The Company believes that these features have helped position Manitex Liftking as the product of choice for rough terrain military forklifts.
All of Manitex Liftking’s shipboard approved vehicles are structurally engineered to withstand a depth charge explosion while on an aircraft carrier, and still be fully operational. The detachable mast and 2-piece operator’s cab on some of Manitex Liftking’s bigger vehicles allow easy disassembly to satisfy height restrictions while being transported by road or rail. Attachments such as fork rollers and standard ISO container handlers further increase the versatility of a Manitex Liftking forklift.
Manitex Liftking’s forklifts are built to exacting military standards including compliance with the quality controls required by ISO 9001-2008. Before being shipped each machine is thoroughly tested on a military approved endurance track located adjacent to Manitex Liftking’s military vehicle manufacturing plant. There are a limited number of test tracks in North America, and having a military approved test track is an advantage.
The timing of customer orders can be expected to result in fluctuations in revenues from period to period. The expected fluctuations, however, are not as dependent on general economic conditions as is our commercial business.
Mission Oriented Vehicles and Specialized Carriers
Special mission oriented vehicles and specialized carriers are designed and built to meet the Company’s unique customer needs and requirements. The Company’s specialized lifting equipment has met the particular needs of
8
Table of Contents
customers in various industries including utility, ship building and steel mill industries. Mission oriented vehicles and specialized carriers are sold directly to the end users.
Transporters, used in ship building, are one example of a specialized carrier built by Manitex Liftking. The ship builder will construct a segment of the hull on our transporter. When the section of the hull is complete, the ship builder will move the section to the already completed portion of the hull and attach it. Manitex Liftking has built transporters capable of transporting 500,000 pounds.
Container Handling Equipment
The Company through its Italian subsidiary, CVS Ferrari, srl (“CVS”) manufactures a range of container handling equipment to serve ports and inter-modal customers on a worldwide basis.
When CVS began operating in the third quarter 2010 it was a startup operation that had no employees. CVS hired a general manager and commenced hiring staff, and conducting startup activities including installing systems, obtaining insurance, establishing a supplier base and establishing banking relationships, etc. The startup phase was heavily supported by corporate management. Additionally, former customers were contacted to see if they would assign any of their unfilled orders with the Predecessor Company to CVS. Under the rental agreement, CVS was permitted to purchase inventory it needed for its future production from the Predecessor Company but was not required to do so. Management made the decision that it would concentrate its efforts on manufacturing reach stackers and providing part support for all products previously sold by the Predecessor Company.
CVS purchased all the rights and designs to manufacture all the products previously manufactured by the Predecessor Company including reach stackers, empty container handlers, forklift, straddle carriers, and tractors. Although CVS initially concentrated on reach stackers, it was the Company’s plan to reintroduce other products. The process of reintroducing products began in 2011 with the sale of a limited number of terminal tractors. Presently, CVS has successfully reintroduced and is currently selling all the Predecessor Company’s products, except for the straddle carrier. CVS is still in the process of reviewing the straddle carrier product design and functions with the intent of reintroducing the product at a future date.
Historically, a slight majority of the Predecessor Company’s sales were to Italy and other European countries. The Predecessor Company also had a market presence in Africa, South America, the Middle East and the Far East. Historically, the Predecessor Company has had no significant penetration into the North American market. Now that CVS is owned by a U.S. based company, it is actively soliciting business in North America. In 2012, CVS had sales to the Canadian military of approximately $1.9 million. This sale is the first significant sale by CVS in North America. In its traditional markets, CVS competes with several other companies, including three companies that are significantly larger than CVS. In attempting to enter the North American market, CVS will be faced with competition from these competitors and also domestic manufacturers.
The container handling market is a somewhat cyclical market, which depends in part on general economic conditions but also on the timing of major port construction projects. The financial crisis that began in the later part of 2008 caused a decline in demand for container handling equipment in 2009. The decrease in demand was not nearly as steep as it was for most other types of equipment. The decline was tempered as there are long lead times for major deliveries and a lot of orders for 2009 production had been placed when the crisis began. Additionally, a significant portion of the funding for purchases comes from governments or governmental agencies, which may be less sensitive to general economic conditions. We believe that demand in markets that CVS traditionally serves did not change significantly between 2009 and 2010. We believe that total market demand increased modestly in 2011, but was still below 2008 levels. During 2012, a continuing debt crisis in Western Europe both decreased governmental funding and made obtaining private financing difficult. As a result, the Western European market for CVS type products was severely depressed during 2012. Nevertheless, CVS was able to grow its revenues during the year by increasing sales to other international markets including South Africa, Brazil, South Korea and Russia.
9
Table of Contents
In 2013, the market for port handling equipment in Europe, CVS’s historical market, overall continued to be weak. There was, however, some modest improvement during the latter part of the year. CVS was again able to grow its revenues by increasing sales to other international markets. This increase is attributed to shipments of tractors to South Africa during the first part of the year and an increase in sales to Latin America in the second half of the year. The sale of the tractors was related to a large tender order that was awarded to CVS in 2012. The increase in Latin American revenues is a benefit from obtaining new dealers in Latin America in 2013. During 2014, CVS has continued to expand its dealer network and has also benefited from a modest increase in demand in its local Italian market.
Mobile Tanks
Manitex Sabre manufactures a comprehensive line of specialized mobile tanks for liquid and solid storage and containment solutions with capacities from 8,000 to 21,000 gallons. Its mobile tanks are sold to specialized independent tank rental companies and through the Company’s existing dealer network. The tanks are used in a variety of end markets such as petrochemical, waste management and oil and gas drilling.
ASV Segment
Loaders and Skid Steer
ASV manufactures and sells a complete range of compact rubber tracked loaders (CTL) and skid steer loaders (SSL). CTLs are used in the site clearing, general construction, forestry, golf course maintenance and landscaping industries, with general construction being the largest market. A complete range from a rated operating capacity of 665 pounds to 12,100 pounds is manufactured. The CTL manufactured by ASV has several patented features and unique attributes, including the only available rubber tracked undercarriage system. SSLs are used in general construction, material handling, including scrap and waste, and agricultural markets. They are utilized in hard abrasive conditions that a CTL may not be able to traverse. A complete range from a rated operating capacity of 1,650 pounds to 8,680 pounds is manufactured.
Equipment Distribution Segment
The Equipment Distribution segment comprises the operations of Crane & Machinery (“C&M”), a division of Manitex International. The segment markets products used primarily for infrastructure development and commercial construction applications that include road and bridge construction, general contracting, roofing, scrap handling and sign construction and maintenance. C&M is a distributor of Terex rough terrain and truck cranes, and supplies repair parts for a wide variety of medium to heavy duty construction equipment and sells domestically and internationally, predominately to end users, including the rental market. It also provides crane equipment repair services in the Chicago area. C&M uses the trade name , North American Equipment Exchange, to market previously-owned construction and heavy equipment, both domestically and internationally and provides a wide range of used lifting and construction equipment of various ages and condition, and also has the capability to refurbish equipment to the customers’ specification. C&M also operates as the North American sales organization for our Italian based PM knuckle boom cranes and Valla pick and carry crane products.
Revenues attributable to the Company’s Equipment Distribution segment were less than 10% of the Company’s total revenues for fiscal years 2014, 2013 and 2012.
Part Sales
Each of our segments supplies repair and replacement parts for its products. The parts business margins are higher than our overall margins. Part sales as a percentage of revenues tend to increase when there is a down-turn in the industry. Part sales as a percentage of revenues is approximately 11%, 15% and 16% for the years ended December 31, 2014, 2013 and 2012, respectively. The declines in 2014 and 2013 are the result of increases in the Company’s total revenues in those years.
10
Table of Contents
Total Company Revenues by Sources
The sources of the Company’s revenues are summarized below:
| 2014 | 2013 | 2012 | ||||||||||
| Boom trucks & truck cranes |
43 | % | 47 | % | 44 | % | ||||||
| Industrial cranes and forklifts |
7 | % | 3 | % | — | |||||||
| Container handling equipment |
15 | % | 14 | % | 12 | % | ||||||
| Rough terrain forklifts |
4 | % | 6 | % | 6 | % | ||||||
| Military forklifts |
4 | % | 2 | % | 6 | % | ||||||
| Rough terrain cranes |
1 | % | 1 | % | 4 | % | ||||||
| Compact loaders and skid steers |
1 | % | — | — | ||||||||
| Mobile tanks |
6 | % | 2 | % | — | |||||||
| Specialized trailers |
5 | % | 8 | % | 8 | % | ||||||
| Used Construction Equipment |
3 | % | 2 | % | 4 | % | ||||||
| Part sales |
11 | % | 15 | % | 16 | % | ||||||
|
|
|
|
|
|
|
|||||||
| Total Revenue |
100 | % | 100 | % | 100 | % | ||||||
|
|
|
|
|
|
|
|||||||
In 2014 and 2013, no customer accounted for 10% of the Company’s revenue. In 2012, one customer, Cropac Equipment, Inc., accounted for 10.8% of the Company’s revenue.
Raw Materials
The Company both purchases and fabricates components used in production. Our Manitex subsidiary fabricates cranes which are mounted on truck chassis, which are either purchased by the Company or supplied by the customer. The Company purchases steel and a variety of machined parts and subassemblies including weldments, cylinders, winches, cables, booms and cabs. Manitex Liftking builds rough terrain forklifts, and other specialized carriers. Manitex Liftking fabricates some of their cylinders, and masts using quality steel and proprietary technology. Manitex Liftking purchases engines, transmissions, axles, tires, rims and most of its frames and many of the cylinders and masts that are used. Badger historically fabricated its frames and booms, but purchases engines, transmissions, axles, tires, rims and other components. Recently, Badger has been outsourcing much of its requirements for frames. Manitex Load King mainly purchases materials including steel, axles, suspensions, tires, wheels and other engineered components. CVS principally purchases components used in production. CVS purchases frames, cabs, booms, engines, transmissions, axles, tires, rims, cylinders, masts and electronic components. Manitex Sabre fabricates mobile tanks for liquid and solid waste. The Company purchases steel and a variety of machined parts and subassemblies including weldments together with axles, tires and wheels. ASV manufactures compact and skid steer loaders and mainly purchases materials including steel, axles, suspensions, tires, wheels and other engineered components together with engines and transmissions and cabs.
Lead times for our components vary from several weeks to many months. The Company is vulnerable to an interruption of supply in instances when only one supplier has been qualified and qualification and supply source changes can exceed a year. The Company has been working on qualifying secondary sources to assure supply and to reduce costs. The degree to which our supply base can respond to changes in market demand directly affects our ability to increase production and the Company attempts to maintain some additional inventory in order to react to unexpected increases in demand. In 2011, our production of boom trucks was at times constrained by a shortage of chassis and to a lesser degree the availability of cylinders, high density steel and other component parts. Delivery of chassis started to improve in the fourth quarter of 2011. During the first part of 2012, supply chain issues at times delayed some of our deliveries. However, we do not believe that availability or lack of component had any significant impact on full year 2012 revenues. During 2013 and 2014, raw materials and components were generally available to meet our production schedules and had no significant
11
Table of Contents
impact on 2013 revenues. During the first part of 2014 delivery of chassis for our larger cranes had a modest impact on production, however this was alleviated during the year as manufacturers increased their production and demand also slowed compared to the first half of the year.
Any future supply chain issues that might impact the Company will in part depend on how fast the rate of growth is for a product as well as the rate of growth in the general economy. Strong general economic growth could put us in competition for parts with other industries. Additionally, events or circumstance at a particular supplier could impact the availability of a necessary component.
Patents and Trademarks
The Company protects its trade names and trademarks through registration. Its technology consists of bill of materials, drawings, plans, vendor sources and specifications and although the Company’s technology has considerable value, it does not generally have patent protection. Competitors will occasionally patent a unique feature, however, the broader technology does not have patent protection. The Company has (on rare occasions) filed for patent protection on a specific feature. In the future, the Company will consider seeking patent protection on any new design features believed to present a significant future benefit.
The Company owns and uses several trademarks relating to its brands that have significant value and are instrumental to the Company’s ability to market its products. The Company’s most significant trademarks are its mark “Manitex” (presently registered with the United States Patent and Trademark Office until 2017), and its mark “LIFTKING” (presently registered with the Canadian Intellectual Property Office until 2015). The Company’s subsidiary, Manitex Load King sells its products using the trademarks Load King (presently registered with the United States Patent and Trademark Office until 2018) and also utilizes the trademark Power Fold (presently registered with the United States Patent and Trademark Office until 2018). Badger Equipment Company markets its products under the “Little Giant” and Badger trade names. The Manitex, LiftKing, Badger, Little Giant and Load King trademarks and trade names are important to the marketing and operation of the Company’s business as a significant number of our products are sold under those names. The use of the trade name “Noble” is also important to the Company’s business. Although the Company does not own the Noble trade name, it has the right to use the Noble name in connection with its rough terrain forklift product line. ASV product is marketed under the Terex trade name to which it has a license, and also under the ASV trade name. Other important trademarks that are registered by ASV include “Posi-Track”, “Loegering” VTS and VTS Versatile Track System. ASV has a number of patents for its current machines presently registered with the United States Patent and Trademark Office until 2023 and the original patent for now discontinued machines that expires in 2018.
Seasonality
Traditionally, the Company’s peak selling periods for cranes and commercial rough terrain forklifts are in the first half of a calendar year as a result of the need to have new equipment available for the spring, summer and fall construction seasons. Seasonality is reduced when the industry is operating at or near full capacity as it did in 2006 and 2007. The financial crisis that began in 2008 dramatically depressed demand for our crane products and commercial rough terrain forklifts used in commercial construction and home building, the market areas subject to the greatest seasonality. As such, our business has not been subject to normal seasonality in recent years.
A significant portion of cranes sold over the last several years have been deployed in specialized industries or applications, such as oil and gas production, power distribution and in the railroad industry. Sales in these market segments are subject to significant fluctuations which correlate more with general economic conditions and the prices of commodities including oil and generally are not of seasonal nature.
The Lifting Equipment segment’s military, special mission oriented vehicles and specialized carriers business is dependent on the receipt of customers’ orders. The timing of customer orders can be expected to result in
12
Table of Contents
fluctuations in revenues from period to period. The expected fluctuations, however, are not of a seasonal nature. The Lifting Equipment segment’s container handling product line is also subject to fluctuations due to in part the timing of contract awards related to major port projects. Again, this fluctuation is not necessarily of a seasonal nature.
Sales of cranes from the Equipment Distribution segment mirror the seasonality of the overall Company. However, the sale of parts is much less seasonal given the geographic breadth of the customer base. Crane repairs are performed by the Equipment Distribution segment throughout the year but are somewhat affected by the slowdown in construction activity during the typically harsh winters in the Midwestern United States.
Peak sales of ASV products are traditionally in the first half of a calendar year as a result of the need to have new equipment available for the spring, summer and fall construction seasons, although this is partially offset by sales to export markets in the southern hemisphere. The financial crisis that began in 2008 dramatically depressed demand for products used in commercial construction and home building, the market areas subject to the greatest seasonality. As such, ASV has not been subject to normal seasonality in recent years.
Competition
Lifting Equipment Segment
The market for the Company’s boom trucks and sky cranes, commercial rough terrain forklifts, container handling equipment and trailers is highly competitive. The Company competes based on product design, quality of products and services, product performance, maintenance costs and price. Several competitors have greater financial, marketing, manufacturing and distribution resources than we do. The Company believes that it effectively competes with its competitors.
Military forklifts, special mission oriented vehicles and specialized carriers are highly engineered products and, therefore, only face limited competition. The Company’s rough terrain cranes serve smaller niche markets and, therefore, also have less competition.
The Company’s boom cranes compete with cranes manufactured by National Crane, Terex, Weldco Beales, Elliott and Altec. The Company’s sky cranes compete with cranes manufactured by Elliott, Wilke, and Radocy. The Company competes with Linamar, Sellick, Harlo, Manitou, Mastercraft and Load Lifter in selling rough terrain forklifts. The Company competes primarily with Terex and Broderson in selling rough terrain and industrial cranes. The Company’s container handling equipment competes with similar equipment sold by Cargotec, Konecranes and Terex. The North American specialty trailer industry is highly fragmented, but our competitors include: Aspen Custom Trailers, Landoll Corporation, Manaca, Inc. and Trail King.
ASV Segment
The Company’s compact and skid steer loaders compete with product manufactured and sold by Bobcat (part of Doosan), Caterpillar, CNH, Gehl, Takeuchi, John Deere and Wacker Neuson.
Equipment Distribution Segment
Our Equipment Distribution segment has a dealership arrangement with Terex and must compete against dealers of other rough terrain and truck crane manufacturers such as Imperial Crane (Tadano and Elliot) and Walter Payton Power (Grove) who operate in the same geographic market in and around Chicago. The same dynamic holds true in selling Manitex boom trucks which are part of our Lifting Equipment segment. The Equipment Distribution segment competes against Runnion Equipment (dealer for National Crane), Power Equipment Leasing (dealer for Elliott) and Guiffre Cranes (dealer for Terex boom trucks). Runnion is also authorized to sell Manitex boom trucks. Our Equipment Distribution segment competes with other PM dealers for distribution in North America.
13
Table of Contents
While no geographic limitations exist regarding the Equipment Distribution segment’s ability to sell cranes internationally, the lack of any barriers to entry and the heavy use of the Internet make this a highly active and competitive market in which to distribute cranes.
Competition for our Equipment Distribution segment’s repair business is even more intense since it is limited geographically due to the necessity of having physical access to the cranes. Most of the above referenced companies also compete in this aspect of the business, as do other types of crane and equipment dealers from nearby areas such as Indiana or Wisconsin.
Parts sales from the Equipment Distribution segment are global in scope and benefit greatly from the Internet and the tenure and expertise of our employees. While competition in this area is extensive, the breadth of the products offered and the segment’s long history in this part of the business is we believe a competitive advantage.
C&M uses the trade name, North American Equipment Exchange, to market previously-owned construction and heavy equipment, domestically and internationally. These divisions provide a wide range of used lifting and construction equipment of various ages and condition and the Company has the capability to refurbish the equipment to the customers’ specification.
The Equipment Distribution segment competes based on the design, quality and performance of the products it distributes, price and the supporting repair and part services that it provides. Several competitors have greater financial, marketing and distribution resources than we do. The Company, however, believes that it effectively competes with its competitors.
Backlog
The backlog at December 31, 2014 was approximately $107.3 million, compared to a backlog of approximately $77.3 million at December 31, 2013. The Company expects to ship product to fulfill its existing backlog within the next twelve months.
Research and Development
The Company spent $2.6 million, $2.9 million and $2.5 million on company-sponsored research and development activities for 2014, 2013 and 2012, respectively.
Geographic Information
The information regarding revenue, the basis for attributing revenue from external customers to individual countries, and long-lived assets is found in Note 18 “Segment Information” to our consolidated financial statements, is hereby incorporated by reference into this Part I, Item 1.
Employees
As of December 31, 2014, the Company had 663 full time employees. The Company has not experienced any work stoppages and anticipates continued good employee relations. Seventy (70) of our employees are covered by collective bargaining agreements. Twenty Six (26) of our employees at our Badger subsidiary are represented by International Union, UAW and its local No. 316. The current union contract expires on January 21, 2017. Four employees are currently represented by Automobile Mechanics’ Local 701. The union contract expires on September 30, 2017. The employees represented by the Automobile Mechanics’ Local 701 are mechanics that work in our Equipment Distribution segment. A number of our Equipment Distribution segment’s customers in the Chicago metropolitan area mandate union mechanics usage for any service / repair jobs. Forty (40) employees at Manitex Load King are represented by United Electrical Radio and Machine Workers of America, Local 1187. The current union contract expires on February 5, 2016.
14
Table of Contents
Governmental Regulation
The Company is subject to various governmental regulations, such as environmental regulations, employment and health regulations, and safety regulations. We have various internal controls and procedures designed to maintain compliance with these regulations. The cost of compliance programs is not material, but is subject to additions to or changes in federal, state or local legislation or changes in regulatory implementation or interpretation of government regulations.
Available Information
The Company makes available free of charge our annual report on Form 10-K, quarterly reports on Form 10-Q, current reports on Form 8-K and amendments to those reports filed or furnished as required by Section 13(a) or 15(d) of the Securities Exchange Act of 1934, as amended, through our Internet Website (www.manitexinternational.com) as soon as is reasonably practicable after we electronically file such material with, or furnish it to, the Securities and Exchange Commission. Information contained in or incorporated into our Internet Website is not incorporated by reference herein.
| ITEM 1A. | RISK FACTORS |
You should carefully consider the following risks, together with the cautionary statement under the caption “Forward-Looking Statements” and the other information included in this report. The risks described below are not the only ones the Company faces. Additional risks that are currently unknown to the Company or that the Company currently considers to be immaterial may also impair its business or adversely affect the Company’s financial condition or results of operations. If any of the following risks actually occur, the Company’s business, financial condition or results of operation could be adversely affected.
Significant deterioration in economic conditions, especially in the United States and Europe, has had and may again have negative effects on the Company’s results of operations and cash flows
Significant deterioration in economic conditions, especially in the United States and Europe, has had and may again have negative effects on the Company’s results of operations and cash flows. Economic conditions affect the Company’s sales volumes, pricing levels and overall profitability. Demand for many of the Company’s products depends on end-use markets. Challenging economic conditions may reduce demand for our products and may also impair the ability of customers to pay for products they have purchased. As a result, the Company’s reserves for doubtful accounts and write-offs for accounts receivable may increase.
A significant deterioration in economic conditions has caused and may again cause deterioration in the credit quality of our customers and the estimated residual value of our equipment. This could further negatively impact the ability of our customers to obtain the resources they need to make purchases of our equipment. Reduced credit availability will diminish our customers’ ability to invest in their businesses, refinance maturing debt obligations, and meet ongoing working capital needs. If customers do not have sufficient access to credit, demand for the Company’s products will likely decline. Reduced access to credit and the capital markets will also negatively affect the Company’s ability to invest in strategic growth initiatives such as acquisitions.
The Company may require additional funding, which may not be available on favorable terms or at all.
Our future capital requirements will depend on the amount of cash generated or required by our current operations, as well as additional funds which may be needed to finance future acquisitions. Future cash needs are subject to substantial uncertainty.
We cannot guarantee that adequate funds will be available when needed, and if we do not receive sufficient capital, we may be required to alter or reduce the scope of our operations or to forego making future acquisitions. If we raise additional funds by issuing equity securities, existing stockholders may be diluted.
15
Table of Contents
The Company’s business is sensitive to increases in interest rates.
The Company is exposed to interest rate volatility with regard to future issuances of fixed rate debt and existing issuances of variable rate debt. Primary exposure includes movements in the U.S. prime rate, the Canadian prime rate and Italian short-term borrowing rates.
If interest rates rise, it becomes more costly for the Company’s customers to borrow money to pay for the equipment they buy from the Company. Should the U. S. Federal Reserve Board decide to increase rates, prospects for business investment and manufacturing could deteriorate sufficiently and impact sales opportunities.
The Company’s business is sensitive to government spending.
Many of the Company’s customers depend substantially on government spending, including highway construction and maintenance and other infrastructure projects by U.S. federal and state governments and governments in other nations. Any decrease or delay in government funding of highway construction and maintenance and other infrastructure projects could cause the Company’s revenues and profits to decrease.
Additionally, the portion of business that is military related (including an international agency) has in the past fluctuated significantly between years. A significant decrease in military related revenues would adversely affect our results of operations and our cash flow.
The Company’s business is affected by the cyclical nature of its markets.
A substantial portion of our revenues are attributed to limited number of customers which may decrease or cease purchasing any time, since the Company’s products depends upon the general economic conditions of the markets in which the Company competes. The Company’s sales depend in part upon its customers’ replacement or repair cycles. Adverse economic conditions, including a decrease in commodity prices, may cause customers to forego or postpone new purchases in favor of repairing existing machinery. Downward economic cycles may result in reductions in sales of the Company’s products, which may reduce the Company’s profits. The Company has taken a number of steps to reduce its fixed costs and diversify its operations to decrease the negative impact of these cycles. There can be no assurance, however, that these steps will prevent the negative impact of poor economic conditions.
The Company’s revenues are attributed to limited number of customers which may decrease or cease purchasing any time.
The Company’s revenues are attributed to a limited number of customers. We generally do not have long-term supply agreements with our customers. Even if a multi-year contract exists, the customer is not required to commit to minimum purchases and can cease purchasing at any time. If we were to lose either a significant customer or several smaller customers our operating results and cash flows would be adversely impacted.
The Company is dependent upon third-party suppliers, making us vulnerable to supply shortages.
The Company obtains materials and manufactured components from third-party suppliers. Any delay in the Company’s suppliers’ abilities to provide the Company with necessary materials and components may affect the Company’s capabilities at a number of our manufacturing locations, or may require the Company to seek alternative supply sources. Delays in obtaining supplies may result from a number of factors affecting the Company’s suppliers including capacity constraints, labor disputes, the impaired financial condition of a particular supplier, suppliers’ allocations to other purchasers, weather emergencies or acts of war or terrorism. Any delay in receiving supplies could impair the Company’s ability to deliver products to customers and, accordingly, could have a material adverse effect on business, results of operations and financial condition.
16
Table of Contents
In addition, the Company purchases material and services from suppliers on extended terms based on the Company’s overall credit rating. Negative changes in the Company’s credit rating may impact suppliers’ willingness to extend terms and increase the cash requirements of the business.
Price increases in materials could affect our profitability.
We use large amounts of steel and other items in the manufacture of our products. In the past, market prices of some of our key raw materials increased significantly. If we experience future significant increases in material costs, including steel, we may not be able to reduce product cost in other areas or pass future raw material price increases on to our customers and our margins could be adversely affected.
The Company depends on its computer systems. If its computer systems do not perform in a satisfactory manner, it could be disruptive and or adversely affect the operations and results of operations of the Company, including the ability of the Company to report accurate and timely financial results.
The Company depends on its computer systems. If its computer systems do not perform in a satisfactory manner, it could be disruptive and or adversely affect the operations and results of operations of the Company, including the ability of the Company to report accurate and timely financial results. In the future, the Company may either install new releases for existing applications or replace existing systems. Systems implementations projects are often not successful. Even when projects are ultimately successful, the projects often require higher than anticipated financial and personal resources. In the future, should systems not be implemented successfully and within budget, or if the systems do not perform in a satisfactory manner, it could be disruptive and or adversely affect the operations and results of operations of the Company, including the ability of the Company to report accurate and timely financial results.
The Company’s level of indebtedness reduces financial flexibility and could impede our ability to operate.
As of December 31, 2014, the Company’s total debt was $112.3 million, which includes: revolving term credit facilities, notes payable, convertible debt and capital lease obligations.
Our level of debt affects our operations in several important ways, including the following:
| • | a significant portion of our cash flow from operations is likely to be dedicated to the payment of the principal and interest on our indebtedness; |
| • | our ability to obtain additional financing in the future for working capital, capital expenditures or acquisitions may be limited; |
| • | we may be unable to refinance our indebtedness on terms acceptable to us or at all; |
| • | our cash flow may be insufficient to meet our required principal and interest payments; and |
| • | we may be unable to obtain additional loans as a result of covenants and agreements with existing debt holders. |
The Company has debt outstanding and must comply with restrictive covenants in its debt agreements.
The Company’s existing debt agreements contain a number of significant covenants which may limit its ability to, among other things, borrow additional money, make capital expenditures, pay dividends, dispose of assets and acquire new businesses. These covenants also require the Company to meet certain financial tests. The Company is currently in compliance with all active covenants. A default, if not waived by the Company’s lenders, could result in acceleration of the Company’s debt and possibly bankruptcy.
17
Table of Contents
Certain of the Company’s products are substantially dependent on the level of capital expenditures in the oil and gas industry and lower capital expenditures will adversely affect the results of the Company’s operations.
The demand for our product in part depends on the condition of the oil and gas industry and, in particular, on the capital expenditures of companies engaged in the exploration, development, and production of oil and natural gas. Capital expenditures by these companies are influenced by the following factors:
| • | the oil and gas industry’s ability to economically justify placing discoveries of oil and gas reserves in production; |
| • | the oil and gas industry’s need to clear all structures from the lease once the oil and gas reserves have been depleted; |
| • | weather events, such as major tropical storms; |
| • | current and projected oil and gas prices; |
| • | the abilities of oil and gas companies to generate, access and deploy capital; |
| • | exploration, production and transportation costs; |
| • | the discovery rate of new oil and gas reserves; |
| • | the sale and expiration dates of oil and gas leases and concessions; |
| • | local and international political and economic conditions; |
| • | the ability or willingness of host country government entities to fund their budgetary commitments; and |
| • | technological advances. |
Historically, prices of oil and natural gas and exploration, development and production have fluctuated substantially. A sustained period of substantially reduced capital expenditures by oil and gas companies will result in decreased demand for certain equipment produced by the Company, lower margins, and possibly net losses.
The Company may face limitations on its ability to integrate acquired businesses.
The Company has completed ten acquisitions since 2006. The successful integration of new businesses depends on the Company’s ability to manage these new businesses and cut excess costs. While the Company believes it has successfully integrated these acquisitions to date, the Company cannot ensure that these acquired companies will operate profitably or that the intended beneficial effect from these acquisitions will be realized.
If the Company is unable to manage anticipated growth effectively, the business could be harmed.
If the Company fails to manage growth, the Company’s financial results and business prospects may be harmed. To manage the Company’s growth and to execute its business plan efficiently, the Company will need to institute operational, financial and management controls, as well as reporting systems and procedures. The Company also must effectively expand, train and manage its employee base. The Company cannot assure you that it will be successful in any of these endeavors.
The Company relies on key management.
The Company relies on the management and leadership skills of David Langevin, Chairman and Chief Executive Officer. When Mr. Langevin joined the Company, he signed a three year employment agreement with the Company which expired on December 31, 2008. Mr. Langevin’s employment agreement has been extended and now expires on December 31, 2015. Under the employment agreement, Mr. Langevin’s employment term automatically extends for successive periods of three year unless either the Company or Mr. Langevin gives
18
Table of Contents
written notice to the other party of non-renewal at least 90 days prior to the end of the then current employment term. The loss of his services could have a significant and negative impact on the Company’s business. In addition, the Company relies on the management and leadership skills of other senior executives. The Company could be harmed by the loss of key personnel in the future.
The Company’s success depends upon the continued protection of its trademarks and the Company may be forced to incur substantial costs to maintain, defend, protect and enforce its intellectual property rights.
The Company’s registered and common law trademarks, as well as certain of the Company’s licensed trademarks, have significant value and are instrumental to the Company’s ability to market its products. The Company’s marks “Manitex” “Liftking” “Badger”, “Sabre”, “Valla” “ASV” and “Load King” are important to the Company’s business as the majority of the Company’s products are sold under those names. The Company has not registered all of its trademarks in the United States nor in the foreign countries where it does business. The Company cannot assure you that third parties will not assert claims against any such intellectual property or that the Company will be able to successfully resolve all such claims. If the Company has to change the names of any of its products, it may experience a loss of goodwill associated with its brand names, customer confusion and a loss of sales.
In addition, international protection of the Company’s intellectual property may not be available in some foreign countries to the same extent permitted by the laws of the United States. The Company could also incur substantial costs to defend legal actions relating to use of its intellectual property, which could have a material adverse effect on the Company’s business, results of operations or financial condition.
The Company may be unable to effectively respond to technological change, which could have a material adverse effect on the Company’s results of operations and business.
The markets served by the Company are not historically characterized by rapidly changing technology. Nevertheless, the Company’s future success will depend in part upon the Company’s ability to enhance its current products and to develop and introduce new products. If the Company fails to anticipate or respond adequately to competitors’ product improvements and new production introductions, future results of operations and financial condition will be negatively affected.
The Company operates in a highly competitive industry and the Company is particularly subject to the risks of such competition.
The Company competes in a highly competitive industry and the competition which the Company encounters has an effect on its product prices, market share, revenues and profitability. Because certain competitors have substantially greater financial, production, research and development resources and substantially greater name recognition than the Company, the Company is particularly subject to the risks inherent in competing with them and may be put at a competitive disadvantage. To compete successfully, the Company’s products must excel in terms of quality, price, product line, ease of use, safety and comfort, and the Company must also provide excellent customer service. The greater financial resources of the Company’s competitors may put it at a competitive disadvantage. If competition in the Company’s industry intensifies or if the Company’s current competitors enhance their products or lower their prices for competing products, the Company may lose sales or be required to lower its prices. This may reduce revenue from the Company’s products and services, lower its gross margins or cause the Company to lose market share. The Company may not be able to differentiate our products from those of competitors, successfully develop or introduce less costly products, offer better performance than competitors or offer purchasers of our products payment and other commercial terms as favorable as those offered by competitors.
19
Table of Contents
The Company faces product liability claims and other liabilities due to the nature of its business.
In the Company’s lines of business numerous suits have been filed alleging damages for accidents that have occurred during the use or operation of the Company’s products. The Company is self-insured, up to certain limits, for these product liability exposures, as well as for certain exposures related to general, workers’ compensation and automobile liability. Insurance coverage is obtained for catastrophic losses as well as those risks required to be insured by law or contract. Any material liabilities not covered by insurance could have an adverse effect on the Company’s financial condition.
The Company is subject to currency fluctuations.
Our revenues are generated in U.S. dollars, Canadian dollars and Euros while costs incurred to generate revenues are only partly incurred in the same currencies. Changes in currency exchange rates between the U.S. dollar and other currencies have had, and will continue to have, an impact on our earnings.
We engage in hedging activities to mitigate the impact of the translation of foreign currencies on our financial results. Our hedging activities are designed to reduce and delay, but not to eliminate, the effects of foreign currency fluctuations. Factors that could affect the effectiveness of our hedging activities include accuracy of sales forecasts, volatility of currency markets, and the availability of hedging instruments. Since the hedging activities are designed to reduce volatility, they not only reduce the negative impact of a weaker U.S. dollar, but they also reduce the positive impact of a stronger U.S. dollar. Our future financial results could be significantly affected by the value of the U.S. dollar in relation to the foreign currencies in which we conduct business. The degree to which our financial results are affected for any given time period will depend in part upon our hedging activities. There can be no assurance that our hedging activities will have the desired beneficial impact on our financial condition or results of operations. Moreover, no hedging activity can completely insulate us from the risks associated with changes in currency exchange rates.
Risks Relating to our Common Stock
The Company’s principal shareholders, executive officers and directors hold a significant percentage of the Company’s common stock, and these shareholders may take actions that may be adverse to your interests.
The Company’s principal shareholders, executive officers and directors beneficially own, in the aggregate, more than 20% of the Company’s common stock as of March 1, 2015. As a result, these shareholders, acting together, will be able to significantly influence all matters requiring shareholder approval, including the election and removal of directors and approval of significant corporate transactions such as mergers, consolidations, sales and purchases of assets. They also could dictate the management of the Company’s business and affairs. This concentration of ownership could have the effect of delaying, deferring or preventing a change in control or impeding a merger or consolidation, takeover or other business combination, which could cause the market price of our common stock to fall or prevent you from receiving a premium in such a transaction.
The cost of compliance with Section 404 of the Sarbanes-Oxley Act of 2002 may negatively impact the Company’s income.
The Company is subject to the rules and regulations of the SEC, including those rules and regulations mandated by the Sarbanes-Oxley Act of 2002. Section 404 of the Sarbanes-Oxley Act requires all reporting companies to include in their annual report a statement of management’s responsibilities for establishing and maintaining adequate internal control over financial reporting, together with an assessment of the effectiveness of those internal controls. Section 404 further requires that the reporting company’s independent auditors attest to, and report on, this management assessment. The Company expects its expenses related to its internal and external auditors to be significant. If we fail to maintain a system of adequate controls, it could have an adverse effect on our business and stock price.
20
Table of Contents
The price of our common stock is highly volatile.
The trading price of the Company’s common stock is highly volatile and could be subject to wide fluctuations in price in response to various factors, many of which are beyond the Company’s control, including:
| • | the degree to which the Company successfully implements its business strategy; |
| • | actual or anticipated variations in quarterly or annual operating results; |
| • | changes in recommendations by the investment community or in their estimates of the Company’s revenues or operating results; |
| • | failure to meet expectations of industry analysts; |
| • | speculation in the press or investment community; |
| • | strategic actions by the Company’s competitors; |
| • | announcements of technological innovations or new products by the Company or competitors; and |
| • | changes in business conditions affecting the Company and its customers. |
In the past, following periods of volatility in the market price of a company’s securities, class action litigation has often been brought against companies. If a securities class action suit is filed against us, whether or not meritorious, we would incur substantial legal fees and our management’s attention and resources would be diverted from operating our business in order to respond to the litigation.
Future sales of the Company’s common stock by existing shareholders in the public market, or the possibility or perception of such sales, could depress the Company’s stock price.
Sales of a large number of shares of the Company’s common stock, or the availability of a large number of shares for sale, could adversely affect the market price of the Company’s common stock and could impair the Company’s ability to raise funds in additional stock offerings. Approximately 14,989,694 of the Company’s shares are eligible for sale in the public market, approximately 1,225,000 of which are subject to applicable volume limitations and other restrictions set forth in Rule 144 under the Securities Act.
Provisions of the Michigan Business Corporation Act and the Company’s Articles of Incorporation, Amended and Restated Bylaws, and Rights Agreement may discourage or prevent a takeover of the Company.
Provisions of the Company’s Articles of Incorporation and Amended and Restated Bylaws, Michigan law, and the Rights Agreement, dated October 17, 2008, between the Company and Broadridge Corporate Issuer Solution, Inc., as rights agent, could make it more difficult for a third party to acquire the Company, even if doing so would be perceived to be beneficial to you. These provisions could discourage potential takeover attempts and could adversely affect the market price of the Company’s shares. Because of these provisions, you might not be able to receive a premium on your investment. These provisions:
| • | authorize the Company’s Board of Directors, with approval by a majority of its independent Directors but without requiring shareholder consent, to issue shares of “blank check” preferred stock that could be issued by the Company’s Board of Directors to increase the number of outstanding shares and prevent a takeover attempt; |
| • | limit our shareholders’ ability to call a special meeting of the Company’s shareholders; |
| • | limit the Company’s shareholders’ ability to amend, alter or repeal the Company bylaws; |
| • | may result in the issuance of preferred stock, which would significantly dilute the stock ownership percentage of certain shareholders and make it more difficult for a third party to acquire a majority of the Company’s outstanding voting stock; and |
| • | restrict business combinations with certain shareholders. |
21
Table of Contents
The provisions described above could prevent, delay or defer a change in control of the Company or its management.
We may be adversely affected by disruption in, or breach in security of, our information technology systems.
We rely on information technology systems, some of which are managed by third parties, to process, transmit and store electronic information (including sensitive data such as confidential business information and personally identifiable data relating to employees, customers and other business partners), and to manage or support a variety of critical business processes and activities. These systems may be damaged, disrupted or shut down due to attacks by computer hackers, computer viruses, employee error or malfeasance, power outages, hardware failures, telecommunication or utility failures, catastrophes or other unforeseen events, and in any such circumstances our system redundancy and other disaster recovery planning may be ineffective or inadequate. A failure of or breach in information technology security could expose us and our customers, distributors and suppliers to risks of misuse of information or systems, the compromise of confidential information, manipulation and destruction of data, defective products, production downtimes and operations disruptions. In addition, such breaches in security could result in litigation, regulatory action and potential liability, as well as the costs and operational consequences of implementing further data protection measures, each of which could have a material adverse effect on our business or results of operations.
| ITEM 1B. | UNRESOLVED STAFF COMMENTS |
None
| ITEM 2. | PROPERTIES |
The Company’s executive offices are located at 9725 Industrial Drive, Bridgeview, Illinois 60455. The Company has twelve principal operating plants. The Company builds boom trucks, and sign cranes in its 188,000 sq. ft. leased facility located in Georgetown, Texas. The Company builds rough terrain forklifts and special mission oriented vehicles, as well as other specialized carriers in its 85,000 sq. ft. leased facility located in Woodbridge, Ontario. The Company builds specialized rough terrain cranes and material handling product in its 170,000 sq. ft. leased facility located in Winona, Minnesota. The Company builds its specialized highly engineered trailers in its 106,000 sq. ft. owned facility in Elk Point, South Dakota. The Company builds reach stackers and container handling equipment in its 103,000 sq. ft leased facility in Cadeo, Italy. The Company develops mobile cranes in its leased facility in Piacenza, Italy. The Company builds its specialized mobile tanks for liquid and solid storage and containment solutions in its 100,000 sq. ft. leased facility located in Knox, Indiana. The Company builds its compact track loaders and skid steer loaders in its 220,000 sq. ft. owned facility located in Grand Rapids, Minnesota. In addition, we also own a 10,000 sq. ft. facility for selling and servicing equipment and a 47,000 sq. ft. leased facility for research and development testing and warehousing all located in Grand Rapids, Minnesota. The Company operates its crane distribution business in its 39,000 sq. ft. leased facility located in Bridgeview, Illinois.
All our facilities are used exclusively by our Lifting Equipment and ASV segments except for our Bridgeview facility. The Bridgeview facility houses our corporate offices and our Crane & Machinery Distribution division.
The Company believes that its facilities are suitable for its business and will be adequate to meet our current needs.
| ITEM 3. | LEGAL PROCEEDINGS |
The Company is involved in various legal proceedings, including product liability and workers’ compensation matters which have arisen in the normal course of operations. The Company has product liability insurance with self-insurance retention that ranges from $50 thousand to $0.5 million. ASV product liability cases that existed on date of acquisition have a $4 million self-retention limit. Until 2012, all worker compensation claims were
22
Table of Contents
fully insured. Beginning in 2012, the Company has a $250 thousand per claim deductible on worker compensation claims and aggregates of $1.2 million and $1.2 million for 2013 and 2014 policy years, respectively. Certain cases are at a preliminary stage and it is not possible to estimate the amount or timing of any cost to the Company. However, the Company does not believe that these contingencies, in the aggregate, will have a material adverse effect on the Company. When it is probable that a loss has been incurred and possible to make a reasonable estimate of the Company’s liability with respect to such matters, a provision is recorded for the amount of such estimate or the minimum amount of a range of estimates when it is not possible to estimate the amount within the range that is most likely to occur.
| ITEM 4. | MINING SAFETY DISCLOSURES |
Not applicable
23
Table of Contents
| ITEM 5. | MARKET FOR REGISTRANT’S COMMON EQUITY, RELATED STOCKHOLDER MATTERS AND ISSUER PURCHASES OF EQUITY SECURITIES |
Market for the Company’s Common Stock
The Company’s common stock is listed on The NASDAQ Capital Market trading under the symbol MNTX. The following table sets forth the high and low sales prices of the common stock for the fiscal periods indicated, as reported on The NASDAQ Capital Market.
Price Range of Common Stock
| 2014 |
High | Low | ||||||
| First Quarter |
$ | 17.44 | $ | 13.19 | ||||
| Second Quarter |
17.16 | 15.79 | ||||||
| Third Quarter |
16.73 | 11.29 | ||||||
| Fourth Quarter |
$ | 12.73 | $ | 9.58 | ||||
| 2013 |
High | Low | ||||||
| First Quarter |
$ | 12.75 | $ | 7.94 | ||||
| Second Quarter |
12.32 | 10.01 | ||||||
| Third Quarter |
11.98 | 10.03 | ||||||
| Fourth Quarter |
$ | 15.88 | $ | 10.84 | ||||
Number of Common Stockholders
As of February 24, 2015, there were 152 record holders of the Company’s common stock.
Dividends
During the fiscal years ended December 31, 2014, 2013 and 2012, the Company did not declare or pay any cash dividends on its common stock and the Company does not intend to pay any cash dividends in the foreseeable future. Furthermore, the terms of our credit facility do not allow us to declare or pay dividends without the prior written consent of the lender.
Performance Graph
The following stock performance graph is intended to show our stock performance compared with that of comparable companies. The stock performance graph shows the change in market value of ten thousand dollars invested in our Common Stock, the Russell 2000 Index and a peer group of comparable companies (“Peer Group”) for the five year period commencing December 31, 2009 through December 31, 2014. The cumulative total stockholder return of the peer group and Russell 2000 Index assumes dividends are reinvested. The stockholder return shown on the graph below is not indicative of future performance. The companies in the Peer Group are weighted by market capitalization.
The Peer Group consists of the following companies, which are in similar lines of business to Manitex International Inc. Lindsay Corporation (LNN), Gencor Industries Inc. (GENC), Astec Industries, Inc. (ASTE), Columbus McKinnon Corporation (CMCO) and Alamo Group, Inc. (ALG). The companies in the Peer Group generally have market capitalizations that are significantly greater than the Company’s market capitalization. It was necessary to select companies with higher market capitalizations to find companies with similar lines of business. Our competitors are most often either small privately owned companies with a narrow product line or a segment of a very large company. In selecting our Peer Group, we intentionally excluded the companies that had the largest market capitalization even when their product lines were similar to ours.
24
Table of Contents
CUMULATIVE TOTAL RETURN
Based upon an initial investment of $10,000 on December 31, 2009
with dividends reinvested
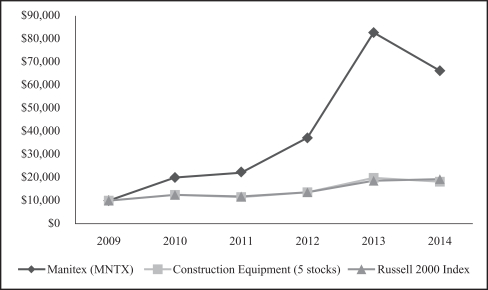
| December 31, 2009 |
December 31, 2010 |
December 31, 2011 |
December 31, 2012 |
December 31, 2013 |
December 31, 2014 |
|||||||||||||||||||
| Manitex International, Inc. |
$ | 10,000 | $ | 20,052 | $ | 22,083 | $ | 37,188 | $ | 82,708 | $ | 66,198 | ||||||||||||
| Russell 2000 Index |
$ | 10,000 | $ | 12,531 | $ | 11,847 | $ | 13,581 | $ | 18,607 | $ | 19,263 | ||||||||||||
| Construction Equipment (5 stocks) |
$ | 10,000 | $ | 12,574 | $ | 11,534 | $ | 13,680 | $ | 19,903 | $ | 18,203 | ||||||||||||
Issuer Purchases of Equity Securities
The following table provides information about the Company’s purchases of equity securities during the quarter ended December 31, 2014:
| Period |
Total number of shares purchased (1) |
Average price paid per share |
Total number of shares purchased as part of publicly announced plans or programs |
Maximum number or approximate dollar value of shares that may yet be purchased under the plans or programs |
||||||||||||
| October 1 through October 31, 2014 |
— | — | — | — | ||||||||||||
| November 1 through November 30, 2014 |
— | — | — | — | ||||||||||||
| December 1 through December 31, 2014 |
8,461 | $ | 12.71 | — | — | |||||||||||
|
|
|
|
|
|
|
|
|
|||||||||
| Total |
8,461 | $ | 12.71 | — | — | |||||||||||
|
|
|
|
|
|
|
|
|
|||||||||
| (1) | The Company purchased and cancelled 8,461 shares of its common stock on December 31, 2014. The shares were purchased from employees on December 31, 2014 at the market closing price of $12.71 on that date. The employees used the proceeds from the sale of shares to satisfy their withholding tax obligations that arose when restricted shares vested on that date. |
25
Table of Contents
| ITEM 6. | SELECTED FINANCIAL DATA |
The following selected financial data should be read in conjunction with our financial statements and the related notes thereto and “Management’s Discussion and Analysis of Financial Condition and Results of Operations” included elsewhere in this report.
The Company’s result include the results for companies acquired from their respective effective dates of acquisition: July 1, 2010 for CVS (and July 1, 2011 for the effect of assets purchased), August 19, 2013 for Sabre, November 30, 2013 for Valla, December 16, 2014 for Lift Ventures and December 20, 2014 for ASV.
(In 000’s except share information)
| 2014 | 2013 | 2012 | 2011 | 2010 | ||||||||||||||||
| Summary of Operations: |
||||||||||||||||||||
| Revenues |
$ | 264,081 | $ | 245,072 | $ | 205,249 | $ | 142,291 | $ | 95,875 | ||||||||||
| Operating income |
13,936 | 17,538 | 14,459 | 6,601 | 5,537 | |||||||||||||||
| Income before income taxes |
10,643 | 14,447 | 11,898 | 4,213 | 3,135 | |||||||||||||||
| Provision for taxes on income |
3,676 | 4,269 | 3,821 | 1,433 | 1,026 | |||||||||||||||
| Net income |
6,967 | 10,178 | 8,077 | 2,780 | 2,109 | |||||||||||||||
| Net income attributable to shareholders of Manitex International, Inc. |
$ | 7,103 | $ | 10,178 | $ | 8,077 | $ | 2,780 | $ | 2,109 | ||||||||||
| Earnings per share |
||||||||||||||||||||
| Basic |
$ | 0.51 | $ | 0.80 | $ | 0.68 | $ | 0.24 | $ | 0.19 | ||||||||||
| Diluted |
$ | 0.51 | $ | 0.80 | $ | 0.68 | $ | 0.24 | $ | 0.19 | ||||||||||
| Shares used to calculate earnings per share: |
||||||||||||||||||||
| Basic |
13,858,189 | 12,671,205 | 11,948,356 | 11,441,914 | 11,362,361 | |||||||||||||||
| Diluted |
13,904,289 | 12,717,575 | 11,957,458 | 11,548,158 | 11,380,966 | |||||||||||||||
| Total assets |
$ | 316,123 | $ | 182,614 | $ | 151,504 | $ | 121,591 | $ | 105,517 | ||||||||||
| Total debt |
$ | 112,294 | $ | 54,201 | $ | 49,138 | $ | 42,227 | $ | 34,019 | ||||||||||
| Total shareholders’ equity attributed to shareholders of Manitex International, Inc |
$ | 104,766 | $ | 84,991 | $ | 59,533 | $ | 46,794 | $ | 43,274 | ||||||||||
| ITEM 7. | MANAGEMENT’S DISCUSSION AND ANALYSIS OF FINANCIAL CONDITION AND RESULTS OF OPERATIONS |
The following management’s discussion and analysis of financial condition and results of continuing operations should be read in conjunction with the Company’s financial statements and notes, and other information included elsewhere in this Report.
FORWARD-LOOKING STATEMENTS
When reading this section of this Annual Report on Form 10-K it is important that you also read the financial statements and related notes thereto. This Annual Report on Form 10-K and certain information incorporated herein by reference contain forward-looking statements within the “safe harbor” provisions of the Private Securities Litigation Reform Act of 1995. All statements contained in this Annual Report on Form 10-K, other than statements that are purely historical, are forward-looking statements and are based upon management’s present expectations, objectives, anticipations, plans, hopes, beliefs, intentions or strategies regarding the future. We use words such as “anticipate,” “estimate,” “plan,” “project,” “continuing,” “ongoing,” “expect,” “believe,” “intend,” “may,” “will,” “should,” “could,” and similar expressions to identify forward—looking statements. Forward-looking statements in this Annual Report on Form 10-K include, without limitation: (1) projections of revenue, earnings, capital structure and other financial items, (2) statements of our plans and objectives,
26
Table of Contents
(3) statements regarding the capabilities and capacities of our business operations, (4) statements of expected future economic performance and (5) assumptions underlying statements regarding us or our business.
It is important to note that our actual results could differ materially from those included in such forward-looking statements due to a variety of factors including: (1) substantial deterioration in economic conditions, especially in the United States and Europe; (2) our customers’ diminished liquidity and credit availability; (3) difficulties in implementing new systems, integrating acquired businesses, managing anticipated growth, and responding to technological change; (4) our ability to negotiate extensions of our credit agreements and to obtain additional debt or equity financing when needed; (5) the cyclical nature of the markets we operate in; (6) increases in interest rates; (7) government spending; (8) fluctuations in the construction industry, and capital expenditures in the oil and gas industry; (9) the performance of our competitors; (10) shortages in supplies and raw materials or the increase in costs of materials; (11) our level of indebtedness and our ability to meet financial covenants required by our debt agreements; (12) product liability claims, intellectual property claims, and other liabilities; (13) the volatility of our stock price; (14) future sales of our common stock; (15) the willingness of our stockholders and directors to approve mergers, acquisitions, and other business transactions; (16) currency transaction (foreign exchange) risks and the risk related to forward currency contracts; (17) certain provisions of the Michigan Business Corporation Act and the Company’s Articles of Incorporation, as amended, Amended and Restated Bylaws, and the Company’s Preferred Stock Purchase Rights may discourage or prevent a change in control of the Company; and (18) a substantial portion of our revenues are attributed to a limited number of customers which may decrease or cease purchasing any time; (19) a disruption or breach in our technology systems; and (20) other risks described in the section entitled “Risk Factors” and elsewhere in our Annual Report on Form 10-K.
The risks, described in our Annual Report on Form 10-K, are not the only risks facing our Company. Additional risks and uncertainties not currently known to us or that we currently deem to be immaterial also may materially adversely affect our business, financial condition or operating results. We do not undertake, and expressly disclaim, any obligation to update this forward-looking information, except as required under applicable law.
OVERVIEW
The Company is a leading provider of engineered lifting solutions. The Company operates in three business segments: the Lifting Equipment segment, the ASV segment and the Equipment Distribution segment.
Lifting Equipment Segment
The Company is a leading provider of engineered lifting solutions. The Company designs, manufactures and distributes a diverse group of products that serve different functions and are used in a variety of industries. Through its Manitex, Inc. subsidiary it markets a comprehensive line of boom trucks, truck cranes and sign cranes. Manitex’s boom trucks and crane products are primarily used for industrial projects, energy exploration and infrastructure development, including, roads, bridges and commercial construction. Its Badger Equipment Company (“Badger”) subsidiary is a manufacturer of specialized rough terrain cranes and material handling products. Badger primarily serves the needs of the construction, municipality, and railroad industries.
Manitex Liftking ULC (“Manitex Liftking” or “Liftking”) sells a complete line of rough terrain forklifts, a line of stand-up electric forklifts, cushioned tired forklifts with lifting capacities from 18 thousand to 40 thousand pounds, and special mission oriented vehicles, as well as other specialized carriers, heavy material handling transporters and steel mill equipment. Manitex Liftking’s rough terrain forklifts are used in both commercial and military applications. Specialty mission oriented vehicles and specialized carriers are designed and built to meet the Company’s unique customer needs and requirements. The Company’s specialized lifting equipment has met the particular needs of customers in various industries that include utility, ship building and steel mill industries.
27
Table of Contents
Manitex Load King, Inc. (“Load King”) manufactures specialized custom trailers and hauling systems typically used for transporting heavy equipment. Load King Trailers serve niche markets in the commercial construction, railroad, military and equipment rental industries through a dealer network.
CVS Ferrari, srl (“CVS”) located near Milan, Italy designs and manufactures a range of reach stackers and associated lifting equipment for the global container handling market, that are sold through a broad dealer network. On November 30, 2013, CVS purchased the assets of Valla SpA. Valla manufactures and markets a line of precision pick and carry cranes from 2 to 90 tons, using electric, diesel and hybrid power. Its crane offer wheeled or tracked, fixed or swing boom configurations, with dozens of special applications designed specifically to meet the needs of its customers.
On August 19, 2013, Manitex Sabre, Inc. (“Sabre”) acquired the assets of Sabre Manufacturing, LLC, which is located in Knox, Indiana. Sabre manufactures a comprehensive line of specialized mobile tanks for liquid and solid storage and containment solutions with capacities from 8,000 to 21,000 gallons. Its mobile tanks will be sold to specialized independent tank rental companies and through the Company’s existing dealer network. The tanks are used in a variety of end markets such as petrochemical, waste management and oil and gas drilling.
ASV Segment
On December 19, 2014, the Company acquired 51% of A.S.V., Inc. from Terex Corporation (“Terex”). In connection with the acquisition, ASV was converted to an LLC and its name was changed to A.S.V., LLC (ASV). ASV located in Grand Rapids, Minnesota manufactures a line of high quality compact rubber tracked and skid steer loaders. The ASV products will be distributed through the Terex distribution channels as well as through Manitex and other independent dealers. ASV’s financial results are included in the Company’s consolidated results beginning on December 20, 2014.
Equipment Distribution Segment
The Equipment Distribution segment comprises the operations of Crane & Machinery (“C&M”), a division of Manitex International, Inc. The segment markets products used primarily for infrastructure development and commercial construction applications that include road and bridge construction, general contracting, roofing, scrap handling and sign construction and maintenance. C&M is a distributor of Terex rough terrain and truck cranes, and supplies repair parts for a wide variety of medium to heavy duty construction equipment and sells domestically and internationally, predominately to end users, including the rental market. It also provides crane equipment repair services in the Chicago area. C&M uses the trade name, North American Equipment Exchange to market previously-owned construction and heavy equipment, both domestically and internationally and provides a wide range of used lifting and construction equipment of various ages and condition, and also has the capability to refurbish equipment to the customers’ specification. C&M operates as the North American sales organization for our Italian based PM knuckle boom cranes and Valla pick and carry crane products.
Economic Conditions
The overall market for construction equipment continues to improve but has not returned to pre-2008 levels. A very significant portion of the Company’s revenues has been attributed to demand from niche market segments, particularly the North American energy sector. In our Annual Report on Form 10-K/A for the year ended December 31, 2013, we stated that, there had been a softening in the demand for our products which was related to the energy sector and that the Company believed that the current decrease in demand from the energy sector was temporary. This softness continued through much of the first quarter, which together with slower construction market demand caused a decrease in revenues from our existing products which was more than offset by additional revenues related to our acquisitions. Towards the end of the first quarter, the Company received significant new orders, which increased our backlog to $100 million from $77 million at December 31, 2013. During the second, third and fourth quarters of 2014 order intake remained at a level consistent with our
28
Table of Contents
output and the backlog at December 31, 2014 was $107 million. Although order remained level, the demand for cranes with higher lifting capacity, which are often used by the energy sector, declined at the end of the second quarter. The decline in demand for cranes with higher capacity was offset by cranes with lower lifting capacity and other product, both of which have lower margins. Crude oil prices fell sharply during the fourth quarter of 2014 and remain in the fifty dollar per barrel range. The lower oil price for now will continue to weaken demand for our products in the energy sector. This will be mitigated by increases in sales into new markets, which the Company expects will come from sales into PM’s distribution channels. The degree of success will depend on how quickly the Company is able to place its existing products into the PM distribution channels. Additionally, PM revenues in the United States may also increase benefiting from Manitex’s distribution network. The Company believes that the North American energy sector over time will continue to grow and in turn will drive future demand for our products.
Additionally, the market for container handling equipment in Europe, CVS’s historical market, overall continued to be weak. CVS has, however, been able to offset this effect by expanding their sales effort into other international markets and were able to secure an increase in orders in Q2 and Q3 of 2014.
Factors Affecting Revenues and Gross Profit
The Company derives most of its revenue from purchase orders from dealers and distributors. The demand for the Company’s products depends upon the general economic conditions of the markets in which the Company competes. The Company’s sales depend in part upon its customers’ replacement or repair cycles. Adverse economic conditions, including a decrease in commodity prices, may cause customers to forego or postpone new purchases in favor of repairing existing machinery. Additionally, our Manitex Liftking subsidiary revenues are impacted by the timing of orders received for military forklifts and residential housing starts. CVS revenues are impacted in part by the timing of contract awards related to major port projects.
Gross profit varies from period to period. Factors that affect gross profit include product mix, production levels and cost of raw materials. Margins tend to increase when production is skewed towards larger capacity cranes, special mission oriented vehicles, specialized carriers and heavy material transporters.
29
Table of Contents
The following table sets forth certain financial data for the three years ended December 31, 2014, 2013 and 2012:
Results of Consolidated Operations
MANITEX INTERNATIONAL, INC.
(Thousands of Dollars, except share data)
| Year Ended December 31, 2014 |
Year Ended December 31, 2013 |
Year Ended December 31, 2012 |
||||||||||
| Net revenues |
$ | 264,081 | $ | 245,072 | $ | 205,249 | ||||||
| Cost of sales |
215,817 | 198,596 | 164,785 | |||||||||
|
|
|
|
|
|
|
|||||||
| Gross profit |
48,264 | 46,476 | 40,464 | |||||||||
| Operating expenses |
||||||||||||
| Research and development costs |
2,552 | 2,912 | 2,457 | |||||||||
| Selling, general and administrative expense |
31,776 | 26,026 | 23,548 | |||||||||
|
|
|
|
|
|
|
|||||||
| Total operating expenses |
34,328 | 28,938 | 26,005 | |||||||||
|
|
|
|
|
|
|
|||||||
| Operating income |
13,936 | 17,538 | 14,459 | |||||||||
| Other income (expense) |
||||||||||||
| Interest expense |
(3,150 | ) | (2,946 | ) | (2,457 | ) | ||||||
| Foreign currency transaction (loss) |
(107 | ) | (95 | ) | (110 | ) | ||||||
| Other (expense) income |
(36 | ) | (50 | ) | 6 | |||||||
|
|
|
|
|
|
|
|||||||
| Total other expense |
(3,293 | ) | (3,091 | ) | (2,561 | ) | ||||||
|
|
|
|
|
|
|
|||||||
| Income before income taxes |
10,643 | 14,447 | 11,898 | |||||||||
| Provision for taxes on income |
3,676 | 4,269 | 3,821 | |||||||||
|
|
|
|
|
|
|
|||||||
| Net income |
6,967 | 10,178 | 8,077 | |||||||||
| Net loss attributable to noncontrolling interest |
136 | — | — | |||||||||
|
|
|
|
|
|
|
|||||||
| Net income attributable to shareholders of Manitex International, Inc. |
$ | 7,103 | $ | 10,178 | $ | 8,077 | ||||||
|
|
|
|
|
|
|
|||||||
Year Ended December 31, 2014 Compared to Year Ended December 31, 2013
The above results include the results for companies acquired from their respective effective dates of acquisition: August 19, 2013 for Sabre, November 30, 2013 for Valla, December 16, 2014 for Lift Ventures and December 20, 2014 for ASV.
Net income
For the year ended December 31, 2014, net income was $7.0 million, which consists of revenue of $264.1 million, cost of sales of $215.8 million, research and development costs of $2.6 million, SG&A costs of $31.8 million, interest expense of $3.1 million, foreign currency transaction loss of $0.1 million and income tax expense of $3.7 million.
For the year ended December 31, 2013, net income was $10.2 million, which consists of revenue of $245.1 million, cost of sales of $198.6 million, research and development costs of $2.9 million, SG&A costs of $26.0 million, interest expense of $2.9 million, foreign currency transaction loss of $0.1 million, other expense of $0.1 million and income tax expense of $4.3 million.
Net revenue and gross profit—For the year ended December 31, 2014, net revenue and gross profit were $264.1 million and $48.3 million, respectively. Gross profit as a percent of sales was 18.3% for the year ended
30
Table of Contents
December 31, 2014. For the year ended December 31, 2013 net revenue and gross profit were $245.1 million and $46.5 million, respectively. Gross profit as a percent of sales was 19.0% for the year ended December 31, 2013.
2014 revenues increased $19.0 million or 7.8% from 2013 to $264.1 million, including $2.3 million from the ASV JV that commenced operations in mid-December of 2014. Excluding ASV, 2014 revenues increased 6.8%, driven substantially by growth in container handling equipment, material handling equipment and equipment distribution revenues that grew year over year by 20%, 14% and 24% respectively. Crane revenues decreased in line with the reduction in our largest market, the boom and truck crane market that was down almost 8% year over year and shipments of larger tonnage cranes being down approximately 19% reflecting a softer oil and gas market. Our CVS container handling products benefited from a modest strengthening in Europe as well as expansion and improved distribution into overseas markets.
Gross profit as a percent of net revenues decreased 0.7% to 18.3% for the year ended December 31, 2014 from 19.0% for the comparable 2013 period. The slight decrease in margin percent is principally attributed to product mix, including the unfavorable impact of decreased sales of crane products which generally have higher margins and the effect that the decrease in parts sales as a percent of total revenues. Part sales, which have significantly higher margins, decreased from 15% to 11% of total revenues from 2013 to 2014.
Research and development—Research and development for the year ended December 31, 2014 was $2.6 million compared to $2.9 million for the comparable period in 2013. The Company’s research and development spending continues to reflect our continued commitment to develop and introduce new products that gives the Company a competitive advantage.
Selling, general and administrative expense—Selling, general and administrative expense for the year ended December 31, 2014 was $31.8 million compared to $26.0 million for the comparable period in 2013. Selling general and administrative expense as a percent of revenue for year ended December 31, 2014 was 12.0% an increase of 1.4% from the 10.6% for the comparable period in 2013.
The increase in selling, general and administrative expense is $5.8 million of which approximately $3.4 million is attributed to increases in expenses at companies acquired in 2013 (full year effect) and 2014, another $2.3 million is related to transaction expenses for the ASV and PM (closed January 2015) acquisitions. Another $0.6 million is related to expense incurred in connection with our participation at the ConExpo show in March 2014. This show, which is held every three years, is an international gathering place for the construction industry. Other items had an impact of decreasing expense by $0.5 million, including a substantial decrease in management bonuses which was partially offset by an increase in deferred stock base compensation and increase in selling expenses, the result of an expansion of the sales organization.
Operating income—The Company, had operating income of $13.9 million and $17.5 million for the years ended December 31, 2014 and 2013, respectively. The decrease in operating income is due to an increase in selling, general and administrative expense offset by an increase in gross profit and a small decrease in research and development costs. The increase in gross profit is attributable to an increase in revenues as the gross profit percent decreased 0.7% between 2014 and 2013.
Interest expense—Interest expense was $3.1 million and $2.9 million for the years ended December 31, 2014 and 2013, respectively. The increase is largely due to higher interest expense in December 2014, the result of an increase in outstanding debt of approximately $57.0 million associated with the ASV acquisition.
Foreign currency transaction gains and loss—The Company attempts to purchase forward currency exchange contracts such that the exchange gains and losses on the assets and liabilities denominated in other than the reporting units’ functional currency will be offset by the changes in the market value of the forward currency exchange contracts it holds. The Company records at the balance sheet date the forward currency exchange contracts at their market value with any associated gain or loss being recorded in current earnings as a currency gain or loss.
31
Table of Contents
For the year ended December 31, 2014, the Company had foreign currency loss of $0.1 million compared to a loss of $0.1 million for 2013.
Income tax— Income tax expense was $3.7 million and $4.3 million for the years ended December 31, 2014 and 2013, respectively. The decrease in income tax is attributed to a decrease in pre-tax income, as the Company’s effective rate increased to 34.6% for 2014 from 29.5% effective tax rate for 2013. The increase in the effective tax rate for 2014 is due primarily to higher foreign and state and local taxes.
Net income—Net income for the year ended December 31, 2014 was $7.1 million. This compares with a net income for the year ended December 31, 2013 of $10.2 million.
Year Ended December 31, 2013 Compared to Year Ended December 31, 2012
Financial results include the results for Sabre and Valla from their respective dates of acquisition which are August 19, 2013 and November 30, 2013, respectively.
Net income
For the year ended December 31, 2013, net income was $10.2 million, which consists of revenue of $245.1 million, cost of sales of $198.6 million, research and development costs of $2.9 million, SG&A costs of $26.0 million, interest expense of $2.9 million, foreign currency transaction loss of $0.1 million, other expense of $0.1 million and income tax expense of $4.3 million.
For the year ended December 31, 2012, net income was $8.1 million, which consists of revenue of $205.2 million, cost of sales of $164.8 million, research and development costs of $2.5 million, SG&A costs of $23.5 million, interest expense of $2.5 million, foreign currency transaction loss of $0.1 million and income tax expense of $3.8 million.
Net revenue and gross profit—For the year ended December 31, 2013, net revenue and gross profit were $245.1 million and $46.5 million, respectively. Gross profit as a percent of sales was 19.0% for the year ended December 31, 2013. For the year ended December 31, 2012 net revenue and gross profit were $205.2 million and $40.5 million, respectively. Gross profit as a percent of sales was 19.7% for the year ended December 31, 2012.
The revenue increase between 2012 and 2013 was approximately 19.4% of which 14.2% is attributed to an increase in revenues from crane products, 5.1% is attributed to an increase in revenues from container handling equipment products, 3.5% is attributed to sales from companies acquired in 2013, partially offset by a decrease of other products which had the effect of decreasing revenues 3.4%.
The increase in crane product revenues is principally attributed to an increase in production capacity which allowed the company to reduce its backlog and to more aggressively market cranes with lower lifting capacity. The increase in revenues from the sale of container handling equipment is attributed to an increase in sales to markets outside Europe, which has historically been the largest market for this equipment and is attributed to shipments of tractors to South Africa during the first part of the year and an increase in sales to Latin America in the second half of the year. The sale of the tractors was related to a large tender order that was awarded to CVS in 2012. The increase in Latin American revenues is a benefit from obtaining new dealers in Latin America in 2013. The decrease in other products revenues is attributed to the timing of military orders and a decrease in special trailer revenues.
Gross profit as a percent of net revenues decreased 0.7% to 19.0% for the year ended December 31, 2013 from 19.7% for the comparable 2012 period. The slight decrease in margin percent is principally attributed to product mix, including the favorable impact of increased sales of crane products which generally have higher margins which was more than offset by an increase in chassis sales which are sold with only a nominal market up and the
32
Table of Contents
effect that the decrease in parts sales as a percent of total revenues. Part sales, which have significantly higher margins, decreased from 16% to 15% of total revenues from 2012 to 2013. A decrease in volumes for military and special trailer also contributed to the decrease in the gross margin percent.
Research and development—Research and development for the year ended December 31, 2013 was $2.9 million compared to $2.5 million for the comparable period in 2012. The increase in research and development expense reflects our continued commitment to develop and introduce new products that gives the Company a competitive advantage.
Selling, general and administrative expense—Selling, general and administrative expense for the year ended December 31, 2013 was $26.0 million compared to $23.5 million for the comparable period in 2012. Selling general and administrative expense as a percent of revenue for year ended December 31, 2013 was 10.6% a decrease of 0.9% from the 11.5% for the comparable period in 2012.
The increase in selling, general and administrative expense is $2.5 million of which approximately $1.0 million are either selling, general and administrative expenses at companies acquired in 2013 or costs directly associated with the acquisitions. Excluding the impact of acquisitions, selling, general and administrative expenses increased by approximately $1.5 million. Approximately two thirds of the remaining increase is attributed to an increase in selling expenses, which are partially a direct impact of an increase in revenues and also the result of an expansion of the sales organization. The majority of the remaining increase in expense is attributed to an increase in compensation expense. Although selective staff additions contributed to an increase in compensation expense, the primary drivers were an increase in non-cash stock based deferred compensation and an increase in performance based incentive compensation.
Operating income—The Company, had operating income of $17.5 million and $14.5 million for the years ended December 31, 2013 and 2012, respectively. The increase in operating income is due to an increase in gross profit of $6 million offset by $2.9 million increase in operating expenses. An increase in revenues accounts for the increase in gross profit as the gross profit percent decreased 0.7% between 2013 and 2012. The increase in operating expenses is related to increases in research and development and selling, general and administrative expenses.
Interest expense—Interest expense was $2.9 million and $2.5 million for the years ended December 31, 2013 and 2012, respectively. Interest expense increased $0.5 million the result of an increase in outstanding debt and a 0.5% increase in the interest rate on our U.S. and Canadian Revolver starting in August 2013.
Foreign currency transaction gains and loss—The Company attempts to purchase forward currency exchange contracts such that the exchange gains and losses on the assets and liabilities denominated in other than the reporting units’ functional currency will be offset by the changes in the market value of the forward currency exchange contracts it holds. The Company records at the balance sheet date the forward currency exchange contracts at their market value with any associated gain or loss being recorded in current earnings as a currency gain or loss.
For the years ended December 31, 2013 and 2012, the Company had foreign currency losses of $0.1 million.
Income tax—Income tax expense was $4.3 million and $3.8 million for the years ended December 31, 2013 and 2012, respectively. The increase in income tax is attributed to an increase in pre-tax income, as the Company’s effective rate decreased to 29.5% for 2013 from 32.1% the effective tax rate for 2012. The effective tax rate for 2013 is favorably impacted by the Domestic Production Activities Deduction (Section 199) and Federal Research and Development tax credits. In the prior year, the Company was not able to recognize the Domestic Production Activities Deduction as it had unutilized net operating loss carryforwards. Additionally, the Company was not able to recognize a Federal Research and Development tax credit in 2012 as the provision in the Internal Revenue Code authorizing the R&D credit had expired.
33
Table of Contents
The American Taxpayer Reconciliation Act enacted on January 2, 2013, retroactively restored the Research and Development credit back to January 1, 2012. The tax provision for 2013 includes discrete items of $206 primarily related to 2012 Federal Research & Development tax credits which were retroactively restored.
Net income—Net income for the year ended December 31, 2013 was $10.2 million. This compares with a net income for the year ended December 31, 2012 of $8.1 million.
SEGMENT INFORMATION
Lifting Equipment Segment
| 2014 | 2013 | 2012 | ||||||||||
| Net revenues |
$ | 245,435 | $ | 228,772 | $ | 188,792 | ||||||
| Operating income |
21,640 | 23,311 | 19,880 | |||||||||
| Operating margin |
8.8 | % | 10.2 | % | 10.5 | % | ||||||
| (1) | The above results include the results for Sabre and Valla from their respective dates of acquisition which are August 19, 2013 and November 30, 2013, respectively. |
Year Ended December 31, 2014 Compared to Year Ended December 31, 2013
Net revenues—Net revenues increased $16.7 million to $245.4 million for the year ended December 31, 2014 from $228.8 million for the comparable period in 2013.
Approximately 75% of the increase in revenues is attributed to having Sabre and Valla for a full year in 2014. The Remaining increase is attributed to high sales of container handling equipment which was offset by a decrease in the sales of crane products.
Additionally, we saw a shift toward cranes with lower lifting capacity during the year. Container handling sales continue to benefit in 2014 from obtaining new dealers in Latin America in 2013. Additionally, the Italian market for container handling equipment strengthened during the year. The decrease in crane sales is due to a softening in demand from the energy sector.
Operating income and operating margins—Operating income of $21.6 million for the year ended December 31, 2014 was equivalent to 8.8% of net revenues compared to an operating income of $23.3 million for the year ended December 31, 2013 or 10.2% of net revenues.
Operating income decreased $1.7 million which is the result of increase in operating expenses as gross profit was not significantly different between years. The benefit that an increase in revenues had on gross profit was essentially offset by a decrease in the gross margin percent. The increase in operation expense is attributed to an increase in selling, general and administrative expense as research and development cost decreased $0.4 million. The increase in operating expenses is attributed to increases in expenses at companies acquired in 2013 (full year effect), cost to participate in the ConExpo trade show in March 2014 and higher selling expenses.
The decrease in operating margin percent is the result of a decrease in gross margin percent and higher operating expenses.
Year Ended December 31, 2013 Compared to Year Ended December 31, 2012
Net revenues—Net revenues increased $40.0 million to $228.8 million for the year ended December 31, 2013 from $188.8 million for the comparable period in 2012.
The revenue increase between 2012 and 2013 was approximately 21.2% of which 15.5% is attributed to an increase in revenues from crane products, 5.5% is attribute an increase in revenues from container handling
34
Table of Contents
equipment products, 4.0% is attributed to sales from companies acquired in 2013, partially offset by a decrease of other products which had the effect of decreasing revenues 3.8%.
The increase in crane product revenues is principally attributed to an increase in production capacity which allowed the company to reduce its backlog and to more aggressively market cranes with lower lifting capacity. The increase in revenues from the sale of container handling equipment is attributed to increase in sales to markets outside Europe, which has historically been the largest market for Company’s port handling equipment. This increase is attributed to shipments of tractors to South Africa during the first part of the year and an increase in sales to Latin America in the second half of the year. The sale of the tractors was related to a large tender order that was awarded to CVS in 2012. The increase in Latin American revenues is a benefit from obtaining new dealers in Latin America in 2013. The decrease in other products revenues is attributed to the timing of military orders and a decrease in special trailer revenues.
Operating income and operating margins—Operating income of $23.3 million for the year ended December 31, 2013 was equivalent to 10.2% of net revenues compared to an operating income of $19.9 million for the year ended December 31, 2012 or 10.5% of net revenues.
Operating income increased $3.4 million which is the net of an increase in gross profit of $5.1 million offset by increase in operating expenses of $1.7 million. The increase in gross profit is attributed to an increase in revenues as there was a modest decrease in the gross profit percent. Approximately 40% of the increase in operating expenses is attributed to companies acquired in 2013. Another 25% of the increase in operating expenses is related to an increase in research and development cost. The majority of the remaining increase is attributed to an increase in selling expenses, which are partially a direct impact of an increase in revenues and also the result of an expansion of the sales organization.
The decrease in operating margin percent is attributed to the decrease in the gross profit as percent of revenues between 2012 and 2013.
ASV Segment
| 2014 | ||||
| Net revenues |
$ | 2,264 | ||
| Operating loss |
(121 | ) | ||
| Operating margin |
(5.3 | )% | ||
ASV results are included from the effective date of acquisition, December 20, 2014.
Year Ended December 31, 2014 Compared to Year Ended December 31, 2013
Net revenues—The ASV segment had net revenues of $2.3 million for the year ended December 31, 2014.
Operating (loss) and operating margin—Operating loss of $0.1 million for the year ended December 31, 2014 was equivalent to (5.3)% of net revenues. The results for the period include costs of approximately $0.2 million related to expenses incurred for the formation of the JV with Terex corporation and inventory step up adjustment from purchased accounting.
Equipment Distribution Segment
| 2014 | 2013 | 2012 | ||||||||||
| Net revenues |
$ | 21,104 | $ | 16,951 | $ | 17,090 | ||||||
| Operating income |
374 | 628 | 222 | |||||||||
| Operating margin |
1.8 | % | 3.7 | % | 1.3 | % | ||||||
35
Table of Contents
Year Ended December 31, 2014 Compared to Year Ended December 31, 2013
Net revenues—The Equipment Distribution segment had net revenues of $21.1 million and $17.0 million for the years ended December 31, 2014 and 2013, respectively, an increase of $4.1 million. The increase in revenue is primarily due to an increase in sales of products manufactured by the Lifting Segment. An increase in sales of sale of new Terex cranes also contributed to the increase in revenues.
Operating income (loss) and operating margins—Operating income of $0.4 million for the year ended December 31, 2014 was equivalent to 1.8% of net revenues and compares to operating income of $0.6 million for the year ended December 31, 2013 or 3.7% of net revenues.
Operating income decreased $0.3 million between years. The decrease in operating income is attributable to a $0.1 million decrease in gross profit and $0.2 million increase in operating expenses. The decrease in gross profit is due to a decrease in the gross profit percent that is the result of an increase in sales of products manufactured by the Lifting Segment, which were sold at lower margins and a decrease in part sales. A decrease in part sales and part sales as a percent of revenues will decrease the gross margin percent as part sales margins are substantially higher than those realized on the sale of new cranes and used equipment. The increase in operating expense is due to higher selling expense related to our efforts to increase Valla and PM United States market penetration.
Year Ended December 31, 2013 Compared to Year Ended December 31, 2012
Net revenues—The Equipment Distribution segment had net revenues of $17.0 million and $17.1 million for the years ended December 31, 2013 and 2012, respectively, an insignificant decrease of $0.1 million.
Operating income (loss) and operating margins—Operating income of $0.6 million for the year ended December 31, 2013 was equivalent to 3.7% of net revenues and compares to operating income of $0.2 million for the year ended December 31, 2012 or 1.3% of net revenues.
Operating income and operating margin percent improved this year as prior year results were adversely impact by the sale of several cranes purchased in 2009 which were still in our inventory until they were sold during 2012 at a loss.
Liquidity and Capital Resources
Cash and cash equivalents were $4.4 million and $6.1 million at December 31, 2014 and December 31, 2013, respectively. In addition, the Company has U.S. and Canadian revolving credit facilities, with maturity dates of August 19, 2018 and our Canadian Subsidiary also has a specialized export facility. Additionally, ASV has a revolving credit facility, which is for its sole use. At December 31, 2014 the Company had approximately $5.7 million available in North America to borrow under its revolving credit facilities. ASV has a revolving credit facility with approximately $20.0 million of availability. ASV will, however, be required to make a $16.5 million tax payment in March 2015.
At December 31, 2014, CVS had established demand credit facilities with twelve Italian banks. Under the facilities, CVS can borrow up to €0.3 million ($0.4 million) on an unsecured basis and additional amounts as advances against orders, invoices and letter of credit with a total maximum facilities (including the unsecured portion) of €13.5 million ($16.4 million). The maximum amount outstanding is limited to 80% of the assigned accounts receivable if there is an invoice issued or 50% if there is an order/contract. The banks will evaluate each request to borrow individually and determine the allowable advance percentage and interest rate. In making its determination the bank considers the customer’s credit and location of the customer. At December 31, 2014, the banks had advanced CVS €6.6 million ($8.0 million) and had issued performance bonds which total €0.5 million ($0.6 million), which also count against the maximum that can be borrowed under these facilities.
36
Table of Contents
The Company needs cash to meet its working capital needs as the business grows, to acquire capital equipment, and to fund acquisitions and debt repayment. We intend to use cash flows from operations and existing availability under the current revolving credit facilities to fund anticipated levels of operations for approximately the next 12 months. As our availability under our credit lines is limited, it is important that we manage our working capital. We may need to raise additional capital through debt or equity financings to support our growth strategy, which may include additional acquisitions. There is no assurance that such financing will be available or, if available, on acceptable terms.
Stock offerings and convertible debt issuance
On December 19, 2014 the Company issued 1,108,156 shares of the Company’s common stock to Terex and received $12.5 million. On that date, the Company also issued debentures with a face amount of $7.5 million to Terex.
On September 30, 2013, the Company issued 1,375,000 shares of the Company’s common stock and received net proceeds after expenses of $13.9 million dollars. The proceeds and additional cash were used to repay the $15,000 term debt, which was the source of funds used acquire Sabre.
37
Table of Contents
Outstanding borrowings and required payments
The following is a summary of our outstanding borrowings at December 31, 2014:
(In millions)
| Outstanding Balance |
Interest Rate |
Interest Paid |
Principal Payment | |||||||||||
| U.S Revolver |
$ | 34.2 | 2.91 to 5.00 | % | Monthly | August 19, 2018 maturity | ||||||||
| Canadian Revolver |
8.6 | 3.25 | % | Monthly | August 19, 2018 maturity | |||||||||
| Specialized export facility |
2.8 | 3.25 | % | Monthly | 60 days after shipment or 5 days after receipt of payment | |||||||||
| Load King bank debt |
1.0 | 3.00 to 6.25 | % | Monthly | $0.02 million monthly including interest | |||||||||
| Load King debt (SD Board of Economic Development |
0.8 | 3.00 | % | Monthly | $0.005 million monthly including Interest | |||||||||
| Note payable—Terex |
0.5 | 6.00 | % | Quarterly | $0.25 million March 1, 2015 and 2016 ($0.15 million can be paid in stock) | |||||||||
| Note payable—Terex |
1.6 | 4.50 | % | Semi-Annual | $0.04 million interest payment June 19, 2015 and $1.64 million interest and principle payment on December 19, 2015 | |||||||||
| Convertible note—related party |
6.6 | 7.5 | % | Semi-Annual | December 19, 2019 maturity | |||||||||
| ASV revolving credit facility |
3.6 | 4.0 | % | Monthly | December 19, 2019 maturity | |||||||||
| ASV Term loan |
40.0 | 10.50 | % | Monthly | $0.50 million quarterly plus interest unpaid balance due December 19, 2019 | |||||||||
| Capital lease—cranes for sale |
1.7 | 4.4 to 6.36 | % | Monthly | Over 36 or 60 months | |||||||||
| Capital lease—Georgetown facility |
2.2 | 12.00 | % | Monthly | $0.07 million monthly payment includes interest | |||||||||
| Acquisition note—Valla |
0.2 | 1.5 | % | Annually | $0.1 in 2015 and 2016 | |||||||||
| Capital leases—Winona facility |
0.5 | 6.13 | % | Monthly | To be paid in 2015 | |||||||||
| CVS short-term working capital borrowings |
8.0 | 3.37 to 6.58 | % | Monthly | Upon payment of invoice or letter of credit
| |||||||||
|
|
|
|||||||||||||
| $ | 112.3 | |||||||||||||
The debt has various maturity dates. See Note 11 to the financial statements for additional details.
Change in outstanding debt
In 2014, existing debt (including lines of credit, capital lease obligations and the current portion of notes payable and capital lease obligations) increased $58.1 million dollars to $112.3 million from $54.2 million at December 31, 2013. The increase in debt is principally attributed to ASV borrowings of $43.6 million and additional borrowing to provide funds to purchase ASV which includes $5.0 million borrowed against the Company’s U.S. Revolver and $6.6 million, net of discount, generated from the issuance of a convertible note.
38
Table of Contents
Our debt increased by approximately $58.1 million. The following is a summary of changes in debt:
(In millions)
| Increase/ (decrease) |
||||
| U.S. Revolver |
$ | 5.0 | ||
| Canadian Revolver |
0.5 | |||
| Special export facility |
0.1 | |||
| Notes payable-Terex |
1.3 | |||
| Load King bank debt |
(0.1 | ) | ||
| Capital leases—buildings |
(0.6 | ) | ||
| Capital leases—equipment |
0.2 | |||
| Convertible note—related party |
6.6 | |||
| ASV Term loan |
40.0 | |||
| ASV Revolving Credit Facility |
3.6 | |||
| CVS working capital borrowings |
1.5 | |||
|
|
|
|||
| $ | 58.1 | |||
|
|
|
|||
2014
Operating activities used $1.5 million of cash for the year ended December 31, 2014, and is comprised of net earnings of $7.0 million, and non-cash items of $5.7 million offset by an increase in working capital of $14.2 million. The following are the principal non-cash items: depreciation and amortization of $4.6 million, and stock based deferred compensation of $1.1 million.
The increase in working capital is principally due to increases in accounts receivable of $12.9 million, and inventory of $5.6 million, partially offset by increase in accounts payable of $2.9 million, accrued expenses of $0.7 million and other current liabilities of $0.7 million. The increase in accounts receivables is primarily due to a longer collection cycle in 2014. The collection cycle was lengthened in part because there were certain receivables from governmental agencies on which payment was delayed. The timing of payments from a couple of larger customers also contributed to a longer payment cycle. Additionally, a modest increase in revenues between for the fourth quarter 2014 versus 2013 also contributed to a higher receivable balance in 2014. The increase in inventory is attributed to increases in inventory at Lifting, CVS and Crane & Machinery. The increase at Liftking is related increase military contracts. The increase at CVS is related to continue anticipated increase in revenues. Finally, the increase at Crane & Machinery represents primarily Valla and PM inventory, which is being purchased to shorten the delivery cycle to U.S. customers. The increase in accounts payable is due to the increase in inventory. The increase in accruals is primarily related to increased accruals for payroll and benefits in our European operations offset by a decrease in accrued bonuses. The increase in other current liabilities represents an increase in deposits received from our customers.
Cash flows related to investing activities consumed $26.0 million of cash for the year ended December 31, 2014. The Company used $25.0 million to acquire ASV and invested another $1.0 in capital equipment. The $1.0 million spent to purchase capital equipment is the total of numerous purchases for various operations. No single item in itself was particularly significant.
Financing activities generated $26.7 million in cash for the year ended December 31, 2014. The Company raised $12.5 million in a private placement of common stock in December 2014 and another $7.5 million (including the portion allocated to equity) from the issuance of a convertible note. The last major source of cash was a $5.0 million increase in the amount borrowed under the U.S. revolver. This additional $5.0 million was used to purchase ASV.
39
Table of Contents
2013
Operating activities generated $2.1 million of cash for the year ended December 31, 2013, and is comprised of net earnings of $10.2 million, and non-cash items of $4.5 million offset by an increase in working capital of $12.6 million. The following are the principal non-cash items: depreciation and amortization of $3.9 million, stock based deferred compensation of $0.7 million, and increase in the provision for doubtful accounts of $0.2 offset by an increase in net deferred tax assets of $0.2 million, a decrease in the reserve for uncertain tax positions of $0.1 million and a gain on the disposal of assets of $0.1 million.
The increase in working capital is principally due to increases in inventory of $8.9 million, prepaids of $0.4 million, other assets of $0.9 million and decreases in accounts payable of $4.1 million and accruals of $0.1 million and other current liabilities or $.01 million offset by decrease in accounts receivable of $1.7, and accounts receivable—finance of $0.3 million. The increase in inventory is principally due to increased revenues. A slight increase in days in inventory on hand did, however, contribute to the increase. The increase in prepaids is principally attributed to prepayment for the CONEXPO show, which is held in March every three years and an increase in prepayments to vendor. Other assets increase as fees and expenses incurred in connection with the Company’s new banking facilities were capitalized and are being amortized. The decrease in accounts payable and accounts receivable is due to the timing of payments to vendors and from customers respectively.
Cash flows related to investing activities consumed $14.1 million of cash for the year ended December 31, 2013. The Company used $13.0 million to acquire Sabre and invested another $1.2 in capital equipment. The $1.2 million spent to purchase capital equipment is the total of numerous purchases for various operations. No single item in itself was particularly significant.
Financing activities generated $16.1 million in cash for the year ended December 31, 2013. The Company raised $13.9 million in stock offering in September 2013. The proceeds from the stock offering were used to repay debt, principally incurred to purchase Sabre. An increase in debt, excluding $3.0 of non-cash items (see note 16 in the financial statements) provided $2.2 million of cash.
Contingencies
The Company is involved in various legal proceedings, including product liability and workers’ compensation matters which have arisen in the normal course of operations. Certain cases are at a preliminary stage, and it is not possible to estimate the amount or timing of any cost to the Company.
The Company does not believe that these contingencies in aggregate will have a material adverse effect on the Company.
Off Balance Sheet Arrangements
Comerica has issued a $0.645 million standby letter of credit in favor of an insurance carrier to secure obligations which may arise in connection with future deductible payments that may be incurred under the Company’s workman compensation insurance policies.
Additionally, various Italian banks have issued performance bonds which total €0.5 million ($0.6 million) which are also guaranteed by the Company.
40
Table of Contents
Contractual Obligations
The following is a schedule as of December 31, 2014 of our long-term contractual commitments, future minimum lease payments under non-cancelable operating lease arrangements and other long-term obligations.
(in thousands)
| Payments due by period | ||||||||||||||||||||
| Total | 2015 | 2016- 2017 |
2018- 2019 |
Thereafter | ||||||||||||||||
| Long-term debt obligations (4) |
$ | 127,932 | $ | 12,368 | $ | 16,471 | $ | 90,333 | $ | 8,760 | ||||||||||
| CVS working capital borrowing (3) |
8,217 | 8,217 | — | — | — | |||||||||||||||
| Operating lease obligations |
6,798 | 1,627 | 2,656 | 1,815 | 700 | |||||||||||||||
| Capital lease obligations (3) |
5,427 | 2,256 | 2,512 | 659 | — | |||||||||||||||
| Legal Settlement (see Note 23) (3) |
1,615 | 95 | 190 | 190 | 1,140 | |||||||||||||||
| Service agreements |
13,082 | 2,464 | 5,152 | 5,466 | — | |||||||||||||||
| Purchase obligations (1) |
35,197 | 35,197 | — | — | — | |||||||||||||||
|
|
|
|
|
|
|
|
|
|
|
|||||||||||
| Total |
$ | 198,268 | $ | 62,224 | $ | 26,981 | $ | 98,463 | $ | 10,600 | ||||||||||
|
|
|
|
|
|
|
|
|
|
|
|||||||||||
| (1) | Except for a very insignificant amount, purchase obligations are for inventory items. Purchase obligations not for inventory would include research and development materials, supplies and services. |
| (2) | At December 31, 2014, the Company had unrecognized tax benefits of $215 thousand for which the Company is unable to make reasonably reliable estimates of the period of cash settlement with the respective tax authority. Thus, these liabilities have not been included in the contractual obligations table. (see Note 14). |
| (3) | CVS working capital borrowing, Capital lease obligations and legal settlement include imputed interest. |
| (4) | Long-term debt obligations include expected interest expense. Interest expense is calculated using fixed interest rates for indebtedness as of December 31, 2014. |
Related Party Transactions
For a description of the Company’s related party transactions, please see Note 22 to the Company’s consolidated financial statements entitled “Transactions between the Company and Related Parties.”
Critical Accounting Policies and Estimates
The preparation of our financial statements and related disclosures in conformity with accounting principles generally accepted in the United States of America requires management to make estimates and judgments that affect our reported amounts of assets and liabilities, revenues and expenses, and related disclosures of contingent assets and liabilities. On an on-going basis, we evaluate our estimates and assumptions based upon historical experience and various other factors and circumstances. Management believes that our estimates and assumptions are reasonable under the circumstances; however, actual results may vary from these estimates and assumptions under different future circumstances. We have identified the following critical accounting policies that affect the more significant judgments and estimates used in the preparation of our consolidated financial statements.
Revenue Recognition. Revenue and related costs are generally recorded when products are shipped and invoiced to our customers. Revenue is recognized when title passes and risk of loss pass to our customers which is generally occurs upon shipment depending upon the terms of the contract. Under certain contracts with our customers title passes to the customers when the units are completed. The units are segregated from our inventory and identified as belonging to the customer, the customer is notified that the units are complete and wait pick up or delivery as specified by the customer before income is recognized. Additionally, the customer is
41
Table of Contents
requested to sign an “Invoice Authorization Form” which acknowledges the contract terms and acknowledges that the customer has economic ownership and control over the unit. It also acknowledges that we are going to invoice the unit per terms of the contract. The Company insures any custodial risk that it may retain.
For FOB contracts, customers may be invoiced prior to the time customers take physical possession. Revenue is recognized in such cases only when the customer has a fixed commitment to purchase the units, the units have been completed, tested and made available to the customer for pickup or delivery, and the customer has authorized in writing that we hold the units for pickup or delivery at a time specified by the customer. In such cases, the units are invoiced under our customary billing terms, title to the units and risks of ownership pass to the customer upon invoicing, the units are segregated from our inventory and identified as belonging to the customer and we have no further obligations under the order. The Company insures any custodial risk that it may retain.
In addition, our policy requires in all instances certain minimum criteria be met in order to recognize revenue, specifically:
| a) | Persuasive evidence that an arrangement exists; |
| b) | The price to the buyer is fixed or determinable; |
| c) | Collectability is reasonably assured; and |
| d) | We have no significant obligations for future performance. |
Investment—Equity Method of Accounting. Our non-marketable equity investments are investments we have made in privately-held companies accounted for under the equity method. We periodically review our non-marketable equity investments for impairment. No impairments were recognized for the year ended December 31, 2014.
Allowance for Doubtful Accounts. Accounts Receivable is reduced by an allowance for amounts that may become uncollectible in the future. The Company’s estimate for the allowance for doubtful accounts related to trade receivables includes evaluation of specific accounts where we have information that the customer may have an inability to meet its financial obligations.
Inventories and Related Reserve for Obsolete and Excess Inventory. Inventories are valued at the lower of cost or market and are reduced by a reserve for excess and obsolete inventories. The estimated reserve is based upon specific identification of excess or obsolete inventories.
Other Intangible Assets. The Company accounts for Other Intangible Assets under the guidance of ASC 350, “Intangibles—Goodwill and Other”. The Company capitalizes certain costs related to patent technology. Additionally, a substantial portion of the purchase price related to the Company’s acquisitions has been assigned to patents or unpatented technology, trade name, customer backlog, and customer relationships. Under the guidance, Other Intangible Assets with definite lives are amortized over their estimated useful lives. Intangible assets with indefinite lives are tested annually for impairment.
Goodwill. Goodwill, representing the difference between the total purchase price and the fair value of assets (tangible and intangible) and liabilities at the date of acquisition, is reviewed for impairment annually, and more frequently as circumstances warrant, and written down only in the period in which the recorded value of such assets exceed their fair value. The Company does not amortize goodwill in accordance with Financial Accounting Standards Board (the “FASB”) Accounting Standards Codification (“ASC”) 350, “Intangibles—Goodwill and Other” (“ASC 350”). The Company selected October 1 as the date for the required annual impairment test.
Goodwill is tested for impairment at the reporting unit level. The Company’s three operating segments comprise the reporting units for goodwill impairment testing purposes.
42
Table of Contents
Under ASU 2011-08, entities are provided with the option of first performing a qualitative assessment on none, some, or all of its reporting units to determine whether it is more likely than not that the fair value of a reporting unit is less than its carrying value. If after completing a qualitative analysis, it is determined that it is more likely than not that the fair value of a reporting unit is less than its carrying value a quantitative analysis is required.
In 2014, the Company elected to evaluate the Lifting Equipment and Equipment Distribution reporting unit’s goodwill using the quantitative two step approach. The first step used to identify potential impairment involves comparing the reporting unit’s estimated fair value to its carrying value, including goodwill. The aforementioned mentioned Step one quantitative tests did not indicate impairment. During the first step testing, the Company evaluated goodwill for impairment using a business valuation method, which is calculated as of a measurement date by determining the present value of debt-free, after-tax projected future cash flows, discounted at the weighted average cost of capital of a hypothetical third party buyer. The market approach was also considered in evaluating the potential for impairment by calculating fair value based on multiples of earnings before interest, taxes, depreciation and amortization (EBITDA) of comparable, publicly traded companies. This analysis also did not indicate impairment. Moreover, the Company also observed implied EBITDA multiples from relatively recent merger and acquisition activity in the industry, which was used to test the reasonableness of the results.
The second step of the process involves the calculation of an implied fair value of goodwill for each reporting unit for which step one indicated impairment. The implied fair value of goodwill is determined by measuring the excess of the estimated fair value of the reporting unit over the estimated fair values of the individual assets, liabilities and identifiable intangibles as if the reporting unit was being acquired in a business combination. If the implied fair value of goodwill exceeds the carrying value of goodwill assigned to the reporting unit, there is no impairment. If the carrying value of goodwill assigned to a reporting unit exceeds the implied fair value of the goodwill, an impairment charge is recorded for the excess. An impairment loss cannot exceed the carrying value of goodwill assigned to a reporting unit and the subsequent reversal of goodwill impairment losses is not permitted.
The determination of fair value requires the Company to make significant estimates and assumptions. These estimates and assumptions primarily include, but are not limited to, revenue growth and operating earnings projections, discount rates, terminal growth rates, and required capital expenditure projections. Due to the inherent uncertainty involved in making these estimates, actual results could differ materially from those estimates. Deterioration in the market or actual results as compared with the projections may ultimately result in a future impairment. In the event, the Company determines that goodwill is impaired in the future the Company would need to recognize a non-cash impairment charge.
For 2012 and 2013, the Company determined on a qualitative basis, that it was not more likely than not that the fair value of the Lifting reporting unit was less than its carrying value. For 2013, the Company also determined on a qualitative basis, that it was not more likely than not that the fair value of the Equipment Distribution reporting unit was less than its carrying value.
In 2012, the Company also elected to evaluate the Equipment Distribution reporting unit’s goodwill using the quantitative two step approach. The first step used to identify potential impairment involves comparing the reporting unit’s estimated fair value to its carrying value, including goodwill. The aforementioned mentioned step one quantitative tests did not indicate impairment.
The Company did not have any impairment for the years ended December 31, 2014, 2013 and 2012
Impairment of Long Lived Assets.—The Company’s policy is to assess the realizability of its long-lived assets, including intangible assets, and to evaluate such assets for impairment whenever events or changes in circumstances indicate that the carrying amount of such assets (or group of assets) may not be recoverable. Impairment is determined to exist if the estimated future undiscounted cash flows are less than the carrying value. Future cash flow projections include assumptions for future sales levels, the impact of cost
43
Table of Contents
reduction programs, and the level of working capital needed to support each business. The amount of any impairment then recognized would be calculated as the difference between the estimated fair value and the carrying value of the asset. The Company did not have any impairment for the years ended December 31, 2014, 2013 and 2012.
Warranty Expense. The Company establishes reserves for future warranty expense at point when revenue is recognized by the Company and is based on a percentage of revenues. The provision for estimated warranty claims, which is included in cost of sales, is based on sales.
Litigation Claims. In determining whether liabilities should be recorded for pending litigation claims, the Company must assess the allegations and the likelihood that it will successfully defend itself. When the Company believes it is probable that it will not prevail in a particular matter, it will then make an estimate of the amount of liability based, in part, on the advice of outside legal counsel.
Income Taxes. The Company accounts for income taxes under the provisions of ASC 740 “Income Taxes,” which requires recognition of income taxes based on amounts payable with respect to the current year and the effects of deferred taxes for the expected future tax consequences of events that have been included in the Company’s financial statements or tax returns. Under this method, deferred tax assets and liabilities are determined based on the differences between the financial accounting and tax basis of assets and liabilities, as well as for operating losses and tax credit carryforwards using enacted tax rates in effect for the year in which the differences are expected to reverse. Valuation allowances are recorded to reduce deferred tax assets when it is more likely than not a tax benefit will not be realized.
ASC 740 also prescribes a recognition threshold and measurement attribute for the financial statement recognition and measurement of a tax position taken or expected to be taken in a tax return, as well as guidance on derecognition, classification, interest and penalties, accounting in interim periods, disclosure and transition.
In assessing the realizability of deferred tax assets, management considers whether it is more likely than not that some portion or all of the deferred tax assets will be realized. The ultimate realization of deferred tax assets is dependent upon the generation of future taxable income prior to the expiration of any net operating loss carryforwards. See Note 15, Income Taxes, for further details.
Recently Adopted Accounting Guidance
In May 2014, the FASB issued ASU 2014-09, “Revenue from Contracts with Customers,” (“ASU 2014-09”). ASU 2014-09 outlines a new, single comprehensive model for entities to use in accounting for revenue arising from contracts with customers and supersedes most current revenue recognition guidance, including industry-specific guidance. This new revenue recognition model provides a five-step analysis in determining when and how revenue is recognized. The new model will require revenue recognition to depict the transfer of promised goods or services to customers in an amount that reflects the consideration a company expects to receive in exchange for those goods or services. ASU 2014-09 is effective for reporting periods beginning after December 15, 2016, and early adoption is not permitted. The Company is evaluating the impact that adoption of this guidance will have on the determination or reporting of its financial results.
In June 2014, the FASB issued ASU 2014-12, “Accounting for Share-Based Payments When the Terms of an Award Provide that a Performance Target Could be Achieved after the Requisite Service Period,” (“ASU 2014-12”). ASU 2014-12 requires that a performance target that affects vesting, and that could be achieved after the requisite service period, be treated as a performance condition. As such, the performance target should not be reflected in estimating the grant date fair value of the award. ASU 2014-12 is effective for reporting periods beginning after December 15, 2015. Early adoption is permitted. Adoption of this guidance is not expected to have a significant impact on the determination or reporting of the Company’s financial results.
44
Table of Contents
In August 2014, the FASB issued ASU 2014-15, “Disclosure of Uncertainties about an Entity’s Ability to Continue as a Going Concern,” (“ASU 2014-15”). ASU 2014-15 requires management to perform interim and annual assessments of an entity’s ability to continue as a going concern for a one year period subsequent to the date of the financial statements. An entity must provide certain disclosures if conditions or events raise substantial doubt about the entity’s ability to continue as a going concern. The guidance is effective for all entities for the first annual period ending after December 15, 2016 and interim periods thereafter, with early adoption permitted. Adoption of this guidance is not expected to have any impact on the determination or reporting of the Company’s financial results.
Except as noted above, the guidance issued by the FASB during the current year is not expected to have a material effect on the Company’s consolidated financial statements.
| ITEM 7A. | QUANTITATIVE AND QUALITATIVE DISCLOSURES ABOUT MARKET RISK |
The Company is exposed to certain market risks that exist as part of our ongoing business operations and the Company’s use of derivative financial instruments, where appropriate, to manage our foreign change risks. As a matter of policy, the Company does not engage in trading or speculative transactions. For further information on accounting policies related to derivative financial instruments, refer to Note 6—“Derivative Financial Instruments” in our Consolidated Financial Statements.
Foreign Exchange Risk
The Company is exposed to fluctuations in foreign currency cash flows related to third-party purchases and sales, intercompany product shipments and intercompany loans. The Company is also exposed to fluctuations in the value of foreign currency investments in subsidiaries and cash flows related to repatriation of these investments. Additionally, the Company is exposed to volatility in the translation of foreign currency earnings to U.S. Dollars. Primary exposures include the U.S. Dollar when compared to functional currencies of our major foreign subsidiaries, which include the Euro and the Canadian dollar. The Company assesses foreign currency risk based on transactional cash flows, identifies naturally offsetting positions and purchases hedging instruments to partially offset anticipated exposures. At December 31, 2014, the Company had foreign exchange contracts with a notional value of $2.9 million. The fair market value of these arrangements, which represents the cost to settle these contracts, was $0.2 at December 31, 2014. At December 31, 2014, the Company performed a sensitivity analysis on the effect that aggregate changes in the translation effect of foreign currency exchange rate changes would have on our operating income. Based on this sensitivity analysis, we have determined that a change in the value of the U.S. dollar relative to currencies outside the U.S. by 10% to amounts already incorporated in the financial statements for the year ended December 31, 2014 would have $0.1 million impact on the translation effect of foreign currency exchange rate changes already included in our reported operating income for the period.
Interest Rate Risk
The Company is exposed to interest rate volatility with regard to future issuances of fixed rate debt and existing issuances of variable rate debt. Primary exposure includes movements in the U.S. prime rate, the Canadian prime rate and EURIBOR. At December 31, 2014, the Company had approximately $99.16 million of variable interest debt with average weighted average interest rate at year end of approximately 6.3%.
At December 31, 2014, the Company performed a sensitivity analysis to determine the impact that in increase in interest rates would have. Based on this sensitivity analysis, the Company has determined that an increase of 10% in our average floating interest rates at December 31, 2014 would increase interest expense by approximately $0.6 million.
45
Table of Contents
Commodities Risk
Principal materials and components that the Company uses in our various manufacturing processes include steel, castings, engines, tires, hydraulics, cylinders, drive trains, electric controls and motors, and a variety of other commodities and fabricated or manufactured items. Extreme movements in the cost and availability of these materials and components may affect the Company’s financial performance. Changes input costs did not have a significant effect on the Company’s operating performance in 2014. During 2014, raw materials and component were generally available to meet our production schedules and had no significant impact on 2014 revenues.
In the absence of labor strikes or other unusual circumstances, substantially all materials and components are normally available from multiple suppliers. However, certain businesses receive materials and components from a single source supplier, although alternative suppliers of such materials may be generally available. Current and potential suppliers are evaluated on a regular basis on their ability to meet our requirements and standards. The Company actively manages our material supply sourcing, and may employ various methods to limit risk associated with commodity cost fluctuations and availability. The inability of suppliers, especially any single source suppliers for a particular business, to deliver materials and components promptly could result in production delays and increased costs to manufacture the Company’s products. To mitigate the impact of these risks, the Company continues to search for acceptable alternative supply sources and less expensive supply options on a regular basis, including improving the globalization.
| ITEM 8. | FINANCIAL STATEMENTS AND SUPPLEMENTARY DATA |
The report of the Company’s independent registered public accounting firm and the Company’s Consolidated Financial Statements are filed pursuant to this Item 8 and are included in this report. See the Index to Financial Statements.
46
Table of Contents
The financial statements of the registrant required to be included in Item 8 are listed below:
47
Table of Contents
Report of Independent Registered Public Accounting Firm
To the Board of Directors and
Shareholders of Manitex International, Inc.
We have audited the accompanying consolidated balance sheets of Manitex International, Inc. and Subsidiaries (the “Company”) as of December 31, 2014 and 2013, and the related consolidated statements of income, comprehensive income, shareholders’ equity, and cash flows for each of the years in the three-year period ended December 31, 2014. We also have audited the Company’s internal control over financial reporting as of December 31, 2014, based on criteria established in Internal Control—Integrated Framework (1992) issued by the Committee of Sponsoring Organizations of the Treadway Commission (COSO). As described in Management’s Annual Report on Internal Control over Financial Reporting appearing under Item 9A, management has excluded A.S.V., LLC from its assessment of internal control over financial reporting as of December 31, 2014. We also have excluded A.S.V., LLC from our audit of internal control over financial reporting. A.S.V., LLC is a 51% owned subsidiary of the Company, acquired on December 19, 2014, whose total assets and total revenues represent approximately 40% and 1%, respectively, of the related consolidated financial statement amounts as of and for the year ended December 31, 2014. The Company’s management is responsible for these consolidated financial statements, for maintaining effective internal control over financial reporting, and for its assessment of the effectiveness of internal control over financial reporting, included in Management’s Annual Report on Internal Control over Financial Reporting appearing under Item 9A. Our responsibility is to express an opinion on these consolidated financial statements and an opinion on the company’s internal control over financial reporting based on our audits.
We conducted our audits in accordance with the standards of the Public Company Accounting Oversight Board (United States). Those standards require that we plan and perform the audits to obtain reasonable assurance about whether the consolidated financial statements are free of material misstatement and whether effective internal control over financial reporting was maintained in all material respects. Our audits of the consolidated financial statements included examining, on a test basis, evidence supporting the amounts and disclosures in the consolidated financial statements, assessing the accounting principles used and significant estimates made by management, and evaluating the overall consolidated financial statement presentation. Our audit of internal control over financial reporting included obtaining an understanding of internal control over financial reporting, assessing the risk that a material weakness exists, and testing and evaluating the design and operating effectiveness of internal control based on the assessed risk. Our audits also included performing such other procedures as we considered necessary in the circumstances. We believe that our audits provide a reasonable basis for our opinions.
A company’s internal control over financial reporting is a process designed to provide reasonable assurance regarding the reliability of financial reporting and the preparation of financial statements for external purposes in accordance with generally accepted accounting principles. A company’s internal control over financial reporting includes those policies and procedures that (1) pertain to the maintenance of records that, in reasonable detail, accurately and fairly reflect the transactions and dispositions of the assets of the company; (2) provide reasonable assurance that transactions are recorded as necessary to permit preparation of financial statements in accordance with generally accepted accounting principles, and that receipts and expenditures of the company are being made only in accordance with authorizations of management and directors of the company; and (3) provide reasonable assurance regarding prevention or timely detection of unauthorized acquisition, use, or disposition of the company’s assets that could have a material effect on the consolidated financial statements.
Because of its inherent limitations, internal control over financial reporting may not prevent or detect misstatements. Also, projections of any evaluation of effectiveness to future periods are subject to the risk that controls may become inadequate because of changes in conditions, or that the degree of compliance with the policies or procedures may deteriorate.
48
Table of Contents
In our opinion, the consolidated financial statements referred to above present fairly, in all material respects, the financial position of Manitex International, Inc. and Subsidiaries as of December 31, 2014 and 2013, and the results of their operations and their cash flows for each of the years in the three-year period ended December 31, 2014, in conformity with accounting principles generally accepted in the United States of America. Also in our opinion, Manitex International, Inc. and Subsidiaries maintained, in all material respects, effective internal control over financial reporting as of December 31, 2014, based on criteria established in Internal Control—Integrated Framework (1992) issued by the Committee of Sponsoring Organizations of the Treadway Commission.
| /s/ UHY LLP UHY LLP
Sterling Heights, Michigan March 16, 2015 |
49
Table of Contents
MANITEX INTERNATIONAL, INC.
(In thousands, except share and per share data)
As of December 31,
| 2014 | 2013 | |||||||
| ASSETS | ||||||||
| Current assets |
||||||||
| Cash |
$ | 4,370 | $ | 6,091 | ||||
| Trade receivables (net) |
60,855 | 38,165 | ||||||
| Accounts receivable finance |
— | 326 | ||||||
| Accounts receivable from related party |
8,609 | — | ||||||
| Other receivables |
243 | 1,541 | ||||||
| Inventory (net) |
97,182 | 72,734 | ||||||
| Deferred tax asset |
1,325 | 1,272 | ||||||
| Prepaid expense and other |
1,733 | 1,669 | ||||||
|
|
|
|
|
|||||
| Total current assets |
174,317 | 121,798 | ||||||
|
|
|
|
|
|||||
| Total fixed assets (net) |
28,846 | 11,143 | ||||||
| Intangible assets (net) |
51,922 | 24,036 | ||||||
| Deferred tax asset |
2,081 | 2,117 | ||||||
| Goodwill |
48,830 | 22,489 | ||||||
| Other long-term assets |
4,176 | 1,031 | ||||||
| Non-marketable equity investment |
5,951 | — | ||||||
|
|
|
|
|
|||||
| Total assets |
$ | 316,123 | $ | 182,614 | ||||
|
|
|
|
|
|||||
| LIABILITIES AND SHAREHOLDERS’ EQUITY | ||||||||
| Current liabilities |
||||||||
| Notes payable—short term |
$ | 11,499 | $ | 6,910 | ||||
| Revolving credit facilities |
2,798 | 2,707 | ||||||
| Current portion of capital lease obligations |
1,631 | 1,812 | ||||||
| Accounts payable |
36,006 | 24,974 | ||||||
| Accounts payable related parties |
503 | 789 | ||||||
| Income tax payable on conversion of ASV (see Note14) |
16,500 | — | ||||||
| Accrued expenses |
13,003 | 8,808 | ||||||
| Other current liabilities |
2,407 | 1,930 | ||||||
|
|
|
|
|
|||||
| Total current liabilities |
84,347 | 47,930 | ||||||
|
|
|
|
|
|||||
| Long-term liabilities |
||||||||
| Revolving term credit facilities |
46,457 | 37,306 | ||||||
| Notes payable |
40,588 | 2,482 | ||||||
| Capital lease obligations |
2,710 | 2,984 | ||||||
| Convertible note—related party |
6,611 | — | ||||||
| Deferred gain on sale of building |
1,268 | 1,648 | ||||||
| Deferred tax liability |
4,163 | 4,074 | ||||||
| Other long-term liabilities |
1,973 | 1,199 | ||||||
|
|
|
|
|
|||||
| Total long-term liabilities |
103,770 | 49,693 | ||||||
|
|
|
|
|
|||||
| Total liabilities |
188,117 | 97,623 | ||||||
|
|
|
|
|
|||||
| Commitments and contingencies |
||||||||
| Shareholders’ equity |
||||||||
| Preferred Stock—Authorized 150,000 shares, no shares issued or outstanding at December 31, 2014 and December 31, 2013 |
— | — | ||||||
| Common Stock—no par value, authorized, 20,000,000 shares issued and outstanding, 14,989,694 and 13,801,277 shares at December 31, 2014 and December 31, 2013, respectively |
82,040 | 68,554 | ||||||
| Paid in capital |
1,789 | 1,191 | ||||||
| Retained earnings |
21,960 | 14,857 | ||||||
| Accumulated other comprehensive (loss) income |
(1,023 | ) | 389 | |||||
|
|
|
|
|
|||||
| Equity attributable to shareholders of Manitex International, Inc. |
104,766 | 84,991 | ||||||
| Equity attributable to noncontrolling interest |
23,240 | — | ||||||
|
|
|
|
|
|||||
| Total Equity |
128,006 | 84,991 | ||||||
|
|
|
|
|
|||||
| Total liabilities and shareholders’ equity |
$ | 316,123 | $ | 182,614 | ||||
|
|
|
|
|
|||||
The accompanying notes are an integral part of these financial statements
50
Table of Contents
MANITEX INTERNATIONAL, INC.
CONSOLIDATED STATEMENTS OF INCOME
(In thousands, except share and per share data)
For the years ended December 31,
| 2014 | 2013 | 2012 | ||||||||||
| Net revenues |
$ | 264,081 | $ | 245,072 | $ | 205,249 | ||||||
| Cost of sales |
215,817 | 198,596 | 164,785 | |||||||||
|
|
|
|
|
|
|
|||||||
| Gross profit |
48,264 | 46,476 | 40,464 | |||||||||
| Operating expenses |
||||||||||||
| Research and development costs |
2,552 | 2,912 | 2,457 | |||||||||
| Selling, general and administrative expense |
31,776 | 26,026 | 23,548 | |||||||||
|
|
|
|
|
|
|
|||||||
| Total operating expenses |
34,328 | 28,938 | 26,005 | |||||||||
|
|
|
|
|
|
|
|||||||
| Operating income |
13,936 | 17,538 | 14,459 | |||||||||
| Other income (expense) |
||||||||||||
| Interest expense |
(3,150 | ) | (2,946 | ) | (2,457 | ) | ||||||
| Foreign currency transaction (loss) |
(107 | ) | (95 | ) | (110 | ) | ||||||
| Other (expense) income |
(36 | ) | (50 | ) | 6 | |||||||
|
|
|
|
|
|
|
|||||||
| Total other expense |
(3,293 | ) | (3,091 | ) | (2,561 | ) | ||||||
|
|
|
|
|
|
|
|||||||
| Income before income taxes |
10,643 | 14,447 | 11,898 | |||||||||
| Provision for taxes on income |
3,676 | 4,269 | 3,821 | |||||||||
|
|
|
|
|
|
|
|||||||
| Net income |
6,967 | 10,178 | 8,077 | |||||||||
| Net loss attributable noncontrolling interest |
136 | — | — | |||||||||
|
|
|
|
|
|
|
|||||||
| Net income attributable to shareholders of Manitex International, Inc. |
$ | 7,103 | $ | 10,178 | $ | 8,077 | ||||||
|
|
|
|
|
|
|
|||||||
| Earnings per share: |
||||||||||||
| Basic |
$ | 0.51 | $ | 0.80 | $ | 0.68 | ||||||
| Diluted |
$ | 0.51 | $ | 0.80 | $ | 0.68 | ||||||
| Weighted average common shares outstanding: |
||||||||||||
| Basic |
13,858,189 | 12,671,205 | 11,948,356 | |||||||||
| Diluted |
13,904,289 | 12,717,575 | 11,957,458 | |||||||||
The accompanying notes are an integral part of these financial statements
51
Table of Contents
MANITEX INTERNATIONAL, INC.
CONSOLIDATED STATEMENTS OF COMPREHENSIVE INCOME
(In thousands)
For the years ended December 31,
| 2014 | 2013 | 2012 | ||||||||||
| Net income . |
$ | 6,967 | $ | 10,178 | $ | 8,077 | ||||||
|
|
|
|
|
|
|
|||||||
| Other comprehensive (loss) income |
||||||||||||
| Foreign currency translation adjustments |
(1,419 | ) | (320 | ) | 429 | |||||||
| Derivative instrument fair market value adjustments—net of income taxes of $(3), $3 and $(13) for 2014, 2013 and 2012, respectively |
7 | (7 | ) | 26 | ||||||||
|
|
|
|
|
|
|
|||||||
| Total other comprehensive (loss) income |
(1,412 | ) | (327 | ) | 455 | |||||||
|
|
|
|
|
|
|
|||||||
| Comprehensive income |
5,555 | 9,851 | 8,532 | |||||||||
| Comprehensive loss attributable to noncontrolling interest |
136 | — | — | |||||||||
|
|
|
|
|
|
|
|||||||
| Total comprehensive income attributable to shareholders of Manitex International, Inc. |
$ | 5,691 | $ | 9,851 | $ | 8,532 | ||||||
|
|
|
|
|
|
|
|||||||
The accompanying notes are an integral part of these financial statements
52
Table of Contents
MANITEX INTERNATIONAL, INC.
CONSOLIDATED STATEMENT OF SHAREHOLDERS’ EQUITY
(In thousands, except per share data)
For the years ended December 31,
| 2014 | 2013 | 2012 | ||||||||||
| Number of common shares outstanding |
||||||||||||
| Balance at beginning of the year |
13,801,277 | 12,268,443 | 11,681,051 | |||||||||
| Shares issued on warrant exercise |
— | — | 105,000 | |||||||||
| Repurchase shares in connection with a cashless warrant exercise |
— | — | (77,071 | ) | ||||||||
| Stock offering |
1,108,156 | 1,375,000 | 500,000 | |||||||||
| Employee 2004 incentive plan grant |
89,114 | 74,320 | 30,351 | |||||||||
| Repurchase to satisfy withholding and cancelled |
(8,853 | ) | (4,414 | ) | — | |||||||
| Stock issued in connection with asset purchase (see Note 19) |
— | 87,928 | 29,112 | |||||||||
|
|
|
|
|
|
|
|||||||
| Balance end of year |
14,989,694 | 13,801,277 | 12,268,443 | |||||||||
|
|
|
|
|
|
|
|||||||
| Common Stock |
||||||||||||
| Balance at beginning of the year |
$ | 68,554 | $ | 53,040 | $ | 48,571 | ||||||
| Shares issued on warrant exercise |
— | — | 986 | |||||||||
| Repurchase shares in connection with a cashless warrant exercise |
— | — | (724 | ) | ||||||||
| Stock offering |
12,500 | 13,927 | 3,781 | |||||||||
| Employee 2004 incentive plan grant |
1,100 | 657 | 226 | |||||||||
| Repurchase to satisfy withholding and cancelled |
(114 | ) | (70 | ) | — | |||||||
| Stock issued in connection with asset purchase (see Note 19) |
— | 1,000 | 200 | |||||||||
|
|
|
|
|
|
|
|||||||
| Balance end of year |
$ | 82,040 | $ | 68,554 | $ | 53,040 | ||||||
|
|
|
|
|
|
|
|||||||
| Paid in Capital |
||||||||||||
| Balance at beginning of the year |
$ | 1,191 | $ | 1,098 | $ | 1,098 | ||||||
| Equity component of Convertible debt issuance |
572 | — | — | |||||||||
| Employee 2004 incentive plan grant |
3 | 7 | — | |||||||||
| Excess tax benefits related to vesting of restricted stock |
23 | 86 | — | |||||||||
|
|
|
|
|
|
|
|||||||
| Balance end of year |
$ | 1,789 | $ | 1,191 | $ | 1,098 | ||||||
|
|
|
|
|
|
|
|||||||
| Warrants |
||||||||||||
| Balance at beginning of the year |
$ | — | $ | — | $ | 232 | ||||||
| Shares issued on warrant exercise |
— | — | (232 | ) | ||||||||
|
|
|
|
|
|
|
|||||||
| Balance end of year |
$ | — | $ | — | $ | — | ||||||
|
|
|
|
|
|
|
|||||||
| Retained Earnings (Deficit) |
||||||||||||
| Balance at beginning of the year |
$ | 14,857 | $ | 4,679 | $ | (3,368 | ) | |||||
| Repurchase shares in connection with a cashless warrant exercise |
— | — | (30 | ) | ||||||||
| Net income attributable to shareholders of Manitex International, Inc. |
7,103 | 10,178 | 8,077 | |||||||||
|
|
|
|
|
|
|
|||||||
| Balance end of year |
$ | 21,960 | $ | 14,857 | $ | 4,679 | ||||||
|
|
|
|
|
|
|
|||||||
| Accumulated Other Comprehensive Income |
||||||||||||
| Balance at beginning of the year |
$ | 389 | $ | 716 | $ | 261 | ||||||
| (Loss) gain on foreign currency translation |
(1,419 | ) | (320 | ) | 429 | |||||||
| Derivative instrument fair market adjustment—net of income taxes |
7 | (7 | ) | 26 | ||||||||
|
|
|
|
|
|
|
|||||||
| Balance end of year |
$ | (1,023 | ) | $ | 389 | $ | 716 | |||||
|
|
|
|
|
|
|
|||||||
| Equity Attributable to Noncontrolling Interest |
||||||||||||
| Balance at beginning of the year |
$ | — | $ | — | $ | — | ||||||
| Acquisition noncontrolling business |
23,376 | — | — | |||||||||
| Net loss attributable to noncontrolling interest |
(136 | ) | — | — | ||||||||
|
|
|
|
|
|
|
|||||||
| Balance end of year |
$ | 23,240 | $ | — | $ | — | ||||||
|
|
|
|
|
|
|
|||||||
The accompanying notes are an integral part of these financial statements
53
Table of Contents
MANITEX INTERNATIONAL, INC.
CONSOLIDATED STATEMENT OF CASH FLOWS
(Thousands of Dollars)
For the years ended December 31,
| 2014 | 2013 | 2012 | ||||||||||
| Cash flows from operating activities: |
||||||||||||
| Net income |
$ | 6,967 | $ | 10,178 | $ | 8,077 | ||||||
| Adjustments to reconcile net income to net cash (used) provided by operating activities: |
||||||||||||
| Depreciation and amortization |
4,572 | 3,945 | 3,498 | |||||||||
| Provisions for allowance for doubtful accounts |
165 | 172 | 17 | |||||||||
| Acquisition expenses financed by the seller |
183 | — | — | |||||||||
| Loss (gain) on disposal of assets |
3 | (100 | ) | (119 | ) | |||||||
| Deferred income taxes |
(254 | ) | (168 | ) | 181 | |||||||
| Inventory reserves |
(2 | ) | 47 | 1 | ||||||||
| Reserves for uncertain tax positions |
(35 | ) | (83 | ) | 183 | |||||||
| Stock based deferred compensation |
1,104 | 664 | 226 | |||||||||
| Changes in operating assets and liabilities: |
||||||||||||
| (Increase) decrease in accounts receivable |
(13,172 | ) | 1,653 | (12,494 | ) | |||||||
| (Increase) decrease in accounts receivable finance |
315 | 271 | 378 | |||||||||
| (Increase) decrease in inventory |
(5,620 | ) | (8,852 | ) | (17,187 | ) | ||||||
| (Increase) decrease in prepaid expenses |
(58 | ) | (424 | ) | 117 | |||||||
| (Increase) decrease in other assets |
141 | (892 | ) | 11 | ||||||||
| Increase (decrease) in accounts payable |
2,859 | (4,079 | ) | 6,702 | ||||||||
| Increase (decrease) in accrued expense |
711 | (89 | ) | 2,765 | ||||||||
| Increase (decrease) in other current liabilities |
650 | (131 | ) | 1,168 | ||||||||
| Increase (decrease) in other long-term liabilities |
(30 | ) | (36 | ) | (8 | ) | ||||||
|
|
|
|
|
|
|
|||||||
| Net cash (used) provided by for operating activities |
(1,501 | ) | 2,076 | (6,484 | ) | |||||||
|
|
|
|
|
|
|
|||||||
| Cash flows from investing activities: |
||||||||||||
| Proceeds from sale of fixed assets |
— | 139 | 212 | |||||||||
| Purchase of property and equipment |
(924 | ) | (1,215 | ) | (1,125 | ) | ||||||
| Acquisition of business assets, net of cash acquired |
(24,998 | ) | (13,000 | ) | (345 | ) | ||||||
|
|
|
|
|
|
|
|||||||
| Net cash used for investing activities |
(25,922 | ) | (14,076 | ) | (1,258 | ) | ||||||
|
|
|
|
|
|
|
|||||||
| Cash flows from financing activities: |
||||||||||||
| New borrowings term loan |
— | 15,000 | — | |||||||||
| Repayment of term loan |
— | (15,000 | ) | — | ||||||||
| Net proceeds of stock offering |
12,500 | 13,927 | 3,781 | |||||||||
| Proceeds from issuance of convertible note payable |
7,500 | — | — | |||||||||
| Borrowing on revolving credit facilities |
5,563 | 5,409 | 9,221 | |||||||||
| Net borrowings (repayments) on working capital facilities |
2,532 | (1,960 | ) | 4,181 | ||||||||
| Payment of fees related to new financing |
(519 | ) | — | — | ||||||||
| New borrowings—notes payable |
677 | 809 | 764 | |||||||||
| Note payments |
(1,060 | ) | (916 | ) | (7,884 | ) | ||||||
| Proceeds from capital leases |
942 | — | — | |||||||||
| Repayment on capital lease obligations |
(1,397 | ) | (1,185 | ) | (795 | ) | ||||||
| Excess tax benefits related to vesting of restricted stock |
22 | 86 | — | |||||||||
| Shares repurchased for income tax withholding on share-based compensation |
(114 | ) | (70 | ) | — | |||||||
|
|
|
|
|
|
|
|||||||
| Net cash provided by financing activities |
26,646 | 16,100 | 9,268 | |||||||||
|
|
|
|
|
|
|
|||||||
| Effect of exchange rate change on cash |
(944 | ) | 102 | 292 | ||||||||
| Net (decrease) increase in cash and cash equivalents |
(777 | ) | 4,100 | 1,526 | ||||||||
| Cash and cash equivalents at the beginning of the year |
6,091 | 1,889 | 71 | |||||||||
|
|
|
|
|
|
|
|||||||
| Cash and cash equivalents at end of year |
$ | 4,370 | $ | 6,091 | $ | 1,889 | ||||||
|
|
|
|
|
|
|
|||||||
| Supplemental disclosure of cash flow information: |
||||||||||||
| Cash paid during the year for |
||||||||||||
| Interest |
$ | 2,994 | $ | 2,857 | $ | 2,498 | ||||||
| Income taxes |
$ | 3,998 | $ | 4,415 |
$ |
2,067 |
| |||||
(See Note 15 for other supplemental cash flow information)
The accompanying notes are an integral part of these financial statements
54
Table of Contents
NOTES TO CONSOLIDATED FINANCIAL STATEMENTS
(In thousands, except per share data)
Note 1. Nature of Operations
The Company is a leading provider of engineered lifting solutions. The Company operates in three business segments: the Lifting Equipment segment, the ASV segment and the Equipment Distribution segment.
Lifting Equipment Segment
The Company is a leading provider of engineered lifting solutions. The Company designs, manufactures and distributes a diverse group of products that serve different functions and are used in a variety of industries. Through its Manitex, Inc. subsidiary it markets a comprehensive line of boom trucks, truck cranes and sign cranes. Manitex’s boom trucks and crane products are primarily used for industrial projects, energy exploration and infrastructure development, including, roads, bridges and commercial construction. Badger Equipment Company (“Badger”) is a manufacturer of specialized rough terrain cranes and material handling products. Badger primarily serves the needs of the construction, municipality and railroad industries.
Manitex Liftking ULC (“Manitex Liftking” or “Liftking”) sells a complete line of rough terrain forklifts, a line of stand-up electric forklifts, cushioned tired forklifts with lifting capacities from 18 thousand to 40 thousand pounds and special mission oriented vehicles, as well as other specialized carriers, heavy material handling transporters and steel mill equipment. Manitex Liftking’s rough terrain forklifts are used in both commercial and military applications. Specialty mission oriented vehicles and specialized carriers are designed and built to meet the Company’s unique customer needs and requirements. The Company’s specialized lifting equipment has met the particular needs of customers in various industries that include utility, ship building and steel mill industries.
Manitex Load King, Inc. (“Load King”) manufactures specialized custom trailers and hauling systems typically used for transporting heavy equipment. Load King trailers serve niche markets in the commercial construction, railroad, military and equipment rental industries through a dealer network.
CVS Ferrari, srl (“CVS”) designs and manufactures a range of reach stackers and associated lifting equipment for the global container handling market, that are sold through a broad dealer network. On November 30, 2013, CVS acquired the assets of Valla SpA (“Valla”) located in Piacenza, Italy. Valla offers a full range of precision pick and carry cranes from 2 to 90 tons, using electric, diesel, and hybrid power options. Its cranes offer wheeled or tracked and fixed or swing boom configurations, with special applications designed specifically to meet the needs of its customers.
On August 19, 2013, Manitex Sabre, Inc. (“Sabre”) acquired the assets of Sabre Manufacturing, LLC, which is located in Knox, Indiana. Sabre manufactures a comprehensive line of specialized mobile tanks for liquid and solid storage and containment solutions with capacities from 8,000 to 21,000 gallons. Its mobile tanks are sold to specialized independent tank rental companies and through the Company’s existing dealer network. The tanks are used in a variety of end markets such as petrochemical, waste management and oil and gas drilling.
ASV Segment
On December 19, 2014, the Company acquired 51% of A.S.V., Inc. from Terex Corporation (“Terex”). Subsequent to the acquisition date ASV was converted to an LLC and its name was changed to A.S.V., LLC (ASV). ASV is located in Grand Rapids, Minnesota manufactures a line of high quality compact track and skid steer loaders. The products are used in the site clearing, general construction, forestry, golf course maintenance and landscaping industries, with general construction being the largest market. The ASV products are distributed through the Terex distribution channels as well as the Manitex dealers.
ASV’s financial results are included in the Company’s consolidated results beginning on December 20, 2014.
55
Table of Contents
Equipment distribution segment
The Equipment Distribution segment comprises the operations of Crane & Machinery (“C&M”), a division of Manitex International, Inc. The segment markets products used primarily for infrastructure development and commercial construction applications that include road and bridge construction, general contracting, roofing, scrap handling and sign construction and maintenance. C&M is a distributor of Terex rough terrain and truck cranes, and supplies repair parts for a wide variety of medium to heavy duty construction equipment and sells domestically and internationally, predominately to end users, including the rental market. It also provides crane equipment repair services in the Chicago area. C&M uses the trade name, North American Equipment Exchange to market previously-owned construction and heavy equipment, both domestically and internationally and provides a wide range of used lifting and construction equipment of various ages and condition, and also has the capability to refurbish equipment to the customers’ specification. C&M operates as the North American sales organization for our Italian based PM knuckle boom cranes and Valla pick and carry crane products.
Note 2. Basis of Presentation
The consolidated financial statements, included herein, have been prepared by the Company pursuant to the rules and regulations of the United States Securities and Exchange Commission. Pursuant to these rules and regulations, the financial statements are prepared in accordance with accounting principles generally accepted in the United States of America. The consolidated financial statement includes the accounts of Manitex International, Inc., and its subsidiaries. Significant intercompany transactions have been eliminated in consolidation. Sabre , Valla and ASV have been included in the Company’s financial results from their respective effective date of acquisition which are August 19, 2013, November 30, 2013 and December 20, 2014 , respectively. The Company owns 25% of Lift Ventures LLC (“Lift Ventures”) and accounts for it as an unconsolidated equity investment. The investment in Lift Ventures has been reflected in the Company’s financial statements on the balance sheet on the line titled “Non-marketable equity investment”. As of the December 31, 2014, Lift Venture had not commenced operation and as such no income or loss is reflected in the Company’s financial results.
Financial statements are presented in thousands of dollars except for per share amounts.
Note 3. Summary of Significant Accounting Policies
The summary of significant accounting policies of Manitex International, Inc. is presented to assist in understanding the Company’s financial statements. The financial statements and notes are representations of the Company’s management who is responsible for their integrity and objectivity. These accounting policies conform to generally accepted accounting principles and have been consistently applied in the preparation of the financial statements.
Cash and Cash Equivalents—For purposes of the statement of cash flows, the Company considers all short-term securities purchased with maturity dates of three months or less to be cash equivalents.
Warrants—The Company had issued warrants, which allowed the warrant holder to purchase one share of stock at a specified price for a specific period of time. The Company records equity instruments including warrants issued to non-employees based on the fair value at date of issue. The fair value of the warrants at date of issuance is estimated using the Black-Scholes Model.
Revenue Recognition—Revenue and related costs are generally recorded when products are shipped and invoiced to our customers. Revenue is recognized when title passes and risk of loss pass to our customers which is generally occurs upon shipment depending upon the terms of the contract. Under certain contracts with our customers title passes to the customers when the units are completed. The units are segregated from our inventory and identified as belonging to the customer, the customer is notified that the units are complete and
56
Table of Contents
wait pick up or delivery as specified by the customer before income is recognized. Additionally, the customer is requested to sign an “Invoice Authorization Form” which acknowledges the contract terms and acknowledges that the customer has economic ownership and control over the unit. It also acknowledges that we are going to invoice the unit per terms of the contract. The Company insures any custodial risk that it may retain.
For FOB contracts, customers may be invoiced prior to the time customers take physical possession. Revenue is recognized in such cases only when the customer has a fixed commitment to purchase the units, the units have been completed, tested and made available to the customer for pickup or delivery, and the customer has authorized in writing that we hold the units for pickup or delivery at a time specified by the customer. In such cases, the units are invoiced under our customary billing terms, title to the units and risks of ownership pass to the customer upon invoicing, the units are segregated from our inventory and identified as belonging to the customer and we have no further obligations under the order. The Company insures any custodial risk that it may retain.
In addition, our policy requires in all instances certain minimum criteria be met in order to recognize revenue, specifically:
| a) | Persuasive evidence that an arrangement exists; |
| b) | The price to the buyer is fixed or determinable; |
| c) | Collectability is reasonably assured; and |
| d) | We have no significant obligations for future performance. |
Investment—Equity Method of Accounting—Our non-marketable equity investments are investments we have made in privately-held companies accounted for under the equity method. We periodically review our non-marketable equity investments for impairment. No impairments were recognized for the year ended December 31, 2014.
Allowance for Doubtful Accounts—The Company has adopted a policy consistent with U.S. GAAP for the periodic review of its accounts receivable to determine whether the establishment of an allowance for doubtful accounts is warranted based on the Company’s assessment of the collectability of the accounts. The Company established an allowance for bad debt of $458 and $333 at December 31, 2014 and 2013, respectively. The Company also has in some instances a security interest in its accounts receivable until payment is received.
Property, Equipment and Depreciation—Property and equipment are stated at cost or the fair market value at date of acquisition for property and equipment acquired in connection with the acquisition of a company. Depreciation of property and equipment is provided over the following useful lives:
| Asset Category |
Depreciable Life | |||
| Buildings |
20 – 25 years | |||
| Machinery and equipment |
1 – 15 years | |||
| Furniture and fixtures |
3 – 12 years | |||
| Leasehold improvements |
1.5 – 12 years | |||
Expenditures for major renewals and betterments that extend the useful lives of property and equipment are capitalized. Expenditures for maintenance and repairs are charged to expense as incurred. Depreciation expense for the years ended December 31, 2014, 2013 and 2012 was $1,855, $1,627 and $1,401, respectively.
Other Intangible Assets—The Company accounts for Other Intangible Assets under the guidance of ASC 350, “Intangibles—Goodwill and Other”. The Company capitalizes certain costs related to patent technology. Additionally, a substantial portion of the purchase price related to the Company’s acquisitions has been assigned to patents or unpatented technology, trade name, customer backlog, and customer relationships. Under the
57
Table of Contents
guidance, Other Intangible Assets with definite lives are amortized over their estimated useful lives. Intangible assets with indefinite lives are tested annually for impairment.
Goodwill is tested for impairment at the reporting unit level. The Company’s three operating segments comprise the reporting units for goodwill impairment testing purposes.
Under ASU 2011-08, entities are provided with the option of first performing a qualitative assessment on none, some, or all of its reporting units to determine whether it is more likely than not that the fair value of a reporting unit is less than its carrying value. If after completing a qualitative analysis, it is determined that it is more likely than not that the fair value of a reporting unit is less than its carrying value a quantitative analysis is required.
In 2014, the Company elected to evaluate the Lifting Equipment and Equipment Distribution reporting unit’s goodwill using the quantitative two step approach. The first step used to identify potential impairment involves comparing the reporting unit’s estimated fair value to its carrying value, including goodwill. The aforementioned mentioned Step one quantitative tests did not indicate impairment. During the first step testing, the Company evaluated goodwill for impairment using a business valuation method, which is calculated as of a measurement date by determining the present value of debt-free, after-tax projected future cash flows, discounted at the weighted average cost of capital of a hypothetical third party buyer. The market approach was also considered in evaluating the potential for impairment by calculating fair value based on multiples of earnings before interest, taxes, depreciation and amortization (EBITDA) of comparable, publicly traded companies. This analysis also did not indicate impairment. Moreover, the Company also observed implied EBITDA multiples from relatively recent merger and acquisition activity in the industry, which was used to test the reasonableness of the results.
The second step of the process involves the calculation of an implied fair value of goodwill for each reporting unit for which step one indicated impairment. The implied fair value of goodwill is determined by measuring the excess of the estimated fair value of the reporting unit over the estimated fair values of the individual assets, liabilities and identifiable intangibles as if the reporting unit was being acquired in a business combination. If the implied fair value of goodwill exceeds the carrying value of goodwill assigned to the reporting unit, there is no impairment. If the carrying value of goodwill assigned to a reporting unit exceeds the implied fair value of the goodwill, an impairment charge is recorded for the excess. An impairment loss cannot exceed the carrying value of goodwill assigned to a reporting unit and the subsequent reversal of goodwill impairment losses is not permitted.
The determination of fair value requires the Company to make significant estimates and assumptions. These estimates and assumptions primarily include, but are not limited to, revenue growth and operating earnings projections, discount rates, terminal growth rates, and required capital expenditure projections. Due to the inherent uncertainty involved in making these estimates, actual results could differ materially from those estimates. Deterioration in the market or actual results as compared with the projections may ultimately result in a future impairment. In the event, the Company determines that goodwill is impaired in the future the Company would need to recognize a non-cash impairment charge.
For 2012 and 2013, the Company determined on a qualitative basis, that it was not more likely than not that the fair value of the Lifting reporting unit was less than its carrying value. For 2013, the Company also determined on a qualitative basis, that it was not more likely than not that the fair value of the Equipment Distribution reporting unit was less than its carrying value.
The Company did not have any impairment for the years ended December 31, 2014, 2013 and 2012.
Impairment of Long Lived Assets—The Company’s policy is to assess the realizability of its long-lived assets, including intangible assets, and to evaluate such assets for impairment whenever events or changes in circumstances indicate that the carrying amount of such assets (or group of assets) may not be recoverable. Impairment is determined to exist if the estimated future undiscounted cash flows are less than the
58
Table of Contents
carrying value. Future cash flow projections include assumptions for future sales levels, the impact of cost reduction programs, and the level of working capital needed to support each business. The amount of any impairment then recognized would be calculated as the difference between estimated fair value and the carrying value of the asset. The Company did not have any impairment for the years ended December 31, 2014, 2013 and 2012.
Inventory—Inventory consists of stock materials and equipment stated at the lower of cost (first in, first out) or market. All equipment classified as inventory is available for sale. The company records excess and obsolete inventory reserves. The estimated reserve is based upon specific identification of excess or obsolete inventories. Selling, general and administrative expenses are expensed as incurred and are not capitalized as a component of inventory.
Foreign Currency Translation and Transactions—The financial statements of the Company’s non-U.S. subsidiaries are translated using the current exchange rate for assets and liabilities and the weighted-average exchange rate for the year for income and expense items. Resulting translation adjustments are recorded to accumulated other comprehensive income (OCI) as a component of shareholders’ equity.
The Company converts receivables and payables denominated in other than the Company’s functional currency at the exchange rate as of the balance sheet date. The resulting transaction exchange gains or losses, except for certain transaction gains or loss related to intercompany receivable and payables, are included in other income and expense. Transaction gains and losses related to intercompany receivables and payables not anticipated to be settled in the foreseeable future are excluded from the determination of net income and are recorded as a translation adjustment (with consideration to the tax effect) to accumulated other comprehensive income (OCI) as a component of shareholders’ equity.
Derivatives—Forward Currency Exchange Contracts—The Company enters into forward currency exchange contracts in relationship such that the exchange gains and losses on the assets and liabilities denominated in other than the reporting units’ functional currency would be offset by the changes in the market value of the forward currency exchange contracts it holds. The forward currency exchange contracts that the Company has to offset existing assets and liabilities denominated in other than the reporting units’ functional currency have been determined not to be considered a hedge under ASC 815-10. The Company records at the balance sheet date the forward currency exchange contracts at its market value with any associated gain or loss being recorded in current earnings. Both realized and unrealized gains and losses related to forward currency contracts are included in current earnings and are reflected in the Statement of Operations in the other income expense section on the line titled foreign currency transaction gain (loss).
The Company has entered into forward currency contracts to hedge certain future U.S. dollar sales of its Canadian Subsidiary. The forward currency contracts to hedge future sales are designated as cash flow hedges under ASC 815-10. As required, forward currency contracts are recognized as an asset or liability at fair value on the Company’s Consolidated Balance Sheet. For derivative instruments that are designated and qualify as cash flow hedges, the effective portion of the gain or loss on the derivative is reported as a component of other comprehensive income and reclassified into earnings in the same period or periods during which the hedged transaction affects earnings (date of sale). Gains or losses on cash flow hedges when recognized into income are included in net revenues (see Note 6).
Credit Risk Concentrations—Financial instruments which potentially subject the Company to concentrations of credit risk consist primarily of cash, trade receivables and payables. The Company maintains its cash balances and marketable securities at banks located in Detroit, Michigan, New York, New York Toronto, Canada as well as several separate Italian banks. Accounts in the United States are insured by the Federal Deposit Insurance Corporation up to $250. At December 31, 2014 and 2013, the Company had uninsured balances of $4,120 and $5,814, respectively.
59
Table of Contents
As of December 31, 2014 and 2013, no customers accounted for 10% or more of total Company’s accounts receivable
In 2014 and 2013, no one customer accounted for 10% or more of total company’s revenues. In 2012, one customer accounted for 11% of total company revenue. For 2014, 2013 and 2012 purchases from any single supplier did not exceed 10% of total purchases.
Research and Development Expenses. The Company expenses research and development costs, as incurred. For the periods ended December 31, 2014, 2013 and 2012 expenses were $2,552, $2,912 and $2,457, respectively.
Advertising—Advertising costs are expensed as incurred and were $458, $626 and $517 for the years ended December 31, 2014, 2013 and 2012, respectively.
Litigation Claims—In determining whether liabilities should be recorded for pending litigation claims, the Company must assess the allegations and the likelihood that it will successfully defend itself. When the Company believes it is probable that it will not prevail in a particular matter, it will then record an estimate of the amount of liability based, in part, on advice of outside legal counsel.
Shipping and Handling—The Company records the amount of shipping and handling costs billed to customers as revenue. The cost incurred for shipping and handling is included in the cost of sales.
Use of Estimates—The preparation of financial statements in conformity with accounting principles generally accepted in the United States of America requires management to make estimates and assumptions that affect certain reported amounts and disclosures. Accordingly, actual results could differ from those estimates.
Income Taxes—The Company accounts for income taxes under the provisions of ASC 740 “ Income Taxes,” which requires recognition of income taxes based on amounts payable with respect to the current year and the effects of deferred taxes for the expected future tax consequences of events that have been included in the Company’s financial statements or tax returns. Under this method, deferred tax assets and liabilities are determined based on the differences between the financial accounting and tax basis of assets and liabilities, as well as for operating losses and tax credit carryforwards using enacted tax rates in effect for the year in which the differences are expected to reverse. Valuation allowances are recorded to reduce deferred tax assets when it is more likely than not a tax benefit will not be realized.
ASC 740 also prescribes a recognition threshold and measurement attribute for the financial statement recognition and measurement of a tax position taken or expected to be taken in a tax return, as well as guidance on derecognition, classification, interest and penalties, accounting in interim periods, disclosure and transition.
In assessing the realizability of deferred tax assets, management considers whether it is more likely than not that some portion or all of the deferred tax assets will be realized. The ultimate realization of deferred tax assets is dependent upon the generation of future taxable income prior to the expiration of any net operating loss carryforwards. See Note 14, Income Taxes, for further details.
Accrued Warranties—Warranty costs are accrued at the time revenue is recognized. The Company’s products are typically sold with a warranty covering defects that arise during a fixed period of time. The specific warranty offered is a function of customer expectations and competitive forces. The Equipment Distribution segment does not accrue for warranty costs at the time of sales, as they are reimbursed by the manufacturers for any warranty that they provide to their customers.
A liability for estimated warranty claims is accrued at the time of sale. The liability is established using historical warranty claim experience. Historical warranty experience is, however, reviewed by management. The current provision may be adjusted to take into account unusual or non-recurring events in the past or anticipated changes
60
Table of Contents
in future warranty claims. Adjustments to the initial warranty accrual are recorded if actual claim experience indicates that adjustments are necessary. Warranty reserves are reviewed to ensure critical assumptions are updated for known events that may impact the potential warranty liability.
Debt Issuance Costs—Debt issuance costs incurred in securing the Company’s financing arrangements are capitalized and amortized over the term of the associated debt. Deferred financing cost are included with other long-term assets on the Company’s balance sheet.
Sale and Leaseback—In accordance with ASC 840-40 Sales-Leaseback Transactions, the Company has recorded deferred revenue in relationship to the sale and leaseback of one of the Company’s operating facilities. As such, the gain on the sale of the land and building has been deferred and is being amortized on a straight line basis over the life of the lease.
Computation of EPS—Basic Earnings per Share (“EPS”) was computed by dividing net income (loss) by the weighted average number of common shares outstanding during the period.
The number of shares related to options, warrants, restricted stock, convertible debt and similar instruments included in diluted EPS (“EPS”) is based on the “Treasury Stock Method” prescribed in ASC 260-10, Earnings per Share. This method assumes theoretical repurchase of shares using proceeds of the respective stock option or warrant exercised, and for restricted stock the amount of compensation cost attributed to future services which has not yet been recognized and the amount of current and deferred tax benefit, if any, that would be credited to additional paid in capital upon the vesting of the restricted stock, at a price equal to the issuer’s average stock price during the related earnings period. Accordingly, the number of shares includable in the calculation of EPS in respect of the stock options, warrants, restricted stock, convertible debt and similar instruments is dependent on this average stock price and will increase as the average stock price increases.
Stock Based Compensation—In accordance with ASC 718 Compensation-Stock Compensation, share-based payments to employees, including grants of restricted stock units, are measured at fair value as of the date of grant and are expensed in the consolidated statement of income over the service period (generally the vesting period).
Comprehensive Income—“Reporting Comprehensive Income” requires reporting and displaying comprehensive income and its components. Comprehensive income includes, in addition to net earnings, other items that are reported as direct adjustments to shareholder’s equity. Currently, the comprehensive income adjustment required for the Company has two components. First is a foreign currency translation adjustment, the result of consolidating its foreign subsidiary. The second component is a derivative instrument fair market value adjustment (net of income taxes) related to forward currency contracts designated as a cash flow hedge.
For derivative instruments that are designated and qualify as cash flow hedges, the effective portion of the gain or loss on the derivative is reported as a component of other comprehensive income and reclassified into earnings in the same period or periods during which the hedged transaction affects earnings (date of sale). See Note 6 for additional details.
Reclassifications—Certain reclassifications have been made to the 2013 and 2012 financial statements to conform to the 2014 presentation.
Business Combinations—The Company accounts for acquisitions in accordance with guidance found in ASC 805, Business Combinations. The guidance requires consideration given, including contingent consideration, assets acquired and liabilities assumed to be valued at their fair market values at the acquisition date. The guidance further provides that: (1) in-process research and development will be recorded at fair value as an indefinite-lived intangible asset; (2) acquisition costs will generally be expensed as incurred, (3) restructuring costs associated with a business combination will generally be expensed subsequent to the
61
Table of Contents
acquisition date; and (4) changes in deferred tax asset valuation allowances and income tax uncertainties after the acquisition date generally will affect income tax expense.
ASC 805 requires that any excess of purchase price over fair value of assets acquired, including identifiable intangibles and liabilities assumed be recognized as goodwill. In accordance with ASC 805, any excess of fair value of acquired net assets, including identifiable intangibles assets, over the acquisition consideration results in a bargain purchase gain. Prior to recording a gain, the acquiring entity must reassess whether all acquired assets and assumed liabilities have been identified and recognized and perform re-measurements to verify that the consideration paid, assets acquired and liabilities assumed have been properly valued.
Note 4. Earnings per Common Share
Basic net earnings per share is computed by dividing net income by the weighted average number of common shares outstanding for the period. Diluted earnings per share reflects the potential dilution of warrants and restricted stock units. Details of the calculations are as follows:
| 2014 | 2013 | 2012 | ||||||||||
| Net Income attributable to shareholders of Manitex International, Inc. |
||||||||||||
| Basic |
$ | 7,103 | $ | 10,178 | $ | 8,077 | ||||||
| Diluted |
$ | 7,103 | $ | 10,178 | $ | 8,077 | ||||||
| Earnings per share |
||||||||||||
| Basic |
$ | 0.51 | $ | 0.80 | $ | 0.68 | ||||||
| Diluted |
$ | 0.51 | $ | 0.80 | $ | 0.68 | ||||||
| Weighted average common shares outstanding |
||||||||||||
| Basic |
13,858,189 | 12,671,205 | 11,948,356 | |||||||||
|
|
|
|
|
|
|
|||||||
| Diluted |
||||||||||||
| Basic |
13,858,189 | 12,671,205 | 11,948,356 | |||||||||
| Dilutive effect of warrants |
— | — | 2,521 | |||||||||
| Dilutive effect of restricted stock units |
46,100 | 46,370 | 6,581 | |||||||||
|
|
|
|
|
|
|
|||||||
| 13,904,289 | 12,717,575 | 11,957,458 | ||||||||||
|
|
|
|
|
|
|
|||||||
Note 5. Fair Value Measurements
The following tables set forth the Company’s financial assets and liabilities that were accounted for at fair value on a recurring basis as of December 31, 2014 and 2013 by level within the fair value hierarchy. As required by ASC 820-10, financial assets and liabilities are classified in their entirety based on the lowest level of input that is significant to the fair value measurement.
62
Table of Contents
The following is a summary of items that the Company measures at fair value on a recurring basis:
| Fair Value at December 31, 2014 | ||||||||||||||||
| Level 1 | Level 2 | Level 3 | Total | |||||||||||||
| Assets: |
||||||||||||||||
| Forward currency exchange contracts |
$ | — | $ | 268 | $ | — | $ | 268 | ||||||||
|
|
|
|
|
|
|
|
|
|||||||||
| Total current assets at fair value |
$ | — | $ | 268 | $ | — | $ | 268 | ||||||||
|
|
|
|
|
|
|
|
|
|||||||||
| Liabilities: |
||||||||||||||||
| Forward currency exchange contracts |
$ | — | $ | 29 | $ | — | $ | 29 | ||||||||
| Convertible debt- Terex ( See Note 13) |
— | 6,607 | — | 6,607 | ||||||||||||
| Valla contingent consideration (see Note 19) |
— | — | 250 | 250 | ||||||||||||
|
|
|
|
|
|
|
|
|
|||||||||
| Total long-term liabilities at fair value |
$ | — | $ | 6,636 | $ | 250 | $ | 6,886 | ||||||||
|
|
|
|
|
|
|
|
|
|||||||||
| Fair Value at December 31, 2013 | ||||||||||||||||
| Level 1 | Level 2 | Level 3 | Total | |||||||||||||
| Assets: |
||||||||||||||||
| Forward currency exchange contracts |
$ | — | $ | 40 | $ | — | $ | 40 | ||||||||
|
|
|
|
|
|
|
|
|
|||||||||
| Total current assets at fair value |
$ | — | $ | 40 | $ | — | $ | 40 | ||||||||
|
|
|
|
|
|
|
|
|
|||||||||
| Liabilities: |
||||||||||||||||
| Forward currency exchange contracts |
$ | — | $ | 47 | $ | — | $ | 47 | ||||||||
| Valla contingent consideration (see Note 19) |
— | — | 250 | 250 | ||||||||||||
|
|
|
|
|
|
|
|
|
|||||||||
| Total current liabilities at fair value |
$ | — | $ | 47 | $ | 250 | $ | 297 | ||||||||
|
|
|
|
|
|
|
|
|
|||||||||
The carrying value of the amounts reported in the Consolidated Balance Sheets for cash, accounts receivable, accounts payable and short-term variable debt, including any amounts outstanding under the Company’s revolving credit facilities and working capital borrowing, approximate fair value due to the short periods during which these amounts are outstanding.
The book and fair value of the Company’s term debt was $44,050 and $44,058 for the year ended December 31, 2014, and $2,896 and $2,912 for the year ending December 31, 2013. The book and fair value of the Company’s capital leases was $4,341 and $4,960 for the year ended December 31, 2014 and $4,796 and $5,565 for the year ending December 31, 2013. There is no difference between the book value and the fair value for amount recorded in connection with a long-term legal settlement, which was $1,007 and $1,022 for the periods ending December 31, 2014 and 2013 respectively.
Fair Value Measurements
ASC 820-10 classifies the inputs used to measure fair value into the following hierarchy:
| Level 1 |
- | Unadjusted quoted prices in active markets that are accessible at the measurement date for identical, unrestricted assets or liabilities; | ||||
| Level 2 |
- | Quoted prices in markets that are not active, or inputs which are observable, either directly or indirectly, for substantially the full term of the asset or liability; and | ||||
| Level 3 |
- | Prices or valuation techniques that require inputs that are both significant to the fair value measurement and unobservable (i.e., supported by little or no market activity) | ||||
Fair value of the forward currency contracts are determined on the last day of each reporting period using observable inputs, which are supplied to the Company by the foreign currency trading operation of its bank and are Level 2 items.
63
Table of Contents
Note 6. Derivative Financial Instruments
ASC 815-10 requires enhanced disclosures regarding an entity’s derivative and hedging activities as provided below.
The Company’s risk management objective is to use the most efficient and effective methods available to us to minimize, eliminate, reduce or transfer the risks which are associated with fluctuation of exchange rates between the Canadian and U.S. dollar and the Euro and the U.S. dollar.
When the Company’s Canadian subsidiary receives a significant new U.S. dollar order, management will evaluate different options that may be available to mitigate future currency exchange risks. The decision to hedge future sales is not automatic and is decided case by case. The Company will only use hedge instruments to hedge firm existing sales orders and not estimated exposure, when management determines that exchange risks exceeds desired risk tolerance levels.
The Company enters into forward currency exchange contracts in relationship such that the exchange gains and losses on the assets and liabilities denominated in other than the reporting units’ functional currency would be offset by the changes in the market value of the forward currency exchange contracts it holds. The forward currency exchange contracts that the Company has to offset existing assets and liabilities denominated in other than the reporting units’ functional currency have been determined not to be considered a hedge under ASC 815-10. The Company records at the balance sheet date the forward currency exchange contracts at its market value with any associated gain or loss being recorded in current earnings. Both realized and unrealized gains and losses related to forward currency contracts are included in current earnings and are reflected in the Statement of Income in the other income expense section on the line titled foreign currency transaction gains (losses). Items denominated in other than a reporting units functional currency includes U.S. denominated accounts receivables and accounts payable held by our Canadian subsidiary and certain intercompany receivables due from the Company’s Canadian and Italian subsidiaries. The decision, to hedge future sales is not automatic and is decided case by case. The forward currency contracts to hedge future sales are designated as cash flow hedges under ASC 815-10.
As required, forward currency contracts are recognized as an asset or liability at fair value on the Company’s Consolidated Balance Sheet. For derivative instruments that are designated and qualify as cash flow hedges, the effective portion of the gain or loss on the derivative is reported as a component of other comprehensive income and reclassified into earnings in the same period or periods during which the hedged transaction affects earnings (date of sale). Gains or losses on cash flow hedges when recognized into income are included in net revenues. Gains and losses on the derivative instruments representing either hedge ineffectiveness or hedge components excluded from the assessment of effectiveness are recognized in current earnings. The Company expects minimal ineffectiveness as the Company has hedged only firm sales orders and has not hedged estimated exposures. As of December 31, 2014, the Company had no outstanding forward currency contracts that were in place to hedge future sales. Therefore, there are currently no unrealized pre-tax gains or loss which will reclassified from other comprehensive income into earnings during the next 12 months
At December 31, 2014, the Company had entered into forward currency exchange contracts. The contracts obligate the Company to purchase CDN $547. The contracts mature on January 7, 2015. Under the contract, the Company will purchase Canadian dollars at exchange rates of .9241 and .8991. The Canadian to US dollar exchange rates was $0.8620 at December 31, 2014. At December 31, 2014, the Company had forward currency contracts to sell €800 at 1.4261, €400 at 1.3635 , €100 at 1.3538 and €500 at 1.2531with contract maturity dates of July 2, 2015, February 10, 2015, January 31, 2015 and October 14, 2015, respectively. The Euro to US dollar exchange rate was 1.2101 at December 31, 2014. The unrealized currency exchange asset is reported under prepaid expense and other if it is an asset or under accrued expenses if it is a liability on the balance sheet at December 31, 2014 and 2013.
64
Table of Contents
As of December 31, 2014, the Company had the following forward currency contracts:
| Nature of Derivative |
Amount | Type | ||||||
| Forward currency contract |
CDN$ | 547 | Not designated as hedge instrument |
|||||
| Forward currency contract |
€ | 1,800 | Not designated as hedge instrument | |||||
The following table provides the location and fair value amounts of derivative instruments that are reported in the Consolidated Balance Sheet as of December 31, 2014 and 2013:
Total derivatives not designated as a hedge instrument
| Fair Value | ||||||||||
| Asset Derivatives |
Balance Sheet Location | December 31, 2014 |
December 31, 2013 |
|||||||
| Foreign currency Exchange Contract |
Prepaid expense and other | $ | 268 | $ | 40 | |||||
|
|
|
|
|
|||||||
| Liabilities Derivatives |
||||||||||
| Foreign currency Exchange Contract |
Accrued expense | $ | (29 | ) | $ | (37 | ) | |||
|
|
|
|
|
|||||||
Total derivatives designated as a hedge instrument
| Fair Value | ||||||||||
| Liabilities Derivatives |
Balance Sheet Location | December 31, 2014 |
December 31, 2013 |
|||||||
| Foreign currency Exchange Contract |
Accrued expense | $ | — | $ | (10 | ) | ||||
|
|
|
|
|
|||||||
The following tables provide the effect of derivative instruments on the Consolidated Statement of Income for 2014, 2013 and 2012:
| Derivatives not designated as Hedge Instrument |
Location of gain or (loss) recognized in Income Statement |
Gain or (loss) | ||||||||||||
| 2014 | 2013 | 2012 | ||||||||||||
| Forward currency contracts |
Foreign currency transaction gains (losses) |
$ | 110 | $ | (178 | ) | $ | 5 | ||||||
| Derivatives designated as Hedge Instrument |
Location of gain or (loss) recognized in Income Statement |
Gain or (loss) | ||||||||||||
|
|
|
|
|
|
|
|||||||||
| 2014 | 2013 | 2012 | ||||||||||||
| Forward currency contracts |
Net revenue | $ | (26 | ) | $ | (30 | ) | $ | 71 | |||||
The following table shows the beginning and ending amounts of gains and losses related to hedges which have been included in Other Comprehensive Income and related activity net of income taxes for December 31, 2014 and 2013:
| December 31, 2014 |
December 31, 2013 |
|||||||
| Beginning balance (loss), net of income taxes |
$ | (7 | ) | $ | — | |||
| Amounts recorded in OCI net of (loss), net of income taxes |
(11 | ) | (28 | ) | ||||
| Amount reclassified to income, loss (gain), net of income taxes |
18 | 21 | ||||||
|
|
|
|
|
|||||
| Ending balance gain (loss), net of income taxes |
$ | — | $ | (7 | ) | |||
|
|
|
|
|
|||||
65
Table of Contents
Note 7. Inventory
The components of inventory at December 31, are summarized as follows:
| 2014 | 2013 | |||||||
| Raw materials and purchased parts |
$ | 63,704 | $ | 48,537 | ||||
| Work in process |
9,257 | 9,807 | ||||||
| Finished goods and replacement parts |
24,221 | 14,390 | ||||||
|
|
|
|
|
|||||
| Inventories, net |
$ | 97,182 | $ | 72,734 | ||||
|
|
|
|
|
|||||
The Company has established reserves for obsolete and excess inventory of $745 and $747 for the years ended December 31, 2014 and 2013, respectively.
Note 8. Property, Plant and Equipment
Property, plant and equipment consist of the following:
| 2014 | 2013 | |||||||
| Land |
$ | 1,182 | $ | 763 | ||||
| Buildings |
16,990 | 8,342 | ||||||
| Machinery and equipment |
16,749 | 7,681 | ||||||
| Furniture and fixtures |
783 | 719 | ||||||
| Leasehold improvements |
1,895 | 804 | ||||||
| Computer software & equipment |
1,414 | 1,250 | ||||||
| Motor vehicles |
649 | 411 | ||||||
| Construction in progress |
277 | 128 | ||||||
|
|
|
|
|
|||||
| Totals |
39,939 | 20,098 | ||||||
| Less: accumulated depreciation |
(11,093 | ) | (8,955 | ) | ||||
|
|
|
|
|
|||||
| Net property and equipment |
$ | 28,846 | $ | 11,143 | ||||
|
|
|
|
|
|||||
Depreciation expense was $1,855 (net of $380 amortization of deferred gain on building), $1,627 (net of $380 amortization of deferred gain on building), and $1,401 (net of $380 amortization of deferred gain on building) in 2014, 2013 and 2012, respectively. See Note 12 for information regarding capital leases.
Note 9. Goodwill and Other Intangible Assets
The Company accounts for Other Intangible Assets under the guidance in ASC 350, Intangibles—Goodwill and Other. Under the guidance intangible assets with definite lives are amortized over their estimated useful lives. Indefinite lived intangible assets are subject to annual impairment testing. The Company capitalizes certain costs related to patent technology. Additionally, a substantial portion of the purchase price related to the Company’s acquisitions has been assigned to patents or unpatented technology, trade name, customer backlog and customer relationships. The intangibles acquired in acquisitions have been valued using a discounted cash flow approach. Intangibles, except goodwill, are being amortized over their estimated useful lives.
66
Table of Contents
Intangible assets were comprised of the following as of December 31, 2014 and 2013:
| 2014 | 2013 | Useful Lives | ||||||||||
| Patented and unpatented technology |
$ | 21,561 | $ | 13,734 | 7-10 years | |||||||
| Amortization |
(10,137 | ) | (8,774 | ) | ||||||||
| Customer relationships |
31,477 | 15,540 | 5-20 years | |||||||||
| Amortization |
(5,013 | ) | (4,005 | ) | ||||||||
| Trade names and trademarks |
15,875 | 9,118 | 25years - Indefinite | |||||||||
| Amortization |
(1,867 | ) | (1,621 | ) | ||||||||
| Non-competition agreements |
50 | 50 | 2-5 years | |||||||||
| Amortization |
(24 | ) | (6 | ) | ||||||||
| Customer backlog |
462 | 469 | < 1 year | |||||||||
| Amortization |
(462 | ) | (469 | ) | ||||||||
|
|
|
|
|
|||||||||
| Total Intangible assets |
$ | 51,922 | $ | 24,036 | ||||||||
|
|
|
|
|
|||||||||
Amortization expense was $2,717, $2,318 and $2,097 for the periods ended December 31, 2014, 2013 and 2012, respectively.
Estimated amortization expense for the next five years and subsequent is as follows:
| Amount | ||||
| 2015 |
5,147 | |||
| 2016 |
4,661 | |||
| 2017 |
4,122 | |||
| 2018 |
3,999 | |||
| 2019 |
3,780 | |||
| And subsequent |
27,319 | |||
|
|
|
|||
| Total intangibles currently to be amortized |
$ | 49,028 | ||
|
|
|
|||
Changes in the Company’s goodwill by business segment were as follows:
| Equipment Lifting Segment |
Equipment Distribution Segment |
ASV Segment |
Total | |||||||||||||
| Balance December 31, 2012 |
$ | 15,008 | $ | 275 | $ | — | $ | 15,283 | ||||||||
| Goodwill for Sabre acquisition |
4,740 | — | — | 4,740 | ||||||||||||
| Goodwill for Valla acquisition |
2,409 | — | — | 2,409 | ||||||||||||
| Effect of change in exchange rates |
57 | — | — | 57 | ||||||||||||
|
|
|
|
|
|
|
|
|
|||||||||
| Balance December 31, 2013 |
$ | 22,214 | $ | 275 | $ | — | $ | 22,489 | ||||||||
|
|
|
|
|
|
|
|
|
|||||||||
| Goodwill for ASV acquisition |
— | — | 26,744 | 26,744 | ||||||||||||
| Effect of change in exchange rates |
(403 | ) | — | — | (403 | ) | ||||||||||
|
|
|
|
|
|
|
|
|
|||||||||
| Balance December 31, 2014 |
$ | 21,811 | $ | 275 | $ | 26,744 | $ | 48,830 | ||||||||
|
|
|
|
|
|
|
|
|
|||||||||
67
Table of Contents
Note 10. Accrual Detail
| As of December 31, | ||||||||
| 2014 | 2013 | |||||||
| Accrued expenses: |
||||||||
| Accrued payroll |
$ | 2,805 | $ | 1,951 | ||||
| Accrued employee benefits |
439 | 24 | ||||||
| Accrued bonuses |
1,226 | 1,998 | ||||||
| Accrued vacation expense |
1,309 | 888 | ||||||
| Accrued consulting fees |
223 | — | ||||||
| Accrued interest |
375 | 237 | ||||||
| Accrued commissions |
497 | 532 | ||||||
| Accrued expenses—other |
995 | 306 | ||||||
| Accrued warranty |
3,335 | 1,070 | ||||||
| Accrued income taxes |
151 | 473 | ||||||
| Accrued taxes other than income taxes |
1,015 | 1,087 | ||||||
| Accrued product liability and workers compensation claims |
603 | 202 | ||||||
| Accrued liability on forward currency exchange contracts |
30 | 40 | ||||||
|
|
|
|
|
|||||
| Total accrued expenses |
$ | 13,003 | $ | 8,808 | ||||
|
|
|
|
|
|||||
Note 11. Revolving Term Credit Facilities and Debt
The Company together with its U.S. and Canadian subsidiaries has a credit agreement (“Credit Agreement”) with Comerica Bank (“Comerica”) and certain other lenders, who are participants under the credit agreement. The Credit Agreement provides the Company with (a) a $40,000 Senior Secured Revolving Credit Facility to the U.S. Borrowers (“U.S. Revolver”), and (b) a $9,000 (or the Canadian dollar equivalent amount) Senior Secured Revolving Credit Facility to the Canadian Borrower (“Canadian Revolver”). The two aforementioned credit facilities each mature on August 19, 2018.
The indebtedness is collateralized by substantially all of the Company’s assets, except for the assets of the ASV. The facility contains customary limitations including, but not limited to, limitations on acquisitions, dividends, repurchase of the Company’s stock and capital expenditures. The Company is also required to comply with certain financial covenants as defined in the Credit Agreement.
U.S. Revolver
At December 31, 2014, the Company had drawn $34,219 under the $40,000 U.S. Revolver. The U.S. Revolver bears interest, at the Company’s option at the base rate plus a spread or an adjusted LIBOR rate plus a spread. The base rate is the greater of the bank’s prime rate, the federal funds rate plus 1.00% or the 30 day LIBOR rate Adjusted Daily plus 1.00%. For the U.S. Revolver the interest rate spread for Base Rate is between 1.625% and 2.250% and for LIBOR the spread is between 2.265% and 3.250% in each case with the spread being based on the consolidated total debt to consolidated adjusted EBITDA ratio, as defined in the Credit Agreement, for the preceding twelve months. The base rate and LIBOR spread is currently 1.625% and 2.625%, respectively. Funds borrowed under the LIBOR options can be borrowed for periods of one, two, three or six months.
The $40,000 U.S. Revolver is a secured financing facility under which borrowing availability is limited to existing collateral as defined in the agreement. The maximum amount available is limited to (1) the sum of 85% of eligible receivables, (2) the lesser of 50% of eligible inventory or $26,500, (3) the lesser of 80% of used equipment purchased for resale or rent or $2,000 reduced by (4) outstanding standby letter or credits issued by the bank. At December 31, 2014, the maximum the Company could borrow based on available collateral was capped at $39,355.
68
Table of Contents
Under the Credit Agreement, the banks are also paid a 0.375% annual facility fee payable in quarterly installments.
The agreement permits the Company to issue unsecured guarantees of indebtedness owed by CVS Ferrari, srl to foreign banks in respect to working capital financing, not to exceed the lesser of $9,000 or the amount of such financing. Additionally the agreement allows the Company to make or allow to remain outstanding any investment (whether such investment shall be of the character of investment of shares of stock, evidence of indebtedness or other securities or otherwise) in, or any loans or advances to CVS or to any other wholly-owned foreign subsidiary in an amount not to exceed $7,500.
Canadian Revolver
At December 31, 2014, the Company had drawn $8,629 under the Canadian Revolver. The Company is eligible to borrow up to $9,000. The maximum amount available is limited to the sum of (1) 90% of eligible insured receivables, (2) 85% of eligible receivables and (3) 50% of eligible inventory including work in process inventory. Under the agreement, total inventory collateral, however, cannot exceed CDN$9,000 and work in process collateral cannot exceed CDN$3,000. At December 31, 2014, the maximum the Company could borrow based on available collateral was CDN$9,000. The indebtedness is collateralized by substantially all of Manitex Liftking ULC’s assets. The Company can borrow in either U.S. or Canadian dollars. For the Canadian Revolver, the interest rate spread for U.S. prime based borrowing is between 0.00% and 0.25% and for Canadian prime based borrowings the interest rate spread is between 0.00% and 0.75%, in each case with the spread being based on the consolidated total debt to consolidated adjusted EBITDA ratio, as defined in the Credit Agreement, for the preceding twelve months. As of December 31, 2014 the spread on both the U.S. Prime based borrowing and Canadian Prime based borrowings was 0.00%.
Under the Credit Agreement, the banks are also paid a 0.375% annual facility fee payable in quarterly installments.
Specialized Export Facility
The Canadian Revolving Credit facility contains an additional $3,000 Specialized Export Facility that matures on June 1, 2015. Borrowings under the Specialized Export Facility are guaranteed by the Company and Export Development Canada (“EDC”), a corporation established by an Act of Parliament of Canada. Under the Export Facility Liftking can borrow 90% of the total cost of material and labor incurred on export contracts which are subject to the EDC guarantee. The EDC guarantee, which expires on June 1, 2015, is issued under their export guarantee program and covers certain goods that are to be exported from Canada. At December 31, 2014, the maximum the Company could have borrowed based upon available collateral under the Specialized Export Facility was $3,000. Under this facility, the Company can borrow either Canadian or U.S. dollars.
Any borrowings under the facility in Canadian dollars currently bear interest of 3.00% which is based on the Canadian prime rate (the Canadian prime was 3.0% at December 31, 2014). Any borrowings under the facility in U.S. dollars bear interest at the U.S. prime rate (prime was 3.25% at December 31, 2014). Repayment of advances made under the Export Facility are due sixty days after shipment of the goods, or five business days after the borrower receives payment in full for the goods covered by the guarantee (the “Scheduled Payment Date”) or upon the termination of the EDC guarantee.
At December 31, 2014, the Company had outstanding borrowing in connection with the Specialized Export Facility of $2,798.
69
Table of Contents
Note Payables—Terex
Related to Crane and Schaeff Acquisitions
At December 31, 2014, the Company has a note payable to Terex Corporation with a remaining balance of $500. The note was issued in connection with the purchase of substantially all of the domestic assets of Crane & Machinery, Inc. (“Crane”) and Schaeff Lift Truck, Inc., (“Schaeff”). The note has an annual interest rate of 6% and is payable quarterly. Terex has been granted a lien on and a subordinated security interest in all of the assets of the Company’s Crane & Machinery Division as security against the payment of the note.
The Company has two remaining principal payments of $250 due on March 1, 2015 and March 1, 2016. As long as the Company’s common stock is listed for trading on the NASDAQ or another national stock exchange, the Company may opt to the pay up to $150 of each annual principal payment in shares of the Company’s common stock having a market value of $150.
Related to ASV Acquisition
On December 19, 2014, the Company executed a note payable to Terex Corporation for $1,594. The note matures on December 19, 2015 and has an annual interest rate of 4.5%. Interest is payable semi-annually beginning on June 19, 2015. The note was issued in connection with acquisition of 51% interest in ASV from Terex Corporation. The note has an outstanding balance of $1,594 at December 31, 2014.
Load King Debt
The Company’s Load King Subsidiary used its manufacturing facility as collateral to secure mortgage financing with BED (South Dakota Board of Economic Development) and bank. Load King pledged its equipment to the bank to secure additional term debt (“Equipment Note”). The funds received in connection with the above borrowing were used to repay a promissory note to Terex Corporation (“Terex”), which was issued in connection with the Load King acquisition. The BED Mortgage, the bank mortgage and the Equipment Note, which are all guaranteed by the Company, have outstanding balances as of December 31, 2014 of $756, $783 and $245, respectively.
Under the terms of the BED Mortgage, the Company is required to make 59 payments of $5 based on a 240 month amortization period and a 3% interest rate. A final balloon payment of unpaid principal and interest is due on November 2, 2016. The interest rate for the note is subject to Load King maintaining employment levels specified in an Employment Agreement between Load King and BED. If Load King fails to maintain agreed upon employment levels, Load King may be required to pay BED an amount equal to the difference between the interest paid and amount of interest that would have been paid if the loan had a 6.5% interest rate.
Under the terms of the Bank Mortgage, the Company is required to make 120 interest and principal payments. The first sixty payments of $6 per month are based on a 240 month amortization period and a 6% interest rate. On November 2, 2016, the interest rate will reset. The new interest rate will be equal to the monthly average yield on 5 Year Constant Maturity U.S. Treasury Securities plus 3.75%. The monthly interest and principal payment will be recalculated accordingly. A final balloon payment of unpaid principal and interest is due on November 2, 2021.
Under the Equipment Note, the Company is required to make 84 monthly interest and principal payments. The first 60 payments will be for $6 and are based on an 84 month amortization period and a 6.25% interest rate. On November 2, 2016, the interest rate will reset. The interest rate will be equal to the monthly average yield on 5 year Constant Maturity of U.S. Treasury Securities plus 4.00%. The monthly principal and interest payments will be recalculated based on the new interest rate and will remain fixed for the next 24 months.
70
Table of Contents
CVS Short-Term Working Capital Borrowings
At December 31, 2014, CVS had established demand credit facilities with twelve Italian banks. Under the facilities, CVS can borrow up to €335 ($405) on an unsecured basis and additional amounts as advances against orders, invoices and letter of credit with a total maximum facilities (including the unsecured portion) of €13,513 ($16,352). The Company has granted guarantees in respect to available credit facilities in the amount of €7,123 ($8,619). The maximum amount outstanding is limited to 80% of the assigned accounts receivable if there is an invoice issued or 50% if there is an order/contract issued. The banks will evaluate each request to borrow individually and determine the allowable advance percentage and interest rate. In making its determination the bank considers the customer’s credit and location of the customer.
At December 31, 2014, the banks had advanced CVS €6,641 ($8,036) at variable interest rates which currently range from 3.83% to 6.58%.
At December 31, 2014, the Company has guaranteed €3,750 ($4,538) of CVS’s outstanding debt. Additionally, the banks had issued performance bonds which total €500 ($605) which have been guaranteed by the Company.
Acquisition note—Valla
In connection with the acquisition, the Company has a note with a stated interest rate of 5% in the amount of $170 payable to the sellers. The note is payable in two installments of $85 payable on December 31, 2015 and 2016.
The fair value of the promissory note was calculated to equal the present value of future debt payments discounted at a market rate of return commensurate with similar debt instruments with comparable levels of risk and marketability. A rate of 1.5% was determined to be the appropriate rate following an assessment of the risk inherent in the debt issued and the market rate for debt of this nature using corporate credit ratings. The difference of $28 between face amount of the promissory note and its fair value is being amortized over the life of the note and recorded as a reduction of interest expense.
As of December 31, 2014, the note had remaining principal balance of $172.
ASV Loan Facilities
In connection with the ASV arrangement, ASV entered into two separate loan facilities on December 19, 2014, one with JPMorgan Chase Bank, N.A. (“JPMCB”), and the other with Garrison Loan Agency Services LLC (“Garrison”). These two facilities are for the exclusive use of ASV and restrict the transfer of cash out side of ASV.
Both loan facilities are secured by certain assets of ASV and by a pledge of the equity interest in ASV. Pursuant to an intercreditor agreement dated as of December 19, 2014 among JPMCB, Garrison and ASV (“ASV Intercreditor Agreement”), the parties have agreed that (i) JPMCB shall have a first-priority security interest in substantially all personal property of ASV and (ii) Garrsion shall have a first priority security interest in (a) substantially all real property of ASV and (b) a pledge of 100% of the equity interest in ASV issued to Company and to Terex. ASV’s loans are solely obligations of ASV and have not been guaranteed by the Company and are not collateralized by any assets outside of ASV.
ASV Revolving Loan Facility with JPMCB
On December 19, 2014 ASV entered into a $35,000 revolving loan facility with JPMCB (“JPMCB Credit Agreement”) as the administrative agent, which loan facility includes two sub-facilities: (i) a $1,000 sub-facility for letters of credit, and (ii) a $7,500 sub-facility for loans to be guaranteed by the Export-Import Bank of the
71
Table of Contents
United States of America (“Ex-Im Bank Loans”). A portion of the JPMCB Credit Agreement was used to fund certain transaction costs and payments required by ASV under the ASV arrangement. The remainder of the loan amount will be available to ASV for its general working capital needs.
The $35,000 revolving loan facility is a secured financing facility under which borrowing availability is limited to existing collateral as defined in the agreement. The maximum amount available is limited to (1) the sum of 85% of eligible receivables, plus (2) the lesser of (i) 65% of eligible inventory valued at the lower of cost or market value or (ii) 85% of eligible inventory valued at the net orderly liquidation value, reduced by (3) (i) certain reserves determined by JPMCB, (ii) the amount of outstanding standby letters of credit issued under the JPMCB Credit Agreement and (iii) the amount of outstanding Ex-In Bank loans. The facility matures on December 19, 2019. At December 31, 2014, ASV had drawn $3,609 under the $35,000 JPMCB Credit Agreement. The JPMCB Credit Agreement bears interest at ASV’s option at JPMCB’ prime rate plus a spread or an adjusted LIBOR rate plus a spread. The interest rate spread for prime rate is between 0.50% and 1.00% and for LIBOR the spread is between 1.50% and 2.00% in each case with the spread being based on the aggregate amount of funds available for borrowing by ASV under the JPMCB Credit Agreement, as defined in the JPMCB Credit Agreement. The base rate and LIBOR spread is currently .75% and 1.75%, respectively. Funds borrowed under the LIBOR options can be borrowed for periods of one, two, three or six months. At December 31, 2014 the maximum ASV could borrow based on available collateral was capped at $19,734.
The indebtedness of ASV under the JPMCB Credit Agreement is collateralized by substantially all of ASV’s assets, but subject to the terms of the ASV Intercreditor Agreement. The facility contains customary limitations including, but not limited to, limitations on additional indebtedness, acquisitions, and payment of dividends. ASV is also required to comply with certain financial covenants as defined in the JPMCB Credit Agreement including maintaining a Minimum Fixed Charge Coverage ratio of not less than 1.10 to 1.0. The covenant requirement becomes effective as of March 31, 2015.
Under the JPMCB Credit Agreement, the banks are also paid a commitment fee payable in monthly installments equal to (i) the average daily amount of funds available but undrawn multiplied by (ii) an annual rate of 0.25%.
ASV Term Loan with Garrison
On December 19, 2014 ASV entered into a $40,000 term loan facility with Garrison (“Garrison Credit Agreement”) as the administrative agent. A portion of the Garrison Credit Agreement was used to fund certain transaction costs and payments required by ASV under the ASV arrangement.
At December 31, 2014, ASV had drawn the entirety of the $40,000 Garrison Credit Agreement. The Garrison Credit Agreement bears interest, at a one-month adjusted LIBOR rate plus a spread of between 9.00% and 9.50%. The spread is based on the ratio of ASV’s total debt to its EBITDA, as defined in the Garrison Credit Agreement. The LIBOR spread is currently 9.5%. The interest rate for the period ending December 31, 2014 was 10.5%.
ASV is obligated to make quarterly principal payments of $500 commencing on April 1, 2015. Any unpaid principal is due on maturity, which is December 19, 2019. Interest is payable monthly being on February 1, 2015.
The indebtedness of ASV under the Garrison Credit Agreement is collateralized by substantially all of ASV assets, but subject to the terms of the ASV Intercreditor Agreement. The facility contains customary limitations including, but not limited to, limitations on additional indebtedness, acquisitions, and payment of dividends. ASV is also required to comply with certain financial covenants as defined in the Garrison Credit Agreement including maintaining (1) a Minimum Fixed Charge Coverage ratio of not less than 1.10 to 1.0 which shall step up to 1.50 to 1.00 by March 31, 2017, (2) a Leverage Ratio of 4.75 to 1.00, which shall step down to 2.50 to 1.00 by March 31, 2018 and (3) a limitation of $1,600 in capital expenditures in any fiscal year. The covenant requirement becomes effective as of March 31, 2015.
72
Table of Contents
Schedule of Debt Maturities
Scheduled annual maturities of the principal portion of debt outstanding at December 31, 2014 in the next five years and the remaining maturity in aggregate are summarized below. Amounts shown include the debt described above in this footnote and the convertible notes disclosed in Note 13—“Convertible Note-Related Party” at its face amount of $7,500.
| 2015 |
$ | 14,297 | ||
| 2016 |
3,236 | |||
| 2017 |
2,093 | |||
| 2018 |
44,946 | |||
| 2019 |
36,142 | |||
| Thereafter |
8,128 | |||
|
|
|
|||
| 108,842 | ||||
| Less: Debt discount |
(889 | ) | ||
|
|
|
|||
| Total |
$ | 107,953 | ||
|
|
|
Note 12. Leases
Capital leases
Georgetown facility
The Company has a twelve year lease which expires in April 2018 that provides for monthly lease payments of $74 for its Georgetown, Texas facility. The lease has been classified as a capital lease. At December 31, 2014, the outstanding capital lease obligation is $2,184.
Winona facility
The Company had a five year lease which expired on July 10, 2014 that provides for monthly lease payments of $25 for its Winona, Minnesota facility. The Company has an option to purchase the facility for $500 by giving notice to the landlord of its intent to purchase the Facility. The Landlord must receive such notice at least three months prior to end of the Lease term. The Company gave the Landlord the required notice of its election to purchase the facility. The Company and the Landlord are currently in the process of finalizing the purchase contract. The purchase of the facility is expected to be completed during the first quarter 2015. At December 31, 2014, the Company has outstanding capital lease obligation of $500, the amount of the purchase option.
Equipment
The Company has entered into a lease agreement with a bank pursuant to which the Company is permitted to borrow 100% of the cost of new equipment and 75% of the cost of used equipment with 60 and 36 months repayment periods, respectively. At the conclusion of the lease period, for each piece of equipment the Company is required to purchase that piece of leased equipment for one dollar.
The equipment, which is acquired in ordinary course of the Company’s business, is available for sales and rental prior to sale.
Under the lease agreement the Company can elect to exercise an early buyout option at any time, and pay the bank the present value of the remaining rental payments discounted by a specified Index Rate established at the time of leasing. The early buyout option results in a prepayment penalty which progressively decreases during the term of the lease. Alternatively, the Company under the like-kind provisions in the agreement can elect to replace or substitute different equipment in place of equipment subject to the early buyout without incurring a penalty.
73
Table of Contents
The following is a summary of inventory held for sale which was financed under equipment capital lease agreements:
| Amount Borrowed |
Repayment Period |
Amount of Monthly Payment |
Balance As of December 31, 2014 |
|||||||||||||
| New equipment |
$ | 1,166 | 60 | $ | 22 | $ | 971 | |||||||||
| Used equipment |
$ | 1,754 | 36 | $ | 53 | $ | 605 | |||||||||
|
|
|
|
|
|
|
|||||||||||
| Total |
$ | 2,920 | $ | 75 | $ | 1,576 | ||||||||||
|
|
|
|
|
|
|
|||||||||||
The Company has three additional capital leases. As of December 31, 2014, the capitalized lease obligation in aggregate related to the three leases was $82.
Future Minimum Lease Payments are:
| Years |
Operating Leases | Capital Leases | ||||||
| 2015 |
$ | 1,627 | $ | 2,256 | ||||
| 2016 |
1,328 | 1,256 | ||||||
| 2017 |
1,328 | 1,256 | ||||||
| 2018 |
907 | 329 | ||||||
| 2019 |
908 | 330 | ||||||
| Subsequent |
700 | — | ||||||
|
|
|
|
|
|||||
| Total Minimum Lease Payments |
$ | 6,798 | 5,427 | |||||
|
|
|
|||||||
| Less: imputed interest |
(1,086 | ) | ||||||
|
|
|
|||||||
| Present value of minimum lease payment |
$ | 4,341 | ||||||
| Less: current portion |
(1,631 | ) | ||||||
|
|
|
|||||||
| Long-term capital lease obligations |
$ | 2,710 | ||||||
|
|
|
|||||||
| Capital Item—as of or for the year ended December 31, 2014 |
Cost | Accumulated Depreciation |
Depreciation Expense |
Interest Expense |
||||||||||||
| Building—Georgetown, TX |
$ | 4,913 | $ | 3,529 | $ | 35 | $ | 307 | ||||||||
| Land & Building—Winona, MN |
1,700 | 311 | 57 | 13 | ||||||||||||
| Other Capitalized leases |
197 | 67 | 28 | 4 | ||||||||||||
|
|
|
|
|
|
|
|
|
|||||||||
| Totals |
$ | 6,810 | $ | 3,907 | $ | 120 | $ | 324 | ||||||||
|
|
|
|
|
|
|
|
|
|||||||||
| Capital Item—as of or for the year ended December 31, 2013 |
Cost | Accumulated Depreciation |
Depreciation Expense |
Interest Expense |
||||||||||||
| Building—Georgetown, TX |
$ | 4,913 | $ | 3,114 | $ | 35 | $ | 457 | ||||||||
| Land & Building—Winona, MN |
1,700 | 254 | 57 | 47 | ||||||||||||
| Other Capitalized leases |
178 | 39 | 14 | 3 | ||||||||||||
|
|
|
|
|
|
|
|
|
|||||||||
| Totals |
$ | 6,791 | $ | 3,407 | $ | 106 | $ | 507 | ||||||||
|
|
|
|
|
|
|
|
|
|||||||||
Sales and Leaseback—In accordance with ASC 840-40 Sales- Leaseback Transaction, at December 31, 2014 and 2013, the Company has deferred gain of $1,268 and $1,648, respectively, related to the sale and leaseback of Georgetown operating facilities. The deferred gain is being amortized over the life of the lease which reduces depreciation expense $380 annually.
Operating leases
The Company leases its Woodbridge, Ontario facility under an operating lease. Monthly payments under the lease are $34. The lease expires on November 29, 2019. The Company has an option to renew the lease for an
74
Table of Contents
additional five years at a rent which is mutually agreed. In the event that the parties cannot agree the lease has an arbitration provision. Total rent expense related to this lease was $431, $489 and $483 for the year ended December 31, 2014, 2013 and 2012, respectively.
The Company leases its 40,000 sq. ft. Bridgeview facility from an entity controlled by Mr. David Langevin, the Company’s Chairman and CEO. Pursuant to the terms of the lease, the Company makes monthly lease payments of $21. The Company is also responsible for all the associated operations expenses, including insurance, property taxes, and repairs. The lease will expire on June 30, 2020 and has a provision for six one year extension periods. The lease contains a rental escalation clause under which annual rent is increased during the initial lease term by the lesser of the increase in the Consumer Price Increase or 2.0%. Rent for any extension period shall, however, be the then-market rate for similar industrial buildings within the market area.
The Company has the option to purchase the building by giving the landlord written notice at any time prior to the date that is 180 days prior to the expiration of the lease or any extension period. The landlord can require the Company to purchase the building if a change of Control Event, as defined in the lease, occurs by giving written notice to the Company at any time prior to the date that is 180 days prior to the expiration of the lease or any extension period. The purchase price, regardless whether the purchase is initiated by the Company or the landlord, will be the Fair Market Value as of the closing date of said sale. Rent expense for the current and former Bridgeview facility was $256, $251 and $247 for the years ended December 31, 2014, 2013 and 2012, respectively.
The Company leases its 103,000 sq. ft. facility in Cadeo, Italy from Fratelli Ferrari Realty. The lease which was executed on June 30, 2011 is for six years and provides annual rent of €360 ($436) payable in monthly installments. The Company has an option to renew the lease for an additional six years at a rent which is mutually agreed.
The Company leases its Knox, Indiana facility under two operating leases. The leases which expire on August 19, 2020, currently provides for month rent of $11 and $3, respectively. The leases contain a rental escalation clause under which annual rent is increased during the lease term by the lesser of the increase in the Consumer Price Increase or 2.0%. The Company is also responsible for all the associated operations expenses, including insurance, property taxes, and repairs. The Company has an option to extend the leases for an additional five year period. The Company has the right to purchase the facility at a negotiated price any time during the lease period. If the parties are unable to agree on purchase price, the purchase price under the terms of the lease will be the average of two appraisals of the premises performed by independent third-party appraisers, one selected by the landlord and on selected by the Company. Total rent expense related to the leases was $181 and $73 (from date of acquisition on August 19, 2013 through December 31, 2013) for the year ended December 31, 2014 and 2013, respectively.
The Company leases its facility in Via Piacenza, Italy under an operating lease. The lease is a six year lease that expires on November 30, 2019. The Company has the option after two years to terminate the lease on the signing anniversary by giving the lessor at least 90 day notice. The annual rent, which is paid in two semi-annual installments, is $86, $100 and $103 for the first, second and third year, respectively. After the third year, the lease provides for an annual rent increase. The rent is increased by seventy-five percent of the increase in the ISTAT index for families of workers and employees.
The Company has various operating equipment leases with monthly payments ranging from less than $1 to $4 with various expiration dates through 2017. Total rent expense under these additional leases was $125, $138 and $272 for the years ended December 31, 2014, 2013 and 2012.
Note 13. Convertible Note—Related Party
On December 19, 2014, the Company issued a subordinated convertible debenture with a $7,500 face amount payable to Terex, a related party. The convertible debenture, is subordinated, carries a 5% per annum coupon, and is convertible into Company common stock at a conversion price of $13.65 per share or a total of 549,451 shares, subject to customary adjustment provisions. The debenture has a December 19, 2020 maturity date.
75
Table of Contents
From and after the third anniversary of the original issuance date, the Company may redeem the convertible debenture in full (but not in part) at any time that the last reported sale price of the Company’s common stock equals at least 130% of the Conversion Price (as defined in the debenture) for at least 20 of any 30 consecutive trading days. Following an election by the holder to convert the debenture into common stock of the Company in accordance with the terms of the debenture, the Company has the discretion to deliver to the holder either (i) shares of common stock, (ii) a cash payment, or (iii) a combination of cash and stock.
In accounting for the issuance of the note, the Company separated the note into liability and equity components. The carrying amount of the liability component was calculated by measuring the estimated fair value of a similar liability that does not have an associated convertible feature. The carrying amount of the equity component representing the conversion option was determined by deducting the fair value of the liability component from the face value of the Note as a whole. The excess of the principal amount of the liability component over its carrying amount (“debt discount”) is amortized to interest expense over the term of the note using the effective interest method with an effective interest rate of 7.5 percent per annum. The equity component is not remeasured as long as it continues to meet the conditions for equity classification.
On December 19, 2014, the components of the note was as follows:
| Liability component |
$ | 6,607 | ||
| Equity component (a component of paid in capital) |
893 | |||
|
|
|
|||
| $ | 7,500 | |||
|
|
|
Additionally in connection with the transaction a $321 deferred tax liability was established and was recorded as a deduction to paid in capital. The deferred tax liability was recognized as the excess of the principal amount being amortized and charged to interest expenses is not tax deductible.
As of December 31, 2014, the note had remaining principal balance of $6,611 and an unamortized discount of $889. The difference between this amount and the amount initially recorded represents $4 of amortization of excess of the principal amount of the liability component over its carrying amount.
Note 14. Income Taxes
Information pertaining to the Company’s income before income taxes is as follows:
| Years ended December 31, | ||||||||||||
| 2014 | 2013 | 2012 | ||||||||||
| Income before income taxes: |
||||||||||||
| Domestic |
$ | 8,871 | $ | 14,659 | $ | 11,316 | ||||||
| Foreign |
1,772 | (212 | ) | 582 | ||||||||
|
|
|
|
|
|
|
|||||||
| Total net income before income taxes |
$ | 10,643 | $ | 14,447 | $ | 11,898 | ||||||
|
|
|
|
|
|
|
|||||||
76
Table of Contents
Information pertaining to the Company’s provision (benefit) for income taxes is as follows:
| Years ended December 31, | ||||||||||||
| 2014 | 2013 | 2012 | ||||||||||
| Provision (benefit) for income taxes: |
||||||||||||
| Current: |
||||||||||||
| Federal |
$ | 3,057 | $ | 4,246 | $ | 2,785 | ||||||
| State and local |
176 | 50 | 227 | |||||||||
| Foreign |
691 | 132 | 535 | |||||||||
|
|
|
|
|
|
|
|||||||
| 3,924 | 4,428 | 3,547 | ||||||||||
| Deferred: |
||||||||||||
| Federal |
(429 | ) | (94 | ) | 670 | |||||||
| State and local |
39 | 64 | (378 | ) | ||||||||
| Foreign |
142 | (129 | ) | (18 | ) | |||||||
|
|
|
|
|
|
|
|||||||
| (248 | ) | (159 | ) | 274 | ||||||||
|
|
|
|
|
|
|
|||||||
| Total provision for income taxes |
$ | 3,676 | $ | 4,269 | $ | 3,821 | ||||||
|
|
|
|
|
|
|
|||||||
Deferred income taxes reflect the net tax effects of temporary differences between the carrying amounts of assets and liabilities for financial reporting purposes and income tax purposes. Significant components of the Company’s deferred tax assets and liabilities are as follows:
| Year ended December 31, |
||||||||
| 2014 | 2013 | |||||||
| Deferred tax assets: |
||||||||
| Current: |
||||||||
| Accrued expenses and other liabilities |
$ | 1,325 | $ | 1,133 | ||||
| Net operating losses |
— | 139 | ||||||
| Long-term: |
||||||||
| Other liabilities |
433 | 457 | ||||||
| Deferred gain |
458 | 594 | ||||||
| State net operating loss carryforwards |
3 | — | ||||||
| Tax credit carryforwards |
824 | 847 | ||||||
| Unrealized foreign currency loss |
219 | 219 | ||||||
| Investment in ASV |
144 | — | ||||||
|
|
|
|
|
|||||
| Total deferred tax asset |
3,406 | 3,389 | ||||||
| Valuation allowance |
— | — | ||||||
|
|
|
|
|
|||||
| Total deferred tax asset net of valuation allowance |
3,406 | 3,389 | ||||||
| Deferred tax liabilities: |
||||||||
| Long-term: |
||||||||
| Property, plant and equipment |
552 | 558 | ||||||
| Intangibles |
3,290 | 3,516 | ||||||
| Discount on convertible notes |
321 | — | ||||||
|
|
|
|
|
|||||
| Total deferred tax liability |
4,163 | 4,074 | ||||||
|
|
|
|
|
|||||
| Net deferred tax liability |
$ | (757 | ) | $ | (685 | ) | ||
|
|
|
|
|
|||||
The Company has not provided for the United States income or the foreign withholding taxes on the $5.6 million of undistributed earnings of its subsidiaries operating outside of the United States. It is the Company’s intention to reinvest those earnings permanently. Generally, such amounts become subject to United States taxation upon
77
Table of Contents
remittance of dividends and under certain other circumstances. Determination of the amount of any unrecognized deferred tax liability related to investments in these foreign subsidiaries is not practicable.
The effective tax rate before income taxes varies from the current U.S. federal statutory income tax rate as follows:
| Years ended December 31, |
||||||||
| 2014 | 2013 | |||||||
| Statutory rate |
35.00 | % | 35.00 | % | ||||
| State and local taxes |
1.48 | 0.72 | ||||||
| Permanent differences |
(2.08 | ) | (3.08 | ) | ||||
| Tax credits |
(2.04 | ) | (3.59 | ) | ||||
| Foreign operations |
2.00 | 0.54 | ||||||
| Uncertain tax positions |
(0.21 | ) | (0.47 | ) | ||||
| Other |
0.45 | 0.43 | ||||||
|
|
|
|
|
|||||
| 34.60 | % | 29.55 | % | |||||
|
|
|
|
|
|||||
As of December 31, 2014, the Company has approximately $1,268 of Texas Temporary Margin Tax Credit that may be utilized through 2026. The Company has reflected a deferred tax asset in the table above of $824, net of the federal tax impact.
A reconciliation of the beginning and ending amount of unrecognized tax benefits, including interest and penalties, is as follows:
| 2014 | 2013 | |||||||
| Balance at January 1, |
$ | 250 | $ | 335 | ||||
| Increases in tax positions for prior years |
80 | 93 | ||||||
| Decreases in tax positions for prior years |
(115 | ) | (178 | ) | ||||
| Settlements |
— | — | ||||||
|
|
|
|
|
|||||
| Balance at December 31, |
$ | 215 | $ | 250 | ||||
|
|
|
|
|
|||||
Of the amounts reflected in the above table at December 31, 2014, the entire amount would reduce the Company’s annual effective tax rate if recognized. The Company had approximately $17 of accrued interest as of December 31, 2014. The Company records accrued interest related to income tax matters in the provision for income taxes in the accompanying consolidated statement of income. The Company does not expect its unrecognized tax benefits to change significantly over the next 12 months.
The Company files income tax returns in the United States, Canada and Italy as well as various state and local tax jurisdictions with varying statutes of limitations. The 2011 through 2014 tax years generally remain subject to examination by federal, foreign and most state tax authorities.
In connection with the acquisition, the Board of Directors of ASV, Inc. agreed a Plan of Conversion to convert ASV, Inc., a corporation into a Minnesota limited liability company. Under the plan, all of the issued and outstanding shares of ASV, Inc. were cancelled and an equal number of limited liability company membership interests were issued to the members of ASV LLC, on a one-for-one basis.
In connection with the conversion, ASV, Inc. will have taxable gain in the assets of the ASV, Inc. The estimated taxes payable on such gain is expected to be approximately $16.5 million. This tax liability was recorded on the balance sheet of ASV as of the date of closing. If the actual taxes are in excess of the $16.5 million, the Sellers shall reimburse ASV, LLC such amount on a timely basis. Such payment from the Seller will be deemed a
78
Table of Contents
purchase price adjustment. If the actual taxes are less than the $16.5 million, then ASV LLC will reimburse the Sellers any excess amount.
Following the conversion, ASV, LLC will be treated as a partnership for tax purposes. The Company received basis in the limited liability company equal to the fair market value basis in its share of the ASV, LLC’s assets. As such, the Company did not record deferred taxes in connection with the business combination and the financial reporting and tax basis in ASV, LLC were the same.
Note 15. Supplemental Cash Flow Disclosures
Interest received and paid, income taxes paid and non-cash transactions incurred during the years ended December 31, 2014, 2013 and 2012 were as follows:
| 2014 | 2013 | 2012 | ||||||||||
| Non-Cash Transactions: |
||||||||||||
| Investment in Lift Ventures (see Note 19) |
$ | 5,951 | $ | — | $ | — | ||||||
| Note to Terex related to ASV |
1,594 | — | — | |||||||||
| Capital leases |
— | 813 | 1,166 | |||||||||
| Issuance of stock in connection with carry deck crane assets (see Note 19) |
— | — | 200 | |||||||||
| Issuance of stock in connection with a Sabre acquisition (see Note 19) |
— | 1,000 | — | |||||||||
| Valla working capital |
— | 2,173 | — | |||||||||
| Acquisition note—Valla (see Note 19) |
— | 228 | — | |||||||||
| Contingent consideration—Valla (see Note 19) |
— | 250 | — | |||||||||
| Issuance of stock in connection with a cashless warrant exercise |
— | — | 986 | |||||||||
| Repurchase of stock in connection with cashless warrant exercise |
— | — | (754 | ) | ||||||||
| Transfer of warrant to capital stock upon exercise of cashless warrant |
— | — | (232 | ) | ||||||||
Note 16. 401(k) Profit Sharing Plan
The Company’s sponsors a 401(k) plan. The plan is intended to cover all non-union United States based employees. The plan is open to employees 21 years of age & older. There is no minimum employment duration required before eligibility. The plan allows for monthly enrollment and contribution changes.
The Company suspended its discretionary matching contribution on February 15, 2009. On January 1, 2012, the Company again began to match participants’ contributions. The Company match currently in effect matches dollar for dollar participants’ contributions up to 3% of the participant’s income. There is no dollar limit regarding matched funds and the plan also calls for immediate vesting of the employer contribution component. The employer match is paid when payroll is processed.
The amount paid in matching contributions by the company for 2014, 2013 and 2012 were $346, $271 and $187, respectively.
Note 17. Accrued Warranties
A liability for estimated warranty claims is accrued at the time of sale. The liability is established using historical warranty claim experience. Historical warranty experience is, however, reviewed by management.
The current provision may be adjusted to take into account unusual or non-recurring events in the past or anticipated changes in future warranty claims. Adjustments to the initial warranty accrual are recorded if actual claim experience indicates that adjustments are necessary. Warranty reserves are reviewed to ensure critical assumptions are updated for known events that may impact the potential warranty liability.
79
Table of Contents
The following table summarizes the changes in product warranty liability:
| 2014 | 2013 | |||||||
| Balance January 1, |
$ | 1,070 | $ | 988 | ||||
| Business Acquired |
2,206 | 10 | ||||||
| Accrual for warranties issued during the year |
849 | 2,358 | ||||||
| Warranty services provided |
(807 | ) | (2,260 | ) | ||||
| Changes in estimates |
32 | (23 | ) | |||||
| Foreign currency translation |
(15 | ) | (3 | ) | ||||
|
|
|
|
|
|||||
| Balance December 31, |
$ | 3,335 | $ | 1,070 | ||||
|
|
|
|
|
|||||
Note 18. Segment Information
The Company operates in three business segments: Lifting Equipment, ASV and Equipment Distribution.
The Lifting Equipment segment is a leading provider of engineered lifting solutions. The Company designs, manufactures and distributes, predominately through a network of dealers, a diverse group of products that serve different functions and are used in a variety of industries. The Company markets a comprehensive line of boom trucks, a truck crane and sign cranes, a complete line of rough terrain forklifts, including both the Liftking and Noble product lines, as well as special mission oriented vehicles, and other specialized carriers, heavy material handling transporters and steel mill equipment. The Company also manufacturers a number of specialized rough terrain cranes and material handling products, including 15 and 30-ton cab down rough terrain cranes. Company lifting products are used in industrial applications, energy exploration and infrastructure development in the commercial sector and for military applications. The company’s specialized rough terrain cranes primarily serve the needs of the construction, municipality, and railroad industries. Through its Italian subsidiary, the Company manufactures and distributes reach stackers and associated lifting equipment for the global container handling markets. On November 30, 2013, the Company acquired the assets of Valla SpA (“Valla”) located in Piacenza, Italy. Valla offers a full range of mobile cranes from 2 to 90 tons, using electric, diesel, and hybrid power options. Its cranes offer wheeled or tracked, fixed or swing boom configurations, with dozens of special applications designed specifically to meet the needs of its customers. Additionally, the Company manufactures and distributes custom trailers and hauling systems typically used for transporting heavy equipment, the trailer business serves niche markets in the commercial construction, railroad, military, and equipment rental industries through a dealer network. Beginning in August 2013, the Company began to manufacture and market a comprehensive line of specialized trailer tanks for liquid and solid storage and containment. The tank trailers are used in a variety of end markets such as petrochemical, waste management and oil and gas drilling.
The Equipment Distribution segment located in Bridgeview, Illinois, comprises the operations of Crane & Machinery (“C&M”), a division of Manitex International , Inc. The segment markets products used primarily for infrastructure development and commercial construction applications that include road and bridge construction, general contracting, roofing, scrap handling and sign construction and maintenance. C&M is a distributor of Terex rough terrain and truck cranes, and supplies repair parts for a wide variety of medium to heavy duty construction equipment and sells domestically and internationally, predominately to end users, including the rental market. It also provides crane equipment repair services in the Chicago area. C&M uses the trade name, North American Equipment Exchange to market previously-owned construction and heavy equipment, both domestically and internationally and provides a wide range of used lifting and construction equipment of various ages and condition, and also has the capability to refurbish equipment to the customers’ specification. C&M operates as the North American sales organization for our Italian based PM knuckle boom cranes and Valla pick and carry crane products.
ASV which was acquired on December 19, 2014, is shown as a separate segment. ASV is located in Grand Rapids, Minnesota and manufactures a line of high quality compact track and skid steer loaders. The ASV products are distributed through the Terex distribution channels as well as Manitex dealers.
80
Table of Contents
Sabre, Valla and ASV results are included in the Company’s results from their respective effective dates of acquisition on August 19, 2013, November 30, 2013 and December 20, 2014.
The following is financial information for our three operating segments, i.e., Lifting Equipment, Equipment Distribution and ASV. The below financial information includes results for each of the above acquisitions from the respective date of acquisition:
| Years ended December 31, | ||||||||||||
| 2014 | 2013 | 2012 | ||||||||||
| Net Revenues |
||||||||||||
| Lifting Equipment |
$ | 245,435 | $ | 228,772 | $ | 188,792 | ||||||
| Equipment Distribution |
21,104 | 16,951 | 17,090 | |||||||||
| ASV |
2,264 | — | — | |||||||||
| Inter-segment elimination |
(4,722 | ) | (651 | ) | (633 | ) | ||||||
|
|
|
|
|
|
|
|||||||
| Total |
$ | 264,081 | $ | 245,072 | $ | 205,249 | ||||||
|
|
|
|
|
|
|
|||||||
| Operating Earnings |
||||||||||||
| Lifting Equipment |
$ | 21,640 | $ | 23,311 | $ | 19,880 | ||||||
| Equipment Distribution |
374 | 628 | 222 | |||||||||
| ASV |
(121 | ) | — | — | ||||||||
| Corporate expenses |
(7,968 | ) | (6,391 | ) | (5,613 | ) | ||||||
| Elimination of inter-segment profit in inventory |
11 | (10 | ) | (30 | ) | |||||||
|
|
|
|
|
|
|
|||||||
| Total operating income |
$ | 13,936 | $ | 17,538 | $ | 14,459 | ||||||
|
|
|
|
|
|
|
|||||||
| Total Assets |
||||||||||||
| Lifting Equipment |
$ | 172,306 | $ | 170,692 | $ | 143,749 | ||||||
| Equipment Distribution |
15,634 | 10,847 | 7,562 | |||||||||
| ASV |
126,547 | — | — | |||||||||
| Corporate |
1,636 | 1,075 | 193 | |||||||||
|
|
|
|
|
|
|
|||||||
| Total |
$ | 316,123 | $ | 182,614 | $ | 151,504 | ||||||
|
|
|
|
|
|
|
|||||||
Total foreign source net revenue was approximately $96,747, $95,205 and $90,691 for the years ended December 31, 2014, 2013 and 2012, respectively. Total long-lived assets related to the Company’s foreign operations were approximately $6,935 and $8,616 for the years ended December 31, 2014 and 2013, respectively. Information of external net revenues and long lived asset information by country is shown on the below tables:
The following is a summary of goodwill by segment:
| 2014 | 2013 | |||||||
| Goodwill—Lifting Equipment Segment |
||||||||
| Balance January 1 |
$ | 22,214 | $ | 15,008 | ||||
| Goodwill related to the Sabre acquisition |
— | 4,740 | ||||||
| Goodwill related to the Valla acquisition |
— | 2,409 | ||||||
| Foreign currency translation |
(403 | ) | 57 | |||||
|
|
|
|
|
|||||
| Balance December 31, |
21,811 | 22,214 | ||||||
|
|
|
|
|
|||||
| Goodwill—Equipment Distribution Segment |
||||||||
| Balance January 1 and December 31 |
275 | 275 | ||||||
| Goodwill—ASV Segment |
||||||||
| Goodwill related to ASV acquisition |
26,744 | — | ||||||
|
|
|
|
|
|||||
| Total goodwill at December 31, |
$ | 48,830 | $ | 22,489 | ||||
|
|
|
|
|
|||||
81
Table of Contents
Net Revenues
| 2014 | 2013 | 2012 | ||||||||||
| United States |
$ | 167,334 | $ | 149,867 | $ | 114,558 | ||||||
| Canada |
34,658 | 44,568 | 55,540 | |||||||||
| Italy |
18,260 | 8,230 | 11,700 | |||||||||
| Turkey |
969 | 5,280 | — | |||||||||
| Peru |
1,840 | 3,849 | — | |||||||||
| South Africa |
516 | 3,651 | — | |||||||||
| Egypt |
129 | 3,285 | — | |||||||||
| Australia |
— | 4 | 3,213 | |||||||||
| Korea |
934 | — | 2,810 | |||||||||
| Russia |
710 | 1,623 | 2,189 | |||||||||
| Germany |
3,459 | 3,246 | 2,041 | |||||||||
| Mexico |
4,050 | 5,096 | 1,867 | |||||||||
| Czech Republic |
3,426 | 1,804 | 1,484 | |||||||||
| Brazil |
3 | — | 1,205 | |||||||||
| France |
2,487 | — | 810 | |||||||||
| United Arab Emirates |
4,226 | 1,297 | 152 | |||||||||
| Venezuela |
— | 407 | 1,188 | |||||||||
| Switzerland |
2,697 | — | 22 | |||||||||
| Other |
18,383 | 12,865 | 6,470 | |||||||||
|
|
|
|
|
|
|
|||||||
| $ | 264,081 | $ | 245,072 | $ | 205,249 | |||||||
|
|
|
|
|
|
|
|||||||
Company attributes revenue to different geographic areas based on where items are shipped or services are performed.
Long Lived Assets
| 2014 | 2013 | |||||||
| United States |
$ | 134,871 | $ | 52,200 | ||||
| Canada |
549 | 789 | ||||||
| Italy |
6,386 | 7,827 | ||||||
|
|
|
|
|
|||||
| Total Long-Lived Assets |
$ | 141,806 | $ | 60,816 | ||||
|
|
|
|
|
|||||
Long-Lived Assets are based on where the operating unit is domiciled.
Note 19. Acquisition and Investment
Lift Ventures, LLC
On December 16, 2014, Manitex International, Inc. (the “Company”), BGI USA Inc. (“BGI”), Movedesign SRL and R & S Advisory S.r.l., entered into an operating agreement (the “Operating Agreement”) for Lift Ventures LLC (“Lift Ventures”), a joint venture entity. The purposes for which Lift Ventures is organized are the manufacturing and selling of certain products and components, including the Schaeff line of electric forklifts and certain LiftKing products. Pursuant to the Operating Agreement, the Company was granted a 25% equity stake in Lift Ventures in exchange for the contribution of inventory totaling $5,951 and a license of certain intellectual property related to the Company’s products. As of December 31, 2014 no transactions occurred since the date of this transaction.
This investment is a non-marketable equity investment made in a privately-held company accounted for under the equity method.
82
Table of Contents
As of December 31, 2014, this investment had a carrying value of $5,951. In the future, we will review this non-marketable equity investment periodically for impairment. No impairments were recognized for the year ended December 31, 2014.
ASV Stock Purchase
On December 19, 2014, the Company closed on the ASV Stock Purchase Agreement entered into between Manitex International, Inc. (the “Company”) and Terex Corporation (“Terex”) on October 29, 2014, pursuant to which the Company purchased 51% of the issued and outstanding shares of ASV Inc. a Grand Rapids, Minnesota-based manufacturer of a broad line of technology leading compact rubber tracked and skid steer loaders and accessories that had been a wholly owned subsidiary of Terex since 2008.
The fair value of the purchase consideration was $94,437 in total as shown below:
| Cash |
$ | 25,000 | ||
| Note payable to seller |
1,411 | |||
| Fair value of non-controlling interest in ASV |
23,376 | |||
| Assumption of non-recourse ASV debt |
44,650 | |||
|
|
|
|||
| Total purchase consideration |
$ | 94,437 | ||
|
|
|
Under the acquisition method of accounting, in accordance ASC 805, Business Combinations, the assets acquired and liabilities assumed are valued based on their estimated fair values as of the date of the acquisition. The Company engaged a valuation expert and a tax advisor to provide guidance and assistance to management which was considered and in part relied upon in completing its purchase price allocation. The excess of the purchase price over the aggregate estimated fair value of net assets acquired was allocated to goodwill. The purchase price allocation is preliminary and is subject to final review of certain inventory, accrual and receivable balances. The following table summarizes the preliminary allocation of the ASV acquisition consideration to the fair value of the assets acquired and liabilities assumed at the date of acquisition:
Purchase price allocation:
| Cash |
$ | 2 | ||
| Accounts receivable |
18,232 | |||
| Prepaid Expenses |
71 | |||
| Inventory |
27,217 | |||
| Total fixed assets |
19,177 | |||
| Customer relationships |
16,000 | |||
| Trade name and trademarks |
7,000 | |||
| Patented & Unpatented Technology |
8,000 | |||
| Goodwill |
26,744 | |||
| Capitalized Debt Issuance Costs |
2,767 | |||
| Accounts payable |
(9,459 | ) | ||
| Accrued expenses |
(3,975 | ) | ||
| Accrued conversion tax |
(16,500 | ) | ||
| Accrued pension liability |
(839 | ) | ||
|
|
|
|||
| Net assets acquired |
$ | 94,437 | ||
|
|
|
Deferred bank fees and expense: Legal and bank fees incurred related to establishing term debt and revolving credit financing for ASV as part of the acquisition transaction. Manitex executed a note payable in the amount of $1,594 in connection with the transaction. The note was to reimburse Terex for Manitex’s share of fees and expenses, including $1,411 of fees related to new financing at ASV.
83
Table of Contents
Noncontrolling interest in ASV: Fair value of Terex 49% share of ASV equity calculated by grossing up the fair value of the controlling interest purchased by the Company to a 100% value, then deducting the $26,411 paid for the majority interest. Subsequently an adjustment for an implied minority discount of $2,000 (approximately 8%) was applied against initial calculation.
Non-recourse ASV debt: In connection with the transaction, ASV entered into a $40,000, five year Term debt facility and a $35,000 revolving credit facility. At the date of acquisition, ASV had fully drawn funds on the Term debt, $40,000, and had drawn $4,650 on the revolving credit facility.
Under the acquisition method of accounting, the total consideration is allocated to the assets acquired and liabilities assumed based on their fair values as of the date of the acquisition as shown below.
Tangible assets and liabilities: The tangible assets and liabilities were valued at their respective carrying values by ASV, except for certain adjustments necessary to state such amounts at their estimated fair values at acquisition date. Fair market adjustments to fixed assets and inventory of $4,390 were recorded.
Intangible assets: There are three fundamental methods applied to value intangible assets outlined in FASB ASC 820. These methods include the Cost Approach, the Market Approach, and the Income Approach. Each of these valuation approaches was considered in our estimation of value.
Trade names and trademarks, patented and unpatented technology: Valued using the Relief from Royalty method, a form of both the Market Approach and the Income Approach. Because the Company has established trade names and trademarks and has developed patented and unpatented technology, we estimated the benefit of ownership as the relief from the royalty expense that would need to be incurred in absence of ownership.
Customer relationships: Because there is a specific earnings stream that can be associated with customer relationships, we determined the fair value of these relationships based on the excess earnings method, a form of the Income Approach.
Goodwill: Goodwill represents the excess of total consideration paid and the fair value of net assets acquired. The recognition of goodwill of $26,744 reflects the inherent value in the ASV reputation, which has been built since being founded in 1983 and the prospects for significant future earnings.
For income tax purposes, intangible assets and goodwill will be amortized and will result in future tax deductions.
Accrued conversion tax: In connection with the acquisition, the Board of Directors of ASV, Inc. agreed a Plan of Conversion to convert ASV, Inc., a corporation into a Minnesota limited liability company. Under the plan, all of the issued and outstanding shares of ASV, Inc. were cancelled and an equal number of limited liability company membership interests were issued to the members of ASV LLC, on a one-for-one basis. In connection with the conversion, ASV will have a taxable gain.
Acquisition transaction costs: Cost and expenses related to the acquisition have been expensed as incurred and recorded in selling, general and administrative expenses. The Company incurred fees of $100 for legal services, $750 for acquisition related bonus payments, $325 for accounting services in connection with the prior year audit of ASV financial statements and $40 for Valuation services.
The results of the acquired ASV operations have been included in our consolidated statement of operations since the acquisition date. ASV is being treated as its own segment for segment reporting purposes.
The following unaudited pro forma information assumes the acquisition of ASV occurred on January 1, 2013. The unaudited pro forma results have been prepared for informational purposes only and do not purport to represent the results of operations that would have been had the acquisition occurred as of the date indicated, nor
84
Table of Contents
of future results of operations. The unaudited pro forma results for the year ended December 31, 2014 and 2013 are as follows (in thousands, except per share data):
| Year Ended December 31, 2014 |
Year Ended December 31, 2013 |
|||||||
| Net revenues |
$ | 393,583 | $ | 383,315 | ||||
| Net income attributable to shareholders of Manitex International, Inc |
$ | 6,397 | $ | 7,731 | ||||
| Income per share: |
||||||||
| Basic |
$ | 0.43 | $ | 0.56 | ||||
| Diluted |
$ | 0.43 | $ | 0.56 | ||||
| Weighted average common shares outstanding: |
||||||||
| Basic |
14,929,912 | 13,779,361 | ||||||
| Diluted |
14,976,012 | 13,825,731 | ||||||
Pro Forma Adjustment Note
For 2014, the following pro forma adjustments were made:
| • | Pro forma adjustments to account for the difference between historical depreciation and depreciation calculated using the fair market value of the fixed assets acquired and the current useful lives and to reverse the write-off of the fair market inventory write-up, increased expense $80 and decreased expense $21, respectively. |
| • | A pro forma adjustment was made to account for the difference between historical amortization and amortization calculated using the fair market value of intangible assets, excluding goodwill, and the current useful lives, which reduced expense by $5,254. |
| • | Pro forma adjustments were made to record interest expense and associated amortization of deferred banking fees (1 )on the term loan and the line of credit recorded at ASV, (2) on the $7,500 convertible and (3) on the $5,000 increase in the Company’s revolving lines of credit used to finance the acquisition. The effect was to increase expense by $5,723. |
| • | Pro forma adjustments were made to remove expenses directly associated with the acquisition including accounting, legal and consulting fees for which recorded in 2013 as result of pro forma adjustment. The effect was to increase income by $1,326. |
| • | Pro forma adjustments were made to reverse ASV historical tax benefit as the ASV was converted to an LLC, record the tax impact on Manitex’s pro forma adjustments, and to record a tax provision on Mantiex’s share of ASV earnings. The net effect was to increase income tax expense by $1,111. |
| • | A Pro forma adjustment was made to increase both basic and diluted shares outstanding by 1,071,723 to reflect the shares issued to Terex for the period between January 1 and December 19, 2014. |
For 2013, the following pro forma adjustments were made:
| • | Pro forma adjustments to account for the difference between historical depreciation and depreciation calculated using the fair market value of the fixed assets acquired and the current useful lives and to write off the fair market inventory write-up increased expense $372 and $260, respectively. |
| • | A pro forma adjustment was made to account for the difference between historical amortization and amortization calculated using the fair market value of intangible assets, excluding goodwill, and the current useful lives, which reduced expense by $5,478. |
| • | Pro forma adjustments were made to record interest expense and associated amortization of deferred banking fees (1) on the term loan and the line of credit recorded at ASV, (2) on the $7,500 convertible |
85
Table of Contents
| and (3) on the $5,000 increase in the Company’s revolving lines of credit used to finance the acquisition. The effect was to increase expense by $6,315. |
| • | Pro forma adjustments were made to record expenses directly associated with the acquisition including accounting, legal and consulting fees, which increased expense by $1,705. |
| • | Pro forma adjustments were made to reverse ASV historical tax benefit as the ASV was converted to an LLC, record the tax impact on Manitex’s pro forma adjustments, and to record a tax provision on Mantiex’s share of ASV earnings. The net effect was to decrease income tax expense by $309. |
| • | A Pro forma adjustment was made to increase both basic and diluted shares outstanding by 1,108,156 to reflect the shares issued to Terex. |
Valla Asset Purchase
On November 30, 2013, CVS Ferrari Srl. (the “Purchaser” or “CVS”), an Italian corporation and a wholly owned subsidiary of the Company completed an Asset Purchase Agreement with Valla SpA (the “Seller”), an Italian based developer of precision pick and carry cranes to acquire substantially all of the Seller’s operating assets and business operations, including the Seller’s accounts receivable, inventory and equipment. Valla develops precision pick and carry cranes with lifting capacities from 2 to 90 tons using electric, diesel and hybrid power options. Its cranes offer wheeled or tracked, fixed or swing boom configurations, with special applications designed specifically to meet the needs of its customers.
The consideration for the Purchase consisted of a note payable to Seller for $170 on (the “Note”) with principal payments of $85 on December 31, 2015 and 2016 and annual interest of 5% and contingent consideration of up to $1,000. The fair value of the purchase consideration was as follows:
| Fair Value Euros |
Fair Value U.S. Dollars |
|||||||
| Seller note |
€ | 143 | $ | 198 | ||||
| Contingent consideration |
183 | 250 | ||||||
|
|
|
|
|
|||||
| Total purchase consideration |
€ | 326 | $ | 448 | ||||
|
|
|
|
|
|||||
Seller Note. In connection with the acquisition, the Company issued a note with a stated interest rate of 5% in the amount of $170 payable to the sellers. The note is payable in two installments of $85 payable on December 31, 2015 and 2016.
The fair value of the promissory note is $198 and was calculated to be to equal the present value of future debt payments discounted at a market rate of return commensurate with similar debt instruments with comparable levels of risk and marketability. A rate of 1.5% was determined to be the appropriate rate following an assessment of the risk inherent in the debt issued and the market rate for debt of this nature using corporate credit ratings. The difference $28 between face amount of the promissory note and its fair value is being amortized over the life of the note and is a reduction of interest expense.
Contingent Consideration. In accordance with ASC 805, the acquirer is to recognize the acquisition date fair value of contingent consideration. The agreement has a contingent consideration provision which provides the seller to receive an annual payment equal to 10% of net income for the next eight years, with a maximum annual payment of $125. If 10% of a year’s net income exceeds $125, the excess amounts will be carried over to future years. Any carryovers not paid out after eight years will be forfeited. The agreement has no provision for a carryback for excess earnings in a year. Given the disparity between the income threshold and the Company’s projected financial results, it was determined that a Monte Carlo simulation analysis was appropriate to determine the fair value of contingent consideration. It was determined that the probability weighted average earn out payment is $250. Based thereon, we determined the fair value of the contingent consideration to be $250.
86
Table of Contents
Under the acquisition method of accounting, in accordance ASC 805, Business Combinations, the assets acquired and liabilities assumed are valued based on their estimated fair values as of the date of the acquisition. The excess of the purchase price over the aggregate estimated fair value of net assets acquired was allocated to goodwill. The purchase price allocation is preliminary and is subject to final review. The following table summarizes the acquisition consideration to the fair value of the assets acquired and liabilities assumed at the date of acquisition:
Purchase price allocation
| Fair Value Euros |
Fair Value U.S. Dollars |
|||||||
| Accounts receivable |
€ | 726 | $ | 994 | ||||
| Inventory |
872 | 1,193 | ||||||
| Prepaids |
29 | 41 | ||||||
| Property and equipment |
155 | 212 | ||||||
| Trade names and trademarks |
400 | 547 | ||||||
| Unpatented technology |
430 | 588 | ||||||
| Customer relationships |
200 | 273 | ||||||
| Goodwill |
1,762 | 2,409 | ||||||
| Accounts payable |
(1,944 | ) | (2,658 | ) | ||||
| Working capital borrowings |
(1,589 | ) | (2,173 | ) | ||||
| Accrued expenses |
(715 | ) | (978 | ) | ||||
|
|
|
|
|
|||||
| € | 326 | $ | 448 | |||||
|
|
|
|
|
|||||
Tangible assets and liabilities: The tangible assets and liabilities were valued at their respective carrying values by Valla, except for certain adjustments necessary to state such amounts at their estimated fair values at acquisition date. Fair market adjustments to fixed assets and inventory that were recorded were not significant.
Intangible assets: There are three fundamental methods applied to value intangible assets outlined in FASB ASC 820. These methods include the Cost Approach, the Market Approach, and the Income Approach. Each of these valuation approaches was considered in our estimation of value.
Trade names and trademarks and unpatented technology: Valued using the Relief from Royalty method, a form of both the Market Approach and the Income Approach. Because the Company has established trade names and trademarks and has developed unpatented technology, we estimated the benefit of ownership as the relief from the royalty expense that would need to be incurred in absence of ownership.
Customer relationships: Because there is a specific earnings stream that can be associated with customer relationships, we determined the discounted cash flow method was the most appropriate methodology for valuation.
Goodwill: Goodwill represents the excess of total consideration paid and the fair value of net assets acquired. The recognition of goodwill of $2,409 reflects the inherent value in the Valla reputation, which has been built since being founded in 1945 and the prospects for significant future earnings based on Valla’s product line.
For income tax purposes, intangible assets and goodwill will be amortized and will result in future tax deductions.
Acquisition transaction costs: Cost and expenses related to the acquisition have been expensed as incurred and recorded in selling, general and administrative expenses. In connection with the Valla acquisition, the Company incurred legal and accounting fees of $42 and fees for valuation services of $15.
87
Table of Contents
Sabre Asset Purchase
On August 19, 2013, Manitex Sabre, Inc. (the “Purchaser” or “Sabre”), a Michigan corporation and a wholly owned subsidiary of the Company, entered into a purchase agreement (the “Purchase Agreement”) with Sabre Manufacturing, LLC, (the “Seller”), a Knox, Indiana-based manufacturer of specialized tanks, to acquire substantially all of the Seller’s operating assets and business operations, including the Seller’s accounts receivable, inventory and equipment. Sabre tanks are used for above ground liquid and solid storage and containment solutions for a variety of end markets such as petrochemical, waste management and oil and gas drilling.
The fair value of the purchase consideration was $14,000 in total as shown below:
| Cash |
$ | 13,000 | ||
| 87,928 shares of Manitex International, Inc. common stock |
1,000 | |||
|
|
|
|||
| Total purchase consideration |
$ | 14,000 | ||
|
|
|
Manitex International Inc. stock. The fair value of the stock consideration was determined to be $1,000 at date of acquisition.
Under the acquisition method of accounting, in accordance ASC 805, Business Combinations, the assets acquired and liabilities assumed are valued based on their estimated fair values as of the date of the acquisition. The excess of the purchase price over the aggregate estimated fair value of net assets acquired was allocated to goodwill. The following table summarizes the allocation of the Sabre acquisition consideration to the fair value of the assets acquired and liabilities assumed at the date of acquisition:
Purchase price allocation:
| Accounts receivable |
$ | 1,148 | ||
| Receivable due from seller |
233 | |||
| Inventory |
1,482 | |||
| Total fixed assets |
1,431 | |||
| Non-competition agreements |
50 | |||
| Customer relationships |
5,200 | |||
| Trade name and trademarks |
1,200 | |||
| Goodwill |
4,740 | |||
| Accounts payable |
(730 | ) | ||
| Accrued expenses |
(140 | ) | ||
| Customer deposits |
(467 | ) | ||
| Debt and Capital lease obligations |
(147 | ) | ||
|
|
|
|||
| Net assets acquired |
$ | 14,000 | ||
|
|
|
Tangible assets and liabilities: The tangible assets and liabilities were valued at their respective carrying values by Sabre, except for certain adjustments necessary to state such amounts at their estimated fair values at acquisition date. Fair market adjustments to fixed assets and inventory that were recorded were not significant.
Intangible assets: There are three fundamental methods applied to value intangible assets outlined in FASB ASC 820. These methods include the Cost Approach, the Market Approach, and the Income Approach. Each of these valuation approaches was considered in our estimation of value.
Trade names and trademarks and unpatented technology: Valued using the Relief from Royalty method, a form of both the Market Approach and the Income Approach. Because the Company has established trade names and
88
Table of Contents
trademarks and has developed unpatented technology, we estimated the benefit of ownership as the relief from the royalty expense that would need to be incurred in absence of ownership.
Customer relationships: Because there is a specific earnings stream that can be associated with customer relationships, we determined the discounted cash flow method was the most appropriate methodology for valuation.
Goodwill: Goodwill represents the excess of total consideration paid and the fair value of net assets acquired. The recognition of goodwill of $4,725 reflects the inherent value in the Sabre reputation, which has been built since being founded in 2005 and the prospects for significant future earnings based on Sabre’s past performance.
For income tax purposes, intangible assets and goodwill will be amortized and will result in future tax deductions.
Acquisition transaction costs: Cost and expenses related to the acquisition have been expensed as incurred and recorded in selling, general and administrative expenses. The Company incurred fees of $93 for legal services, $68 for accounting service in connection with the prior year audit of Sabre financial statements and $37 for Valuation services.
The results of the acquired Sabre and Valla operations have been included in our consolidated statement of operations since their respective acquisition date. The results of Sabre and Valla also form part of the segment disclosures for the Lifting Equipment segment.
Note 20. Equity
Issuance of Common Stock and Warrants
Stock Warrants
The Company accounts for equity instruments issued to non-employees based on the fair value of the equity instruments issued. The Warrants were exercisable on a cashless basis under certain circumstances, and are callable by the Company on a cashless basis under certain circumstances.
Roth Capital Partners, LLC acted as exclusive placement agent for the 2007 Private Placement and received cash and warrants to purchase 105,000 shares of the Company’s common stock as a placement agent fee. The Warrants were issued the day after the closing of the 2007 Private Placement (September 11, 2007) and were exercisable after the sixth month anniversary of the issuance date of the Warrants until September 11, 2012. The warrant holder can purchase 105,000 shares of the Company’s common stock. The Warrants have an exercise price of $7.18 per share. On May 18, 2012, the holder of the outstanding warrants elected to exercise its rights to purchase 105,000 warrant shares under the cashless exercise provisions of the warrant. Under the cashless exercise provisions, the holder surrendered its rights to receive the number of shares with a value equal to the exercise price of $754 based on the average of $9.782 or the closing price for the five days, preceding the date of exercise or 77,071 shares. Upon exercise, the warrant holder was issued 27,929 shares of Company, which represents the difference between the 105,000 warrants exercised and the 77,071 shares withheld in lieu of a cash payment for the exercise price.
The following table contains information regarding warrants for the year ended December 31, 2012:
| 2012 | ||||||||
| Warrants | Price per Share | |||||||
| Outstanding on January 1 |
105,000 | $ | 7.18 | |||||
| Exercised |
(105,000 | ) | $ | 7.18 | ||||
|
|
|
|||||||
| Outstanding on December 31 |
$ | — | ||||||
|
|
|
|||||||
89
Table of Contents
During 2014 and 2013, the Company had no issued or outstanding warrants.
Stock Issuance
Sabre acquisition shares
On August 19, 2013, the Company issued 87,928 shares of common stock. The shares which were part of the consideration paid to the seller in connection with the purchase of the Sabre assets. See Note 19.
Shares issued to Terex Corporation
On December 19, 2014, pursuant to the terms of the Securities Purchase Agreement, the Company issued 1,108,156 shares of Company’s common stock and received $12,500 of cash.
Stock issued to employees and Directors
The Company issued shares of common stock to employees and Directors at various times in 2014, 2013 and 2012 as restricted stock units issued under the Company’s 2004 Incentive Plan vested. Upon issuance entries were recorded to increase common stock and decrease paid in capital for the amounts shown below. The following is a summary of stock issuances that occurred during the three year period:
| Date of Issue |
Employees or Director |
Shares Issued | Value of Shares Issued |
|||||||
| March 6, 2014 |
Directors | 6,600 | $ | 106 | ||||||
| March 6, 2014 |
Employees | 14,292 | 229 | |||||||
| June 5, 2014 |
Employees | 749 | 8 | |||||||
| December 31, 2014 |
Employees | 38,005 | 406 | |||||||
| December 31, 2014 |
Directors | 20,615 | 257 | |||||||
|
|
|
|
|
|||||||
| 80,261 | $ | 1,006 | ||||||||
|
|
|
|
|
|||||||
| Date of Issue |
Employees or Director |
Shares Issued | Value of Shares Issued |
|||||||
| March 8, 2013 |
Directors | 6,600 | $ | 69 | ||||||
| March 8, 2013 |
Employees | 20,836 | $ | 219 | ||||||
| September 12, 2013 |
Directors | 1,667 | 19 | |||||||
| December 31, 2013 |
Directors | 17,400 | 151 | |||||||
| December 31, 2013 |
Employees | 23,403 | 167 | |||||||
|
|
|
|
|
|||||||
| 69,906 | $ | 625 | ||||||||
|
|
|
|
|
|||||||
| Date of Issue |
Employees or Director |
Shares Issued | Value of Shares Issued |
|||||||
| March 21, 2012 |
Employees | 12,051 | $ | 94 | ||||||
| March 21, 2012 |
Directors | 6,600 | 52 | |||||||
| December 31, 2012 |
Directors | 11,700 | 80 | |||||||
|
|
|
|
|
|||||||
| 30,351 | $ | 226 | ||||||||
|
|
|
|
|
|||||||
Additionally, on October 3, 2012, the Company issued 29,112 shares to an executive officer. The executive officer was assigned the rights to receive the shares which had a value of $200 pursuant to a purchase agreement between SL and the Company.
90
Table of Contents
Warrant exercises
On May 18, 2012, the Company issued shares of common stock in connection with a cashless exercise of warrant as detailed below:
| Issued Date |
Shares Issued |
Shares Repurchased | Share Net of Repurchases |
Repurchase Price |
||||||||||||
| May 18, 2012 |
105,000 | 77,071 | 27,929 | $ | 9.782 | |||||||||||
In connection with the above cashless exercise $232, the value of warrants at the date of grant, was transferred from warrants to common stock. The shares 77,071 repurchased and cancelled were acquired $754 or $9.782 per share. The shares being repurchased were originally issued $9.39 per share or $724. The $30 difference was recorded as a direct charge to retained earnings.
Stock offerings
September 30, 2013 offering
On September 30, 2013, the Company issued 1,375,000 shares of the Company’s common stock, no par value. The shares were issued to certain investors pursuant to subscription agreements between the Company and the investors that were entered into on September 25, 2013 (the “Agreements”). Under the Agreements, the investors paid $10.75 per share for a total purchase price of $14,781. The shares were issued pursuant to a prospectus supplement dated September 25, 2013 and prospectus dated August 9, 2011, which is part of a registration statement on Form S-3 (Registration No. 333-176189) that was declared effective by the Securities and Exchange Commission on August 23, 2011.
In connection with this offering, the Company entered into a placement agency agreement (“Placement Agreement”) dated September 25, 3013 with Avondale Partners, LLC, Roth Capital Partners, LLC, and The Benchmark Company, LLC (the “Agents”). In accordance with the terms of the Placement Agreement between the Company and the Agents, the Company paid the Agents a cash fee that represents 5.25% of the gross proceeds of the offering and reimbursed the Agents for reasonable out-of-pocket expenses.
In connection with the stock issuance, the Company incurred investment banking fees of $776 and legal fees and expenses of approximately $78. The Company’s net cash proceeds after fees and expenses of approximately $13,927 were used to repay debt.
July 17, 2012 offering
On July 17, 2012, the Company issued 500,000 shares of the Company’s common stock, no par value. The shares were issued to certain investors pursuant to subscription agreements between the Company and the investors that were entered into on July 12, 2012 (the “Agreements”). Under the Agreements, the investors paid $8.25 per share for a total purchase price of $4,125. The shares were issued pursuant to a prospectus supplement dated July 12, 2012 and a prospectus dated August 9, 2011, which is part of a registration statement on Form S-3 (Registration No. 333-176189) that was declared effective by the Securities and Exchange Commission on August 23, 2011.
Avondale Partners, LLC acted as the Company’s exclusive placement agent in this offering. In accordance with the terms of a Placement Agency Agreement dated July 12, 2012 between the Company and the placement agent, the Company paid the placement agent a cash fee that represents 5.25% of the gross proceeds of the offering and reimbursed the placement agent for reasonable out-of-pocket expenses. The Company received net cash proceeds of approximately $3,781 after payment of investment bank fees of $217 and legal and other expenses of $127. The net proceeds from the stock offering was used to repay debt.
91
Table of Contents
Stock Repurchase
The Company purchased shares of Common Stock at various times from certain employees at the closing price on date of purchase. The stock was purchased from the employees to satisfy employees’ withholding tax obligations related to stock issuances described above. The following is a summary of common stock purchased during 2014 and 2013 (no stock purchases occurred in 2012):
| Date of Purchase |
Shares Purchased | Closing Price on Date of Purchase |
||||||
| June 5, 2014 |
392 | $ | 16.75 | |||||
| December 31, 2014 |
8,461 | $ | 12.71 | |||||
|
|
|
|||||||
| 8,853 | ||||||||
|
|
|
|||||||
| December 31, 2013 |
4,414 | $ | 15.88 | |||||
|
|
|
|||||||
On May 18, 2012, the holder of the outstanding warrants elected to exercise its rights to purchase 105,000 warrant shares under the cashless exercise provisions of the warrant. In connection with cashless exercise, the Company repurchased 77,071 shares that had of value equal the exercise price of warrants being exercised or $754.
2004 Equity Incentive Plan
In 2004, the Company adopted the 2004 Equity Incentive Plan and subsequently amended and restated the plan on September 13, 2007, May 28, 2009 and June 5, 2013. The maximum number of shares of common stock reserved for issuance under the plan is 917,046 shares. The total number of shares reserved for issuance however, can be adjusted to reflect certain corporate transactions or changes in the Company’s capital structure. The Company’s employees and members of the board of directors who are not our employees or employees of our affiliates are eligible to participate in the plan. The plan is administered by a committee of the board comprised of members who are outside directors. The plan provides that the committee has the authority to, among other things, select plan participants, determine the type and amount of awards, determine award terms, fix all other conditions of any awards, interpret the plan and any plan awards. Under the plan, the committee can grant stock options, stock appreciation rights, restricted stock, restricted stock units, performance shares and performance units, except Directors may not be granted stock appreciation rights, performance shares and performance units. During any calendar year, participants are limited in the number of grants they may receive under the plan. In any year, an individual may not receive options for more than 15,000 shares, stock appreciation rights with respect to more than 20,000 shares, more than 20,000 shares of restricted stock and/or an award for more than 10,000 performance shares or restricted stock units or performance units. The plan requires that the exercise price for stock options and stock appreciation rights be not less than fair market value of the Company’s common stock on date of grant.
The Company awarded under the Amended and Restated 2004 Equity Incentive Plan a total of 34,292; 114,821; and 135,001 restricted stock units to employees and directors during 2014, 2013 and 2012, respectively. The restricted stock units are subject to the same conditions as the restricted stock awards except the restricted stock units will not have voting rights and the common stock will not be issued until the vesting criteria are satisfied.
Compensation expense in 2014, 2013 and 2012 includes $875, $445 and $132 related to restricted stock units, respectively. Compensation expense related to restricted stock units will be $701, $360 and $0 for 2015, 2016 and 2017, respectively.
92
Table of Contents
The following is a summary of restricted stock units that were awarded during 2014, 2013 and 2012:
| 2014 Grants |
Vesting Date |
Number of Restricted Stock Units |
Closing Price on Date of Grant |
Value of Restricted Stock Units Issued |
||||||||||
| March 6, 2014 |
March 6, 2014 20,892 units; December 31, 2014 6,600 units; December 31, 2015 6,800 units | 34,292 | $ | 15.99 | $ | 548 | ||||||||
|
|
|
|
|
|||||||||||
| 34,292 | $ | 548 | ||||||||||||
|
|
|
|
|
|||||||||||
| 2013 Grants |
Vesting Date |
Number of Restricted Stock Units |
Closing Price on Date of Grant |
Value of Restricted Stock Units Issued |
||||||||||
| March 8, 2013 |
March 8, 2013 27,436 units; December 31, 2013 6,600 units; December 31, 2014 6,800 units | 40,836 | $ | 10.51 | $ | 429 | ||||||||
| June 5, 2013 |
June 5, 2014 1,141 units; June 5, 2015 1,142 units; June 5, 2016 1,142 units | 3,425 | $ | 10.45 | $ | 36 | ||||||||
| September 12, 2013 |
September 21, 2013—1,667 units | 1,667 | $ | 11.19 | $ | 19 | ||||||||
| December 31, 2013 |
22,735 units December 31, 2014; 22,735 units December 31, 2015 and 23,423 units December 31, 2016 | 68,893 | $ | 15.88 | $ | 1,094 | ||||||||
|
|
|
|
|
|||||||||||
| 114,821 | $ | 1,578 | ||||||||||||
|
|
|
|
|
|||||||||||
| 2012 Grants |
Vesting Date |
Number of Restricted Stock Units |
Closing Price on Date of Grant |
Value of Restricted Stock Units Issued |
||||||||||
| March 21, 2012 |
March 21, 2012 18,651 units; December 31, 2012 6,600 units; December 31, 2013 6,800 units | 32,051 | $ | 7.83 | $ | 251 | ||||||||
| December 31, 2012 |
34,317 units December 31, 2013; 34,317 units December 31, 2014 and 34,316 units December 31, 2015 | 102,950 | $ | 7.14 | 735 | |||||||||
|
|
|
|
|
|||||||||||
| 135,001 | $ | 986 | ||||||||||||
|
|
|
|
|
|||||||||||
The following table contains information regarding restricted stock units for the years ended December 31, 2014, December 31, 2013 and December 31, 2012, respectively:
| Restricted Stock Units | ||||||||||||
| 2014 | 2013 | 2012 | ||||||||||
| Outstanding on January 1, |
142,851 | 109,750 | 5,100 | |||||||||
| Issued |
34,292 | 114,821 | 135,001 | |||||||||
| Vested and issued |
(80,261 | ) | (69,906 | ) | (30,351 | ) | ||||||
| Vested—issued and repurchased for income tax withholding |
(8,853 | ) | (4,414 | ) | — | |||||||
| Forfeited |
(2,645 | ) | (7,400 | ) | — | |||||||
|
|
|
|
|
|
|
|||||||
| Outstanding on December 31 |
85,384 | 142,851 | 109,750 | |||||||||
|
|
|
|
|
|
|
|||||||
93
Table of Contents
Note 21. Recent Accounting Guidance
Recently Adopted Accounting Guidance
In May 2014, the FASB issued ASU 2014-09, “Revenue from Contracts with Customers,” (“ASU 2014-09”). ASU 2014-09 outlines a new, single comprehensive model for entities to use in accounting for revenue arising from contracts with customers and supersedes most current revenue recognition guidance, including industry-specific guidance. This new revenue recognition model provides a five-step analysis in determining when and how revenue is recognized. The new model will require revenue recognition to depict the transfer of promised goods or services to customers in an amount that reflects the consideration a company expects to receive in exchange for those goods or services. ASU 2014-09 is effective for reporting periods beginning after December 15, 2016, and early adoption is not permitted. The Company is evaluating the impact that adoption of this guidance will have on the determination or reporting of its financial results.
In June 2014, the FASB issued ASU 2014-12, “Accounting for Share-Based Payments When the Terms of an Award Provide that a Performance Target Could be Achieved after the Requisite Service Period,” (“ASU 2014-12”). ASU 2014-12 requires that a performance target that affects vesting, and that could be achieved after the requisite service period, be treated as a performance condition. As such, the performance target should not be reflected in estimating the grant date fair value of the award. ASU 2014-12 is effective for reporting periods beginning after December 15, 2015. Early adoption is permitted. Adoption of this guidance is not expected to have a significant impact on the determination or reporting of the Company’s financial results.
In August 2014, the FASB issued ASU 2014-15, “Disclosure of Uncertainties about an Entity’s Ability to Continue as a Going Concern,” (“ASU 2014-15”). ASU 2014-15 requires management to perform interim and annual assessments of an entity’s ability to continue as a going concern for a one year period subsequent to the date of the financial statements. An entity must provide certain disclosures if conditions or events raise substantial doubt about the entity’s ability to continue as a going concern. The guidance is effective for all entities for the first annual period ending after December 15, 2016 and interim periods thereafter, with early adoption permitted. Adoption of this guidance is not expected to have any impact on the determination or reporting of the Company’s financial results.
Except as noted above, the guidance issued by the FASB during the current year is not expected to have a material effect on the Company’s consolidated financial statements.
Note 22. Transactions between the Company and Related Parties
In the course of conducting its business, the Company has entered into certain related party transactions.
On December 16, 2014, Manitex International, Inc. (the “Company”), BGI USA Inc. (“BGI”), Movedesign SRL and R & S Advisory S.r.l., entered into an operating agreement (the “Operating Agreement”) for Lift Ventures LLC (“Lift Ventures”), a joint venture entity. The purposes for which Lift Ventures is organized are the manufacturing and selling of certain products and components, including the Schaeff line of electric forklifts and certain LiftKing products. Pursuant to the Operating Agreement, the Company was granted a 25% equity stake in the Lift Ventures in exchange for the contribution of certain inventory and a license of certain intellectual property related to the Company’s products. As of December 31, 2014 no transactions occurred since date of acquisition.
The Company, through its Manitex and Manitex Liftking subsidiaries, purchases and sells parts to BGI USA, Inc. (“BGI”) including its subsidiary SL Industries, Ltd (“SL”). BGI is a distributor of assembly parts used to manufacture various lifting equipment. SL Industries, Ltd is a Bulgarian subsidiary of BGI that manufactures fabricated and welded components used to manufacture various lifting equipment. The President of Manufacturing Operations is the majority owner of BGI.
94
Table of Contents
The Company through its Manitex Liftking subsidiary provides parts and services to LiftMaster, Ltd (“LiftMaster”) or purchases parts or services from LiftMaster. LiftMaster is a rental company that rents and services rough terrain forklifts. LiftMaster is owned by the Vice President of a wholly owned subsidiary of the Company, Manitex Liftking, ULC, and a relative.
As of December 31, 2014 the Company had an accounts receivable of $2 and $16 from LiftMaster and SL, respectively and accounts payable of $1, $519 and $1 to BGI, SL and Liftmaster respectively. As of December 31, 2013 the Company had an accounts receivable of $6 and $7 from LiftMaster and SL, respectively and accounts payable of $6, $796 and $0 to BGI, SL and Liftmaster respectively.
The following is a summary of the amounts attributable to certain related party transactions as described in the footnotes to the table, for the periods indicated:
| 2014 | 2013 | 2012 | ||||||||||
| Bridgeview Facility (1) |
$ | 256 | $ | 251 | $ | 247 | ||||||
| Sales to: |
||||||||||||
| SL Industries, Ltd |
6 | 43 | 65 | |||||||||
| LiftMaster (2) |
185 | 10 | 6 | |||||||||
|
|
|
|
|
|
|
|||||||
| Total Sales |
191 | 53 | 71 | |||||||||
| Inventory Purchases from: |
||||||||||||
| SL Industries, Ltd (3) |
5,364 | 5,337 | 4,592 | |||||||||
| LiftMaster (2) |
1 | 21 | 24 | |||||||||
| BGI |
43 | 165 | 147 | |||||||||
|
|
|
|
|
|
|
|||||||
| Total Inventory Purchases |
$ | 5,408 | $ | 5,523 | $ | 4,763 | ||||||
| Intangible Asset Purchase (3) |
||||||||||||
| SL Industries Ltd |
$ | — | $ | — | $ | 339 | ||||||
|
|
|
|
|
|
|
|||||||
| Total Intangible asset Purchase |
$ | — | $ | — | $ | 339 | ||||||
| 1. | The Company leases its 40,000 sq. ft. Bridgeview facility from an entity controlled by Mr. David Langevin, the Company’s Chairman and CEO. Pursuant to the terms of the lease, the Company makes monthly lease payments of $21. The Company is also responsible for all the associated operations expenses, including insurance, property taxes, and repairs. The lease will expire on June 30, 2020 and has a provision for six one year extension periods. The lease contains a rental escalation clause under which annual rent is increased during the initial lease term by the lesser of the increase in the Consumer Price Increase or 2.0%. Rent for any extension period shall however, be the then-market rate for similar industrial buildings within the market area. The Company has the option, to purchase the building by giving the Landlord written notice at any time prior to the date that is 180 days prior to the expiration of the lease or any extension period. The Landlord can require the Company to purchase the building if a change of Control Event, as defined in the agreement occurs by giving written notice to the Company at any time prior to the date that is 180 days prior to the expiration of the lease or any extension period. The purchase price regardless whether the purchase is initiated by the Company or the landlord will be the Fair Market Value as of the closing date of said sale. |
| (2) | The Company provides parts and services to LiftMaster, Inc. LiftMaster is a rental company that rents and services rough terrain forklifts. LiftMaster is owned by a relative of an Officer of Manitex Liftking, ULC. |
| (3) | The Company acquired the intangible assets associated with a nine ton carry deck crane (the “Crane”) developed by SL Industries Ltd. The intangible assets (the Intangible Assets”) includes all related technology, patents, drawings, designs, know-how and all technical information related to the Crane and its improvements, including all variations, sizes and models, both now in existence or which are hereafter developed. In exchange for the rights, designs and the two cranes, Manitex is contractually obligated to pay to SL the sum of $345 in cash (“the Cash Consideration”) and to issue them 29,112 shares of the Manitex’s common stock, (the “the Stock Consideration”). SL assigned to Mr. Litchev, the sole owner of SL and the Company’s President of Manufacturing, all of its rights to the Stock Consideration under the Agreement, |
95
Table of Contents
| and $139 of the Cash Consideration and Mr. Litchev agreed to this assignment, and accepted the Stock Consideration and $139 of the Cash Consideration. |
Transactions with Terex
On December 19, 2014, Terex became a related party when the Company and Terex entered into an agreement.
At December 31, 2014, ASV has receivable due from Terex for $8,609 which is shown on the balance on the line titled “accounts receivable from related party”. As part of the agreement Terex retained certain receivables from third party customers. In place of the retained receivable, Terex gave ASV a receivable for a portion of the third party customer receivable retained by Terex. Terex is obligated to pay 50% of this receivable thirty days after closing of the transaction and the remaining balance 60 days after of closing the transaction.
At December 31, 2014, the Company has the following notes payable to Terex:
| Note related to Crane and Schaeff acquisition |
$ | 500 | ||
| Note payable related to ASV acquisition |
$ | 1,594 | ||
| Convertible note |
$ | 6,611 |
See Note 11 and Note 13 for additional details regarding the above debt obligations.
Effective December 19, 2014, the Company has entered into a Distribution and Cross Marketing Agreement with Terex Corporation (“Terex”) that sets forth the terms under which ASV will manufacture and sell ASV Products and certain services Terex will provide in assisting in the sales and marketing of ASV products and the costs to be paid by ASV in exchange for such services. The agreement defines dealers and territories and customers that Terex shall have the exclusive right on behalf of ASV to market and sell Terex branded ASV products. The agreement defines the compensation to Terex for its machine sales selling expense and part sales selling expense and general and administrative costs associated with such sales. In addition, for the provision of marketing services, ASV shall pay an annual fee of $250, subject to annual escalation of 3% plus 0.2% of net incremental sales. Unless terminated, the term of the agreement is five years, and the parties may agree to renew for additional one year terms. ASV expensed $90 for marketing services for the period from December 20, 2014 through December 31, 2014.
Effective December 19, 2014 the Company has entered into a Services Agreement with Terex Corporation (“Terex”) that sets forth the terms under which ASV will provide certain services to Terex and its affiliates and Terex will retain access to certain services provided by the Company and the compensation related thereto. The scope of the agreement covers amongst other items, temporary transition services arising from the transfer of majority ownership to Manitex International, third party logistics services for parts fulfilment, warranty and field service and Information Technology services for both transitional and ongoing services. Unless terminated, the term of the agreement is specific to each service provided, and the parties may agree to renew for additional one year terms. ASV expensed $216 for services provided for the period from December 20, 2014 through December 31, 2014.
Note 23. Legal Proceedings and Other Contingencies
The Company is involved in various legal proceedings, including product liability, employment related issues, and workers’ compensation matters which have arisen in the normal course of operations. The Company has product liability insurance with self insurance retention that range from $50 to $500. ASV product liability cases that existed on date of acquisition have a $4,000 self-retention limit.
Certain cases are at a preliminary stage, and it is not possible to estimate the amount or timing of any cost to the Company. However, the Company does not believe that these contingencies, in the aggregate, will have a
96
Table of Contents
material adverse effect on the Company. A provisional reserve has been established for the above mentioned liability case. The Company is, however, waiting to receive additional information required to access the value of the liability as of date ASV was acquired. Based on a review of the additional information, the provisional reserve may be adjusted with an offsetting adjustment to goodwill. The adjustment will be made as of the date of the acquisition. At this time, the Company cannot assess what the magnitude of future possible adjustment will be and, therefore, cannot conclude that it will not be material.
Additionally, the Company has been named as a defendant in several multi-defendant asbestos related product liability lawsuits. In certain instances, the Company is indemnified by a former owner of the product line in question. In the remaining cases the plaintiff has, to date, not been able to establish any exposure by the plaintiff to the Company’s products. The Company is uninsured with respect to these claims but believes that it will not incur any material liability with respect to these to claims.
When it is probable that a loss has been incurred and possible to make a reasonable estimate of the Company’s liability with respect to such matters, a provision is recorded for the amount of such estimate or the minimum amount of a range of estimates when it is not possible to estimate the amount within the range that is most likely to occur.
Additionally beginning on December 31, 2011, the Company’s workmen’s compensation insurance policy has per claim deductible of $250 and aggregates of $1,000, $1,150 and $1,325 for 2012, 2013 and 2014 policy years, respectively. The Company is fully insured for any amount on any individual claim that exceeds the deductible and for any additional amounts of all claims once the aggregate is reached. The Company currently has several workmen compensation claims related to injuries that occurred after December 31, 2011 and therefore are subject to a deductible. The Company does not believe that the contingencies associated with these worker compensation claims in aggregate will have a material adverse effect on the Company. Prior to December 31, 2011, worker compensation claims were fully insured.
On May 5, 2011, Company entered into two separate settlement agreements with two plaintiffs. As of December 31, 2014, the Company has a remaining obligation under the agreements to pay the plaintiffs $1,615 without interest in 17 annual installments of $95 on or before May 22 each year. The Company has recorded a liability for the net present value of the liability. The difference between the net present value and the total payment will be charged to interest expense over payment period.
It is reasonably possible that the “Estimated Reserve for Product Liability Claims” may change within the next 12 months. A change in estimate could occur if a case is settled for more or less than anticipated, or if additional information becomes known to the Company.
Note 24. Quarterly Financial Data (Unaudited)
Unaudited Quarterly Financial Data
Summarized quarterly financial data for 2014 and 2013 are as follows (in thousands, except per share amounts).
| 2014 | 2013 | |||||||||||||||||||||||||||||||
| 1st Qtr | 2nd Qtr | 3rd Qtr | 4th Qtr | 1st Qtr | 2nd Qtr | 3rd Qtr | 4th Qtr | |||||||||||||||||||||||||
| Net revenues |
$ | 62,576 | $ | 68,399 | $ | 66,197 | $ | 66,909 | $ | 59,566 | $ | 62,554 | $ | 57,521 | $ | 65,431 | ||||||||||||||||
| Gross Profit |
11,604 | 13,144 | 10,915 | 12,601 | 10,236 | 12,260 | 11,201 | 12,779 | ||||||||||||||||||||||||
| Net income |
$ | 1,877 | $ | 2,986 | $ | 1,768 | $ | 472 | $ | 1,911 | $ | 2,655 | $ | 2,621 | $ | 2,991 | ||||||||||||||||
| Earnings per Share |
||||||||||||||||||||||||||||||||
| Basic |
$ | 0.14 | $ | 0.22 | $ | 0.13 | $ | 0.03 | $ | 0.16 | $ | 0.22 | $ | 0.21 | $ | 0.22 | ||||||||||||||||
| Diluted |
$ | 0.14 | $ | 0.22 | $ | 0.13 | $ | 0.03 | $ | 0.16 | $ | 0.22 | $ | 0.21 | $ | 0.22 | ||||||||||||||||
| Shares outstanding |
||||||||||||||||||||||||||||||||
| Basic |
13,807,312 | 13,822,383 | 13,822,918 | 13,980,142 | 12,275,759 | 12,295,879 | 12,352,266 | 13,760,918 | ||||||||||||||||||||||||
| Diluted |
13,840,506 | 13,874,289 | 13,873,157 | 14,029,205 | 12,307,792 | 12,337,493 | 12,403,665 | 13,821,352 | ||||||||||||||||||||||||
97
Table of Contents
Results for Sabre, Valla, Lift Ventures and ASV are included in the Company’s results from their respective effective dates of acquisition which are August 19, 2013, November 30, 2013, December 16, 2014 and December 20, 2014 respectively.
Note 25. Subsequent Events
Modifications to US and Canadian credit facilities
On January 6, 2015, the Company and Comerica Bank (“Comerica”) and Fifth Third Bank (collectively the “Banks”) entered into Amendment No. 6 to the Credit Agreement (the “Amendment”). The principal modification to the Credit Agreement resulting from the Amendment is the express authorization from the Banks for the Company to enter into the Perella Note Purchase Agreement, which is described below.
On January 9, 2015, the Company together with its U.S. and Canadian subsidiaries amended and restated its existing credit agreement (“Amended Credit Agreement”) with Comerica Bank (“Comerica”) and certain other lenders, who are participants under the credit agreement. The Amended Credit Agreement provides the Company with up to $71,000 of financing (“Financing”) comprised of (a) a $45,000 Senior Secured Revolving Credit Facility to the U.S. Borrowers (“U.S. Revolver”), (b) a new $14,000 Secured Term Loan to the U.S. Borrowers (“Term Loan”) and (c) a $12,000 (or the Canadian dollar equivalent amount) Senior Secured Revolving Credit Facility to the Canadian Borrower (“Canadian Revolver”). The three aforementioned credit facilities each mature on August 19, 2018.
Prior to the credit restatement, the Company had US and Canadian revolving credit facilities of $40,000 and $9,000, respectively.
The Company is also required to comply with certain financial covenants as defined in the Credit Agreement including maintaining (1) a Consolidated Fixed Charge Coverage Ratio of not less than 1.20 to 1.00, (2) a Maximum Senior Secured First Lien North American Debt to Consolidated North American EBITDA Ratio of not more than 3.75 to 1.00, with a step down to 3.50 to 1.00 at December 31, 2015, and a further step down to 2.75 to 1.00 at June 30, 2016, and (3) a Maximum Consolidated North American Debt to Consolidated North American EBITDA Ratio of not more than 5.75 to 1.00, with a step down to 4.50 to 1.00 at December 31, 2015, and a further step down to 3.75 to 1.00 at June 30, 2016.
New convertible note
On January 7, 2015, the Company entered into a Note Purchase Agreement (the “Perella Note Purchase Agreement”) with MI Convert Holdings LLC (which is owned by investment funds constituting part of the Perella Weinberg Partners Asset Based Value Strategy) and Invemed Associates LLC (together, the “Investors”), pursuant to which the Company agreed to issue $15,000 in aggregate principal amount of convertible notes due 2021 (the “Perella Notes”) to the Investors. The Notes are subordinated, carry a 6.50% per annum coupon, and are convertible, at the holder’s option, into shares of Company common stock, based on an initial conversion price of $15.00 per share, subject to customary adjustments. Upon the occurrence of certain fundamental corporate changes, the Perella Notes are redeemable at the option of the holders of the Perella Notes. The Perella Notes are not redeemable at the Company’s option prior to the maturity date, and the payment of principal is subject to acceleration upon an event of default. The issuance of the Perella Notes by the Company was made in reliance upon the exemptions from registration provided by Rule 506 and Section 4(2) of the Securities Act of 1933.
In connection with the issuance of the Perella Notes, on January 7, 2015, the Company entered into a Registration Rights Agreement with the Investors (the “Registration Rights Agreement”). Pursuant to the Registration Rights Agreement, the Company has agreed to register the resale of the shares of common stock issuable upon conversion of the Perella Notes. The Company filed Registration Statement On Form S-3 to register the shares with the Securities and Exchange Commission declared the Registration Statement, which was declared effective on February 23, 2015.
98
Table of Contents
PM Acquisition
As previously disclosed, on July 21, 2014 Manitex International, Inc. (the “Company”) entered into a series of agreements to acquire PM Group S.p.A, (“PM Group”), a manufacturer of truck mounted cranes based in San Cesario sul Panaro, Modena, Italy. On January 15, 2015, the Company’s acquisition of PM Group closed. The aggregate consideration paid by the Company for PM Group was $91 million, which reflects exchange rates in effect at the closing. The consideration consisted of $21 million of cash, the assumption of $60 million of debt, which is non-recourse to the Company and 994,483 shares of Company common stock.
99
Table of Contents
| ITEM 9. | CHANGES IN AND DISAGREEMENTS WITH ACCOUNTANTS ON ACCOUNTING AND FINANCIAL DISCLOSURE |
None.
| ITEM 9A | CONTROLS AND PROCEDURES |
Disclosure Controls and Procedures
Disclosure controls and procedures are controls and other procedures that are designed to ensure that information required to be disclosed by the Company in the reports it files or submits under the Securities Exchange Act of 1934, as amended (the “Exchange Act”) is recorded, processed, summarized, and reported, within the time periods specified by the Securities and Exchange Commission (“SEC”) rules and forms. Disclosure controls and procedures include, without limitation, controls and procedures designed to ensure that information required to be disclosed by the Company in the reports it files or submits under the Exchange Act is accumulated and communicated to management, including the Chief Executive Officer (principal executive officer) and the Chief Financial Officer (principal financial officer), as appropriate to allow timely decisions regarding required disclosure.
Under the supervision of, and with the participation of our management, including our Chief Executive Officer (principal executive officer) and Chief Financial Officer (principal financial officer), we conducted an evaluation of the effectiveness of our disclosure controls and procedures, as defined in Rules 13a-15(e) and 15d-15(e) under the Exchange Act, as of the end of the period covered by this report. We have excluded A.S.V., LLC. from our assessment of internal control over financial reporting. A.S.V., LLC is 51% owned subsidiary of Manitex International, Inc. whose total revenues and total assets represent approximately 1% and 40%, respectively, of the related consolidated financial statement amounts as of and for the year ended December 31, 2014. Based on our evaluation, the Chief Executive Officer (principal executive officer) and Chief Financial Officer (principal financial officer) have concluded that these controls and procedures were effective as of the end of the period covered by this report to ensure that information required to be disclosed by us in reports that we file or submit under the Exchange Act is recorded, processed, summarized, and reported within the time periods specified in the rules and forms of the SEC.
Management’s Report on Internal Control over Financial Reporting
Management’s Responsibility
Management is responsible for establishing and maintaining adequate internal control over financial reporting, as such term is defined in Rules 13a-15(f) and 15d-15(f) under the Exchange Act. A company’s internal control over financial reporting is a process designed to provide reasonable assurance regarding the reliability of financial reporting and the preparation of financial statements for external purposes in accordance with generally accepted accounting principles in the United States.
Because of its inherent limitations, internal control over financial reporting may not prevent or detect misstatements. Also, projections of any evaluation of effectiveness to future periods are subject to the risk that controls may become inadequate because of changes in conditions, or that the degree of compliance with the policies or procedures may deteriorate.
Management’s Assessment
Management, under the supervision and with the participation of our Chief Executive Officer (principal executive officer) and Chief Financial Officer (principal financial officer), assessed the effectiveness of the Company’s internal control over financial reporting as of December 31, 2014. In making this assessment, management used the criteria set forth by the Committee of Sponsoring Organizations of the Treadway
100
Table of Contents
Commission (COSO) in Internal Control—Integrated Framework (1992). In connection with such evaluation, our management concluded that the Company’s internal control over financial reporting was effective as of December 31, 2014.
The effectiveness of the company’s internal control over financial reporting as of December 31, 2014, has been audited by UHY LLP, an independent registered public accounting firm, as stated in their report which appears herein.
Changes in Internal Control over Financial Reporting
During the fourth quarter of 2014, there were no changes in our internal control over financial reporting that have materially affected, or are reasonably likely to materially affect, our internal control over financial reporting.
| ITEM 9B. | OTHER INFORMATION |
Bonus Awards
On March 13, 2015, the Compensation Committee of the Board of Directors of the Company recommended to the Board of Directors, that certain bonuses be awarded to key Executive Officers of the Company. The discretionary awards were based on the recognition by the Compensation Committee of the superior level of performance and leadership provided by the Executive Officers during 2014, including but not limited to, with respect to the successful completion of the Company’s acquisitions of (i) 51% of A.S.V., Inc. from Terex Corporation, in December 2014, and (ii) PM Group S.p.A., in January 2015. The recommended awards were to the Company’s Chairman and Chief Executive officer, David J. Langevin, in the amount of $401,700, to the Company’s President and Chief Operating Officer, Andrew M Rooke, in the amount of $316,004, to the Company’s President of Manufacturing Operations, Lubomir T Litchev in the amount of $299,936 and to the Company’s Vice President and Chief Financial Officer, David H. Gransee, in the amount of $114,619. The Compensation Committee recommended that fifteen percent of each bonus award be paid in restricted stock awarded under the Company’s 2004 Equity Incentive Plan and that the remainder of the bonus awards be paid in cash. The Board of Directors approved the bonuses recommended by the Compensation Committee.
Certain information required by Part III is omitted from this Form 10-K as the Company intends to file with the Commission its definitive Proxy Statement for its 2015 Annual Meeting of Shareholders (the “2015 Proxy Statement”) pursuant to Regulation 14A of the Securities Exchange Act of 1934, as amended, not later than 120 days after December 31, 2014.
| ITEM 10. | DIRECTORS, EXECUTIVE OFFICERS AND CORPORATE GOVERNANCE |
The information under the headings “Nominees to Serve Until the 2016 Annual Meeting,” “Executive Officers of the Company who are not also Directors,” “Section 16(a) Beneficial Ownership Reporting Compliance,” “Committee on Directors and Board Governance,” and “Audit Committee” in our 2015 Proxy Statement is incorporated herein by reference.
Code of Ethics
The Company has adopted a code of ethics applicable to our principal executive officer and principal financial and accounting officer, in accordance with Section 406 of the Sarbanes-Oxley Act of 2002, the rules of the SEC promulgated thereunder, and the NASDAQ rules. The code of ethics also applies to all employees of the
101
Table of Contents
Company as well as the Board of Directors. In the event that any changes are made or any waivers from the provisions of the code of ethics are made, these events would be disclosed on the Company’s website or in a report on Form 8-K within four business days of such event. The code of ethics is posted on our website at www.manitexinternational.com. Copies of the code of ethics will be provided free of charge upon written request directed to Investor Relations, Manitex International, Inc., 9725 Industrial Drive, Bridgeview, Illinois 60455.
| ITEM 11. | EXECUTIVE COMPENSATION |
The information under the headings “Compensation Committee Interlocks and Insider Participation,” “Compensation Committee Report” “COMPENSATION DISCUSSION AND ANALYSIS” “EXECUTIVE COMPENSATION,” and “DIRECTOR COMPENSATION” in our 2015 Proxy Statement is incorporated herein by reference.
| ITEM 12. | SECURITY OWNERSHIP OF CERTAIN BENEFICIAL OWNERS AND MANAGEMENT AND RELATED STOCKHOLDER MATTERS |
The information under the headings “Equity Compensation Plan Information” and “PRINCIPAL STOCKHOLDERS” in our 2015 Proxy Statement is incorporated herein by reference.
| ITEM 13. | CERTAIN RELATIONSHIPS AND RELATED TRANSACTIONS, AND DIRECTOR INDEPENDENCE |
The information under the headings “Transactions with Related Persons,” “Corporate Governance,” “Compensation Committee,” and “Audit Committee” in our 2015 Proxy Statement is incorporated herein by reference.
| ITEM 14. | PRINCIPAL ACCOUNTANT FEES AND SERVICES |
The information under the heading “AUDIT COMMITTEE” in our 2015 Proxy Statement is incorporated herein by reference.
| ITEM 15. | EXHIBITS AND FINANCIAL STATEMENT SCHEDULES |
(a) The following documents are filed as part of this Report:
| (1) | Financial Statements |
See Index to Financial Statements on page 43.
| (2) | Supplemental Schedules |
None.
All schedules have been omitted because the required information is not present in amounts sufficient to require submission of the schedules, or because the required information is included in the consolidated financial statements or notes thereto.
| (b) | Exhibits |
See the Exhibit Index following the signature page.
| (c) | Financial Statement Schedules |
All information for which provision is made in the applicable accounting regulations of the SEC is either included in the financial statements, is not required under the related instructions or is inapplicable, and therefore has been omitted.
102
Table of Contents
Pursuant to the requirements of Section 13 or 15(d) of the Securities Exchange Act of 1934, the registrant has duly caused this report to be signed on its behalf by the undersigned, thereunto duly authorized.
Dated: March 16, 2015
| MANITEX INTERNATIONAL, INC. | ||
| By: |
/s/ DAVID H. GRANSEE | |
| David H. Gransee | ||
| Vice President, Chief Financial Officer | ||
| (On behalf of the Registrant and as Principal Financial and Accounting Officer) | ||
POWER OF ATTORNEY
KNOW ALL PERSONS BY THESE PRESENTS, that each person whose signature appears below constitutes and appoints David J. Langevin and David H. Gransee his or her attorneys-in-fact, each with the power of substitution, for him in any and all capacities, to sign any amendments to this Annual Report on Form 10-K, and to file the same, with Exhibits thereto and other documents in connection therewith with the Securities and Exchange Commission, hereby ratifying and confirming all that each of said attorneys-in-fact, or substitute or substitutes may do or cause to be done by virtue hereof.
Pursuant to the requirements of the Securities Exchange Act of 1934, this report has been signed below by the following persons on behalf of the registrant and in the capacities and on the dates indicated.
| /s/ DAVID J. LANGEVIN David J. Langevin, Chairman and Chief Executive Officer (Principal Executive Officer) |
March 16, 2015 | |
| /s/ DAVID H. GRANSEE David H. Gransee, Vice President, Chief Financial Officer (Principal Financial and Accounting Officer) |
March 16, 2015 | |
| /s/ RONALD M. CLARK Ronald M. Clark, Director |
March 16, 2015 | |
| /s/ ROBERT S. GIGLIOTTI Robert S. Gigliotti, Director |
March 16, 2015 | |
| /s/ FREDERICK B. KNOX Frederick B. Knox, Director |
March 16, 2015 | |
| /s/ MARVIN B. ROSENBERG Marvin B. Rosenberg, Director |
March 16, 2015 | |
| /s/ STEPHEN J. TOBER Stephen J. Tober, Director |
March 16, 2015 | |
103
Table of Contents
Exhibit Index
| Exhibit No. |
Description | |||
| 2.1 | English Summary of Form of Agreement for Sale of Company Division dated June 27, 2011 between C.V.S. Costruzione Veicoli Speciali S.p.A. and CVS Ferrari srl (incorporated by reference to Exhibit 2.1 to the Current Report on Form 8-K/A filed on August 8, 2011). | |||
| 2.2 | Stock Purchase Agreement, dated October 29, 2014, between Manitex International, Inc. and Terex Corporation (incorporated by reference to Exhibit 2.2 to the Current Report on Form 8-K filed on November 3, 2014). | |||
| 2.3 | Amendment No. 1, dated December 19, 2014 to Stock Purchase Agreement, dated October 29, 2014, between Manitex International, Inc. and Terex Corporation (incorporated by reference to Exhibit 2.1 to the Current Report on Form 8-K filed on December 23, 2014). | |||
| 3.1 | Articles of Incorporation, as amended (incorporated by reference to Exhibit 3.1 to the Quarterly Report on Form 10-Q filed on November 13, 2008). | |||
| 3.2 | Amended and Restated Bylaws of Veri-Tek International, Corp. (now known as Manitex International, Inc.), as amended (incorporated by reference to Exhibit 3.2 to the Annual Report on Form 10-K filed on March 27, 2008). | |||
| 4.1 | Specimen Common Stock Certificate of Manitex International, Inc. (incorporated by reference to Exhibit 4.1 to the Annual Report on Form 10-K filed on March 25, 2009). | |||
| 4.2 | Rights Agreement, dated as of October 17, 2008, between Manitex International, Inc. and American Stock Transfer & Trust Company, LLC (incorporated by reference to Exhibit 4.1 to the Current Report on Form 8-K filed on October 21, 2008). | |||
| 4.3 | Subordinated Convertible Promissory Note, dated as of December 19, 2014, between Manitex International, Inc. and Terex Corporation (incorporated by reference to Exhibit 4.1 to the Current Report on Form 8-K filed on December 23, 2014). | |||
| 10.1 | * | Employment Agreement, dated December 12, 2012, between Manitex International, Inc. and David J. Langevin (incorporated by reference to Exhibit 10.1 to the Current Report on Form 8-k filed on December 17, 2012). | ||
| 10.2 | * | Employment Agreement, dated December 12, 2012, between Manitex International, Inc. and Andrew M. Rooke (incorporated by reference to Exhibit 10.2 to the Current Report on Form 8-k filed on December 17, 2012). | ||
| 10.3 | * | Employment Agreement, dated December 12, 2012, between Manitex International, Inc. and Lubomir T. Litchev (incorporated by reference to Exhibit 10.3 to the Current Report on Form 8-k filed on December 17, 2012). | ||
| 10.4 | * | Employment Agreement, dated December 12, 2012, between Manitex International, Inc. and David H. Gransee (incorporated by reference to Exhibit 10.4 to the Current Report on Form 8-k filed on December 17, 2012). | ||
| 10.5 | * | Second Amended and Restated Manitex International, Inc. 2004 Equity Incentive Plan (incorporated by reference to Exhibit 10.4 to the Annual Report on Form 10-K filed on March 30, 2010). | ||
| 10.6 | * | Form of Restricted Stock Unit Award (incorporated by reference to Exhibit 10.1 to the Current Report on Form 8-K filed on November 16, 2007). | ||
| 10.7 | Lease dated April 17, 2006 between Krislee-Texas, LLC and Manitex, Inc. for facility located in Georgetown, Texas (incorporated by reference to Exhibit 10.21 to the Annual Report on Form 10-K filed on April 13, 2007). | |||
104
Table of Contents
| Exhibit No. |
Description | |||
| 10.8 | Lease Agreement, dated July 10, 2009, by and between Badger Equipment Company and Avis Industrial Corporation (incorporated by reference to Exhibit 10.5 to the Current Report on Form 8-K filed on July 16, 2009). | |||
| 10.9 | Lease Agreement, dated May 26, 2010, between Manitex International, Inc. and KB Building, LLC (incorporated by reference to Exhibit 10.1 to the Current Report on Form 8-K filed on May 28, 2010). | |||
| 10.9(a) | Lease Amendment, dated June 6, 2014 between Manitex International, Inc. and KB Building, LLC (incorporated by reference to Exhibit 10.2 to the Current Report on Form 8-K filed on June 6, 2014) | |||
| 10.10 | Lease dated June 8, 2010, between Aldrovandi Equipment Limited and Manitex Liftking, ULC for facility located in Woodbridge, Ontario (incorporated by reference to Exhibit 10.1 to the Quarterly Report on Form 10-Q filed on August 13, 2010). | |||
| 10.11 | First Amendment to Commercial lease with Sabre Realty, LLC dated August 19, 2013 (incorporated by reference to Exhibit 10.3 of the Company’s Current Report on Form 8-K filed (with respect to Items 1.01, 2.01, 2.03, 3.02, and 9.01) August 20, 2013). | |||
| 10.12 | Commercial lease with Sabre Realty, LLC dated January 1, 2009 (incorporated by reference to Exhibit 10.1 of the Company’s Current Report on Form 8-K filed (with respect to Items 1.01, 2.01, 2.03, 3.02, and 9.01) August 20, 2013). | |||
| 10.13 | Commercial lease with Brave New World Realty, LLC dated August 29, 2011 (incorporated by reference to Exhibit 10.2 of the Company’s Current Report on Form 8-K filed (with respect to Items 1.01, 2.01, 2.03, 3.02, and 9.01) August 20, 2013). | |||
| 10.14 | First Amendment to Commercial lease with Brave New World Realty, LLC dated August 19, 2013 (incorporated by reference to Exhibit 10.4 of the Company’s Current Report on Form 8-K filed (with respect to Items 1.01, 2.01, 2.03, 3.02, and 9.01) August 20, 2013). | |||
| 10.15 | Amendment No. 1 to Amended and Restated Letter Agreement dated December 23, 2011 (incorporated by reference to Exhibit 10.1 to the Company’s Current Report on Form 8-K filed February 5, 2013). | |||
| 10.16 | Amended and Restated Specialized Equipment Facility Master Note (incorporated by reference to Exhibit 10.2 to the Company’s Current Report on Form 8-K filed February 5, 2013). | |||
| 10.17 | Reaffirmation of Manitex International, Inc. Guaranty (incorporated by reference to Exhibit 10.3 to the Company’s Current Report on Form 8-K filed February 5, 2013). | |||
| 10.18 | Reaffirmation of Manitex, LLC Guaranty (incorporated by reference to Exhibit 10.4 to the Company’s Current Report on Form 8-K filed February 5, 2013). 10.5 Declaration of Borrower (incorporated by reference to Exhibit 10.5 to the Company’s Current Report on Form 8-K filed February 5, 2013). | |||
| 10.19 | Guarantor Waiver executed by Manitex International, Inc. and Manitex, LLC (incorporated by reference to Exhibit 10.6 to the Company’s Current Report on Form 8-K filed February 5, 2013). | |||
| 10.20 | Acknowledgement of Manitex International, Inc. and Manitex, LLC (incorporated by reference to Exhibit 10.7 to the Company’s Current Report on Form 8-K filed February 5, 2013). | |||
| 10.21 | Amendment dated April 3, 2013 to Master Revolving Note dated June 29, 2011 (incorporated by reference to Exhibit 10.1 to the Company’s Current Report on Form 10-K filed April 8, 2013). | |||
| 10.22 | First Amendment to the Second Amended and Restated Manitex International, Inc. 2004 Equity Incentive Plan. (incorporated by reference to Exhibit 10.2 to the Company’s Quarterly Report on Form 10-Q August 7, 2013). | |||
105
Table of Contents
| Exhibit No. |
Description | |||
| 10.23 | Credit Agreement dated as of August 19, 2013 by and among Manitex International, Inc., Manitex, Inc., Manitex Sabre, Inc., Badger Equipment Company and Manitex Load King, Inc. as the U.S. Borrowers, Manitex Liftking ULC, as the Canadian Borrower, The Other Persons Party hereto that are designed as credit parties, Comerica Bank, for itself as U.S. Revolving Lender, a U.S. Term Lender, the U.S. Swing Line Lender and a U.S. L/C Issuer and as U.S. Agent for All Lenders , Comerica through its Toronto branch, for itself, as a Canadian Lender and the Canadian Swing Line Lender and as Canadian Agent for all Canadian Lenders, The Other Financial Institutions now or hereafter party hereto, as lenders, Comerica as Administrative Agent, Sole Lead Arranger and Sole Bookrunner (incorporated by reference to Exhibit 10.1 of the Company’s Current Report on Form 8-K filed (with respect to Items 1.01, 1.02, 2.03, and 9.01) August 20, 2013). | |||
| 10.24 | Guaranty dated August 19, 2013 of Manitex International, Inc., Manitex, Inc., Manitex Sabre, Inc., Badger Equipment Company, Manitex Load King, Inc., Liftking , Inc. and Manitex, LLC (incorporated by reference to Exhibit 10.2 of the Company’s Current Report on Form 8-K filed (with respect to Items 1.01, 1.02, 2.03, and 9.01) August 20, 2013). | |||
| 10.25 | Security Agreement dated August 19, 2013 by and among Manitex International, Inc., Manitex, Inc., Manitex Sabre, Inc., Badger Equipment Company, Manitex Load King, Inc., Liftking, Inc. and Manitex, LLC and Comerica Bank, as Agent (incorporated by reference to Exhibit 10.3 of the Company’s Current Report on Form 8-K filed (with respect to Items 1.01, 1.02, 2.03, and 9.01) August 20, 2013). | |||
| 10.26 | Security Agreement dated August 19, 2013 between Manitex Liftking, ULC and Comerica Bank, as Canadian Agent (incorporated by reference to Exhibit 10.4 of the Company’s Current Report on Form 8-K filed (with respect to Items 1.01, 1.02, 2.03, and 9.01) August 20, 2013). | |||
| 10.27 | First Amendment, dated as of October 15, 2013, to the Credit Agreement, dated as of August 19, 2013 by and among Manitex International, Inc. and certain of its subsidiaries, and Comerica Bank and certain other lenders (incorporated by reference to Exhibit 10.1 to the Current Report on Form 8-K filed on October 18, 2013). | |||
| 10.28 | First Amendment, dated as of October 15, 2013, to the Security Agreement, dated as of August 19, 2013 by and among Manitex International, Inc. and certain of its subsidiaries, and Comerica Bank (incorporated by reference to Exhibit 10.2 to the Current Report on Form 8-K filed on October 18, 2013). | |||
| 10.28 | (a) | Second Amendment, dated as of November 26, 2013, to the Credit Agreement, dated as of August 19, 2013 by and among Manitex International, Inc. and certain of its subsidiaries, and Comerica Bank and certain other lenders (Incorporated by reference to Exhibit 10.1 to the Quarterly Report on Form 10-Q filed on May 9, 2014). | ||
| 10.28 | (b) | Amendment No. 3 to Credit Agreement dated as of April 16, 2014 by and among Manitex International, Inc., Manitex, Inc., Manitex Sabre, Inc., Badger Equipment Company and Manitex Load King, Inc. as the U.S. Borrowers, Manitex Liftking ULC, as the Canadian Borrower, The Other Persons Party hereto that are designed as Lenders, Comerica Bank, a U.S. Lender, a US Issuing Lender, the U.S. Swing Line Lender and as U.S. Agent, Comerica as a Canadian Lender, a Canadian Issuing Lender and the Canadian Swing Line Lender and as Canadian Agent, Fifth Third Bank, as a US Lender and HSBC Bank USA, N.A., as a US Lender (Incorporated by reference to Exhibit 10.1 to the Quarterly Report on Form 10-Q filed on August 7, 2014). | ||
| 10.28 | (c) | Amendment No. 4 to Credit Agreement dated as of July 21, 2014 by and among Manitex International, Inc., Manitex, Inc., Manitex Sabre, Inc., Badger Equipment Company and Manitex Load King, Inc. as the U.S. Borrowers, Manitex Liftking ULC, as the Canadian Borrower, The Other Persons Party hereto that are designed as Lenders, Comerica Bank, a U.S. Lender, a US | ||
106
Table of Contents
| Exhibit No. |
Description | |||
| Issuing Lender, the U.S. Swing Line Lender and as U.S. Agent, Comerica as a Canadian Lender, a Canadian Issuing Lender and the Canadian Swing Line Lender and as Canadian Agent, Fifth Third Bank, as a US Lender and HSBC Bank USA, N.A., as a US Lender (incorporated by reference to Exhibit 10.1 to the Current Report on Form 8-K filed on July 25, 2014) | ||||
| 10.28 | (d) | Amendment No. 5 to Credit Agreement dated as of December 19, 2014 by and among Manitex International, Inc., Manitex, Inc., Manitex Sabre, Inc., Badger Equipment Company and Manitex Load King, Inc. as the U.S. Borrowers, Manitex Liftking ULC, as the Canadian Borrower, The Other Persons Party hereto that are designed as Lenders, Comerica Bank, a U.S. Lender, a US Issuing Lender, the U.S. Swing Line Lender and as U.S. Agent, Comerica as a Canadian Lender, a Canadian Issuing Lender and the Canadian Swing Line Lender and as Canadian Agent, Fifth Third Bank, as a US Lender and HSBC Bank USA, N.A., as a US Lender (incorporated by reference to Exhibit 10.1 to the Current Report on Form 8-K filed on December 23, 2014) | ||
| 10.29 | Second Amended and Restated Letter Agreement between Manitex Liftking, ULC and Comerica Bank dated November 13, 2013 (incorporated by reference to Exhibit 10.1 to the Current Report on Form 8-K filed on November 14, 2013). | |||
| 10.30 | Second Amended and Restated Specialized Equipment Export Facility Master Revolving Note between Manitex Liftking, ULC and Comerica Bank dated November 13, 2013 (incorporated by reference to Exhibit 10.2 to the Current Report on Form 8-K filed on November 14, 2013). | |||
| 10.31 | Advance Formula Agreement dated as of December 23, 2011, made by Manitex Liftking, ULC in favor of Comerica Bank (incorporated by reference to Exhibit 10.8 to the Current Report on Form 8-K filed on December 30, 2011). | |||
| 10.32 | Amendment No. 1, dated August 10, 2012, to Advance Formula Agreement dated as of December 23, 2011, made by Manitex Liftking, ULC in favor of Comerica Bank (incorporated by reference to Exhibit 10.2 to the Current Report on Form 8-K filed on August 13, 2012). | |||
| 10.33 | Master Revolving Note in the principal amount of $500,000 dated May 5, 2010, between Manitex International, Inc. and Comerica Bank (incorporated by reference to Exhibit 10.2 to the Current Report on Form 8-K filed on August May 11, 2010). | |||
| 10.34 | Amendment No. 1, dated August 10, 2012, to Master Revolving Note in the principal amount of $500,000 dated May 5, 2010, between Manitex International, Inc. and Comerica Bank (incorporated by reference to Exhibit 10.1 to the Current Report on Form 8-K filed on August 13, 2012). | |||
| 10.35 | Letter agreement dated May 5, 2010, between Manitex International, Inc. and Comerica Bank (incorporated by reference to Exhibit 10.4 to the Current Report on Form 8-K filed on May 11, 2010). | |||
| 10.36 | Amendment effective as of June 29, 2011 to the Letter Agreement dated May 5, 2010 between Manitex International, Inc. and Comerica Bank (incorporated by reference to Exhibit 10.7 to the Current Report on Form 8-K filed on July 1, 2011). | |||
| 10.37 | Comerica Bank Foreign Currency Exchange Master Agreement, dated September 7, 2007, between Veri-Tek International, Corp. (now known as Manitex International, Inc.) and Comerica Bank (incorporated by reference to Exhibit 10.1 to the Quarterly Report on Form 10-Q filed on November 14, 2007). | |||
| 10.38 | Specialized Equipment Export Facility Master Revolving Note for $2.0 million dated December 23, 2011, between Manitex Liftking, ULC and Comerica Bank (incorporated by reference to Exhibit 10.2 to the Current Report on Form 8-K filed on December 30, 2011). | |||
107
Table of Contents
| Exhibit No. |
Description | |||
| 10.39 | Manitex International, Inc. Guarantee dated as of December 23, 2011 in favor of Comerica Bank related to indebtedness of Manitex Liftking, ULC Specialized Equipment Export Facility (incorporated by reference to Exhibit 10.4 to the Current Report on Form 8-K filed on December 30, 2011). | |||
| 10.40 | Manitex, LLC Guarantee dated as of December 23, 2011, in favor of Comerica Bank related to indebtedness of Manitex Liftking, ULC Specialized Equipment Export Facility (incorporated by reference to Exhibit 10.5 to the Current Report on Form 8-K filed on December 30, 2011). | |||
| 10.41 | Manitex International, Inc. Waiver issued to Export Development Canada dated December 9, 2011 (incorporated by reference to Exhibit 10.6 to the Current Report on Form 8-K filed on December 30, 2011). | |||
| 10.42 | Manitex, LLC Waiver issued to Export Development Canada dated December 9, 2011 (incorporated by reference to Exhibit 10.7 to the Current Report on Form 8-K filed on December 30, 2011). | |||
| 10.43 | Amended and Restated Master Revolving Note (Multi-Currency) for $6.5 million dated December 23, 2011, between Manitex Liftking, ULC and Comerica Bank (incorporated by reference to Exhibit 10.9 to the Current Report on Form 8-K filed on December 30, 2011). | |||
| 10.44 | Amended and Restated Guaranty dated December 23, 2011 from Manitex International, Inc. to Comerica Bank related to Manitex Liftking, ULC Amended and Restated Master Revolving Note (incorporated by reference to Exhibit 10.10 to the Current Report on Form 8-K filed on December 30, 2011). | |||
| 10.45 | Amended and Restated Security Agreement dated as of December 23, 1011 from Manitex International, Inc. to Comerica Bank related to Manitex Liftking, ULC Amended and Restated Master Revolving Note (incorporated by reference to Exhibit 10.11 to the Current Report on Form 8-K filed on December 30, 2011). | |||
| 10.46 | Amended and Restated Guaranty dated December 23, 2011 from Manitex, LLC to Comerica Bank related to Manitex Liftking, ULC Amended and Restated Master Revolving Note (incorporated by reference to Exhibit 10.12 to the Current Report on Form 8-K filed on December 30, 2011). | |||
| 10.47 | Security Agreement dated as of December 23, 2011 from Manitex, LLC to Comerica Bank related to Manitex Liftking, ULC Amended and Restated Master Revolving Note (incorporated by reference to Exhibit 10.13 to the Current Report on Form 8-K filed on December 30, 2011). | |||
| 10.48 | Floorplan and Security Agreement between Manitex International, Inc. and HCA Equipment Finance LLC, dated December 15, 2008, together with the form of Extension of Credit, which is attached as Exhibit A thereto, and the Addendum to Floorplan and Security Agreement, dated January 20, 2009 (incorporated by reference to Exhibit 10.1 to the Current Report on Form 8-K filed on January 27, 2009). | |||
| 10.49 | Restructuring Agreement, dated October 6, 2008, by and among Terex Corporation, Crane & Machinery, Inc., and Manitex International, Inc. (incorporated by reference to Exhibit 10.2 to the Current Report on Form 8-K filed on October 10, 2008). | |||
| 10.50 | Term Note in principal amount of $2,000,000, dated October 6, 2008, payable by Manitex International, Inc. to Terex Corporation (incorporated by reference to Exhibit 10.3 to the Current Report on Form 8-K filed on October 10, 2008). | |||
| 10.51 | Security Agreement, dated October 6, 2008, by and between Crane & Machinery, Inc. and Terex Corporation (incorporated by reference to Exhibit 10.5 to the Current Report on Form 8-K filed on October 10, 2008). | |||
108
Table of Contents
| Exhibit No. |
Description | |||
| 10.52 | Master Revolving Note in the principal amount of $22.5 million dated June 29, 2011 by and between, and between Manitex, Inc. and Comerica Bank (incorporated by reference to Exhibit 10-2 to the Current Report on Form 8-K filed on July 1, 2011). | |||
| 10.53 | Master Revolving Note in the principal amount of $1.0 million dated June 29, 2011 by and between, and between Manitex International, Inc. and Comerica Bank (incorporated by reference to Exhibit 10-6 to the Current Report on Form 8-K filed on July 1, 2011). | |||
| 10.54 | Guaranty of Manitex International, Inc. dated June 29, 2011 that guarantees Manitex, Inc. indebtedness to Comerica Bank (incorporated by reference to Exhibit 10.9 to the Current Report on Form 8-K filed on July 1, 2011). | |||
| 10.55 | Guaranty of Manitex International, Inc. dated June 29, 2011 that guarantees Manitex Liftking, ULC indebtedness to Comerica Bank (incorporated by reference to Exhibit 10.10 to the Current Report on Form 8-K filed on July 1, 2011). | |||
| 10.56 | Guaranty of Badger Equipment Company and Manitex Load King, Inc. dated June 29, 2011 that guarantees Manitex, Inc. and Manitex International, Inc. indebtedness to Comerica Bank (incorporated by reference to Exhibit 10.11 to the Current Report on Form 8-K filed on July 1, 2011). | |||
| 10.57 | Security Agreement dated June 29, 2011 by and between, and between Badger Equipment Company and Comerica Bank (incorporated by reference to Exhibit 10.12 to the Current Report on Form 8-K filed on July 1, 2011). | |||
| 10.58 | Security Agreement dated June 29, 2011 by and between, and between Manitex Load King, Inc. and Comerica Bank (incorporated by reference to Exhibit 10.13 to the Current Report on Form 8-K filed on July 1, 2011). | |||
| 10.59 | Guaranty of Manitex, Inc. dated June 29, 2011 that guarantees Manitex International, Inc. indebtedness to Comerica Bank (incorporated by reference to Exhibit 10.14 to the Current Report on Form 8-K filed on July 1, 2011). | |||
| 10.60 | Loan Agreement dated November 2, 2011, between the South Dakota Board of Economic Development and Manitex Load King, Inc. (incorporated by reference to Exhibit 10.1 to the Current Report on Form 8-K filed on November 8, 2011). | |||
| 10.61 | Promissory Note in the principal amount of $857,500 dated November 2, 2011, between Manitex Load King, Inc. and the South Dakota Board of Economic Development (incorporated by reference to Exhibit 10.2 to the Current Report on Form 8-K filed on November 8, 2011). | |||
| 10.62 | Mortgage—One Hundred Eighty Day Redemption dated November 2, 2011, between Manitex Load King, Inc. and the South Dakota Board of Economic Development (incorporated by reference to Exhibit 10.3 to the Current Report on Form 8-K filed on November 8, 2011). | |||
| 10.63 | Guaranty Agreement dated November 2, 2011, between the State of South Dakota Board of Economic Development and Manitex International, Inc. (incorporated by reference to Exhibit 10.4 to the Current Report on Form 8-K filed on November 8, 2011). | |||
| 10.64 | * | Employment Agreement dated November 2, 2011, between the State of South Dakota Board of Economic Development and Manitex Load King, Inc. (incorporated by reference to Exhibit 10.5 to the Current Report on Form 8-K filed on November 8, 2011). | ||
| 10.65 | Promissory Note in the principal amount of $857,500 dated November 2, 2011, between Manitex Load King, Inc. and Home Federal Bank (incorporated by reference to Exhibit 10.6 to the Current Report on Form 8-K filed on November 8, 2011). | |||
109
Table of Contents
| Exhibit No. |
Description | |||
| 10.66 | Mortgage One Hundred Eighty Day Redemption dated November 2, 2011, between Manitex Load King, Inc. and Home Federal Bank (incorporated by reference to Exhibit 10.7 to the Current Report on Form 8-K filed on November 8, 2011). | |||
| 10.67 | Guaranty dated November 2, 2011, between Manitex International, Inc., Manitex Load King, Inc. and Home Federal Bank (incorporated by reference to Exhibit 10.8 to the Current Report on Form 8-K filed on November 8, 2011). | |||
| 10.68 | Promissory Note in the principal amount of $400,000 dated November 2, 2011, between Manitex Load King, Inc. and Home Federal Bank (incorporated by reference to Exhibit 10.9 to the Current Report on Form 8-K filed on November 8, 2011). | |||
| 10.69 | Security Agreement dated November 2, 2011, between Home Federal Bank and Manitex Load King, Inc. (incorporated by reference to Exhibit 10.10 to the Current Report on Form 8-K filed on November 8, 2011). | |||
| 10.70 | English Summary of Form of Agreement for the Provision of Goods dated June 29, 2011 between CVS Ferrari Srl and Cabletronic srl. (incorporated by reference to Exhibit 10.1 to the Current Report on Form 8-K/A filed on August 8, 2011). | |||
| 10.71 | English Summary of Form of Letter Agreement dated February 11, 2011 between C.V.S. Costruzione Veicoli Speciali S.p.A. and CVS Ferrari srl (incorporated by reference to Exhibit 10.2 to the Current Report on Form 8-K/A filed on August 8, 2011). | |||
| 10.72 | Investment Agreement, dated July 21, 2014, between Manitex International, Inc., IPEF III Holdings n° 11 S.A and Columna Holdings Limited (incorporated by reference to Exhibit 10.1 to the Current Report on Form 8-K filed on July 25, 2014). | |||
| 10.73 | Debt Assignment Agreements, dated July 21, 2014, between Manitex International, Inc. and Banca Popolare del’Emilia Romagna S.C. (incorporated by reference to Exhibit 10.2 to the Current Report on Form 8-K filed on July 25, 2014). | |||
| 10.74 | Debt Assignment Agreements, dated July 21, 2014, between Manitex International, Inc. and Unicredit S.P.A. (incorporated by reference to Exhibit 10.3 to the Current Report on Form 8-K filed on July 25, 2014). | |||
| 10.75 | Option Agreement, dated July 21, 2014, by and between Manitex International, Inc. and Banca Popolare del’Emilia Romagna S.C. (incorporated by reference to Exhibit 10.4 to the Current Report on Form 8-K filed on July 25, 2014). | |||
| 10.76 | Commitment Letter dated July 21, 2014 the Company and PM Group (incorporated by reference to Exhibit 10.5 to the Current Report on Form 8-K filed on July 25, 2014). | |||
| 10.77 | Common Stock and Convertible Debenture Purchase Agreement, dated October 29, 2014, between Manitex International, Inc. and Terex Corporation (incorporated by reference to Exhibit 10.1 to the Current Report on Form 8-K filed on November 3, 2014). | |||
| 10.78 | Credit Agreement, dated as of December 19, 2014 among ASV, the Loan Parties party thereto and Garrison Loan Agency Services LLC, as Administrative Agent (incorporated by reference to Exhibit 10.2 to the Current Report on Form 8-K filed on December 23, 2014). | |||
| 10.79 | Credit Agreement, dated as of December 19, 2014 among ASV, the Loan Parties party thereto, the Lenders party thereto and JPMorgan Chase bank, N.A., as Administrative Agent (incorporated by reference to Exhibit 10.2 to the Current Report on Form 8-K filed on December 23, 2014). | |||
| 21.1 | (1) | Subsidiaries of the Company. | ||
| 23.1 | (1) | Consent of UHY LLP. | ||
110
Table of Contents
| Exhibit No. |
Description | |||
| 24.1 | (1) | Power of Attorney (included on signature page). | ||
| 31.1 | (1) | Certification of Principal Executive Officer pursuant to Rule 13a-14(a) and 15d-14(a) of the Securities Exchange Act of 1934, as amended. | ||
| 31.2 | (1) | Certification of Principal Financial Officer pursuant to Rule 13a-14(a) and 15d-14(a) of the Securities Exchange Act of 1934, as amended. | ||
| 32.1 | (1) | Certification by Principal Executive Officer and Principal Financial Officer pursuant to 18 U.S.C. 1350. | ||
| 101 | (1) | The following financial information from the Company’s Annual Report on Form 10-K for the fiscal year ended December 31, 2014, formatted in XBRL (eXtensible Business Reporting Language): (i) Consolidated Statements of Income for the fiscal years ended December 31, 2014, 2013 and 2012, (ii) Consolidated Balance Sheets as of December 31, 2014 and 2013, (iii) Consolidated Statements of Shareholders Equity and Comprehensive Income, (iv) Consolidated Statements of Cash Flows and (v) Notes to Consolidated Financial Statements. | ||
| * | Denotes a management contract or compensatory plan or arrangement. |
| (1) | Filed herewith. |
111