Attached files
| file | filename |
|---|---|
| EX-99.1 - EX-99.1 - LAUREATE EDUCATION, INC. | a18-18496_1ex99d1.htm |
| 8-K - 8-K - LAUREATE EDUCATION, INC. | a18-18496_18k.htm |

Forward Looking Statements This presentation includes statements that express Laureate's opinions, expectations, beliefs, plans, objectives, assumptions or projections regarding future events or future results and therefore are, or may be deemed to be, "forward-looking statements" within the meaning of the federal securities laws, which involve risks and uncertainties. Laureate’s actual results may vary significantly from the results anticipated in these forward-looking statements. You can identify forward-looking statements because they contain words such as ‘‘believes,’’ ‘‘expects,’’ ‘‘may,’’ ‘‘will,’’ ‘‘should,’’ ‘‘seeks,’’ ‘‘approximately,’’ ‘‘intends,’’ ‘‘plans,’’ ‘‘estimates’’ or ‘‘anticipates’’ or similar expressions that concern our strategy, plans or intentions. All statements we make relating to guidance (including, but not limited to, total enrollments, revenue, Adjusted EBITDA, costs (including cost savings), expenditures (including capital expenditures), cash interest expense, free cash flow, earnings per share, runrates and growth rates), our hedging strategy, margin expansion, EV/EBITDA, currency rates and financial results, debt leverage, all statements we make related to the expansion of our EiP initiative, and all statements we make relating to our planned divestitures, the expected proceeds generated therefrom and the expected reduction in revenue and Adjusted EBITDA therefrom, are forward-looking statements. In addition, we, through our senior management, from time to time make forward-looking public statements concerning our expected future operations and performance and other developments. All of these forward-looking statements are subject to risks and uncertainties that may change at any time, and, therefore, our actual results may differ materially from those we expected. We derive most of our forward-looking statements from our operating budgets and forecasts, which are based upon many detailed assumptions. While we believe that our assumptions are reasonable, we caution that it is very difficult to predict the impact of known factors, and, of course, it is impossible for us to anticipate all factors that could affect our actual results. Important factors that could cause actual results to differ materially from our expectations are disclosed in our Annual Report on Form 10-K filed with the U.S. Securities and Exchange Commission (“SEC”) on March 20, 2018, our Quarterly Report on Form 10-Q filed on May 9, 2018 with the SEC, our Quarterly Report on Form 10-Q filed with the SEC on Aug 9, 2018, and other filings made with the SEC. These forward-looking statements speak only as of the time of this presentation and we do not undertake to publicly update or revise them, whether as a result of new information, future events or otherwise, except as required by law. In addition, this presentation contains various operating data, including market share and market position, that are based on internal company data and management estimates. While management believes our internal company research is reliable and the definitions of our markets which are used herein are appropriate, neither such research nor these definitions have been verified by an independent source and there are inherent challenges and limitations involved in compiling data across various geographies and from various sources, including those discussed under “Market and Industry Data” in Laureate’s filings with the SEC. Presentation of Non-GAAP Measures This presentation contains certain non-GAAP measures which are provided to assist in an understanding of the business and performance of Laureate Education Inc. These measures should always be considered in conjunction with the appropriate GAAP measure. Reconciliations of non-GAAP measures to the relevant GAAP measures are provided in the appendix to this presentation in the financial tables and our SEC filings.
SUMMARY OVERVIEW Note: Throughout this presentation amounts may not sum to totals due to rounding
Summary Highlights New Enrollments up 4% Q2 YTD Continued margin improvements; up 86bps through Q2 YTD 2Q Adjusted EBITDA ahead of Guidance; up 6% Vs. 2Q 2017 (1) Strong 1H performance; reaffirming full year guidance Outstanding 3rd party rankings and recognitions in Spain, Chile and Peru 2017 Accelerator Plan on-track, resulting in simplification of business model & margin expansion Further portfolio simplification underway Strong H1 Performance On an Organic Constant Currency (CC) basis
Portfolio Simplification

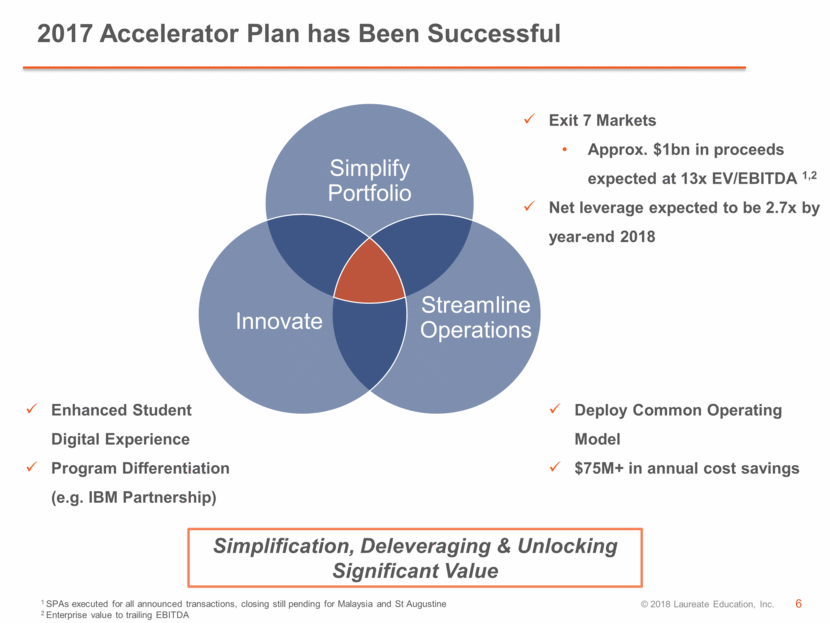
2017 Accelerator Plan has Been Successful Exit 7 Markets Approx. $1bn in proceeds expected at 13x EV/EBITDA 1,2 Net leverage expected to be 2.7x by year-end 2018 Deploy Common Operating Model $75M+ in annual cost savings Simplify Portfolio Streamline Operations Innovate Enhanced Student Digital Experience Program Differentiation (e.g. IBM Partnership) Simplification, Deleveraging & Unlocking Significant Value 1 SPAs executed for all announced transactions, closing still pending for Malaysia and St Augustine 2 Enterprise value to trailing EBITDA
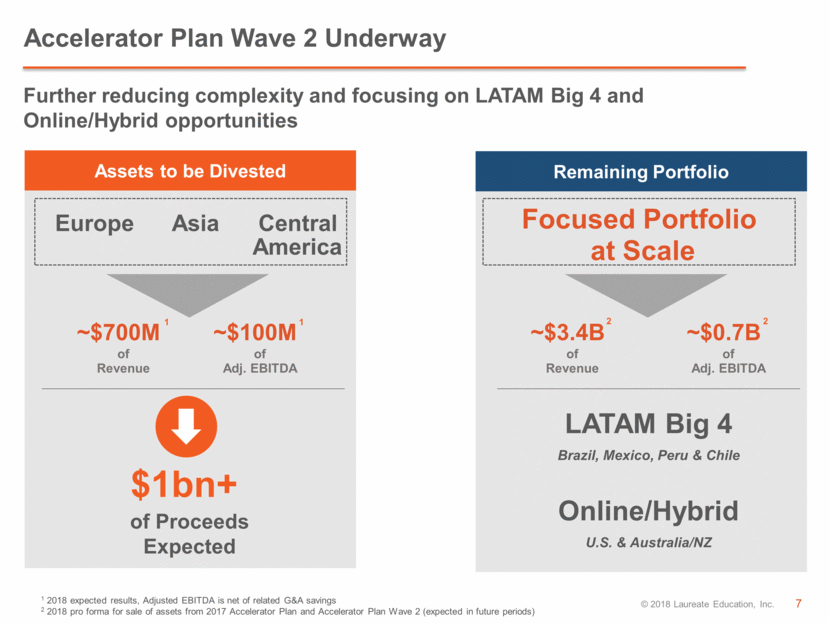
Accelerator Plan Wave 2 Underway of Proceeds Expected of Revenue ~$700M Assets to be Divested $1bn+ Europe Asia Central Further reducing complexity and focusing on LATAM Big 4 and Online/Hybrid opportunities Remaining Portfolio LATAM Big 4 Brazil, Mexico, Peru & Chile Online/Hybrid U.S. & Australia/NZ Focused Portfolio at Scale of Adj. EBITDA ~$100M 1 2018 expected results, Adjusted EBITDA is net of related G&A savings 2 2018 pro forma for sale of assets from 2017 Accelerator Plan and Accelerator Plan Wave 2 (expected in future periods) 1 of Revenue ~$3.4B of Adj. EBITDA ~$0.7B 2 2 America 1
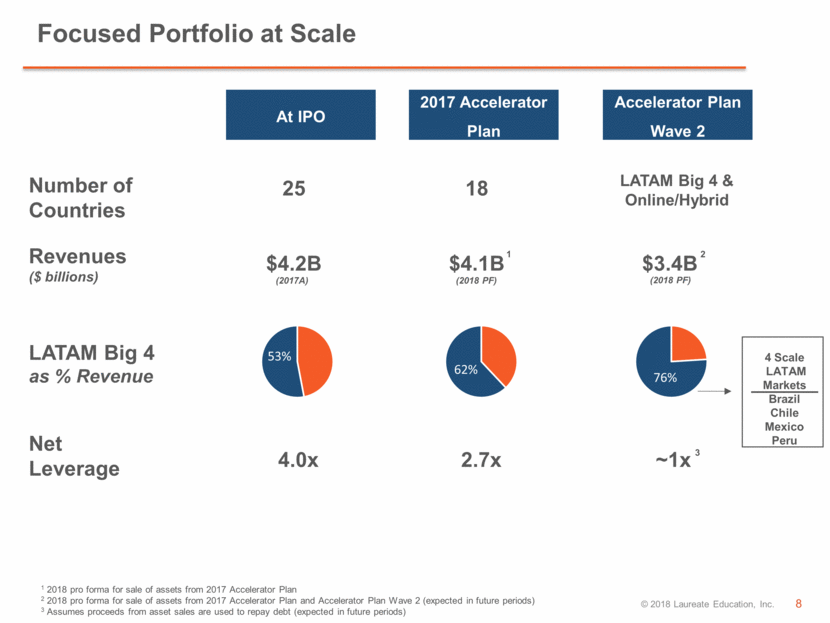
Focused Portfolio at Scale Number of Countries Net Leverage At IPO 2017 Accelerator Plan Accelerator Plan Wave 2 25 18 LATAM Big 4 & Online/Hybrid 4.0x 2.7x ~1x LATAM Big 4 as % Revenue 53% 62% 76% Revenues ($ billions) $4.2B $4.1B $3.4B 1 2018 pro forma for sale of assets from 2017 Accelerator Plan 2 2018 pro forma for sale of assets from 2017 Accelerator Plan and Accelerator Plan Wave 2 (expected in future periods) 3 Assumes proceeds from asset sales are used to repay debt (expected in future periods) (2017A) (2018 PF) (2018 PF) 1 2 3 4 Scale LATAM Markets Brazil Chile Mexico Peru 53% 62% 76%
Q2 & 1H 2018 PERFORMANCE RESULTS
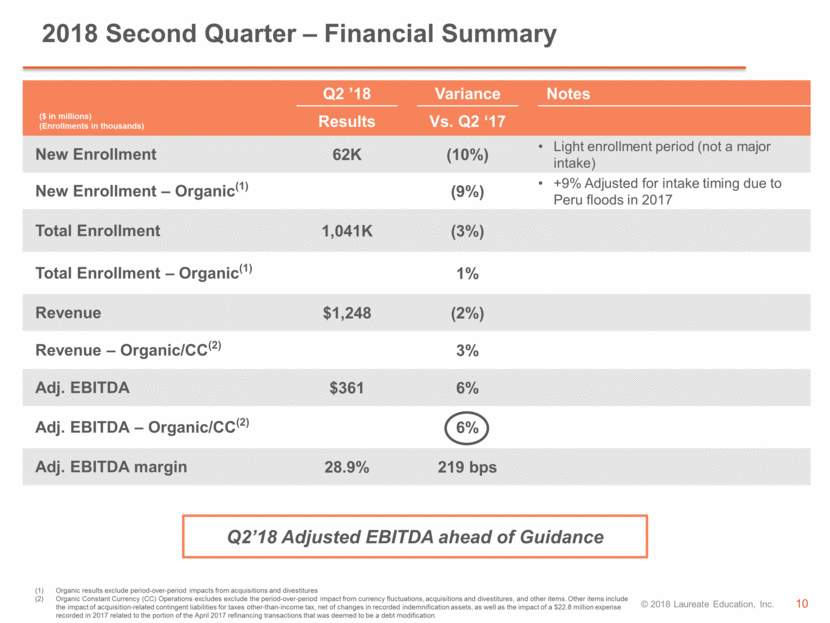
Q2 ’18 Variance Notes ($ in millions) (Enrollments in thousands) Results Vs. Q2 ‘17 New Enrollment 62K (10%) Light enrollment period (not a major intake) New Enrollment – Organic(1) (9%) +9% Adjusted for intake timing due to Peru floods in 2017 Total Enrollment 1,041K (3%) Total Enrollment – Organic(1) 1% Revenue $1,248 (2%) Revenue – Organic/CC(2) 3% Adj. EBITDA $361 6% Adj. EBITDA – Organic/CC(2) 6% Adj. EBITDA margin 28.9% 219 bps Organic results exclude period-over-period impacts from acquisitions and divestitures Organic Constant Currency (CC) Operations excludes exclude the period-over-period impact from currency fluctuations, acquisitions and divestitures, and other items. Other items include the impact of acquisition-related contingent liabilities for taxes other-than-income tax, net of changes in recorded indemnification assets, as well as the impact of a $22.8 million expense recorded in 2017 related to the portion of the April 2017 refinancing transactions that was deemed to be a debt modification. 2018 Second Quarter – Financial Summary Q2’18 Adjusted EBITDA ahead of Guidance
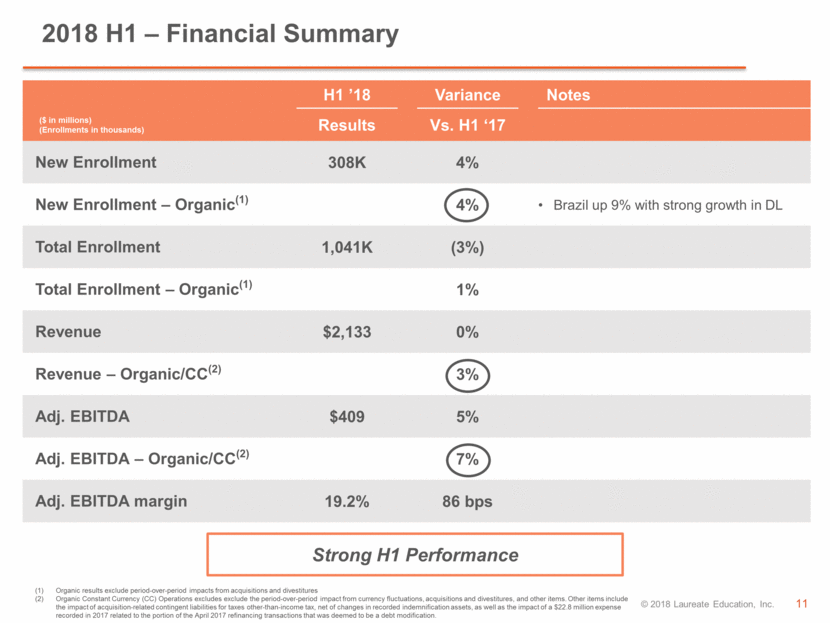
H1 ’18 Variance Notes ($ in millions) (Enrollments in thousands) Results Vs. H1 ‘17 New Enrollment 308K 4% New Enrollment – Organic(1) 4% Brazil up 9% with strong growth in DL Total Enrollment 1,041K (3%) Total Enrollment – Organic(1) 1% Revenue $2,133 0% Revenue – Organic/CC(2) 3% Adj. EBITDA $409 5% Adj. EBITDA – Organic/CC(2) 7% Adj. EBITDA margin 19.2% 86 bps 2018 H1 – Financial Summary Strong H1 Performance Organic results exclude period-over-period impacts from acquisitions and divestitures Organic Constant Currency (CC) Operations excludes exclude the period-over-period impact from currency fluctuations, acquisitions and divestitures, and other items. Other items include the impact of acquisition-related contingent liabilities for taxes other-than-income tax, net of changes in recorded indemnification assets, as well as the impact of a $22.8 million expense recorded in 2017 related to the portion of the April 2017 refinancing transactions that was deemed to be a debt modification.
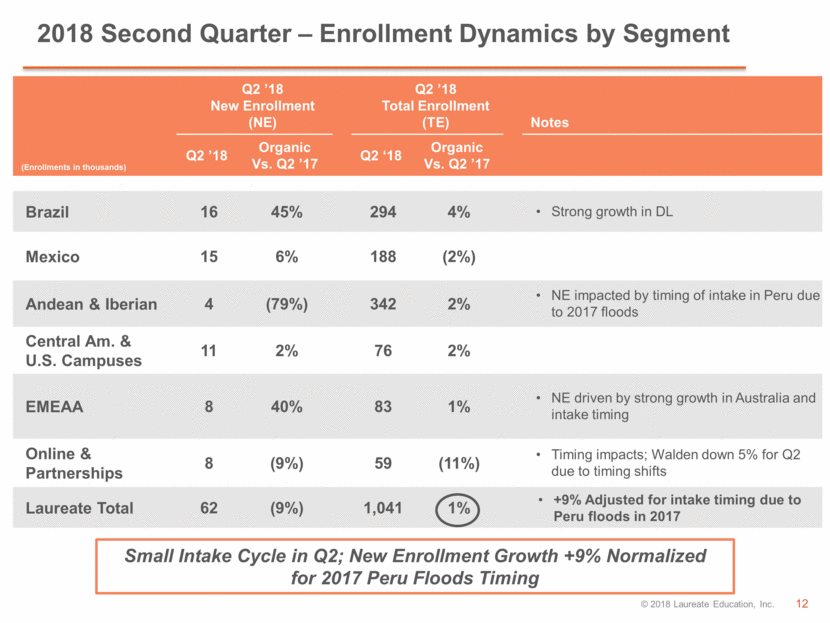
2018 Second Quarter – Enrollment Dynamics by Segment Small Intake Cycle in Q2; New Enrollment Growth +9% Normalized for 2017 Peru Floods Timing Q2 ’18 New Enrollment (NE) Q2 ’18 Total Enrollment (TE) Notes (Enrollments in thousands) Q2 ’18 Organic Vs. Q2 ’17 Q2 ‘18 Organic Vs. Q2 ’17 Brazil 16 45% 294 4% Strong growth in DL Mexico 15 6% 188 (2%) Andean & Iberian 4 (79%) 342 2% NE impacted by timing of intake in Peru due to 2017 floods Central Am. & U.S. Campuses 11 2% 76 2% EMEAA 8 40% 83 1% NE driven by strong growth in Australia and intake timing Online & Partnerships 8 (9%) 59 (11%) Timing impacts; Walden down 5% for Q2 due to timing shifts Laureate Total 62 (9%) 1,041 1% +9% Adjusted for intake timing due to Peru floods in 2017
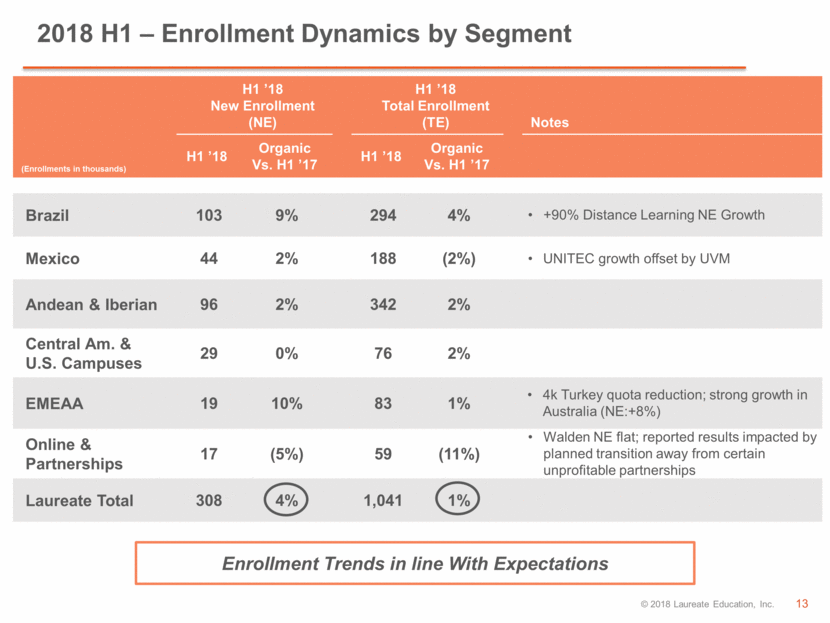
2018 H1 – Enrollment Dynamics by Segment Enrollment Trends in line With Expectations H1 ’18 New Enrollment (NE) H1 ’18 Total Enrollment (TE) Notes (Enrollments in thousands) H1 ’18 Organic Vs. H1 ’17 H1 ’18 Organic Vs. H1 ’17 Brazil 103 9% 294 4% +90% Distance Learning NE Growth Mexico 44 2% 188 (2%) UNITEC growth offset by UVM Andean & Iberian 96 2% 342 2% Central Am. & U.S. Campuses 29 0% 76 2% EMEAA 19 10% 83 1% 4k Turkey quota reduction; strong growth in Australia (NE:+8%) Online & Partnerships 17 (5%) 59 (11%) Walden NE flat; reported results impacted by planned transition away from certain unprofitable partnerships Laureate Total 308 4% 1,041 1%
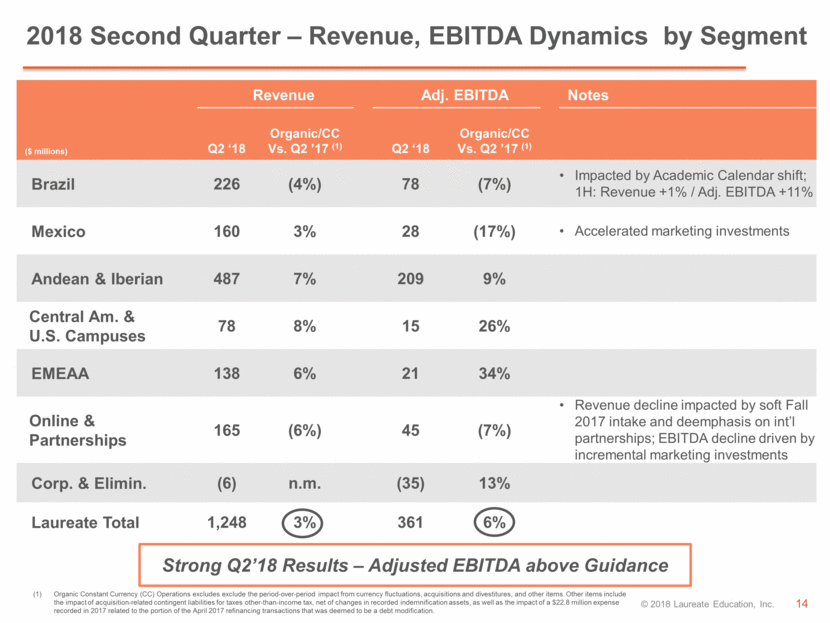
Revenue Adj. EBITDA Notes ($ millions) Q2 ‘18 Organic/CC Vs. Q2 ’17 (1) Q2 ‘18 Organic/CC Vs. Q2 ’17 (1) Brazil 226 (4%) 78 (7%) Impacted by Academic Calendar shift; 1H: Revenue +1% / Adj. EBITDA +11% Mexico 160 3% 28 (17%) Accelerated marketing investments Andean & Iberian 487 7% 209 9% Central Am. & U.S. Campuses 78 8% 15 26% EMEAA 138 6% 21 34% Online & Partnerships 165 (6%) 45 (7%) Revenue decline impacted by soft Fall 2017 intake and deemphasis on int’l partnerships; EBITDA decline driven by incremental marketing investments Corp. & Elimin. (6) n.m. (35) 13% Laureate Total 1,248 3% 361 6% Organic Constant Currency (CC) Operations excludes exclude the period-over-period impact from currency fluctuations, acquisitions and divestitures, and other items. Other items include the impact of acquisition-related contingent liabilities for taxes other-than-income tax, net of changes in recorded indemnification assets, as well as the impact of a $22.8 million expense recorded in 2017 related to the portion of the April 2017 refinancing transactions that was deemed to be a debt modification. Strong Q2’18 Results – Adjusted EBITDA above Guidance 2018 Second Quarter – Revenue, EBITDA Dynamics by Segment
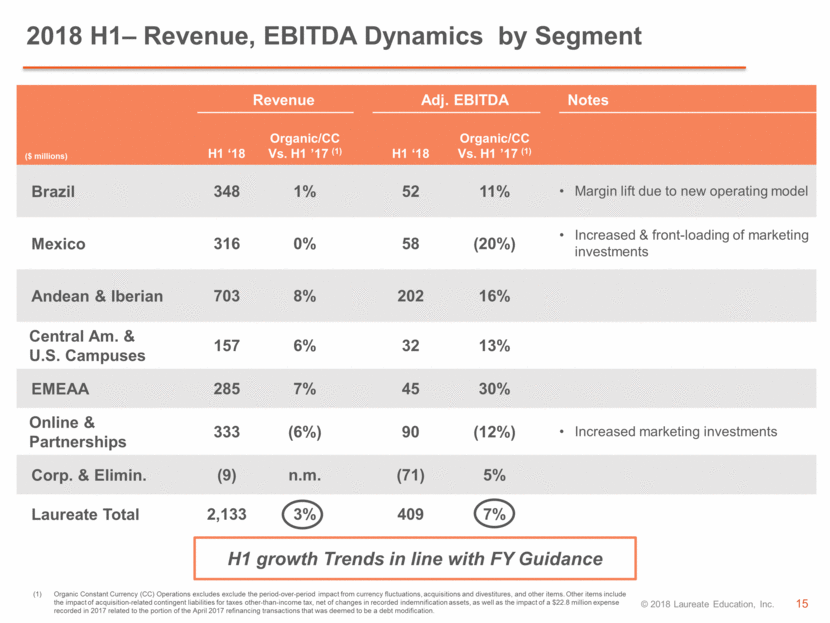
Revenue Adj. EBITDA Notes ($ millions) H1 ‘18 Organic/CC Vs. H1 ’17 (1) H1 ‘18 Organic/CC Vs. H1 ’17 (1) Brazil 348 1% 52 11% Margin lift due to new operating model Mexico 316 0% 58 (20%) Increased & front-loading of marketing investments Andean & Iberian 703 8% 202 16% Central Am. & U.S. Campuses 157 6% 32 13% EMEAA 285 7% 45 30% Online & Partnerships 333 (6%) 90 (12%) Increased marketing investments Corp. & Elimin. (9) n.m. (71) 5% Laureate Total 2,133 3% 409 7% H1 growth Trends in line with FY Guidance 2018 H1– Revenue, EBITDA Dynamics by Segment Organic Constant Currency (CC) Operations excludes exclude the period-over-period impact from currency fluctuations, acquisitions and divestitures, and other items. Other items include the impact of acquisition-related contingent liabilities for taxes other-than-income tax, net of changes in recorded indemnification assets, as well as the impact of a $22.8 million expense recorded in 2017 related to the portion of the April 2017 refinancing transactions that was deemed to be a debt modification.
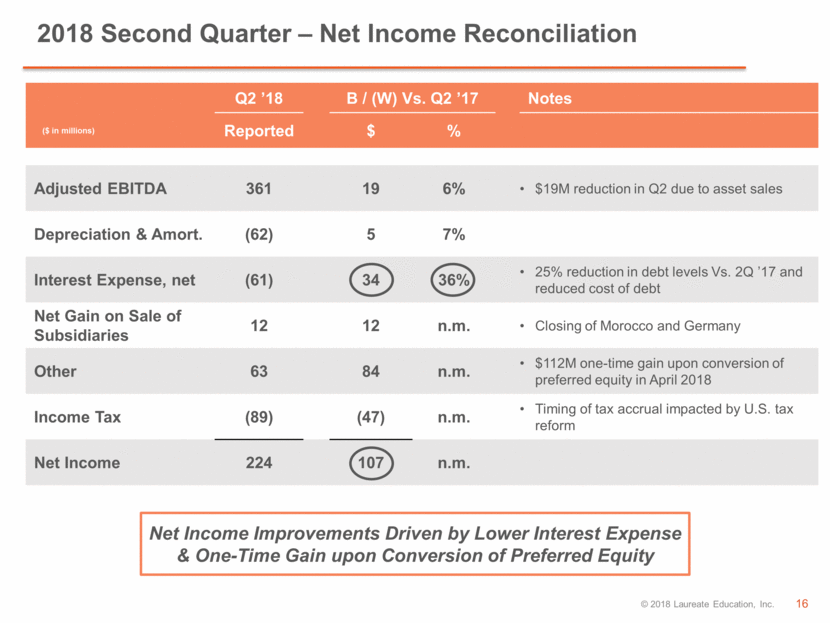
2018 Second Quarter – Net Income Reconciliation Net Income Improvements Driven by Lower Interest Expense & One-Time Gain upon Conversion of Preferred Equity Q2 ’18 B / (W) Vs. Q2 ’17 Notes ($ in millions) Reported $ % Adjusted EBITDA 361 19 6% $19M reduction in Q2 due to asset sales Depreciation & Amort. (62) 5 7% Interest Expense, net (61) 34 36% 25% reduction in debt levels Vs. 2Q ’17 and reduced cost of debt Net Gain on Sale of Subsidiaries 12 12 n.m. Closing of Morocco and Germany Other 63 84 n.m. $112M one-time gain upon conversion of preferred equity in April 2018 Income Tax (89) (47) n.m. Timing of tax accrual impacted by U.S. tax reform Net Income 224 107 n.m.
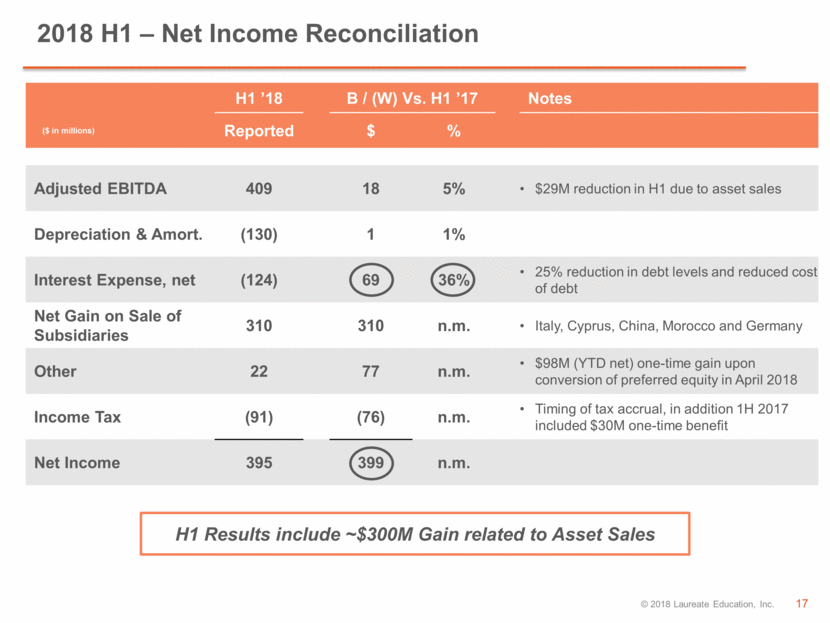
2018 H1 – Net Income Reconciliation H1 Results include ~$300M Gain related to Asset Sales H1 ’18 B / (W) Vs. H1 ’17 Notes ($ in millions) Reported $ % Adjusted EBITDA 409 18 5% $29M reduction in H1 due to asset sales Depreciation & Amort. (130) 1 1% Interest Expense, net (124) 69 36% 25% reduction in debt levels and reduced cost of debt Net Gain on Sale of Subsidiaries 310 310 n.m. Italy, Cyprus, China, Morocco and Germany Other 22 77 n.m. $98M (YTD net) one-time gain upon conversion of preferred equity in April 2018 Income Tax (91) (76) n.m. Timing of tax accrual, in addition 1H 2017 included $30M one-time benefit Net Income 395 399 n.m.
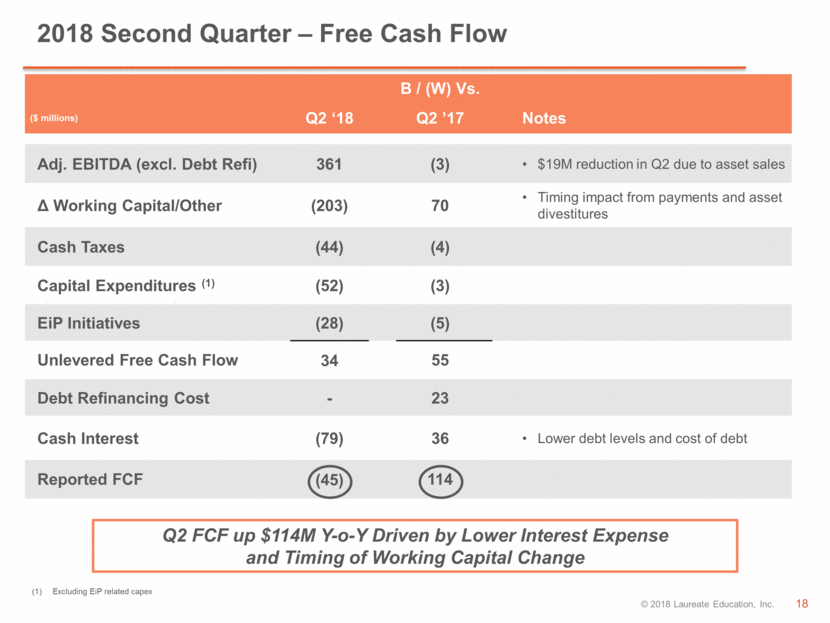
2018 Second Quarter – Free Cash Flow Q2 FCF up $114M Y-o-Y Driven by Lower Interest Expense and Timing of Working Capital Change B / (W) Vs. ($ millions) Q2 ‘18 Q2 ’17 Notes Adj. EBITDA (excl. Debt Refi) 361 (3) $19M reduction in Q2 due to asset sales Working Capital/Other (203) 70 Timing impact from payments and asset divestitures Cash Taxes (44) (4) Capital Expenditures (1) (52) (3) EiP Initiatives (28) (5) Unlevered Free Cash Flow 34 55 Debt Refinancing Cost - 23 Cash Interest (79) 36 Lower debt levels and cost of debt Reported FCF (45) 114 Excluding EiP related capex
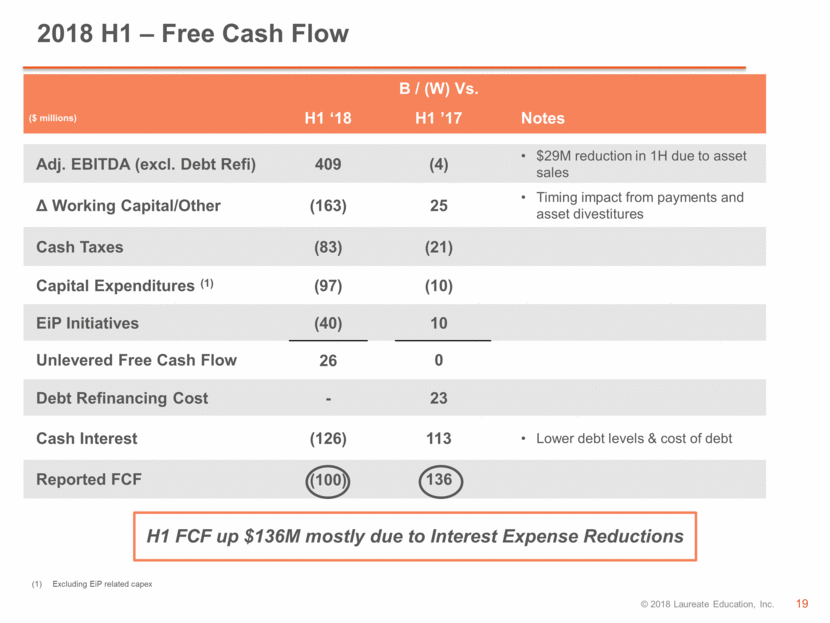
2018 H1 – Free Cash Flow H1 FCF up $136M mostly due to Interest Expense Reductions B / (W) Vs. ($ millions) H1 ‘18 H1 ’17 Notes Adj. EBITDA (excl. Debt Refi) 409 (4) $29M reduction in 1H due to asset sales Working Capital/Other (163) 25 Timing impact from payments and asset divestitures Cash Taxes (83) (21) Capital Expenditures (1) (97) (10) EiP Initiatives (40) 10 Unlevered Free Cash Flow 26 0 Debt Refinancing Cost - 23 Cash Interest (126) 113 Lower debt levels & cost of debt Reported FCF (100) 136 Excluding EiP related capex
FX update
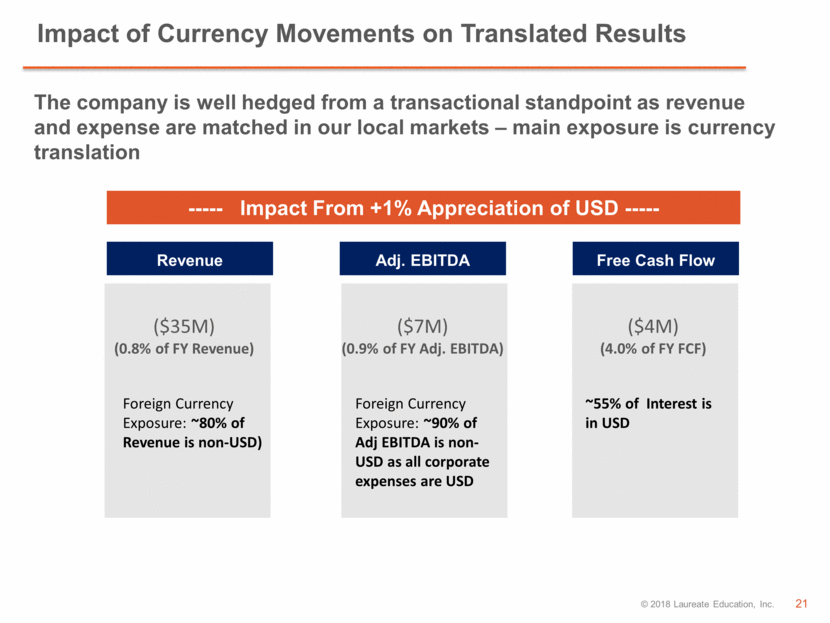
Impact of Currency Movements on Translated Results Foreign Currency Exposure: ~80% of Revenue is non-USD) Foreign Currency Exposure: ~90% of Adj EBITDA is non-USD as all corporate expenses are USD ~55% of Interest is in USD ----- Impact From +1% Appreciation of USD ----- ($35M) (0.8% of FY Revenue) The company is well hedged from a transactional standpoint as revenue and expense are matched in our local markets – main exposure is currency translation Revenue Adj. EBITDA Free Cash Flow ($7M) (0.9% of FY Adj. EBITDA) ($4M) (4.0% of FY FCF)
2018 guidance

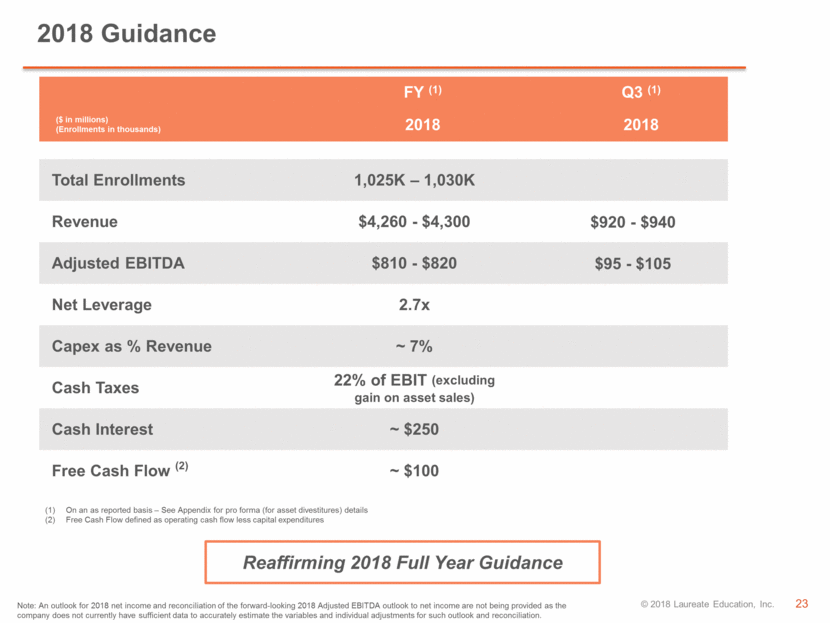
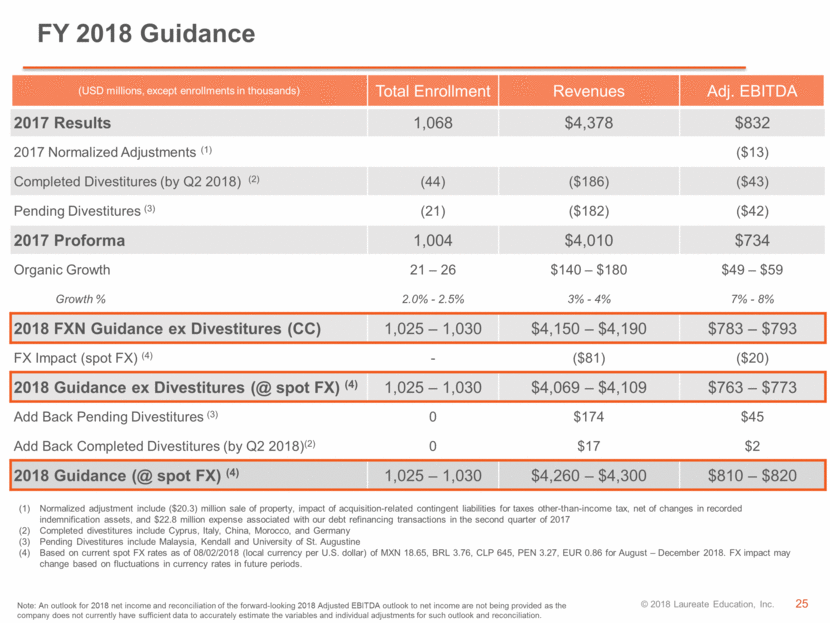
FY (1) Q3 (1) ($ in millions) (Enrollments in thousands) 2018 2018 Total Enrollments 1,025K – 1,030K Revenue $4,260 - $4,300 $920 - $940 Adjusted EBITDA $810 - $820 $95 - $105 Net Leverage 2.7x Capex as % Revenue ~ 7% Cash Taxes 22% of EBIT (excluding gain on asset sales) Cash Interest ~ $250 Free Cash Flow (2) ~ $100 2018 Guidance Reaffirming 2018 Full Year Guidance On an as reported basis – See Appendix for pro forma (for asset divestitures) details Free Cash Flow defined as operating cash flow less capital expenditures Note: An outlook for 2018 net income and reconciliation of the forward-looking 2018 Adjusted EBITDA outlook to net income are not being provided as the company does not currently have sufficient data to accurately estimate the variables and individual adjustments for such outlook and reconciliation.
Appendix
FY 2018 Guidance (USD millions, except enrollments in thousands) Total Enrollment Revenues Adj. EBITDA 2017 Results 1,068 $4,378 $832 2017 Normalized Adjustments (1) ($13) Completed Divestitures (by Q2 2018) (2) (44) ($186) ($43) Pending Divestitures (3) (21) ($182) ($42) 2017 Proforma 1,004 $4,010 $734 Organic Growth 21 – 26 $140 – $180 $49 – $59 Growth % 2.0% - 2.5% 3% - 4% 7% - 8% 2018 FXN Guidance ex Divestitures (CC) 1,025 – 1,030 $4,150 – $4,190 $783 – $793 FX Impact (spot FX) (4) - ($81) ($20) 2018 Guidance ex Divestitures (@ spot FX) (4) 1,025 – 1,030 $4,069 – $4,109 $763 – $773 Add Back Pending Divestitures (3) 0 $174 $45 Add Back Completed Divestitures (by Q2 2018)(2) 0 $17 $2 2018 Guidance (@ spot FX) (4) 1,025 – 1,030 $4,260 – $4,300 $810 – $820 Normalized adjustment include ($20.3) million sale of property, impact of acquisition-related contingent liabilities for taxes other-than-income tax, net of changes in recorded indemnification assets, and $22.8 million expense associated with our debt refinancing transactions in the second quarter of 2017 Completed divestitures include Cyprus, Italy, China, Morocco, and Germany Pending Divestitures include Malaysia, Kendall and University of St. Augustine Based on current spot FX rates as of 08/02/2018 (local currency per U.S. dollar) of MXN 18.65, BRL 3.76, CLP 645, PEN 3.27, EUR 0.86 for August – December 2018. FX impact may change based on fluctuations in currency rates in future periods. Note: An outlook for 2018 net income and reconciliation of the forward-looking 2018 Adjusted EBITDA outlook to net income are not being provided as the company does not currently have sufficient data to accurately estimate the variables and individual adjustments for such outlook and reconciliation.
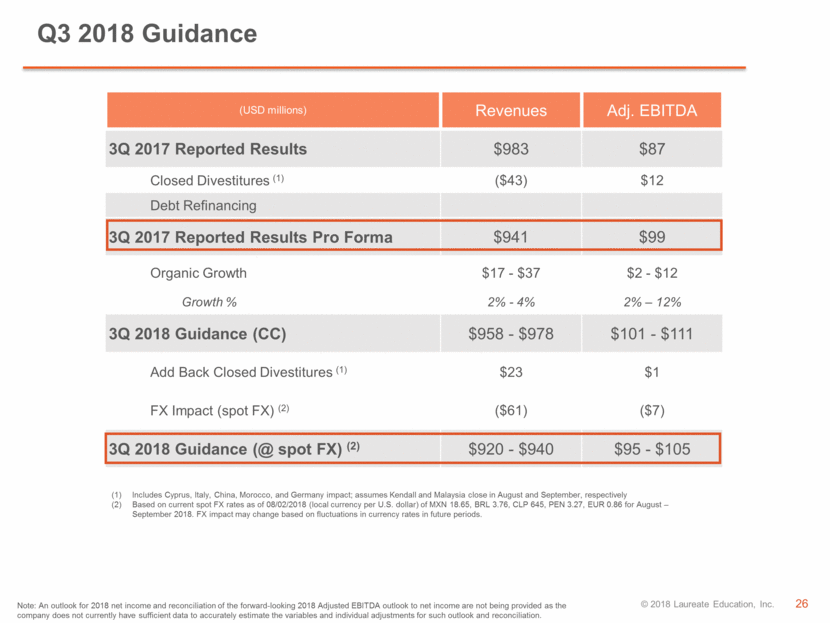
Q3 2018 Guidance (USD millions) Revenues Adj. EBITDA 3Q 2017 Reported Results $983 $87 Closed Divestitures (1) ($43) $12 Debt Refinancing 3Q 2017 Reported Results Pro Forma $941 $99 Organic Growth $17 - $37 $2 - $12 Growth % 2% - 4% 2% – 12% 3Q 2018 Guidance (CC) $958 - $978 $101 - $111 Add Back Closed Divestitures (1) $23 $1 FX Impact (spot FX) (2) ($61) ($7) 3Q 2018 Guidance (@ spot FX) (2) $920 - $940 $95 - $105 Includes Cyprus, Italy, China, Morocco, and Germany impact; assumes Kendall and Malaysia close in August and September, respectively Based on current spot FX rates as of 08/02/2018 (local currency per U.S. dollar) of MXN 18.65, BRL 3.76, CLP 645, PEN 3.27, EUR 0.86 for August – September 2018. FX impact may change based on fluctuations in currency rates in future periods. Note: An outlook for 2018 net income and reconciliation of the forward-looking 2018 Adjusted EBITDA outlook to net income are not being provided as the company does not currently have sufficient data to accurately estimate the variables and individual adjustments for such outlook and reconciliation.
Other Information

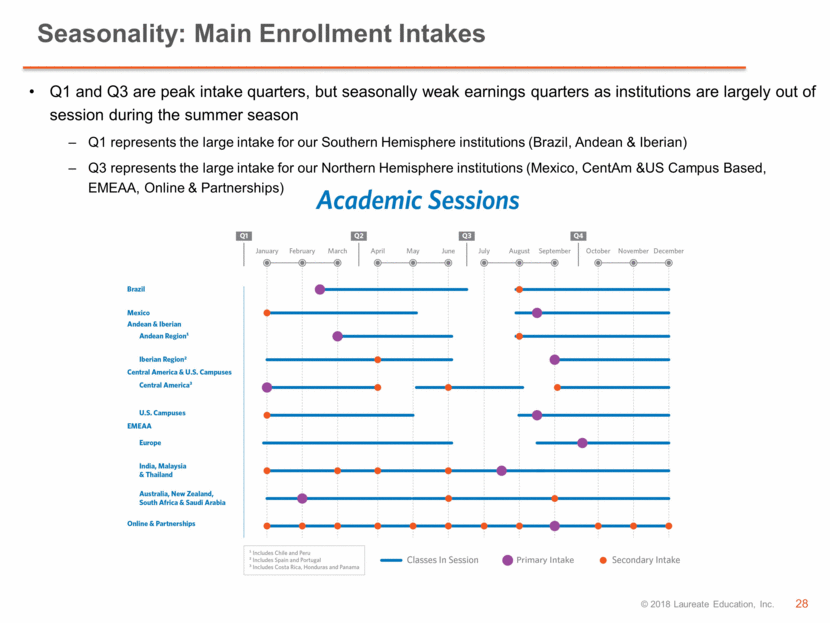
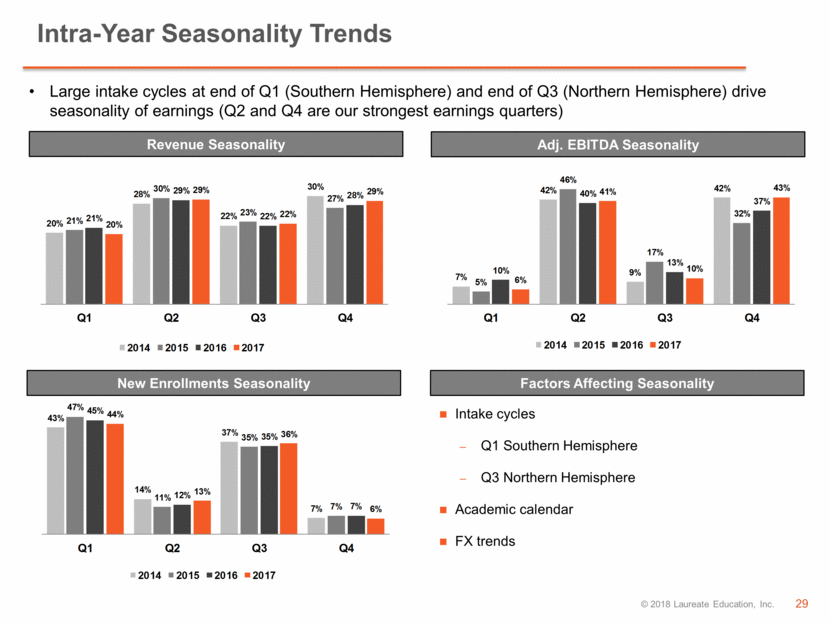
Q1 and Q3 are peak intake quarters, but seasonally weak earnings quarters as institutions are largely out of session during the summer season Q1 represents the large intake for our Southern Hemisphere institutions (Brazil, Andean & Iberian) Q3 represents the large intake for our Northern Hemisphere institutions (Mexico, CentAm &US Campus Based, EMEAA, Online & Partnerships) Seasonality: Main Enrollment Intakes
Intra-Year Seasonality Trends Large intake cycles at end of Q1 (Southern Hemisphere) and end of Q3 (Northern Hemisphere) drive seasonality of earnings (Q2 and Q4 are our strongest earnings quarters) Revenue Seasonality Adj. EBITDA Seasonality New Enrollments Seasonality Factors Affecting Seasonality Intake cycles Q1 Southern Hemisphere Q3 Northern Hemisphere Academic calendar FX trends 43% 14% 37% 7% 47% 11% 35% 7% 45% 12% 35% 7% 44% 13% 36% 6% Q1 Q2 Q3 Q4 2014 2015 2016 2017 7% 42% 9% 42% 5% 46% 17% 32% 10% 40% 13% 37% 6% 41% 10% 43% Q1 Q2 Q3 Q4 2014 2015 2016 2017 20% 28% 22% 30% 21% 30% 23% 27% 21% 29% 22% 28% 20% 29% 22% 29% Q1 Q2 Q3 Q4 2014 2015 2016 2017
Financial Tables

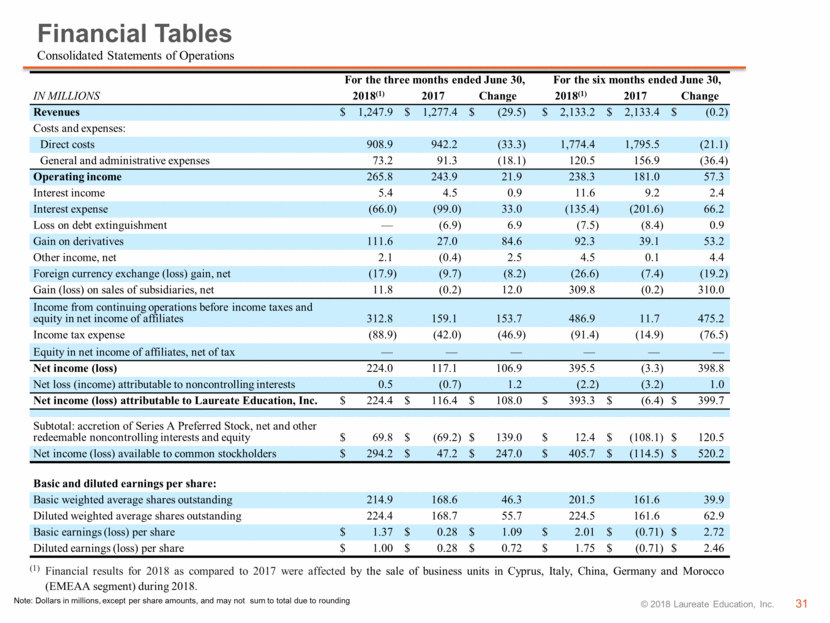
Financial Tables Consolidated Statements of Operations Note: Dollars in millions, except per share amounts, and may not sum to total due to rounding For the three months ended June 30, For the three months ended June 30, For the six months ended June 30, For the six months ended June 30, IN MILLIONS 2018(1) 2018(1) 2017 2017 Change Change 2018(1) 2018(1) 2017 2017 Change Change Revenues $ 1,247.9 $ 1,277.4 $ (29.5 ) $ 2,133.2 $ 2,133.4 $ (0.2 ) Costs and expenses: Direct costs 908.9 942.2 (33.3 ) 1,774.4 1,795.5 (21.1 ) General and administrative expenses 73.2 91.3 (18.1 ) 120.5 156.9 (36.4 ) Operating income 265.8 243.9 21.9 238.3 181.0 57.3 Interest income 5.4 4.5 0.9 11.6 9.2 2.4 Interest expense (66.0 ) (99.0 ) 33.0 (135.4 ) (201.6 ) 66.2 Loss on debt extinguishment — (6.9 ) 6.9 (7.5 ) (8.4 ) 0.9 Gain on derivatives 111.6 27.0 84.6 92.3 39.1 53.2 Other income, net 2.1 (0.4 ) 2.5 4.5 0.1 4.4 Foreign currency exchange (loss) gain, net (17.9 ) (9.7 ) (8.2 ) (26.6 ) (7.4 ) (19.2 ) Gain (loss) on sales of subsidiaries, net 11.8 (0.2 ) 12.0 309.8 (0.2 ) 310.0 Income from continuing operations before income taxes and equity in net income of affiliates 312.8 159.1 153.7 486.9 11.7 475.2 Income tax expense (88.9 ) (42.0 ) (46.9 ) (91.4 ) (14.9 ) (76.5 ) Equity in net income of affiliates, net of tax — — — — — — Net income (loss) 224.0 117.1 106.9 395.5 (3.3 ) 398.8 Net loss (income) attributable to noncontrolling interests 0.5 (0.7 ) 1.2 (2.2 ) (3.2 ) 1.0 Net income (loss) attributable to Laureate Education, Inc. $ 224.4 $ 116.4 $ 108.0 $ 393.3 $ (6.4 ) $ 399.7 Subtotal: accretion of Series A Preferred Stock, net and other redeemable noncontrolling interests and equity $ 69.8 $ (69.2 ) $ 139.0 $ 12.4 $ (108.1 ) $ 120.5 Net income (loss) available to common stockholders $ 294.2 $ 47.2 $ 247.0 $ 405.7 $ (114.5 ) $ 520.2 Basic and diluted earnings per share: Basic weighted average shares outstanding 214.9 168.6 46.3 201.5 161.6 39.9 Diluted weighted average shares outstanding 224.4 168.7 55.7 224.5 161.6 62.9 Basic earnings (loss) per share $ 1.37 $ 0.28 $ 1.09 $ 2.01 $ (0.71 ) $ 2.72 Diluted earnings (loss) per share $ 1.00 $ 0.28 $ 0.72 $ 1.75 $ (0.71 ) $ 2.46 (1) Financial results for 2018 as compared to 2017 were affected by the sale of business units in Cyprus, Italy, China, Germany and Morocco (EMEAA segment) during 2018.
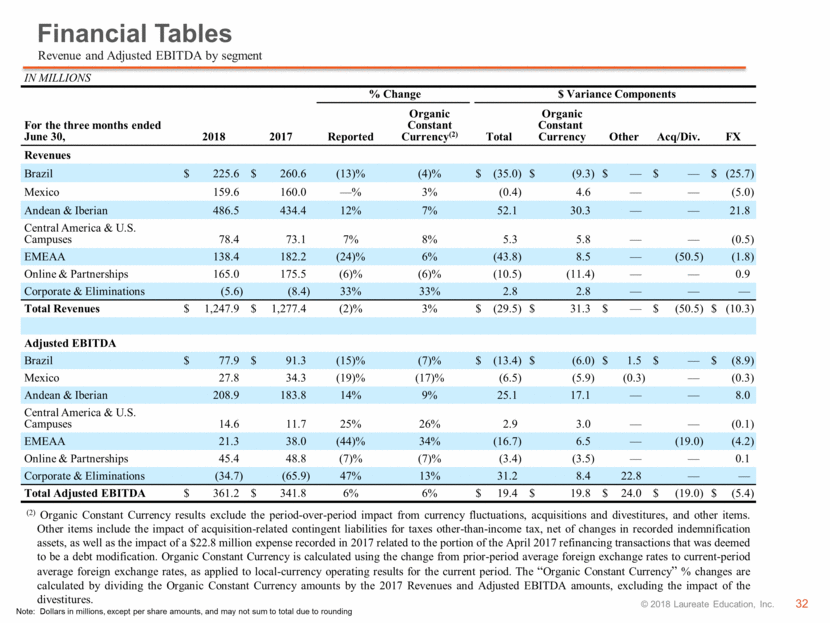
Financial Tables Note: Dollars in millions, except per share amounts, and may not sum to total due to rounding Revenue and Adjusted EBITDA by segment IN MILLIONS % Change $ Variance Components $ Variance Components For the three months ended June 30, 2018 2018 2017 2017 Reported Organic Constant Currency(2) Total Total Organic Constant Currency Organic Constant Currency Other Other Acq/Div. Acq/Div. FX FX Revenues Brazil $ 225.6 $ 260.6 (13)% (4)% $ (35.0 ) $ (9.3 ) $ — $ — $ (25.7 ) Mexico 159.6 160.0 —% 3% (0.4 ) 4.6 — — (5.0 ) Andean & Iberian 486.5 434.4 12% 7% 52.1 30.3 — — 21.8 Central America & U.S. Campuses 78.4 73.1 7% 8% 5.3 5.8 — — (0.5 ) EMEAA 138.4 182.2 (24)% 6% (43.8 ) 8.5 — (50.5 ) (1.8 ) Online & Partnerships 165.0 175.5 (6)% (6)% (10.5 ) (11.4 ) — — 0.9 Corporate & Eliminations (5.6 ) (8.4 ) 33% 33% 2.8 2.8 — — — Total Revenues $ 1,247.9 $ 1,277.4 (2)% 3% $ (29.5 ) $ 31.3 $ — $ (50.5 ) $ (10.3 ) Adjusted EBITDA Brazil $ 77.9 $ 91.3 (15)% (7)% $ (13.4 ) $ (6.0 ) $ 1.5 $ — $ (8.9 ) Mexico 27.8 34.3 (19)% (17)% (6.5 ) (5.9 ) (0.3 ) — (0.3 ) Andean & Iberian 208.9 183.8 14% 9% 25.1 17.1 — — 8.0 Central America & U.S. Campuses 14.6 11.7 25% 26% 2.9 3.0 — — (0.1 ) EMEAA 21.3 38.0 (44)% 34% (16.7 ) 6.5 — (19.0 ) (4.2 ) Online & Partnerships 45.4 48.8 (7)% (7)% (3.4 ) (3.5 ) — — 0.1 Corporate & Eliminations (34.7 ) (65.9 ) 47% 13% 31.2 8.4 22.8 — — Total Adjusted EBITDA $ 361.2 $ 341.8 6% 6% $ 19.4 $ 19.8 $ 24.0 $ (19.0 ) $ (5.4 ) (2) Organic Constant Currency results exclude the period-over-period impact from currency fluctuations, acquisitions and divestitures, and other items. Other items include the impact of acquisition-related contingent liabilities for taxes other-than-income tax, net of changes in recorded indemnification assets, as well as the impact of a $22.8 million expense recorded in 2017 related to the portion of the April 2017 refinancing transactions that was deemed to be a debt modification. Organic Constant Currency is calculated using the change from prior-period average foreign exchange rates to current-period average foreign exchange rates, as applied to local-currency operating results for the current period. The “Organic Constant Currency” % changes are calculated by dividing the Organic Constant Currency amounts by the 2017 Revenues and Adjusted EBITDA amounts, excluding the impact of the divestitures.
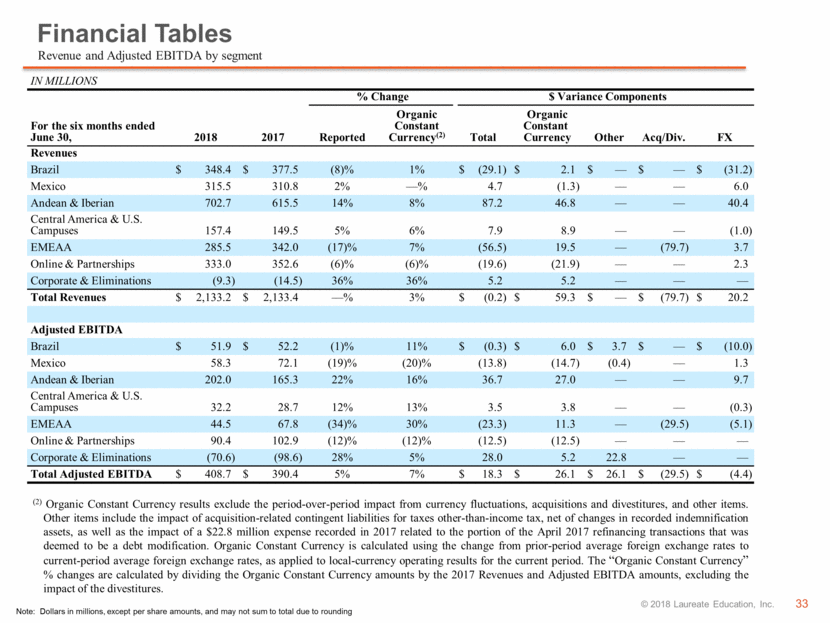
Financial Tables Note: Dollars in millions, except per share amounts, and may not sum to total due to rounding Revenue and Adjusted EBITDA by segment IN MILLIONS % Change $ Variance Components $ Variance Components For the six months ended June 30, 2018 2018 2017 2017 Reported Organic Constant Currency(2) Total Total Organic Constant Currency Organic Constant Currency Other Other Acq/Div. Acq/Div. FX FX Revenues Brazil $ 348.4 $ 377.5 (8)% 1% $ (29.1 ) $ 2.1 $ — $ — $ (31.2 ) Mexico 315.5 310.8 2% —% 4.7 (1.3 ) — — 6.0 Andean & Iberian 702.7 615.5 14% 8% 87.2 46.8 — — 40.4 Central America & U.S. Campuses 157.4 149.5 5% 6% 7.9 8.9 — — (1.0 ) EMEAA 285.5 342.0 (17)% 7% (56.5 ) 19.5 — (79.7 ) 3.7 Online & Partnerships 333.0 352.6 (6)% (6)% (19.6 ) (21.9 ) — — 2.3 Corporate & Eliminations (9.3 ) (14.5 ) 36% 36% 5.2 5.2 — — — Total Revenues $ 2,133.2 $ 2,133.4 —% 3% $ (0.2 ) $ 59.3 $ — $ (79.7 ) $ 20.2 Adjusted EBITDA Brazil $ 51.9 $ 52.2 (1)% 11% $ (0.3 ) $ 6.0 $ 3.7 $ — $ (10.0 ) Mexico 58.3 72.1 (19)% (20)% (13.8 ) (14.7 ) (0.4 ) — 1.3 Andean & Iberian 202.0 165.3 22% 16% 36.7 27.0 — — 9.7 Central America & U.S. Campuses 32.2 28.7 12% 13% 3.5 3.8 — — (0.3 ) EMEAA 44.5 67.8 (34)% 30% (23.3 ) 11.3 — (29.5 ) (5.1 ) Online & Partnerships 90.4 102.9 (12)% (12)% (12.5 ) (12.5 ) — — — Corporate & Eliminations (70.6 ) (98.6 ) 28% 5% 28.0 5.2 22.8 — — Total Adjusted EBITDA $ 408.7 $ 390.4 5% 7% $ 18.3 $ 26.1 $ 26.1 $ (29.5 ) $ (4.4 ) (2) Organic Constant Currency results exclude the period-over-period impact from currency fluctuations, acquisitions and divestitures, and other items. Other items include the impact of acquisition-related contingent liabilities for taxes other-than-income tax, net of changes in recorded indemnification assets, as well as the impact of a $22.8 million expense recorded in 2017 related to the portion of the April 2017 refinancing transactions that was deemed to be a debt modification. Organic Constant Currency is calculated using the change from prior-period average foreign exchange rates to current-period average foreign exchange rates, as applied to local-currency operating results for the current period. The “Organic Constant Currency” % changes are calculated by dividing the Organic Constant Currency amounts by the 2017 Revenues and Adjusted EBITDA amounts, excluding the impact of the divestitures.
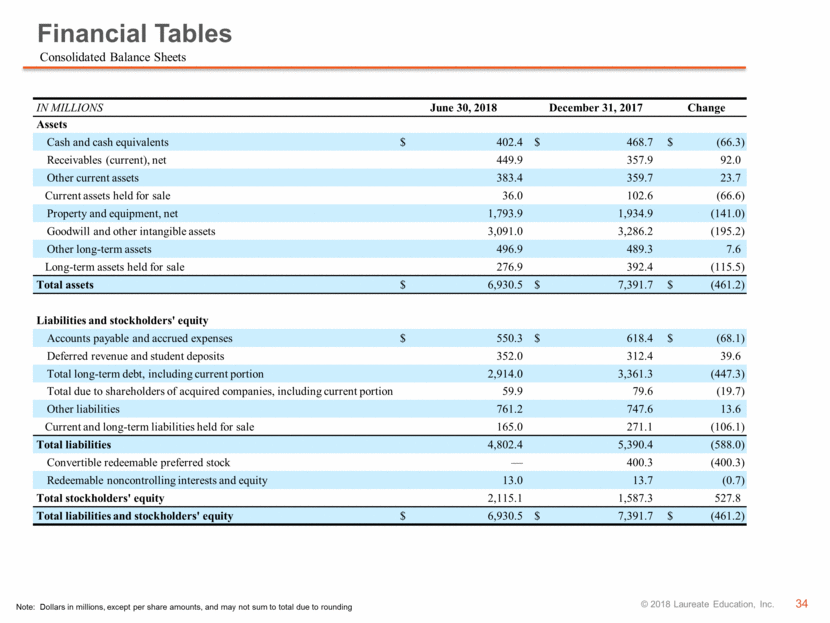
Financial Tables Note: Dollars in millions, except per share amounts, and may not sum to total due to rounding Consolidated Balance Sheets IN MILLIONS June 30, 2018 June 30, 2018 December 31, 2017 December 31, 2017 Change Change Assets Cash and cash equivalents $ 402.4 $ 468.7 $ (66.3 ) Receivables (current), net 449.9 357.9 92.0 Other current assets 383.4 359.7 23.7 Current assets held for sale 36.0 102.6 (66.6 ) Property and equipment, net 1,793.9 1,934.9 (141.0 ) Goodwill and other intangible assets 3,091.0 3,286.2 (195.2 ) Other long-term assets 496.9 489.3 7.6 Long-term assets held for sale 276.9 392.4 (115.5 ) Total assets $ 6,930.5 $ 7,391.7 $ (461.2 ) Liabilities and stockholders' equity Accounts payable and accrued expenses $ 550.3 $ 618.4 $ (68.1 ) Deferred revenue and student deposits 352.0 312.4 39.6 Total long-term debt, including current portion 2,914.0 3,361.3 (447.3 ) Total due to shareholders of acquired companies, including current portion 59.9 79.6 (19.7 ) Other liabilities 761.2 747.6 13.6 Current and long-term liabilities held for sale 165.0 271.1 (106.1 ) Total liabilities 4,802.4 5,390.4 (588.0 ) Convertible redeemable preferred stock — 400.3 (400.3 ) Redeemable noncontrolling interests and equity 13.0 13.7 (0.7 ) Total stockholders' equity 2,115.1 1,587.3 527.8 Total liabilities and stockholders' equity $ 6,930.5 $ 7,391.7 $ (461.2 )
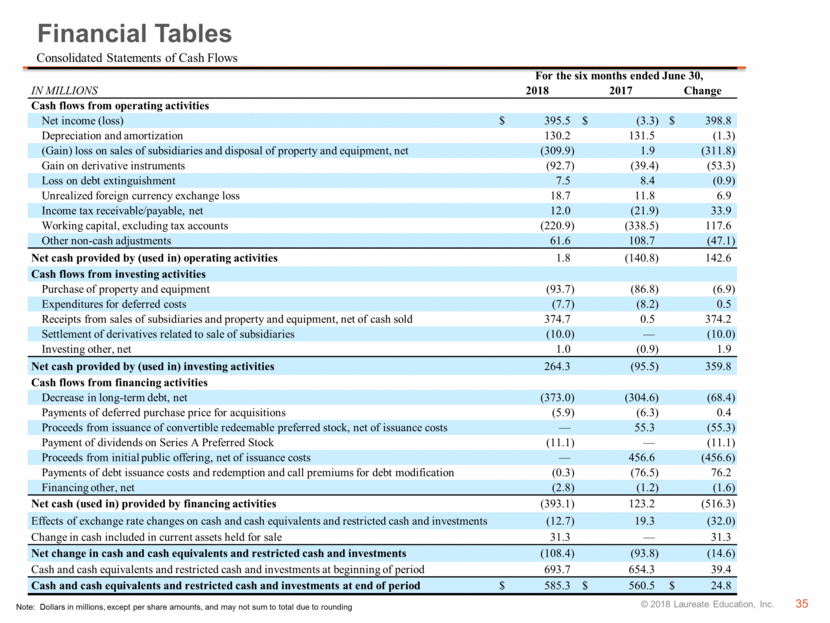
Financial Tables Note: Dollars in millions, except per share amounts, and may not sum to total due to rounding Consolidated Statements of Cash Flows For the six months ended June 30, For the six months ended June 30, IN MILLIONS 2018 2018 2017 2017 Change Change Cash flows from operating activities Net income (loss) $ 395.5 $ (3.3 ) $ 398.8 Depreciation and amortization 130.2 131.5 (1.3 ) (Gain) loss on sales of subsidiaries and disposal of property and equipment, net (309.9 ) 1.9 (311.8 ) Gain on derivative instruments (92.7 ) (39.4 ) (53.3 ) Loss on debt extinguishment 7.5 8.4 (0.9 ) Unrealized foreign currency exchange loss 18.7 11.8 6.9 Income tax receivable/payable, net 12.0 (21.9 ) 33.9 Working capital, excluding tax accounts (220.9 ) (338.5 ) 117.6 Other non-cash adjustments 61.6 108.7 (47.1 ) Net cash provided by (used in) operating activities 1.8 (140.8 ) 142.6 Cash flows from investing activities Purchase of property and equipment (93.7 ) (86.8 ) (6.9 ) Expenditures for deferred costs (7.7 ) (8.2 ) 0.5 Receipts from sales of subsidiaries and property and equipment, net of cash sold 374.7 0.5 374.2 Settlement of derivatives related to sale of subsidiaries (10.0 ) — (10.0 ) Investing other, net 1.0 (0.9 ) 1.9 Net cash provided by (used in) investing activities 264.3 (95.5 ) 359.8 Cash flows from financing activities Decrease in long-term debt, net (373.0 ) (304.6 ) (68.4 ) Payments of deferred purchase price for acquisitions (5.9 ) (6.3 ) 0.4 Proceeds from issuance of convertible redeemable preferred stock, net of issuance costs — 55.3 (55.3 ) Payment of dividends on Series A Preferred Stock (11.1 ) — (11.1 ) Proceeds from initial public offering, net of issuance costs — 456.6 (456.6 ) Payments of debt issuance costs and redemption and call premiums for debt modification (0.3 ) (76.5 ) 76.2 Financing other, net (2.8 ) (1.2 ) (1.6 ) Net cash (used in) provided by financing activities (393.1 ) 123.2 (516.3 ) Effects of exchange rate changes on cash and cash equivalents and restricted cash and investments (12.7 ) 19.3 (32.0 ) Change in cash included in current assets held for sale 31.3 — 31.3 Net change in cash and cash equivalents and restricted cash and investments (108.4 ) (93.8 ) (14.6 ) Cash and cash equivalents and restricted cash and investments at beginning of period 693.7 654.3 39.4 Cash and cash equivalents and restricted cash and investments at end of period $ 585.3 $ 560.5 $ 24.8
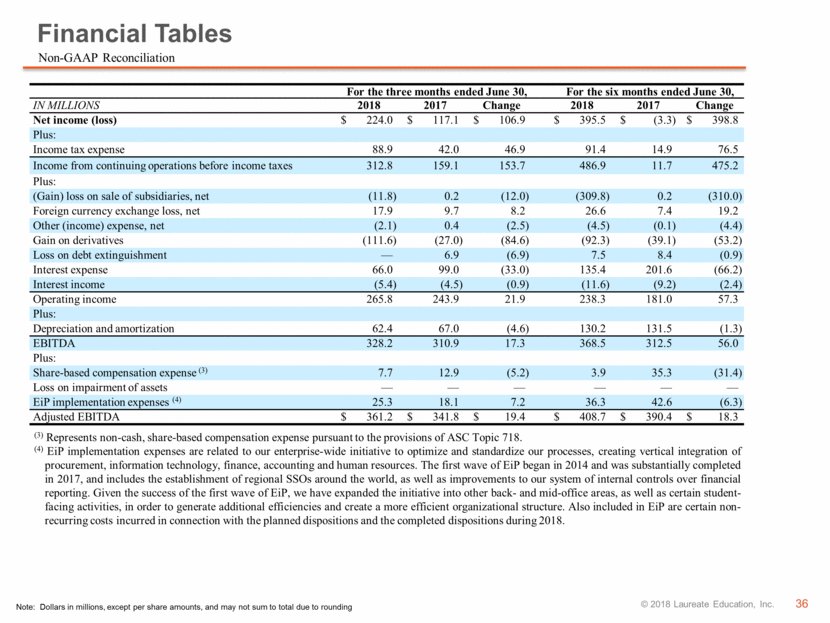
Financial Tables Note: Dollars in millions, except per share amounts, and may not sum to total due to rounding Non-GAAP Reconciliation For the three months ended June 30, For the three months ended June 30, For the six months ended June 30, For the six months ended June 30, IN MILLIONS 2018 2018 2017 2017 Change Change 2018 2018 2017 2017 Change Change Net income (loss) $ 224.0 $ 117.1 $ 106.9 $ 395.5 $ (3.3 ) $ 398.8 Plus: Income tax expense 88.9 42.0 46.9 91.4 14.9 76.5 Income from continuing operations before income taxes 312.8 159.1 153.7 486.9 11.7 475.2 Plus: (Gain) loss on sale of subsidiaries, net (11.8 ) 0.2 (12.0 ) (309.8 ) 0.2 (310.0 ) Foreign currency exchange loss, net 17.9 9.7 8.2 26.6 7.4 19.2 Other (income) expense, net (2.1 ) 0.4 (2.5 ) (4.5 ) (0.1 ) (4.4 ) Gain on derivatives (111.6 ) (27.0 ) (84.6 ) (92.3 ) (39.1 ) (53.2 ) Loss on debt extinguishment — 6.9 (6.9 ) 7.5 8.4 (0.9 ) Interest expense 66.0 99.0 (33.0 ) 135.4 201.6 (66.2 ) Interest income (5.4 ) (4.5 ) (0.9 ) (11.6 ) (9.2 ) (2.4 ) Operating income 265.8 243.9 21.9 238.3 181.0 57.3 Plus: Depreciation and amortization 62.4 67.0 (4.6 ) 130.2 131.5 (1.3 ) EBITDA 328.2 310.9 17.3 368.5 312.5 56.0 Plus: Share-based compensation expense (3) 7.7 12.9 (5.2 ) 3.9 35.3 (31.4 ) Loss on impairment of assets — — — — — — EiP implementation expenses (4) 25.3 18.1 7.2 36.3 42.6 (6.3 ) Adjusted EBITDA $ 361.2 $ 341.8 $ 19.4 $ 408.7 $ 390.4 $ 18.3 (3) Represents non-cash, share-based compensation expense pursuant to the provisions of ASC Topic 718. (4) EiP implementation expenses are related to our enterprise-wide initiative to optimize and standardize our processes, creating vertical integration of procurement, information technology, finance, accounting and human resources. The first wave of EiP began in 2014 and was substantially completed in 2017, and includes the establishment of regional SSOs around the world, as well as improvements to our system of internal controls over financial reporting. Given the success of the first wave of EiP, we have expanded the initiative into other back- and mid-office areas, as well as certain student-facing activities, in order to generate additional efficiencies and create a more efficient organizational structure. Also included in EiP are certain non-recurring costs incurred in connection with the planned dispositions and the completed dispositions during 2018.
[LOGO]