Attached files
| file | filename |
|---|---|
| 8-K - WSFS FINANCIAL CORP | e18295_wsfs-8kannounce.htm |
| EX-99.2 - WSFS FINANCIAL CORP | e18295_ex99-2.htm |

Creating the Largest, Premier, Locally - Headquartered Community Bank for the Greater Delaware Valley Concurrently executing a technology transformation to secure a competitive advantage and meet fast - changing Customer needs August 8, 2018

This presentation contains estimates, predictions, opinions, projections and other “forward - looking statements” as that phrase i s defined in the Private Securities Litigation Reform Act of 1995. Forward - looking statements include, without limitation, statements relatin g to the impact WSFS Financial Corporation (“WSFS”) expects its proposed acquisition of Beneficial to have on the combined entity’s operation s, financial condition, and financial results, and WSFS’s expectations about its ability to successfully integrate the combined businesses an d the amount of cost savings and overall operational efficiencies WSFS expects to realize as a result of the proposed acquisition. The forwa rd - looking statements also include predications or expectations of future business or financial performance as well as goals and objecti ves for future operations, financial and business trends, business prospects, and management's outlook or expectations for earnings, revenue s, expenses, capital levels, liquidity levels, asset quality or other future financial or business performance, strategies or expectations . The words “believe,” “expect,” “anticipate,” “plan,” “estimate,” “target,” “project” and similar expressions, among others, generally identify for war d - looking statements. Such forward - looking statements are based on various assumptions (many of which are beyond the control of WSFS and Beneficial Bancorp, Inc. (“Beneficial” or “BNCL”)) and are subject to risks and uncertainties (which change over time) and ot her factors which could cause actual results to differ materially from those currently anticipated. Such risks and uncertainties include, but a re not limited to, the possibility that the proposed acquisition does not close when expected or at all because required regulatory, stockholder or oth er approvals and other conditions to closing are not received or satisfied on a timely basis or at all, the failure to close for any other re ason, changes in WSFS’s share price before closing, that the businesses of WSFS and Beneficial will not be integrated successfully, that the c ost savings and any synergies from the proposed acquisition may not be fully realized or may take longer to realize than expected, disruption fro m t he proposed acquisition making it more difficult to maintain relationships with employees, customers or other parties with whom WSFS or B ene ficial have business relationships, diversion of management time on merger - related issues, risks relating to the potential dilutive effect o f shares of WSFS common stock to be issued in the transaction, the reaction to the transaction of the companies’ customers, employees and coun ter parties and other factors, many of which are beyond the control of WSFS and Beneficial. We refer you to the “Risk Factors” and “Mana gem ent’s Discussion and Analysis of Financial Condition and Results of Operations” sections of WSFS’s Annual Report on Form 10 - K for the year ended December 31, 2017, the Annual Report on Form 10 - K filed by Beneficial for the year ended December 31, 2017 and any updates to th ose risk factors set forth in WSFS’s and Beneficial’s Quarterly Reports on Form 10 - Q, Current Reports on Form 8 - K and other filings, whic h have been filed by WSFS and Beneficial with the U.S. Securities and Exchange Commission (the “SEC”) and are available on the SEC’s webs ite at www.sec.gov. All forward - looking statements, expressed or implied, included in this presentation are expressly qualified in the ir entirety by the cautionary statements contained or referred to herein. The actual results or developments anticipated may not be realized or , even if substantially realized, they may not have the expected consequences to or effects on WSFS, Beneficial or their respective bus ine sses or operations. We caution readers not to place undue reliance on any such forward - looking statements, which speak only as of the da te on which they are made. Neither WSFS nor Beneficial undertakes any obligation, and specifically declines any obligation, to revi se or update any forward - looking statements, whether as a result of new information, future developments or otherwise. Forward - Looking Statements 2
Important Additional Information will be Filed with the SEC This presentation does not constitute an offer to sell or the solicitation of an offer to buy any securities or a solicitatio n o f any vote or approval with respect to the proposed acquisition by WSFS of Beneficial. No offer of securities shall be made except by means of a prospectus meeting the requirements of the Securities Act of 1933, as amended, and no offer to sell or solicitation of an offer to buy s hal l be made in any jurisdiction in which such offer, solicitation or sale would be unlawful. In connection with the proposed transaction, WSFS will file with the SEC a Registration Statement on Form S - 4 that will include a joint proxy statement of WSFS and Beneficial and a prospectus of WSFS (the “Joint Proxy/Prospectus”), and each of WSFS and Beneficial may fi le with the SEC other relevant documents concerning the proposed transaction. The definitive Joint Proxy /Prospectus will be mailed to st ock holders of WSFS and Beneficial. STOCKHOLDERS ARE URGED TO READ THE REGISTRATION STATEMENT AND THE JOINT PROXY/PROSPECTUS REGARDING THE TRANSACTION CAREFULLY AND IN THEIR ENTIRETY WHEN THEY BECOME AVAILABLE AND ANY OTHER RELEVANT DOCUMENTS FILED WITH THE SEC BY WSFS AND BENEFICIAL, AS WELL AS ANY AMENDMENTS OR SUPPLEMENTS TO THOSE DOCUMENTS, BECAUSE THEY WILL CONTAIN IMPORTANT INFORMATION ABOUT THE PROPOSED TRANSACTION. Free copies of the Registration Statement and the Joint Proxy/Prospectus, as well as other filings containing information abo ut WSFS and Beneficial, may be obtained at the SEC’s website (http://www.sec.gov) when they are filed. You will also be able to obtain th ese documents, when they are filed, free of charge, by directing a request to WSFS Financial Corporation, WSFS Bank Center, 500 Delaware Ave nue , Wilmington, Delaware 19801 or by directing a request to Beneficial Bancorp, Inc., Beneficial Bank Place, 1818 Market Street, Phi ladelphia, Pennsylvania 19103 . Participants in the Solicitation WSFS, Beneficial and certain of their respective directors, executive officers and employees may be deemed to be participants in the solicitation of proxies from the stockholders of WSFS or Beneficial in respect of the proposed transaction. Information about WS FS’s directors and executive officers is available in its proxy statement for its 2018 annual meeting of stockholders, which was filed with the SEC on March 23, 2018, and information regarding Beneficial’s directors and executive officers is available in its proxy statement for its 20 18 annual meeting of stockholders, which was filed with the SEC on March 8, 2018. Information regarding the persons who may, under the rules of th e SEC, be deemed participants in the proxy solicitation and a description of their direct and indirect interests, by security holdings or otherwise, will be contained in the Joint Proxy/Prospectus and other relevant materials to be filed with the SEC when they become available. Fr ee copies of this document may be obtained as described in the preceding paragraph. 3 Additional Information & Participants in the solicitation
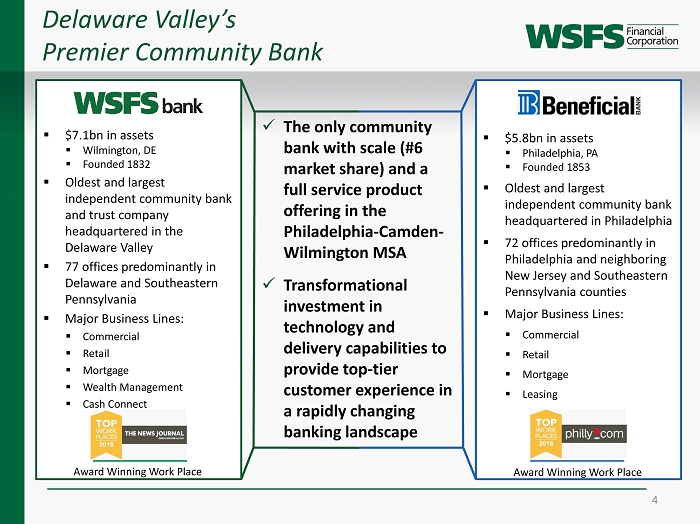
x The only community bank with scale (#6 market share) and a full service product offering in the Philadelphia - Camden - Wilmington MSA x Transformational investment in technology and delivery capabilities to provide top - tier customer experience in a rapidly changing banking landscape Delaware Valley’s Premier Community Bank 4 ▪ $7.1bn in assets ▪ Wilmington, DE ▪ Founded 1832 ▪ Oldest and largest independent community bank and trust company headquartered in the Delaware Valley ▪ 77 offices predominantly in Delaware and Southeastern Pennsylvania ▪ Major Business Lines: ▪ Commercial ▪ Retail ▪ Mortgage ▪ Wealth Management ▪ Cash Connect Award Winning Work Place ▪ $5.8bn in assets ▪ Philadelphia, PA ▪ Founded 1853 ▪ Oldest and largest independent community bank headquartered in Philadelphia ▪ 72 offices predominantly in Philadelphia and neighboring New Jersey and Southeastern Pennsylvania counties ▪ Major Business Lines: ▪ Commercial ▪ Retail ▪ Mortgage ▪ Leasing Award Winning Work Place

Compelling Market Opportunity 5 At $13 billion in assets, the combined bank fills a long - standing service gap in the Delaware Valley market between larger regional / national banks and smaller community banks ▪ 5 th largest depository MSA in the U.S. ▪ Over 2.5x the market share of the next largest local community bank ▪ WSFS’ 5 - year compound annual deposit growth rate of 9.5% vs. an annual average of 3.5% for the MSA ▪ WSFS is filling the service gap left by the acquisitions of former iconic local banks by larger out - of - market banks Philadelphia-Camden-Wilmington Deposit Market Share Institution Total Deposits ($mm) Market Share (%) 1 Wells Fargo Bank, NA 31,664 20.02 2 TD Bank, NA 29,164 18.44 3 PNC Bank, NA 17,984 11.37 4 Citizens Bank 15,857 10.03 5 Bank of America, NA 14,240 9.00 Pro Forma WSFS / BNCL 8,012 5.07 6 M&T Bank 7,800 4.93 7 BB&T 5,075 3.21 8 Wilmington Savings Fund Society, FSB 4,032 2.55 9 Beneficial Bank 3,980 2.52 10The Bryn Mawr Trust Company 3,089 1.95 11Univest Bank and Trust Co. 2,961 1.87 12Fulton Bank 2,717 1.72 13KeyBank NA 2,129 1.35 14Santander Bank, N.A. 2,091 1.32 15Firstrust Savings Bank 2,054 1.30 16Republic Bank 1,776 1.12 17Investors Bank 1,523 0.96 18Customers Bank 1,437 0.91 19Penn Community Bank 1,370 0.87 20DNB First, NA 867 0.55 Total Institutions in Market 158,167 Market Position Former Iconic Delaware Valley Banks Market share data as of June 30, 2017; Source: FDIC Note: Market Share data excludes brokered deposits and non - traditional banks (e.g. credit card companies)

Leading Market Position in Demographically - Robust Region 6 ▪ 3rd largest metro in the Northeast – $432 billion regional economy ▪ 5th largest depository MSA in the U.S. ▪ 8th largest MSA population in the U.S. ▪ Median household income of $71k versus national median of $61k ▪ 200,000+ operating businesses ▪ 4th largest university population among all U.S. metro areas ▪ Major transportation hub, conveniently located along I - 95 corridor, Amtrak’s Northeast Regional Line, and home to the Philadelphia International Airport New Jersey 25 Miles Sources: S&P Global Market Intelligence, Select Greater Philadelphia Council

Transaction Summary Negotiated Deal Combines Two Strong Community Banks 7 Transaction Value & Consideration Pro Forma Ownership Headquarters Senior Management Expected Closing (a) Based on WSFS closing price as of August 7, 2018 of $55.35 (b) Based on consensus analyst estimates ▪ Per share: $19.61, Aggregate: $1.46 billion (a) ▪ $2.93 of cash and .3013 WSFS shares ▪ Approximately 85% WSFS Common Stock, 15% Cash ▪ BNCL options will be cashed out ▪ P/TBV: 171.7%, P/2018E (b) : 35.9x, Core Deposit Premium: 15.4% ▪ ~60% WSFS shareholders / ~40% BNCL shareholders ▪ Q1 2019, subject to shareholder and regulatory approvals ▪ Wilmington, DE, with a significant presence in Philadelphia, PA ▪ Mark A. Turner, Executive Chairman ▪ Rodger Levenson, President and CEO ▪ Gerald P. Cuddy, Vice Chairman of WSFS Bank ▪ Entire BNCL senior team (8) under contract through mid - 2020 Board of Directors ▪ Gerard P. Cuddy and 2 additional BNCL Directors to join WSFS Board
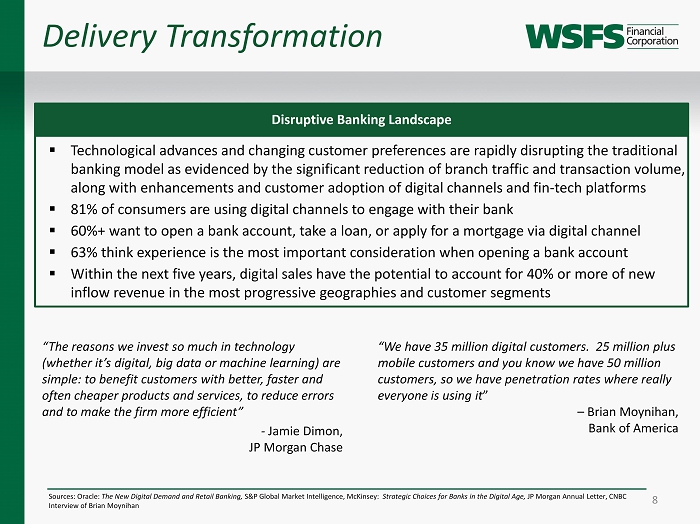
▪ Technological advances and changing customer preferences are rapidly disrupting the traditional banking model as evidenced by the significant reduction of branch traffic and transaction volume, along with enhancements and customer adoption of digital channels and fin - tech platforms ▪ 81% of consumers are using digital channels to engage with their bank ▪ 60%+ want to open a bank account, take a loan, or apply for a mortgage via digital channel ▪ 63% think experience is the most important consideration when opening a bank account ▪ Within the next five years, digital sales have the potential to account for 40% or more of new inflow revenue in the most progressive geographies and customer segments Delivery Transformation 8 Disruptive Banking Landscape Sources: Oracle: The New Digital Demand and Retail Banking, S&P Global Market Intelligence, McKinsey: Strategic Choices for Banks in the Digital Age, JP Morgan Annual Letter, CNBC Interview of Brian Moynihan “The reasons we invest so much in technology (whether it’s digital, big data or machine learning) are simple: to benefit customers with better, faster and often cheaper products and services, to reduce errors and to make the firm more efficient” - Jamie Dimon, JP Morgan Chase “We have 35 million digital customers. 25 million plus mobile customers and you know we have 50 million customers, so we have penetration rates where really everyone is using it ” – Brian Moynihan, Bank of America

Delivery Transformation 9 ▪ The combined platform creates an ideal opportunity to evaluate the expanded branch network and scale investment into complementary digital capabilities with the objective of developing a top - tier, highly competitive omni - channel delivery platform ▪ Incremental investment of $32 million over the next 5 years into digital delivery initiatives targeted across four major areas, representing ~3x WSFS’ non - routine annual technology expenses ▪ Investment funded from ~50% of the savings from consolidating ~25% of the combined branch network Customer Experience Leading - edge, proven, customer - focused initiatives to deliver a seamless customer experience ▪ Peer - to - peer payments ▪ Personal financial management ▪ Streamlined account opening Risk Management Enhancing security and privacy for our customers as trust is a top priority ▪ Advanced cyber security ▪ Real - time fraud alerts ▪ Integrated internal control monitoring Next generation platform for an integrated architecture ▪ CRM ▪ Data warehouse ▪ Customer intelligence Data Platform Standardize and digitize processes to reduce cost and improve efficiency ▪ Enterprise document imaging ▪ Back office automation & streamlining ▪ Associate knowledge platform Workflow Automation Integrated Omni - Channel Platform Opportunity for Delivery Transformation

▪ Cost savings from traditional synergies and delivery transformation are phased in at 50%, 90%, and 100% for 2019, 2020, and 2021 Key Model Details 10 Traditional Synergies Merger & Restructuring Costs ▪ $45.6 million annual from non - branch operations and personnel ▪ $10.3 million annual expenses related to BNCL’s 2015 public offering (b) Delivery Transformation ▪ $11.7 million of additional annual cost savings from branch consolidations ▪ 36% from proximity, 64% from branch optimization ▪ 30 net branches consolidated (~25% of combined network) ▪ Incremental $32.0 million technology investment over a 5 year period; ~50% of branch savings ▪ $117 million with an additional $29 million of capitalized expenses, total $146 million ▪ Some of these incremental costs are associated with delivery transformation and technological investments Note: Assumes marginal effective tax rate of 26% and Core Deposit Intangible equal to 1.75% BNCL’s Non - Time Deposits (a) Percentage of BNCL YTD annualized non - interest expense of $143 million (b) Reflects acceleration of certain costs related to BNCL’s full conversion to a public company in 2015 37% (a) 8% (a) Cost Savings Realization Crossing $10bn ▪ $11 million ($10.5 million Durbin related) annual pre - tax earnings loss starting Q3 2020
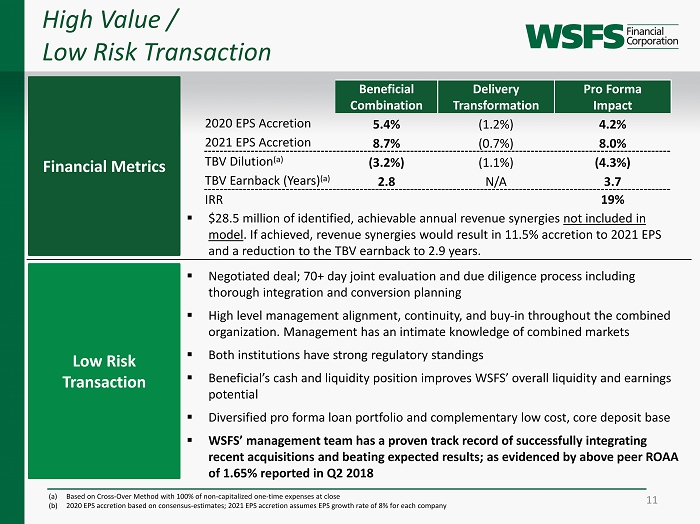
High Value / Low Risk Transaction 11 Financial Metrics Low Risk Transaction ▪ Negotiated deal; 70+ day joint evaluation and due diligence process including thorough integration and conversion planning ▪ High level management alignment, continuity, and buy - in throughout the combined organization. Management has an intimate knowledge of combined markets ▪ Both institutions have strong regulatory standings ▪ Beneficial’s cash and liquidity position improves WSFS’ overall liquidity and earnings potential ▪ Diversified pro forma loan portfolio and complementary low cost, core deposit base ▪ WSFS’ management team has a proven track record of successfully integrating recent acquisitions and beating expected results; as evidenced by above peer ROAA of 1.65% reported in Q2 2018 Beneficial Combination Delivery Transformation Pro Forma Impact 2020 EPS Accretion 5.4% (1.2%) 4.2% 2021 EPS Accretion 8.7% (0.7%) 8.0% TBV Dilution (a) (3.2%) (1.1%) (4.3%) TBV Earnback (Years) (a) 2.8 N/A 3.7 IRR 19% (a) Based on Cross - Over Method with 100% of non - capitalized one - time expenses at close (b) 2020 EPS accretion based on consensus - estimates; 2021 EPS accretion assumes EPS growth rate of 8% for each company ▪ $28.5 million of identified, achievable annual revenue synergies not included in model . If achieved, revenue synergies would result in 11.5% accretion to 2021 EPS and a reduction to the TBV earnback to 2.9 years.

$4.5bn $4.8bn $5.6bn $6.8bn $7.0bn $7.2bn $ - $13bn+ 0.91% 0.95% 1.13% 1.15% 1.19% 1.50% 1.50% + 0.60% 0.80% 1.00% 1.20% 1.40% 1.60% $- $2,000 $4,000 $6,000 $8,000 $10,000 $12,000 $14,000 $16,000 $18,000 2013 2014 2015 2016 2017 2018 Plan 2021 Total Assets Core & Sustainable ROA(a) History of Delivering on Strategic Plan Targets 12 Accelerated significant investments in infrastructure, personnel, and additional lines of business to capitalize on post recession opportunities to expand market share and significantly improve profitability. Accelerating significant investments in integration, technology, and delivery systems to profitably expand market share as the premier community bank in our market and address the changing needs of the banking customer. Strategic merger rationale is in line with WSFS’ proven strategy of accelerating investment spending over the short - term to deliver superior long - term value creation Post Recession Investment 2010 - 2013 Merger / Delivery Transformation 2019 - 2021 (a) Core and Sustainable ROA is a non - GAAP measure that divides (i) net income determined in accordance with GAAP and adjusting it by taking core net income and normalizing for long - term credit costs, non - recurring accretion from purchased credit impaired loans (“PCI”), and a normal tax rate by (ii) aver age assets. See Appendix for GAAP reconciliation. Assets

4.00 14.00 24.00 34.00 44.00 54.00 Delivering Beyond Expectations, Including on M&A 13 WSFS’ management team has a history of delivering superior shareholder value by performing beyond expectations 7 6 5 4 3 2 1 7 6 5 4 3 2 1 Christiana Bank & Trust Company Array Financial / Arrow Land Transfer* First Wyoming Financial Corp Alliance Bancorp Penn Liberty Financial Corp Powdermill Financial Solutions* West Capital Management* NASDAQ Bank CAGR: 11% Total Price Increase: 151% WSFS CAGR: 24% Total Price Increase: 544% Jan 2010 Aug 2018 Note: returns based on stock price appreciation * Non - bank financial acquisition
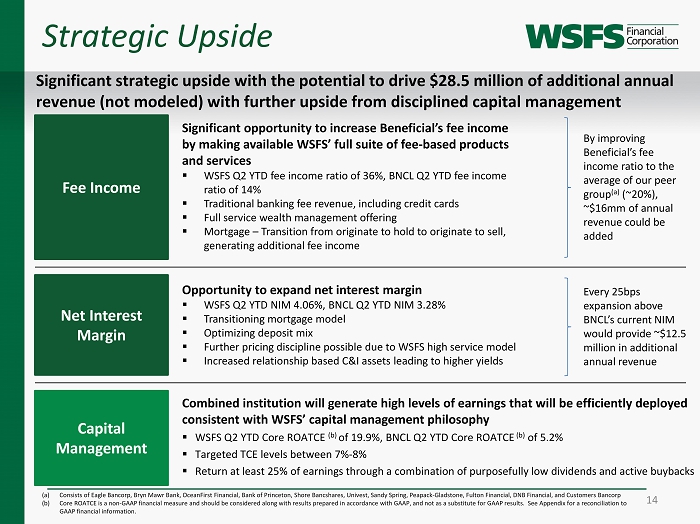
Strategic Upside 14 Significant opportunity to increase Beneficial’s fee income by making available WSFS’ full suite of fee - based products and services ▪ WSFS Q2 YTD fee income ratio of 36%, BNCL Q2 YTD fee income ratio of 14% ▪ Traditional banking fee revenue, including credit cards ▪ Full service wealth management offering ▪ Mortgage – Transition from originate to hold to originate to sell, generating additional fee income Capital Management Opportunity to expand net interest margin ▪ WSFS Q2 YTD NIM 4.06%, BNCL Q2 YTD NIM 3.28% ▪ Transitioning mortgage model ▪ Optimizing deposit mix ▪ Further pricing discipline possible due to WSFS high service model ▪ Increased relationship based C&I assets leading to higher yields Net Interest Margin Fee Income Combined institution will generate high levels of earnings that will be efficiently deployed consistent with WSFS’ capital management philosophy ▪ WSFS Q2 YTD Core ROATCE (b) of 19.9%, BNCL Q2 YTD Core ROATCE (b) of 5.2% ▪ Targeted TCE levels between 7% - 8% ▪ Return at least 25% of earnings through a combination of purposefully low dividends and active buybacks By improving Beneficial’s fee income ratio to the average of our peer group (a) (~20%), ~$16mm of annual revenue could be added Every 25bps expansion above BNCL’s current NIM would provide ~$12.5 million in additional annual revenue Significant strategic upside with the potential to drive $28.5 million of additional annual revenue (not modeled) with further upside from disciplined capital management (a) Consists of Eagle Bancorp, Bryn Mawr Bank, OceanFirst Financial, Bank of Princeton, Shore Bancshares, Univest, Sandy Spring, Pea pack - Gladstone, Fulton Financial, DNB Financial, and Customers Bancorp (b) Core ROATCE is a non - GAAP financial measure and should be considered along with results prepared in accordance with GAAP, and no t as a substitute for GAAP results. See Appendix for a reconciliation to GAAP financial information.
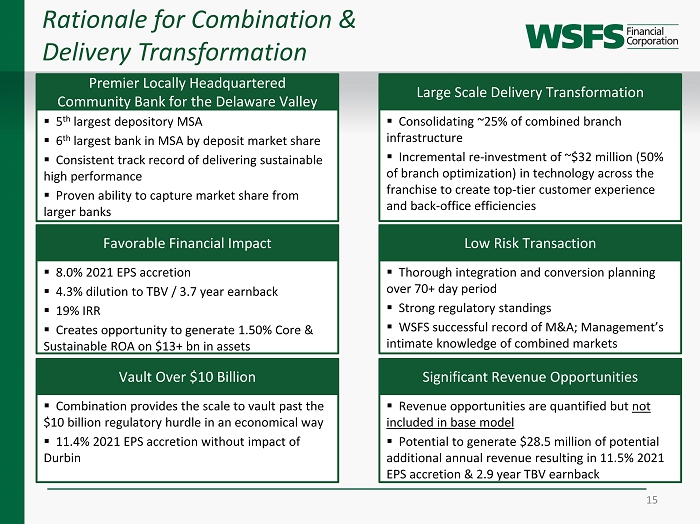
Rationale for Combination & Delivery Transformation 15 ▪ 5 th largest depository MSA ▪ 6 th largest bank in MSA by deposit market share ▪ Consistent track record of delivering sustainable high performance ▪ Proven ability to capture market share from larger banks Premier Locally Headquartered Community Bank for the Delaware Valley ▪ Consolidating ~25% of combined branch infrastructure ▪ Incremental re - investment of ~$32 million (50% of branch optimization) in technology across the franchise to create top - tier customer experience and back - office efficiencies Large Scale Delivery Transformation ▪ 8.0% 2021 EPS accretion ▪ 4.3% dilution to TBV / 3.7 year earnback ▪ 19% IRR ▪ Creates opportunity to generate 1.50% Core & Sustainable ROA on $13+ bn in assets Favorable Financial Impact ▪ Revenue opportunities are quantified but not included in base model ▪ Potential to generate $28.5 million of potential additional annual revenue resulting in 11.5% 2021 EPS accretion & 2.9 year TBV earnback Significant Revenue Opportunities ▪ Combination provides the scale to vault past the $10 billion regulatory hurdle in an economical way ▪ 11.4% 2021 EPS accretion without impact of Durbin Vault Over $10 Billion ▪ Thorough integration and conversion planning over 70+ day period ▪ Strong regulatory standings ▪ WSFS successful record of M&A; Management’s intimate knowledge of combined markets Low Risk Transaction

Summary 16 The WSFS combination with Beneficial and Delivery Transformation of the resulting $ 13 billion and growing franchise creates the only community bank in the demographically - robust Delaware Valley with the scale and delivery capabilities to drive sustainable top - quintile performance at or above WSFS’ current ROAA and ROATCE metrics .
Appendix
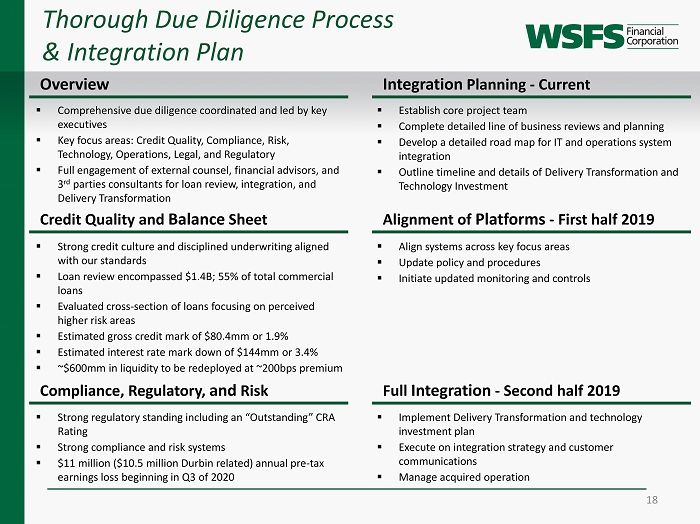
Thorough Due Diligence Process & Integration Plan 18 Overview Credit Quality and Balance Sheet Compliance, Regulatory, and Risk Integration Planning - Current Alignment of Platforms - First half 2019 Full Integration - Second half 2019 ▪ Comprehensive due diligence coordinated and led by key executives ▪ Key focus areas: Credit Quality, Compliance, Risk, Technology, Operations, Legal, and Regulatory ▪ Full engagement of external counsel, financial advisors, and 3 rd parties consultants for loan review, integration, and Delivery Transformation ▪ Strong credit culture and disciplined underwriting aligned with our standards ▪ Loan review encompassed $1.4B; 55% of total commercial loans ▪ Evaluated cross - section of loans focusing on perceived higher risk areas ▪ Estimated gross credit mark of $80.4mm or 1.9% ▪ Estimated interest rate mark down of $144mm or 3.4% ▪ ~$600mm in liquidity to be redeployed at ~200bps premium ▪ Strong regulatory standing including an “Outstanding” CRA Rating ▪ Strong compliance and risk systems ▪ $11 million ($10.5 million Durbin related) annual pre - tax earnings loss beginning in Q3 of 2020 ▪ Establish core project team ▪ Complete detailed line of business reviews and planning ▪ Develop a detailed road map for IT and operations system integration ▪ Outline timeline and details of Delivery Transformation and Technology Investment ▪ Align systems across key focus areas ▪ Update policy and procedures ▪ Initiate updated monitoring and controls ▪ Implement Delivery Transformation and technology investment plan ▪ Execute on integration strategy and customer communications ▪ Manage acquired operation

High Quality Loan & Deposit Portfolio Based on Q2 2018 Balance Sheets 19 Combined Total Loans: $4.92 bn Yield on Loans: 5.31% Total Loans: $4.02 bn Yield on Loans: 4.50 % Total Loans: $8.94 bn Yield on Loans: 4.99% Deposits: $5.37 bn Cost of Deposits: 0.65% Deposits: $4.16 bn Cost of Deposits: 0.59% Deposits: $9.53 bn Cost of Deposits: 0.63% Noninterest - Bearing 27% Interest - Bearing Demand 18% MMDA/Savings 36% Time 13% Brokered 6% Noninterest - Bearing 21% Interest - Bearing Demand 21% MMDA/Savings 38% Time 16% Brokered 4% Noninterest - Bearing 14% Interest - Bearing Demand 26% MMDA/Savings 41% Time 19% C&I(a) 53% CRE 24% Construction 6% Residential 5% Consumer 12% C&I(a) 24% CRE 33% Small Business Leases 4% Construction 3% Residential 24% Consumer 12% C&I(a) 40% CRE 28% Small Business Leases 2% Construction 5% Residential 13% Consumer 12% (a) Includes owner occupied CRE Note: Does not include purchase accounting adjustments

20 Tier 1 Common Ratio Total Capital Ratio Tier 1 Ratio Leverage Ratio Capital Overview Well Capitalized 6.5% Well Capitalized 8.0% Well Capitalized 10.0% Well Capitalized 5.0% 10.4% 21.7% 10.2% WSFS 6/30/2018 BNCL 6/30/2018 Pro Forma at Close 11.5% 21.7% 10.8% WSFS 6/30/2018 BNCL 6/30/2018 Pro Forma at Close 12.2% 22.8% 11.2% WSFS 6/30/2018 BNCL 6/30/2018 Pro Forma at Close 10.0% 15.7% 9.5% WSFS 6/30/2018 BNCL 6/30/2018 Pro Forma at Close Holding Company Ratios

TBV Dilution Reconciliation 21 Aggregate Per Share WSFS Projected TBV 12/31/18 $633,203 $19.97 Equity Consideration 1,253,085 Less Goodwill from Seller's One Time Costs 12,740 Less Total Additional Intangibles Created 764,360 Less Buyer's One Time Costs 78,921 Pro Forma TBV $1,030,267 $19.12 Dilution (4.3%) Tangible Book Value Dilution

22 Supports Core ROATCE figures on page 14 Six months ended June 30, 2018 WSFS BNCL Calculation of return on average tangible common equity: GAAP net (loss) income $66,090 $21,729 Plus: Tax effected amortization of intangible assets 1,084 291 Net tangible income (non - GAAP) $67,174 $22,020 Average shareholders' equity $741,652 $1,015,984 Less: average goodwill and intangible assets 187,891 171,289 Net average tangible common equity $553,761 $844,695 Return on average tangible common equity (non - GAAP) 24.5 % 5.2 % Calculation of core return on average tangible common equity: GAAP net (loss) income $66,090 $21,729 Plus (less): Pre - tax adjustments: Securities gains, unrealized gains, recovery of/provision for fraud loss, and corporate development costs (16,575) (123) (Plus)/less: Tax impact of pre - tax adjustments 3,963 29 Non - GAAP net income 53,478 21,635 Plus: Tax effected amortization of intangible assets 1,084 291 Core net tangible income (non - GAAP) $54,562 $21,926 Net average tangible common equity $553,761 $844,695 Core return on average tangible common equity (non - GAAP) 19.9 % 5.2 % FY17 FY16 FY15 FY14 FY13 FY12 Reported (GAAP) ROA 0.87 1.06 1.05 1.17 1.07 0.73 Non - recurring PCI accretion (0.02) Long - term credit normalization (0.00) 0.04 (0.00) (0.09) (0.05) 0.33 Securities Gains (0.02) (0.03) (0.02) (0.01) (0.05) (0.33) SASCO write up (0.06) Corporate Development expense 0.01 0.09 0.10 0.06 0.01 Debt Extinguishment 0.01 0.01 0.06 FHLB Dividend (0.01) BOLI (0.02) Fraud Loss 0.03 Contribution 0.02 Tax Normalization 0.27 (0.01) 0.02 (0.18) (0.01) 0.00 Core & Sustainable ROA 1.19 1.15 1.13 0.95 0.91 0.77 Supports Core and Sustainable ROA detail on page 12 Non - GAAP Financial Information