Attached files
| file | filename |
|---|---|
| EX-99.1 - EXHIBIT 99.1 - EARNINGS RELEASE DATED 8.8.2018 - TRIUMPH GROUP INC | exhibit991q1fy2019.htm |
| 8-K - 8-K - DATED 8.8.2018 - TRIUMPH GROUP INC | form8-kq1fy2019earningsrel.htm |

August 8, 2018 First Quarter FY’19 Earnings Conference Call Daniel J. Crowley, President and Chief Executive Officer James F. McCabe Jr., Senior Vice President and Chief Financial Officer
Forward Looking Statements This presentation contains forward-looking statements within the meaning of the Private Securities Litigation Reform Act of 1995. Forward- looking statements are often, but not always, identified by the use of words such as “anticipate”, “believe”, “expect”, “plan”, “intend”, “project”, “may”, “will”, “should”, “could”, or similar words suggesting future outcomes or outlooks. These forward-looking statements include, but are not limited to, statements of expectations of or assumptions about strategic actions, objectives, expectations, intentions, aerospace market conditions, aircraft production rates, financial and operational performance, revenue and earnings growth and profitability and earnings results. These statements are based on the current projections, expectations and beliefs of Triumph’s management. These forward looking statements involve known and unknown risks, uncertainties and other factors which could cause actual results to differ materially from any expected future results, performance or achievements, including, but not limited to, competitive and cyclical factors relating to the aerospace industry, dependence on some of Triumph’s business from key customers, requirements of capital, uncertainties relating to the integration of acquired businesses, general economic conditions affecting Triumph’s business segments, product liabilities in excess of insurance, technological developments, limited availability of raw materials or skilled personnel, changes in governmental regulation and oversight and international hostilities and terrorism. Further information regarding the important factors that could cause actual results, performance or achievements to differ from those expressed in any forward looking statements can be found in Triumph’s reports filed with the SEC, including in the risk factors described in Triumph’s Annual Report on Form 10-K for the fiscal year ended March 31, 2018. Triumph Group — First Quarter FY'19 2

Overview • Top-line up YOY 7% in Q1 ◦ Organic growth across all 3 segments • Free Cash Use improved YOY by $33M • Maintaining full year Revenue and Adjusted EPS guidance • Program stability enables full year cash visibility Triumph Financials Improving Year-over-Year Triumph Group — First Quarter FY'19 3
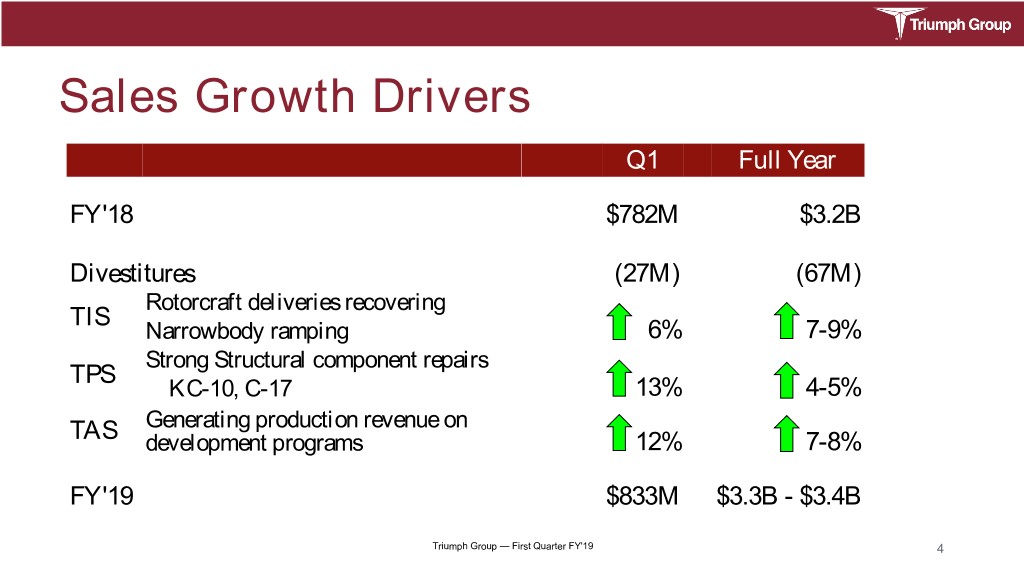
Sales Growth Drivers Q1 Full Year FY'18 $782M $3.2B Divestitures (27M) (67M) Rotorcraft deliveries recovering TIS Narrowbody ramping 6% 7-9% Strong Structural component repairs TPS KC-10, C-17 13% 4-5% Generating production revenue on TAS development programs 12% 7-8% FY'19 $833M $3.3B - $3.4B Triumph Group — First Quarter FY'19 4
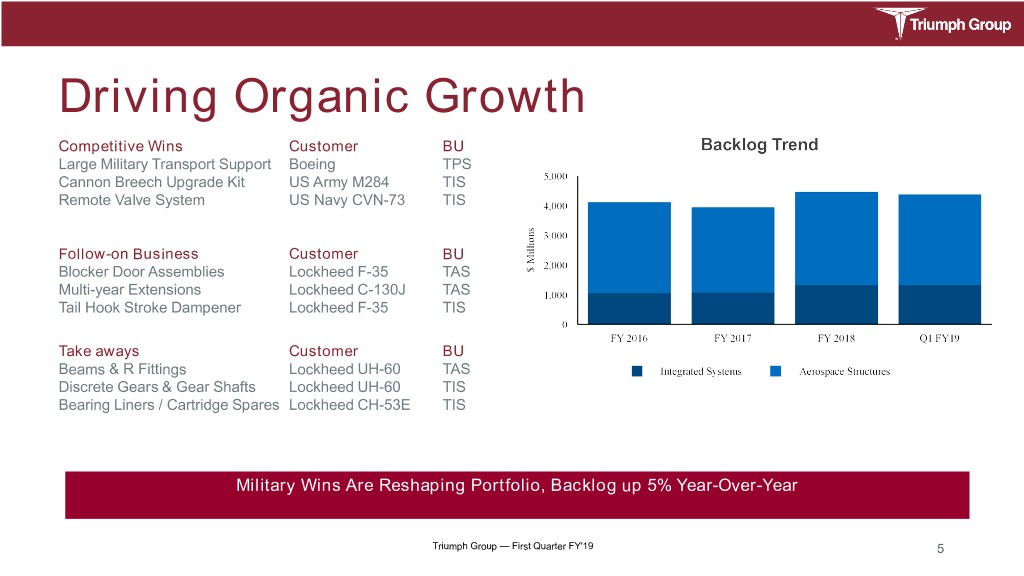
Driving Organic Growth Competitive Wins Customer BU Large Military Transport Support Boeing TPS Cannon Breech Upgrade Kit US Army M284 TIS Remote Valve System US Navy CVN-73 TIS Follow-on Business Customer BU Blocker Door Assemblies Lockheed F-35 TAS Multi-year Extensions Lockheed C-130J TAS Tail Hook Stroke Dampener Lockheed F-35 TIS Take aways Customer BU Beams & R Fittings Lockheed UH-60 TAS Discrete Gears & Gear Shafts Lockheed UH-60 TIS Bearing Liners / Cartridge Spares Lockheed CH-53E TIS Military Wins Are Reshaping Portfolio, Backlog up 5% Year-Over-Year Triumph Group — First Quarter FY'19 5
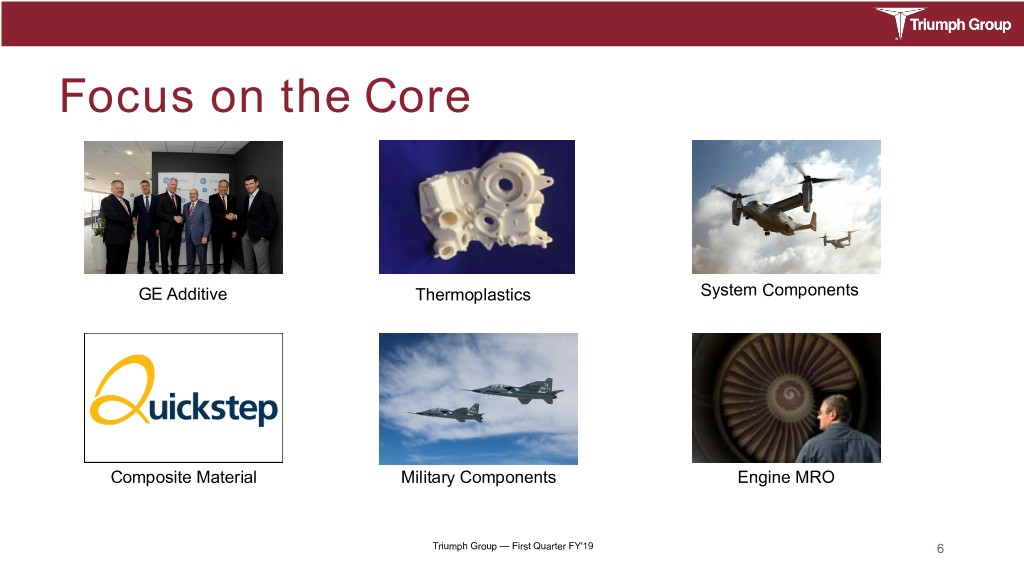
Focus on the Core GE Additive Thermoplastics System Components Composite Material Military Components Engine MRO Triumph Group — First Quarter FY'19 6
Driving Cash from Operations • Global 7500 Cash Use Expected To Decline Quarter Over Quarter • G650 Transition on Track, Cash Positive in FY'19 • E2 Transition on Track, Break Even in FY'20 • Evaluating LT Supply Chain Arrangements on G280 and Global 7500 Addressing Largest Users of Cash Triumph Group — First Quarter FY'19 7
Portfolio Updates Business Divestitures Program Actions Long Island (Build-to-print Machining) Embraer E2 East Texas (Build-to-print Machining) Gulfstream G650 (Pending) Long & Large (Build-to-print Machining) Boeing 767 (Pending) APU Repair Product Line (Pending) Bombardier Global 7500 (Pending) Gulfstream G280 (w/ Israeli Facilities Aerospace Industries) From 74 to 56 facilities since FY16 (Pending) Bell 525 Two (2) more consolidations remain Occupancy reduced by 1M sq.ft. Focusing on Core and Derisking TAS Backlog Triumph Group — First Quarter FY'19 8
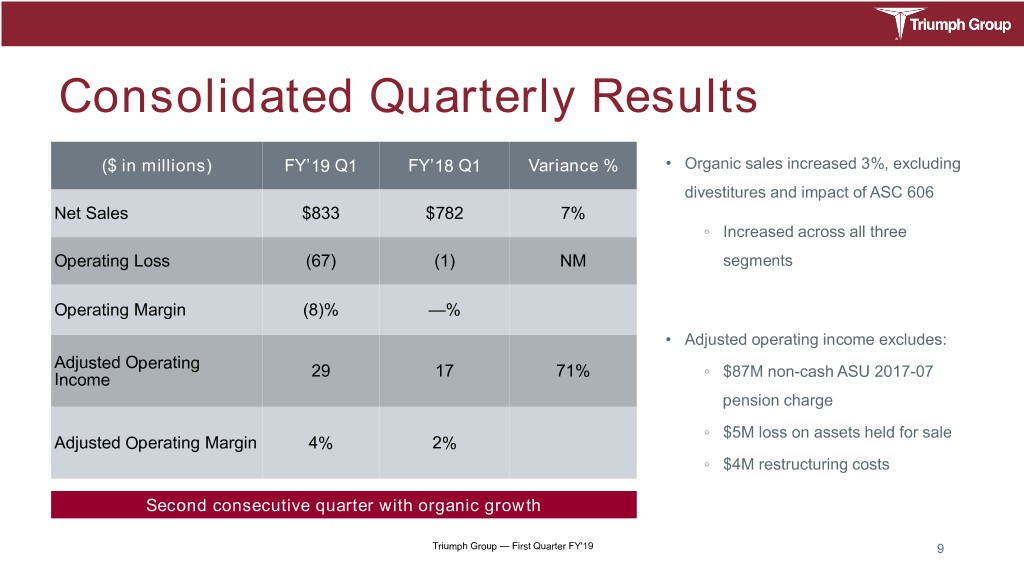
Consolidated Quarterly Results ($ in millions) FY’19 Q1 FY’18 Q1 Variance % • Organic sales increased 3%, excluding divestitures and impact of ASC 606 Net Sales $833 $782 7% ◦ Increased across all three Operating Loss (67) (1) NM segments Operating Margin (8)% —% • Adjusted operating income excludes: Adjusted Operating 29 17 71% ◦ $87M non-cash ASU 2017-07 Income pension charge ◦ $5M loss on assets held for sale Adjusted Operating Margin 4% 2% ◦ $4M restructuring costs Second consecutive quarter with organic growth Triumph Group — First Quarter FY'19 9
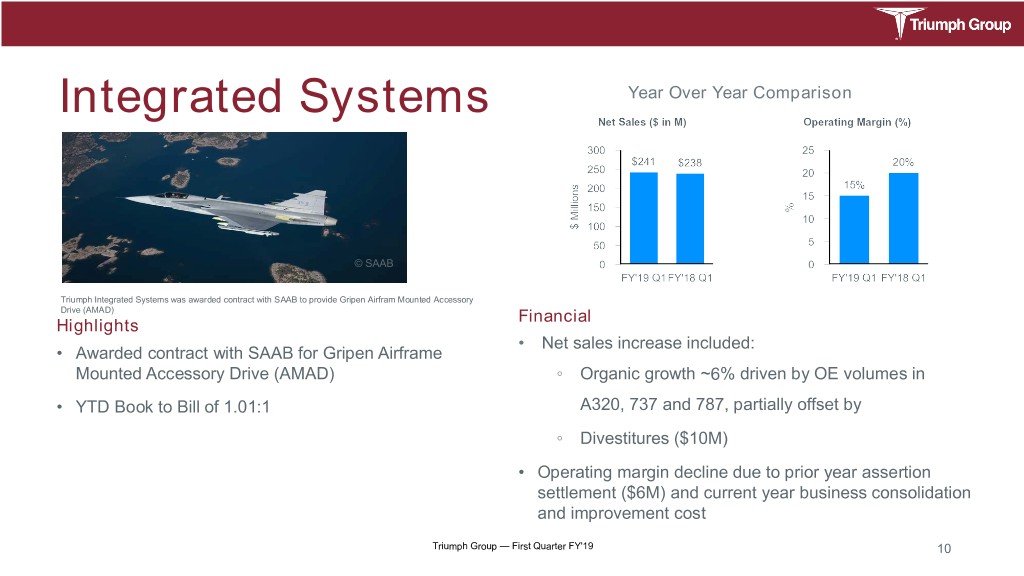
Integrated Systems Year Over Year Comparison © SAAB Triumph Integrated Systems was awarded contract with SAAB to provide Gripen Airfram Mounted Accessory Drive (AMAD) Financial Highlights • Net sales increase included: • Awarded contract with SAAB for Gripen Airframe Mounted Accessory Drive (AMAD) ◦ Organic growth ~6% driven by OE volumes in • YTD Book to Bill of 1.01:1 A320, 737 and 787, partially offset by ◦ Divestitures ($10M) • Operating margin decline due to prior year assertion settlement ($6M) and current year business consolidation and improvement cost Triumph Group — First Quarter FY'19 10
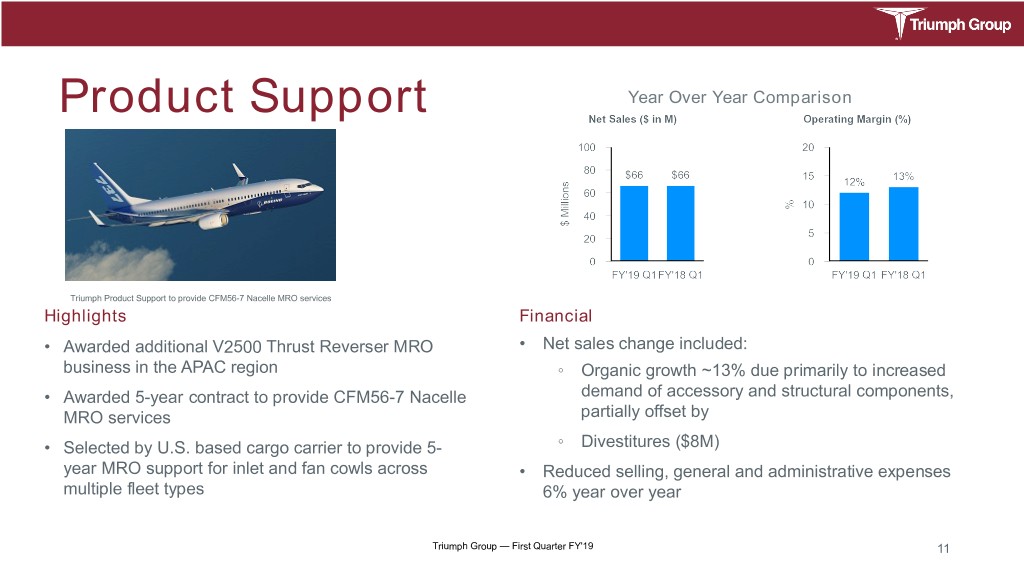
Product Support Year Over Year Comparison Triumph Product Support to provide CFM56-7 Nacelle MRO services Highlights Financial • Awarded additional V2500 Thrust Reverser MRO • Net sales change included: business in the APAC region ◦ Organic growth ~13% due primarily to increased • Awarded 5-year contract to provide CFM56-7 Nacelle demand of accessory and structural components, MRO services partially offset by • Selected by U.S. based cargo carrier to provide 5- ◦ Divestitures ($8M) year MRO support for inlet and fan cowls across • Reduced selling, general and administrative expenses multiple fleet types 6% year over year Triumph Group — First Quarter FY'19 11
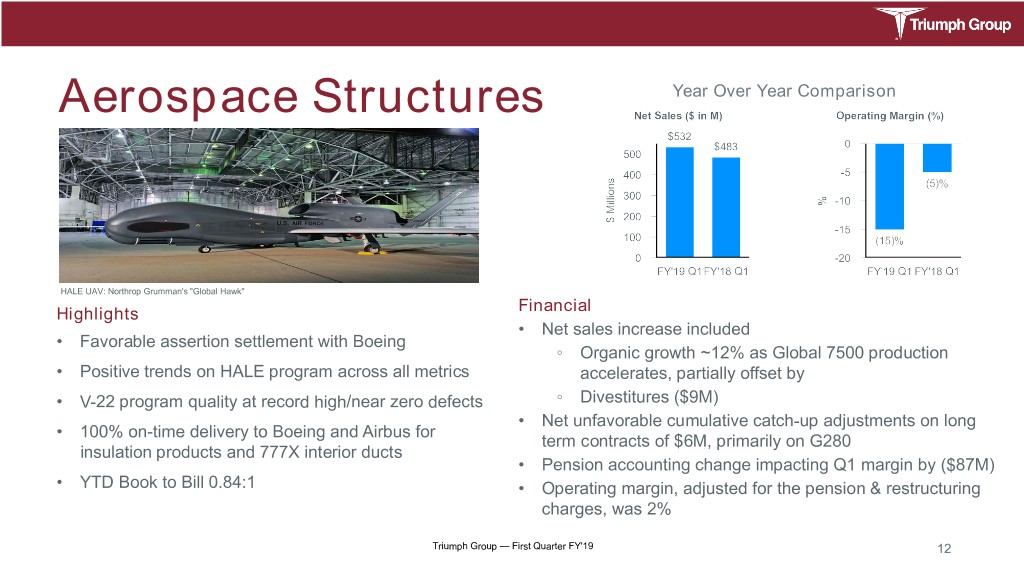
Aerospace Structures Year Over Year Comparison HALE UAV: Northrop Grumman's "Global Hawk" Financial Highlights • Net sales increase included • Favorable assertion settlement with Boeing ◦ Organic growth ~12% as Global 7500 production • Positive trends on HALE program across all metrics accelerates, partially offset by • V-22 program quality at record high/near zero defects ◦ Divestitures ($9M) • Net unfavorable cumulative catch-up adjustments on long • 100% on-time delivery to Boeing and Airbus for term contracts of $6M, primarily on G280 insulation products and 777X interior ducts • Pension accounting change impacting Q1 margin by ($87M) • YTD Book to Bill 0.84:1 • Operating margin, adjusted for the pension & restructuring charges, was 2% Triumph Group — First Quarter FY'19 12
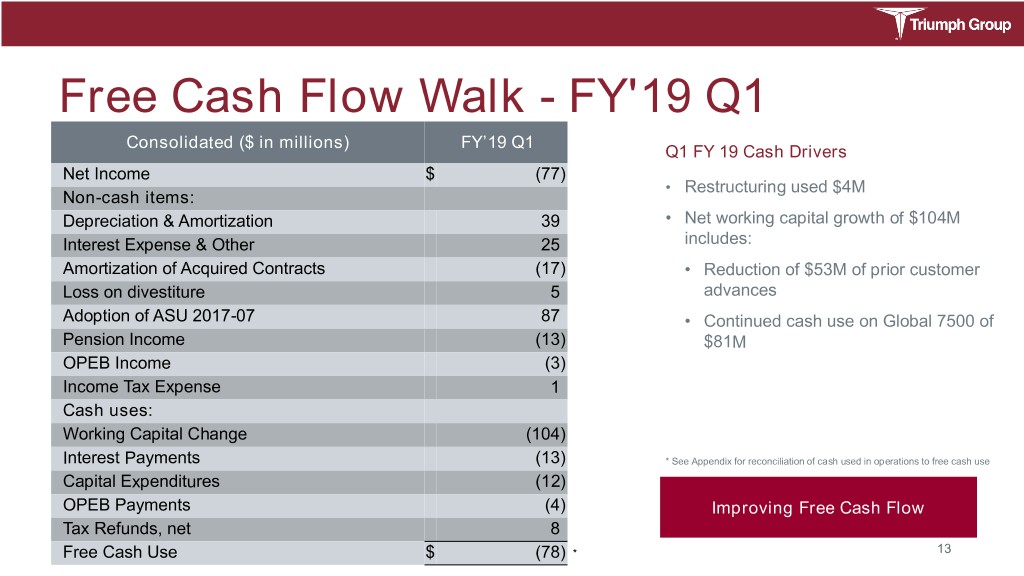
Free Cash Flow Walk - FY'19 Q1 Consolidated ($ in millions) FY’19 Q1 Q1 FY 19 Cash Drivers Net Income $ (77) • Restructuring used $4M Non-cash items: Depreciation & Amortization 39 • Net working capital growth of $104M Interest Expense & Other 25 includes: Amortization of Acquired Contracts (17) • Reduction of $53M of prior customer Loss on divestiture 5 advances Adoption of ASU 2017-07 87 • Continued cash use on Global 7500 of Pension Income (13) $81M OPEB Income (3) Income Tax Expense 1 Cash uses: Working Capital Change (104) Interest Payments (13) * See Appendix for reconciliation of cash used in operations to free cash use Capital Expenditures (12) OPEB Payments (4) Improving Free Cash Flow Tax Refunds, net 8 Free Cash Use $ (78) * 13
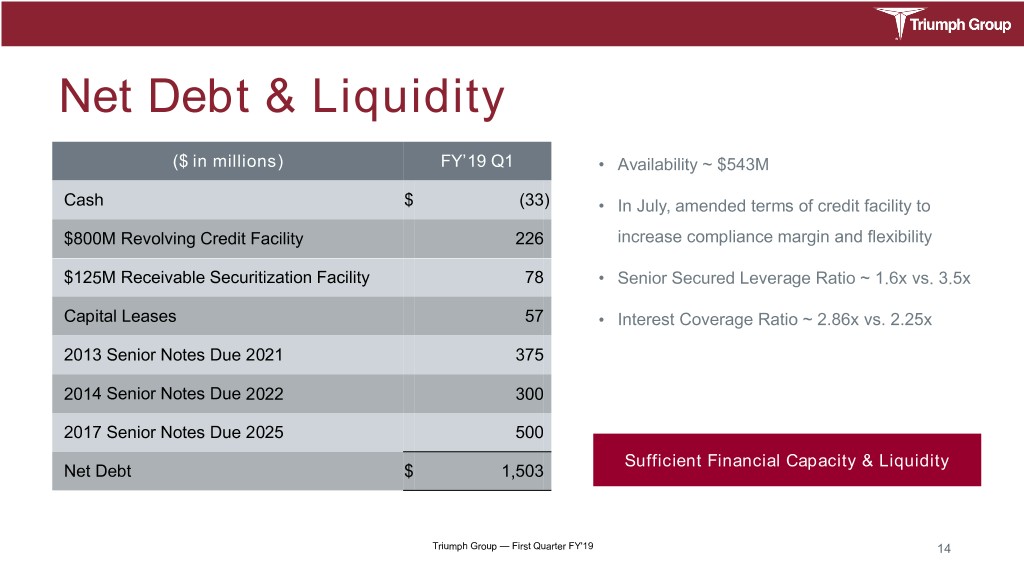
Net Debt & Liquidity ($ in millions) FY’19 Q1 • Availability ~ $543M Cash $ (33) • In July, amended terms of credit facility to $800M Revolving Credit Facility 226 increase compliance margin and flexibility $125M Receivable Securitization Facility 78 • Senior Secured Leverage Ratio ~ 1.6x vs. 3.5x Capital Leases 57 • Interest Coverage Ratio ~ 2.86x vs. 2.25x 2013 Senior Notes Due 2021 375 2014 Senior Notes Due 2022 300 2017 Senior Notes Due 2025 500 Sufficient Financial Capacity & Liquidity Net Debt $ 1,503 Triumph Group — First Quarter FY'19 14
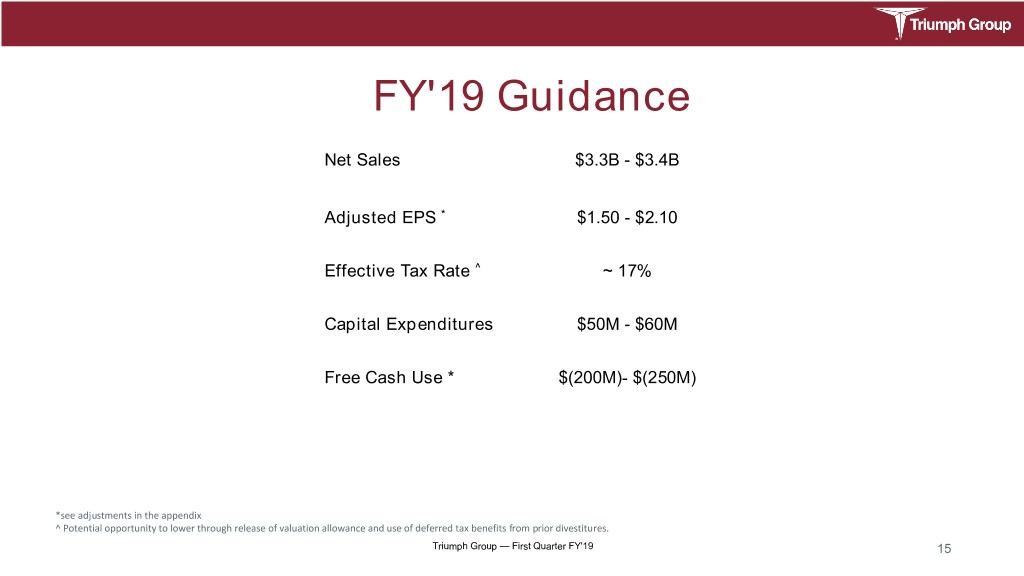
FY'19 Guidance Net Sales $3.3B - $3.4B Adjusted EPS * $1.50 - $2.10 Effective Tax Rate ^ ~ 17% Capital Expenditures $50M - $60M Free Cash Use * $(200M)- $(250M) *see adjustments in the appendix ^ Potential opportunity to lower through release of valuation allowance and use of deferred tax benefits from prior divestitures. Triumph Group — First Quarter FY'19 15
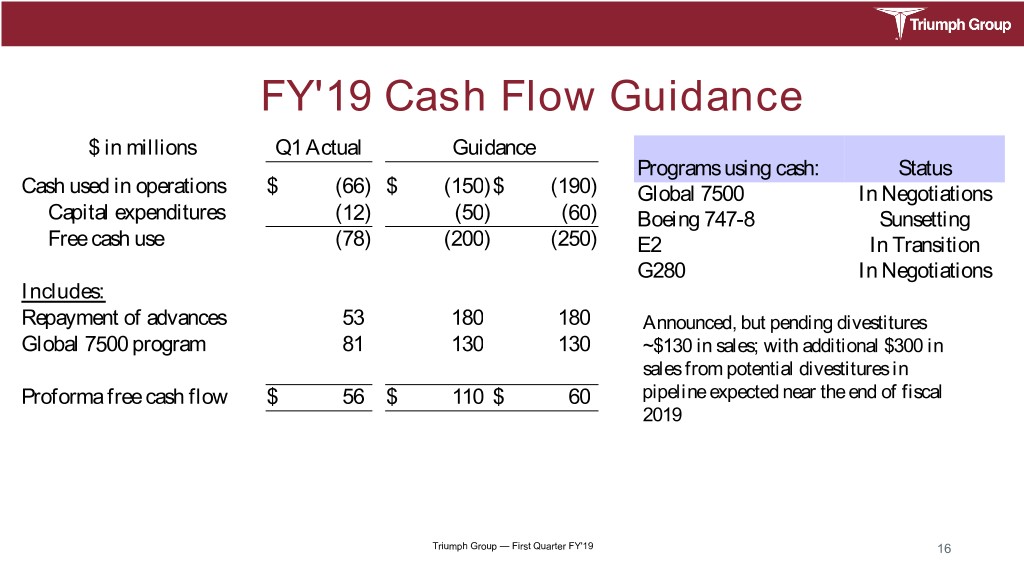
FY'19 Cash Flow Guidance $ in millions Q1 Actual Guidance Programs using cash: Status Cash used in operations $ (66) $ (150)$ (190) Global 7500 In Negotiations Capital expenditures (12) (50) (60) Boeing 747-8 Sunsetting Free cash use (78) (200) (250) E2 In Transition G280 In Negotiations Includes: Repayment of advances 53 180 180 Announced, but pending divestitures Global 7500 program 81 130 130 ~$130 in sales; with additional $300 in sales from potential divestitures in Proforma free cash flow $ 56 $ 110 $ 60 pipeline expected near the end of fiscal 2019 Triumph Group — First Quarter FY'19 16
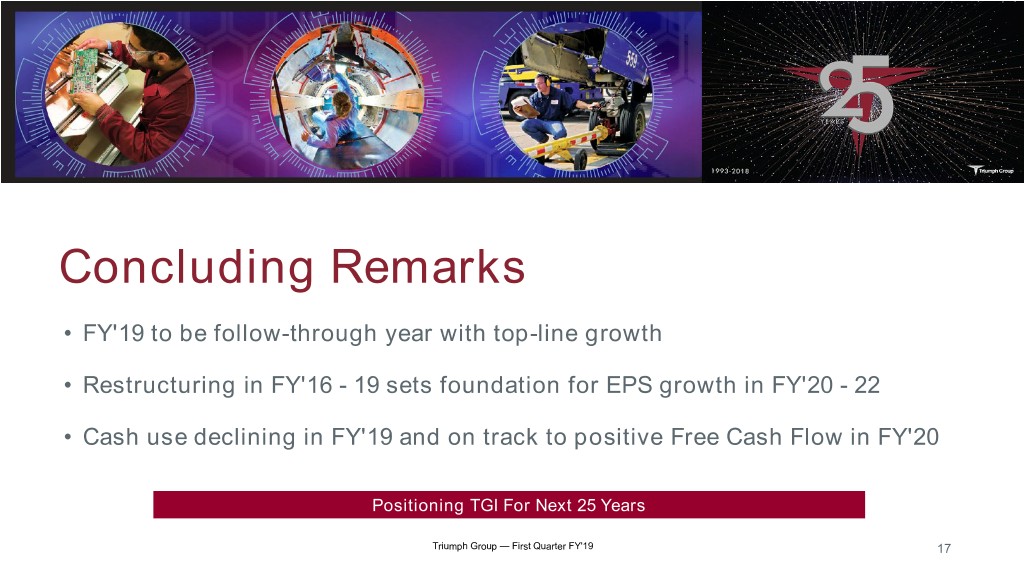
Concluding Remarks • FY'19 to be follow-through year with top-line growth • Restructuring in FY'16 - 19 sets foundation for EPS growth in FY'20 - 22 • Cash use declining in FY'19 and on track to positive Free Cash Flow in FY'20 Positioning TGI For Next 25 Years Triumph Group — First Quarter FY'19 17
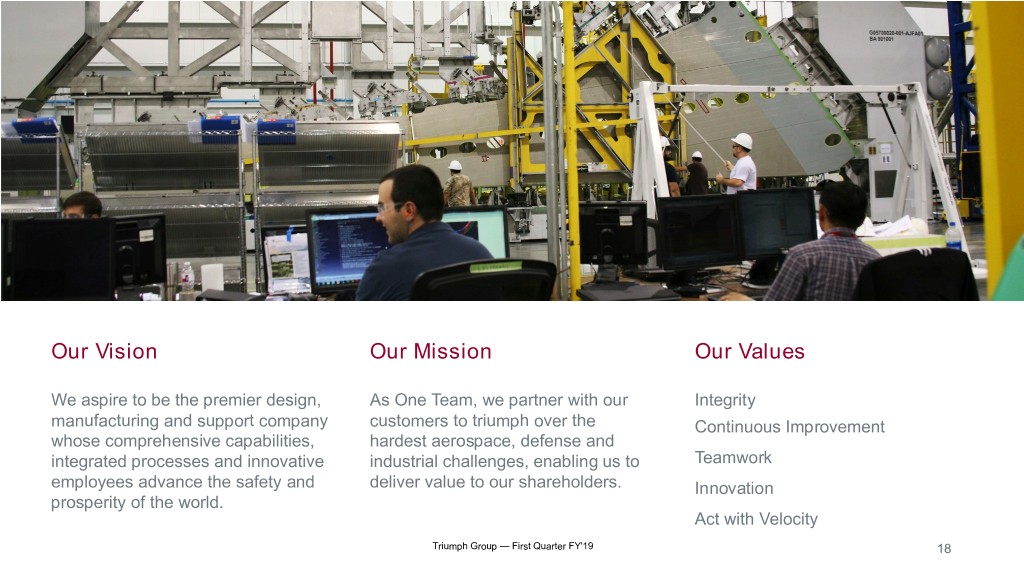
Our Vision Our Mission Our Values We aspire to be the premier design, As One Team, we partner with our Integrity manufacturing and support company customers to triumph over the Continuous Improvement whose comprehensive capabilities, hardest aerospace, defense and integrated processes and innovative industrial challenges, enabling us to Teamwork employees advance the safety and deliver value to our shareholders. Innovation prosperity of the world. Act with Velocity Triumph Group — First Quarter FY'19 18
Appendix Triumph Group — First Quarter FY'19 19
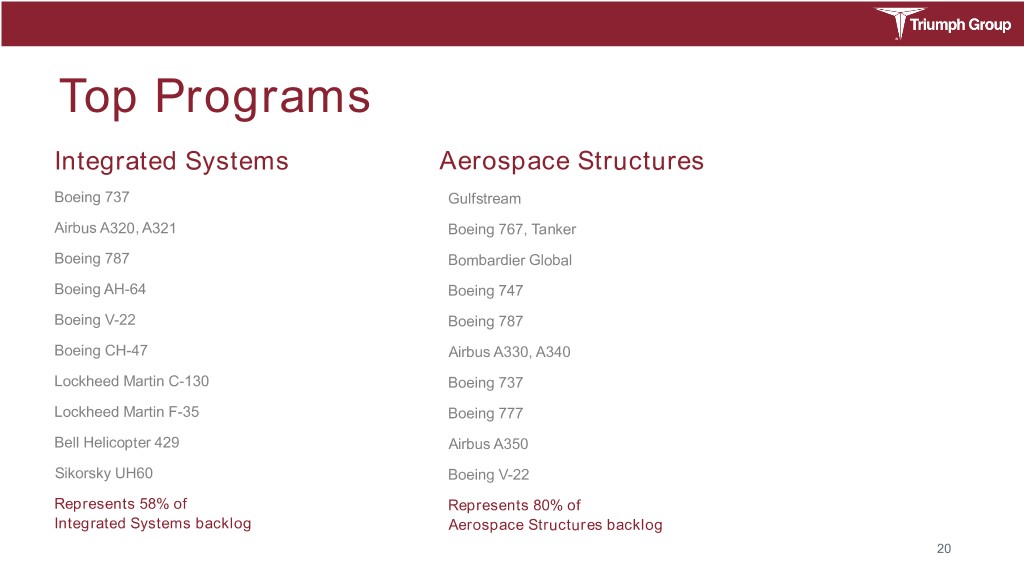
Top Programs Integrated Systems Aerospace Structures Boeing 737 Gulfstream Airbus A320, A321 Boeing 767, Tanker Boeing 787 Bombardier Global Boeing AH-64 Boeing 747 Boeing V-22 Boeing 787 Boeing CH-47 Airbus A330, A340 Lockheed Martin C-130 Boeing 737 Lockheed Martin F-35 Boeing 777 Bell Helicopter 429 Airbus A350 Sikorsky UH60 Boeing V-22 Represents 58% of Represents 80% of Integrated Systems backlog Aerospace Structures backlog 20
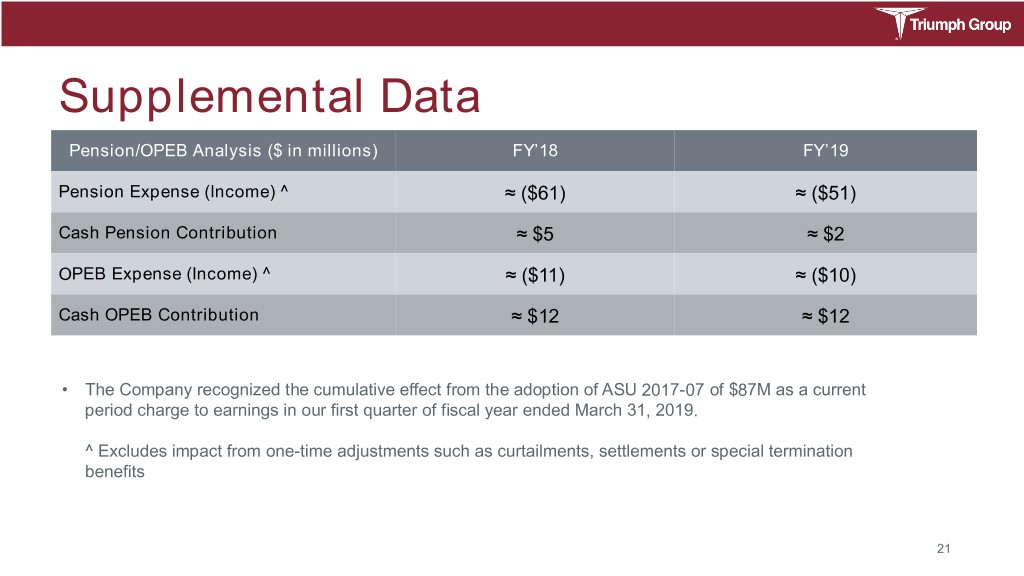
Supplemental Data Pension/OPEB Analysis ($ in millions) FY’18 FY’19 Pension Expense (Income) ^ ≈ ($61) ≈ ($51) Cash Pension Contribution ≈ $5 ≈ $2 OPEB Expense (Income) ^ ≈ ($11) ≈ ($10) Cash OPEB Contribution ≈ $12 ≈ $12 • The Company recognized the cumulative effect from the adoption of ASU 2017-07 of $87M as a current period charge to earnings in our first quarter of fiscal year ended March 31, 2019. ^ Excludes impact from one-time adjustments such as curtailments, settlements or special termination benefits 21
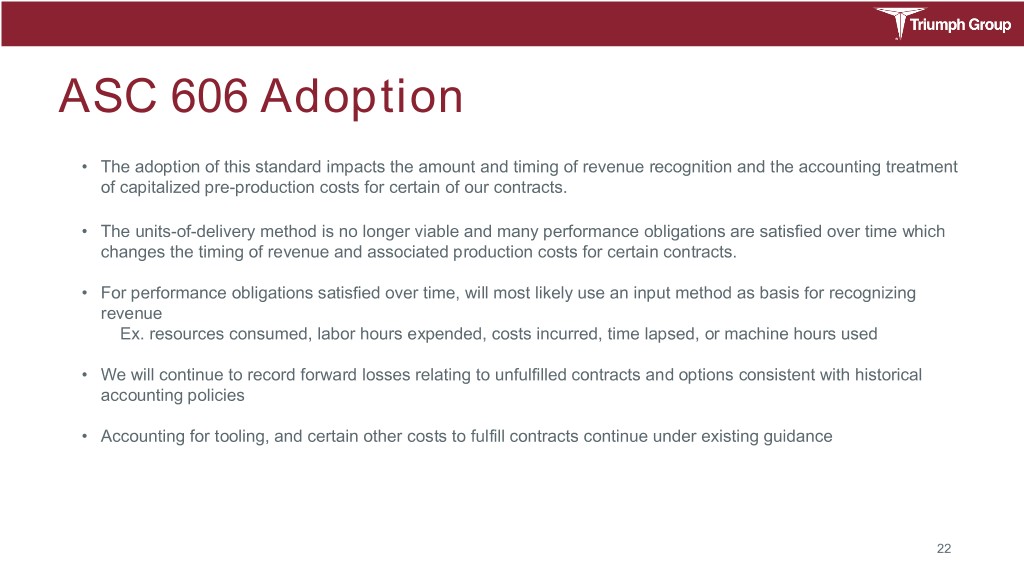
ASC 606 Adoption • The adoption of this standard impacts the amount and timing of revenue recognition and the accounting treatment of capitalized pre-production costs for certain of our contracts. • The units-of-delivery method is no longer viable and many performance obligations are satisfied over time which changes the timing of revenue and associated production costs for certain contracts. • For performance obligations satisfied over time, will most likely use an input method as basis for recognizing revenue Ex. resources consumed, labor hours expended, costs incurred, time lapsed, or machine hours used • We will continue to record forward losses relating to unfulfilled contracts and options consistent with historical accounting policies • Accounting for tooling, and certain other costs to fulfill contracts continue under existing guidance 22
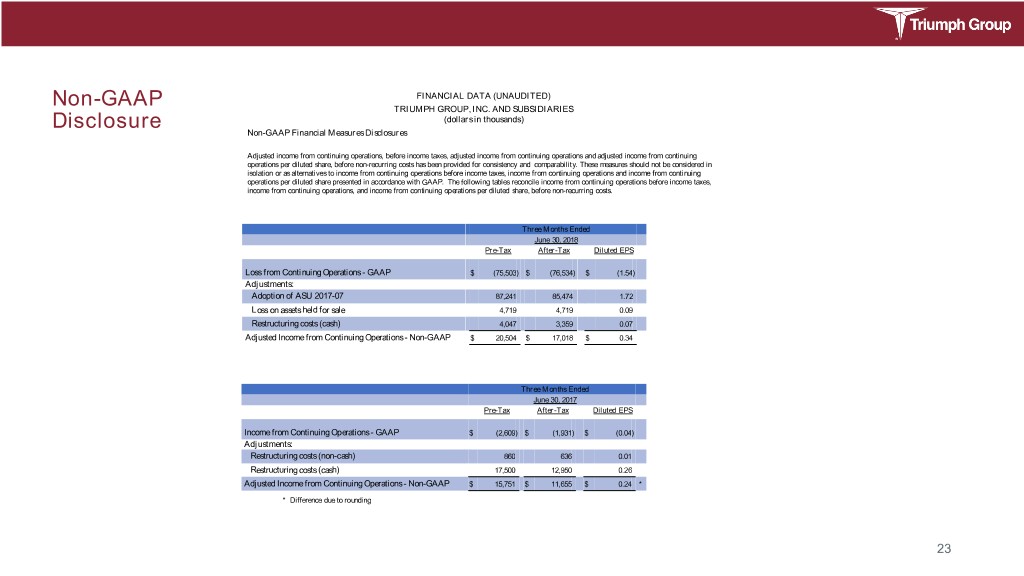
FINANCIAL DATA (UNAUDITED) Non-GAAP TRIUMPH GROUP, INC. AND SUBSIDIARIES (dollars in thousands) Disclosure Non-GAAP Financial Measures Disclosures Adjusted income from continuing operations, before income taxes, adjusted income from continuing operations and adjusted income from continuing operations per diluted share, before non-recurring costs has been provided for consistency and comparability. These measures should not be considered in isolation or as alternatives to income from continuing operations before income taxes, income from continuing operations and income from continuing operations per diluted share presented in accordance with GAAP. The following tables reconcile income from continuing operations before income taxes, income from continuing operations, and income from continuing operations per diluted share, before non-recurring costs. Three Months Ended June 30, 2018 Pre-Tax After-Tax Diluted EPS Loss from Continuing Operations - GAAP $ (75,503) $ (76,534) $ (1.54) Adjustments: Adoption of ASU 2017-07 87,241 85,474 1.72 Loss on assets held for sale 4,719 4,719 0.09 Restructuring costs (cash) 4,047 3,359 0.07 Adjusted Income from Continuing Operations - Non-GAAP $ 20,504 $ 17,018 $ 0.34 Three Months Ended June 30, 2017 Pre-Tax After-Tax Diluted EPS Income from Continuing Operations - GAAP $ (2,609) $ (1,931) $ (0.04) Adjustments: Restructuring costs (non-cash) 860 636 0.01 Restructuring costs (cash) 17,500 12,950 0.26 Adjusted Income from Continuing Operations - Non-GAAP $ 15,751 $ 11,655 $ 0.24 * * Difference due to rounding 23
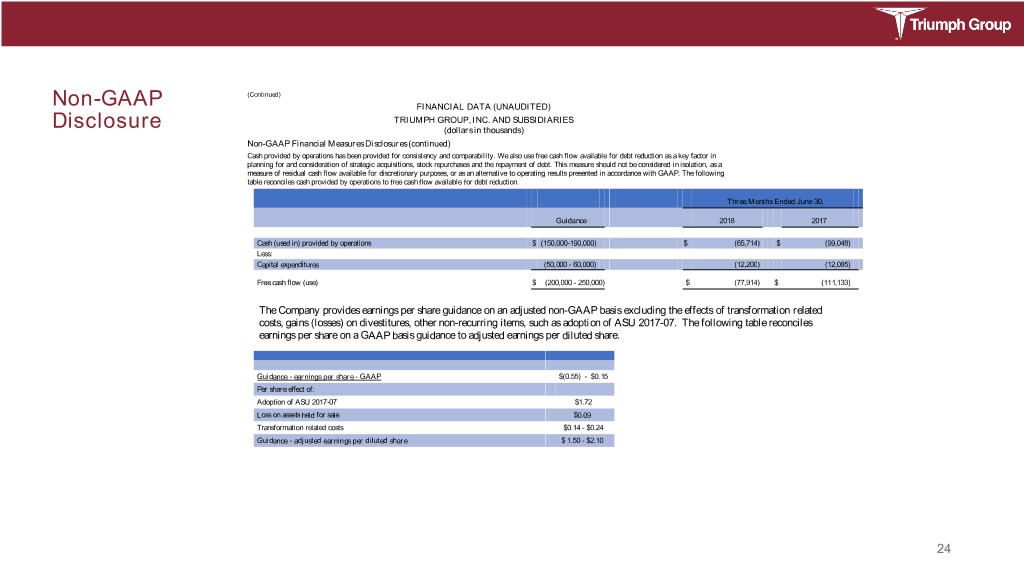
(Continued) Non-GAAP FINANCIAL DATA (UNAUDITED) TRIUMPH GROUP, INC. AND SUBSIDIARIES Disclosure (dollars in thousands) Non-GAAP Financial Measures Disclosures (continued) Cash provided by operations has been provided for consistency and comparability. We also use free cash flow available for debt reduction as a key factor in planning for and consideration of strategic acquisitions, stock repurchases and the repayment of debt. This measure should not be considered in isolation, as a measure of residual cash flow available for discretionary purposes, or as an alternative to operating results presented in accordance with GAAP. The following table reconciles cash provided by operations to free cash flow available for debt reduction. Three Months Ended June 30, Guidance 2018 2017 Cash (used in) provided by operations $ (150,000-190,000) $ (65,714) $ (99,048) Less: Capital expenditures (50,000 - 60,000) (12,200) (12,085) Free cash flow (use) $ (200,000 - 250,000) $ (77,914) $ (111,133) The Company provides earnings per share guidance on an adjusted non-GAAP basis excluding the effects of transformation related costs, gains (losses) on divestitures, other non-recurring items, such as adoption of ASU 2017-07. The following table reconciles earnings per share on a GAAP basis guidance to adjusted earnings per diluted share. Guidance - earnings per share - GAAP $(0.55) - $0.15 Per share effect of: Adoption of ASU 2017-07 $1.72 Loss on assets held for sale $0.09 Transformation related costs $0.14 - $0.24 Guidance - adjusted earnings per diluted share $ 1.50 - $2.10 24
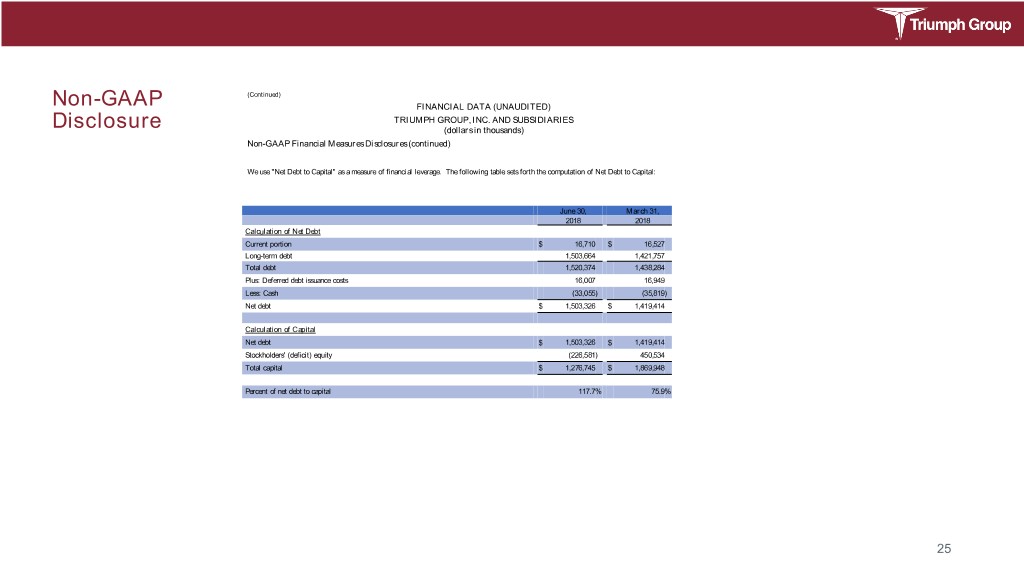
(Continued) Non-GAAP FINANCIAL DATA (UNAUDITED) TRIUMPH GROUP, INC. AND SUBSIDIARIES Disclosure (dollars in thousands) Non-GAAP Financial Measures Disclosures (continued) We use "Net Debt to Capital" as a measure of financial leverage. The following table sets forth the computation of Net Debt to Capital: June 30, March 31, 2018 2018 Calculation of Net Debt Current portion $ 16,710 $ 16,527 Long-term debt 1,503,664 1,421,757 Total debt 1,520,374 1,438,284 Plus: Deferred debt issuance costs 16,007 16,949 Less: Cash (33,055) (35,819) Net debt $ 1,503,326 $ 1,419,414 Calculation of Capital Net debt $ 1,503,326 $ 1,419,414 Stockholders' (deficit) equity (226,581) 450,534 Total capital $ 1,276,745 $ 1,869,948 Percent of net debt to capital 117.7% 75.9% 25
