Attached files
| file | filename |
|---|---|
| EX-10.36 - EXHIBIT 10.36 - TRIUMPH GROUP INC | tgi-ex1036xemploymentagree.htm |
| EX-32.2 - EXHIBIT 32.2 - TRIUMPH GROUP INC | tgi-ex322x3312017.htm |
| EX-32.1 - EXHIBIT 32.1 - TRIUMPH GROUP INC | tgi-ex321x3312017.htm |
| EX-31.2 - EXHIBIT 31.2 - TRIUMPH GROUP INC | tgi-ex312x3312017.htm |
| EX-31.1 - EXHIBIT 31.1 - TRIUMPH GROUP INC | tgi-ex311x3312017.htm |
| EX-23.1 - EXHIBIT 23.1 - TRIUMPH GROUP INC | tgi-ex231x3312017.htm |
| EX-21.1 - EXHIBIT 21.1 - TRIUMPH GROUP INC | tgi-ex211x3312017.htm |
UNITED STATES
SECURITIES AND EXCHANGE COMMISSION
Washington, D.C. 20549
____________________________________________________________________________
FORM 10-K
(Mark One) | |
x | ANNUAL REPORT PURSUANT TO SECTION 13 OR 15(D) OF THE SECURITIES EXCHANGE ACT OF 1934 |
For the fiscal year ended March 31, 2017 | |
or | |
o | TRANSITION REPORT PURSUANT TO SECTION 13 OR 15(D) OF THE SECURITIES EXCHANGE ACT OF 1934 |
For the transition period from to | |
Commission File No. 1-12235
Triumph Group, Inc.
(Exact name of registrant as specified in its charter)
Delaware (State or other jurisdiction of incorporation or organization) | 51-0347963 (I.R.S. Employer Identification Number) |
899 Cassatt Road, Suite 210, Berwyn, Pennsylvania 19312 (Address of principal executive offices, including zip code) | |
Registrant's telephone number, including area code: (610) 251-1000 | |
____________________________________________________________________________
Securities registered pursuant to Section 12(b) of the Act: | |
Common Stock, par value $.001 per share (Title of each class) | New York Stock Exchange (Name of each exchange on which registered) |
Securities registered pursuant to Section 12(g) of the Act: None
____________________________________________________________________________
Indicate by check mark if the Registrant is a well-known seasoned issuer, as defined in Rule 405 of the Securities Act. Yes x No o
Indicate by check mark if the Registrant is not required to file reports pursuant to Section 13 or Section 15(d) of the Securities Exchange Act of 1934. Yes o No x
Indicate by check mark whether the Registrant (1) has filed all reports required to be filed by Section 13 or 15(d) of the Securities Exchange Act of 1934 during the preceding 12 months (or for such shorter period that the Registrant was required to file such reports), and (2) has been subject to such filing requirements for the past 90 days. Yes x No o
Indicate by check mark whether the Registrant has submitted electronically and posted on its corporate website, if any, every Interactive Data File required to be submitted and posted pursuant to Rule 405 of Regulation S-T during the preceding 12 months (or for such shorter period that the registrant was required to submit and post such files). Yes x No o
Indicate by check mark if disclosure of delinquent filers pursuant to Item 405 of Regulation S-K is not contained herein, and will not be contained, to the best of Registrant's knowledge, in definitive proxy or information statements incorporated by reference in Part III of this Form 10-K or any amendment to this Form 10-K. x
Indicate by check mark whether the Registrant is a large accelerated filer, an accelerated filer, a non-accelerated filer, a smaller reporting company, or an emerging growth company. See the definitions of "large accelerated filer," "accelerated filer," "smaller reporting company," and "emerging growth company" in Rule 12b-2 of the Securities Exchange Act of 1934. (Check one)
Large accelerated filer x | Accelerated filer o |
Non-accelerated filer o (Do not check if a smaller reporting company) | Smaller reporting company o |
Emerging growth company o | |
If an emerging growth company, indicate by check mark if the registrant has elected not to use the extended transition period for complying with any new or revised financial accounting standards provided pursuant to Section 13(a) of the Exchange Act. o
Indicate by check mark whether the Registrant is a shell company (as defined in Rule 12b-2 of the Securities Exchange Act of 1934). Yes o No x
As of September 30, 2016, the aggregate market value of the shares of Common Stock held by non-affiliates of the Registrant was approximately $1,244 million. Such aggregate market value was computed by reference to the closing price of the Common Stock as reported on the New York Stock Exchange on September 30, 2016. For purposes of making this calculation only, the Registrant has defined affiliates as including all directors and executive officers.
The number of outstanding shares of the Registrant's Common Stock, par value $.001 per share, on May 22, 2017 was 49,579,347.
____________________________________________________________________________
Documents Incorporated by Reference
Portions of the following document are incorporated herein by reference:
The Proxy Statement of Triumph Group, Inc. to be filed in connection with our 2017 Annual Meeting of Stockholders is incorporated in part in Part III hereof, as specified herein.
Table of Contents
Item No. | Page | |
2
PART I
Item 1. | Business |
Cautionary Note Regarding Forward-Looking Statements
This report contains forward-looking statements within the meaning of the Private Securities Litigation Reform Act of 1995 relating to our future operations and prospects, including statements that are based on current projections and expectations about the markets in which we operate, and management's beliefs concerning future performance and capital requirements based upon current available information. Actual results could differ materially from management's current expectations. Additional capital may be required and, if so, may not be available on reasonable terms, if at all, at the times and in the amounts we need. In addition to these factors and others described elsewhere in this report, other factors that could cause actual results to differ materially include competitive and cyclical factors relating to the aerospace industry, dependence of some of our businesses on key customers, requirements of capital, product liabilities in excess of insurance, uncertainties relating to the integration of acquired businesses, general economic conditions affecting our business segment, technological developments, limited availability of raw materials or skilled personnel, changes in governmental regulation and oversight, and international hostilities and terrorism. For a more detailed discussion of these and other factors affecting us, see the Risk Factors described in Item 1A of this Annual Report on Form 10-K. We do not undertake any obligation to revise these forward-looking statements to reflect future events.
General
Triumph Group, Inc. ("Triumph", the "Company", "we", "us", or "our") was incorporated in 1993 in Delaware. Our companies design, engineer, manufacture, repair, overhaul and distribute a broad portfolio of aerostructures, aircraft components, accessories, subassemblies and systems. We serve a broad, worldwide spectrum of the aviation industry, including original equipment manufacturers, or OEMs, of commercial, regional, business and military aircraft and aircraft components, as well as commercial and regional airlines and air cargo carriers.
Products and Services
We offer a variety of products and services to the aerospace industry through four operating segments: (i) Triumph Integrated Systems, whose companies revenues are derived from the design, development and support of proprietary components, subsystems and systems, as well as production of complex assemblies using external designs; (ii) Triumph Aerospace Structures, whose companies supply commercial, business, regional and military manufacturers with large metallic and composite structures; (iii) Triumph Precision Components, whose companies produce close-tolerance parts primarily to customer designs and model-based definition, including a wide range of aluminum, hard metal and composite structure capabilities; and (iv) Triumph Product Support, whose companies provide full life cycle solutions for commercial, regional and military aircraft.
Integrated Systems capabilities include hydraulic, mechanical and electro-mechanical actuation, power and control; a complete suite of aerospace gearbox solutions including engine accessory gearboxes and helicopter transmissions; active and passive heat exchange technology; fuel pumps, fuel metering units and Full Authority Digital Electronic Control fuel systems; hydro-mechanical and electromechanical primary and secondary flight controls; and a broad spectrum of surface treatment options.
The products that companies within this group design, engineer, build and repair include:
Aircraft and engine mounted accessory drives | Thermal control systems and components |
Cargo hooks | High lift actuation |
Cockpit control levers | Hydraulic systems and components |
Comprehensive processing services | Landing gear actuation systems |
Control system valve bodies | Landing gear components and assemblies |
Electronic engine controls | Main engine gear box assemblies |
Exhaust nozzles and ducting | Main fuel pumps |
Geared transmissions and drive train components | Secondary flight control systems |
Fuel metering units | Vibration absorbers |
3
Aerospace Structures products include wings, wing boxes, fuselage panels, horizontal and vertical tails and sub-assemblies such as floor grids. Inclusive of most of the former Vought Aircraft Division, Aerospace Structures also has the capability to engineer detailed structural designs in metal and composites.
The products that companies within this group design, manufacture, build and repair include:
Aircraft wings | Flight control surfaces |
Composite and metal bonding | Helicopter cabins |
Engine nacelles | Precision machined parts |
Comprehensive processing services | Stretch-formed leading edges and fuselage skins |
Empennages | Wing spars and stringers |
Precision Components capabilities include complex machining, gear manufacturing, sheet metal fabrication, forming, advanced composite and interior structures, joining processes such as welding, autoclave bonding and conventional mechanical fasteners and a variety of special processes including: super plastic titanium forming, aluminum and titanium chemical milling and surface treatments.
The products that companies within this group design, engineer, build and repair include:
Acoustic and thermal insulation systems | Flight control surfaces |
Composite and metal bonding | Helicopter cabins |
Composite ducts and floor panels | Precision machined parts |
Comprehensive processing services | Stretch-formed leading edges and fuselage skins |
Wing spars and stringers | |
Product Support extensive product and service offerings include full post-delivery value chain services that simplify the MRO supply chain. Through its line maintenance, component MRO and postproduction supply chain activities, Product Support is positioned to provide integrated planeside repair solutions globally. Capabilities include fuel tank repair, metallic and composite aircraft structures, nacelles, thrust reversers, interiors, auxiliary power units and a wide variety of pneumatic, hydraulic, fuel and mechanical accessories. Companies in Product Support repair and overhaul various components for the aviation industry including:
Air cycle machines | Blades and vanes |
APUs | Cabin panes, shades, light lenses and other components |
Constant speed drives | Combustors |
Engine and airframe accessories | Stators |
Flight control surfaces | Transition ducts |
Integrated drive generators | Sidewalls |
Nacelles | Light assemblies |
Remote sensors | Overhead bins |
Thrust reversers | Fuel bladder cells |
Certain financial information about our four segments is set forth in Note 21 of "Notes to Consolidated Financial Statements."
4
Proprietary Rights
We benefit from our proprietary rights relating to designs, engineering and manufacturing processes and repair and overhaul procedures. For some products, our unique manufacturing capabilities are required by the customer's specifications or designs, thereby necessitating reliance on us for the production of such specially designed products.
We view our name and trademark as significant to our business as a whole. Our products are protected by a portfolio of patents, trademarks, licenses or other forms of intellectual property that expire at various dates in the future. We continually develop and acquire new intellectual property and consider all of our intellectual property to be valuable. However, based on the broad scope of our product lines, management believes that the loss or expiration of any single intellectual property right would not have a material adverse effect on our results of operations, our financial position or our business segments. Our policy is to file applications and obtain patents for our new products as appropriate, including product modifications and improvements. While patents generally expire 20 years after the patent application filing date, new patents are issued to us on a regular basis.
In our overhaul and repair businesses, OEMs of equipment that we maintain for our customers often include language in repair manuals that relate to their equipment, asserting broad claims of proprietary rights to the contents of the manuals used in our operations. There can be no assurance that OEMs will not try to enforce such claims, including the possible use of legal proceedings. In the event of such legal proceedings, there can be no assurance that such actions against the Company will be unsuccessful. However, we believe that our use of manufacture and repair manuals is lawful.
Raw Materials and Replacement Parts
We purchase raw materials, primarily consisting of extrusions, forgings, castings, aluminum and titanium sheets and shapes and stainless steel alloys, from various vendors. We also purchase replacement parts, which are utilized in our various repair and overhaul operations. We believe that the availability of raw materials to us is adequate to support our operations.
Sales, Marketing and Engineering
While each of our operating companies maintains responsibility for selling and marketing its specific products, we have developed two marketing teams at the group level who are focused on cross-selling our broad capabilities. One team supports Integrated Systems, Aerospace Structures and Precision Components and the other team supports Product Support. These teams are responsible for selling systems, integrated assemblies and repair and overhaul services, reaching across our operating companies, to our OEM, military, airline and air cargo customers. In certain limited cases, we use independent, commission-based representatives to serve our customers' changing needs and the current trends in some of the markets and geographic regions in which we operate.
The two group-level marketing teams operate as the front-end of the selling process, establishing or maintaining relationships, identifying opportunities to leverage our brand, and providing service for our customers. Each individual operating company is responsible for its own technical support, pricing, manufacturing and product support. Also, within the Product Support, we have created a group engineering function to provide integrated solutions to meet our customer needs by designing systems that integrate the capabilities of our companies.
A significant portion of our government and defense contracts are awarded on a competitive bidding basis. We generally do not bid or act as the primary contractor, but will typically bid and act as a subcontractor on contracts on a fixed-price basis. We generally sell to our other customers on a fixed-price, negotiated contract or purchase order basis.
Backlog
We have a number of long-term agreements with several of our customers. These agreements generally describe the terms under which the customer may issue purchase orders to buy our products and services during the term of the agreement. These terms typically include a list of the products or repair services customers may purchase, initial pricing, anticipated quantities and, to the extent known, delivery dates. In tracking and reporting our backlog, however, we only include amounts for which we have actual purchase orders with firm delivery dates or contract requirements generally within the next 24 months, which primarily relate to sales to our OEM customer base. Purchase orders issued by our aftermarket customers are usually completed within a short period of time. As a result, our backlog data relates primarily to the OEM customers. The backlog information set forth below does not include the sales that we expect to generate from long-term agreements for which we do not have actual purchase orders with firm delivery dates.
5
As of March 31, 2017, we had outstanding purchase orders representing an aggregate invoice price of approximately $3.98 billion, of which $1.08 billion, $1.75 billion, $1.12 billion, and $33 million relate to Integrated Systems, Aerospace Structures, Precision Components, and Product Support, respectively. As of March 31, 2016, our continuing operations had outstanding purchase orders representing an aggregate invoice price of approximately $4.15 billion, of which $1.07 billion, $1.90 billion, $1.15 billion, and $37 million related to Integrated Systems, Aerospace Structures, Precision Components, and Product Support, respectively. The sharp decline in backlog was due to the production rate reductions on key programs such as Boeing 747-8, 777 and G450/G550. Of the existing backlog of $3.98 billion, approximately $1.83 billion will not be shipped by March 31, 2018.
Dependence on Significant Customers
For the fiscal years ended March 31, 2017, 2016 and 2015, the Boeing Company ("Boeing") represented approximately 35%, 38% and 42%, respectively, of our net sales, covering virtually every Boeing plant and product.
For the fiscal years ended March 31, 2017, 2016 and 2015, Gulfstream Aerospace Corporation ("Gulfstream") represented approximately 12%, 12% and 9%, respectively, of our net sales, covering several of Gulfstream's products.
A significant reduction in sales to Boeing and/or Gulfstream would have a material adverse impact on our financial position, results of operations and cash flows.
United States and International Operations
Our revenues from customers in the United States for the fiscal years ended March 31, 2017, 2016 and 2015, were approximately $2,764 million, $3,088 million, and $3,136 million, respectively. Our revenues from customers in all other countries for the fiscal years ended March 31, 2017, 2016 and 2015, were approximately $769 million, $798 million, and $753 million, respectively.
As of March 31, 2017 and 2016, our long-lived assets located in the United States were approximately $2,326 million and $2,725 million, respectively. As of March 31, 2017 and 2016, our long-lived assets located in all other countries were approximately $315 million and $367 million, respectively.
Competition
We compete primarily with Tier 1 and Tier 2 aerostructures manufacturers, systems suppliers and component manufacturers, some of which are divisions or subsidiaries of other large companies, in the manufacture of aircraft structures, systems components, subassemblies and detail parts. OEMs are increasingly focusing on assembly and integration activities while outsourcing more manufacturing and, therefore, are less of a competitive force than in previous years.
Competition for the repair and overhaul of aviation components comes from four primary sources, some of whom possess greater financial and other resources than we have: OEMs, major commercial airlines, government support depots and other independent repair and overhaul companies. Some major commercial airlines continue to own and operate their own service centers, while others have begun to sell or outsource their repair and overhaul services to other aircraft operators or third parties. Large domestic and foreign airlines that provide repair and overhaul services typically provide these services not only for their own aircraft but for other airlines as well. OEMs also maintain service centers which provide repair and overhaul services for the components they manufacture. Many governments maintain aircraft support depots in their military organizations that maintain and repair the aircraft they operate. Other independent service organizations also compete for the repair and overhaul business of other users of aircraft components.
Participants in the aerospace industry compete primarily on the basis of breadth of technical capabilities, quality, turnaround time, capacity and price.
Government Regulation and Industry Oversight
The aerospace industry is highly regulated in the United States by the FAA and in other countries by similar agencies. We must be certified by the FAA and, in some cases, by individual OEMs, in order to engineer and service parts and components used in specific aircraft models. If material authorizations or approvals were revoked or suspended, our operations would be adversely affected. New and more stringent government regulations may be adopted, or industry oversight heightened, in the future and these new regulations, if enacted, or any industry oversight, if heightened, may have an adverse impact on us.
We must also satisfy the requirements of our customers, including OEMs, that are subject to FAA regulations, and provide these customers with products and repair services that comply with the government regulations applicable to aircraft components used in commercial flight operations. The FAA regulates commercial flight operations and requires that aircraft components meet its stringent standards. In addition, the FAA requires that various maintenance routines be performed on aircraft components, and we currently satisfy these maintenance standards in our repair and overhaul services. Several of our operating locations are FAA-approved repair stations.
6
Generally, the FAA only grants licenses for the manufacture or repair of a specific aircraft component, rather than the broader licenses that have been granted in the past. The FAA licensing process may be costly and time-consuming. In order to obtain an FAA license, an applicant must satisfy all applicable regulations of the FAA governing repair stations. These regulations require that an applicant have experienced personnel, inspection systems, suitable facilities and equipment. In addition, the applicant must demonstrate a need for the license. Because an applicant must procure manufacturing and repair manuals from third parties relating to each particular aircraft component in order to obtain a license with respect to that component, the application process may involve substantial cost.
The license approval processes for the European Aviation Safety Agency ("EASA"), which regulates this industry in the European Union, the Civil Aviation Administration of China, and other comparable foreign regulatory authorities are similarly stringent, involving potentially lengthy audits. EASA was formed in 2002 and is handling most of the responsibilities of the national aviation authorities in Europe, such as the United Kingdom Civil Aviation Authority.
Our operations are also subject to a variety of worker and community safety laws. For example, the Occupational Safety and Health Act of 1970, or OSHA, mandates general requirements for safe workplaces for all employees in the United States. In addition, OSHA provides special procedures and measures for the handling of hazardous and toxic substances. Specific safety standards have been promulgated for workplaces engaged in the treatment, disposal or storage of hazardous waste. We believe that our operations are in material compliance with OSHA's health and safety requirements.
Environmental Matters
Our business, operations and facilities are subject to numerous stringent federal, state, local and foreign environmental laws and regulation by government agencies, including the Environmental Protection Agency ("EPA"). Among other matters, these regulatory authorities impose requirements that regulate the emission, discharge, generation, management, transportation and disposal of hazardous materials, pollutants and contaminants, govern public and private response actions to hazardous or regulated substances which may be or have been released to the environment, and require us to obtain and maintain licenses and permits in connection with our operations. This extensive regulatory framework imposes significant compliance burdens and risks on us. Although management believes that our operations and our facilities are in material compliance with such laws and regulations, future changes in these laws, regulations or interpretations thereof or the nature of our operations or regulatory enforcement actions which may arise, may require us to make significant additional capital expenditures to ensure compliance in the future.
Certain of our facilities, including facilities acquired and operated by us or one of our subsidiaries have at one time or another been under active investigation for environmental contamination by federal or state agencies when acquired, and at least in some cases, continue to be under investigation or subject to remediation for potential environmental contamination. We are frequently indemnified by prior owners or operators and/or present owners of the facilities for liabilities which we incur as a result of these investigations and the environmental contamination found which pre-dates our acquisition of these facilities, subject to certain limitations. We also maintain a pollution liability policy that provides coverage for material liabilities associated with the clean-up of on-site pollution conditions, as well as defense and indemnity for certain third-party suits (including Superfund liabilities at third-party sites), in each case, to the extent not otherwise indemnified. This policy applies to all of our manufacturing and assembly operations worldwide. Also, as we proceed with our plans to exit certain facilities as part of restructuring and related initiatives, the need for remediation for potential environmental contamination could be identified. If we are required to pay the expenses related to environmental liabilities because neither indemnification nor insurance coverage is available, these expenses could have a material adverse effect on us.
Employees
As of March 31, 2017, we employed 14,309 persons, of whom 3,990 were management employees, 123 were sales and marketing personnel, 801 were technical personnel, 660 were administrative personnel and 8,735 were production workers. Our segments were composed of the following employees: Integrated Systems - 3,060 persons, Aerospace Structures - 4,538 persons, Precision Components - 5,479 persons, Product Support - 1,069 persons, and Corporate - 163 persons.
Several of our subsidiaries are parties to collective bargaining agreements with labor unions. Under those agreements, we currently employ approximately 1,780 full-time employees. Currently, approximately 12% of our permanent employees are represented by labor unions and approximately 47% of net sales are derived from the facilities at which at least some employees are unionized. During the quarter ended June 30, 2016, we settled the strike and agreed to a new collective bargaining agreement with our union employees with IAM District 751 at our Spokane, Washington facility which had expired during the quarter, resulting in a charge of $15.7 million due to disruption costs. Of the 1,780 employees represented by unions, 81 employees are working under contracts that have expired or will expire within one year and 479 employees in our Red Oak, Texas and 351 employees in our Tulsa, Oklahoma facilities have not yet negotiated initial contracts. Our inability to
7
negotiate an acceptable contract with any of these labor unions could result in strikes by the affected workers and increased operating costs as a result of higher wages or benefits paid to union members. If the unionized workers were to engage in a strike or other work stoppage, or other employees were to become unionized, we could experience a significant disruption of our operations and higher ongoing labor costs, which could have an adverse effect on our business and results of operations.
Research and Development Expenses
Certain information about our research and development expenses for the fiscal years ended March 31, 2017, 2016 and 2015 is available in Note 2 of "Notes to Consolidated Financial Statements."
Executive Officers
Our current executive officers are: | ||||
Name | Age | Position | ||
Daniel J. Crowley | 54 | President and Chief Executive Officer and Director | ||
James F. McCabe, Jr. | 54 | Senior Vice President, Chief Financial Officer | ||
John B. Wright, II | 63 | Senior Vice President, General Counsel and Secretary | ||
Richard R. Lovely | 58 | Senior Vice President, Human Resources | ||
Thomas A. Quigley, III | 40 | Vice President and Controller | ||
Thomas K. Holzthum | 60 | Executive Vice President, Integrated Systems | ||
MaryLou B. Thomas | 54 | Executive Vice President, Aerospace Structures | ||
Michael R. Abram | 64 | Executive Vice President, Product Support | ||
Daniel J. Crowley was appointed President and Chief Executive Officer and a director of the Company on January 4, 2016. Previously, Mr. Crowley served as President of two Raytheon Company business areas from 2010 through 2015. Prior to Raytheon, Mr. Crowley served as Chief Operating Officer of Lockheed Martin Aeronautics after holding a series of increasingly responsible assignments across its space, electronics, and aeronautics sectors.
James F. McCabe, Jr. has been our Senior Vice President and Chief Financial Officer since August 2016. He joined Triumph from Steel Partners Holdings where he last served as Senior Vice President and CFO, President, Shared Services, and SVP and CFO of its affiliates Handy & Harman and Steel Excel. Prior to joining Steel Partners Holdings, McCabe served as Vice President, Finance and Treasurer of American Water’s Northeast Region, and President and CFO of Teleflex Aerospace, which served the global aviation industry. He is a certified public accountant and Six Sigma Green Belt, and served as a member of the Board of Governors and the Civil Aviation Council Executive Committee for the Aerospace Industries Association.
John B. Wright, II has been a Senior Vice President and our General Counsel and Secretary since April 2016, having served as Vice President, General Counsel and Secretary from 2004 until April 2016. From 2001 until he joined us, Mr. Wright was a partner with the law firm of Ballard Spahr LLP, where he practiced corporate and securities law.
Richard R. Lovely was appointed Senior Vice President, Human Resources in April 2016. From 2009 until 2015, Mr. Lovely served as Senior Vice President, Global Human Resources for Houghton International Inc. and Executive Vice President, Human Resources for Rohm and Haas Company from 2007 until 2009.
Thomas A. Quigley, III has been our Vice President and Controller since November 2012, and serves as the Company's principal accounting officer. Mr. Quigley has served as the Company's SEC Reporting Manager since January 2009. From June 2002 until joining Triumph in 2009, Mr. Quigley held various roles within the audit practice of KPMG LLP, including Senior Audit Manager.
Thomas K. Holzthum was appointed Executive Vice President, Integrated Systems in April 2016. Prior thereto, Mr. Holzthum served as Corporate Vice President-Systems beginning in October 2013 with responsibility for eight Triumph Group companies in Integrated Systems. Mr. Holzthum previously served as President of Triumph Actuation Systems-Connecticut from 2001 to 2013. Mr. Holtzhum joined Triumph in 1998 with the acquisition of Frisby Aerospace, where he held the position of Group Director, Hydraulics.
MaryLou B. Thomas was appointed Executive Vice President, Aerospace Structures in April 2016. Since joining Triumph in 2005, Ms. Thomas has served as Corporate Vice President - Composites, Structures and Interiors business area with operations in the United States, Mexico, Thailand and U.K. Ms. Thomas has more than thirty years of experience in the aerospace and defense industry, including service at Lockheed, Boeing and the Company.
8
Michael R. Abram was appointed Executive Vice President, Product Support in April 2016. Since joining Triumph in 2003 as Vice President of Operations for Triumph Airborne Structures, Mr. Abram has served as Vice President of Triumph Product Support, North America and, most recently, Vice President-Aftermarket Services Group, where he was responsible for the company’s maintenance, repair and overhaul (MRO) activities supporting commercial, regional, business and military aircraft worldwide. Before joining Triumph, he was Vice President of Operations for NORDAM Repair Division.
Available Information
For more information about us, visit our website at www.triumphgroup.com. The contents of the website are not part of this Annual Report on Form 10-K. Our electronic filings with the Securities and Exchange Commission ("SEC") (including all Forms 10-K, 10-Q and 8-K, and any amendments to these reports) are available free of charge through our website immediately after we electronically file with or furnish them to the SEC. These filings may also be read and copied at the SEC's Public Reference Room which is located at 100 F Street, N.E., Washington, D.C. 20549. Information about the operation of the Public Reference Room can be obtained by calling the SEC at 1-800-SEC-0330. The SEC maintains an Internet site that contains reports, proxy and information statements, and other information regarding issuers who file electronically with the SEC at www.sec.gov.
Item 1A. | Risk Factors |
Factors that have an adverse impact on the aerospace industry may adversely affect our results of operations and liquidity.
A substantial percentage of our gross profit and operating income derives from commercial aviation. Our operations have been focused on designing, engineering, manufacturing, repairing and overhauling a broad portfolio of aerostructures, aircraft components, accessories, subassemblies and systems. Therefore, our business is directly affected by economic factors and other trends that affect our customers in the aerospace industry, including a possible decrease in outsourcing by OEMs and aircraft operators or projected market growth that may not materialize or be sustainable. We are also significantly dependent on sales to the commercial aerospace market, which has been cyclical in nature with significant downturns in the past. When these economic and other factors adversely affect the aerospace industry, they tend to reduce the overall customer demand for our products and services, which decreases our operating income. Economic and other factors that might affect the aerospace industry may have an adverse impact on our results of operations and liquidity. We have credit exposure to a number of commercial airlines, some of which have encountered financial difficulties. In addition, an increase in energy costs and the price of fuel to the airlines could result in additional pressure on the operating costs of airlines. The market for jet fuel is inherently volatile and is subject to, among other things, changes in government policy on jet fuel production, fluctuations in the global supply of crude oil and disruptions in oil production or delivery caused by hostility in oil-producing areas. Airlines are sometimes unable to pass on increases in fuel prices to customers by increasing fares due to the competitive nature of the airline industry, and this compounds the pressure on operating costs. Other events of general impact such as natural disasters, war, terrorist attacks against the industry or pandemic health crises may lead to declines in the worldwide aerospace industry that could adversely affect our business and financial condition.
In addition, demand for our maintenance, repair and overhaul services is strongly correlated with worldwide flying activity. A significant portion of the MRO activity required on commercial aircraft is mandated by government regulations that limit the total time or number of flights that may elapse between scheduled MRO events. As a result, although short-term deferrals are possible, MRO activity is ultimately required to continue to operate the aircraft in revenue-producing service. Therefore, over the intermediate and long-term, trends in the MRO market are closely related to the size and utilization level of the worldwide aircraft fleet, as reflected by the number of available seat miles, commonly referred to as ASMs, and cargo miles flown. Consequently, conditions or events which contribute to declines in worldwide ASMs and cargo miles flown, such as those mentioned above, could negatively impact our MRO business.
We may not be successful in achieving expected operating efficiencies and sustaining or improving operating expense reductions, and may experience business disruptions associated with restructuring, facility consolidations, realignment, cost reduction and other strategic initiatives.
Over the past several years we have implemented a number of restructuring, realignment and cost reduction initiatives, including facility consolidations, organizational realignments and reductions in our workforce. While we have realized some efficiencies from these actions, we may not realize the benefits of these initiatives to the extent we anticipated. Further, such benefits may be realized later than expected, and the ongoing difficulties in implementing these measures may be greater than anticipated, which could cause us to incur additional costs or result in business disruptions. In addition, if these measures are not successful or sustainable, we may be compelled to undertake additional realignment and cost reduction efforts, which could
9
result in significant additional charges. Moreover, if our restructuring and realignment efforts prove ineffective, our ability to achieve our other strategic and business plan goals may be adversely affected.
We derive a significant portion of our revenue from the U.S. government, primarily from defense related programs with the U.S. DoD . Levels of U.S. defense spending are very difficult to predict and may be impacted by numerous factors such as the political environment, U.S. foreign policy, macroeconomic conditions and the ability of the U.S. government to enact relevant legislation such as authorization and appropriations bills.
In addition, significant budgetary delays and constraints have already resulted in reduced spending levels, and additional reductions may be forthcoming. The Budget Control Act of 2011 (The Act) established limits on U.S. government discretionary spending, including a reduction of defense spending between the 2012 and 2021 U.S. government fiscal years. Accordingly, long-term uncertainty remains with respect to overall levels of defense spending and it is likely that U.S. government discretionary spending levels will continue to be subject to pressure.
In addition, there continues to be significant uncertainty with respect to program-level appropriations for the U.S. DoD and other government agencies within the overall budgetary framework described above. While the House and Senate Appropriations committees included funding for major military programs in fiscal year 2018, such as CH-47 Chinook, AH-64 Apache, KC-46A Tanker, UH-60 Black Hawk, Northrop Grumman Global Hawk and V-22 Osprey programs, uncertainty remains about how defense budgets in fiscal year 2018 and beyond will affect these programs. Future budget cuts, including cuts mandated by sequestration, or future procurement decisions associated with the authorizations and appropriations process could result in reductions, cancellations, and/or delays of existing contracts or programs. Any of these impacts could have a material effect on the results of the Company’s operations, financial position and/or cash flows.
In addition, as a result of the significant ongoing uncertainty with respect to both U.S. defense spending levels and the nature of the threat environment, we expect the U.S. DoD to continue to emphasize cost-cutting and other efficiency initiatives in its procurement processes. If we can no longer adjust successfully to these changing acquisition priorities and/or fail to meet affordability targets set by the U.S. DoD customer, our revenues and market share would be further impacted.
The profitability of certain development programs depends significantly on the assumptions surrounding satisfactory settlement of claims and assertions.
For certain of our new development programs, we regularly commence work or incorporate customer-requested changes prior to negotiating pricing terms for engineering work or the product which has been modified. We typically have the legal right to negotiate pricing for customer-directed changes. In those cases, we assert to our customers our contractual rights to obtain the additional revenue or cost reimbursement we expect to receive upon finalizing pricing terms. An expected recovery value of these assertions is incorporated into our contract profitability estimates when applying contract accounting. Our inability to recover these expected values, among other factors, could result in the recognition of a forward loss on these programs or a lower than expected profit margin and could have a material adverse effect on our results of operations.
Future volatility in the financial markets may impede our ability to successfully access capital markets and ensure adequate liquidity and may adversely affect our customers and suppliers.
Future turmoil in the capital markets may impede our ability to access the capital markets when we would like, or need, to raise capital or may restrict our ability to borrow money on favorable terms. Such market conditions could have an adverse impact on our flexibility to react to changing economic and business conditions and on our ability to fund our operations and capital expenditures in the future. In addition, interest rate fluctuations, financial market volatility or credit market disruptions may also negatively affect our customers' and our suppliers' ability to obtain credit to finance their businesses on acceptable terms. As a result, our customers' need for and ability to purchase our products or services may decrease, and our suppliers may increase their prices, reduce their output or change their terms of sale. If our customers' or suppliers' operating and financial performance deteriorates, or if they are unable to make scheduled payments or obtain credit, our customers may not be able to pay, or may delay payment of, accounts receivable owed to us, and our suppliers may restrict credit or impose different payment terms. Any inability of customers to pay us for our products and services or any demands by suppliers for different payment terms may adversely affect our earnings and cash flow.
We incur risk associated with new programs.
New programs with new technologies typically carry risks associated with design responsibility, development of new production tools, hiring and training of qualified personnel, increased capital and funding commitments, ability to meet customer specifications, delivery schedules and unique contractual requirements, supplier performance, ability of the customer
10
to meet its contractual obligations to us, and our ability to accurately estimate costs associated with such programs. In addition, any new aircraft program may not generate sufficient demand or may experience technological problems or significant delays in the regulatory certification or manufacturing and delivery schedule. If we were unable to perform our obligations under new programs to the customer's satisfaction or manufacture products at our estimated costs, if we were to experience unexpected fluctuations in raw material prices or supplier problems leading to cost overruns, if we were unable to successfully perform under revised design and manufacturing plans or successfully resolve claims and assertions, or if a new program in which we had made a significant investment was terminated or experienced weak demand, delays or technological problems, our business, financial condition and results of operations could be materially adversely affected. This risk includes the potential for default, quality problems, or inability to meet weight requirements and could result in low margin or forward loss contracts, and the risk of having to write-off inventory if it were deemed to be unrecoverable over the life of the program. In addition, beginning new work on existing programs also carries risks associated with the transfer of technology, knowledge and tooling.
In order to perform on new programs we may be required to construct or acquire new facilities requiring additional up-front investment costs. In the case of significant program delays and/or program cancellations, we could be required to bear certain unrecoverable construction and maintenance costs and incur potential impairment charges for the new facilities. Also, we may need to expend additional resources to determine an alternate revenue generating use for the facilities. Likewise, significant delays in the construction or acquisition of a plant site could impact production schedules.
Our business could be negatively affected by cyber or other security threats or other disruptions.
Our businesses depend heavily on information technology and computerized systems to communicate and operate effectively. The Company's systems and technologies, or those of third parties on which we rely, could fail or become unreliable due to equipment failures, software viruses, cyber threats, terrorist acts, natural disasters, power failures or other causes. These threats arise in some cases as a result of our role as a defense contractor.
Cybersecurity threats are evolving and include, but are not limited to, malicious software, attempts to gain unauthorized access to our sensitive information, including that of our customers, suppliers, subcontractors, and joint venture partners, and other electronic security breaches that could lead to disruptions in mission critical systems, unauthorized release of confidential or otherwise protected information, and corruption of data.
Although we utilize various procedures and controls to monitor and mitigate these threats, there can be no assurance that these procedures and controls will be sufficient to prevent security threats from materializing. If any of these events were to materialize, the costs related to cyber or other security threats or disruptions may not be fully insured or indemnified and could have a material adverse effect on our reputation, operating results, and financial condition.
Cancellations, reductions or delays in customer orders may adversely affect our results of operations.
Our overall operating results are affected by many factors, including the timing of orders from large customers and the timing of expenditures to manufacture parts and purchase inventory in anticipation of future sales of products and services. A large portion of our operating expenses are relatively fixed. Because several of our operating locations typically do not obtain long-term purchase orders or commitments from our customers, they must anticipate the future volume of orders based upon the historic purchasing patterns of customers and upon our discussions with customers as to their anticipated future requirements. These historic patterns may be disrupted by many factors, including changing economic conditions, inventory adjustments, or work stoppages or labor disruptions at our customers' locations. Cancellations, reductions or delays in orders by a customer or group of customers could have a material adverse effect on our business, financial condition and results of operations.
In the event that certain of the Company's subsidiaries commence voluntary insolvency proceedings, it could cause a material adverse effect on the Company.
Pursuant to a recent amendment to the Credit Facility (as defined below), the Company’s Vought Aircraft Division (Triumph Aerostructures, LLC) and certain affiliated entities (collectively, the “Vought entities”) have the option, if necessary, to commence voluntary insolvency proceedings within 90 days of the effective date of the amendment, subject to certain conditions set forth in the Credit Facility. Upon the commencement of such proceedings, the Vought entities would no longer be Subsidiary Co-Borrowers under the Credit Facility, and transactions between any of the Vought entities, on the one hand, and the Company and any of the Subsidiary Co-Borrowers, on the other hand, will be restricted. While the commencement of such proceedings would not cause a cross default under the Credit Facility, such a filing could have a material adverse effect on the Company's obligations to and relationships with customers, suppliers, lenders and financing sources.
11
Our acquisition strategy exposes us to risks, including the risk that we may not be able to successfully integrate acquired businesses.
We have a consistent strategy to grow, in part, through the acquisition of additional businesses in the aerospace industry and are continuously evaluating various acquisition opportunities, including those outside the United States and those that may have a material impact on our business. Our ability to grow by acquisition is dependent upon, among other factors, the availability of suitable acquisition candidates. Growth by acquisition involves risks that could adversely affect our operating results, including difficulties in integrating the operations and personnel of acquired companies, the risk of diverting the attention of senior management from our existing operations, the potential amortization of acquired intangible assets, the potential impairment of goodwill and the potential loss of key employees of acquired companies. We may not be able to consummate acquisitions on satisfactory terms or, if any acquisitions are consummated, successfully integrate these acquired businesses.
A significant decline in business with a key customer could have a material adverse effect on us.
Boeing, or Boeing Commercial, Military and Space, represented approximately 35% of our net sales for the fiscal year ended March 31, 2017, covering virtually every Boeing plant and product. Gulfstream represented approximately 12% of our net sales for the fiscal year ended March 31, 2017, covering several Gulfstream plants and products. As a result, a significant reduction in purchases by Boeing and/or Gulfstream could have a material adverse impact on our financial condition, results of operations, and cash flows. In addition, some of our individual companies rely significantly on particular customers, the loss of which could have an adverse effect on those businesses.
Our international sales and operations are subject to applicable laws relating to trade, export controls and foreign corrupt practices, the violation of which could adversely affect our operations.
We must comply with all applicable export control laws and regulations of the United States and other countries. United States laws and regulations applicable to us include the Arms Export Control Act, the International Traffic in Arms Regulations ("ITAR"), the Export Administration Regulations ("EAR") and the trade sanctions laws and regulations administered by the United States Department of the Treasury's Office of Foreign Assets Control ("OFAC"). EAR restricts the export of dual-use products and technical data to certain countries, while ITAR restricts the export of defense products, technical data and defense services. The U.S. Government agencies responsible for administering EAR and ITAR have significant discretion in the interpretation and enforcement of these regulations. We cannot provide services to certain countries subject to United States trade sanctions unless we first obtain the necessary authorizations from OFAC. In addition, we are subject to the Foreign Corrupt Practices Act which generally bars bribes or unreasonable gifts to foreign governments or officials.
Violations of these laws or regulations could result in significant additional sanctions, including fines, more onerous compliance requirements, more extensive debarments from export privileges, loss of authorizations needed to conduct aspects of our international business and criminal penalties and may harm our ability to enter into contracts with the U.S. Government. A future violation of ITAR or the other regulations enumerated above could materially adversely affect our business, financial condition and results of operations.
Our expansion into international markets may increase credit, currency and other risks, and our current operations in international markets expose us to such risks.
As we pursue customers in Asia, South America and other less developed aerospace markets throughout the world, our inability to ensure the creditworthiness of our customers in these areas could adversely impact our overall profitability. In addition, with operations in Canada, China, France, Germany, Ireland, Mexico, Thailand and the United Kingdom, and customers throughout the world, we will be subject to the legal, political, social and regulatory requirements and economic conditions of other jurisdictions. In the future, we may also make additional international capital investments, including further acquisitions of companies outside the United States or companies having operations outside the United States. Risks inherent to international operations include, but are not limited to, the following:
• | difficulty in enforcing agreements in some legal systems outside the United States; |
• | imposition of additional withholding taxes or other taxes on our foreign income, tariffs or other restrictions on foreign trade and investment, including currency exchange controls; |
• | fluctuations in exchange rates which may affect demand for our products and services and may adversely affect our profitability in U.S. dollars; |
• | inability to obtain, maintain or enforce intellectual property rights; |
• | changes in general economic and political conditions in the countries in which we operate; |
12
• | unexpected adverse changes in the laws or regulatory requirements outside the United States, including those with respect to environmental protection, export duties and quotas; |
• | failure by our employees or agents to comply with U.S. laws affecting the activities of U.S. companies abroad; |
• | difficulty with staffing and managing widespread operations; and |
• | difficulty of and costs relating to compliance with the different commercial and legal requirements of the countries in which we operate. |
We may need additional financing for internal growth and acquisitions and capital expenditures and additional financing may not be available on terms acceptable to us.
A key element of our strategy has been, and continues to be, internal growth supplemented by growth through the acquisition of additional aerospace companies and product lines. In order to grow internally, we may need to make significant capital expenditures, such as investing in facilities in low-cost countries, and may need additional capital to do so. Our ability to grow is dependent upon, and may be limited by, among other things, access to markets and conditions of markets, availability under the Credit Facility and the Securitization Facility (each as defined in Note 10 of the "Notes to Consolidated Financial Statements") and by particular restrictions contained in the Credit Facility and our other financing arrangements. In that case, additional funding sources may be needed, and we may not be able to obtain the additional capital necessary to pursue our internal growth and acquisition strategy or, if we can obtain additional financing, the additional financing may not be on financial terms that are satisfactory to us.
Competitive pressures may adversely affect us.
We have numerous competitors in the aerospace industry. We compete primarily with the top-tier systems integrators and the manufacturers that supply them, some of which are divisions or subsidiaries of OEMs and other large companies that manufacture aircraft components and subassemblies. Our OEM competitors, which include Boeing, Airbus, Bell Helicopter, Bombardier, Cessna, General Electric, Gulfstream, Honeywell, Lockheed Martin, Northrop Grumman, Raytheon, Rolls Royce and Sikorsky, may choose not to outsource production of aerostructures or other components due to, among other things, their own direct labor and overhead considerations, capacity utilization at their own facilities and desire to retain critical or core skills. Consequently, traditional factors affecting competition, such as price and quality of service, may not be significant determinants when OEMs decide whether to produce a part in-house or to outsource. We also face competition from non-OEM component manufacturers, including Alenia Aeronautica, Fokker Technologies, Fuji Heavy Industries, GKN Westland Aerospace (U.K.), Kawasaki Heavy Industries, Mitsubishi Heavy Industries, Spirit AeroSystems and UTC Aerospace Systems. Competition for the repair and overhaul of aviation components comes from three primary sources: OEMs, major commercial airlines and other independent repair and overhaul companies.
We may need to expend significant capital to keep pace with technological developments in our industry.
The aerospace industry is constantly undergoing development and change and it is likely that new products, equipment and methods of repair and overhaul service will be introduced in the future. In order to keep pace with any new developments, such as additive technology, we may need to expend significant capital to purchase new equipment and machines or to train our employees in the new methods of production and service.
The construction of aircraft is heavily regulated and failure to comply with applicable laws could reduce our sales or require us to incur additional costs to achieve compliance, and we may incur significant expenses to comply with new or more stringent governmental regulation.
The aerospace industry is highly regulated in the United States by the FAA and in other countries by similar agencies. We must be certified by the FAA and, in some cases, by individual OEMs in order to engineer and service parts, components and aerostructures used in specific aircraft models. If any of our material authorizations or approvals were revoked or suspended, our operations would be adversely affected. New or more stringent governmental regulations may be adopted, or industry oversight heightened in the future, and we may incur significant expenses to comply with any new regulations or any heightened industry oversight.
Our business could be materially adversely affected by product warranty obligations.
Our operations expose us to potential liability for warranty claims made by customers or third parties with respect to aircraft components that have been designed, manufactured, or serviced by us or our suppliers. Material product warranty obligations could have a material adverse effect on our business, financial condition and results of operations.
13
We may not realize our anticipated return on capital commitments made to expand our capabilities.
We continually make significant capital expenditures to implement new processes and to increase both efficiency and capacity. Some of these projects require additional training for our employees and not all projects may be implemented as anticipated. If any of these projects do not achieve the anticipated increase in efficiency or capacity, our returns on these capital expenditures may be lower than expected.
Any product liability claims in excess of insurance may adversely affect our financial condition.
Our operations expose us to potential liability for personal injury or death as a result of the failure of an aircraft component that has been serviced by us or the failure of an aircraft component designed or manufactured by us. While we believe that our liability insurance is adequate to protect us from these liabilities, our insurance may not cover all liabilities. Additionally, should insurance market conditions change, general aviation product liability, insurance coverage may not be available in the future at a cost acceptable to us. Any material liability not covered by insurance or for which third-party indemnification is not available could have a material adverse effect on our financial condition.
The lack of available skilled personnel may have an adverse effect on our operations.
From time to time, some of our operating locations have experienced difficulties in attracting and retaining skilled personnel to design, engineer, manufacture, repair and overhaul sophisticated aircraft components. Our ability to operate successfully could be jeopardized if we are unable to attract and retain a sufficient number of skilled personnel to conduct our business.
Our fixed-price contracts may commit us to unfavorable terms.
A significant portion of our net sales are derived from fixed-price contracts under which we have agreed to provide components or aerostructures for a price determined on the date we entered into the contract. Several factors may cause the costs we incur in fulfilling these contracts to vary substantially from our original estimates, and we bear the risk that increased or unexpected costs may reduce our profit or cause us to sustain losses on these contracts. In a fixed-price contract, we must fully absorb cost overruns, notwithstanding the difficulty of estimating all of the costs we will incur in performing these contracts. Because our ability to terminate contracts is generally limited, we may not be able to terminate our performance requirements under these contracts at all or without substantial liability and, therefore, in the event we are sustaining reduced profits or losses, we could continue to sustain these reduced profits or losses for the duration of the contract term. Our failure to anticipate technical problems, estimate delivery reductions, estimate costs accurately or control costs during performance of a fixed-price contract may reduce our profitability or cause significant losses on programs similar in nature to the forward losses incurred on the Boeing 747-8 ("747-8 program") and Bombardier Global 7000/8000 contracts.
Due to the size and long-term nature of many of our contracts, we are required by GAAP to estimate sales and expenses relating to these contracts in our financial statements, which may cause actual results to differ materially from those estimated under different assumptions or conditions.
Our financial statements are prepared in conformity with accounting principles generally accepted in the United States ("GAAP"). These principles require our management to make estimates and assumptions regarding our contracts that affect the reported amounts of revenue and expenses during the reporting period. Contract accounting requires judgment relative to assessing risks, estimating contract sales and costs, and making assumptions for schedule and technical issues. Due to the size and nature of many of our contracts, the estimation of total sales and cost at completion is complicated and subject to many variables. While we base our estimates on historical experience and on various assumptions that we believe to be reasonable under the circumstances at the time made, actual results may differ materially from those estimated.
Any exposure to environmental liabilities may adversely affect us.
Our business, operations and facilities are subject to numerous stringent federal, state, local and foreign environmental laws and regulations, and we are subject to potentially significant fines or penalties, including criminal sanctions, if we fail to comply with these requirements. In addition, we could be affected by future laws and regulations, including those imposed in response to climate change concerns and other actions commonly referred to as "green initiatives." Compliance with current and future environmental laws and regulations currently requires and is expected to continue to require significant operating and capital costs.
Pursuant to certain environmental laws, a current or previous owner or operator of a contaminated site may be held liable for the entire cost of investigation, removal or remediation of hazardous materials at such property, whether the owner or operator knew of, or was responsible for, the presence of any hazardous materials. Although management believes that our operations and facilities are in material compliance with such laws and regulations, future changes in such laws, regulations or
14
interpretations thereof or the nature of our operations or regulatory enforcement actions which may arise, may require us to make significant additional capital expenditures to ensure compliance in the future. Certain of our facilities, including facilities acquired and operated by us or one of our subsidiaries, have at one time or another been under active investigation for environmental contamination by federal or state agencies when acquired and, at least in some cases, continue to be under investigation or subject to remediation for potential or identified environmental contamination. Lawsuits, claims and costs involving environmental matters are likely to continue to arise in the future. Individual facilities of ours have also been subject to investigation on occasion for possible past waste disposal practices which might have contributed to contamination at or from remote third-party waste disposal sites. In some instances, we are indemnified by prior owners or operators and/or present owners of the facilities for liabilities which we incur as a result of these investigations and the environmental contamination found which pre-dates our acquisition of these facilities, subject to certain limitations, including, but not limited to specified exclusions, deductibles and limitations on the survival period of the indemnity. We also maintain a pollution liability policy that provides coverage, subject to specified limitations, for specified material liabilities associated with the clean-up of certain on-site pollution conditions, as well as defense and indemnity for certain third-party suits (including Superfund liabilities at third-party sites), in each case, to the extent not otherwise indemnified. Also, as we proceed with our plans to exit certain facilities as part of restructuring and related initiatives, the need for remediation for potential environmental contamination could be identified. However, if we are required to pay the expenses related to environmental liabilities because neither indemnification nor insurance coverage is available, these expenses could have a material adverse effect on our financial position, results of operations, and cash flows.
We could become involved in intellectual property litigation, which could have a material and adverse impact on our profitability.
We and other companies in our industry possess certain proprietary rights relating to designs, engineering, manufacturing processes and repair and overhaul procedures. In the event that we believe that a third party is infringing upon our proprietary rights, we may bring an action to enforce such rights. In addition, third parties may claim infringement by us with respect to their proprietary rights and may initiate legal proceedings against us in the future. The expense and time of bringing an action to enforce such rights or defending against infringement claims can be significant. Intellectual property litigation involves complex legal and factual questions which makes the outcome of any such proceedings subject to considerable uncertainty. Not only can such litigation divert management's attention, but it can also expose the Company to damages and potential injunctive relief which, if granted, may preclude the Company from making, using or selling particular products or technology. The expense and time associated with such litigation may have a material and adverse impact on our profitability.
We do not own certain intellectual property and tooling that is important to our business.
In our overhaul and repair businesses, OEMs of equipment that we maintain for our customers include language in repair manuals relating to their equipment asserting broad claims of proprietary rights to the contents of the manuals used in our operations. Although we believe that our use of manufacture and repair manuals is lawful, there can be no assurance that OEMs will not try to enforce such claims, including through the possible use of legal proceedings, or that any such actions will be unsuccessful.
Our business also depends on using certain intellectual property and tooling that we have rights to use pursuant to license grants under our contracts with our OEM customers. These contracts contain restrictions on our use of the intellectual property and tooling and may be terminated if we violate certain of these restrictions. Our loss of a contract with an OEM customer and the related license rights to use an OEM's intellectual property or tooling would materially adversely affect our business.
Any significant disruption from key suppliers of raw materials and key components could delay production and decrease revenue.
We are highly dependent on the availability of essential raw materials such as carbon fiber, aluminum and titanium, and purchased engineered component parts from our suppliers, many of which are available only from single customer-approved sources. Moreover, we are dependent upon the ability of our suppliers to provide raw materials and components that meet our specifications, quality standards and delivery schedules. Our suppliers' failure to provide expected raw materials or component parts could require us to identify and enter into contracts with alternate suppliers that are acceptable to both us and our customers, which could result in significant delays, expenses, increased costs and management distraction and adversely affect production schedules and contract profitability.
We have from time to time experienced limited interruptions of supply, and we may experience a significant interruption in the future. Our continued supply of raw materials and component parts are subject to a number of risks including:
• | availability of capital to our suppliers; |
15
• | the destruction of our suppliers' facilities or their distribution infrastructure; |
• | a work stoppage or strike by our suppliers' employees; |
• | the failure of our suppliers to provide raw materials or component parts of the requisite quality; |
• | the failure of essential equipment at our suppliers' plants; |
• | the failure or shortage of supply of raw materials to our suppliers; |
• | contractual amendments and disputes with our suppliers; |
• | reduction to credit terms; and |
• | geopolitical conditions in the global supply base. |
In addition, some contracts with our suppliers for raw materials, component parts and other goods are short-term contracts, which are subject to termination on a relatively short-term basis. The prices of our raw materials and component parts fluctuate depending on market conditions, and substantial increases in prices could increase our operating costs, which, as a result of our fixed-price contracts, we may not be able to recoup through increases in the prices of our products.
Due to economic difficulty, we may face pressure to renegotiate agreements resulting in lower margins. Our suppliers may discontinue provision of products to us at attractive prices or at all, and we may not be able to obtain such products in the future from these or other providers on the scale and within the time periods we require. Furthermore, substitute raw materials or component parts may not meet the strict specifications and quality standards we and our customers demand, or that the U.S. Government requires. If we are not able to obtain key products on a timely basis and at an affordable cost, or we experience significant delays or interruptions of their supply, revenues from sales of products that use these supplies will decrease.
Our operations depend on our manufacturing facilities, which are subject to physical and other risks that could disrupt production.
Our manufacturing facilities or our customers' facilities could be damaged or disrupted by a natural disaster, war, or terrorist activity. We maintain property damage and business interruption insurance at the levels typical in our industry or for our customers and suppliers, however, a major catastrophe, such as an earthquake, hurricane, fire, flood, tornado or other natural disaster at any of our sites, or war or terrorist activities in any of the areas where we conduct operations could result in a prolonged interruption of our business. Any disruption resulting from these events could cause significant delays in shipments of products and the loss of sales and customers and we may not have insurance to adequately compensate us for any of these events. For leased facilities, timely renewal of leases and risk mitigation from the sale of our leased facilities is required to avoid any business interruption.
Our reputation, our ability to do business and our financial position, results of operations and/or cash flows may be impacted by the improper conduct of employees, agents, subcontractors, suppliers, business partners or joint ventures in which we participate.
We have implemented policies, procedures, training and other compliance controls, and have negotiated terms designed to prevent misconduct by employees, agents or others working on our behalf or with us that would violate the applicable laws of the jurisdictions in which we operate, including laws governing improper payments to government officials, the protection of export controlled or classified information, cost accounting and billing, competition and data privacy. However, we cannot ensure that we will prevent all such misconduct committed by our employees, agents, subcontractors, suppliers, business partners or others working on our behalf or with us, and this risk of improper conduct may increase as we expand globally. In the ordinary course of our business we form and are members of joint ventures. We may be unable to prevent misconduct or other violations of applicable laws by these joint ventures (including their officers, directors and employees) or our partners. Improper actions by those with whom or through whom we do business (including our employees, agents, subcontractors, suppliers, business partners and joint ventures) could subject us to administrative, civil or criminal investigations and monetary and non-monetary penalties, including suspension and debarment, which could negatively impact our reputation and ability to conduct business and could have a material adverse effect on our financial position, results of operations and/or cash flows.
Significant consolidation by aerospace industry suppliers could adversely affect our business.
The aerospace industry continues to experience consolidation among suppliers and customers, primarily the airlines. Suppliers have consolidated and formed alliances to broaden their product and integrated system offerings and achieve critical mass. This supplier consolidation is in part attributable to aircraft manufacturers more frequently awarding long-term sole-source or preferred supplier contracts to the most capable suppliers, thus reducing the total number of suppliers. This consolidation could cause us to compete against certain competitors with greater financial resources, market penetration and
16
purchasing power. When we purchase component parts and services from suppliers to manufacture our products, consolidation reduces price competition between our suppliers, which could diminish incentives for our suppliers to reduce prices. If this consolidation continues, our operating costs could increase and it may become more difficult for us to be successful in obtaining new customers.
We may be subject to work stoppages at our facilities or those of our principal customers and suppliers, which could seriously impact the profitability of our business.
At March 31, 2017, we employed 14,309 people, of which 12.4% belonged to unions. Our unionized workforces and those of our customers and suppliers may experience work stoppages. For example, during the quarter ended June 30, 2016, we settled the strike and agreed to a new collective bargaining agreement with our union employees with IAM District 751 at our Spokane, Washington facility which had expired during the quarter. While we were in negotiations with the workforce, we were able to implement plans that allowed us to continue production in Spokane with the support from our other locations. Our union employees with Local 848 at our Red Oak, Texas and Local 952 at our Tulsa, Oklahoma, facilities of the United Auto Workers ("UAW") are currently working without a contract. If we are unable to negotiate a contract with those workforces, our operations may be disrupted and we may be prevented from completing production and delivery of products from those facilities, which would negatively impact our results. Contingency plans have been developed that would allow production to continue in the event of a strike.
Many aircraft manufacturers, airlines and aerospace suppliers have unionized workforces. Strikes, work stoppages or slowdowns experienced by aircraft manufacturers, airlines or aerospace suppliers could reduce our customers' demand for our products or prevent us from completing production. In turn, this may have a material adverse effect on our financial condition, results of operations and cash flows.
Financial market conditions may adversely affect the benefit plan assets for our defined benefit plans, increase funding requirements and materially impact our statements of financial position and cash flows.
Our benefit plan assets are invested in a diversified portfolio of investments in both the equity and debt categories, as well as limited investments in other alternative investments. The current market values of all of these investments, as well as the related benefit plan liabilities are impacted by the movements and volatility in the financial markets. In accordance with the Compensation—Retirement Benefits topic of the Accounting Standards Codification ("ASC"), we have recognized the over-funded or under-funded status of a defined benefit postretirement plan as an asset or liability on our balance sheet, and will recognize changes in that funded status in the year in which the changes occur. The funded status is measured as the difference between the fair value of the plan's assets and the projected benefit obligation. A decrease in the fair value of these plan assets or a decrease in interest rates resulting from movements in the financial markets will increase the under-funded status of the plans recorded on our Consolidated Balance Sheet and result in additional cash funding requirements to meet the minimum required funding levels.
The U.S. government is a significant customer of our largest customers, and we and they are subject to specific U.S. Government contracting rules and regulations.
The military aircraft manufacturers' business, and by extension, our business, is affected by the U.S. government's continued commitment to programs under contract with our customers. The terms of defense contracts with the U.S. government generally permit the government to terminate contracts partially or completely, either for its convenience or if we default by failing to perform under the contract. Termination for convenience provisions provide only for our recovery of unrecovered costs incurred or committed, settlement expenses and profit on the work completed prior to termination. Termination for default provisions provide for the contractor to be liable for excess costs incurred by the U.S. government in procuring undelivered items from another source. On contracts where the price is based on cost, the U.S. government may review our costs and performance, as well as our accounting and general business practices. Based on the results of such audits, the U.S. government may adjust our contract-related costs and fees, including allocated indirect costs. In addition, under U.S. government purchasing regulations, some of our costs, including most financing costs, portions of research and development costs, and certain marketing expenses may not be subject to reimbursement.
We bear the potential risk that the U.S. government may unilaterally suspend our customers or us from new contracts pending the resolution of alleged violations of procurement laws or regulations. Sales to the U.S. government are also subject to changes in the government's procurement policies in advance of design completion. An unexpected termination of, or suspension from, a significant government contract, a reduction in expenditures by the U.S. government for aircraft using our products, lower margins resulting from increasingly competitive procurement policies, a reduction in the volume of contracts awarded to us, or substantial cost overruns could have a material adverse effect on our financial condition, results of operations and cash flows.
17
We are subject to the requirements of the National Industrial Security Program Operating Manual for facility security clearance, which is a prerequisite for our ability to perform on classified contracts for the U.S. Government.
DoD facility security clearance is required in order to be awarded and perform on classified contracts for the DoD and certain other agencies of the U.S. Government, which is a significant part of our business. We have obtained clearance at appropriate levels that require stringent qualifications, and we may be required to seek higher level clearances in the future. We cannot assure you that we will be able to maintain our security clearance. If for some reason our security clearance is invalidated or terminated, we may not be able to continue to perform our present classified contracts or be able to enter into new classified contracts, which could affect our ability to compete for and capture new business.
Regulations related to conflict minerals have and will continue to force us to incur additional expenses, may make our supply chain more complex, and could adversely impact our business.
The Dodd-Frank Wall Street Reform and Consumer Protection Act of 2010 contains provisions to improve transparency and accountability concerning the supply of certain minerals and metals, known as conflict minerals, originating from the Democratic Republic of Congo (the "DRC") and adjoining countries. As a result, in August 2012, the SEC adopted annual investigation, disclosure and reporting requirements for those companies that manufacture or contract to manufacture products that contain conflict minerals that originated from the DRC and adjoining countries. We have and will continue to incur compliance costs, including costs related to determining the sources of conflict minerals used in our products and other potential changes to processes or sources of supply as a consequence of such verification activities. The implementation of these rules could adversely affect the sourcing, supply and pricing of materials used in certain of our products. As there may be only a limited number of suppliers offering "conflict free" minerals, we cannot be sure that we will be able to obtain necessary conflict-free minerals from such suppliers in sufficient quantities or at competitive prices. Also, we may face reputational challenges if we determine that certain of our products contain minerals not determined to be conflict free.
Our business is subject to regulation in the United States and internationally.
The manufacturing of our products is subject to numerous federal, state and foreign governmental regulations. The number of laws and regulations that are being enacted or proposed by various governmental bodies and authorities are increasing. Compliance with these regulations is difficult and expensive. If we fail to adhere, or are alleged to have failed to adhere, to any applicable federal, state or foreign laws or regulations, or if such laws or regulations negatively affect sales of our products, our business, prospects, results of operations, financial condition or cash flows may be adversely affected. In addition, our future results could be adversely affected by changes in applicable federal, state and foreign laws and regulations, or the interpretation or enforcement thereof, including those relating to manufacturing processes, product liability, government contracts, trade rules and customs regulations, intellectual property, consumer laws, privacy laws, as well as accounting standards and taxation requirements (including tax-rate changes, new tax laws, revised tax law interpretations, or other potential impacts outlined in proposals on U.S. Tax Reform)
Item 1B. | Unresolved Staff Comments |
None.
Item 2. | Properties |
As of March 31, 2017, our segments owned or leased the following facilities with the following square footage:
(Square feet in thousands) | Owned | Leased | Total | |||||
Integrated Systems | 1,141 | 823 | 1,964 | |||||
Aerospace Structures | 3,373 | 3,475 | 6,848 | |||||
Precision Components | 1,777 | 2,611 | 4,388 | |||||
Product Support | 562 | 540 | 1,102 | |||||
Corporate | — | 22 | 22 | |||||
Total | 6,853 | 7,471 | 14,324 | |||||
At March 31, 2017, our segments occupied 7.3 million square feet of floor space at the following major locations:
• | Integrated Systems: West Hartford, Connecticut; and Park City, Utah |
18
• | Aerospace Structures: Nashville, Tennessee; Hawthorne, California; Red Oak, Texas; Grand Prairie, Texas; and Stuart, Florida |
• | Precision Components: Milledgeville, Georgia; and Spokane, Washington |
• | Product Support: Hot Springs, Arkansas |
We believe that our properties are adequate to support our operations for the foreseeable future.
Item 3. | Legal Proceedings |
On December 22, 2016, Triumph Aerostructures, LLC, a wholly owned subsidiary of the Company (“Triumph Aerostructures”), initiated litigation against Bombardier, Inc. (“Bombardier”) in the Quebec Superior Court, District of Montreal. The lawsuit related to Bombardier’s failure to pay to Triumph Aerostructures certain non-recurring expenses incurred by Triumph Aerostructures during the development phase of a program pursuant to which Triumph Aerostructures agreed to design, manufacture, and supply the wing and related components for Bombardier’s Global 7000 business aircraft.
In May 2017, Triumph Aerostructures and Bombardier entered into a comprehensive settlement agreement that resolves all outstanding commercial disputes between them, including all pending litigation, related to the design, manufacture and supply of wing components for Bombardier’s Global 7000 business aircraft. The settlement resets the commercial relationship between the companies and allows each company to better achieve its business objectives going forward.
In the ordinary course of business, we are involved in disputes, claims and lawsuits with employees, suppliers and customers, as well as governmental and regulatory inquiries, that are deemed to be immaterial. Some may involve claims or potential claims of substantial damages, fines, penalties or injunctive relief. While we cannot predict the outcome of any pending or future litigation or proceeding and no assurances can be given, we do not believe that any pending matter will have a material effect, individually or in the aggregate, on its financial position or results of operations.
Item 4. | Mine Safety Disclosures |
Not applicable.
19
PART II
Item 5. | Market for Registrant's Common Equity, Related Stockholder Matters and Issuer Purchases of Equity Securities |
Range of Market Price
Our common stock is traded on the New York Stock Exchange under the symbol "TGI." The following table sets forth the range of high and low prices for our common stock for the periods indicated:
High | Low | ||||||
Fiscal 2016 | |||||||
1st Quarter | $ | 70.68 | $ | 57.25 | |||
2nd Quarter | 67.16 | 41.14 | |||||
3rd Quarter | 47.28 | 32.82 | |||||
4th Quarter | 40.36 | 22.94 | |||||
Fiscal 2017 | |||||||
1st Quarter | $ | 40.09 | $ | 29.97 | |||
2nd Quarter | 39.88 | 26.31 | |||||
3rd Quarter | 31.00 | 22.40 | |||||
4th Quarter | 29.00 | 23.00 | |||||
On May 22, 2017, the reported closing price for our common stock was $24.30. As of May 22, 2017, there were approximately 102 holders of record of our common stock and we believe that our common stock was beneficially owned by approximately 30,000 persons.
Dividend Policy
During fiscal 2017 and 2016, we paid cash dividends of $0.16 per share and $0.16 per share, respectively. However, our declaration and payment of cash dividends in the future and the amount thereof will depend upon our results of operations, financial condition, cash requirements, future prospects, limitations imposed by credit agreements or indentures governing debt securities and other factors deemed relevant by our Board of Directors. No assurance can be given that cash dividends will continue to be declared and paid at historical levels or at all. Certain of our debt arrangements, including the Credit Facility, restrict our paying dividends and making distributions on our capital stock, except for the payment of stock dividends and redemptions of an employee's shares of capital stock upon termination of employment. On April 28, 2017, the Company announced that its Board of Directors declared a regular quarterly dividend of $0.04 per share on its outstanding common stock. The dividend is payable on June 15, 2017, to stockholders of record as of June 1, 2017.
Repurchases of Stock
In December 1998, we announced a program to repurchase up to 500,000 shares of our common stock. In February 2008, the Company's Board of Directors authorized an increase in the Company's existing stock repurchase program by up to an additional 500,000 shares of its common stock. In February 2014, the Company's Board of Directors authorized an increase in the Company's existing stock repurchase program by up to an additional 5,000,000 shares of its common stock. During the fiscal years ended March 31, 2017 and 2016, we did not repurchase any shares. During the fiscal years ended March 31, 2015 and 2014, we repurchased 2,923,011 and 300,000 shares, respectively, for a purchase price of $184.4 million and $19.1 million, respectively. From the inception of the program through March 31, 2013, we repurchased 499,200 shares (prior to fiscal 2012 stock split) for a purchase price of $19.2 million. Repurchases may be made from time to time in open market transactions, block purchases, privately negotiated transactions or otherwise at prevailing prices. No time limit has been set for completion of the program. As a result, as of May 24, 2017, the Company remains able to purchase an additional 2,277,789 shares.
20
Equity Compensation Plan Information
The information required regarding equity compensation plan information will be included in our Proxy Statement in connection with our 2017 Annual Meeting of Stockholders to be held on July 20, 2017, under the heading "Equity Compensation Plan Information" and is incorporated herein by reference.
The following graph compares the cumulative 5-year total return provided stockholders on our common stock relative to the cumulative total returns of the Russell 1000 index and the S&P Aerospace & Defense index. An investment of $100 (with reinvestment of all dividends) is assumed to have been made in our common stock and in each of the indexes on March 31, 2012, and its relative performance is tracked through March 31, 2017.
COMPARISON OF 5-YEAR CUMULATIVE TOTAL RETURN*
Among Triumph Group, Inc., and The Russell 1000 Indexes
And The S&P Aerospace & Defense Index
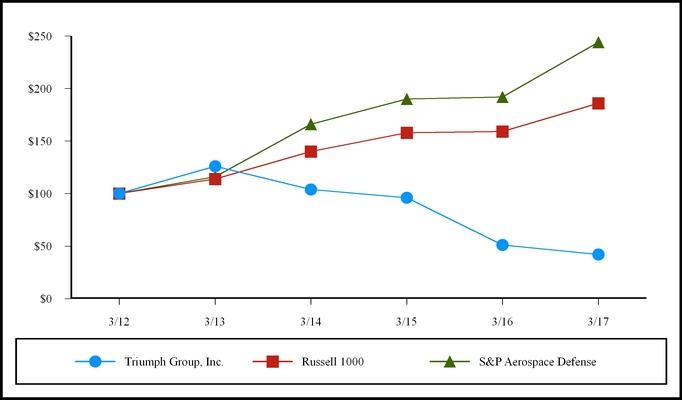
* $100 invested on March 31, 2012 in stock or index, including reinvestment of dividends.
Fiscal year ended March 31 | |||||||||||
2011 | 2012 | 2013 | 2014 | 2015 | 2016 | ||||||
Triumph Group, Inc. | 100.00 | 142.05 | 178.40 | 147.09 | 136.55 | 72.14 | |||||
Russell 1000 | 100.00 | 107.86 | 123.42 | 151.09 | 170.33 | 171.18 | |||||
S&P Aerospace & Defense | 100.00 | 104.54 | 121.06 | 173.68 | 198.30 | 200.23 | |||||
The stock price performance included in this graph is not necessarily indicative of future stock price performance.
21
Item 6. | Selected Financial Data |
The following selected financial data should be read in conjunction with the Consolidated Financial Statements and related Notes thereto and "Management's Discussion and Analysis of Financial Condition and Results of Operations" included herein.
Fiscal Year Ended March 31, | |||||||||||||||||||
2017(1) | 2016(2) | 2015(3) | 2014(4) | 2013(5) | |||||||||||||||
(in thousands, except per share data) | |||||||||||||||||||
Operating Data: | |||||||||||||||||||
Net sales | $ | 3,532,799 | $ | 3,886,072 | $ | 3,888,722 | $ | 3,763,254 | $ | 3,702,702 | |||||||||
Cost of sales | 2,689,818 | 3,597,299 | 3,141,453 | 2,911,802 | 2,763,488 | ||||||||||||||
842,981 | 288,773 | 747,269 | 851,452 | 939,214 | |||||||||||||||
Selling, general and administrative expense | 281,547 | 287,349 | 285,773 | 254,715 | 241,349 | ||||||||||||||
Depreciation and amortization | 176,946 | 177,755 | 158,323 | 164,277 | 129,506 | ||||||||||||||
Impairment of intangible assets | 266,298 | 874,361 | — | — | — | ||||||||||||||
Restructuring | 42,177 | 36,182 | 3,193 | 31,290 | 2,665 | ||||||||||||||
Loss on divestitures | 19,124 | — | — | — | — | ||||||||||||||
Curtailments, settlements and early retirement incentives | — | (1,244 | ) | — | 1,166 | 34,481 | |||||||||||||
Loss (gain) on legal settlement, net | — | 5,476 | (134,693 | ) | — | — | |||||||||||||
Operating income (loss) | 56,889 | (1,091,106 | ) | 434,673 | 400,004 | 531,213 | |||||||||||||
Interest expense and other | 80,501 | 68,041 | 85,379 | 87,771 | 68,156 | ||||||||||||||
(Loss) income from continuing operations, before income taxes | (23,612 | ) | (1,159,147 | ) | 349,294 | 312,233 | 463,057 | ||||||||||||
Income tax expense (benefit) | 19,340 | (111,187 | ) | 110,597 | 105,977 | 165,710 | |||||||||||||
Net (loss) income | $ | (42,952 | ) | $ | (1,047,960 | ) | $ | 238,697 | $ | 206,256 | $ | 297,347 | |||||||
Earnings per share: | |||||||||||||||||||
(Loss) income from continuing operations: | |||||||||||||||||||
Basic | $ | (0.87 | ) | $ | (21.29 | ) | $ | 4.70 | $ | 3.99 | $ | 5.99 | |||||||
Diluted(6) | $ | (0.87 | ) | $ | (21.29 | ) | $ | 4.68 | $ | 3.91 | $ | 5.67 | |||||||
Cash dividends declared per share | $ | 0.16 | $ | 0.16 | $ | 0.16 | $ | 0.16 | $ | 0.16 | |||||||||
Shares used in computing earnings per share: | |||||||||||||||||||
Basic | 49,303 | 49,218 | 50,796 | 51,711 | 49,663 | ||||||||||||||
Diluted(6) | 49,303 | 49,218 | 51,005 | 52,787 | 52,446 | ||||||||||||||
As of March 31, | |||||||||||||||||||
2017(1) | 2016(2) | 2015(3) | 2014(4) | 2013(5) | |||||||||||||||
(in thousands) | |||||||||||||||||||
Balance Sheet Data: | |||||||||||||||||||
Working capital | $ | 438,659 | $ | 606,767 | $ | 1,023,144 | $ | 1,141,741 | $ | 892,818 | |||||||||
Total assets | 4,414,600 | 4,835,093 | 5,956,325 | 5,553,386 | 5,239,179 | ||||||||||||||
Long-term debt, including current portion | 1,196,300 | 1,417,320 | 1,368,600 | 1,550,383 | 1,329,863 | ||||||||||||||
Total stockholders' equity | $ | 846,473 | $ | 934,944 | $ | 2,135,784 | $ | 2,283,911 | $ | 2,045,158 | |||||||||
(1) | Includes the divestitures of Triumph Aerospace Systems-Newport News, Inc. (September 2016) and Triumph Air Repair, the Auxiliary Power Unit Overhaul Operations of Triumph Aviations Services - Asia, Ltd. and Triumph Engines - Tempe (December 2016). See Notes to the Consolidated Financial Statements. |
(2) | Includes the acquisition of Fairchild Controls Corporation (October 2015) from the date of acquisition, forward losses on the Bombardier and 747-8 programs of $561,158 (March 2016). See Notes to the Consolidated Financial Statements. |
(3) | Includes the acquisitions of Spirit AeroSystems Holdings, Inc. - Gulfstream G650 and G280 Wings Programs and forward losses on the 747-8 program of $151,992 (December 2014), North American Aircraft Services, Inc. (October 2014) and GE Aviation - Hydraulic Actuation (June 2014) from the date of each respective acquisition. See Notes to the Consolidated Financial Statements. |
(4) | Includes the acquisitions of Insulfab Product Line (Chase Corporation) (October 2013), General Donlee Canada, Inc. (October 2013) and Primus Composites (May 2013) from the date of each respective acquisition. Includes the divestitures of Triumph Aerospace Systems - Wichita (January |
22
2014) and Triumph Instruments (April 2013) from the date of respective divestiture. See Note 3 and 4 to the Consolidated Financial Statements, respectively.
(5) | Includes the acquisitions of Goodrich Pump & Engine Control Systems, Inc. (March 2013) and Embee, Inc. (December 2012) from the date of each respective acquisition. |
(6) | Diluted earnings per share for the fiscal years ended March 31, 2015, 2014 and 2013, included 40,177, 811,083 and 2,400,439 shares, respectively, related to the dilutive effects of the Company's Convertible Notes. |
Item 7. | Management's Discussion and Analysis of Financial Condition and Results of Operations |
The following discussion should be read in conjunction with the Consolidated Financial Statements and notes thereto contained elsewhere herein.
OVERVIEW
We are a major supplier to the aerospace industry and have four operating segments: (i) Integrated Systems, whose companies’ revenues are derived from integrated solutions including design, development and support of proprietary components, subsystems and systems, as well as production of complex assemblies using external designs; (ii) Aerospace Structures, whose companies supply commercial, business, regional and military manufacturers with large metallic and composite structures; (iii) Precision Components, whose companies produce close-tolerance parts primarily to customer designs and model based definition, including a wide range of aluminum, hard metal and composite structure capabilities; and (iv) Product Support, whose companies provide full life cycle solutions for commercial, regional and military aircraft.
In February 2017, the Company sold Triumph Air Repair, the Auxiliary Power Unit Overhaul Operations of Triumph Aviations Services - Asia, Ltd. and Triumph Engines - Tempe ("Engines and APU") for total cash proceeds of $60.4 million. As a result, the Company recognized a loss of $14.3 million on the sale which is presented on the accompanying Consolidated Statements of Operations as "Loss on divestitures" and is included in Corporate. For financial statement purposes, the assets and liabilities of these business have been segregated from those of the continuing operations and are presented on the accompanying Consolidated Balance Sheets as "Assets held for sale" and "Liabilities related to assets held for sale", respectively. The operating results of Engines and APU will be included in Product Support through the date of disposal. The transaction is expected to close in stages by the end of the fiscal year ending March 31, 2018.
In September 2016, the Company sold all of the shares of Triumph Aerospace Systems-Newport News, Inc. ("TAS-Newport News) for total cash proceeds of $9.0 million. As a result of the sale of TAS-Newport News, the Company recognized a loss of $4.9 million on the sale which is presented on the accompanying Consolidated Statements of Operations as "Loss on divestitures" and is included in Corporate. The operating results of TAS-Newport News were included in Integrated Systems through the date of disposal.
Significant financial results for the fiscal year ended March 31, 2017 include:
• | Net sales for fiscal 2017 decreased 9.1% to $3.53 billion, including a 8.9% decrease in organic sales. |
• | Operating income for fiscal 2017 was $56.9 million. |
• | Included in operating income for fiscal 2017 was a non-cash impairment charge of $266.3 million related to goodwill associated with the Aerospace Structures reporting unit and restructuring charges of $53.0 million, partially offset by the reduction to the previously recognized forward losses on the 747-8 program of $131.4 million. |
• | Net loss for fiscal 2017 was $43.0 million. |
• | Backlog decreased 4.2% over the prior year to $3.98 billion. |
For the fiscal year ended March 31, 2017, net sales totaled $3.53 billion, a 9.1% decrease from fiscal year 2016 net sales of $3.89 billion. The net loss for fiscal year 2017 decreased 95.9% to $43.0 million, or $0.87 per diluted common share, versus the net loss of $1,048.0 million, or $21.29 per diluted common share, for fiscal year 2016.
Our working capital needs are generally funded through cash flows from operations and borrowings under our credit arrangements. For the fiscal year ended March 31, 2017, we generated $281.5 million of cash flows from operating activities, received $34.4 million from investing activities and used $266.5 million from financing activities. Cash flows from operating activities in fiscal year 2016 was $83.9 million.
23
The Company has committed to several plans that incorporate the restructuring of certain its businesses as well as the consolidation of certain of its facilities. The Company expects to reduce its footprint by approximately 4.5 million square feet and to reduce head count by 1,300 employees approximately 1,000 of which have exited as of March 31, 2017. Over the course of programs (which were initiated in fiscal 2016), the Company estimates that it will record aggregate pre-tax charges of $195.0 million to $210.0 million related to these programs, which represent employee termination benefits, contract termination costs, accelerated depreciation and facility closure and other exit costs, and will result in future cash outlays. For the fiscal years ended March 31, 2017 and 2016, the Company recorded charges of $53.0 million and $81.0 million, respectively, related to these programs.
We are currently performing work on several new programs, which are in various stages of development. Several of the these programs have entered flight testing, including the Bombardier Global 7000/8000 ("Global 7000/8000") and Embraer second generation E-Jet ("E2-Jets") and we expect to deliver revenue generating production units for these programs in fiscal 2018. Historically, low-rate production commences during flight testing, followed by an increase to full-rate production, assuming that successful testing and certification are achieved. Accordingly, we anticipate that each of these programs will begin generating full-rate production level revenues between fiscal 2019 and fiscal 2021. We are still in the early development stages for the Gulfstream G500/G600 programs, as these aircraft are not expected to enter service until fiscal 2019. Transition of each of these programs from development to recurring production levels is dependent upon the success of each program at achieving flight testing and certification, as well as the ability of the OEM to generate acceptable levels of aircraft sales.
While work progressed on these development programs, we have experienced difficulties in achieving estimated cost targets particularly in the areas of engineering and estimated recurring costs. In the fourth quarter of fiscal 2016, we recorded a $399.8 million forward loss on our Global 7000/8000 wing contract. The Global 7000/8000 contract provides for fixed pricing and requires us to fund certain up-front development expenses, with certain milestone payments made by Bombardier.
The provision for forward losses on the Global 7000/8000 program resulted in the impairment of previously capitalized pre-production costs due to the combination of cost recovery uncertainty, higher than anticipated non-recurring costs and increased forecasted costs on recurring production. The increases in costs were driven by several factors, including: changing technical requirements, increased spending on the design and engineering phase of the program and uncertainty regarding cost reduction and cost recovery initiatives with our customer and suppliers.
The program has continued to incur costs since March 2016 in support of development and transition to production.
On December 22, 2016, Triumph Aerostructures, LLC, the wholly owned subsidiary of the Company that is party to the Global 7000/8000 contract with Bombardier (“Triumph Aerostructures”), initiated litigation against Bombardier in the Quebec Superior Court, District of Montreal. The lawsuit related to Bombardier’s failure to pay to Triumph Aerostructures certain non-recurring expenses incurred by Triumph Aerostructures during the development phase of a program pursuant to which Triumph Aerostructures agreed to design, manufacture, and supply the wing and related components for Bombardier’s Global 7000 business aircraft.
In May 2017, Triumph Aerostructures and Bombardier entered into a comprehensive settlement agreement that resolves all outstanding commercial disputes between them, including all pending litigation, related to the design, manufacture and supply of wing components for Bombardier’s Global 7000 business aircraft. The settlement resets the commercial relationship between the companies and allows each company to better achieve its business objectives going forward.
Further cost increases or an inability to meet revised recurring cost forecasts on the Global 7000/8000 program will likely result in additional forward loss reserves in future periods, while improvements in future costs compared to current estimates or additional cost recovery may result in favorable adjustments if forward loss reserves are no longer required.
Under our contract with Embraer, we have the exclusive right to design, develop and manufacture the center fuselage section III, rear fuselage section and various tail section components (rudder and elevator) for the E2-Jets over the initial 600 ship sets. The contract provides for funding on a fixed amount of non-recurring costs, which will be paid over a specified number of production units. Higher than expected spending on the E2-Jets program has resulted in a near breakeven estimated profit margin percentage, with additional potential future cost pressures as well as opportunities for improved performance. Risks related to additional engineering as well as the recurring cost profile remains as this program completes flight testing.
We seek additional consideration for customer work statement changes throughout the development process as a standard course of business. The ability to recover or negotiate additional consideration is not certain and varies by contract. Varying market conditions for these products may also impact future profitability.
24
Although none of these new programs individually are expected to have a material impact on our net revenues, they do have the potential, either individually or in the aggregate, to materially and negatively impact our consolidated results of operations if future changes in estimates result in the need for a forward loss provision. Absent any such loss provisions, we do not anticipate that any of these new programs will significantly dilute our future consolidated margins.
In March 2017, the Company settled several outstanding change orders and open pricing on a number of its programs with Boeing. The agreement included pricing settlements, advanced payments, delivery schedule adjustments and the opportunity to extend the mutual relationship on future programs. The agreement also provides for continued build ahead on the 747-8 program through the end of the existing contract, resulting in a reduction to the previously recognized forward losses on the 747-8 program.
As disclosed during fiscal 2016, Boeing announced a rate reduction to the 747-8 program, which lowered production to one plane every two months, the impact of the rate reduction resulted in an additional $161.4 million forward loss during the fiscal year ended March 31, 2016. This announcement follows the September 2015 decision by Boeing to in-source production of the 747-8 program beginning in the second half of fiscal 2019, effectively terminating this program with us after our current contract. Additional costs associated with exiting the facilities where the 747-8 program is manufactured, such as asset impairment, supplier and lease termination charges, as well as severance and retention payments to employees and contractors have been included in the 2016 Restructuring Plan.
During fiscal 2015, we also recognized a provision for forward losses associated with our long-term contract on the 747-8 program. There is still risk similar to what we have experienced on the 747-8 program. Particularly, our ability to manage risks related to supplier performance, execution of cost reduction strategies, hiring and retaining skilled production and management personnel, quality and manufacturing execution, program schedule delays and many other risks, will determine the ultimate performance of these long-term programs.
In the fourth quarter of the fiscal year ended March 31, 2017, consistent with the Company's policy described here within, the Company performed its annual assessment of the fair value of goodwill. The Company concluded that the goodwill related to the Aerospace Structures reporting unit was impaired as of the annual testing date. The Company concluded that the reporting unit had a fair value that was lower than its carrying value by an amount that exceeded the remaining goodwill for the reporting unit. Accordingly, the Company recorded a non-cash impairment charge during the fourth quarter of the fiscal year ending March 31, 2017, of $266.3 million, which is presented on the accompanying Consolidated Statements of Operations as "Impairment of intangible assets”. The decline in fair value is the result of declining revenues from production rate reductions on sun-setting programs and the slower than previously projected ramp in our development programs and the timing of associated earnings and cash flows. (See Note 2 of our Consolidated Financial Statements for definition of fair value levels).
The Company’s assessment of the Precision Components reporting unit concluded that the goodwill was not impaired as of the annual impairment assessment date. However, the excess of the fair value over the carrying value for the reporting unit was less than 5%. The decline in fair value is the result of declining revenues from production rate reductions on sunsetting programs and the start-up costs related to new programs and the timing of associated earnings and cash flows. Going forward, the Company will continue to monitor the performance of this reporting unit in relation to the key assumptions in our analysis.
In the event that market multiples for stock price to EBITDA in the aerospace and defense markets decrease, or the expected EBITDA and cash flows for our reporting units decreases, an additional goodwill impairment charge may be required, which would adversely affect our operating results and financial condition. If management determines that impairment exists, the impairment will be recognized in the period in which it is identified.
During the fourth quarter of the fiscal year ended March 31, 2016, we performed our annual assessment of the fair value of our goodwill for each of our three reporting units. We concluded that the goodwill of our Aerostructures reporting unit was impaired as of the annual testing date. We concluded that the goodwill had an implied fair value of $822.8 million (Level 3) compared to a carrying value of $1.42 billion. Accordingly, we recorded a non-cash impairment charge during the fourth quarter of fiscal 2016 of $597.6 million, which is presented on the accompanying Consolidated Statements of Operations as "Impairment of intangible assets". The decline in fair value is the result of continued declines in stock price and related market multiples for stock price to EBITDA of both the Company and our peer group.
During the third quarter of the fiscal year ended March 31, 2016, we performed an interim assessment of fair value on our indefinite-lived intangible assets due to potential indicators of impairment related to the continued decline in our stock price during the fiscal third quarter. We estimated the fair value of the tradenames using the relief-from-royalty method, which uses several significant assumptions, including revenue projections that consider historical and estimated future results, general
25
economic and market conditions, as well as the impact of planned business and operational strategies. The following estimates and assumptions were also used in the relief-from-royalty method:
•Royalty rates between 2% and 4% based on market observed royalty rates and profit split analysis; and
•Discount rates between 12% and 13% based on the required rate of return for the tradename assets.
Based on our evaluation, we concluded that the Vought tradename had a fair value of $195.8 million (Level 3) compared to a carrying value of $425.0 million. Accordingly, we recorded a non-cash impairment charge during the quarter ended December 31, 2015, of $229.2 million, which is presented on the accompanying Consolidated Statements of Operations as "Impairment of intangible assets". The decline in fair value compared to carrying value of the Vought tradename is the result of declining revenues from production rate reductions and the slower than previously projected ramp in Bombardier Global 7000/8000 and the timing of associated earnings.
During the fourth quarter of the fiscal year ended March 31, 2016, we performed our annual assessment of fair value on our indefinite-lived intangible assets. We estimated the fair value of the tradenames using the relief-from-royalty method, which uses several significant assumptions, including revenue projections that consider historical and estimated future results, general economic and market conditions, as well as the impact of planned business and operational strategies. The following estimates and assumptions were also used in the relief-from-royalty method:
•Royalty rates between 2% and 4% based on market observed royalty rates and profit split analysis; and
•Discount rate of 14% based on the required rate of return for the tradename assets, which increased from our interim assessment driven by increased risk due to continued declines in stock price and related market multiples for stock price to EBITDA of both the Company and our peer group and increased interest rates.
Based on our evaluation of indefinite-lived assets, including the tradenames, we concluded that the Vought and Embee tradenames had a fair value of $163.0 million (Level 3) compared to a carrying value of $209.2 million. The decline in fair value compared to carrying value of the tradenames is the result of the increase in discount rate during the fourth quarter, which required the Company to assess whether events and/or circumstances have changed regarding the indefinite-life conclusion. Accordingly, we revalued both the tradenames as if these intangible assets were no longer indefinite and recorded a non-cash impairment charge during the fiscal year ended March 31, 2016, of $46.2 million, which is presented on the accompanying Consolidated Statements of Operations as "Impairment of intangible assets".
During the fiscal year ended March 31, 2017, as part of the Company's annual assessment, the Company determined that the remaining estimated useful life for the Vought tradename should be reduced from a useful life of 20 years to a useful life of 10 years, as it better represents the expected period of benefit to the Company's financial performance.
In the event of significant loss of revenues and related earnings associated with the Vought and Embee tradenames, further impairment charges may be required, which would adversely affect our operating results.
During the quarter ended June 30, 2016, we settled the strike and agreed to a new collective bargaining agreement with our union employees with IAM District 751 at our Spokane, Washington facility which had expired during the quarter, resulting in a charge of $15.7 million due to disruption costs. Our union employees with UAW Local 848 at our Red Oak, Texas facility and UAW Local 952 at our Tulsa, Oklahoma facility are currently working without a contract. If we are unable to negotiate a contract with each of those workforces, our operations may be disrupted and we may be prevented from completing production and delivery of products from those facilities, which would negatively impact our results. Contingency plans have been developed that would allow production to continue in the event of an additional strike.
Effective October 21, 2015, the Company acquired the ownership of all of the outstanding shares of Fairchild Controls Corporation ("Fairchild"). Fairchild is a leading provider of proprietary thermal management systems, auxiliary power generation systems and related aftermarket spares and repairs. The acquired business operates as Triumph Thermal Systems-Maryland, Inc. and its results are included in Integrated Systems from the date of acquisition.
26
RESULTS OF OPERATIONS
The following includes a discussion of our consolidated and business segment results of operations. The Company's diverse structure and customer base do not provide for precise comparisons of the impact of price and volume changes to our results. However, we have disclosed the significant variances between the respective periods.
Non-GAAP Financial Measures
We prepare and publicly release quarterly unaudited financial statements prepared in accordance with GAAP. In accordance with the SEC guidance and the SEC's Compliance and Disclosure Interpretations, we also disclose and discuss certain non-GAAP financial measures in our public releases. Currently, the non-GAAP financial measure that we disclose is Adjusted EBITDA, which is our (loss) income from continuing operations before interest, income taxes, amortization of acquired contract liabilities, curtailments, settlements and early retirement incentives and depreciation and amortization. We disclose Adjusted EBITDA on a consolidated and a reportable segment basis in our earnings releases, investor conference calls and filings with the SEC. The non-GAAP financial measures that we use may not be comparable to similarly titled measures reported by other companies. Also, in the future, we may disclose different non-GAAP financial measures in order to help our investors more meaningfully evaluate and compare our future results of operations to our previously reported results of operations.
We view Adjusted EBITDA as an operating performance measure and, as such, we believe that the GAAP financial measure most directly comparable to it is (loss) income from continuing operations. In calculating Adjusted EBITDA, we exclude from (loss) income from continuing operations the financial items that we believe should be separately identified to provide additional analysis of the financial components of the day-to-day operation of our business. We have outlined below the type and scope of these exclusions and the material limitations on the use of these non-GAAP financial measures as a result of these exclusions. Adjusted EBITDA is not a measurement of financial performance under GAAP and should not be considered as a measure of liquidity, as an alternative to net (loss) income, (loss) income from continuing operations, or as an indicator of any other measure of performance derived in accordance with GAAP. Investors and potential investors in our securities should not rely on Adjusted EBITDA as a substitute for any GAAP financial measure, including net (loss) income or (loss) income from continuing operations. In addition, we urge investors and potential investors in our securities to carefully review the reconciliation of Adjusted EBITDA to (loss) income from continuing operations set forth below, in our earnings releases and in other filings with the SEC and to carefully review the GAAP financial information included as part of our Quarterly Reports on Form 10-Q and our Annual Reports on Form 10-K that are filed with the SEC, as well as our quarterly earnings releases, and compare the GAAP financial information with our Adjusted EBITDA.
Adjusted EBITDA is used by management to internally measure our operating and management performance and by investors as a supplemental financial measure to evaluate the performance of our business that, when viewed with our GAAP results and the accompanying reconciliation, we believe provides additional information that is useful to gain an understanding of the factors and trends affecting our business. We have spent more than 20 years expanding our product and service capabilities partially through acquisitions of complementary businesses. Due to the expansion of our operations, which included acquisitions, our (loss) income from continuing operations has included significant charges for depreciation and amortization. Adjusted EBITDA excludes these charges and provides meaningful information about the operating performance of our business, apart from charges for depreciation and amortization. We believe the disclosure of Adjusted EBITDA helps investors meaningfully evaluate and compare our performance from quarter to quarter and from year to year. We also believe Adjusted EBITDA is a measure of our ongoing operating performance because the isolation of non-cash charges, such as depreciation and amortization, and non-operating items, such as interest and income taxes, provides additional information about our cost structure, and, over time, helps track our operating progress. In addition, investors, securities analysts and others have regularly relied on Adjusted EBITDA to provide a financial measure by which to compare our operating performance against that of other companies in our industry.
Set forth below are descriptions of the financial items that have been excluded from our (loss) income from continuing operations to calculate Adjusted EBITDA and the material limitations associated with using this non-GAAP financial measure as compared to (loss) income from continuing operations:
• | Divestitures may be useful for investors to consider because they reflect gains or losses from sale of operating units. We do not believe these earnings necessarily reflect the current and ongoing cash earnings related to our operations. |
• | Legal settlements may be useful for investors to consider because it reflects gains or losses from disputes with third parties. We do not believe these earnings necessarily reflect the current and ongoing cash earnings related to our operations. |
27
• | Curtailments, settlements and early retirement incentives may be useful for investors to consider because it represents the current period impact of the change in the defined benefit obligation due to the reduction in future service costs as well as the incremental cost of retirement incentive benefits paid to participants. We do not believe these earnings necessarily reflect the current and ongoing cash earnings related to our operations. |
• | Amortization of acquired contract liabilities may be useful for investors to consider because it represents the non-cash earnings on the fair value of off-market contracts acquired through acquisitions. We do not believe these earnings necessarily reflect the current and ongoing cash earnings related to our operations. |
• | Amortization expense (including intangible asset impairments) may be useful for investors to consider because it represents the estimated attrition of our acquired customer base and the diminishing value of product rights and licenses. We do not believe these charges necessarily reflect the current and ongoing cash charges related to our operating cost structure. |
• | Depreciation may be useful for investors to consider because it generally represents the wear and tear on our property and equipment used in our operations. We do not believe these charges necessarily reflect the current and ongoing cash charges related to our operating cost structure. |
• | The amount of interest expense and other we incur may be useful for investors to consider and may result in current cash inflows or outflows. However, we do not consider the amount of interest expense and other to be a representative component of the day-to-day operating performance of our business. |
• | Income tax expense may be useful for investors to consider because it generally represents the taxes which may be payable for the period and the change in deferred income taxes during the period and may reduce the amount of funds otherwise available for use in our business. However, we do not consider the amount of income tax expense to be a representative component of the day-to-day operating performance of our business. |
Management compensates for the above-described limitations of using non-GAAP measures by using a non-GAAP measure only to supplement our GAAP results and to provide additional information that is useful to gain an understanding of the factors and trends affecting our business.
The following table shows our Adjusted EBITDA reconciled to our (loss) income from continuing operations for the indicated periods (in thousands):
Fiscal year ended March 31, | |||||||||||
2017 | 2016 | 2015 | |||||||||
(Loss) income from continuing operations | $ | (42,952 | ) | $ | (1,047,960 | ) | $ | 238,697 | |||
Legal settlement charge (gain), net of expenses | — | 5,476 | (134,693 | ) | |||||||
Loss on divestitures | 19,124 | — | — | ||||||||
Amortization of acquired contract liabilities | (121,004 | ) | (132,363 | ) | (75,733 | ) | |||||
Depreciation and amortization * | 443,244 | 1,052,116 | 158,323 | ||||||||
Curtailments, settlements and early retirement incentives | — | (1,244 | ) | — | |||||||
Interest expense and other | 80,501 | 68,041 | 85,379 | ||||||||
Income tax expense (benefit) | 19,340 | (111,187 | ) | 110,597 | |||||||
Adjusted EBITDA | $ | 398,253 | $ | (167,121 | ) | $ | 382,570 | ||||
* - Includes Impairment charges related to intangible assets | |||||||||||
28
The following tables show our Adjusted EBITDA by reportable segment reconciled to our operating income (loss) for the indicated periods (in thousands):
Fiscal year ended March 31, 2017 | |||||||||||||||||||||||
Total | Integrated Systems | Aerospace Structures | Precision Components | Product Support | Corporate/ Eliminations | ||||||||||||||||||
Operating income (loss) | $ | 56,889 | $ | 201,294 | $ | (108,811 | ) | $ | 18,322 | $ | 55,801 | $ | (109,717 | ) | |||||||||
Loss on divestitures | 19,124 | — | — | — | — | 19,124 | |||||||||||||||||
Amortization of acquired contract liabilities | (121,004 | ) | (36,760 | ) | (81,805 | ) | (2,439 | ) | — | — | |||||||||||||
Depreciation and amortization * | 443,244 | 40,332 | 338,525 | 53,889 | 9,037 | 1,461 | |||||||||||||||||
Adjusted EBITDA | $ | 398,253 | $ | 204,866 | $ | 147,909 | $ | 69,772 | $ | 64,838 | $ | (89,132 | ) | ||||||||||
* - Includes Impairment charges related to intangible assets. | |||||||||||||||||||||||
Fiscal year ended March 31, 2016 | |||||||||||||||||||||||
Total | Integrated Systems | Aerospace Structures | Precision Components | Product Support | Corporate/ Eliminations | ||||||||||||||||||
Operating (loss) income | $ | (1,091,106 | ) | $ | 220,649 | $ | (1,354,640 | ) | $ | 75,734 | $ | 24,977 | $ | (57,826 | ) | ||||||||
Legal settlement charge (gain), net | 5,476 | (8,494 | ) | 10,500 | 1,570 | 1,900 | — | ||||||||||||||||
Curtailments, settlements and early retirement incentives | (1,244 | ) | — | — | — | — | (1,244 | ) | |||||||||||||||
Amortization of acquired contract liabilities | (132,363 | ) | (41,585 | ) | (87,524 | ) | (3,254 | ) | — | — | |||||||||||||
Depreciation and amortization * | 1,052,116 | 42,486 | 937,877 | 59,102 | 11,009 | 1,642 | |||||||||||||||||
Adjusted EBITDA | $ | (167,121 | ) | $ | 213,056 | $ | (493,787 | ) | $ | 133,152 | $ | 37,886 | $ | (57,428 | ) | ||||||||
* - Includes Impairment charges related to intangible assets. | |||||||||||||||||||||||
Fiscal year ended March 31, 2015 | |||||||||||||||||||||||
Total | Integrated Systems | Aerospace Structures | Precision Components | Product Support | Corporate/ Eliminations | ||||||||||||||||||
Operating income (loss) | $ | 434,673 | $ | 183,558 | $ | (25,257 | ) | $ | 146,726 | $ | 47,931 | $ | 81,715 | ||||||||||
Legal settlement gain, net | (134,693 | ) | — | — | — | — | (134,693 | ) | |||||||||||||||
Amortization of acquired contract liabilities | (75,733 | ) | (37,014 | ) | (33,704 | ) | (5,015 | ) | — | — | |||||||||||||
Depreciation and amortization | 158,323 | 37,528 | 63,492 | 46,476 | 8,559 | 2,268 | |||||||||||||||||
Adjusted EBITDA | $ | 382,570 | $ | 184,072 | $ | 4,531 | $ | 188,187 | $ | 56,490 | $ | (50,710 | ) | ||||||||||
The fluctuations from period to period within the amounts of the components of the reconciliations above are discussed further below within Results of Operations.
29
Fiscal year ended March 31, 2017 compared to fiscal year ended March 31, 2016
Year Ended March 31, | |||||||
2017 | 2016 | ||||||
(in thousands) | |||||||
Net sales | $ | 3,532,799 | $ | 3,886,072 | |||
Segment operating income (loss) | $ | 166,606 | $ | (1,033,280 | ) | ||
Corporate expense | (109,717 | ) | (57,826 | ) | |||
Total operating income (loss) | 56,889 | (1,091,106 | ) | ||||
Interest expense and other | 80,501 | 68,041 | |||||
Income tax expense (benefit) | 19,340 | (111,187 | ) | ||||
Net loss | $ | (42,952 | ) | $ | (1,047,960 | ) | |
Net sales decreased by $353.3 million, or 9.1%, to $3.5 billion for the fiscal year ended March 31, 2017, from $3.9 billion for the fiscal year ended March 31, 2016. Organic sales decreased $359.9 million, or 8.9%. The acquisition of Fairchild offset by the divestitures of TAS-Newport News and Engines and APU contributed $6.6 million to net sales. Organic sales decreased due to production rate reductions by our customers on the 747-8, Gulfstream G450/G550, C-17 and A330 programs.
Cost of sales decreased by $907.5 million, or 25.2%, to $2.7 billion for the fiscal year ended March 31, 2017, from $3.6 billion for the fiscal year ended March 31, 2016. Organic cost of sales decreased $916.6 million or 25.0%. The acquisition of Fairchild offset by the divestitures of TAS-Newport News and Engines and APU contributed $9.1 million to cost of sales. Organic gross margin for the fiscal year ended March 31, 2017, was 23.0% compared with 6.5% for the fiscal year ended March 31, 2016. The gross margin for the fiscal year ended March 31, 2017 increased in part due to the aforementioned settlement with Boeing, compared to the prior year which was impacted by provisions for forward losses of $561.2 million on the Bombardier and 747-8 programs.
Gross margin included net favorable cumulative catch-up adjustments on long-term contracts and provisions for forward losses as noted above ($57.2 million). The favorable cumulative catch-up adjustments to operating income included gross favorable adjustments of $163.3 million and gross unfavorable adjustments of $106.1 million, of which $131.4 million was related to the reduction of the previously recorded forward losses associated with the 747-8 program and partially offset by the correction of an immaterial error in the amount of $12.7 million. Gross margins for fiscal 2016 included net unfavorable cumulative catch-up adjustments of $596.2 million, of which $561.2 million was related to provisions for forward losses on the Bombardier and 747-8 programs.
Segment operating income (loss) increased by $1.2 billion, or 116.1%, to $166.6 million of operating income for the fiscal year ended March 31, 2017, from a $1.0 billion operating loss for the fiscal year ended March 31, 2016. Organic operating income increased $1.18 billion million or 114.8%. The acquisition of Fairchild offset by the divestitures of TAS-Newport News and Engines and APU contributed $18.5 million to operating income. The organic operating income increased for the fiscal year ended March 31, 2017 since the comparative prior year included the provisions for forward losses and gross margin changes noted above and the previously mentioned goodwill and tradename impairment charges.
Corporate operations incurred expenses of $109.7 million for the fiscal year ended March 31, 2017, as compared to $57.8 million for the fiscal year ended March 31, 2016. The increase in corporate expenses of $54.8 million or 99.6%, was due to the restructuring charges of $22.2 million and loss on the divestitures of $19.1 million.
Interest expense and other increased by $12.5 million, or 18.3%, to $80.5 million for the fiscal year ended March 31, 2017 compared to $68.0 million for the prior year due to increased average debt levels and higher interest rates.
The income tax expense was $19.3 million for the fiscal year ended March 31, 2017, reflecting an effective tax rate of (81.9)%. The rate reflects an adjustment associated with the impairment charge recognized related to Aerospace Structures which was not deductible for tax purposes. During the fiscal year ended March 31, 2017, the Company reduced the valuation allowance against certain of its net deferred tax assets resulting in a benefit of $16.0 million. The reduction resulted from the net deferred tax liabilities generated from the current year temporary differences and the utilization of deferred tax assets associated with NOL carryforwards and R&D credit carryforwards.
The income tax benefit for the fiscal year ended March 31, 2016, was $111.2 million and reflected the establishment of a valuation allowance of $155.8 million against net deferred tax assets
30
As of March 31, 2017, we have a valuation allowance against substantially all of our net deferred tax assets given the insufficient positive evidence to support the realization of our deferred tax assets. We intend to continue maintaining a valuation allowance on our deferred tax assets until there is sufficient positive evidence to support the reversal of all or some portion of these allowances. A reduction in the valuation allowance could result in a significant decrease in income tax expense in the period that the release is recorded. However, the exact timing and amount of the reduction in our valuation allowance are unknown at this time and will be subject to the earnings level we achieve as well as our projected income in future periods.
Fiscal year ended March 31, 2016 compared to fiscal year ended March 31, 2015
Year Ended March 31, | |||||||
2016 | 2015 | ||||||
(in thousands) | |||||||
Net sales | $ | 3,886,072 | $ | 3,888,722 | |||
Segment operating (loss) income | $ | (1,033,280 | ) | $ | 352,958 | ||
Corporate (expenses) income | (57,826 | ) | 81,715 | ||||
Total operating income | (1,091,106 | ) | 434,673 | ||||
Interest expense and other | 68,041 | 85,379 | |||||
Income tax (benefit) expense | (111,187 | ) | 110,597 | ||||
Net (loss) income | $ | (1,047,960 | ) | $ | 238,697 | ||
Net sales decreased by $2.7 million, or 0.1%, to $3.9 billion for the fiscal year ended March 31, 2016, from $3.9 billion for the fiscal year ended March 31, 2015. The acquisition of Fairchild and the fiscal 2015 acquisitions contributed $355.3 million. Organic sales decreased $352.7 million, or 9.8%, due to production rate cuts by our customers on the 747-8, V-22, G450/G550 and C-17 programs. The prior fiscal year was negatively impacted by our customers' decreased production rates on existing programs and decreased military sales.
In the fourth quarter of fiscal 2016, we recorded a $399.8 million forward loss charge for the Bombardier Global 7000/8000 wing program. Under our contract for this program, we have the right to design, develop and manufacture wing components over the initial 300 ship sets. The Global 7000/8000 contract provides for fixed pricing and requires us to fund certain up-front development expenses, with certain milestone payments made by Bombardier. The Global 7000/8000 program charge resulted in the impairment of previously capitalized pre-production costs due to the combination of cost recovery uncertainty, higher than anticipated non-recurring costs and increased forecasted costs on recurring production. The increases in costs were driven by several factors, including: changing technical requirements, increased spending on the design and engineering phase of the program and uncertainty regarding cost reduction and cost recovery initiatives with our customer and suppliers. Further cost increases or an inability to meet revised recurring cost forecasts on the Global 7000/8000 program may result in additional forward loss reserves in future periods, while improvements in future costs compared to current estimates may result in favorable adjustments if forward loss reserves are no longer required.
In January 2016, Boeing announced a rate reduction to the 747-8 program, which lowers production to one plane every two months. We have assessed the impact of the rate reduction and have recorded an additional $161.4 million forward loss. This announcement follows the September 2015 decision by Boeing to in-source production of the 747-8 program beginning in the second half of fiscal 2019, effectively terminating this program with us after our current contract. Additional costs associated with exiting the facilities where the 747-8 program is manufactured, such as asset impairment, supplier and lease termination charges, as well as severance and retention payments to employees and contractors have been included in the 2016 Restructuring Plan.
Recognition of additional forward losses in the future periods continues to be a risk and will depend upon several factors, including the impact of the above discussed production rate change, our ability to successfully perform under current design and manufacturing plans, achievement of forecasted cost reductions as we continue production, our ability to successfully resolve claims and assertions with our customers and suppliers and our customers' ability to sell their products.
Cost of sales increased by $455.8 million, or 14.5%, to $3.6 billion for the fiscal year ended March 31, 2016, from $3.1 billion for the fiscal year ended March 31, 2015. The acquisition of Fairchild and the fiscal 2015 acquisitions contributed $274.5 million. The organic cost of sales included provisions for forward losses of $561.2 million on the Bombardier and 747-8 programs (as discussed above). Organic gross margin for the fiscal year ended March 31, 2016, was 3.9% compared
31
with 19.1% for the fiscal year ended March 31, 2015. The prior year was impacted by additional costs on the 747-8 program and disruption and accelerated depreciation associated with the relocation from our Jefferson Street Facilities.
Gross margin included net unfavorable cumulative catch-up adjustments on long-term contracts and provisions for forward losses as noted above ($596.2 million). The unfavorable cumulative catch-up adjustments to operating income included gross favorable adjustments of $33.0 million and gross unfavorable adjustments of $629.2 million, of which $561.2 million was related to forward losses associated with the Bombardier and 747-8 programs. Excluding the aforementioned forward losses, the cumulative catch-up adjustments for the fiscal year ended March 31, 2016, reflected increased labor and supplier costs on other programs. Gross margins for fiscal 2015 included net unfavorable cumulative catch-up adjustments of $156.0 million, of which $152.0 million was related to the forward losses on the 747-8 program.
Segment operating (loss) income decreased by $1,386.2 million, or (392.7)%, to $(1,033.3) million for the fiscal year ended March 31, 2016, from $353.0 million for the fiscal year ended March 31, 2015. The decreased operating income is directly related to the provisions for forward losses and gross margin changes noted above and the previously mentioned goodwill and tradename impairment charges.
Corporate operations incurred expenses of $57.8 million for the fiscal year ended March 31, 2016, as opposed to income of $81.7 million for the fiscal year ended March 31, 2015. The fiscal year ended March 31, 2015, included the legal settlement between the Company and Eaton, which resulted in a net gain of $134.7 million.
Interest expense and other decreased by $17.3 million, or 20.3%, to $68.0 million for the fiscal year ended March 31, 2016 compared to $85.4 million for the prior year. Interest expense and other for the fiscal year ended March 31, 2016, included foreign exchange losses of $2.4 million versus foreign exchange gains of $5.0 million for the fiscal year ended March 31, 2015. Interest expense and other for the fiscal year ended March 31, 2015 included the redemption of the 2018 Notes, which included $22.6 million for pre-tax losses associated with the 4.79% redemption premium, and write-off of the remaining related unamortized discount and deferred financing fees.
The effective income tax rate was 9.6% for the fiscal year ended March 31, 2016, and reflected the establishment of a valuation allowance of $155.8 million against net deferred tax assets. Based on an evaluation of both the positive and negative evidence available, we determined that it was necessary to establish a valuation allowance against substantially all of our net deferred tax assets for the fiscal year ended March 31, 2016.
A valuation allowance, if needed, reduces deferred tax assets to the amount expected to be realized. When determining the amount of net deferred tax assets that are more likely than not to be realized, the Company assesses all available positive and negative evidence. This evidence includes, but is not limited to, prior earnings history, expected future earnings, carry-back and carry-forward periods and the feasibility of ongoing tax strategies that could potentially enhance the likelihood of the realization of a deferred tax asset. The weight given to the positive and negative evidence is commensurate with the extent the evidence may be objectively verified. As such, it is generally difficult for positive evidence regarding projected future taxable income exclusive of reversing taxable temporary differences to outweigh objective negative evidence of recent financial reporting losses.
Based on these criteria and the relative weighting of both the positive and negative evidence available, and in particular the activity surrounding the Company's prior earnings history, including the forward losses and intangible impairments previously recognized, management determined that it was necessary to establish a valuation allowance against principally all of its net deferred tax assets at March 31, 2016. Given the objectively verifiable negative evidence of a three-year cumulative loss and the weighting of all available positive evidence, the Company excluded projected taxable income (aside from reversing taxable temporary differences) from the assessment of income that could be used as a source of taxable income to realize the deferred tax assets.
The effective tax rate for the fiscal year ended March 31, 2015, was 31.7% and included the release of previously reserved for unrecognized tax benefits of $1.1 million, the benefit of $2.8 million from a decrease of the state deferred tax rate and the benefit of $6.0 million from the retroactive reinstatement of the R&D tax credit to January 1, 2014.
32
Business Segment Performance
We report our financial performance based on the following four reportable segments: Integrated Systems, Aerospace Structures, Precision Components and Product Support. The Company's Chief Operating Decision Maker ("CODM") utilizes Adjusted EBITDA as a primary measure of profitability to evaluate performance of its segments and allocate resources.
The results of operations among our reportable segments vary due to differences in competitors, customers, extent of proprietary deliverables and performance. The results of operations among our operating segments vary due to differences in competitors, customers, extent of proprietary deliverables and performance. For example, Integrated Systems, which generally includes proprietary products and/or arrangements where we become the primary source or one of a few primary sources to our customers, our unique manufacturing capabilities command a higher margin. Also OEMs are increasingly focusing on assembly activities while outsourcing more manufacturing and repair to third parties, and as a result, are less of a competitive force than in previous years. This compares to Aerospace Structures, which generally includes long-term sole-source or preferred supplier contracts and the success of these programs provides a strong foundation for our business and positions us well for future growth on new programs and new derivatives. In contrast, Product Support provides MRO services on components and accessories manufactured by third parties, with more diverse competition, including airlines, OEMs and other third-party service providers. In addition, variability in the timing and extent of customer requests performed in Product Support can provide for greater volatility and less predictability in revenue and earnings than that experienced in Integrated Systems, Aerospace Structures and Precision Components segments.
Integrated Systems consists of the Company’s operations that provides integrated solutions including design, development and support of proprietary components, subsystems and systems, as well as production of complex assemblies using external designs. Capabilities include hydraulic, mechanical and electro-mechanical actuation, power and control; a complete suite of aerospace gearbox solutions including engine accessory gearboxes and helicopter transmissions; active and passive heat exchange technology; fuel pumps, fuel metering units and Full Authority Digital Electronic Control fuel systems; hydro-mechanical and electromechanical primary and secondary flight controls; and a broad spectrum of surface treatment options.
Aerospace Structures consists of the Company’s operations that supply commercial, business, regional and military manufacturers with large metallic and composite structures. Products include wings, wing boxes, fuselage panels, horizontal and vertical tails and sub-assemblies such as floor grids. Inclusive of most of the former Vought Aircraft Division, Aerospace Structures also has the capability to engineer detailed structural designs in metal and composites.
Precision Components consists of the Company’s operations that produce close-tolerance parts primarily to customer designs and model-based definition, including a wide range of aluminum, hard metal and composite structure capabilities. Capabilities include complex machining, gear manufacturing, sheet metal fabrication, forming, advanced composite and interior structures, joining processes such as welding, autoclave bonding and conventional mechanical fasteners and a variety of special processes including: super plastic titanium forming, aluminum and titanium chemical milling and surface treatments.
Product Support consists of the Company’s operations that provides full life cycle solutions for commercial, regional and military aircraft. The Company’s extensive product and service offerings include full post-delivery value chain services that simplify the MRO supply chain. Through its line maintenance, component MRO and postproduction supply chain activities, Product Support is positioned to provide integrated planeside repair solutions globally. Capabilities include fuel tank repair, metallic and composite aircraft structures, nacelles, thrust reversers, interiors, auxiliary power units and a wide variety of pneumatic, hydraulic, fuel and mechanical accessories.
We currently generate a majority of our revenue from clients in the commercial aerospace industry, the military, the business jet industry and the regional airline industry. Our growth and financial results are largely dependent on continued demand for our products and services from clients in these industries. If any of these industries experiences a downturn, our clients in these sectors may conduct less business with us. The following table summarizes our net sales by end market by business segment. The loss of one or more of our major customers or an economic downturn in the commercial airline or the military and defense markets could have a material adverse effect on our business.
33
Year Ended March 31, | ||||||||
2017 | 2016 | 2015 | ||||||
Integrated Systems | ||||||||
Commercial aerospace | 15.1 | % | 13.8 | % | 12.2 | % | ||
Military | 10.2 | 10.3 | 10.5 | |||||
Business Jets | 1.7 | 1.8 | 1.2 | |||||
Regional | 1.0 | 0.9 | 1.0 | |||||
Non-aviation | 1.0 | 1.0 | 1.1 | |||||
Total Integrated Systems net sales | 29.0 | % | 27.8 | % | 26.0 | % | ||
Aerospace Structures | ||||||||
Commercial aerospace | 16.7 | % | 22.5 | % | 26.1 | % | ||
Military | 5.5 | 6.1 | 9.7 | |||||
Business Jets | 13.6 | 15.1 | 7.4 | |||||
Regional | — | — | — | |||||
Non-aviation | — | — | — | |||||
Total Aerospace Structures net sales | 35.8 | % | 43.7 | % | 43.2 | % | ||
Precision Components | ||||||||
Commercial aerospace | 17.9 | % | 13.7 | % | 15.2 | % | ||
Military | 4.7 | 4.5 | 4.5 | |||||
Business Jets | 2.0 | 1.5 | 1.8 | |||||
Regional | 0.5 | 0.4 | 0.4 | |||||
Non-aviation | 0.4 | 0.4 | 1.1 | |||||
Total Precision Components net sales | 25.5 | % | 20.5 | % | 23.0 | % | ||
Product Support | ||||||||
Commercial aerospace | 7.5 | % | 6.1 | % | 6.3 | % | ||
Military | 1.5 | 1.4 | 0.9 | |||||
Regional | 0.7 | 0.5 | 0.5 | |||||
Non-aviation | — | — | 0.1 | |||||
Total Product Support net sales | 9.7 | % | 8.0 | % | 7.8 | % | ||
Total Consolidated net sales | 100.0 | % | 100.0 | % | 100.0 | % | ||
We continue to experience a higher proportion of our sales mix in the commercial aerospace end market for Integrated Systems and Precision Components due to the 737, 777 and 787 programs. We have experienced a decline in the commercial aerospace end market for Aerospace Structures due to lower production rates of the 747-8 and a decrease in our military end market due to the wind-down of the C-17 program.
34
Business Segment Performance—Fiscal year ended March 31, 2017 compared to fiscal year ended March 31, 2016
Year Ended March 31, | % Change | % of Total Sales | |||||||||||||||
2017 | 2016 | 2017 | 2016 | ||||||||||||||
(in thousands) | |||||||||||||||||
NET SALES | |||||||||||||||||
Integrated Systems | $ | 1,040,805 | $ | 1,094,703 | (4.9 | )% | 29.5 | % | 28.2 | % | |||||||
Aerospace Structures | 1,294,865 | 1,550,850 | (16.5 | )% | 36.7 | % | 39.9 | % | |||||||||
Precision Components | 987,919 | 1,061,607 | (6.9 | )% | 28.0 | % | 27.3 | % | |||||||||
Product Support | 338,325 | 311,394 | 8.6 | % | 9.6 | % | 8.0 | % | |||||||||
Elimination of inter-segment sales | (129,115 | ) | (132,482 | ) | (2.5 | )% | (3.7 | )% | (3.4 | )% | |||||||
Total net sales | 3,532,799 | 3,886,072 | (9.1 | )% | 100.0 | % | 100.0 | % | |||||||||
Year Ended March 31, | % Change | % of Segment Sales | |||||||||||||||
2017 | 2016 | 2017 | 2016 | ||||||||||||||
(in thousands) | |||||||||||||||||
SEGMENT OPERATING INCOME (LOSS) | |||||||||||||||||
Integrated Systems | $ | 201,294 | $ | 220,649 | (8.8 | )% | 19.3 | % | 20.2 | % | |||||||
Aerospace Structures | (108,811 | ) | (1,354,640 | ) | 92.0 | % | (8.4 | )% | (87.3 | )% | |||||||
Precision Components | 18,322 | 75,734 | (75.8 | )% | 1.9 | % | 7.1 | % | |||||||||
Product Support | 55,801 | 24,977 | 123.4 | % | 16.5 | % | 8.0 | % | |||||||||
Corporate | (109,717 | ) | (57,826 | ) | (89.7 | )% | n/a | n/a | |||||||||
Total segment operating income (loss) | 56,889 | (1,091,106 | ) | 105.2 | % | 1.6 | % | (28.1 | )% | ||||||||
Year Ended March 31, | % Change | % of Segment Sales | |||||||||||||||
2017 | 2016 | 2017 | 2016 | ||||||||||||||
(in thousands) | |||||||||||||||||
Adjusted EBITDA | |||||||||||||||||
Integrated Systems | $ | 204,866 | $ | 213,056 | (3.8 | )% | 19.7 | % | 19.5 | % | |||||||
Aerospace Structures | 147,909 | (493,787 | ) | 130.0 | % | 11.4 | % | (31.8 | )% | ||||||||
Precision Components | 69,772 | 133,152 | (47.6 | )% | 7.1 | % | 12.5 | % | |||||||||
Product Support | 64,838 | 37,886 | 71.1 | % | 19.2 | % | 12.2 | % | |||||||||
Corporate | (89,132 | ) | (57,428 | ) | (55.2 | )% | n/a | n/a | |||||||||
$ | 398,253 | $ | (167,121 | ) | 338.3 | % | 11.3 | % | (4.3 | )% | |||||||
Integrated Systems: Integrated Systems net sales decreased by $53.9 million, or 4.9%, to $1.04 billion for the fiscal year ended March 31, 2017, from $1.1 billion for the fiscal year ended March 31, 2016. Organic sales decreased by $66.8 million, or 6.3%, due to decreased sales in the rotocraft market and the spares aftermarket and were impacted by fluctuations in foreign currency exchange rates primarily due to changes in the British pound sterling of approximately $16.2 million. The acquisition of Fairchild offset by the divestiture of TAS-Newport News contributed $12.9 million in sales.
Integrated Systems cost of sales decreased by $40.3 million, or 5.5%, to $688.7 million for the fiscal year ended March 31, 2017, from $729.1 million for the fiscal year ended March 31, 2016. Organic cost of sales decreased by $48.5 million, or 6.9%. While the acquisition of Fairchild offset by the divestiture of TAS-Newport News contributed $8.2 million to cost of sales.
35
Organic gross margin for the fiscal year ended March 31, 2017, was 33.9% compared with 33.5% for the fiscal year ended March 31, 2016.
Integrated Systems operating income decreased by $19.4 million, or 8.8%, to $201.3 million for the fiscal year ended March 31, 2017, from $220.6 million for the fiscal year ended March 31, 2016. Organic operating income decreased $22.0 million, or 10.1%, while the acquisition of Fairchild offset by the divestiture of TAS-Newport News contributed $2.6 million to operating income. Operating income decreased due to the decreased sales noted above and the prior year included the net favorable settlement of a contingent liability of $8.5 million. These same factors contributed to the decrease in Adjusted EBITDA year over year.
Integrated Systems operating income as a percentage of segment sales decreased to 19.3% for the fiscal year ended March 31, 2017, as compared with 20.2% for the fiscal year ended March 31, 2016.
Aerospace Structures: Aerospace Structures net sales decreased by $256.0 million, or 16.5%, to $1.3 billion for the fiscal year ended March 31, 2017, from $1.6 billion for the fiscal year ended March 31, 2016. Sales decreased primarily due to production rate reductions by our customers on the 747-8, Gulfstream G450/550, A330 and C-17 programs and partially offset by rate increases on 767/Tanker program.
Aerospace Structures cost of sales decreased by $869.7 million, or 45.7%, to $1.03 billion for the fiscal year ended March 31, 2017, from $1.90 billion for the fiscal year ended March 31, 2016. The cost of sales were impacted by the reduction to the previously recognized forward losses on the 747-8 program of $131.4 million, offset by the decreased sales as noted above and by a provision for forward losses of $38.6 million mainly on the high altitude long endurance unmanned aircraft system (UAS) and A350 programs. The fiscal year ended March 31, 2016, included a provision for forward losses of $561.2 million on the Bombardier and 747-8 programs.
Gross margin for the fiscal year ended March 31, 2017, was 20.3% compared with (23.9)% for the fiscal year ended March 31, 2016. The gross margin included net favorable cumulative catch-up adjustments including reductions to previously recorded provisions for forward losses of $131.4 million. The net favorable cumulative catch-up adjustments included gross favorable adjustments of $163.3 million and gross unfavorable adjustments of $106.1 million. The net unfavorable cumulative catch-up adjustment for the fiscal year ended March 31, 2016, was $596.2 million.
Aerospace Structures operating loss improved by $1.25 billion, or 92.0%, to $108.8 million for the fiscal year ended March 31, 2017, from $1.35 billion for the fiscal year ended March 31, 2016. Operating loss improved for the year ended March 31, 2017, since the prior year included a provision for forward losses and the gross margin changes noted above and the previously mentioned goodwill and tradename impairment charges. Additionally, the provision for forward losses and gross margin changes noted above contributed to the increase in Adjusted EBITDA year over year.
Aerospace Structures operating loss as a percentage of segment sales improved to 8.4% for the fiscal year ended March 31, 2017, as compared with (87.3)% for the fiscal year ended March 31, 2016, due to the increase in gross margin as discussed above, which also caused the improvement in the Adjusted EBITDA margin.
Precision Components: Precision Components net sales decreased by $73.7 million, or 6.9%, to $987.9 million for the fiscal year ended March 31, 2017, from $1.06 billion for the fiscal year ended March 31, 2016. The decline in sales was primarily driven by production rate reductions on Boeing Commercial and Gulfstream G450/550 and price reductions due to changes in model mix, partially offset by increased production rates on the A350 program.
Precision Components cost of sales decreased by $3.0 million, or 0.4%, to $852.1 million for the fiscal year ended March 31, 2017, from $855.1 million for the fiscal year ended March 31, 2016. The cost of sales did not decrease in proportion to the decrease in sales noted above due to the strike at our Spokane, Washington facility ($15.7 million), start-up costs related to the A350 and other new programs, provisions for forward losses of $10.0 million on an engine program, and changes in sales mix. Gross margin for the fiscal year ended March 31, 2017, was 13.7% compared with 19.5% for the fiscal year ended March 31, 2016.
Precision Components operating income decreased by $57.4 million, or 75.8%, to $18.3 million for the fiscal year ended March 31, 2017, from $75.7 million for the fiscal year ended March 31, 2016. Operating income decreased due to the decreased sales as well as the decreased gross margins as noted above and restructuring charges of $8.9 million. These same factors contributed to the decrease in Adjusted EBITDA year over year.
Precision Components operating income as a percentage of sales decreased to 1.9% for the fiscal year ended March 31, 2017, as compared with 7.1% for the fiscal year ended March 31, 2016, due to the sales and cost of sales factors as noted above. The same factors contributed to the decrease in Adjusted EBITDA margin year over year.
36
Product Support: Product Support net sales increased by $26.9 million, or 8.6%, to $338.3 million for the fiscal year ended March 31, 2017, from $311.4 million for the fiscal year ended March 31, 2016. Organic sales increased $33.2 million or 13.1% and the divestiture of the Engines and APU contributed $6.3 million to the prior year period. Organic sales increased due to key wins with regional jet and commercial operators for components and accessories.
Product Support cost of sales increased by $2.2 million, or 0.9%, to $245.9 million for the fiscal year ended March 31, 2017, from $243.7 million for the fiscal year ended March 31, 2016. Organic cost of sales increased $19.4 million, or 10.4% and the divestiture of the Engines and APU contributed $17.2 million to the prior year period. Organic cost of sales increased for the current year period due to the increased sales noted above compared to the prior year period which was impacted by the impairment of excess and obsolete inventory associated with certain slow moving programs we decided to no longer support ($21.1.million). Organic gross margin for the fiscal year ended March 31, 2017, was 27.7% compared with 25.9% for the fiscal year ended March 31, 2016.
Product Support operating income increased by $30.8 million, or 123.4%, to $55.8 million for the fiscal year ended March 31, 2017, from $25.0 million for the fiscal year ended March 31, 2016. Organic operating income increased $15.0 million, or 46.8% and the divestiture of the Engines and APU contributed $15.8 million compared to the prior year period. Organic operating income increased due to sales factors as noted above and the prior year period included an increase to the bad debt reserve resulting from an international customer's declaration of bankruptcy ($1.1 million). These same factors contributed to the increase in Adjusted EBITDA year over year.
Product Support operating income as a percentage of segment sales increased to 16.5% for the fiscal year ended March 31, 2017, as compared with 8.0% for the fiscal year ended March 31, 2016, due to the increased sales and changes to gross margin noted above. The same factors contributed to the increase in Adjusted EBITDA margin year over year.
Business Segment Performance—Fiscal year ended March 31, 2016 compared to fiscal year ended March 31, 2015
Year Ended March 31, | % Change | % of Total Sales | |||||||||||||||
2016 | 2015 | 2016 | 2015 | ||||||||||||||
(in thousands) | |||||||||||||||||
NET SALES | |||||||||||||||||
Integrated Systems | $ | 1,094,703 | $ | 1,014,267 | 7.9 | % | 28.2 | % | 26.1 | % | |||||||
Aerospace Structures | 1,550,850 | 1,521,635 | 1.9 | % | 39.9 | % | 39.1 | % | |||||||||
Precision Components | 1,061,607 | 1,161,592 | (8.6 | )% | 27.3 | % | 29.9 | % | |||||||||
Product Support | 311,394 | 304,013 | 2.4 | % | 8.0 | % | 7.8 | % | |||||||||
Elimination of inter-segment sales | (132,482 | ) | (112,785 | ) | 17.5 | % | (3.4 | )% | (2.9 | )% | |||||||
Total net sales | $ | 3,886,072 | $ | 3,888,722 | (0.1 | )% | 100.0 | % | 100.0 | % | |||||||
Year Ended March 31, | % Change | % of Segment Sales | ||||||||||||
2016 | 2015 | 2016 | 2015 | |||||||||||
(in thousands) | ||||||||||||||
SEGMENT OPERATING INCOME (LOSS) | ||||||||||||||
Integrated Systems | $ | 220,649 | $ | 183,558 | 20.2% | 20.2% | 18.1% | |||||||
Aerospace Structures | (1,354,640 | ) | (25,257 | ) | N/M | (87.3)% | (1.7)% | |||||||
Precision Components | 75,734 | 146,726 | (48.4)% | 7.1% | 12.6% | |||||||||
Product Support | 24,977 | 47,931 | (47.9)% | 8.0% | 15.8% | |||||||||
Corporate | (57,826 | ) | 81,715 | (170.8)% | n/a | n/a | ||||||||
Total segment operating (loss) income | $ | (1,091,106 | ) | $ | 434,673 | (351.0)% | (28.1)% | 11.2% | ||||||
37
Year Ended March 31, | % Change | % of Segment Sales | |||||||||||||||
2016 | 2015 | 2016 | 2015 | ||||||||||||||
(in thousands) | |||||||||||||||||
Adjusted EBITDA | |||||||||||||||||
Integrated Systems | $ | 213,056 | $ | 184,072 | 15.7 | % | 19.5 | % | 18.1 | % | |||||||
Aerospace Structures | (493,787 | ) | 4,531 | N/M | (31.8 | )% | 0.3 | % | |||||||||
Precision Components | 133,152 | 188,187 | (29.2 | )% | 12.5 | % | 16.2 | % | |||||||||
Product Support | 37,886 | 56,490 | (32.9 | )% | 12.2 | % | 18.6 | % | |||||||||
Corporate | (57,428 | ) | (50,710 | ) | 13.2 | % | n/a | n/a | |||||||||
$ | (167,121 | ) | $ | 382,570 | (143.7 | )% | 11.4 | % | (4.3 | )% | |||||||
Integrated Systems: Integrated Systems net sales increased by $80.4 million, or 7.9%, to $1.09 billion for the fiscal year ended March 31, 2016, from $1.01 billion for the fiscal year ended March 31, 2015. The acquisitions of Fairchild and GE contributed $89.1 million of net sales. Organic net sales decreased by $8.5 million, or 1.1%, primarily due to slower commercial rotocraft demand and lower aftermarket revenue.
Integrated Systems cost of sales increased by $50.9 million, or 7.5%, to $729.1 million for the fiscal year ended March 31, 2016, from $678.2 million for the fiscal year ended March 31, 2015. Organic cost of sales decreased by $8.7 million, or 1.7%, while the acquisitions of Fairchild and GE contributed $59.6 million in cost of sales. Organic gross margin for the fiscal year ended March 31, 2016, was 34.2% compared with 34.4% for the fiscal year ended March 31, 2015.
Integrated Systems segment operating income increased by $37.1 million, or 20.2%, to $220.6 million for the fiscal year ended March 31, 2016, from $183.6 million for the fiscal year ended March 31, 2015. Operating income increased primarily due to the acquisitions of Fairchild and GE ($21.3 million) and the net favorable settlement of a contingent liability ($8.5 million). These same factors contributed to the increase in Adjusted EBITDA year over year.
Integrated Systems segment operating income as a percentage of segment sales increased to 20.2% for the fiscal year ended March 31, 2016, as compared with 18.1% for the fiscal year ended March 31, 2015, due to the effects of the acquisitions of Fairchild and GE. The same factors contributed to the increase in Adjusted EBITDA margin year over year.
Aerospace Structures: Aerospace Structures net sales increased by $29.2 million, or 1.9%, to $1.55 billion for the fiscal year ended March 31, 2016, from $1.52 billion for the fiscal year ended March 31, 2015. Organic sales decreased by $214.9 million or 15.0%, due to decreased production rate cuts by our customers on the 747-8, Gulfstream G450/G550, A330 and C-17 programs. The acquisition of the Tulsa Programs contributed $244.1 million to net sales.
Aerostructures cost of sales increased by $433.3 million, or 29.5%, to $1.90 billion for the fiscal year ended March 31, 2016, from $1 billion for the fiscal year ended March 31, 2015. The acquisition of the Tulsa Programs contributed $200.6 million for the fiscal year ended March 31, 2016 and organic cost of sales increased by $252.1 million, or 18.1%. The organic cost of sales included provisions for forward losses of $561.2 million on the Bombardier and 747-8 programs (as discussed above). Excluding the aforementioned forward losses, the cumulative catch-up adjustments for the fiscal year ended March 31, 2016, included increased labor and supplier costs on other programs. The fiscal year ended March 31, 2015, included a provision for forward losses of $152.0 million on the 747-8 program.
Organic gross margin for the fiscal year ended March 31, 2016, was (35.0)% compared with 2.9% for the fiscal year ended March 31, 2015. The organic gross margin included net unfavorable cumulative catch-up adjustments and provisions for forward losses of $596.2 million. The net unfavorable cumulative catch-up adjustments included gross favorable adjustments of $33.0 million and gross unfavorable adjustments of $629.2 million, which includes forward losses of $561.2 million associated with the Bombardier and 747-8 programs. The net unfavorable cumulative catch-up adjustment for the fiscal year ended March 31, 2015, was $156.0 million, which included $152.0 million of forward losses related to the 747-8 program.
Aerospace Structures operating loss decreased by $1.33 billion, or 5,263.4%, to $1.35 billion for the fiscal year ended March 31, 2016, from $25.3 million for the fiscal year ended March 31, 2015. The decreased operating income is directly related to the provision for forward losses and gross margin changes noted above and the previously mentioned goodwill and tradename impairment charges and included restructuring charges ($45.3 million). Additionally, the provision for forward losses and gross margin changes noted above contributed to the decrease in Adjusted EBITDA year over year.
38
Aerospace Structures operating loss as a percentage of segment sales decreased to (87.3)% for the fiscal year ended March 31, 2016, as compared with (1.7)% for the fiscal year ended March 31, 2015, due to the decrease in gross margin as discussed above, which also caused the decline in the Adjusted EBITDA margin.
Precision Components: Precision Components net sales decreased by $100.0 million, or 8.6%, to $1.06 billion for the fiscal year ended March 31, 2016, from $1.16 billion for the fiscal year ended March 31, 2015, due to decreased production rate cuts by our customers on the 747-8, Gulfstream G450/G550 and C-17 programs
Precision Components cost of sales decreased by $32.2 million, or 3.6%, to $855.1 million for the fiscal year ended March 31, 2016, from $887.3 million for the fiscal year ended March 31, 2015, due to the decreased sales noted above. The gross margin for the fiscal year ended March 31, 2016, was 19.5% compared with 23.6% for the fiscal year ended March 31, 2015, the gross margin decline is partially due to losing NADCAP certification at one of our facilities.
Precision Components operating income decreased by $71.0 million, or 48.4%, to $75.7 million for the fiscal year ended March 31, 2016, from $146.7 million for the fiscal year ended March 31, 2015. Operating income decreased primarily due to decreased sales and gross margins noted above and the restructuring charges ($25.3 million). These same factors contributed to the increase in Adjusted EBITDA year over year.
Precision Components operating income as a percentage of segment sales decreased to 7.1% for the fiscal year ended March 31, 2016, as compared with 12.6% for the fiscal year ended March 31, 2015, due to the effects of the gross margins and restructuring charges noted above. The same factors contributed to the decrease in Adjusted EBITDA margin year over year.
Product Support: Product Support net sales increased by $7.4 million, or 2.4%, to $311.4 million for the fiscal year ended March 31, 2016, from $304.0 million for the fiscal year ended March 31, 2015. Organic sales decreased $10.3 million, or 3.5%, and the acquisition of NAAS contributed $17.7 million. Organic sales decreased due to a decreased demand from commercial customers.
Product Support cost of sales increased by $19.0 million, or 8.5%, to $243.7 million for the fiscal year ended March 31, 2016, from $224.7 million for the fiscal year ended March 31, 2015. The organic cost of sales increased $7.9 million, or 3.6%, and the acquisition of NAAS contributed $11.1 million to cost of sales. Organic gross margin for the fiscal year ended March 31, 2016, was 20.2% compared with 27.3% for the fiscal year ended March 31, 2015. The decrease in gross margin was impacted by the impairment of excess and obsolete inventory associated with certain slow moving programs we have decided to no longer support ($21.1 million).
Product Support operating income decreased by $23.0 million, or 47.9%, to $25.0 million for the fiscal year ended March 31, 2016, from $47.9 million for the fiscal year ended March 31, 2015. Operating income decreased primarily due to the decreased organic sales and the decline in gross margins noted above. These same factors contributed to the decrease in Adjusted EBITDA year over year.
Product Support operating income as a percentage of segment sales decreased to 8.0% for the fiscal year ended March 31, 2016, as compared with 15.8% for the fiscal year ended March 31, 2015, due to the decreased organic sales and the decline in gross margins noted above. The same factors contributed to the decrease in Adjusted EBITDA margin year over year.
Liquidity and Capital Resources
Our working capital needs are generally funded through cash flow from operations and borrowings under our credit arrangements. During the year ended March 31, 2017, we generated approximately $281.5 million of cash flow from operating activities, received approximately $34.4 million from investing activities and used approximately $266.5 million in financing activities.
For the fiscal year ended March 31, 2017, we had a net cash inflow of $281.5 million from operating activities, an increase of $197.7 million, compared to a net cash inflow of $83.9 million for the fiscal year ended March 31, 2016. During fiscal 2017, the net cash provided by operating activities was primarily attributable to increased receipts from customers ($440.6 million), offset by the timing of payments on accounts payable and other accrued expenses driven by pre-production costs, net spending on the G280 and G650 Programs discussed below ($286.2 million) and a $5.5 million payment related to a previously resolved legal settlement.
We continue to invest in inventory for new programs which impacts our cash flows from operating activities. During fiscal 2017 expenditures for inventory costs on new programs, excluding progress payments, including the Bombardier Global 7000/8000 and the Embraer E-Jet programs, were $183.3 million and $26.4 million, respectively. Net spend on the Tulsa Programs during fiscal 2017 was approximately $76.5 million. Additionally, inventory for mature programs declined due to
39
decreased production rates, by approximately $82.9 million. Unliquidated progress payments netted against inventory increased $99.3 million due to timing of receipts.
Cash flows provided by investing activities for the fiscal year ended March 31, 2017, increased $162.4 million from the fiscal year ended March 31, 2016. Cash flows provided by investing activities for the fiscal year ended March 31, 2017, included cash from the divestitures of TAS - Newport News and Engines and APU ($86.2 million) offset by capital expenditures ($51.8 million). Cash flows used in investing activities for the fiscal year ended March 31, 2016, included cash used to fund the acquisition of Fairchild ($57.1 million), and a payment to settle a working capital adjustment related to the acquisition of GE ($6.0 million) and capital expenditures ($80.0 million).
Cash flows used in financing activities for the fiscal year ended March 31, 2017, were $266.5 million, compared to cash flows provided by financing activities for the fiscal year ended March 31, 2016, of $32.5 million. Cash flows used in financing activities for the fiscal year ended March 31, 2017, included payments funded by our operations to our Credit Facility (as defined below).
As of March 31, 2017, $483.8 million was available under the Company's existing credit agreement ("Credit Facility"). On March 31, 2017, an aggregate amount of approximately $30.0 million in outstanding borrowings and approximately $27.2 million in letters of credit were outstanding under the Credit Facility, all of which were accruing interest at LIBOR plus applicable basis points totaling 2.00% per annum. Amounts repaid under the Credit Facility may be reborrowed.
In October 2016, we entered into a Seventh Amendment to the Third Amended and Restated Credit Agreement, among the Company and its lenders to, among other things, (i) modify certain financial covenants to allow for the add-back of certain cash and non-cash charges, (ii) increase the maximum permitted total leverage ratio and senior secured leverage ratio financial covenants commencing with the fiscal quarter ended September 30, 2016 through the fiscal quarter ending June 30, 2017, (iii) permit the sale of certain specified assets so long as the Company applies 65.0% of the net proceeds received from such sales to the outstanding term loan, pro rata across all maturities, (iv) establish a new higher pricing tier for the interest rate, commitment fee and letter of credit fee pricing provisions, (v) increase the interest rate and letter of credit fee pricing provisions for several of the lower tiers of the pricing grid, (vi) establish the interest rate, commitment fee and letter of credit fee pricing at the highest pricing tier until we deliver our compliance certificate for its fiscal quarter ending September 30, 2017, and (vii) extend the period during which the increased minimum revolver availability threshold test and the decreased maximum senior secured leverage ratio threshold test are in effect in connection with us making certain permitted investments, certain additional permitted dividends, permitted acquisitions and permitted payments of certain types of indebtedness to the date we deliver our compliance certificate for the fiscal quarter ending September 30, 2017.
In May 2016, we entered into a Sixth Amendment to the Third Amended and Restated Credit Agreement, among the Company and its lenders, pursuant to which those lenders electing to enter into the Sixth Amendment extended the expiration date for the revolving line of credit and the maturity date for the term loan by five years to May 3, 2021. Lenders holding revolving credit commitments aggregating $940.0 million elected to extend the expiration date for the revolving line of credit, and Lenders holding approximately $324.5 million of term loans (out of an aggregate outstanding term loan balance of approximately $330.0 million) elected to extend the term loan maturity date.
In March 2016, we entered into a Purchase Agreement ("Receivables Purchase Agreement") to sell certain accounts receivables to a financial institution without recourse. We are the servicer of the accounts receivable under the Receivables Purchase Agreement. As of March 31, 2016, the maximum amount available under the Receivables Purchase Agreement was $90.0 million. Interest rates are based on LIBOR plus 0.65% -0.70%. As of March 31, 2017 and 2016, the Company sold $78.0 million and $89.9 million, respectively, worth of eligible accounts receivable.
In November 2014, the Company amended its receivable securitization facility (the “Securitization Facility”), increasing the purchase limit from $175.0 million to $225.0 million and extending the term through November 2017.
In May 2014, the Company amended its existing Credit Facility with its lenders to (i) to increase the maximum amount allowed for the Securitization Facility and (ii) amend certain other terms and covenants.
In November 2013, the Company amended the Credit Facility with its lenders to (i) provide for a $375.0 million Term Loan with a maturity date of May 14, 2019, (ii) maintain a Revolving Line of Credit under the Credit Facility to $1.0 billion and increase the accordion feature to $250.0 million, and (iii) amend certain other terms and covenants. The amendment resulted in a more favorable pricing grid and a more streamlined package of covenants and restrictions.
The level of unused borrowing capacity under the Credit Facility varies from time to time depending in part upon its compliance with financial and other covenants set forth in the related agreement. The Credit Facility contains certain
40
affirmative and negative covenants, including limitations on specified levels of indebtedness to earnings before interest, taxes, depreciation and amortization, and interest coverage requirements, and includes limitations on, among other things, liens, mergers, consolidations, sales of assets, payment of dividends and incurrence of debt. As of March 31, 2017, the Company was in compliance with all such covenants.
In June 2014, the Company issued the 2022 Notes for $300.0 million in principal amount. The 2022 Notes were sold at 100% of principal amount and have an effective yield of 5.25%. Interest on the 2022 Notes is payable semiannually in cash in arrears on June 1 and December 1 of each year. We used the net proceeds to redeem the 2018 Notes and pay related fees and expenses. In connection with the issuance of the 2022 Notes, the Company incurred approximately $5.0 million of costs, which were deferred and are being amortized on the effective interest method over the term of the notes.
In February 2013, the Company issued the 2021 Notes for $375.0 million in principal amount. The 2021 Notes were sold at 100% of principal amount and have an effective interest yield of 4.875%. Interest on the 2021 Notes is payable semiannually in cash in arrears on April 1 and October 1 of each year. We used the net proceeds to repay borrowings under our Credit Facility and pay related fees and expenses, and for general corporate purposes. In connection with the issuance of the 2021 Notes, the Company incurred approximately $6.3 million of costs, which were deferred and are being amortized on the effective interest method over the term of the notes.
For further information on the Company's long-term debt, see Note 10 of "Notes to Consolidated Financial Statements".
For the fiscal year ended March 31, 2016, we had a net cash inflow of $83.9 million from operating activities, a decrease of $383.5 million, compared to a net cash inflow of $467.3 million for the fiscal year ended March 31, 2015. During fiscal 2016, the net cash provided by operating activities was primarily attributable to the timing of payments on accounts payable and other accrued expenses ($251.5 million) driven by pre-production costs and net spending on the Tulsa Programs discussed below, offset by increased receipts from customers and others related to increased collection efforts ($40.9 million). During fiscal 2015, the net increase in cash provided by operating activities was primarily due to the cash received from a legal settlement ($134.7 million), and an income tax refund ($26.0 million).
We continue to invest in inventory for new programs which impacts our cash flows operating activities. During fiscal 2016 expenditures for inventory costs on new programs, excluding progress payments, including the Bombardier Global 7000/8000 and the Embraer E-Jet programs, were $146.1 million and $83.8 million, respectively. Net spend on the Tulsa Programs during fiscal 2016 was approximately $57.3 million. Additionally, inventory for mature programs declined due to decreased production rates, by approximately $67.8 million. Unliquidated progress payments netted against inventory decreased $66.8 million due to timing of receipts.
Cash flows used in investing activities for the fiscal year ended March 31, 2016, decreased $60.1 million from the fiscal year ended March 31, 2015. Cash flows used in investing activities for the fiscal year ended March 31, 2016, included the acquisition of Fairchild ($57.1 million), and a payment to settle a working capital adjustment related to the acquisition of GE ($6.0 million) and capital expenditures ($80.0 million). Cash flows used in investing activities for the fiscal year ended March 31, 2015 included the cash received from the acquisition of the Tulsa Programs ($160.0 million) offset by the acquisitions of GE ($65.0 million) and NAAS ($43.7 million) and the working capital finalization of the acquisition of Primus ($13.0 million).
Cash flows provided by financing activities for the fiscal year ended March 31, 2016, were $32.5 million, compared to cash flows used in financing activities for the fiscal year ended March 31, 2015, of $395.2 million. Cash flows provided by financing activities for the fiscal year ended March 31, 2016, included additional borrowings on the Credit Facility to fund the acquisition of Fairchild and to fund operations. Cash flows used in financing activities for the fiscal year ended March 31, 2015, included the redemption of the 2018 Notes, settlement of the Convertible Senior Subordinated Notes ("Convertible Notes") redemptions and the purchase of our common stock ($184.4 million), offset by the issuance of the 2022 Notes.
In May 2017, the Company entered into an Eighth Amendment to the Third Amended and Restated Credit Agreement (the “Eighth Amendment Effective Date”), with its the lenders to, among other things, (i) eliminate the total leverage ratio financial covenant, (ii) increase the maximum permitted senior secured leverage ratio financial covenant applicable to each fiscal quarter, commencing with the fiscal quarter ended March 31, 2017, and to revise the step-downs applicable to such financial covenant, (iii) reduce the aggregate principal amount of commitments under the revolving line of credit to $850.0 million from $1.0 billion, (iv) modify the maturity date of the term loans so that all of the term loans will mature on March 31, 2019, and (v) establish a new higher pricing tier for the interest rate, commitment fee and letter of credit fee pricing provisions and provide that the highest pricing tier will apply until the maximum senior secured leverage ratio financial covenant is 2.50 to 1.00 and the Company delivers a compliance certificate demonstrating compliance with such financial covenant.
41
The Eighth Amendment also provides the Company’s Vought Aircraft Division (Triumph Aerostructures, LLC) and certain affiliated entities (collectively, the “Vought entities”) with the option, if necessary, to commence voluntary insolvency proceedings within 90 days of the Eighth Amendment Effective Date, subject to certain conditions set forth in the Credit Agreement. Upon the commencement of such proceedings, the Vought entities would no longer be Subsidiary Co-Borrowers under the Credit Agreement, and transactions between any of the Vought entities, on the one hand, and the Company and any of the Subsidiary Co-Borrowers, on the other hand, will be restricted.
The Company entered into the Eighth Amendment, among other reasons, in order to provide the Vought entities with greater financial flexibility to address their significant cash utilization relative to certain contracts. While the commencement of such proceedings would not cause a cross default under the Credit Facility, and the Company has taken steps to minimize the impact of such a filing on the rest of its business, there can be no assurance that such a filing would not have a material adverse effect on the Company's obligations to and relationships with customers, suppliers, lenders and financing sources. The Company does not anticipate and believes it is highly unlikely that it will voluntarily file insolvency proceedings with respect to the Vought entities, despite having the ability to do so. The Company expects that any actions it may take regarding the Vought entities will improve the Company’s credit profile and equity value. The Company continues to execute its transformation strategy to strengthen its operations, enhance its liquidity and drive profitable growth.
Capital expenditures were $51.8 million for the fiscal year ended March 31, 2017. We funded these expenditures through cash from operations and borrowings under the Credit Facility. We expect capital expenditures of approximately $80.0 million to $100.0 million for our fiscal year ending March 31, 2018. The expenditures are expected to be used mainly to expand capacity or replace old equipment at several facilities.
Our expected future cash flows for the next five years for long-term debt, leases and other obligations are as follows:
Payments Due by Period | |||||||||||||||||||
Contractual Obligations | Total | Less than 1 Year | 1 - 3 Years | 4 - 5 Years | After 5 Years | ||||||||||||||
(in thousands) | |||||||||||||||||||
Debt principal (1) | $ | 1,208,052 | $ | 160,630 | $ | 102,877 | $ | 634,991 | $ | 309,554 | |||||||||
Debt-interest (2) | 236,652 | 47,337 | 93,160 | 74,649 | 21,506 | ||||||||||||||
Operating leases | 152,117 | 27,636 | 44,564 | 29,734 | 50,183 | ||||||||||||||
Purchase obligations | 1,441,925 | 1,045,808 | 381,284 | 14,665 | 168 | ||||||||||||||
Total | $ | 3,038,746 | $ | 1,281,411 | $ | 621,885 | $ | 754,039 | $ | 381,411 | |||||||||
_______________________________________________
(1) | The maturities of the Term Loan reflected above are based on the maturities dates prior to the May 2017 amendment to the Credit Facility. |
(2) | Includes fixed-rate interest only. |
The above table excludes unrecognized tax benefits of $10.7 million as of March 31, 2017, since we cannot predict with reasonable certainty the timing of cash settlements with the respective taxing authorities.
42
In addition to the financial obligations detailed in the table above, we also had obligations related to our benefit plans at March 31, 2017, as detailed in the following table. Our other postretirement benefits are not required to be funded in advance, so benefit payments are paid as they are incurred. Our expected net contributions and payments are included in the table below:
Pension Benefits | Other Postretirement Benefits | ||||||
(in thousands) | |||||||
Projected benefit obligation at March 31, 2017 | $ | 2,346,990 | $ | 164,128 | |||
Plan assets at March 31, 2017 | 1,900,372 | — | |||||
Projected contributions by fiscal year | |||||||
2018 | — | 16,099 | |||||
2019 | — | 15,757 | |||||
2020 | 17,000 | 15,161 | |||||
2021 | 35,900 | 14,578 | |||||
2022 | 48,000 | 13,860 | |||||
Total 2018 - 2022 | $ | 100,900 | $ | 75,455 | |||
Current plan documents reserve our right to amend or terminate the plans at any time, subject to applicable collective bargaining requirements for represented employees.
We believe that cash generated by operations and borrowings under the Credit Facility will be sufficient to meet anticipated cash requirements for our current operations for the foreseeable future.
Loans under the Credit Facility bear interest, at the Company's option, by reference to a base rate or a rate based on LIBOR, in either case plus an applicable margin determined quarterly based on the Company's Total Leverage Ratio (as defined in the Credit Facility) as of the last day of each fiscal quarter. The Company is also required to pay a quarterly commitment fee on the average daily unused portion of the Credit Facility for each fiscal quarter and fees in connection with the issuance of letters of credit. All outstanding principal and interest under the Credit Facility will be due and payable on the maturity date.
The Credit Facility contains representations, warranties, events of default and covenants customary for financings of this type including, without limitation, financial covenants under which the Company is obligated to maintain on a consolidated basis, as of the end of each fiscal quarter, a certain minimum Interest Coverage Ratio, maximum Total Leverage Ratio and maximum Senior Leverage Ratio (in each case as defined in the Credit Facility).
CRITICAL ACCOUNTING POLICIES
Critical accounting policies are those accounting policies that can have a significant impact on the presentation of our financial condition and results of operations, and that require the use of complex and subjective estimates based upon past experience and management's judgment. Because of the uncertainty inherent in such estimates, actual results may differ from these estimates. Below are those policies applied in preparing our financial statements that management believes are the most dependent on the application of estimates and assumptions. For additional accounting policies, see Note 2 of "Notes to Consolidated Financial Statements."
Allowance for Doubtful Accounts
Trade receivables are presented net of an allowance for doubtful accounts. In determining the appropriate allowance, we consider a combination of factors, such as industry trends, our customers' financial strength and credit standing, and payment and default history. The calculation of the required allowance requires a judgment as to the impact of these and other factors on the ultimate realization of our trade receivables. We believe that these estimates are reasonable and historically have not resulted in material adjustments in subsequent periods when the estimates are adjusted to actual amounts.
Inventories
The Company records inventories at the lower of cost or estimated net realizable value. Costs on long-term contracts and programs in progress represent recoverable costs incurred for production or contract-specific facilities and equipment, allocable operating overhead and advances to suppliers. Pursuant to contract provisions, agencies of the U.S. Government and certain other customers have title to, or a security interest in, inventories related to such contracts as a result of advances, performance-based payments, and progress payments. The Company reflects those advances and payments as an offset against the related
43
inventory balances. The Company expenses general and administrative costs related to products and services provided essentially under commercial terms and conditions as incurred. The Company determines the costs of inventories by the first-in, first-out or average cost methods.
Advance payments and progress payments received on contracts-in-process are first offset against related contract costs that are included in inventory, with any remaining amount reflected in current liabilities.
Work-in-process inventory includes capitalized pre-production costs. Company policy allows for the capitalization of pre-production costs after it establishes a contractual arrangement with a customer that explicitly states that the cost of recovery of pre-production costs is allowed.
Capitalized pre-production costs include nonrecurring engineering, planning and design, including applicable overhead, incurred before production is manufactured on a regular basis. Significant customer-directed work changes can also cause pre-production costs to be incurred (see Note 5 of "Notes to Consolidated Financial Statements" for further discussion).
Revenue and Profit Recognition
Revenues are recognized in accordance with the contract terms when products are shipped, delivery has occurred or services have been rendered, pricing is fixed or determinable, and collection is reasonably assured.
A significant portion of our contracts are within the scope of Accounting Standards Codification ("ASC") 605-35, Revenue Recognition —Construction-Type and Production-Type Contracts, and revenue and costs on contracts are recognized using the percentage-of-completion method of accounting. Accounting for the revenue and profit on a contract requires estimates of (1) the contract value or total contract revenue, (2) the total costs at completion, which is equal to the sum of the actual incurred costs to date on the contract and the estimated costs to complete the contract's scope of work and (3) the measurement of progress towards completion. Depending on the contract, we measure progress toward completion using either the cost-to-cost method or the units-of-delivery method, with the great majority measured under the units-of-delivery method.
• | Under the cost-to-cost method, progress toward completion is measured as the ratio of total costs incurred to our estimate of total costs at completion. We recognize costs as incurred. Profit is determined based on our estimated profit margin on the contract multiplied by our progress toward completion. Revenue represents the sum of our costs and profit on the contract for the period. |
• | Under the units-of-delivery method, revenue on a contract is recorded as the units are delivered and accepted during the period at an amount equal to the contractual selling price of those units. The costs recorded on a contract under the units-of-delivery method are equal to the total costs at completion divided by the total units to be delivered. As our contracts can span multiple years, we often segment the contracts into production lots for the purposes of accumulating and allocating cost. Profit is recognized as the difference between revenue for the units delivered and the estimated costs for the units delivered. |
Adjustments to original estimates for a contract's revenues, estimated costs at completion and estimated total profit are often required as work progresses under a contract, as experience is gained and as more information is obtained, even though the scope of work required under the contract may not change, or if contract modifications occur. These estimates are also sensitive to the assumed rate of production. Generally, the longer it takes to complete the contract quantity, the more relative overhead that contract will absorb. The impact of revisions in cost estimates is recognized on a cumulative catch-up basis in the period in which the revisions are made. Provisions for anticipated losses on contracts are recorded in the period in which they become evident ("forward losses") and are first offset against costs that are included in inventory, with any remaining amount reflected in accrued contract liabilities in accordance with ASC 605-35. Revisions in contract estimates, if significant, can materially affect our results of operations and cash flows, as well as our valuation of inventory. Furthermore, certain contracts are combined or segmented for revenue recognition in accordance with ASC 605-35.
For the fiscal year ended March 31, 2017, cumulative catch-up adjustments resulting from changes in contract values and estimated costs that arose during the fiscal year increased operating loss, net loss and earnings per share by approximately $57.2 million, $52.6 million and $1.07, respectively. The cumulative catch-up adjustments to operating income for the fiscal year ended March 31, 2017, included gross favorable adjustments of approximately $163.3 million and gross unfavorable adjustments of approximately $106.1 million, which includes a reduction to the previously recognized forward losses of $131.4 million for the 747-8 program.
For the fiscal year ended March 31, 2016, cumulative catch-up adjustments resulting from changes in estimates decreased operating loss, net loss and earnings per share by approximately $596.2 million, $539.0 million and $10.95, respectively. The cumulative catch-up adjustments to operating income for the fiscal year ended March 31, 2016, included gross favorable adjustments of approximately $33.0 million and gross unfavorable adjustments of approximately $629.2 million, which
44
includes a provision for forward losses of $561.2 million on the Bombardier Global 7000/8000 ("Bombardier") and 747-8 programs.
For the fiscal year ended March 31, 2015, cumulative catch-up adjustments resulting from changes in estimates decreased operating income, net income and earnings per share by approximately $156.0 million, $106.6 million and $2.09, respectively. The cumulative catch-up adjustments to operating income for the fiscal year ended March 31, 2015, included gross favorable adjustments of approximately $4.7 million and gross unfavorable adjustments of approximately $160.7 million which includes a provision for forward losses of $152.0 million on the 747-8 program.
Amounts representing contract change orders or claims are only included in revenue when such change orders or claims have been settled with our customer and to the extent that units have been delivered. Additionally, some contracts may contain provisions for revenue sharing, price re-determination, requests for equitable adjustments, change orders or cost and/or performance incentives. Such amounts or incentives are included in contract value when the amounts can be reliably estimated and their realization is reasonably assured.
Although fixed-price contracts, which extend several years into the future, generally permit us to keep unexpected profits if costs are less than projected, we also bear the risk that increased or unexpected costs may reduce our profit or cause the Company to sustain losses on the contract. In a fixed-price contract, we must fully absorb cost overruns, notwithstanding the difficulty of estimating all of the costs we will incur in performing these contracts and in projecting the ultimate level of revenue that may otherwise be achieved.
As previously disclosed, we recognized a provision for forward losses associated with our long-term contract on the 747-8 and Bombardier programs. There is still risk similar to what we have experienced on the 747-8 and Bombardier programs. Particularly, our ability to manage risks related to supplier performance, execution of cost reduction strategies, hiring and retaining skilled production and management personnel, quality and manufacturing execution, program schedule delays and many other risks, will determine the ultimate performance of these long-term programs.
Product Support provides repair and overhaul services, certain of which are provided under long-term power-by-the-hour contracts, comprising approximately 3% of the segment's fiscal 2017 net sales. The Company applies the proportional performance method to recognize revenue under these contracts. Revenue is recognized over the contract period as units are delivered based on the relative value in proportion to the total estimated contract consideration. In estimating the total contract consideration, management evaluates the projected utilization of its customer's fleet over the term of the contract, in connection with the related estimated repair and overhaul servicing requirements to the fleet based on such utilization. Changes in utilization of the fleet by customers, among other factors, may have an impact on these estimates and require adjustments to estimates of revenue to be realized.
Goodwill and Intangible Assets
The Company accounts for purchased goodwill and intangible assets in accordance with Accounting Standards Codification ("ASC") 350, Intangibles—Goodwill and Other. Under ASC 350, purchased goodwill and intangible assets with indefinite lives are not amortized; rather, they are tested for impairment on at least an annual basis. Intangible assets with finite lives are amortized over their useful lives. Upon acquisition, critical estimates are made in valuing acquired intangible assets, which include but are not limited to: future expected cash flows from customer contracts, customer lists, and estimating cash flows from projects when completed; tradename and market position, as well as assumptions about the period of time that customer relationships will continue; and discount rates. Management's estimates of fair value are based upon assumptions believed to be reasonable, but which are inherently uncertain and unpredictable and, as a result, actual results may differ from the assumptions used in determining the fair values.
The Company's operating segments of Integrated Systems, Aerospace Structures, Precision Components and Product Support are also its reporting units. The Chief Executive Officer is the Company's Chief Operating Decision Maker ("CODM"). The Company's CODM evaluates performance and allocates resources based upon review of segment information. Each of the operating segments is comprised of a number of operating units which are considered to be components. The components, for which discrete financial information exists, are aggregated for purposes of goodwill impairment testing. The Company's acquisition strategy is to acquire companies that complement and enhance the capabilities of the operating segments of the Company. Each acquisition is assigned to either the Integrated Systems reporting unit, the Aerospace Structures reporting unit, the Precision Components reporting unit or the Product Support reporting unit. The goodwill that results from each acquisition is also assigned to the reporting unit to which the acquisition is allocated, because it is that reporting unit which is intended to benefit from the synergies of the acquisition.
45
The Company assesses whether goodwill impairment exists using both the qualitative and quantitative assessments. The qualitative assessment involves determining whether events or circumstances exist that indicate it is more likely than not that the fair value of a reporting unit is less than its carrying amount, including goodwill. If based on this qualitative assessment the Company determines it is not more likely than not that the fair value of a reporting unit is less than its carrying amount or if the Company elects not to perform a qualitative assessment, a quantitative assessment is performed as required by ASC 350 to determine whether a goodwill impairment exists at the reporting unit.
The quantitative test is used to compare the carrying amount of the reporting unit's assets to the fair value of the reporting unit. If the fair value exceeds the carrying value, no further evaluation is required and no impairment loss is recognized. If the carrying amount exceeds the fair value, then an impairment loss occurs. The impairment is measured by using the amount by which the carrying value exceeds the fair value not to exceed the amount of recorded goodwill. The determination of the fair value of our reporting units is based, among other things, on estimates of future operating performance of the reporting unit being valued. We are required to complete an impairment test for goodwill and record any resulting impairment losses at least annually. Changes in market conditions, among other factors, may have an impact on these estimates and require interim impairment assessments.
When performing the quantitative impairment test, the Company's methodology includes the use of an income approach which discounts future net cash flows to their present value at a rate that reflects the Company's cost of capital, otherwise known as the discounted cash flow method ("DCF"). These estimated fair values are based on estimates of future cash flows of the businesses. Factors affecting these future cash flows include the continued market acceptance of the products and services offered by the businesses, the development of new products and services by the businesses and the underlying cost of development, the future cost structure of the businesses, and future technological changes. The Company also incorporates market multiples for comparable companies in determining the fair value of our reporting units. Any such impairment would be recognized in full in the reporting period in which it has been identified. The Company early adopted ASU 2017-04, which eliminates Step 2 of the goodwill impairment analysis (see Recently Issued Accounting Pronouncements below).
In the fourth quarter of the fiscal year ended March 31, 2017, consistent with the Company's policy described here within, the Company performed its annual assessment of the fair value of goodwill. The Company concluded that the goodwill related to the Aerospace Structures reporting unit was impaired as of the annual testing date. The Company concluded that the reporting unit had a fair value that was lower than its carrying value by an amount that exceed the remaining goodwill for the reporting unit. Accordingly, the Company recorded a non-cash impairment charge during the fourth quarter of the fiscal year ending March 31, 2017, of $266.3 million, which is presented on the accompanying Consolidated Statements of Operations as "Impairment of intangible assets”. The decline in fair value is the result of declining revenues from production rate reductions on sun-setting programs and the slower than previously projected ramp in our development programs and the timing of associated earnings and cash flows (see Note 2 of the Notes to Consolidated Financial Statements for definition of fair value levels).
The Company’s assessment of the Precision Components reporting unit concluded that the goodwill was not impaired as of the annual impairment assessment date. However, the excess of the fair value over the carrying value for the reporting unit was less than 5%. The decline in fair value is the result of declining revenues from production rate reductions on sun-setting programs and the start-up costs related to new programs and the timing of associated earnings and cash flows. Going forward, the Company will continue to monitor the performance of this reporting unit in relation to the key assumptions in our analysis.
In the event that market multiples for stock price to EBITDA in the aerospace and defense markets decrease, or the expected EBITDA and cash flows for our reporting units decreases, an additional goodwill impairment charge may be required, which would adversely affect our operating results and financial condition. If management determines that impairment exists, the impairment will be recognized in the period in which it is identified.
Prior to adoption of ASU 2017-04, the Company used the quantitative assessment to perform the two-step approach required by ASC 350 to determine whether a goodwill impairment exists at the reporting unit.
The first step of the quantitative test is to compare the carrying amount of the reporting unit's assets to the fair value of the reporting unit. If the fair value exceeds the carrying value, no further work is required and no impairment loss is recognized. If the carrying amount exceeds the fair value, then the second step is required to be completed, which involves allocating the fair value of the reporting unit to each asset and liability, with the excess being applied to goodwill. An impairment loss occurs if the amount of the recorded goodwill exceeds the implied goodwill. The determination of the fair value of our reporting units is based, among other things, on estimates of future operating performance of the reporting unit being valued. We are required to
46
complete an impairment test for goodwill and record any resulting impairment losses at least annually. Changes in market conditions, among other factors, may have an impact on these estimates and require interim impairment assessments.
When performing the two-step quantitative impairment test, the Company's methodology includes the use of an income approach which discounts future net cash flows to their present value at a rate that reflects the Company's cost of capital, otherwise known as the discounted cash flow method ("DCF"). These estimated fair values are based on estimates of future cash flows of the businesses. Factors affecting these future cash flows include the continued market acceptance of the products and services offered by the businesses, the development of new products and services by the businesses and the underlying cost of development, the future cost structure of the businesses, and future technological changes. The Company also incorporates market multiples for comparable companies in determining the fair value of our reporting units. Any such impairment would be recognized in full in the reporting period in which it has been identified.
In the fourth quarter of fiscal 2016, the Company performed the quantitative assessment for all three of the Company's former reporting units, which indicated that the fair value of goodwill for the former Aerostructures reporting unit did not exceed its carrying amount. After evaluating whether other assets within the reporting unit were impaired in accordance with ASC 350, we concluded on the implied goodwill under Step 2 resulting in a $597.6 million impairment of goodwill to the former Aerostructures reporting unit. The assessment for the Company's reporting units formerly known as Aerospace Systems and Aftermarket Services indicated that the fair value of their respective goodwill exceeded the carrying amount. We incurred no impairment of goodwill as a result of our annual goodwill impairment tests in fiscal 2015 (see Note 7 for further discussion).
As of March 31, 2016, the Company had a $163.0 million indefinite-lived intangible asset associated with the tradenames acquired in the acquisitions of Vought Aircraft Industries, Inc. ("Vought") and Embee, Inc. ("Embee"). The Company assesses whether indefinite-lived intangible assets impairment exists using both the qualitative and quantitative assessments. The qualitative assessment involves determining whether events or circumstances exist that indicate it is more likely than not that the fair value of an indefinite-lived intangible asset is less than its carrying amount. If based on this qualitative assessment, the Company determines it is not more likely than not that the fair value of an indefinite-lived intangible asset is less than its carrying amount or if the Company elects not to perform a qualitative assessment, a quantitative assessment is performed to determine whether an indefinite-lived intangible asset impairment exists. We test the indefinite-lived intangible assets for impairment by comparing the carrying value to the fair value based on current revenue projections of the related operations, under the relief from royalty method. Any excess of the carrying value over the amount of fair value is recognized as an impairment.
During the third quarter of the fiscal year ended March 31, 2016, the Company performed an interim assessment of fair value on our indefinite-lived intangible assets due to indicators of impairment related to the continued decline in our stock price during the fiscal third quarter. Based on the Company's evaluation, the Company concluded that the Vought tradename had a fair value of $195.8 million (Level 3) compared to a carrying value of $425.0 million. Accordingly, the Company recorded a non-cash impairment charge during the fiscal year ended March 31, 2016, of $229.2 million, which is presented on the accompanying Consolidated Statements of Operations as "Impairment of intangible assets". The decline in fair value compared to the carrying value of the Vought tradename is the result of declining revenues from production rate reductions and the slower than previously projected ramp in Bombardier Global 7000/8000 and the timing of associated earnings.
In the fourth quarter of fiscal 2016, the Company performed its annual impairment test for each of the Company's indefinite-lived intangible assets, which indicated that the Vought and Embee tradenames had a fair value of $163.0 million (Level 3) compared to a carrying value of $209.2 million. The decline in fair value of the tradenames is the result of the increase in discount rate during the fourth quarter of fiscal 2016, which required the Company to assess whether events and/or circumstances have changed regarding the indefinite-life conclusion. As a result the Company incurred a non-cash impairment charge of $46.2 million presented on the accompanying Consolidated Statements of Operations as "Impairment of intangible assets" to the Vought and Embee tradenames. The Company incurred no impairment of indefinite-lived assets as a result of our annual indefinite-lived assets impairment tests in fiscal 2015.
During the fiscal year ended March 31, 2017, as part of the Company's annual assessment, the Company determined that the remaining estimated useful life for the Vought tradename should be reduced from a useful life of 20 years to a useful life of 10 years, as it better represents the financial performance relative to the expected performance.
Finite-lived intangible assets are amortized over their useful lives ranging from 3 to 32 years. The Company continually evaluates whether events or circumstances have occurred that would indicate that the remaining estimated useful lives of long-lived assets, including intangible assets, may warrant revision or that the remaining balance may not be recoverable. Intangible assets are evaluated for indicators of impairment. When factors indicate that long-lived assets, including intangible assets, should be evaluated for possible impairment, an estimate of the related undiscounted cash flows over the remaining life of the
47
long-lived assets, including intangible assets, is used to measure recoverability based on the primary asset of the asset group. Some of the more important factors management considers include the Company's financial performance relative to expected and historical performance, significant changes in the way the Company manages its operations, negative events that have occurred, and negative industry and economic trends. If the estimated fair value is less than the carrying amount, measurement of the impairment will be based on the difference between the carrying value and fair value of the asset group, generally determined based on the present value of expected future cash flows associated with the use of the asset.
Acquired Contract Liabilities, net
In connection with several of our acquisitions, we assumed existing long-term contracts. Based on our review of these contracts, we concluded that the terms of certain contracts to be either more or less favorable than could be realized in market transactions as of the date of the acquisition. As a result, we recognized acquired contract liabilities, net of acquired contract assets as of the acquisition date of each respective acquisition, based on the present value of the difference between the contractual cash flows of the executory contracts and the estimated cash flows had the contracts been executed at the acquisition date. The liabilities principally relate to long-term contracts that were initially executed at several years prior to the respective acquisition (see Note 3 of "Notes to Consolidated Financial Statements" for further discussion).
The acquired contract liabilities, net, are being amortized as non-cash revenues over the terms of the respective contracts. The Company recognized net amortization of contract liabilities of approximately $121.0 million, $132.4 million and $75.7 million in the fiscal years ended March 31, 2017, 2016 and 2015, respectively, and such amounts have been included in revenues in our results of operations. The balance of the liability as of March 31, 2017, is approximately $394.9 million and, based on the expected delivery schedule of the underlying contracts, the Company estimates annual amortization of the liability as follows 2018—$112.1 million; 2019—$77.0 million; 2020—$55.4 million; 2021—$51.1 million; 2022—$51.1 million; Thereafter—$48.2 million.
Postretirement Plans
The liabilities and net periodic cost of our pension and other postretirement plans are determined using methodologies that involve several actuarial assumptions, the most significant of which are the discount rate, the expected long-term rate of asset return and rate of growth for medical costs. The actuarial assumptions used to calculate these costs are reviewed annually or when a remeasurement is necessary. Assumptions are based upon management's best estimates, after consulting with outside investment advisors and actuaries, as of the measurement date.
During the fourth quarter of the fiscal year ended March 31, 2016, we changed the method we use to estimate the service and interest components of net periodic benefit cost for our pension and other postretirement benefit plans. This new estimation approach discounts the individual expected cash flows underlying the service cost and interest cost by applying the specific spot rates derived from the yield curve used to discount the cash flows reflected in the measurement of the benefit obligation. Historically, we estimated these service and interest cost components utilizing a single weighted-average discount rate derived from the yield curve used to measure the benefit obligation at the beginning of the period.
We made this change to provide a more precise measurement of service and interest costs by improving the correlation between projected benefit cash flows to the corresponding spot yield curve rates. We have accounted for this change as a change in accounting estimate that is inseparable from a change in accounting principle pursuant to ASC 250, Accounting Changes and Error Corrections and accordingly have accounted for it prospectively. While the benefit obligation measured under this approach is unchanged from that determined under the prior approach, the more granular application of the spot rates reduced the service and interest cost for the pension and OPEB plans for the fiscal year ended March 31, 2017, by approximately $20.0 million. The spot rates used to determine service and interest costs for the U.S. plans ranged from 0.60% to 9.75%. Under the Company’s prior methodology, these rates would have resulted in weighted-average rates for service cost and interest cost of 3.86% for the U.S. pension plans and 3.73% for the OPEB plans. The new approach will be used to measure the service cost and interest cost for our pension and OPEB plans for the fiscal year ended March 31, 2017.
Effective April 1, 2015, the Company changed the period over which actuarial gains and losses are being amortized for its U.S. pension plans from the average remaining future service period of active plan participants to the average life expectancy of inactive plan participants. This change was made because the Company has determined that as of that date almost all plan participants are inactive.
The accounting corridor is a defined range within which amortization of net gains and losses is not required. The discount rates at March 31, 2017, ranged from 2.87 - 4.06% compared to a weighted-average of 3.25 - 3.93% at March 31, 2016.
The assumed expected long-term rate of return on assets is the weighted-average rate of earnings expected on the funds invested or to be invested to provide for the benefits included in the Projected Benefit Obligation ("PBO"). The expected
48
average long-term rate of return on assets is based on several factors, including actual historical market index returns, anticipated long-term performance of individual asset classes with consideration given to the related investment strategy, plan expenses and the potential to outperform market index returns. This rate is utilized principally in calculating the expected return on plan assets component of the annual pension expense. To the extent the actual rate of return on assets realized over the course of a year differs from the assumed rate, that year's annual pension expense is not affected. The gain or loss reduces or increases future pension expense over the average remaining life expectancy of inactive plan participants. The expected long-term rate of return for fiscal 2017, 2016 and 2015, was 6.50 - 8.00%. The expected long-term rate of return for fiscal 2017 will be 8.00%.
In addition to our defined benefit pension plans, we provide certain healthcare and life insurance benefits for some retired employees. Such benefits are unfunded as of March 31, 2017. Employees achieve eligibility to participate in these contributory plans upon retirement from active service if they meet specified age and years of service requirements. Election to participate for eligible employees must be made at the date of retirement. Qualifying dependents at the date of retirement are also eligible for medical coverage. Current plan documents reserve our right to amend or terminate the plans at any time, subject to applicable collective bargaining requirements for represented employees. From time to time, we have made changes to the benefits provided to various groups of plan participants. Premiums charged to most retirees for medical coverage prior to age 65 are based on years of service and are adjusted annually for changes in the cost of the plans as determined by an independent actuary. In addition to this medical inflation cost-sharing feature, the plans also have provisions for deductibles, co-payments, coinsurance percentages, out-of-pocket limits, schedules of reasonable fees, preferred provider networks, coordination of benefits with other plans, and a Medicare carve-out.
In accordance with ASC 715, Compensation—Retirement Benefits, we recognized the funded status of our benefit obligation. This funded status is remeasured as of our annual remeasurement date. The funded status is measured as the difference between the fair value of the plan's assets and the PBO or accumulated postretirement benefit obligation of the plan. In order to recognize the funded status, we determined the fair value of the plan assets. The majority of our plan assets are publicly traded investments which were valued based on the market price as of the date of remeasurement. Investments that are not publicly traded were valued based on the estimated fair value of those investments as of the remeasurement date based on our evaluation of data from fund managers and comparable market data.
The Company periodically experiences events or makes changes to its benefit plans that result in curtailment or special charges. Curtailments are recognized when events occur that significantly reduce the expected years of future service of present employees or eliminates the benefits for a significant number of employees for some or all of their future service.
Curtailment losses are recognized when it is probable the curtailment will occur and the effects are reasonably estimable. Curtailment gains are recognized when the related employees are terminated or a plan amendment is adopted, whichever is applicable.
As required under ASC 715, the Company remeasures plan assets and obligations during an interim period whenever a significant event occurs that results in a material change in the net periodic pension cost. The determination of significance is based on judgment and consideration of events and circumstances impacting the pension costs.
See Note 15 of "Notes to Consolidated Financial Statements" for a summary of the key events that affected our net periodic benefit cost and obligations that occurred during the fiscal years ended March 31, 2017, 2016 and 2015.
Pension income, excluding curtailments, settlements and special termination benefits (early retirement incentives) for the fiscal year ended March 31, 2017, was $66.5 million compared with pension income of $57.2 million for the fiscal year ended March 31, 2016, and $52.4 million for the fiscal year ended March 31, 2015. For the fiscal year ending March 31, 2018, the Company expects to recognize pension income of approximately $66.5 million.
Recently Issued Accounting Pronouncements
In May 2014, the FASB issued ASU 2014-09, Revenue from Contracts with Customers (“ASU 2014-09”, “ASC 606”), which requires recognition of revenue to depict the transfer of goods or services to customers in an amount that reflects the consideration to which the entity expects to be entitled in exchange for those goods or services. The FASB has issued several updates to ASU 2014-09 which must be adopted concurrently with ASU 2014-09.
Under ASC 606, revenue is recognized when control of promised goods or services transfers to a customer and is recognized in an amount that reflects the consideration which the entity expects to receive in exchange for those goods or services. The major provisions include determining enforceable rights and obligation between parties, defining performance obligations as the units of accounting under contract, accounting for variable consideration, and determining whether
49
performance obligations are satisfied over time or at a point of time. Additionally, ASC 606 requires disclosure of the nature, amount, timing, and uncertainty of revenue and cash flows arising from contracts with customers.
ASC 606 will be effective for us beginning April 1, 2018 and early adoption as of April 1, 2017 is permitted. The guidance permits two methods of adoption: retrospectively to each prior reporting period presented (“full retrospective method”), or retrospectively with the cumulative effect of initially applying ASC 606 recognized at the date of initial application (“the modified retrospective method”). The Company is adopting ASC 606 effective April 1, 2018 and the Company expects to do so using the modified retrospective method.
During the fiscal year ended March 31, 2016, we established a cross-functional team to assess and prepare for implementation of the new standard. We are analyzing the impact of the new standard on the Company’s revenue contracts, comparing our current accounting policies and practices to the requirements of the new standard, and identifying potential differences that would result from applying the new standard to our contracts.
While further analysis of ASC 606 and a review of all material contracts is underway the adoption of ASC 606 may impact the amounts and timing of revenue recognition and the accounting treatment of certain deferred production costs. Under ASC 606, the units-of-delivery method is no longer viable and some performance obligations may be satisfied over time which may change the timing of recognition of revenue and associated production costs for certain contracts.
In March 2017, the Financial Accounting Standards Board ("FASB") issued Accounting Standards Update No. 2017-07, Improving the Presentation of Net Periodic Pension Cost and Net Periodic Postretirement Benefit Cost (“ASU 2017-07”). ASU 2017-07 amends ASC 715, Compensation — Retirement Benefits, to require employers that present a measure of operating income in their statement of income to include only the service cost component of net periodic pension cost and net periodic postretirement benefit cost in operating expenses (together with other employee compensation costs). The other components of net benefit cost, including amortization of prior service cost/credit, and settlement and curtailment effects, are to be included in nonoperating expenses. Employers that do not present a measure of operating income are required to include the service cost component in the same line item as other employee compensation costs. Employers are required to include all other components of net benefit cost in a separate line item(s). The line item(s) in which the components of net benefit cost other than the service cost are included need to be identified as such on the income statement or in the disclosures. ASU 2017-07 also stipulates that only the service cost component of net benefit cost is eligible for capitalization. ASU 2017-07 is effective for reporting periods beginning after December 15, 2017, with early adoption permitted. The Company is currently performing its assessment of the impact of adopting the guidance; however based on its expectations for the fiscal year ended March 31, 2018, the Company believes the it will likely have a material impact due to the reclassification of pension and OPEB income from capitalized costs (Operating Income) to Other Income. Excluding the service costs, the net periodic pension benefit for the fiscal year ended March 31, 2018 is expected to be $67.0 million.
In January 2017, the FASB issued ASU 2017-04, Intangibles - Goodwill and Other (Topic 350), Simplifying the Test for Goodwill Impairment (“ASU 2017-04). ASU 2017-04 removes Step 2 of the goodwill impairment test, which requires a hypothetical purchase price allocation. A goodwill impairment will now be the amount by which a reporting unit’s carrying value exceeds its fair value, not to exceed the carrying amount of goodwill. ASU 2017-04 is effective for reporting periods beginning after December 15, 2019, with early adoption permitted for annual and interim goodwill impairment testing dates after January 1, 2017. The Company early adopted ASU 2017-04, which reduced the cost and complexity of the impairment testing.
In August 2016, the FASB issued ASU 2016-15, Statement of Cash Flows (Topic 230), Classification of Certain Cash Receipts and Cash Payments (“ASU 2016-15”). ASU 2016-15 provides guidance on eight specific cash flow classification issues. Current GAAP does not include specific guidance on these eight cash flow classification issues. ASU 2016-15 is effective for reporting periods beginning after December 15, 2017, with early adoption permitted. The adoption of ASU 2016-15 is not expected to have a material impact on the Company's consolidated financial statements.
In March 2016, the FASB issued ASU 2016-09, Compensation - Stock Compensation (Topic 718): Improvements to Employee Share-Based Payment Accounting ("ASU 2016-09"). ASU 2016-09 identifies areas for simplification involving several aspects of accounting for share-based payment transactions, including the income tax consequences, classification of awards as either equity or liabilities, an option to recognize gross stock compensation expense with actual forfeitures recognized as they occur, as well as certain classifications on the statement of cash flows. ASU 2016-09 will be effective for annual periods beginning after December 15, 2016. Early adoption is permitted. The adoption of ASU 2016-15 is not expected to have a material impact on the Company's consolidated financial statements.
50
In February 2016, the FASB issued ASU 2016-02, Leases (Topic 842) ("ASU 2016-02"). This update requires recognition of lease assets and lease liabilities on the balance sheet of lessees. ASU 2016-02 is effective for fiscal years beginning after December 15, 2018 and interim reporting periods within those years. Early adoption is permitted. ASU 2016-02 requires a modified retrospective transition approach and provides certain optional transition relief. The Company is currently evaluating the new guidance to determine the impact it may have to the Company's consolidated financial statements.
In May 2015, the FASB issued ASU 2015-05, Fair Value Measurement (Topic 820): Disclosures for Investments in Certain Entities That Calculate Net Asset Value per Share (or Its Equivalent) ("ASU 2015-05"). This update eliminates the requirement to categorize within the fair value hierarchy investments whose fair values are measured at net asset value (NAV) using the practical expedient in Accounting Standards Codification (ASC 820). ASU 2015-05 is effective for fiscal years beginning after December 15, 2015 and interim reporting periods within those years. ASU 2015-05 requires retrospective application.
Forward-Looking Statements
This report contains forward-looking statements within the meaning of the Private Securities Litigation Reform Act of 1995 relating to our future operations and prospects, including statements that are based on current projections and expectations about the markets in which we operate, and management's beliefs concerning future performance and capital requirements based upon current available information. Such statements are based on management's beliefs as well as assumptions made by and information currently available to management. When used in this document, words like "may," "might," "will," "expect," "anticipate," "believe," "potential," and similar expressions are intended to identify forward-looking statements. Actual results could differ materially from management's current expectations. For example, there can be no assurance that additional capital will not be required or that additional capital, if required, will be available on reasonable terms, if at all, at such times and in such amounts as may be needed by us. In addition to these factors, among other factors that could cause actual results to differ materially, are uncertainties relating to the integration of acquired businesses, general economic conditions affecting our business segments, dependence of certain of our businesses on certain key customers, the risk that we will not realize all of the anticipated benefits from acquisitions as well as competitive factors relating to the aerospace industry. For a more detailed discussion of these and other factors affecting us, see the risk factors described in "Item 1A. Risk Factors."
Item 7A. | Quantitative and Qualitative Disclosures About Market Risk |
Commodity Price Risk
Some contracts with our suppliers for raw materials, component parts and other goods are short-term contracts, which are subject to termination on a relatively short-term basis. The prices of our raw materials and component parts fluctuate depending on market conditions, and substantial increases in prices could increase our operating costs, which, as a result of our fixed-price contracts, we may not be able to recoup through increases in the prices of our products. We generally do not employ forward contracts or other financial instruments to hedge commodity price risk, although we continue to review a full range of business options focused on strategic risk management for all material commodities.
Any failure by our suppliers to provide acceptable raw materials, components, kits or subassemblies could adversely affect our production schedules and contract profitability. We assess qualification of suppliers and continually monitor them to control risk associated with such supply base reliance.
To a lesser extent, we also are exposed to fluctuations in the prices of certain utilities and services, such as electricity, natural gas, chemicals and freight. We utilize a range of long-term agreements to minimize procurement expense and supply risk in these areas.
Foreign Exchange Risk
In addition, even when revenues and expenses are matched, we must translate foreign denominated results of operations, assets and liabilities for our foreign subsidiaries to U.S. dollars in our consolidated financial statements. Consequently, increases and decreases in the value of the U.S. dollar as compared to the respective foreign currencies will affect our reported results of operations and the value of our assets and liabilities on our consolidated balance sheet, even if our results of operations or the value of those assets and liabilities has not changed in its original currency. These transactions could significantly affect the comparability of our results between financial periods and/or result in significant changes to the carrying value of our assets, liabilities and stockholders' equity.
We are subject to foreign currency exchange rate risk relating to receipts from customers and payments to suppliers in foreign currencies. We use foreign currency forward contracts to hedge the price risk associated with forecasted foreign denominated payments related to our ongoing business. Foreign currency forward contracts are sensitive to changes in foreign currency exchange rates. At March 31, 2017, a 10% change in the exchange rate in our portfolio of foreign currency contracts
51
would not have material impact on our unrealized gains. Consistent with the use of these contracts to neutralize the effect of exchange rate fluctuations, such unrealized losses or gains would be offset by corresponding gains or losses, respectively, in the remeasurement of the underlying transactions being hedged. When taken together, these forward currency contracts and the offsetting underlying commitments do not create material market risk.
Interest Rate Risk
Our primary exposure to market risk consists of changes in interest rates on borrowings. An increase in interest rates would adversely affect our operating results and the cash flow available after debt service to fund operations and expansion. In addition, an increase in interest rates would adversely affect our ability to pay dividends on our common stock, if permitted to do so under certain of our debt arrangements, including the Credit Facility. We manage exposure to interest rate fluctuations by optimizing the use of fixed and variable rate debt. As of March 31, 2017, approximately 88% of our debt was fixed-rate debt. Our financing policy states that we generally maintain between 50% and 75% of our debt as fixed-rate debt, however, a portion of our variable debt is fixed through an interest rate swap. Our fixed-rate debt was unusually high as of March 31, 2017, because we received a significant amount of customer advances in our fiscal fourth quarter, which was used to pay down our variable debt. The information below summarizes our market risks associated with debt obligations and should be read in conjunction with Note 10 of "Notes to Consolidated Financial Statements."
The following table presents principal cash flows and the related interest rates. Fixed interest rates disclosed represent the weighted-average rate as of March 31, 2017. Variable interest rates disclosed fluctuate with the LIBOR, federal funds rates and other weekly rates and represent the weighted-average rate at March 31, 2017.
Expected Years of Maturity
Next 12 Months | 13 - 24 Months | 25 - 36 Months | 37 - 48 Months | 49 - 60 Months | Thereafter | Total | |||||||||||||||||||||
Fixed-rate cash flows (in thousands) | $ | 47,694 | $ | 52,655 | $ | 50,217 | $ | 53,760 | $ | 549,054 | $ | 309,456 | $ | 1,062,836 | |||||||||||||
Weighted-average interest rate (%) | 4.58 | % | 4.63 | % | 4.68 | % | 4.74 | % | 4.91 | % | 4.13 | % | |||||||||||||||
Variable-rate cash flows (in thousands) | $ | 112,900 | $ | — | $ | — | $ | 2,178 | $ | 30,000 | $ | — | $ | 145,078 | |||||||||||||
Weighted-average interest rate (%) | 2.70 | % | — | % | — | % | 4.46 | % | 4.20 | % | — | % | |||||||||||||||
There are no other significant market risk exposures.
52
Item 8. | Financial Statements and Supplementary Data |
Report of Independent Registered Public Accounting Firm
The Board of Directors and Stockholders of Triumph Group, Inc.
We have audited the accompanying consolidated balance sheets of Triumph Group, Inc. as of March 31, 2017 and 2016, and the related consolidated statements of operations, comprehensive (loss) income, stockholders' equity, and cash flows for each of the three years in the period ended March 31, 2017. Our audits also included the financial statement schedule listed in the Index at Item 15(a). These financial statements and schedule are the responsibility of the Company's management. Our responsibility is to express an opinion on these financial statements and schedule based on our audits.
We conducted our audits in accordance with the standards of the Public Company Accounting Oversight Board (United States). Those standards require that we plan and perform the audit to obtain reasonable assurance about whether the financial statements are free of material misstatement. An audit includes examining, on a test basis, evidence supporting the amounts and disclosures in the financial statements. An audit also includes assessing the accounting principles used and significant estimates made by management, as well as evaluating the overall financial statement presentation. We believe that our audits provide a reasonable basis for our opinion.
In our opinion, the financial statements referred to above present fairly, in all material respects, the consolidated financial position of Triumph Group, Inc. at March 31, 2017 and 2016, and the consolidated results of its operations and its cash flows for each of the three years in the period ended March 31, 2017, in conformity with U.S. generally accepted accounting principles. Also, in our opinion, the related financial statement schedule, when considered in relation to the basic financial statements taken as a whole, presents fairly in all material respects the information set forth therein.
We also have audited, in accordance with the standards of the Public Company Accounting Oversight Board (United States), Triumph Group, Inc.'s internal control over financial reporting as of March 31, 2017, based on criteria established in Internal Control—Integrated Framework issued by the Committee of Sponsoring Organizations of the Treadway Commission (2013 framework) and our report dated May 24, 2017, expressed an unqualified opinion thereon.
/s/ Ernst & Young LLP | |
Philadelphia, Pennsylvania
May 24, 2017
53
TRIUMPH GROUP, INC.
CONSOLIDATED BALANCE SHEETS
(Dollars in thousands, except per share data)
March 31, | |||||||
2017 | 2016 | ||||||
ASSETS | |||||||
Current assets: | |||||||
Cash and cash equivalents | $ | 69,633 | $ | 20,984 | |||
Trade and other receivables, less allowance for doubtful accounts of $4,559 and $6,492 | 311,792 | 444,208 | |||||
Inventories, net of unliquidated progress payments of $222,485 and $123,155 | 1,340,175 | 1,236,190 | |||||
Prepaid expenses and other | 30,064 | 41,259 | |||||
Assets held for sale | 21,255 | — | |||||
Total current assets | 1,772,919 | 1,742,641 | |||||
Property and equipment, net | 805,030 | 889,734 | |||||
Goodwill | 1,142,605 | 1,444,254 | |||||
Intangible assets, net | 592,364 | 649,612 | |||||
Other, net | 101,682 | 108,852 | |||||
Total assets | $ | 4,414,600 | $ | 4,835,093 | |||
LIABILITIES AND STOCKHOLDERS' EQUITY | |||||||
Current liabilities: | |||||||
Current portion of long-term debt | $ | 160,630 | $ | 42,441 | |||
Accounts payable | 481,243 | 410,225 | |||||
Accrued expenses | 674,379 | 683,208 | |||||
Liabilities related to assets held for sale | 18,008 | — | |||||
Total current liabilities | 1,334,260 | 1,135,874 | |||||
Long-term debt, less current portion | 1,035,670 | 1,374,879 | |||||
Accrued pension and other postretirement benefits, noncurrent | 592,134 | 664,664 | |||||
Deferred income taxes, noncurrent | 68,107 | 62,453 | |||||
Other noncurrent liabilities | 537,956 | 662,279 | |||||
Stockholders' equity: | |||||||
Common stock, $.001 par value, 100,000,000 shares authorized, 52,460,920 and 52,460,920 shares issued; 49,573,029 and 49,328,999 shares outstanding | 51 | 51 | |||||
Capital in excess of par value | 846,807 | 851,102 | |||||
Treasury stock, at cost, 2,887,891 and 3,131,921 shares | (183,696 | ) | (199,415 | ) | |||
Accumulated other comprehensive loss | (396,178 | ) | (347,162 | ) | |||
Retained earnings | 579,489 | 630,368 | |||||
Total stockholders' equity | 846,473 | 934,944 | |||||
Total liabilities and stockholders' equity | $ | 4,414,600 | $ | 4,835,093 | |||
See notes to consolidated financial statements.
54
TRIUMPH GROUP, INC.
CONSOLIDATED STATEMENTS OF OPERATIONS
(In thousands, except per share data)
Year ended March 31, | |||||||||||
2017 | 2016 | 2015 | |||||||||
Net sales | $ | 3,532,799 | $ | 3,886,072 | $ | 3,888,722 | |||||
Operating costs and expenses: | |||||||||||
Cost of sales (exclusive of depreciation shown separately below) | 2,689,818 | 3,597,299 | 3,141,453 | ||||||||
Selling, general and administrative | 281,547 | 287,349 | 285,773 | ||||||||
Depreciation and amortization | 176,946 | 177,755 | 158,323 | ||||||||
Impairment of intangible assets | 266,298 | 874,361 | — | ||||||||
Restructuring | 42,177 | 36,182 | 3,193 | ||||||||
Loss on divestitures | 19,124 | — | — | ||||||||
Curtailments, settlements and early retirement incentives | — | (1,244 | ) | — | |||||||
Legal settlement charge (gain), net | — | 5,476 | (134,693 | ) | |||||||
3,475,910 | 4,977,178 | 3,454,049 | |||||||||
Operating income (loss) | 56,889 | (1,091,106 | ) | 434,673 | |||||||
Interest expense and other | 80,501 | 68,041 | 85,379 | ||||||||
(Loss) income from continuing operations before income taxes | (23,612 | ) | (1,159,147 | ) | 349,294 | ||||||
Income tax expense (benefit) | 19,340 | (111,187 | ) | 110,597 | |||||||
Net (loss) income | $ | (42,952 | ) | $ | (1,047,960 | ) | $ | 238,697 | |||
Earnings per share—basic: | |||||||||||
Net (loss) income | $ | (0.87 | ) | $ | (21.29 | ) | $ | 4.70 | |||
Weighted-average common shares outstanding—basic | 49,303 | 49,218 | 50,796 | ||||||||
Earnings per share—diluted: | |||||||||||
Net (loss) income | $ | (0.87 | ) | $ | (21.29 | ) | $ | 4.68 | |||
Weighted-average common shares outstanding—diluted | 49,303 | 49,218 | 51,005 | ||||||||
See notes to consolidated financial statements.
55
TRIUMPH GROUP, INC.
CONSOLIDATED STATEMENTS OF COMPREHENSIVE (LOSS) INCOME
(Dollars in thousands)
Year ended March 31, | |||||||||||
2017 | 2016 | 2015 | |||||||||
Net (loss) income | $ | (42,952 | ) | $ | (1,047,960 | ) | $ | 238,697 | |||
Other comprehensive (loss) income: | |||||||||||
Foreign currency translation adjustment | (28,396 | ) | (12,065 | ) | (46,949 | ) | |||||
Defined benefit pension plans and other postretirement benefits: | |||||||||||
Amounts arising during the period - gains (losses), net of tax (expense) benefit: | |||||||||||
Prior service credit, net of taxes $0, ($14,725) and $19, respectively | (121 | ) | 27,392 | (31 | ) | ||||||
Actuarial loss, net of taxes $394, $86,261 and $71,060, respectively | (15,977 | ) | (154,659 | ) | (122,636 | ) | |||||
Reclassification from net income - losses (gains), net of tax expense (benefit): | |||||||||||
Amortization of net loss, net of taxes of ($40), ($1,263) and $0, respectively | 5,651 | 2,119 | — | ||||||||
Recognized prior service credits, net of taxes of $0, $5,937 and $3,864, respectively | (15,246 | ) | (10,876 | ) | (6,133 | ) | |||||
Total defined benefit pension plans and other postretirement benefits, net of taxes | (25,693 | ) | (136,024 | ) | (128,800 | ) | |||||
Cash flow hedges: | |||||||||||
Unrealized gain (loss) arising during period, net of tax benefit (expense) of $0, $384 and $2,463, respectively | 6,582 | (527 | ) | (4,098 | ) | ||||||
Reclassification of loss included in net earnings, net of tax expense of $0, ($173) and $42, respectively | (1,509 | ) | 364 | (155 | ) | ||||||
Net unrealized gain (loss) on cash flow hedges, net of tax | 5,073 | (163 | ) | (4,253 | ) | ||||||
Total other comprehensive loss | (49,016 | ) | (148,252 | ) | (180,002 | ) | |||||
Total comprehensive (loss) income | $ | (91,968 | ) | $ | (1,196,212 | ) | $ | 58,695 | |||
See notes to consolidated financial statements.
56
TRIUMPH GROUP, INC.
CONSOLIDATED STATEMENTS OF STOCKHOLDERS' EQUITY
(Dollars in thousands)
Outstanding Shares | Common Stock All Classes | Capital in Excess of Par Value | Treasury Stock | Accumulated Other Comprehensive (Loss) Income | Retained Earnings | Total | ||||||||||||||||||||
Balance at March 31, 2014 | 52,159,020 | $ | 52 | $ | 866,281 | $ | (19,134 | ) | $ | (18,908 | ) | $ | 1,455,620 | $ | 2,283,911 | |||||||||||
Net income | — | — | — | — | — | 238,697 | 238,697 | |||||||||||||||||||
Foreign currency translation adjustment | — | — | — | — | (46,949 | ) | — | (46,949 | ) | |||||||||||||||||
Pension liability adjustment, net of income taxes of ($74,763) | — | — | — | — | (128,800 | ) | — | (128,800 | ) | |||||||||||||||||
Change in fair value of interest rate swap, net of income taxes, $2,014 | — | — | — | — | (3,156 | ) | — | (3,156 | ) | |||||||||||||||||
Change in fair value of foreign currency hedges, net of income taxes of $490 | — | — | — | — | (1,097 | ) | — | (1,097 | ) | |||||||||||||||||
Settlement of convertible notes | — | (1 | ) | (19,386 | ) | — | — | — | (19,387 | ) | ||||||||||||||||
Deferred tax impact of convertible debt redemption | — | — | 2,725 | — | — | — | 2,725 | |||||||||||||||||||
Purchase of 2,923,011 shares of common stock | (2,923,011 | ) | — | — | (184,380 | ) | — | — | (184,380 | ) | ||||||||||||||||
Exercise of stock options | 45,782 | — | 720 | — | — | — | 720 | |||||||||||||||||||
Cash dividends ($0.16 per share) | — | — | — | — | — | (8,100 | ) | (8,100 | ) | |||||||||||||||||
Share-based compensation | 1,600 | — | 1,272 | — | — | — | 1,272 | |||||||||||||||||||
Repurchase of restricted shares for minimum tax obligation | (10,338 | ) | — | (673 | ) | — | — | — | (673 | ) | ||||||||||||||||
Excess tax benefit from exercise of stock options | — | — | 1,001 | — | — | — | 1,001 | |||||||||||||||||||
Balance, March 31, 2015 | 49,273,053 | 51 | 851,940 | (203,514 | ) | (198,910 | ) | 1,686,217 | 2,135,784 | |||||||||||||||||
Net loss | — | — | — | — | — | (1,047,960 | ) | (1,047,960 | ) | |||||||||||||||||
Foreign currency translation adjustment | — | — | — | — | (12,065 | ) | — | (12,065 | ) | |||||||||||||||||
Pension liability adjustment, net of income taxes of $76,210 | — | — | — | — | (136,024 | ) | — | (136,024 | ) | |||||||||||||||||
Change in fair value of interest rate swap, net of taxes, $2,014 | — | — | — | — | (1,146 | ) | — | (1,146 | ) | |||||||||||||||||
Change in fair value of derivatives, net of income taxes of $636 | — | — | — | — | 983 | — | 983 | |||||||||||||||||||
Cash dividends ($0.16 per share) | — | — | — | — | — | (7,889 | ) | (7,889 | ) | |||||||||||||||||
Share-based compensation | 36,598 | — | (590 | ) | 3,247 | — | — | 2,657 | ||||||||||||||||||
Repurchase of restricted shares for minimum tax obligation | (1,528 | ) | — | (96 | ) | — | — | — | (96 | ) | ||||||||||||||||
Employee stock purchase plan | 20,876 | — | (152 | ) | 852 | — | — | 700 | ||||||||||||||||||
Balance, March 31, 2016 | 49,328,999 | 51 | 851,102 | (199,415 | ) | (347,162 | ) | 630,368 | 934,944 | |||||||||||||||||
Net loss | — | — | — | — | — | (42,952 | ) | (42,952 | ) | |||||||||||||||||
Foreign currency translation adjustment | — | — | — | — | (28,396 | ) | — | (28,396 | ) | |||||||||||||||||
Pension liability adjustment, net of income taxes of $434 | — | — | — | — | (25,693 | ) | — | (25,693 | ) | |||||||||||||||||
Change in fair value of derivatives | — | — | — | — | 4,834 | — | 4,834 | |||||||||||||||||||
Change in fair value of foreign currency hedges | — | — | — | — | 239 | — | 239 | |||||||||||||||||||
Cash dividends ($0.16 per share) | — | — | — | — | — | (7,927 | ) | (7,927 | ) | |||||||||||||||||
Share-based compensation | 191,127 | — | (4,279 | ) | 12,201 | — | — | 7,922 | ||||||||||||||||||
Repurchase of restricted shares for minimum tax obligation | (5,926 | ) | — | 42 | (224 | ) | — | — | (182 | ) | ||||||||||||||||
Excess tax benefit from exercise of stock options | — | — | 2,007 | — | — | — | 2,007 | |||||||||||||||||||
Employee stock purchase plan | 58,829 | — | (2,065 | ) | 3,742 | — | — | 1,677 | ||||||||||||||||||
Balance, March 31, 2017 | 49,573,029 | $ | 51 | $ | 846,807 | $ | (183,696 | ) | $ | (396,178 | ) | $ | 579,489 | $ | 846,473 | |||||||||||
See notes to consolidated financial statements.
57
TRIUMPH GROUP, INC.
CONSOLIDATED STATEMENTS OF CASH FLOWS
(Dollars in thousands)
Year ended March 31, | |||||||||||
2017 | 2016 | 2015 | |||||||||
Operating Activities | |||||||||||
Net (loss) income | $ | (42,952 | ) | $ | (1,047,960 | ) | $ | 238,697 | |||
Adjustments to reconcile net (loss) income to net cash provided by operating activities: | |||||||||||
Depreciation and amortization | 176,946 | 177,755 | 158,323 | ||||||||
Impairment of intangible assets | 266,298 | 874,361 | — | ||||||||
Amortization of acquired contract liability | (121,004 | ) | (132,363 | ) | (75,733 | ) | |||||
Loss on divestiture and assets held for sale | 19,124 | — | — | ||||||||
Curtailments, settlements and early retirement incentives | — | (1,244 | ) | — | |||||||
Accretion of debt discount | — | — | 1,577 | ||||||||
Other amortization included in interest expense | 5,553 | 3,904 | 8,135 | ||||||||
Provision for doubtful accounts receivable | 202 | 1,996 | 172 | ||||||||
Provision (benefit) for deferred income taxes | 9,480 | (118,302 | ) | 105,277 | |||||||
Employee stock compensation | 7,922 | 2,657 | 1,272 | ||||||||
Changes in other current assets and liabilities, excluding the effects of acquisitions: | |||||||||||
Accounts receivable | 112,196 | 73,083 | 69,500 | ||||||||
Inventories | (272,653 | ) | 293,517 | 42,383 | |||||||
Prepaid expenses and other current assets | 11,756 | (6,958 | ) | 1,589 | |||||||
Accounts payable, accrued expenses and income taxes payable | 211,560 | 53,914 | 95,167 | ||||||||
Accrued pension and other postretirement benefits | (100,012 | ) | (87,559 | ) | (180,569 | ) | |||||
Other | (2,894 | ) | (2,938 | ) | 1,542 | ||||||
Net cash provided by operating activities | 281,522 | 83,863 | 467,332 | ||||||||
Investing Activities | |||||||||||
Capital expenditures | (51,832 | ) | (80,047 | ) | (110,004 | ) | |||||
Reimbursements of capital expenditures from insurance and other | — | — | 653 | ||||||||
Proceeds from sale of assets | 86,187 | 6,069 | 3,167 | ||||||||
Acquisitions, net of cash acquired | 9 | (54,051 | ) | 38,281 | |||||||
Net cash provided by (used in) investing activities | 34,364 | (128,029 | ) | (67,903 | ) | ||||||
Financing Activities | |||||||||||
Net decrease in revolving credit facility | (110,000 | ) | (8,256 | ) | (46,150 | ) | |||||
Proceeds from issuance of long-term debt | 24,400 | 134,797 | 508,960 | ||||||||
Retirement of debt and capital lease obligations | (144,144 | ) | (80,917 | ) | (655,860 | ) | |||||
Payment of deferred financing costs | (14,034 | ) | (185 | ) | (6,487 | ) | |||||
Purchase of common stock | — | — | (184,380 | ) | |||||||
Dividends paid | (7,927 | ) | (7,889 | ) | (8,100 | ) | |||||
Net repayment of government grant | (14,570 | ) | (5,000 | ) | (3,198 | ) | |||||
Repurchase of restricted shares for minimum tax obligations | (182 | ) | (96 | ) | (673 | ) | |||||
Proceeds from exercise of stock options, including excess tax benefit of $1,001 in 2015 | — | — | 720 | ||||||||
Net cash (used in) provided by financing activities | (266,457 | ) | 32,454 | (395,168 | ) | ||||||
Effect of exchange rate changes on cash | (780 | ) | 79 | (642 | ) | ||||||
Net change in cash and cash equivalents | 48,649 | (11,633 | ) | 3,619 | |||||||
Cash and cash equivalents at beginning of year | 20,984 | 32,617 | 28,998 | ||||||||
Cash and cash equivalents at end of year | $ | 69,633 | $ | 20,984 | $ | 32,617 | |||||
See notes to consolidated financial statements.
58
TRIUMPH GROUP, INC.
NOTES TO CONSOLIDATED FINANCIAL STATEMENTS
(Dollars in thousands, except per share data)
1. | BACKGROUND AND BASIS OF PRESENTATION |
Triumph Group, Inc. ("Triumph") is a Delaware corporation which, through its operating subsidiaries, designs, engineers, manufactures and sells products for the global aerospace original equipment manufacturers ("OEMs") of aircraft and aircraft components and repairs and overhauls aircraft components and accessories for commercial airline, air cargo carrier and military customers on a worldwide basis. Triumph and its subsidiaries (collectively, the "Company") are organized based on the products and services that it provides. Under this organizational structure, the Company has four reportable segments: Integrated Systems, Aerospace Structures, Precision Components and Product Support.
Integrated Systems consists of the Company’s operations that provides integrated solutions including design, development and support of proprietary components, subsystems and systems, as well as production of complex assemblies using external designs. Capabilities include hydraulic, mechanical and electro-mechanical actuation, power and control; a complete suite of aerospace gearbox solutions including engine accessory gearboxes and helicopter transmissions; active and passive heat exchange technology; fuel pumps, fuel metering units and Full Authority Digital Electronic Control fuel systems; hydro-mechanical and electromechanical primary and secondary flight controls; and a broad spectrum of surface treatment options.
Aerospace Structures consists of the Company’s operations that supply commercial, business, regional and military manufacturers with large metallic and composite structures. Products include wings, wing boxes, fuselage panels, horizontal and vertical tails and sub-assemblies such as floor grids. Inclusive of most of the former Vought Aircraft Division, Aerospace Structures also has the capability to engineer detailed structural designs in metal and composites.
Precision Components consists of the Company’s operations that produce close-tolerance parts primarily to customer designs and model-based definition, including a wide range of aluminum, hard metal and composite structure capabilities. Capabilities include complex machining, gear manufacturing, sheet metal fabrication, forming, advanced composite and interior structures, joining processes such as welding, autoclave bonding and conventional mechanical fasteners and a variety of special processes including: super plastic titanium forming, aluminum and titanium chemical milling and surface treatments.
Product Support consists of the Company’s operations that provide full life cycle solutions for commercial, regional and military aircraft. The Company’s extensive product and service offerings include full post-delivery value chain services that simplify the MRO supply chain. Through its line maintenance, component MRO and postproduction supply chain activities, Product Support is positioned to provide integrated planeside repair solutions globally. Capabilities include fuel tank repair, metallic and composite aircraft structures, nacelles, thrust reversers, interiors, auxiliary power units and a wide variety of pneumatic, hydraulic, fuel and mechanical accessories.
Repair services generally involve the replacement of parts and/or the remanufacture of parts, which is similar to the original manufacture of the part. The processes that the Company performs related to repair and overhaul services are essentially the repair of wear parts or replacement of parts that are beyond economic repair. The repair service generally involves remanufacturing a complete part or a component of a part.
The accompanying consolidated financial statements include the accounts of Triumph and its wholly-owned subsidiaries. Intercompany accounts and transactions have been eliminated from the consolidated financial statements.
The preparation of financial statements in conformity with accounting principles generally accepted in the United States requires management to make estimates and assumptions that affect the amounts reported in the financial statements and accompanying notes. Actual results could differ from those estimates.
59
TRIUMPH GROUP, INC.
NOTES TO CONSOLIDATED FINANCIAL STATEMENTS (Continued)
(Dollars in thousands, except per share data)
2. | SUMMARY OF SIGNIFICANT ACCOUNTING POLICIES |
Cash Equivalents
Cash equivalents consist of highly liquid investments with a maturity of three months or less at the time of purchase. Fair value of cash equivalents approximates carrying value.
Trade and Other Receivables, net
Trade and other receivables are recorded net of an allowance for doubtful accounts. Trade and other receivables include amounts billed and currently due from customers, amounts currently due but unbilled, certain estimated contract changes and amounts retained by the customer pending contract completion. Unbilled amounts are generally billed and collected within one year. The Company performs ongoing credit evaluations of its customers and generally does not require collateral. The Company records the allowance for doubtful accounts based on prior experience and for specific collectibility matters when they arise. The Company writes off balances against the reserve when collectibility is deemed remote. The Company's trade and other receivables are exposed to credit risk; however, the risk is limited due to the diversity of the customer base.
Trade and other receivables, net comprised of the following:
March 31, | |||||||
2017 | 2016 | ||||||
Billed | $ | 268,711 | $ | 407,275 | |||
Unbilled | 32,089 | 25,742 | |||||
Total trade receivables | 300,800 | 433,017 | |||||
Other receivables | 15,551 | 17,683 | |||||
Total trade and other receivables | 316,351 | 450,700 | |||||
Less: Allowance for doubtful accounts | (4,559 | ) | (6,492 | ) | |||
Total trade and other receivables, net | $ | 311,792 | $ | 444,208 | |||
Inventories
The Company records inventories at the lower of cost (average-cost or specific-identification methods) or market. Costs on long-term contracts and programs in progress represent recoverable costs incurred for production or contract-specific facilities and equipment, allocable operating overhead and advances to suppliers. Pursuant to contract provisions, agencies of the U.S. Government and certain other customers have title to, or a security interest in, inventories related to such contracts as a result of advances, performance-based payments, and progress payments. The Company reflects those advances and payments as an offset against the related inventory balances. The Company expenses general and administrative costs related to products and services provided essentially under commercial terms and conditions as incurred. The Company determines the costs of inventories by the first-in, first-out or average cost methods.
Work-in-process inventory includes capitalized pre-production costs. Company policy allows for the capitalization of pre-production costs after it establishes a contractual arrangement with a customer that explicitly states that the cost of recovery of pre-production costs is allowed.
Capitalized pre-production costs include nonrecurring engineering, planning and design, including applicable overhead, incurred before production is manufactured on a regular basis. Significant customer-directed work changes can also cause pre-production costs to be incurred (see Note 5 for further discussion).
Advance Payments and Progress Payments
Advance payments and progress payments received on contracts-in-process are first offset against related contract costs that are included in inventory, with any excess amount reflected in current liabilities under the Accrued expenses caption on the accompanying Consolidated Balance Sheets.
60
TRIUMPH GROUP, INC.
NOTES TO CONSOLIDATED FINANCIAL STATEMENTS (Continued)
(Dollars in thousands, except per share data)
Property and Equipment
Property and equipment, which includes equipment under capital lease and leasehold improvements, are recorded at cost and depreciated over the estimated useful lives of the related assets, or the lease term if shorter in the case of leasehold improvements, by the straight-line method. Buildings and improvements are depreciated over a period of 15 to 39.5 years, and machinery and equipment are depreciated over a period of 7 to 15 years (except for furniture, fixtures and computer equipment which are depreciated over a period of 3 to 10 years).
Goodwill and Intangible Assets
The Company accounts for purchased goodwill and intangible assets in accordance with Accounting Standards Codification ("ASC") 350, Intangibles—Goodwill and Other. Under ASC 350, purchased goodwill and intangible assets with indefinite lives are not amortized; rather, they are tested for impairment on at least an annual basis. Intangible assets with finite lives are amortized over their useful lives. Upon acquisition, critical estimates are made in valuing acquired intangible assets, which include but are not limited to: future expected cash flows from customer contracts, customer lists, and estimating cash flows from projects when completed; tradename and market position, as well as assumptions about the period of time that customer relationships will continue; and discount rates. Management's estimates of fair value are based upon assumptions believed to be reasonable, but which are inherently uncertain and unpredictable and, as a result, actual results may differ from the assumptions used in determining the fair values.
The Company's operating segments of Integrated Systems, Aerospace Structures, Precision Components and Product Support are also its reporting units. The Chief Executive Officer is the Company's Chief Operating Decision Maker ("CODM"). The Company's CODM evaluates performance and allocates resources based upon review of segment information. Each of the operating segments is comprised of a number of operating units which are considered to be components. The components, for which discrete financial information exists, are aggregated for purposes of goodwill impairment testing. The Company's acquisition strategy is to acquire companies that complement and enhance the capabilities of the operating segments of the Company. Each acquisition is assigned to one of the Company's reporting units. The goodwill that results from each acquisition is also assigned to the reporting unit to which the acquisition is allocated, because it is that reporting unit which is intended to benefit from the synergies of the acquisition.
The Company assesses whether goodwill impairment exists using both the qualitative and quantitative assessments. The qualitative assessment involves determining whether events or circumstances exist that indicate it is more likely than not that the fair value of a reporting unit is less than its carrying amount, including goodwill. If based on this qualitative assessment the Company determines it is not more likely than not that the fair value of a reporting unit is less than its carrying amount or if the Company elects not to perform a qualitative assessment, a quantitative assessment is performed as required by ASC 350 to determine whether a goodwill impairment exists at the reporting unit.
The quantitative test is used to compare the carrying amount of the reporting unit's assets to the fair value of the reporting unit. If the fair value exceeds the carrying value, no further evaluation is required and no impairment loss is recognized. If the carrying amount exceeds the fair value, then an impairment loss occurs. The impairment is measured by using the amount by which the carrying value exceeds the fair value not to exceed the amount of recorded goodwill. The determination of the fair value of our reporting units is based, among other things, on estimates of future operating performance of the reporting unit being valued. The Company is required to complete an impairment test for goodwill and record any resulting impairment losses at least annually. Changes in market conditions, among other factors, may have an impact on these estimates and require interim impairment assessments.
When performing the quantitative impairment test, the Company's methodology includes the use of an income approach which discounts future net cash flows to their present value at a rate that reflects the Company's cost of capital, otherwise known as the discounted cash flow method ("DCF"). These estimated fair values are based on estimates of future cash flows of the businesses. Factors affecting these future cash flows include the continued market acceptance of the products and services offered by the businesses, the development of new products and services by the businesses and the underlying cost of development, the future cost structure of the businesses, and future technological changes. The Company also incorporates market multiples for comparable companies in determining the fair value of our reporting units. Any such impairment would be recognized in full in the reporting period in which it has been identified.
In the fourth quarter of the fiscal year ended March 31, 2017, consistent with the Company's policy described here, the Company performed its annual assessment of the fair value of goodwill. The Company concluded that the goodwill related to the Aerospace Structures reporting unit was impaired as of the annual testing date. The Company concluded that the goodwill had a fair value that was lower then its carrying value by an amount that exceeded the remaining goodwill for the reporting unit.
61
TRIUMPH GROUP, INC.
NOTES TO CONSOLIDATED FINANCIAL STATEMENTS (Continued)
(Dollars in thousands, except per share data)
Accordingly, the Company recorded a non-cash impairment charge during the fourth quarter of the fiscal year ending March 31, 2017 of $266,298, which is presented on the accompanying Consolidated Statements of Operations as "Impairment of intangible assets”. The decline in fair value is the result of declining revenues from production rate reductions on sun-setting programs and the slower than previously projected ramp in our development programs and the timing of associated earnings and cash flows (See Note 2 for definition of fair value levels).
The Company’s assessment of the Precision Components reporting unit concluded that the goodwill was not impaired as of the annual impairment assessment date. However, the excess of the fair value over the carrying value was less than 5%. The decline in fair value is the result of declining revenues from production rate reductions on sun-setting programs and the start-up costs related to new programs and the timing of associated earnings and cash flows. Going forward, the Company will continue to monitor the performance of this reporting unit in relation to the key assumptions in our analysis.
In the event that market multiples for stock price to EBITDA in the aerospace and defense markets decrease, or the expected EBITDA and cash flows for the Company's reporting units decreases, an additional goodwill impairment charge may be required, which would adversely affect the Company's operating results and financial condition. If management determines that impairment exists, the impairment will be recognized in the period in which it is identified.
Prior to adoption of ASU 2017-04, the Company used the quantitative assessment to perform the two-step approach required by ASC 350 to determine whether a goodwill impairment exists at the reporting unit.
The first step of the quantitative test is to compare the carrying amount of the reporting unit's assets to the fair value of the reporting unit. If the fair value exceeds the carrying value, no further work is required and no impairment loss is recognized. If the carrying amount exceeds the fair value, then the second step is required to be completed, which involves allocating the fair value of the reporting unit to each asset and liability, with the excess being applied to goodwill. An impairment loss occurs if the amount of the recorded goodwill exceeds the implied goodwill. The determination of the fair value of our reporting units is based, among other things, on estimates of future operating performance of the reporting unit being valued. We are required to complete an impairment test for goodwill and record any resulting impairment losses at least annually. Changes in market conditions, among other factors, may have an impact on these estimates and require interim impairment assessments.
When performing the two-step quantitative impairment test, the Company's methodology includes the use of an income approach which discounts future net cash flows to their present value at a rate that reflects the Company's cost of capital, otherwise known as the discounted cash flow method ("DCF"). These estimated fair values are based on estimates of future cash flows of the businesses. Factors affecting these future cash flows include the continued market acceptance of the products and services offered by the businesses, the development of new products and services by the businesses and the underlying cost of development, the future cost structure of the businesses, and future technological changes. The Company also incorporates market multiples for comparable companies in determining the fair value of our reporting units. Any such impairment would be recognized in full in the reporting period in which it has been identified.
In the fourth quarter of fiscal 2016, the Company performed the quantitative assessment for all three of the Company's former reporting units, which indicated that the fair value of goodwill for the former Aerostructures reporting unit did not exceed its carrying amount. After evaluating whether other assets within the reporting unit were impaired in accordance with ASC 350, we concluded on the implied goodwill under Step 2 resulting in a $597,603 impairment of goodwill to the former Aerostructures reporting unit. The assessment for the Company's reporting units formerly known as Aerospace Systems and Aftermarket Services indicated that the fair value of their respective goodwill exceeded the carrying amount. We incurred no impairment of goodwill as a result of our annual goodwill impairment tests in fiscal 2015 (see Note 7 for further discussion).
As of March 31, 2016, the Company had a $163,000 intangible asset associated with the tradenames acquired in the acquisitions of Vought Aircraft Industries, Inc. ("Vought") and Embee, Inc. ("Embee"). The Company assesses whether indefinite-lived intangible assets impairment exists using both the qualitative and quantitative assessments. The qualitative assessment involves determining whether events or circumstances exist that indicate it is more likely than not that the fair value of an indefinite-lived intangible asset is less than its carrying amount. If based on this qualitative assessment, the Company determines it is not more likely than not that the fair value of an indefinite-lived intangible asset is less than its carrying amount or if the Company elects not to perform a qualitative assessment, a quantitative assessment is performed to determine whether an indefinite-lived intangible asset impairment exists. We test the indefinite-lived intangible assets for impairment by comparing the carrying value to the fair value based on current revenue projections of the related operations, under the relief from royalty method. Any excess of the carrying value over the amount of fair value is recognized as an impairment.
62
TRIUMPH GROUP, INC.
NOTES TO CONSOLIDATED FINANCIAL STATEMENTS (Continued)
(Dollars in thousands, except per share data)
During the third quarter of the fiscal year ended March 31, 2016, the Company performed an interim assessment of fair value on our indefinite-lived intangible assets due to indicators of impairment related to the continued decline in our stock price during the fiscal third quarter. Based on the Company's evaluation, the Company concluded that the Vought tradename had a fair value of $195,800 (Level 3) compared to a carrying value of $425,000. Accordingly, the Company recorded a non-cash impairment charge during the fiscal year ended March 31, 2016, of $229,200, which is presented on the accompanying Consolidated Statements of Operations as "Impairment of intangible assets". The decline in fair value compared to the carrying value of the Vought tradename is the result of declining revenues from production rate reductions and the slower than previously projected ramp in Bombardier Global 7000/8000 and the timing of associated earnings.
In the fourth quarter of fiscal 2016, the Company performed its annual impairment test for each of the Company's indefinite-lived intangible assets, which indicated that the Vought and Embee tradenames had a fair value of $163,000 (Level 3) compared to a carrying value of $209,200. The decline in fair value of the tradenames is the result of the increase in discount rate during the fourth quarter of fiscal 2016, which required the Company to assess whether events and/or circumstances have changed regarding the indefinite-life conclusion. As a result the Company incurred a non-cash impairment charge of $46,200 presented on the accompanying Consolidated Statements of Operations as "Impairment of intangible assets" to the Vought and Embee tradenames. The Company incurred no impairment of indefinite-lived assets as a result of our annual indefinite-lived assets impairment tests in fiscal 2015.
During the fiscal year ended March 31, 2017, as part of the Company's annual assessment, the Company determined that the remaining estimated useful life for the Vought tradename should be reduced from a useful life of 20 years to a useful life of 10 years, as it better represents the financial performance relative to the expected performance.
Finite-lived intangible assets are amortized over their useful lives ranging from 3 to 32 years. The Company continually evaluates whether events or circumstances have occurred that would indicate that the remaining estimated useful lives of long-lived assets, including intangible assets, may warrant revision or that the remaining balance may not be recoverable. Intangible assets are evaluated for indicators of impairment. When factors indicate that long-lived assets, including intangible assets, should be evaluated for possible impairment, an estimate of the related undiscounted cash flows over the remaining life of the long-lived assets, including intangible assets, is used to measure recoverability based on the primary asset of the asset group. Some of the more important factors management considers include the Company's financial performance relative to expected and historical performance, significant changes in the way the Company manages its operations, negative events that have occurred, and negative industry and economic trends. If the estimated fair value is less than the carrying amount, measurement of the impairment will be based on the difference between the carrying value and fair value of the asset group, generally determined based on the present value of expected future cash flows associated with the use of the asset.
Deferred Financing Costs
Financing costs are deferred and amortized to Interest expense and other on the accompanying Consolidated Statements of Operations over the related financing period using the effective interest method or the straight-line method when it does not differ materially from the effective interest method. The Company records deferred financing costs as a direct deduction from the carrying value of that debt liability; however, the policy does exclude deferred financing costs relating to revolving debt instruments. These deferred financing costs are recorded in Other, net on the accompanying Consolidated Balance Sheets as of March 31, 2017 and 2016. Total deferred financing costs, net of accumulated amortization of $22,692 and $14,131, respectively, are recorded as of March 31, 2017 and 2016. Make-whole payments in connection with early debt retirements are classified as cash flows used in financing activities.
Acquired Contract Liabilities, net
In connection with several of our acquisitions, we assumed existing long-term contracts. Based on our review of these contracts, we concluded that the terms of certain contracts to be either more or less favorable than could be realized in market transactions as of the date of the acquisition. As a result, we recognized acquired contract liabilities, net of acquired contract assets as of the acquisition date of each respective acquisition, based on the present value of the difference between the contractual cash flows of the executory contracts and the estimated cash flows had the contracts been executed at the acquisition date. The liabilities principally relate to long-term contracts that were initially executed at several years prior to the respective acquisition (see Note 3 for further discussion).
The Company measured these net liabilities under the measurement provisions of ASC 820, Fair Value Measurement, which is based on the price to transfer the obligation to a market participant at the measurement date, assuming that the net liabilities will remain outstanding in the marketplace. Fair value estimates are based on a complex series of judgments about future events and uncertainties and rely heavily on estimates and assumptions. The judgments used to determine the estimated fair value assigned to each long-term contracts can materially impact our results of operations.
63
TRIUMPH GROUP, INC.
NOTES TO CONSOLIDATED FINANCIAL STATEMENTS (Continued)
(Dollars in thousands, except per share data)
Included in the net sales of the Integrated Systems, Aerospace Structures and Precision Components is the non-cash amortization of acquired contract liabilities recognized as fair value adjustments through purchase accounting from various acquisitions. The Company recognized net amortization of contract liabilities of $121,004, $132,363 and $75,733 in the fiscal years ended March 31, 2017, 2016 and 2015, respectively, and such amounts have been included in revenues in results of operations. The balance of the liability as of March 31, 2017 is $394,883 and, based on the expected delivery schedule of the underlying contracts, the Company estimates annual amortization of the liability as follows: 2018—$112,063; 2019—$77,004; 2020—$55,401; 2021—$51,101; and 2022—$51,101.
Revenue Recognition
Revenues are generally recognized in accordance with the contract terms when products are shipped, delivery has occurred or services have been rendered, pricing is fixed or determinable, and collection is reasonably assured. The Company's policy with respect to sales returns and allowances generally provides that the customer may not return products or be given allowances, except at the Company's option. Accruals for sales returns, other allowances and estimated warranty costs are provided at the time of shipment based upon past experience.
A significant portion of the Company's contracts are within the scope of ASC 605-35, Revenue Recognition —Construction-Type and Production-Type Contracts, and revenue and costs on contracts are recognized using the percentage-of-completion method of accounting. Accounting for the revenue and profit on a contract requires estimates of (1) the contract value or total contract revenue, (2) the total costs at completion, which is equal to the sum of the actual incurred costs to date on the contract and the estimated costs to complete the contract's scope of work and (3) the measurement of progress towards completion. Depending on the contract, the Company measures progress toward completion using either the cost-to-cost method or the units-of-delivery method, with the great majority measured under the units-of-delivery method.
• | Under the cost-to-cost method, progress toward completion is measured as the ratio of total costs incurred to estimated total costs at completion. Costs are recognized as incurred. Profit is determined based on estimated profit margin on the contract multiplied by progress toward completion. Revenue represents the sum of costs and profit on the contract for the period. |
• | Under the units-of-delivery method, revenue on a contract is recorded as the units are delivered and accepted during the period at an amount equal to the contractual selling price of those units. The costs recorded on a contract under the units-of-delivery method are equal to the total costs at completion divided by the total units to be delivered. As contracts can span multiple years, the Company often segments the contracts into production lots for the purposes of accumulating and allocating cost. Profit is recognized as the difference between revenue for the units delivered and the estimated costs for the units delivered. |
Adjustments to original estimates for a contract's revenues, estimated costs at completion and estimated total profit are often required as work progresses under a contract, as experience is gained and as more information is obtained, even though the scope of work required under the contract may not change, or if contract modifications occur. These estimates are also sensitive to the assumed rate of production. Generally, the longer it takes to complete the contract quantity, the more relative overhead that contract will absorb. The impact of revisions in cost estimates is recognized on a cumulative catch-up basis in the period in which the revisions are made. Provisions for anticipated losses on contracts are recorded in the period in which they become probable ("forward losses") and are first offset against costs that are included in inventory, with any remaining amount reflected in accrued contract liabilities in accordance with ASC 605-35. Revisions in contract estimates, if significant, can materially affect results of operations and cash flows, as well as valuation of inventory. Furthermore, certain contracts are combined or segmented for revenue recognition in accordance with ASC 605-35.
For the fiscal year ended March 31, 2017, cumulative catch-up adjustments resulting from changes in contract values and estimated costs that arose during the fiscal year increased operating (loss) income, net (loss) income and earnings per share by approximately $57,153, $52,598 and $1.07, respectively. The cumulative catch-up adjustments to operating income for the fiscal year ended March 31, 2017 included gross favorable adjustments of approximately $163,274 and gross unfavorable adjustments of approximately $106,121, which includes a reduction to the previously recognized forward losses of $131,400 on the 747-8 program.
For the fiscal year ended March 31, 2016, cumulative catch-up adjustments resulting from changes in estimates decreased operating income, net income and earnings per share by approximately $596,213, $539,023 and $10.95, respectively. The cumulative catch-up adjustments to operating income for the fiscal year ended March 31, 2016 included gross favorable adjustments of approximately $32,954 and gross unfavorable adjustments of approximately $629,167 which includes a provision for forward losses of $561,158 on the Bombardier Global 7000/8000 ("Bombardier") and 747-8 programs.
64
TRIUMPH GROUP, INC.
NOTES TO CONSOLIDATED FINANCIAL STATEMENTS (Continued)
(Dollars in thousands, except per share data)
For the fiscal year ended March 31, 2015, cumulative catch-up adjustments resulting from changes in estimates decreased operating income, net income and earnings per share by approximately $156,048, $106,639 and $2.09, respectively. The cumulative catch-up adjustments to operating income for the fiscal year ended March 31, 2015 included gross favorable adjustments of approximately $4,653 and gross unfavorable adjustments of approximately $160,701 which includes a provision for forward losses of $151,992 on the 747-8 program.
Amounts representing contract change orders or claims are only included in revenue when such change orders or claims have been settled with the customer and to the extent that units have been delivered. Additionally, some contracts may contain provisions for revenue sharing, price re-determination, requests for equitable adjustments, change orders or cost and/or performance incentives. Such amounts or incentives are included in contract value when the amounts can be reliably estimated and their realization is reasonably assured.
Although fixed-price contracts, which extend several years into the future, generally permit the Company to keep unexpected profits if costs are less than projected, the Company also bears the risk that increased or unexpected costs may reduce profit or cause the Company to sustain losses on the contract. In a fixed-price contract, the Company must fully absorb cost overruns, notwithstanding the difficulty of estimating all of the costs the Company will incur in performing these contracts and in projecting the ultimate level of revenue that may otherwise be achieved.
As disclosed during fiscal 2016, the Company recognized a provision for forward losses associated with our long-term contract on the 747-8 and Bombardier programs. There is still risk similar to what the Company has experienced on the 747-8 and Bombardier programs. Particularly, the Company's ability to manage risks related to supplier performance, execution of cost reduction strategies, hiring and retaining skilled production and management personnel, quality and manufacturing execution, program schedule delays, potential need to negotiate facility lease extensions or alternatively relocate work and many other risks, will determine the ultimate performance of these programs.
Product Support provides repair and overhaul services, certain of which services are provided under long-term power-by-the-hour contracts, comprising approximately 3% of the segment's net sales. The Company applies the proportional performance method to recognize revenue under these contracts. Revenue is recognized over the contract period as units are delivered based on the relative value in proportion to the total estimated contract consideration. In estimating the total contract consideration, management evaluates the projected utilization of its customer's fleet over the term of the contract, in connection with the related estimated repair and overhaul servicing requirements to the fleet based on such utilization. Changes in utilization of the fleet by customers, among other factors, may have an impact on these estimates and require adjustments to estimates of revenue to be realized.
Shipping and Handling Costs
The cost of shipping and handling products is included in cost of products sold.
Research and Development Expense
Research and development ("R&D") expense (which includes certain amounts subject to reimbursement from customers) was approximately $112,418, $103,031 and $108,062 for the fiscal years ended March 31, 2017, 2016 and 2015, respectively.
Retirement Benefits
Defined benefit pension plans are recognized in the consolidated financial statements on an actuarial basis. A significant element in determining the Company's pension income (expense) is the expected long-term rate of return on plan assets. This expected return is an assumption as to the average rate of earnings expected on the funds invested or to be invested to provide for the benefits included in the projected pension benefit obligation. The Company applies this assumed long-term rate of return to a calculated value of plan assets, which recognizes changes in the fair value of plan assets in a systematic manner over five years. This produces the expected return on plan assets that is included in pension income (expense). The difference between this expected return and the actual return on plan assets is deferred. The net deferral of past asset gains (losses) affects the calculated value of plan assets and, ultimately, future pension income (expense).
The Company periodically experiences events or makes changes to its benefit plans that result in curtailment or special charges. Curtailments are recognized when events occur that significantly reduce the expected years of future service of present employees or eliminates the benefits for a significant number of employees for some or all of their future service.
Curtailment losses are recognized when it is probable the curtailment will occur and the effects are reasonably estimable. Curtailment gains are recognized when the related employees are terminated or a plan amendment is adopted, whichever is applicable.
65
TRIUMPH GROUP, INC.
NOTES TO CONSOLIDATED FINANCIAL STATEMENTS (Continued)
(Dollars in thousands, except per share data)
As required under ASC 715, Compensation — Retirement Benefits, the Company remeasures plan assets and obligations during an interim period whenever a significant event occurs that results in a material change in the net periodic pension cost. The determination of significance is based on judgment and consideration of events and circumstances impacting the pension costs.
At March 31 of each year, the Company determines the fair value of its pension plan assets as well as the discount rate to be used to calculate the present value of plan liabilities. The discount rate is an estimate of the interest rate at which the pension benefits could be effectively settled. In estimating the discount rate, the Company looks to rates of return on high-quality, fixed-income investments currently available and expected to be available during the period to maturity of the pension benefits. The Company uses a portfolio of fixed-income securities, which receive at least the second-highest rating given by a recognized ratings agency.
Fair Value Measurements
Fair value is defined as the exchange price that would be received for an asset or paid to transfer a liability in the principal or most advantageous market for the asset or liability in an orderly transaction between market participants on the measurement date. When determining fair value measurements for assets and liabilities required to be recorded at fair value, the Company considers the principal or most advantageous market in which it would transact and also considers assumptions that market participants would use when pricing an asset or liability. The fair value hierarchy has three levels of inputs that may be used to measure fair value: Level 1—Unadjusted quoted prices in active markets for identical assets or liabilities; Level 2—Unadjusted quoted prices in active markets for similar assets or liabilities, or unadjusted quoted prices for identical or similar assets or liabilities in markets that are not active, or inputs other than quoted prices that are observable for the asset or liability; and Level 3—Unobservable inputs for the asset or liability. The Company has applied fair value measurements to its divestitures (see Note 4), to its goodwill and intangible impairment tests (see Note 7), to its interest rate swap (see Note 10) and to its pension and postretirement plan assets (see Note 15).
Foreign Currency Translation
The determination of the functional currency for the Company's foreign subsidiaries is made based on appropriate economic factors. The functional currency of the Company's subsidiaries Triumph Aviation Services—Asia and Triumph Structures—Thailand is the U.S. dollar since that is the currency in which that entity primarily generates and expends cash. The functional currency of the Company's remaining subsidiaries is the local currency, since that is the currency in which those entities primarily generate and expend cash. Assets and liabilities of these subsidiaries are translated at the rates of exchange at the balance sheet date. Income and expense items are translated at average monthly rates of exchange. The resultant translation adjustments are included in accumulated other comprehensive income (see Note 13). Gains and losses arising from foreign currency transactions of these subsidiaries are included in earnings.
Income Taxes
The Company accounts for income taxes using the asset and liability method. The asset and liability method requires recognition of deferred tax assets and liabilities for expected future tax consequences of temporary differences that currently exist between tax bases and financial reporting bases of the Company's assets and liabilities. A valuation allowance is provided on deferred taxes if it is determined that it is more likely than not that the asset will not be realized. The Company recognizes penalties and interest accrued related to income tax liabilities in the provision for income taxes on its Consolidated Statements of Operations.
Significant management judgment is required to determine the amount of benefit to be recognized in relation to an uncertain tax position. The Company uses a two-step process to evaluate tax positions. The first step requires an entity to determine whether it is more likely than not (greater than 50% chance) that the tax position will be sustained. The second step requires an entity to recognize in the financial statements the benefit of a tax position that meets the more-likely-than-not recognition criterion. The amounts ultimately paid upon resolution of issues raised by taxing authorities may differ materially from the amounts accrued and may materially impact the financial statements of the Company in future periods.
Recently Issued Accounting Pronouncements
In May 2014, the FASB issued ASU 2014-09, Revenue from Contracts with Customers (“ASU 2014-09”, “ASC 606”), which requires recognition of revenue to depict the transfer of goods or services to customers in an amount that reflects the consideration to which the entity expects to be entitled in exchange for those goods or services. The FASB has issued several updates to ASU 2014-09 which must be adopted concurrently with ASU 2014-09.
66
TRIUMPH GROUP, INC.
NOTES TO CONSOLIDATED FINANCIAL STATEMENTS (Continued)
(Dollars in thousands, except per share data)
Under ASC 606, revenue is recognized when control of promised goods or services transfers to a customer and is recognized in an amount that reflects the consideration which the entity expects to receive in exchange for those goods or services. The major provisions include determining enforceable rights and obligation between parties, defining performance obligations as the units of accounting under contract, accounting for variable consideration, and determining whether performance obligations are satisfied over time or at a point of time. Additionally, ASC 606 requires disclosure of the nature, amount, timing, and uncertainty of revenue and cash flows arising from contracts with customers.
ASC 606 will be effective for us beginning April 1, 2018 and early adoption as of April 1, 2017 is permitted. The guidance permits two methods of adoption: retrospectively to each prior reporting period presented (“full retrospective method”), or retrospectively with the cumulative effect of initially applying ASC 606 recognized at the date of initial application (“the modified retrospective method”). The Company is adopting ASC 606 effective April 1, 2018 and the Company expects to do so using the modified retrospective method.
During the fiscal year ended March 31, 2016, we established a cross-functional team to assess and prepare for implementation of the new standard. We are analyzing the impact of the new standard on the Company’s revenue contracts, comparing our current accounting policies and practices to the requirements of the new standard, and identifying potential differences that would result from applying the new standard to our contracts.
While further analysis of ASC 606 and a review of all material contracts is underway the adoption of ASC 606 may impact the amounts and timing of revenue recognition and the accounting treatment of deferred production costs. Under ASC 606, the units-of-delivery method is no longer viable and some performance obligations may be satisfied over time which may change the timing of recognition of revenue and associated production costs for certain contracts.
In March 2017, the Financial Accounting Standards Board ("FASB") issued ASU No. 2017-07, Improving the Presentation of Net Periodic Pension Cost and Net Periodic Postretirement Benefit Cost (“ASU 2017-07”). ASU 2017-07 amends ASC 715, Compensation — Retirement Benefits, to require employers that present a measure of operating income in their statement of income to include only the service cost component of net periodic pension cost and net periodic postretirement benefit cost in operating expenses (together with other employee compensation costs). The other components of net benefit cost, including amortization of prior service cost/credit, and settlement and curtailment effects, are to be included in nonoperating expenses. Employers that do not present a measure of operating income are required to include the service cost component in the same line item as other employee compensation costs. Employers are required to include all other components of net benefit cost in a separate line item(s). The line item(s) in which the components of net benefit cost other than the service cost are included need to be identified as such on the income statement or in the disclosures. ASU 2017-07 also stipulates that only the service cost component of net benefit cost is eligible for capitalization. ASU 2017-07 is effective for -reporting periods beginning after December 15, 2017, with early adoption permitted. The Company is currently performing its assessment of the impact of adopting the guidance; however based on its expectations for the fiscal year ended March 31, 2018, the Company believes the it will likely have a material impact due to the reclassification of pension and OPEB income from capitalized costs (Operating Income) to Other Income. Excluding the service costs, the net periodic pension benefit for the fiscal year ended March 31, 2018 is expected to be $67,000.
In January 2017, the FASB issued ASU 2017-04, Intangibles - Goodwill and Other (Topic 350), Simplifying the Test for Goodwill Impairment (“ASU 2017-04). ASU 2017-04 removes Step 2 of the goodwill impairment test, which requires a hypothetical purchase price allocation. A goodwill impairment will now be the amount by which a reporting unit’s carrying value exceeds its fair value, not to exceed the carrying amount of goodwill. ASU 2017-04 is effective for reporting periods beginning after December 15, 2019, with early adoption permitted for annual and interim goodwill impairment testing dates after January 1, 2017. The Company early adopted ASU 2017-04, which reduced the cost and complexity of the impairment testing.
In August 2016, the FASB issued ASU 2016-15, Statement of Cash Flows (Topic 230), Classification of Certain Cash Receipts and Cash Payments (“ASU 2016-15”). ASU 2016-15 provides guidance on eight specific cash flow classification issues. Current GAAP does not include specific guidance on these eight cash flow classification issues. ASU 2016-15 is effective for reporting periods beginning after December 15, 2017, with early adoption permitted. The adoption of ASU 2016-15 is not expected to have a material impact on the Company's consolidated financial statements.
In March 2016, the FASB issued ASU 2016-09, Compensation - Stock Compensation (Topic 718): Improvements to Employee Share-Based Payment Accounting ("ASU 2016-09"). ASU 2016-09 identifies areas for simplification involving several aspects of accounting for share-based payment transactions, including the income tax consequences, classification of
67
TRIUMPH GROUP, INC.
NOTES TO CONSOLIDATED FINANCIAL STATEMENTS (Continued)
(Dollars in thousands, except per share data)
awards as either equity or liabilities, an option to recognize gross stock compensation expense with actual forfeitures recognized as they occur, as well as certain classifications on the statement of cash flows. ASU 2016-09 will be effective for annual periods beginning after December 15, 2016. Early adoption is permitted. The adoption of ASU 2016-15 is not expected to have a material impact on the Company's consolidated financial statements.
In February 2016, the FASB issued ASU 2016-02, Leases (Topic 842) ("ASU 2016-02"). This update requires recognition of lease assets and lease liabilities on the balance sheet of lessees. ASU 2016-02 is effective for fiscal years beginning after December 15, 2018 and interim reporting periods within those years. Early adoption is permitted. ASU 2016-02 requires a modified retrospective transition approach and provides certain optional transition relief. The Company is currently evaluating the new guidance to determine the impact it may have to the Company's consolidated financial statements.
In May 2015, the FASB issued ASU 2015-05, Fair Value Measurement (Topic 820): Disclosures for Investments in Certain Entities That Calculate Net Asset Value per Share (or Its Equivalent) ("ASU 2015-05"). This update eliminates the requirement to categorize within the fair value hierarchy investments whose fair values are measured at net asset value (NAV) using the practical expedient in Accounting Standards Codification (ASC 820). ASU 2015-05 is effective for fiscal years beginning after December 15, 2015 and interim reporting periods within those years. ASU 2015-05 requires retrospective application.
Stock-Based Compensation
The Company recognizes compensation expense for share-based awards based on the fair value of those awards at the date of grant. Stock-based compensation expense for fiscal years ended March 31, 2017, 2016 and 2015 was $7,922, $2,657 and $1,272, respectively. The Company has classified share-based compensation within selling, general and administrative expenses to correspond with the same line item as the majority of the cash compensation paid to employees. Upon the exercise of stock options or vesting of restricted stock, the Company first transfers treasury stock, then will issue new shares (see Note 16 for further details).
Supplemental Cash Flow Information
For the fiscal years ended March 31, 2017 and 2016, the Company paid $7,930 and $4,887, respectively, for income tax, net of income tax refunds received. For the fiscal year ended March 31, 2015, the Company received $22,241 for income tax refunds, net of payments. The Company made interest payments of $72,533, $62,325 and $82,425 for fiscal years ended March 31, 2017, 2016 and 2015, respectively.
During the fiscal years ended March 31, 2017, 2016 and 2015, the Company financed $13,066, $188 and $52 of property and equipment additions through capital leases, respectively.
Warranty Reserves
A reserve has been established to provide for the estimated future cost of warranties on our delivered products. The Company periodically reviews the reserves and adjustments are made accordingly. A provision for warranty on products delivered is made on the basis of historical experience and identified warranty issues. Warranties cover such factors as non-conformance to specifications and defects in material and workmanship. The majority of the Company's agreements include a three-year warranty, although certain programs have warranties up to 20 years. Warranty reserves are included in accrued expenses and other noncurrent liabilities on the Consolidated Balance Sheet. The warranty reserves for the fiscal years ended March 31, 2017 and 2016, were $107,088 and $112,937, respectively, of which a significant portion is offset by an indemnification asset.
3. | ACQUISITIONS |
Acquisition of Fairchild Controls Corporation
Effective October 21, 2015, the Company acquired all of the outstanding shares of Fairchild Controls Corporation ("Fairchild"). Fairchild is a leading provider of proprietary thermal management systems, auxiliary power generation systems and related aftermarket spares and repairs. The acquired business operates as Triumph Thermal Systems-Maryland, Inc. and its results are included in Integrated Systems from the date of acquisition.
The purchase price for Fairchild was $57,130, including a working capital adjustment. Goodwill in the amount of $14,695 was recognized for this acquisition and is calculated as the excess of consideration transferred over the net assets recognized and represents future economic benefits arising from other assets acquired that could not be individually identified and
68
TRIUMPH GROUP, INC.
NOTES TO CONSOLIDATED FINANCIAL STATEMENTS (Continued)
(Dollars in thousands, except per share data)
separately recognized such as assembled workforce. The goodwill is not deductible for tax purposes. The Company has also identified an intangible asset related to customer relationships valued at $18,000 with a weighted-average life of 12.0 years.
The following consolidated balance sheet represents the amounts assigned to each major asset and liability caption in the aggregate from the acquisition of Fairchild, in accordance with ASC 805:
October 21, 2015 | |||
Cash | $ | 9,075 | |
Accounts receivable | 8,841 | ||
Inventory | 15,069 | ||
Prepaid expenses | 263 | ||
Property and equipment | 6,632 | ||
Goodwill | 14,695 | ||
Intangible assets | 18,000 | ||
Deferred taxes | 5,889 | ||
Total assets | $ | 78,464 | |
Accounts payable | $ | 1,284 | |
Accrued expenses | 12,183 | ||
Other noncurrent liabilities | 7,867 | ||
Total liabilities | $ | 21,334 | |
The Company finalized its estimates after it was able to determine that it had obtained all necessary information that existed as of the acquisition date related to these matters.
The Fairchild acquisition has been accounted for under the acquisition method and, accordingly, is included in the consolidated financial statements from the effective date of acquisition. The Company incurred $569 in acquisition-related costs in connection with the Fairchild acquisition.
FISCAL 2015 ACQUISITIONS
Assumption of Spirit AeroSystems Holdings, Inc. - Gulfstream G650 and G280 Wing Programs
Effective December 30, 2014, a wholly-owned subsidiary of the Company, Triumph Aerostructures - Tulsa LLC, doing business as Triumph Aerostructures-Vought Aircraft Division-Tulsa, completed the acquisition of the Gulfstream G650 and G280 wing programs (the "Tulsa Programs") located in Tulsa, Oklahoma, from Spirit AeroSystems, Inc. The acquisition of the Tulsa Programs establishes the Company as a leader in fully integrated wing design, engineering and production and advances its standing as a strategic Tier One Capable aerostructures supplier. The Company received $160,000 in cash plus assets required to run the business from Spirit-Tulsa to cover the anticipated future cash flow needs of the programs. The Company incurred $5,000 in acquisition-related costs in connection with the Tulsa Programs acquisition, which is recorded in selling, general and administrative expenses on the accompanying Consolidated Statements of Operations. The acquired business operates as Triumph Aerostructures-Vought Aircraft Division-Tulsa and its results are included in Aerospace Structures from the date of acquisition.
Acquisition of North American Aircraft Services, Inc.
Effective October 17, 2014, the Company acquired the ownership of all of the outstanding shares of North American Aircraft Services, Inc. and its affiliates ("NAAS"). NAAS is based in San Antonio, Texas, with fixed-based operator units throughout the United States as well as international locations and delivers line maintenance and repair, fuel leak detection and fuel bladder cell repair services. The purchase price for the NAAS acquisition was $44,520, net of working capital adjustment of $167. The Company incurred $654 in acquisition-related costs in connection with the NAAS acquisition, which is recorded in selling, general and administrative expenses on the accompanying Consolidated Statements of Operations. The acquired
69
TRIUMPH GROUP, INC.
NOTES TO CONSOLIDATED FINANCIAL STATEMENTS (Continued)
(Dollars in thousands, except per share data)
business operates as Triumph Aviation Services - NAAS Division and its results are included in Product Services from the date of acquisition.
Acquisition of GE Aviation - Hydraulic Actuation
Effective June 27, 2014, the Company acquired the hydraulic actuation business of GE Aviation ("GE"). GE's hydraulic actuation business consists of three facilities located in Yakima, Washington, Cheltenham, England and the Isle of Man and is a technology leader in actuation systems. GE's key product offerings include complete landing gear actuation systems, door actuation, nose-wheel steerings, hydraulic fuses, manifolds flight control actuation and locking mechanisms for the commercial, military and business jet markets. The purchase price for the GE acquisition was $75,609, which included cash paid at closing, working capital adjustments, and deferred payments of $6,000 paid in fiscal 2016. The Company incurred $1,834 in acquisition-related costs in connection with the GE acquisition, which is recorded in selling, general and administrative expenses in the accompanying Consolidated Statements of Operations. The acquired business operates as Triumph Actuation Systems-Yakima and Triumph Actuation Systems-UK & IOM and its results are included in Integrated Systems from the date of acquisition.
The acquisitions of the Tulsa Programs, NAAS and GE are referred to in this report as the "fiscal 2015 acquisitions."
4. | DIVESTED OPERATIONS AND ASSETS HELD FOR SALE |
Sale of Triumph Aerospace Systems-Newport News
In September 2016, the Company sold all of the shares of Triumph Aerospace Systems-Newport News, Inc. ("TAS-Newport News") for total cash proceeds of $9,000. As a result of the sale of TAS-Newport News, the Company recognized a loss of $4,861 which is presented on the accompanying Consolidated Statements of Income as "Loss on divestitures." The operating results of TAS-Newport News were included in Integrated Systems through the date of disposal.
Sale of Triumph Air Repair, the Auxiliary Power Unit Overhaul Operations of Triumph Aviations Services - Asia, Ltd. and Triumph Engines - Tempe
In December 2016, the Company entered into a definitive agreement to divest Triumph Air Repair, the Auxiliary Power Unit Overhaul Operations of Triumph Aviations Services - Asia, Ltd. and Triumph Engines - Tempe ("Engines and APU"). As a result, the Company recognized a loss of $14,263 on the expected sale which is presented on the accompanying Consolidated Statements of Income as "Loss on divestitures." For financial statement purposes, the assets and liabilities of these business have been segregated from those of the continuing operations and are presented on the accompanying Consolidated Balance Sheets as "Assets held for sale" and "Liabilities related to assets held for sale", respectively. The operating results of Engines and APU will be included in Product Support through the date of disposal. The transaction is expected to close in stages by the end of the fiscal year ending March 31, 2018.
The disposal of these entities does not represent a strategic shift and is not expected to have a major effect on the Company's operations or financial results, as defined by ASC 205-20, Discontinued Operations; as a result, the disposals do not meet the criteria to be classified as discontinued operations.
To measure the amount of loss on divestiture, the Company compared the fair values of assets and liabilities at the evaluation dates to the carrying amounts at the end of the month prior to the respective evaluation dates. The sale of TAS-Newport News and Engines and APU assets and liabilities are categorized as Level 2 within the fair value hierarchy. The key assumption included the negotiated sales price of the assets and the assumptions of the liabilities (see Note 2 above for definition of levels).
70
TRIUMPH GROUP, INC.
NOTES TO CONSOLIDATED FINANCIAL STATEMENTS (Continued)
(Dollars in thousands, except per share data)
5. | INVENTORIES |
Inventories are stated at the lower of cost (average-cost or specific-identification methods) or market. The components of inventories are as follows:
March 31, | |||||||
2017 | 2016 | ||||||
Raw materials | $ | 89,069 | $ | 81,989 | |||
Work-in-process, including manufactured and purchased components | 1,297,989 | 1,100,660 | |||||
Finished goods | 118,265 | 124,744 | |||||
Rotable assets | 57,337 | 51,952 | |||||
Less: unliquidated progress payments | (222,485 | ) | (123,155 | ) | |||
Total inventories | $ | 1,340,175 | $ | 1,236,190 | |||
According to the provisions of U.S. Government contracts, the customer has title to, or a security interest in, substantially all inventories related to such contracts. Included above is total net inventory on government contracts of $34,392 and $27,635, respectively, at March 31, 2017 and 2016.
Work-in-process inventory includes capitalized pre-production costs on newer development programs. Capitalized pre-production costs include nonrecurring engineering, planning and design, including applicable overhead, incurred before production is manufactured on a regular basis. Significant customer-directed work changes can also cause pre-production costs to be incurred. These costs are typically recovered over a contractually determined number of ship set deliveries. The balance of development program inventory, comprised principally of capitalized pre-production costs, excluding progress payments related to the Company's contracts with Bombardier for the Global 7000/8000 program ("Bombardier") and Embraer for the second generation E-Jet ("Embraer") are as follows:
March 31, 2017 | |||||||||||||||
Inventory | Capitalized Pre-Production | Forward Loss Provision | Total Inventory, net | ||||||||||||
Bombardier | $ | 89,650 | $ | 589,449 | $ | (399,758 | ) | $ | 279,341 | ||||||
Embraer | 14,987 | 173,169 | (5,800 | ) | 182,356 | ||||||||||
Total | $ | 104,637 | $ | 762,618 | $ | (405,558 | ) | $ | 461,697 | ||||||
March 31, 2016 | |||||||||||||||
Inventory | Capitalized Pre-Production | Forward Loss Provision | Total Inventory, net | ||||||||||||
Bombardier | $ | 6,662 | $ | 406,147 | $ | (399,758 | ) | $ | 13,051 | ||||||
Embraer | 5,139 | 146,765 | — | 151,904 | |||||||||||
Total | $ | 11,801 | $ | 552,912 | $ | (399,758 | ) | $ | 164,955 | ||||||
During the fiscal year ended March 31, 2016, the Company recorded a $399,758 forward loss charge for the Bombardier Global 7000/8000 wing program. Under our contract for this program, the Company has the right to design, develop and manufacture wing components for the Global 7000 program. The Global 7000/8000 contract provides for fixed pricing and requires the Company to fund certain up-front development expenses, with certain milestone payments made by Bombardier.
The Global 7000/8000 program charge resulted in the impairment of previously capitalized pre-production costs due to the combination of cost recovery uncertainty, higher than anticipated non-recurring costs and increased forecasted costs on recurring production. The increases in costs were driven by several factors, including: changing technical requirements, increased spending on the design and engineering phase of the program and uncertainty regarding cost reduction and cost recovery initiatives with our customer and suppliers.
The program has continued to incur costs since March 2016 in support of the development and transition to production.
71
TRIUMPH GROUP, INC.
NOTES TO CONSOLIDATED FINANCIAL STATEMENTS (Continued)
(Dollars in thousands, except per share data)
In May 2017, Triumph Aerostructures and Bombardier entered into a comprehensive settlement agreement that resolves all outstanding commercial disputes between them, including all pending litigation, related to the design, manufacture and supply of wing components for Bombardier’s Global 7000 business aircraft. The settlement resets the commercial relationship between the companies and allows each company to better achieve its business objectives going forward.
Further cost increases or an inability to meet revised recurring cost forecasts on the Global 7000/8000 program will likely result in additional forward loss reserves in future periods, while improvements in future costs compared to current estimates may result in favorable adjustments if forward loss reserves are no longer required.
The Company is still in the pre-production stages for the Bombardier and Embraer programs, as these aircrafts are not scheduled to enter service until 2018, or later. Transition of these programs from development to recurring production levels is dependent upon the success of the programs achieving flight testing and certification, as well as the ability of the Bombardier and Embraer programs to generate acceptable levels of aircraft sales. The failure to achieve these milestones and level of sales or significant cost overruns may result in additional forward losses.
6. | PROPERTY AND EQUIPMENT |
Net property and equipment is:
March 31, | |||||||
2017 | 2016 | ||||||
Land | $ | 65,338 | $ | 72,204 | |||
Construction in process | 31,808 | 40,772 | |||||
Buildings and improvements | 378,193 | 371,336 | |||||
Furniture, fixtures and computer equipment | 160,298 | 159,511 | |||||
Machinery and equipment | 982,240 | 989,423 | |||||
1,617,877 | 1,633,246 | ||||||
Less: accumulated depreciation | 812,847 | 743,512 | |||||
$ | 805,030 | $ | 889,734 | ||||
Depreciation expense for the fiscal years ended March 31, 2017, 2016 and 2015 was $123,199, $122,197 and $108,347, respectively, which includes depreciation of assets under capital lease. Included in furniture, fixtures and computer equipment above is $91,557 and $93,047, respectively, of capitalized software at March 31, 2017 and 2016, which were offset by accumulated depreciation of $76,847 and $66,760, respectively.
7. | GOODWILL AND OTHER INTANGIBLE ASSETS |
The following is a summary of the changes in the carrying value of goodwill by reportable segment, for the fiscal years ended March 31, 2017 and 2016:
Integrated Systems | Aerospace Structures | Precision Components | Product Support | Total | |||||||||||||||
Balance, March 31, 2016 | $ | 560,696 | $ | 266,298 | $ | 535,804 | $ | 81,456 | $ | 1,444,254 | |||||||||
Goodwill recognized in connection with acquisitions | (1,834 | ) | — | — | — | (1,834 | ) | ||||||||||||
Impairment of goodwill | — | (266,298 | ) | — | — | (266,298 | ) | ||||||||||||
Goodwill associated with disposition | (6,600 | ) | — | — | (12,665 | ) | (19,265 | ) | |||||||||||
Effect of exchange rate changes | (11,107 | ) | — | (3,386 | ) | 241 | (14,252 | ) | |||||||||||
Balance, March 31, 2017 | $ | 541,155 | $ | — | $ | 532,418 | $ | 69,032 | $ | 1,142,605 | |||||||||
72
TRIUMPH GROUP, INC.
NOTES TO CONSOLIDATED FINANCIAL STATEMENTS (Continued)
(Dollars in thousands, except per share data)
Integrated Systems | Aerospace Structures | Precision Components | Product Support | Total | |||||||||||||||
Balance, March 31, 2015 | $ | 550,407 | $ | 861,270 | $ | 531,784 | $ | 81,385 | $ | 2,024,846 | |||||||||
Goodwill recognized in connection with acquisitions | 16,529 | — | — | — | 16,529 | ||||||||||||||
Impairment of goodwill | — | (597,603 | ) | — | — | (597,603 | ) | ||||||||||||
Effect of exchange rate changes | (6,240 | ) | 2,631 | 4,020 | 71 | 482 | |||||||||||||
Balance, March 31, 2016 | $ | 560,696 | $ | 266,298 | $ | 535,804 | $ | 81,456 | $ | 1,444,254 | |||||||||
In the fourth quarter of the fiscal year ended March 31, 2017, consistent with the Company's policy described here, the Company performed its annual assessment of the fair value of goodwill. The Company concluded that the goodwill had a fair value that was lower then its carrying value by an amount that exceeded the remaining goodwill for the reporting unit. Accordingly, the Company recorded a non-cash impairment charge during the fourth quarter of the fiscal year ending March 31, 2017 of $266,298, which is presented on the accompanying Consolidated Statements of Operations as "Impairment of intangible assets”. The decline in fair value is the result of declining revenues from production rate reductions on sun-setting programs and the slower than previously projected ramp in our development programs and the timing of associated earnings and cash flows (See Note 2 for definition of fair value levels).
The Company’s assessment of the Precision Components reporting unit concluded that the goodwill was not impaired as of the annual impairment assessment date. However, the excess of the fair value over the carrying value was less than 5%. The decline in fair value is the result of declining revenues from production rate reductions on sun-setting programs and the start-up costs related to new programs and the timing of associated earnings and cash flows. Going forward, the Company will continue to monitor the performance of this reporting unit in relation to the key assumptions in our analysis.
In the event that market multiples for stock price to EBITDA in the aerospace and defense markets decrease, or the expected EBITDA and cash flows for the Company's reporting units decreases, an additional goodwill impairment charge may be required, which would adversely affect the Company's operating results and financial condition. If management determines that impairment exists, the impairment will be recognized in the period in which it is identified.
During the fourth quarter of the fiscal year ended March 31, 2016, consistent with the Company's policy described here within, the Company performed its annual assessment of the fair value of goodwill. The Company concluded that the goodwill related to the reporting unit formerly know as Aerostructures was impaired as of the annual testing date. The Company concluded that the goodwill had an implied fair value of $822,801 (Level 3) compared to a carrying value of $1,420,195. Accordingly, the Company recorded a non-cash impairment charge during the fourth quarter of the fiscal year ending March 31, 2016, of $597,603, which is presented on the accompanying Consolidated Statements of Operations as "Impairment of intangible assets". The decline in fair value is the result of continued declines in stock price and related market multiples for stock price to EBITDA of both the Company and our peer group.
Intangible Assets
The components of intangible assets, net are as follows:
March 31, 2017 | |||||||||||||
Weighted- Average Life (in Years) | Gross Carrying Amount | Accumulated Amortization | Net | ||||||||||
Customer relationships | 16.6 | $ | 663,165 | $ | (241,124 | ) | $ | 422,041 | |||||
Product rights, technology and licenses | 11.4 | 54,347 | (39,486 | ) | 14,861 | ||||||||
Noncompete agreements and other | 16.3 | 2,756 | (786 | ) | 1,970 | ||||||||
Tradenames | 10.3 | 163,000 | (9,508 | ) | 153,492 | ||||||||
Total intangibles, net | $ | 883,268 | $ | (290,904 | ) | $ | 592,364 | ||||||
73
TRIUMPH GROUP, INC.
NOTES TO CONSOLIDATED FINANCIAL STATEMENTS (Continued)
(Dollars in thousands, except per share data)
March 31, 2016 | |||||||||||||
Weighted- Average Life (in Years) | Gross Carrying Amount | Accumulated Amortization | Net | ||||||||||
Customer relationships | 16.4 | $ | 683,309 | $ | (215,546 | ) | $ | 467,763 | |||||
Product rights, technology and licenses | 11.7 | 55,739 | (37,695 | ) | 18,044 | ||||||||
Noncompete agreements and other | 16.1 | 2,881 | (718 | ) | 2,163 | ||||||||
Tradenames | 20.0 | 163,000 | (1,358 | ) | 161,642 | ||||||||
Total intangibles, net | $ | 904,929 | $ | (255,317 | ) | $ | 649,612 | ||||||
During the third quarter of the fiscal year ended March 31, 2016, the Company performed an interim assessment of fair value on our indefinite-lived intangible assets due to indicators of impairment related to the continued decline in our stock price during the fiscal third quarter. The Company estimated the fair value of the tradenames using the relief-from-royalty method, which uses several significant assumptions, including revenue projections that consider historical and estimated future results, general economic and market conditions, as well as the impact of planned business and operational strategies. The following estimates and assumptions were also used in the relief-from-royalty method:
•Royalty rates between 2% and 4% based on market observed royalty rates and profit split analysis; and
•Discount rates between 12% and 13% based on the required rate of return for the tradename assets.
Based on the Company's evaluation of indefinite-lived assets, including the tradenames, the Company concluded that the Vought tradename had a fair value of $195,800 (Level 3) compared to a carrying value of $425,000. Accordingly, the Company recorded a non-cash impairment charge during the third quarter of the fiscal year ended March 31, 2016, of $229,200, which is presented on the accompanying Consolidated Statements of Operations as "Impairment of intangible assets". The decline in fair value compared to carrying value of the Vought tradename is the result of declining revenues from production rate reductions and the slower than previously projected ramp in Bombardier Global 7000/8000 and the timing of associated earnings.
During the fourth quarter of the fiscal year ended March 31, 2016, the Company performed its annual assessment of fair value on our indefinite-lived intangible assets. The Company estimated the fair value of the tradenames using the relief-from-royalty method, which uses several significant assumptions, including revenue projections that consider historical and estimated future results, general economic and market conditions, as well as the impact of planned business and operational strategies. The following estimates and assumptions were also used in the relief-from-royalty method:
•Royalty rates between 2% and 4% based on market observed royalty rates and profit split analysis; and
•Discount rate of 14% based on the required rate of return for the tradename assets, which increased from our interim assessment driven by increased risk due to continued declines in stock price and related market multiples for stock price to EBITDA of both the Company and our peer group and increased interest rates.
Based on the Company's evaluation of indefinite-lived assets, including the tradenames, the Company concluded that the Vought and Embee tradenames had a fair value of $163,000 (Level 3) compared to a carrying value of $209,200. Accordingly, the Company recorded a non-cash impairment charge during the fiscal year ended March 31, 2016 of $46,200, which is presented on the accompanying Consolidated Statements of Operations as "Impairment of intangible assets". The decline in fair value of the Vought and Embee tradenames is the result of declining revenues from production rate reductions and the slower than previously projected ramp in Bombardier Global 7000/8000 and the timing of associated earnings.
During the fiscal year ended March 31, 2017, as part of the Company's annual assessment, the Company determined that the remaining estimated useful life for the Vought tradename should be reduced from a useful life of 20 years to a useful life of 10 years, as it better represents the financial performance relative to the expected performance.
In the event of significant loss of revenues and related earnings associated with the Vought and Embee tradenames, further impairment charges may be required, which would adversely affect our operating results.
Amortization expense for the fiscal years ended March 31, 2017, 2016 and 2015, was $53,746, $54,620 and $49,976, respectively. Amortization expense for the five fiscal years succeeding March 31, 2017, by year is expected to be as follows: 2018: $59,491; 2019: $57,898; 2020: $56,379; 2021: $55,532; 2022: $55,540 and thereafter: $307,524.
74
TRIUMPH GROUP, INC.
NOTES TO CONSOLIDATED FINANCIAL STATEMENTS (Continued)
(Dollars in thousands, except per share data)
8. | ACCRUED EXPENSES |
Accrued expenses consist of the following items:
March 31, | |||||||
2017 | 2016 | ||||||
Accrued pension | $ | 4,094 | $ | 3,621 | |||
Deferred revenue, advances and progress billings | 256,275 | 78,932 | |||||
Accrued other postretirement benefits | 15,983 | 16,246 | |||||
Accrued compensation and benefits | 89,419 | 114,149 | |||||
Accrued interest | 17,911 | 16,933 | |||||
Warranty reserve | 29,110 | 31,975 | |||||
Accrued workers' compensation | 17,354 | 17,033 | |||||
Accrued income tax | 3,873 | 2,469 | |||||
Loss contract reserve | 172,416 | 307,934 | |||||
All other | 67,944 | 93,916 | |||||
Total accrued expenses | $ | 674,379 | $ | 683,208 | |||
9. | LEASES |
At March 31, 2017, future minimum payments under noncancelable operating leases with initial or remaining terms of more than one year were as follows: 2018—$27,636; 2019—$24,539; 2020—$20,025; 2021—$16,931; 2022—$12,803 and thereafter—$50,183 through 2031. In the normal course of business, operating leases are generally renewed or replaced by other leases.
Total rental expense was $39,114, $33,279 and $34,762 for the fiscal years ended March 31, 2017, 2016 and 2015, respectively.
75
TRIUMPH GROUP, INC.
NOTES TO CONSOLIDATED FINANCIAL STATEMENTS (Continued)
(Dollars in thousands, except per share data)
10. | LONG-TERM DEBT |
Long-term debt consists of the following:
March 31, | |||||||
2017 | 2016 | ||||||
Revolving credit facility | $ | 29,999 | $ | 140,000 | |||
Term loan | 309,375 | 337,500 | |||||
Receivable securitization facility | 112,900 | 191,300 | |||||
Capital leases | 72,800 | 74,513 | |||||
Senior notes due 2021 | 375,000 | 375,000 | |||||
Senior notes due 2022 | 300,000 | 300,000 | |||||
Other debt | 7,978 | 7,978 | |||||
Less: debt issuance costs | (11,752 | ) | (8,971 | ) | |||
1,196,300 | 1,417,320 | ||||||
Less: current portion | 160,630 | 42,441 | |||||
$ | 1,035,670 | $ | 1,374,879 | ||||
Revolving Credit Facility
In October 2016, the Company entered into a Seventh Amendment to the Third Amended and Restated Credit Agreement, among the Company and its lenders to, among other things, (i) modify certain financial covenants to allow for the add-back of certain cash and non-cash charges, (ii) increase the maximum permitted total leverage ratio and senior secured leverage ratio financial covenants commencing with the fiscal quarter ended September 30, 2016 through the fiscal quarter ending June 30, 2017, (iii) permit the sale of certain specified assets so long as the Company applies 65.0% of the net proceeds received from such sales to the outstanding term loan, pro rata across all maturities, (iv) establish a new higher pricing tier for the interest rate, commitment fee and letter of credit fee pricing provisions, (v) increase the interest rate and letter of credit fee pricing provisions for several of the lower tiers of the pricing grid, (vi) establish the interest rate, commitment fee and letter of credit fee pricing at the highest pricing tier until the Company delivers its compliance certificate for its fiscal quarter ending September 30, 2017, and (vii) extend the period during which the increased minimum revolver availability threshold test and the decreased maximum senior secured leverage ratio threshold test are in effect in connection with the Company making certain permitted investments, certain additional permitted dividends, permitted acquisitions and permitted payments of certain types of indebtedness to the date the Company delivers its compliance certificate for the fiscal quarter ending September 30, 2017
In May 2016, the Company entered into a Sixth Amendment to the Third Amended and Restated Credit Agreement, among the Company and its lenders, pursuant to which those lenders electing to enter into the Sixth Amendment extended the expiration date for the revolving line of credit and the maturity date for the term loan by five years to May 3, 2021. Lenders holding revolving credit commitments aggregating $940,000 elected to extend the expiration date for the revolving line of credit, and Lenders holding approximately $324,500 of term loans (out of an aggregate outstanding term loan balance of approximately $330,000) elected to extend the term loan maturity date.
In addition, the Sixth Amendment amended the Credit Facility to, among other things, (i) modify certain financial covenants to allow for the add-back of certain cash and non-cash charges, (ii) amend the total leverage ratio financial covenant to provide for a gradual reduction in the maximum permitted total leverage ratio commencing with the fiscal year ending March 31, 2018, (iii) increase the interest rate, commitment fee and letter of credit fee pricing provisions for the highest pricing tier, (iv) establish the interest rate, commitment fee and letter of credit fee pricing at the highest pricing tier until the Company delivers its compliance certificate for its fiscal year ending March 31, 2017, (v) increase the minimum revolver availability threshold test in connection with the Company making certain permitted investments, certain additional permitted dividends, permitted acquisitions and permitted payments of certain types of indebtedness, and (vi) decrease the maximum senior secured leverage ratio threshold test in connection with the Company making certain permitted investments, certain permitted dividends, permitted acquisitions and permitted payments of certain types of indebtedness during the period from the date of the Sixth Amendment until the Company delivers its compliance certificate for the fiscal year ending March 31, 2017.
In May 2014, the Company amended and restated the Credit Facility with its lenders to (i) increase the maximum amount allowed for the receivable securitization facility (the "Securitization Facility") and (ii) amend certain other terms and covenants.
76
TRIUMPH GROUP, INC.
NOTES TO CONSOLIDATED FINANCIAL STATEMENTS (Continued)
(Dollars in thousands, except per share data)
In November 2013, the Company amended and restated its Credit Facility with its lenders to (i) provide for a $375,000 term loan with a maturity date of May 14, 2019 (the "2013 Term Loan"), (ii) maintain a revolving line of credit under the Credit Facility of $1,000,000, with a $250,000 accordion feature, (iii) extend the maturity date to November 19, 2018, and (iv) amend certain other terms and covenants.
The Company will repay the outstanding principal amount of the 2013 Term Loan in quarterly installments, on the first business day of each January, April, July and October, commencing April 2014.
The obligation under the Credit Facility and related documents are secured by liens on substantially all assets of the Company and its domestic subsidiaries pursuant to an Amended and Restated Guarantee and Collateral Agreement, dated as of November 19, 2013, among the administrative agent, the Company and the subsidiaries of the Company party thereto.
Pursuant to the Credit Facility, the Company can borrow, repay and re-borrow revolving credit loans, and cause to be issued letters of credit, in an aggregate principal amount not to exceed $1,000,000 outstanding at any time. The Credit Facility bears interest at either: (i) LIBOR plus between 1.38% and 2.50%; (ii) the prime rate; or (iii) an overnight rate at the option of the Company. The applicable interest rate is based upon the Company’s ratio of total indebtedness to earnings before interest, taxes, depreciation and amortization. In addition, the Company is required to pay a commitment fee of between 0.25% and 0.45% on the unused portion of the Credit Facility. The Company’s obligations under the Credit Facility are guaranteed by the Company’s domestic subsidiaries.
At March 31, 2017, there were $29,999 in outstanding borrowings and $27,240 in letters of credit under the Credit Facility primarily to support insurance policies. At March 31, 2016, there were $140,000 in borrowings and $25,709 in letters of credit outstanding. The level of unused borrowing capacity under the Credit Facility varies from time to time depending in part upon the Company's compliance with financial and other covenants set forth in the related agreement. The Credit Facility contains certain affirmative and negative covenants including limitations on specified levels of indebtedness to earnings before interest, taxes, depreciation and amortization, and interest coverage requirements, and includes limitations on, among other things, liens, mergers, consolidations, sales of assets, payment of dividends and incurrence of debt. If an event of default were to occur under the Credit Facility, the lenders would be entitled to declare all amounts borrowed under it immediately due and payable. The occurrence of an event of default under the Credit Facility could also cause the acceleration of obligations under certain other agreements. The Company is in compliance with all such covenants as of March 31, 2017. As of March 31, 2017, the Company had borrowing capacity under the Credit Facility of $483,809 after reductions for borrowings and letters of credit outstanding under the Credit Facility.
In connection with the Company amending and restating the Credit Facility to add the 2013 Term Loan, the Company also entered into an interest rate swap agreement through November 2018 to reduce its exposure to interest on the variable rate portion of its long-term debt. On the date of inception, the Company designated the interest rate swap as a cash flow hedge in accordance with FASB guidance on accounting for derivatives and hedges and linked the interest rate swap to the 2013 Term Loan. The Company formally documented the hedging relationship between 2013 Term Loan and the interest rate swap, as well as its risk-management objective and strategy for undertaking the hedge, the nature of the risk being hedged, how the hedging instrument's effectiveness will be assessed and a description of the method of measuring the ineffectiveness. The Company also formally assesses, both at the hedge's inception and on a quarterly basis, whether the derivative item is highly effective offsetting changes in cash flows.
As of March 31, 2017 and 2016, the interest rate swap agreement had a notional amount of $309,375 and $337,500, respectively, and a fair value of $309 and $(4,526), respectively, which is recorded in other comprehensive income net of applicable taxes (Level 2). The interest rate swap settles on a monthly basis when interest payments are made. These settlements occur through the maturity date.
In May 2017, the Company entered into an Eighth Amendment to the Third Amended and Restated Credit Agreement (the “Eighth Amendment Effective Date”), among the Company and its lenders to, among other things, (i) eliminate the total leverage ratio financial covenant, (ii) increase the maximum permitted senior secured leverage ratio financial covenant applicable to each fiscal quarter, commencing with the fiscal quarter ended March 31, 2017, and to revise the step-downs applicable to such financial covenant, (iii) reduce the aggregate principal amount of commitments under the revolving line of credit to $850,000 from $1,000,000, (iv) modify the maturity date of the term loans so that all of the term loans will mature on March 31, 2019, and (v) establish a new higher pricing tier for the interest rate, commitment fee and letter of credit fee pricing provisions and provide that the highest pricing tier will apply until the maximum senior secured leverage ratio financial covenant is 2.50 to 1.00 and the Company delivers a compliance certificate demonstrating compliance with such financial covenant.
77
TRIUMPH GROUP, INC.
NOTES TO CONSOLIDATED FINANCIAL STATEMENTS (Continued)
(Dollars in thousands, except per share data)
The Eighth Amendment also provides the Company’s Vought Aircraft Division (Triumph Aerostructures, LLC) and certain affiliated entities (collectively, the “Vought entities”) with the option, if necessary, to commence voluntary insolvency proceedings within 90 days of the Eighth Amendment Effective Date, subject to certain conditions set forth in the Credit Agreement. Upon the commencement of such proceedings, the Vought entities would no longer be Subsidiary Co-Borrowers under the Credit Agreement, and transactions between any of the Vought entities, on the one hand, and the Company and any of the Subsidiary Co-Borrowers, on the other hand, will be restricted.
The Company entered into the Eighth Amendment, among other reasons, in order to provide the Vought entities with greater financial flexibility to address their significant cash utilization relative to certain contracts. The Company expects that any actions it may take regarding the Vought entities will improve the Company’s credit profile and equity value. The Company continues to execute its transformation strategy to strengthen its operations, enhance its liquidity and drive profitable growth.
Receivables Securitization Program
In November 2014, the Company amended its receivable securitization facility (the "Securitization Facility"), increasing the purchase limit from $175,000 to $225,000 and extending the term through November 2017. In connection with the Securitization Facility, the Company sells on a revolving basis certain eligible accounts receivable to Triumph Receivables, LLC, a wholly owned special-purpose entity, which in turn sells a percentage ownership interest in the receivables to commercial paper conduits sponsored by financial institutions. The Company is the servicer of the accounts receivable under the Securitization Facility. As of March 31, 2017, the maximum amount available under the Securitization Facility was $225,000. Interest rates are based on prevailing market rates for short-term commercial paper plus a program fee and a commitment fee. The program fee is 0.40% on the amount outstanding under the Securitization Facility. Additionally, the commitment fee is 0.40% on 100% of the maximum amount available under the Securitization Facility. At March 31, 2017, $112,900 was outstanding under the Securitization Facility. In connection with amending the Securitization Facility, the Company incurred approximately $252 of financing costs. These costs, along with the $341 of unamortized financing costs prior to the amendment, are being amortized over the life of the Securitization Facility. The Company securitizes its accounts receivable, which are generally non-interest bearing, in transactions that are accounted for as borrowings pursuant to the Transfers and Servicing topic of the ASC.
The agreement governing the Securitization Facility contains restrictions and covenants which include limitations on the making of certain restricted payments, creation of certain liens, and certain corporate acts such as mergers, consolidations and the sale of substantially all assets. The Company was in compliance with all such covenants as of March 31, 2017.
Capital Leases
During the fiscal years ended March 31, 2017, 2016 and 2015, the Company entered into new capital leases in the amounts of $13,066, $188 and $52, respectively, to finance a portion of the Company's capital additions for the respective years. During the fiscal years ended March 31, 2017, 2016 and 2015, the Company obtained financing for existing fixed assets in the amount of $0, $6,497 and $37,608, respectively.
Senior Notes due 2021
On February 26, 2013, the Company issued $375,000 principal amount of 4.875% Senior Notes due 2021 (the "2021 Notes"). The 2021 Notes were sold at 100% of principal amount and have an effective interest yield of 4.875%. Interest on the 2021 Notes accrues at the rate of 4.875% per annum and is payable semiannually in cash in arrears on April 1 and October 1 of each year, commencing on October 1, 2013. In connection with the issuance of the 2021 Notes, the Company incurred approximately $6,327 of costs, which were deferred and are being amortized on the effective interest method over the term of the 2021 Notes.
The 2021 Notes are the Company's senior unsecured obligations and rank equally in right of payment with all of its other existing and future senior unsecured indebtedness and senior in right of payment to all of its existing and future subordinated indebtedness. The 2021 Notes are guaranteed on a full, joint and several basis by each of the Guarantor Subsidiaries.
The Company may redeem some or all of the 2021 Notes prior to April 1, 2017, by paying a "make-whole" premium. The Company may redeem some or all of the 2021 Notes on or after April 1, 2017, at specified redemption prices. In addition, prior to April 1, 2016, the Company could have redeemed up to 35% of the 2021 Notes with the net proceeds of certain equity offerings at a redemption price equal to 104.875% of the aggregate principal amount plus accrued and unpaid interest, if any, subject to certain limitations set forth in the indenture governing the 2021 Notes (the "2021 Indenture").
The Company is obligated to offer to repurchase the 2021 Notes at a price of (i) 101% of their principal amount plus accrued and unpaid interest, if any, as a result of certain change of control events and (ii) 100% of their principal amount plus
78
TRIUMPH GROUP, INC.
NOTES TO CONSOLIDATED FINANCIAL STATEMENTS (Continued)
(Dollars in thousands, except per share data)
accrued and unpaid interest, if any, in the event of certain asset sales. These restrictions and prohibitions are subject to certain qualifications and exceptions.
The 2021 Indenture contains covenants that, among other things, limit the Company's ability and the ability of any of the Guarantor Subsidiaries to (i) grant liens on its assets, (ii) make dividend payments, other distributions or other restricted payments, (iii) incur restrictions on the ability of the Guarantor Subsidiaries to pay dividends or make other payments, (iv) enter into sale and leaseback transactions, (v) merge, consolidate, transfer or dispose of substantially all of their assets, (vi) incur additional indebtedness, (vii) use the proceeds from sales of assets, including capital stock of restricted subsidiaries, and (viii) enter into transactions with affiliates.
During May 2016, to ensure that the Company had full access to the Credit Facility during fiscal 2017, the Company obtained approval from the holders of the 2021 Notes to amend the terms of the indenture to conform with the 2022 Notes (as defined below) which allows for a higher level of secured debt. Absent this consent, the Company would have been restricted as to the level of new borrowings under the Credit Facility during fiscal 2017.
Senior Notes due 2022
On June 3, 2014, the Company issued $300,000 principal amount of 5.250% Senior Notes due 2022 (the "2022 Notes"). The 2022 Notes were sold at 100% of principal amount and have an effective interest yield of 5.250%. Interest on the 2022 Notes accrues at the rate of 5.250% per annum and is payable semiannually in cash in arrears on June 1 and December 1 of each year, commencing on December 1, 2014. In connection with the issuance of the 2022 Notes, the Company incurred approximately $4,990 of costs, which were deferred and are being amortized on the effective interest method over the term of the 2022 Notes.
The 2022 Notes are the Company's senior unsecured obligations and rank equally in right of payment with all of its other existing and future senior unsecured indebtedness and senior in right of payment to all of its existing and future subordinated indebtedness. The 2022 Notes are guaranteed on a full, joint and several basis by each of the Guarantor Subsidiaries.
The Company may redeem some or all of the 2022 Notes prior to June 1, 2017, by paying a "make-whole" premium. The Company may redeem some or all of the 2022 Notes on or after June 1, 2017, at specified redemption prices. In addition, prior to June 1, 2017, the Company may redeem up to 35% of the 2022 Notes with the net proceeds of certain equity offerings at a redemption price equal to 105.250% of the aggregate principal amount plus accrued and unpaid interest, if any, subject to certain limitations set forth in the indenture governing the 2022 Notes (the "2022 Indenture").
The Company is obligated to offer to repurchase the 2022 Notes at a price of (i) 101% of their principal amount plus accrued and unpaid interest, if any, as a result of certain change-of-control events and (ii) 100% of their principal amount plus accrued and unpaid interest, if any, in the event of certain asset sales. These restrictions and prohibitions are subject to certain qualifications and exceptions.
The 2022 Indenture contains covenants that, among other things, limit the Company's ability and the ability of any of the Guarantor Subsidiaries to (i) grant liens on its assets, (ii) make dividend payments, other distributions or other restricted payments, (iii) incur restrictions on the ability of the Guarantor Subsidiaries to pay dividends or make other payments, (iv) enter into sale and leaseback transactions, (v) merge, consolidate, transfer or dispose of substantially all of their assets, (vi) incur additional indebtedness, (vii) use the proceeds from sales of assets, including capital stock of restricted subsidiaries, and (viii) enter into transactions with affiliates.
Receivables Purchase Agreement
On March 28, 2016, the Company entered into a Purchase Agreement ("Receivables Purchase Agreement") to sell certain accounts receivables to a financial institution without recourse. The Company is the servicer of the accounts receivable under the Receivables Purchase Agreement. As of March 31, 2017, the maximum amount available under the Receivables Purchase Agreement was $90,000. Interest rates are based on LIBOR plus 0.65% - 0.70%. As of March 31, 2017 and 2016, the Company sold $78,006 and $89,900, respectively, worth of eligible accounts receivable.
Senior Notes due 2018
On June 16, 2010, in connection with the acquisition of Vought, the Company issued $350,000 principal amount of 8.63% Senior Notes due 2018 (the "2018 Notes"). The 2018 Notes were sold at 99.27% of principal amount and had effective interest yield of 8.75%. Interest on the 2018 Notes accrued at the rate of 8.63% per annum and was payable semiannually in cash in arrears on January 15 and July 15 of each year, commencing on January 15, 2011. In connection with the issuance of the 2018
79
TRIUMPH GROUP, INC.
NOTES TO CONSOLIDATED FINANCIAL STATEMENTS (Continued)
(Dollars in thousands, except per share data)
Notes, the Company incurred approximately $7,307 of costs, which were deferred and amortized on the effective interest method over the term of the 2018 Notes.
On June 23, 2014, the Company completed the redemption of the 2018 Notes. The principal amount of $350,000 was redeemed at a price of 104.79% plus accrued and unpaid interest. As a result of the redemption, the Company recognized a pre-tax loss on redemption of $22,615, consisting of early termination premium, write-off of unamortized discount and deferred financing fees and was recorded on the Consolidated Statements of Operations as a component of "Interest expense and other" for the fiscal year ended March 31, 2015.
Convertible Senior Subordinated Notes
On May 22, 2014, the Company announced the redemption of the Convertible Notes. The redemption price for the Convertible Notes was equal to the sum of 100% of the principal amount of the Convertible Notes outstanding, plus accrued and unpaid interest on the Convertible Notes up to, but not including, the redemption date of June 23, 2014. The Convertible Notes were able to be converted at the option of the holder.
The Convertible Notes were eligible for conversion upon meeting certain conditions as provided in the indenture governing the Convertible Notes. For the periods from January 1, 2011 through June 23, 2014, the Convertible Notes were eligible for conversion. During the fiscal year ended March 31, 2015, the Company settled the conversion of $12,834 in principal value of the Convertible Notes, with the principal and the conversion benefit settled in cash.
To be included in the calculation of diluted earnings per share, the average price of the Company's common stock for the fiscal year must exceed the conversion price per share of $27.12. The average price of the Company's common stock for the fiscal years ended March 31, 2015, was $65.11, respectively. Therefore, 40,177 additional shares, were included in the diluted earnings per share calculation for the fiscal years ended March 31, 2015.
Financial Instruments Not Recorded at Fair Value
Carrying amounts and the related estimated fair values of the Company's long-term debt not recorded at fair value in the consolidated financial statements are as follows:
March 31, 2017 | March 31, 2016 | |||||||||||||
Carrying Value | Fair Value | Carrying Value | Fair Value | |||||||||||
$ | 1,196,300 | $ | 1,178,968 | $ | 1,417,320 | $ | 1,354,961 | |||||||
The fair value of the long-term debt was calculated based on either interest rates available for debt with terms and maturities similar to the Company's existing debt arrangements or broker quotes on our existing debt (Level 2 inputs).
Interest paid on indebtedness during the fiscal years ended March 31, 2017, 2016 and 2015 amounted to $72,533, $62,325 and $82,425, respectively. Interest capitalized during the fiscal years ended March 31, 2017, 2016 and 2015 was $158, $668 and $284, respectively.
As of March 31, 2017, the maturities of long-term debt are as follows: 2018—$160,630; 2019—$52,660; 2020—$50,217; 2021—$55,937; 2022—$579,054; and thereafter—$309,554 through 2021.
80
TRIUMPH GROUP, INC.
NOTES TO CONSOLIDATED FINANCIAL STATEMENTS (Continued)
(Dollars in thousands, except per share data)
11. | OTHER NONCURRENT LIABILITIES |
Other noncurrent liabilities are composed of the following items:
March 31, | |||||||
2017 | 2016 | ||||||
Acquired contract liabilities, net | $ | 394,883 | $ | 522,680 | |||
Accrued warranties | 77,978 | 80,898 | |||||
Accrued workers' compensation | 16,881 | 15,942 | |||||
Deferred grant income | 3,985 | 4,670 | |||||
Environmental contingencies | 5,495 | 7,613 | |||||
Income tax reserves | 527 | 4,798 | |||||
All other | 38,207 | 25,678 | |||||
Total other noncurrent liabilities | $ | 537,956 | $ | 662,279 | |||
12. | INCOME TAXES |
The components of pretax (loss) income are as follows:
Year ended March 31, | |||||||||||
2017 | 2016 | 2015 | |||||||||
Foreign | $ | 23,398 | $ | (13,673 | ) | $ | (429 | ) | |||
Domestic | (47,010 | ) | (1,145,474 | ) | 349,723 | ||||||
$ | (23,612 | ) | $ | (1,159,147 | ) | $ | 349,294 | ||||
The components of income tax expense are as follows:
Year ended March 31, | |||||||||||
2017 | 2016 | 2015 | |||||||||
Current: | |||||||||||
Federal | $ | 5,074 | $ | 2,074 | $ | 391 | |||||
State | 445 | 615 | 178 | ||||||||
Foreign | 4,341 | 4,426 | 4,751 | ||||||||
9,860 | 7,115 | 5,320 | |||||||||
Deferred: | |||||||||||
Federal | 9,782 | (148,069 | ) | 114,260 | |||||||
State | (3,166 | ) | 29,020 | (1,857 | ) | ||||||
Foreign | 2,864 | 747 | (7,126 | ) | |||||||
9,480 | (118,302 | ) | 105,277 | ||||||||
$ | 19,340 | $ | (111,187 | ) | $ | 110,597 | |||||
81
TRIUMPH GROUP, INC.
NOTES TO CONSOLIDATED FINANCIAL STATEMENTS (Continued)
(Dollars in thousands, except per share data)
A reconciliation of the statutory federal income tax rate to the effective tax rate is as follows:
Year ended March 31, | ||||||||
2017 | 2016 | 2015 | ||||||
Statutory federal income tax rate | 35.0 | % | 35.0 | % | 35.0 | % | ||
State and local income taxes, net of federal tax benefit | 12.2 | 1.8 | 0.5 | |||||
Goodwill impairment | (394.7 | ) | (15.8 | ) | — | |||
Disposition of business | 40.8 | — | — | |||||
Domestic production activities deduction | 9.6 | — | — | |||||
Miscellaneous permanent items and nondeductible accruals | (18.0 | ) | (0.2 | ) | (0.7 | ) | ||
Research and development tax credit | 43.5 | 0.7 | (1.9 | ) | ||||
Foreign tax credits | 40.9 | 0.2 | (0.2 | ) | ||||
Valuation allowance | 106.3 | (13.4 | ) | — | ||||
Other (including foreign rate differential and FIN 48) | 42.5 | 1.3 | (1.0 | ) | ||||
Effective income tax rate | (81.9 | )% | 9.6 | % | 31.7 | % | ||
The components of deferred tax assets and liabilities are as follows:
March 31, | |||||||
2017 | 2016 | ||||||
Deferred tax assets: | |||||||
Net operating loss and other credit carryforwards | $ | 113,440 | $ | 105,731 | |||
Inventory | 92,718 | 139,006 | |||||
Accruals and reserves | 53,264 | 45,343 | |||||
Pension and other postretirement benefits | 227,487 | 252,234 | |||||
Acquired contract liabilities, net | 143,443 | 191,061 | |||||
630,352 | 733,375 | ||||||
Valuation allowance | (141,214 | ) | (157,246 | ) | |||
Net deferred tax assets | 489,138 | 576,129 | |||||
Deferred tax liabilities: | |||||||
Deferred revenue | 207,966 | 253,705 | |||||
Property and equipment | 123,250 | 140,781 | |||||
Goodwill and other intangible assets | 211,981 | 219,120 | |||||
Prepaid expenses and other | 2,236 | 6,754 | |||||
545,433 | 620,360 | ||||||
Net deferred tax liabilities | $ | 56,295 | $ | 44,231 | |||
A valuation allowance, if needed, reduces deferred tax assets to the amount expected to be realized. When determining the amount of net deferred tax assets that are more likely than not to be realized, the Company assesses all available positive and negative evidence. This evidence includes, but is not limited to, prior earnings history, expected future earnings, carry-back and carry-forward periods and the feasibility of ongoing tax strategies that could potentially enhance the likelihood of the realization of a deferred tax asset. The weight given to the positive and negative evidence is commensurate with the extent the evidence may be objectively verified. As such, it is generally difficult for positive evidence regarding projected future taxable income exclusive of reversing taxable temporary differences to outweigh objective negative evidence of recent financial reporting losses.
Based on these criteria and the relative weighting of both the positive and negative evidence available, and in particular the
82
TRIUMPH GROUP, INC.
NOTES TO CONSOLIDATED FINANCIAL STATEMENTS (Continued)
(Dollars in thousands, except per share data)
activity surrounding the Company's prior earnings history, including the forward losses and intangible impairments previously recognized, management determined that it was necessary to establish a valuation allowance against principally all of its net deferred tax assets at March 31, 2016. Given the objectivity verifiable negative evidence of a three-year cumulative loss and the weighting of all available positive evidence, the Company excluded projected taxable income (aside from reversing taxable temporary differences) from the assessment of income that could be used as a source of taxable income to realize the deferred tax assets. Valuation allowances recorded against the consolidated net deferred tax asset in fiscal 2016 were $155,774.
During the fiscal year ended March 31, 2017, the Company reduced the valuation allowance against the consolidated net deferred tax asset by $16,032. The reduction resulted from the net deferred tax liabilities generated from the current year book/tax differences and the utilization of the deferred tax assets of NOL carryforward and R&D credit carryforward. As of March 31, 2017, management determined that it was necessary to maintain a valuation allowance against principally all of its net deferred tax assets.
As of March 31, 2017, the Company has state net operating loss carryforwards of $650,734 expiring in various years through 2037. The Company also has a foreign net operating loss carryforward of $109,165.
The effective income tax rate for the fiscal year ended March 31, 2017, was (81.9)% as compared to 9.6% for the fiscal year ended March 31, 2016. The effective income tax rate for the fiscal year ended March 31, 2017, included the benefit of the R&D tax credit of $10,269, the benefit of the foreign tax credit of $9,667 and the benefit of the reduction of the valuation allowance of $25,086. The effective tax rate was also impacted by the non-deductible portion of the goodwill impairment of $93,204. Due to the current year pre-tax loss, the effective tax rate drivers on a percentage basis are amplified. Accordingly, a year over year comparison of the effective tax rate may not be indicative of changes in the Company's tax position.
The Company has been granted income tax holiday as an incentive to attract foreign investment by the Government of Thailand. The tax holidays expire in various years through 2026. We do not have any other tax holidays in the jurisdictions in which we operate. The income tax benefit attributable to the tax status of our subsidiaries in Thailand was approximately $928 or $0.02 per diluted share in fiscal 2017, $(439) or $(0.01) per diluted share in fiscal 2016 and $1,930 or $0.04 per diluted share in fiscal 2015.
At March 31, 2017, cumulative undistributed earnings of foreign subsidiaries, for which no U.S. income or foreign withholding taxes have been recorded is $74,270. As the Company currently intends to indefinitely reinvest all such earnings, no provision has been made for income taxes that may become payable upon distribution of such earnings, and it is not practicable to determine the amount of the related unrecognized deferred income tax liability.
The Company has classified uncertain tax positions as noncurrent income tax liabilities unless expected to be paid in one year. Penalties and tax-related interest expense are reported as a component of income tax expense. As of March 31, 2017 and 2016, the total amount of accrued income tax-related interest and penalties was $282 and $239, respectively.
During the fiscal years ended March 31, 2017, 2016 and 2015, the Company added $43, $32 and $4 of interest and penalties related to activity for identified uncertain tax positions, respectively.
As of March 31, 2017 and 2016, the total amount of unrecognized tax benefits was $10,266 and $9,212, respectively, all of which would impact the effective rate, if recognized. The Company anticipates that total unrecognized tax benefits may be reduced by zero in the next 12 months.
With a few exceptions, the Company is no longer subject to U.S. federal income tax examinations for fiscal years ended before March 31, 2011, state or local examinations for fiscal years ended before March 31, 2013, or foreign income tax examinations by tax authorities for fiscal years ended before March 31, 2011.
As of March 31, 2017, the Company is subject to examination in one state and no foreign jurisdictions. The Company has filed appeals in a prior state examination related to fiscal years ended March 31, 1999 through March 31, 2005. Because of net operating losses acquired as part of the acquisition of Vought, the Company is subject to U.S. federal income tax examinations and various state jurisdiction examinations for the years ended December 31, 2001, and after related to previously filed Vought tax returns. The Company believes appropriate provisions for all outstanding issues have been made for all jurisdictions and all open years.
83
TRIUMPH GROUP, INC.
NOTES TO CONSOLIDATED FINANCIAL STATEMENTS (Continued)
(Dollars in thousands, except per share data)
A reconciliation of the liability for uncertain tax positions, which are included in noncurrent liabilities for the fiscal years ended March 31, 2017 and 2016 follows:
Year ended March 31, | |||||||||||
2017 | 2016 | 2015 | |||||||||
Beginning balance | $ | 9,670 | $ | 8,826 | $ | 9,293 | |||||
Additions for tax positions related to the current year | 730 | 669 | 962 | ||||||||
Additions for tax positions of prior years | 296 | 175 | 178 | ||||||||
Reductions for tax positions of prior years | — | — | (1,607 | ) | |||||||
Ending Balance | $ | 10,696 | $ | 9,670 | $ | 8,826 | |||||
13. | STOCKHOLDERS' EQUITY |
In February 2014, the Company's Board of Directors authorized an increase in the Company's existing stock repurchase program by up to 5,000,000 shares of its common stock in addition to the 500,800 shares authorized under prior authorizations. During the fiscal year ended March 31, 2015, the Company repurchased 2,923,011 of its common stock for $184,380. As a result, as of March 31, 2017, the Company remains able to purchase an additional 2,277,789 shares. Repurchases may be made from time to time in open market transactions, block purchases, privately negotiated transactions or otherwise at prevailing prices. No time limit has been set for completion of the program.
During the fiscal year ended March 31, 2015, the Company settled the conversion of $12,834, in principal value of the Convertible Notes, as requested by the respective holders, with the principal and the conversion benefit settled in cash.
The holders of the common stock are entitled to one vote per share on all matters to be voted upon by the stockholders of Triumph.
The Company has preferred stock of $0.01 par value, 250,000 shares authorized. At March 31, 2017 and 2016, zero shares of preferred stock were outstanding.
Accumulated Other Comprehensive Loss
Changes in accumulated other comprehensive loss ("AOCI") by component for the years ended March 31, 2017 and 2016 were as follows:
Currency Translation Adjustment | Unrealized Gains and Losses on Derivative Instruments | Defined Benefit Pension Plans and Other Postretirement Benefits | Total (1) | ||||||||||||
Balance March 31, 2015 | $ | (46,751 | ) | $ | (2,757 | ) | $ | (149,402 | ) | $ | (198,910 | ) | |||
OCI before reclassifications | (12,065 | ) | (527 | ) | (127,267 | ) | (139,859 | ) | |||||||
Amounts reclassified from AOCI | — | 364 | (8,757 | ) | (2) | (8,393 | ) | ||||||||
Net current period OCI | (12,065 | ) | (163 | ) | (136,024 | ) | (148,252 | ) | |||||||
Balance March 31, 2016 | (58,816 | ) | (2,920 | ) | (285,426 | ) | (347,162 | ) | |||||||
OCI before reclassifications | (28,396 | ) | 6,582 | (16,098 | ) | (37,912 | ) | ||||||||
Amounts reclassified from AOCI | — | (1,509 | ) | (9,595 | ) | (2 | ) | (11,104 | ) | ||||||
Net current period OCI | (28,396 | ) | 5,073 | (25,693 | ) | (49,016 | ) | ||||||||
Balance March 31, 2017 | $ | (87,212 | ) | $ | 2,153 | $ | (311,119 | ) | $ | (396,178 | ) | ||||
(1) Net of tax.
(2) Includes amortization of actuarial losses and recognized prior service (credits) costs, which are included in the net periodic pension cost of which a portion is allocated to production as inventoried costs.
84
TRIUMPH GROUP, INC.
NOTES TO CONSOLIDATED FINANCIAL STATEMENTS (Continued)
(Dollars in thousands, except per share data)
14. | EARNINGS PER SHARE |
The following is a reconciliation between the weighted-average common shares outstanding used in the calculation of basic and diluted earnings per share:
Year ended March 31, | ||||||||
2017 | 2016 | 2015 | ||||||
(thousands) | ||||||||
Weighted-average common shares outstanding—basic | 49,303 | 49,218 | 50,796 | |||||
Net effect of dilutive stock options and nonvested stock | — | — | 169 | |||||
Net effect of convertible debt | — | — | 40 | |||||
Weighted-average common shares outstanding—diluted | 49,303 | 49,218 | 51,005 | |||||
15. | EMPLOYEE BENEFIT PLANS |
Defined Contribution Pension Plan
The Company sponsors a defined contribution 401(k) plan, under which salaried and certain hourly employees may defer a portion of their compensation. Eligible participants may contribute to the plan up to the allowable amount as determined by the plan of their regular compensation before taxes. The Company generally matches contributions up to 50% of the first 6% of compensation contributed by the participant. All contributions and Company matches are invested at the direction of the employee in one or more investment options offered under the plan. Company matching contributions vest immediately and aggregated $14,163, $17,462 and $20,020 for the fiscal years ended March 31, 2017, 2016 and 2015, respectively.
Defined Benefit Pension and Other Postretirement Benefit Plans
The Company sponsors several defined benefit pension plans covering some of its employees. Most employees are ineligible to participate in the plans or have ceased to accrue additional benefits under the plans. Benefits under the defined benefit plans are based on years of service and, for most non-represented employees, on average compensation for certain years. It is the Company's policy to fund at least the minimum amount required for all qualified plans, using actuarial cost methods and assumptions acceptable under applicable government regulations, by making payments into a trust separate from us.
In addition to the defined benefit pension plans, the Company provides certain health care and life insurance benefits for eligible retired employees. Such benefits are unfunded as of March 31, 2017. Employees achieve eligibility to participate in these contributory plans upon retirement from active service if they meet specified age and years of service requirements. Election to participate for some employees must be made at the date of retirement. Qualifying dependents of eligible retirees at the date of retirement are also eligible for medical coverage. Current plan documents reserve the right to amend or terminate the plans at any time, subject to applicable collective bargaining requirements for represented employees. From time to time, changes have been made to the benefits provided to various groups of plan participants. Premiums paid by the Company for most retirees for medical coverage prior to age 65 are capped and are based on years of service. Overall premiums are adjusted annually for changes in the cost of the plans as determined by an independent actuary. In addition to this medical inflation cost-sharing feature, the plans also have provisions for deductibles, co-payments, coinsurance percentages, out-of-pocket limits, schedules of reasonable fees, preferred provider networks, coordination of benefits with other plans and a Medicare carve-out.
The Company also sponsors an unfunded supplemental executive retirement plan ("SERP") that provides retirement benefits to certain key employees.
In accordance with ASC 715, the Company has recognized the funded status of the benefit obligation as of March 31, 2017 and 2015, on the accompanying Consolidated Balance Sheets. The funded status is measured as the difference between the fair value of the plans' assets and the PBO or accumulated postretirement benefit obligation of the plan. The majority of the plan assets are publicly traded investments which were valued based on the market price as of the measurement date. Investments that are not publicly traded were valued based on the estimated fair value of those investments based on our evaluation of data from fund managers and comparable market data.
85
TRIUMPH GROUP, INC.
NOTES TO CONSOLIDATED FINANCIAL STATEMENTS (Continued)
(Dollars in thousands, except per share data)
The following table sets forth the Company's consolidated defined benefit pension plans for its union and non-union employees and its SERP as of March 31, 2017 and 2016, and the amounts recorded on the Consolidated Balance Sheets at March 31, 2017 and 2016. Company contributions include amounts contributed directly to plan assets and indirectly as benefits are paid from the Company's assets. Benefit payments reflect the total benefits paid from the plans and the Company's assets. Information on the plans includes both the domestic qualified and nonqualified plans and the foreign qualified plans.
Pension Benefits | Other Postretirement Benefits | ||||||||||||||
Year ended March 31, | Year ended March 31, | ||||||||||||||
2017 | 2016 | 2017 | 2016 | ||||||||||||
Change in projected benefit obligations | |||||||||||||||
Projected benefit obligation at beginning of year | $ | 2,430,315 | $ | 2,479,319 | $ | 179,901 | $ | 239,267 | |||||||
Service cost | 6,538 | 10,902 | 716 | 1,186 | |||||||||||
Interest cost | 72,638 | 88,708 | 4,987 | 7,669 | |||||||||||
Actuarial loss (gain) | 14,104 | 37,342 | (4,865 | ) | 2,030 | ||||||||||
Plan amendments | 121 | 7,395 | — | (49,512 | ) | ||||||||||
Participant contributions | 184 | 212 | 1,379 | 2,323 | |||||||||||
Special termination benefits | — | 724 | — | — | |||||||||||
Benefits paid | (170,900 | ) | (192,652 | ) | (17,990 | ) | (23,062 | ) | |||||||
Currency translation adjustment | (6,010 | ) | (1,635 | ) | — | — | |||||||||
Projected benefit obligation at end of year | $ | 2,346,990 | $ | 2,430,315 | $ | 164,128 | $ | 179,901 | |||||||
Accumulated benefit obligation at end of year | $ | 2,336,062 | $ | 2,419,305 | $ | 164,128 | $ | 179,901 | |||||||
Assumptions used to determine benefit obligations at end of year | |||||||||||||||
Discount rate | 2.87 - 4.06% | 3.25 - 3.93% | 3.86 | % | 3.73 | % | |||||||||
Rate of compensation increase | 3.50 - 4.50% | 3.50 - 4.50% | N/A | N/A | |||||||||||
86
TRIUMPH GROUP, INC.
NOTES TO CONSOLIDATED FINANCIAL STATEMENTS (Continued)
(Dollars in thousands, except per share data)
Pension Benefits | Other Postretirement Benefits | ||||||||||||||
Year ended March 31, | Year ended March 31, | ||||||||||||||
2017 | 2016 | 2017 | 2016 | ||||||||||||
Change in fair value of plan assets | |||||||||||||||
Fair value of plan assets at beginning of year | $ | 1,925,685 | $ | 2,156,148 | $ | — | $ | — | |||||||
Actual return on plan assets | 149,103 | (39,482 | ) | — | — | ||||||||||
Settlements | — | — | — | — | |||||||||||
Participant contributions | 184 | 212 | 1,379 | 2,323 | |||||||||||
Company contributions | 2,146 | 3,021 | 16,611 | 20,739 | |||||||||||
Benefits paid | (170,900 | ) | (192,652 | ) | (17,990 | ) | (23,062 | ) | |||||||
Currency translation adjustment | (5,846 | ) | (1,562 | ) | — | — | |||||||||
Fair value of plan assets at end of year | $ | 1,900,372 | $ | 1,925,685 | $ | — | $ | — | |||||||
Funded status (underfunded) | |||||||||||||||
Funded status | $ | (446,618 | ) | $ | (504,630 | ) | $ | (164,128 | ) | $ | (179,901 | ) | |||
Reconciliation of amounts recognized in the consolidated balance sheets | |||||||||||||||
Pension asset—noncurrent | $ | 1,465 | $ | — | $ | — | $ | — | |||||||
Accrued benefit liability—current | (4,094 | ) | (3,621 | ) | (15,983 | ) | (16,246 | ) | |||||||
Accrued benefit liability—noncurrent | (443,989 | ) | (501,009 | ) | (148,145 | ) | (163,655 | ) | |||||||
Net amount recognized | $ | (446,618 | ) | $ | (504,630 | ) | $ | (164,128 | ) | $ | (179,901 | ) | |||
Reconciliation of amounts recognized in accumulated other comprehensive income | |||||||||||||||
Prior service credits | $ | (4,852 | ) | $ | (6,755 | ) | $ | (33,920 | ) | $ | (47,384 | ) | |||
Actuarial losses (gains) | 577,605 | 569,435 | (64,756 | ) | (66,480 | ) | |||||||||
Income tax (benefits) expenses related to above items | (209,696 | ) | (205,406 | ) | 36,412 | 42,016 | |||||||||
Unamortized benefit plan costs (gains) | $ | 363,057 | $ | 357,274 | $ | (62,264 | ) | $ | (71,848 | ) | |||||
87
TRIUMPH GROUP, INC.
NOTES TO CONSOLIDATED FINANCIAL STATEMENTS (Continued)
(Dollars in thousands, except per share data)
The components of net periodic benefit cost for fiscal years ended March 31, 2017, 2016 and 2015 are as follows:
Pension Benefits | Other Postretirement Benefits | ||||||||||||||||||||||
Year Ended March 31, | Year Ended March 31, | ||||||||||||||||||||||
2017 | 2016 | 2015 | 2017 | 2016 | 2015 | ||||||||||||||||||
Components of net periodic pension cost | |||||||||||||||||||||||
Service cost | $ | 6,538 | $ | 10,902 | $ | 12,902 | $ | 716 | $ | 1,186 | $ | 2,868 | |||||||||||
Interest cost | 72,638 | 88,708 | 90,576 | 4,987 | 7,669 | 12,332 | |||||||||||||||||
Expected return on plan assets | (155,991 | ) | (162,285 | ) | (150,565 | ) | — | — | — | ||||||||||||||
Amortization of prior service credit cost | (1,782 | ) | (4,038 | ) | (5,288 | ) | (13,464 | ) | (10,810 | ) | (4,529 | ) | |||||||||||
Amortization of net loss | 12,115 | 9,488 | — | (6,588 | ) | (6,106 | ) | — | |||||||||||||||
Curtailment gain | — | (1,968 | ) | — | — | — | — | ||||||||||||||||
Special termination benefits | — | 724 | — | — | — | — | |||||||||||||||||
Total net periodic benefit (income) expense | $ | (66,482 | ) | $ | (58,469 | ) | $ | (52,375 | ) | $ | (14,349 | ) | $ | (8,061 | ) | $ | 10,671 | ||||||
Assumptions used to determine net periodic pension cost | |||||||||||||||||||||||
Discount rate | 3.25 - 3.93% | 3.31 - 4.11% | 3.73 | % | 3.73 | % | 3.66 | % | 4.14 | % | |||||||||||||
Expected long-term rate on assets | 6.50 - 8.00% | 6.50 - 8.25% | N/A | N/A | N/A | N/A | |||||||||||||||||
Rate of compensation increase | 3.50 - 4.50% | 3.50 - 4.50% | N/A | N/A | N/A | N/A | |||||||||||||||||
The discount rate is determined annually as of each measurement date, based on a review of yield rates associated with long-term, high-quality corporate bonds. At the end of each year, the discount rate is primarily determined using the results of bond yield curve models based on a portfolio of high-quality bonds matching notional cash inflows with the expected benefit payments for each significant benefit plan.
The expected return on plan assets is determined based on a market-related value of plan assets, which is a smoothed asset value. The market-related value of assets is calculated by recognizing investment performance that is different from that expected on a straight-line basis over five years. Actuarial gains and losses are amortized over the average remaining life expectancy of inactive participants for plans that are predominantly inactive and over the expected future service for active participants for other plans, but only to the extent unrecognized gains or losses exceed a corridor equal to 10% of the greater of the projected benefit obligation or market-related value of assets.
During the fourth quarter of the fiscal year ended March 31, 2016, the Company changed the method it uses to estimate the service and interest components of net periodic benefit cost for the Company’s pension and other postretirement benefit plans. This new estimation approach discounts the individual expected cash flows underlying the service cost and interest cost by applying the specific spot rates derived from the yield curve used to discount the cash flows reflected in the measurement of the benefit obligation. Historically, the Company estimated these service and interest cost components utilizing a single weighted-average discount rate derived from the yield curve used to measure the benefit obligation at the beginning of the period.
The Company made this change to provide a more precise measurement of service and interest costs by improving the correlation between projected benefit cash flows to the corresponding spot yield curve rates. The Company has accounted for this change as a change in accounting estimate that is inseparable from a change in accounting principle pursuance to ASC 250, Accounting Changes and Error Corrections and accordingly have accounted for it prospectively. While the benefit obligation measured under this approach is unchanged from that determined under the prior approach, the more granular application of the spot rates reduced the service and interest cost for the pension and OPEB plans for the fiscal year ending March 31, 2017, by approximately $20,000. The spot rates used to determine service and interest costs the U.S. plans ranged from 0.60% to 9.75%. Under the Company’s prior methodology, these rates would have resulted in weighted-average rates for service cost and interest
88
TRIUMPH GROUP, INC.
NOTES TO CONSOLIDATED FINANCIAL STATEMENTS (Continued)
(Dollars in thousands, except per share data)
cost of 3.86% for the U.S. Pension plans and 3.73% for the OPEB plans. The new approach was used to measure the service cost and interest cost for our pension and OPEB plans beginning with the fiscal year ending March 31, 2017.
Effective April 1, 2015, the Company changed the period over which actuarial gains and losses are being amortized for its U.S. pension plans from the average remaining future service period of active plan participants to the average life expectancy of inactive plan participants. This change was made because the Company has determined that as of that date almost all plan participants are inactive.
During the fiscal year ended March 31, 2017, the Society of Actuaries released new mortality tables that reflect increased life expectancy for participants of U.S. pension plans. The Company has reflected these new tables, along with an updated projection scale of mortality improvements, in the measurement of our U.S. pension and other postretirement benefit plans as of March 31, 2017. This change resulted in a decrease in the benefit obligation.
The Company periodically experiences events or makes changes to its benefit plans that result in curtailment or special charges. Curtailments are recognized when events occur that significantly reduce the expected years of future service of present employees or eliminates the benefits for a significant number of employees for some or all of their future service.
Curtailment losses are recognized when it is probable the curtailment will occur and the effects are reasonably estimable. Curtailment gains are recognized when the related employees are terminated or a plan amendment is adopted, whichever is applicable.
As required under ASC 715, the Company remeasures plan assets and obligations during an interim period whenever a significant event occurs that results in a material change in the net periodic pension cost. The determination of significance is based on judgment and consideration of events and circumstances impacting the pension costs.
The following summarizes the key events whose effects on net periodic benefit cost and obligations are included in the tables above:
• | In March 2016, one of the Company's union-represented groups of employees ratified a new collective bargaining agreement. The agreement includes an amendment to the other postretirement benefits plan, for which participants will no longer receive a benefit after the fiscal year ended March 31, 2016. This change resulted in the termination of the plan and as a result, the plan's liability was eliminated as of March 31, 2016 and the Company recognized a credit of approximately $2,297. Additionally, the agreement includes an amendment to the pension plan, under which participants will no longer continue to accrue a benefit after the fiscal year ending March 31, 2021. This change resulted in a curtailment gain of approximately $1,516 and is presented on the accompanying Consolidated Statements of Operations within "Curtailments, settlements and early retirement incentives." |
• | In February 2016, one of the Company's union-represented groups of employees ratified a new collective bargaining agreement. The agreement includes an amendment to the pension plan, under which effective January 1, 2017, actively accruing participants will no longer accrue benefits once they reach 30 years of service under the plan. This change resulted in a curtailment gain of approximately $3,314 and is presented on the accompanying Consolidated Statements of Operations within "Curtailments, settlements and early retirement incentives." |
• | In May 2015 and February 2016 the Company offered enhanced retirement benefits to employees of one of its union-represented groups. In order to receive these enhanced benefits, eligible employees had to agree to retire within a special window period. This change resulted in a special termination charge of approximately $724 and is presented on the accompanying Consolidated Statements of Operations within "Curtailments, settlements and early retirement incentives." |
• | In April 2015, the Company's largest union-represented group of employees ratified a new collective bargaining agreement. The agreement includes an amendment to the pension plan, under which participants will no longer accrue benefits after 30 years of service under the plan. This change resulted in a curtailment gain of approximately $2,863 and is presented on the accompanying Consolidated Statements of Operations within "Curtailments, settlements and early retirement incentives." |
89
TRIUMPH GROUP, INC.
NOTES TO CONSOLIDATED FINANCIAL STATEMENTS (Continued)
(Dollars in thousands, except per share data)
The following table shows those amounts expected to be recognized in net periodic benefit costs during the fiscal year ending March 31, 2018:
Pension Benefits | Other Postretirement Benefits | ||||||
Amounts expected to be recognized in FY 2018 net periodic benefit costs | |||||||
Prior service credit | $ | (2,841 | ) | $ | (9,312 | ) | |
Actuarial loss | $ | (13,909 | ) | $ | (7,099 | ) | |
Expected Pension Benefit Payments
The total estimated future benefit payments for the pension plans are expected to be paid from the plan assets and company funds. The other postretirement plan benefit payments reflect the Company's portion of the funding. Estimated future benefit payments from plan assets and Company funds for the next ten years are as follows:
Year | Pension Benefits | Other Postretirement Benefits* | |||||
2018 | $ | 177,231 | $ | 16,099 | |||
2019 | 170,971 | 15,757 | |||||
2020 | 167,975 | 15,161 | |||||
2021 | 164,999 | 14,578 | |||||
2022 | 162,048 | 13,860 | |||||
2022 - 2026 | 763,380 | 56,777 | |||||
* Net of expected Medicare Part D subsidies of $690 to $730 per year.
Plan Assets, Investment Policy and Strategy
The table below sets forth the Company's target asset allocation for fiscal 2017 and the actual asset allocations at March 31, 2017 and 2016.
Actual Allocation | |||||||
Target Allocation | |||||||
March 31, | |||||||
Asset Category | Fiscal 2016 | 2017 | 2016 | ||||
Equity securities | 40 - 50% | 48 | % | 48 | % | ||
Fixed income securities | 40 - 50% | 47 | 48 | ||||
Alternative investment funds | 0 - 10% | 5 | 4 | ||||
Total | 100 | % | 100 | % | |||
Pension plan assets are invested in various asset classes that are expected to produce a sufficient level of diversification and investment return over the long-term. The investment goals are to exceed the assumed actuarial rate of return over the long-term within reasonable and prudent levels of risks and to meet future obligations.
Asset/liability studies are conducted on a regular basis to provide guidance in setting investment goals for the pension portfolio and its asset allocation. The asset allocation aims to prudently achieve a strong, risk-adjusted return while seeking to minimize funding level volatility and improve the funded status of the plans. The pension plans currently employ a liability-driven investment ("LDI") approach, where assets and liabilities move in the same direction. The goal is to limit the volatility of the funding status and cover part, but not all, of the changes in liabilities. Most of the liabilities' changes are due to interest rate movements.
To balance expected risk and return, allocation targets are established and monitored against acceptable ranges. All investment policies and procedures are designed to ensure that the plans' investments are in compliance with the Employee Retirement Income Security Act of 1974 ("ERISA"). Guidelines are established defining permitted investments within each asset class. Each investment manager has contractual guidelines to ensure that investments are made within the parameters of
90
TRIUMPH GROUP, INC.
NOTES TO CONSOLIDATED FINANCIAL STATEMENTS (Continued)
(Dollars in thousands, except per share data)
their asset class or in the case of multi-asset class managers, the parameters of their multi-asset class strategy. Certain investments are not permitted at any time, including investment directly in employer securities and uncovered short sales.
The tables below provide the fair values of the Company's plan assets at March 31, 2017 and 2016, by asset category. The table also identifies the level of inputs used to determine the fair value of assets in each category (see Note 2 for definition of levels).
March 31, 2017 | |||||||||||||||
Level 1 | Level 2 | Level 3 | Total | ||||||||||||
Assets | |||||||||||||||
Cash and cash equivalents | $ | 25,537 | $ | 3,343 | $ | — | $ | 28,880 | |||||||
Equity securities | |||||||||||||||
International | 173,898 | — | — | 173,898 | |||||||||||
U.S. equity | 68,454 | — | — | 68,454 | |||||||||||
U.S. commingled fund | 548,760 | — | — | 548,760 | |||||||||||
International commingled fund | 44,330 | 8,605 | — | 52,935 | |||||||||||
Fixed income securities | |||||||||||||||
Corporate bonds | — | 27,273 | — | 27,273 | |||||||||||
Government securities | — | 149,295 | — | 149,295 | |||||||||||
U.S. commingled fund | 597,340 | — | — | 597,340 | |||||||||||
International commingled fund | 10,028 | 3,651 | — | 13,679 | |||||||||||
Other fixed income | — | 5,644 | — | 5,644 | |||||||||||
Other | |||||||||||||||
Insurance contracts | — | — | 1,173 | 1,173 | |||||||||||
Total investment in securities—assets | $ | 1,468,347 | $ | 197,811 | $ | 1,173 | $ | 1,667,331 | |||||||
US equity commingled fund | 5,475 | ||||||||||||||
International equity commingled fund | 54,512 | ||||||||||||||
Government fixed income securities | 1,262 | ||||||||||||||
US fixed income commingled fund | 85,682 | ||||||||||||||
International fixed income commingled fund | 5,828 | ||||||||||||||
Private equity and infrastructure | 76,200 | ||||||||||||||
Other | 1,564 | ||||||||||||||
Total investment measured at NAV as a practical expedient | $ | 230,523 | |||||||||||||
Receivables | 2,623 | ||||||||||||||
Payables | (105 | ) | |||||||||||||
Total plan assets | $ | 1,900,372 | |||||||||||||
91
TRIUMPH GROUP, INC.
NOTES TO CONSOLIDATED FINANCIAL STATEMENTS (Continued)
(Dollars in thousands, except per share data)
March 31, 2016 | |||||||||||||||
Level 1 | Level 2 | Level 3 | Total | ||||||||||||
Assets | |||||||||||||||
Cash and cash equivalents | $ | 24,302 | $ | 3,151 | $ | — | $ | 27,453 | |||||||
Equity securities | |||||||||||||||
International | 162,168 | — | — | 162,168 | |||||||||||
U.S. equity | 78,155 | — | — | 78,155 | |||||||||||
U.S. commingled fund | 570,500 | — | — | 570,500 | |||||||||||
International commingled fund | 44,613 | 7,416 | — | 52,029 | |||||||||||
Fixed income securities | |||||||||||||||
Corporate bonds | — | 25,121 | — | 25,121 | |||||||||||
Government securities | — | 158,228 | — | 158,228 | |||||||||||
U.S. commingled fund | 622,605 | — | — | 622,605 | |||||||||||
International commingled fund | 9,555 | 3,146 | — | 12,701 | |||||||||||
Other fixed income | — | 7,286 | — | 7,286 | |||||||||||
Other | |||||||||||||||
Private equity and infrastructure | — | — | — | — | |||||||||||
Insurance contracts | — | — | 1,349 | 1,349 | |||||||||||
Total investment in securities—assets | $ | 1,511,898 | $ | 204,348 | $ | 1,349 | $ | 1,717,595 | |||||||
US equity commingled fund | 5,226 | ||||||||||||||
International equity commingled fund | 45,751 | ||||||||||||||
Government fixed income securities | 1,204 | ||||||||||||||
US fixed income commingled fund | 74,447 | ||||||||||||||
International fixed income commingled fund | 5,563 | ||||||||||||||
Private equity and infrastructure | 71,571 | ||||||||||||||
Other | 1,493 | ||||||||||||||
Total investment measured at NAV as a practical expedient | $ | 205,255 | |||||||||||||
Receivables | 3,249 | ||||||||||||||
Payables | (414 | ) | |||||||||||||
Total plan assets | $ | 1,925,685 | |||||||||||||
Cash equivalents and other short-term investments are primarily held in registered short-term investment vehicles which are valued using a market approach based on quoted market prices of similar instruments.
Public equity securities, including common stock, are primarily valued using a market approach based on the closing fair market prices of identical instruments in the principal market on which they are traded. Commingled funds that are open-ended mutual funds for which the fair value per share is determined and published by the respective mutual fund sponsor and is the basis for current observable transactions are categorized as Level 1 fair value measures.
Investments in commingled funds and private equity and infrastructure funds are carried at NAV as a practical expedient to estimate fair value. The NAV is the total value of the fund divided by the number of shares outstanding. Adjustments to NAV, if any, are determined based on evaluation of data provided by fund managers, including valuation of the underlying investments derived using inputs such as cost, operating results, discounted future cash flows and market-based comparable data. In accordance with Subtopic 820-10, investments that are measured at NAV practical expedient are not classified in the fair value hierarchy; however, their fair value amounts are presented in these tables to permit reconciliation of the fair value hierarchy to the total plan assets disclosed in this footnote.
92
TRIUMPH GROUP, INC.
NOTES TO CONSOLIDATED FINANCIAL STATEMENTS (Continued)
(Dollars in thousands, except per share data)
Corporate, government agency bonds and mortgage-backed securities are primarily valued using a market approach with inputs that include broker quotes, benchmark yields, base spreads and reported observable trades for identical or comparable instruments.
Other investments include private equity and infrastructure funds and insurance contracts. Investments in private equity and infrastructure funds are carried at estimated fair value based on NAV as a practical expedient and other appropriate adjustments to NAV as determined based on an evaluation of data provided by fund managers, including valuations of the underlying investments derived using inputs such as cost, operating results, discounted future cash flows, and market-based comparable data.
The following table represents a rollforward of the balances of our pension plan assets that are valued using Level 3 inputs:
March 31, 2016, Balance | Acquisitions | Net Purchases (Sales) | Net Realized Appreciation (Depreciation) | Net Unrealized Appreciation (Depreciation) | March 31, 2017, Balance | ||||||||||||||||||
Insurance contracts | 1,349 | — | — | — | (176 | ) | 1,173 | ||||||||||||||||
Total | $ | 1,349 | $ | — | $ | — | $ | — | $ | (176 | ) | $ | 1,173 | ||||||||||
March 31, 2015, Balance | Acquisitions | Net Purchases (Sales) | Net Realized Appreciation (Depreciation) | Net Unrealized Appreciation (Depreciation) | March 31, 2016, Balance | ||||||||||||||||||
Insurance contracts | 920 | — | — | — | 429 | 1,349 | |||||||||||||||||
Total | $ | 920 | $ | — | $ | — | $ | — | $ | 429 | $ | 1,349 | |||||||||||
Assumptions and Sensitivities
The discount rate is determined as of each measurement date, based on a review of yield rates associated with long-term, high-quality corporate bonds. The calculation separately discounts benefit payments using the spot rates from a long-term, high-quality corporate bond yield curve.
The effect of a 25 basis-point change in discount rates as of March 31, 2017, is shown below:
Pension Benefits | Other Postretirement Benefits | |||||||
Increase of 25 basis points | ||||||||
Obligation | * | $ | (60,500 | ) | $ | (3,173 | ) | |
Net periodic expense | 57 | (226 | ) | |||||
Decrease of 25 basis points | ||||||||
Obligation | * | $ | 63,300 | $ | 3,298 | |||
Net periodic expense | 65 | 234 | ||||||
* Excludes impact to plan assets due to the LDI investment approach discussed above under "Plan Assets, Investment Policy and Strategy."
The long-term rate of return assumption represents the expected average rate of earnings on the funds invested to provide for the benefits included in the benefit obligations. The long-term rate of return assumption is determined based on a number of factors, including historical market index returns, the anticipated long-term asset allocation of the plans, historical plan return data, plan expenses and the potential to outperform market index returns. For fiscal 2017, the expected long-term rate of return on assets was 6.50 - 8.00%. For fiscal 2018, the expected long-term rate of return is 6.50 - 8.00%.
A significant factor used in estimating future per capita cost of covered health care benefits for our retirees and us is the health care cost trend rate assumption. The rate used at March 31, 2017, was 6.40% and is assumed to decrease gradually to 4.50% by fiscal 2027 and remain at that level thereafter. The effect of a one-percentage-point change in the healthcare cost trend rate in each year is shown below:
93
TRIUMPH GROUP, INC.
NOTES TO CONSOLIDATED FINANCIAL STATEMENTS (Continued)
(Dollars in thousands, except per share data)
Other Postretirement Benefits | |||||||
One-Percentage- Point Increase | One-Percentage- Point Decrease | ||||||
Net periodic expense | $ | 407 | $ | (157 | ) | ||
Obligation | 6,601 | (5,987 | ) | ||||
Anticipated Contributions to Defined Benefit Plans
Assuming a normal retirement age of 65, the Company does not expect to contribute to its defined benefit pension plans and expects to $16,099 to its OPEB during fiscal 2018. No plan assets are expected to be returned to the Company in fiscal 2018.
16. | STOCK COMPENSATION PLANS |
The Company has stock incentive plans under which employees and non-employee directors may be granted equity awards to acquire shares of the Company's common stock at the fair value at the time of the grant. The stock incentive and compensation plans under which outstanding equity awards have been granted to employees, officers and non-employee directors are the Triumph Group 2013 Equity and Cash Incentive Plan (the “2013 Plan”), the 2016 Directors’ Equity Compensation Plan, as amended (the “Directors’ Plan”), the Triumph Group 2004 Stock Incentive Plan (the “2004 Plan”), and the Amended and Restated Directors’ Stock Incentive Plan (the “Prior Directors’ Plan”). No new awards have been made under the 2004 Plan after the 2013 Plan was approved by the Board and the stockholders. The Prior Directors’ Plan expired by its terms during fiscal 2017. The current stock incentive and compensation plans used for future awards are the 2013 Plan for employees, officers and consultants, and the Directors’ Plan, provided, that the Directors’ Plan remains subject to stockholder approval at the 2017 annual meeting. In addition, in April 2016, the Board approved a separate employment inducement plan under which stock options and restricted stock awards were granted to Daniel J. Crowley as new hire and retention awards (the “Crowley Plan”). The 2013 Plan, the Directors’ Plan, the 2004 Plan and the Prior Directors’ Plan are collectively referred to in this note as the plans.
Since fiscal 2006, the management and compensation committee has utilized restricted stock and restricted stock units as its primary form of share-based incentive compensation. The restricted shares are subject to forfeiture should the grantee's employment be terminated prior to the third or fourth anniversary of the date of grant, and are included in capital in excess of par value. Restricted shares generally vest in full after three or four years. The fair value of restricted shares under the Company's restricted stock plans is determined by the product of the number of shares granted and the grant date market price of the Company's common stock. Most of these awards contain performance conditions, in addition to service conditions. The fair value of restricted shares is expensed on a straight-line basis over the requisite service period of three or four years.
The Company recognized $7,922, $2,657 and $1,272 of share-based compensation expense during the fiscal years ended March 31, 2017, 2016 and 2015, respectively. The total income tax benefit recognized for share-based compensation arrangements for fiscal years ended March 31, 2017, 2016 and 2015, was $2,851, $930 and $445, respectively.
A summary of the Company's stock option activity and related information for its option plans for the fiscal year ended March 31, 2017, was as follows:
Options | Weighted- Average Exercise Price per share | Weighted- Average Remaining Contractual Term (in Years) | Aggregate Intrinsic Value | |||||||||
Outstanding at March 31, 2016 | — | $ | — | |||||||||
Granted | 150,000 | 30.86 | ||||||||||
Outstanding at March 31, 2017 | 150,000 | $ | 30.86 | 9 | $ | 94 | ||||||
During the fiscal year ended March 31, 2016, the balance of then outstanding stock options expired. The intrinsic value of stock options exercised during the fiscal year ended March 31, 2015 was $2,234.
At March 31, 2017 and 2016, 4,355,185 shares and 5,006,109 shares of common stock, respectively, were available for issuance under the plans. A summary of the status of the Company's nonvested shares/units of restricted stock and deferred stock units as of March 31, 2017, and changes during the fiscal year ended March 31, 2017, is presented below:
94
TRIUMPH GROUP, INC.
NOTES TO CONSOLIDATED FINANCIAL STATEMENTS (Continued)
(Dollars in thousands, except per share data)
Shares | Weighted- Average Grant Date Fair Value | |||||
Nonvested restricted awards and deferred stock units at March 31, 2016 | 169,891 | $ | 57.88 | |||
Granted | 502,081 | 33.70 | ||||
Vested | (57,902 | ) | 66.47 | |||
Forfeited | (1,157 | ) | 65.08 | |||
Nonvested restricted awards and deferred stock units at March 31, 2017 | 612,913 | $ | 37.24 | |||
The fair value of restricted stock which vested during fiscal 2017 was $1,967. The tax benefit from vested restricted stock was $182, $96 and $673 during the fiscal years ended March 31, 2017, 2016 and 2015, respectively. The weighted-average grant date fair value of share-based grants in the fiscal years ended March 31, 2017, 2016 and 2015, was $33.70, $63.68 and $64.44, respectively. Expected future compensation expense on restricted stock net of expected forfeitures, is approximately $9,534, which is expected to be recognized over the remaining weighted-average vesting period of 2.3 years.
During the fiscal years ended March 31, 2016 and 2015, 15,200 and 8,800 deferred stock units were granted to the non-employee members of the Board of Directors, respectively, under the prior Directors' Plan. Each deferred stock unit represents the contingent right to receive one share of the Company's common stock. The deferred stock units vest over a three or four-year period and the shares of common stock underlying vested deferred stock units will be delivered on January 1 of the year following the year in which the non-employee director terminates service as a Director of the Company.
During fiscal 2017, 45,315 restricted stock units were granted to the non-employee members of the Board of Directors’ under the Directors’ Plan. Each restricted stock unit represents the contingent right to receive one share of the Company’s common stock. The restricted stock units vest on the first anniversary of the date of grant. The restricted stock unit awards are subject to approval by the stockholders of the Directors’ Plan at the 2017 annual meeting; if such approval is not obtained, the awards will be void.
17. | COMMITMENTS AND CONTINGENCIES |
On December 22, 2016, Triumph Aerostructures, LLC, a wholly owned subsidiary of the Company (“Triumph Aerostructures”), initiated litigation against Bombardier, Inc. (“Bombardier”) in the Quebec Superior Court, District of Montreal. The lawsuit related to Bombardier’s failure to pay to Triumph Aerostructures certain non-recurring expenses incurred by Triumph Aerostructures during the development phase of a program pursuant to which Triumph Aerostructures agreed to design, manufacture, and supply the wing and related components for Bombardier’s Global 7000 business aircraft.
In May 2017, Triumph Aerostructures and Bombardier entered into a comprehensive settlement agreement that resolves all outstanding commercial disputes between them, including all pending litigation, related to the design, manufacture and supply of wing components for Bombardier’s Global 7000 business aircraft. The settlement resets the commercial relationship between the companies and allows each company to better achieve its business objectives going forward.
Other
Certain of the Company's business operations and facilities are subject to a number of federal, state, local and foreign environmental laws and regulations. Former owners generally indemnify the Company for environmental liabilities related to the assets and businesses acquired which existed prior to the acquisition dates. In the opinion of management, there are no significant environmental contingent liabilities which would have a material effect on the financial condition or operating results of the Company which are not covered by such indemnification.
The Company's risk related to pension projected obligations as of March 31, 2017, is significant. This amount is currently in excess of the related plan assets. Benefit plan assets are invested in a diversified portfolio of investments in both the equity and debt categories, as well as limited investments in real estate and other alternative investments. The market value of all of these investment categories may be adversely affected by external events and the movements and volatility in the financial markets, including such events as the current credit and real estate market conditions. Declines in the market values of our plan assets could expose the total asset balance to significant risk which may cause an increase to future funding requirements. The Company's potential risk related to OPEB projected obligations as of March 31, 2017, is also significant.
Some raw materials and operating supplies are subject to price and supply fluctuations caused by market dynamics. The Company's strategic sourcing initiatives seek to find ways of mitigating the inflationary pressures of the marketplace. In recent years, these inflationary pressures have affected the market for raw materials. However, the Company believes that raw
95
TRIUMPH GROUP, INC.
NOTES TO CONSOLIDATED FINANCIAL STATEMENTS (Continued)
(Dollars in thousands, except per share data)
material prices will remain stable through the remainder of fiscal 2018 and after that, experience increases that are in line with inflation. Additionally, the Company generally does not employ forward contracts or other financial instruments to hedge commodity price risk.
The Company's suppliers' failure to provide acceptable raw materials, components, kits and subassemblies would adversely affect production schedules and contract profitability. The Company maintains an extensive qualification and performance surveillance system to control risk associated with such supply base reliance. The Company is dependent on third parties for certain information technology services. To a lesser extent, the Company is also exposed to fluctuations in the prices of certain utilities and services, such as electricity, natural gas, chemical processing and freight. The Company utilizes a range of long-term agreements and strategic aggregated sourcing to optimize procurement expense and supply risk in these categories.
In the ordinary course of business, the Company is involved in disputes, claims and lawsuits with employees, suppliers and customers, as well as governmental and regulatory inquiries, that it deems to be immaterial. Some may involve claims or potential claims of substantial damages, fines, penalties or injunctive relief. While the Company cannot predict the outcome of any pending or future litigation or proceeding and no assurances can be given, the Company does not believe that any pending matter will have a material effect, individually or in the aggregate, on its financial position or results of operations.
18. | RESTRUCTURING COSTS |
During the fiscal year ended March 31, 2017, the Company committed to a restructuring of certain of its businesses as well as the consolidation of certain of its facilities ("2017 Restructuring Plan"). The Company expects to reduce its footprint by approximately 1.0 million square feet and to reduce head count by 100 employees. Over the next few fiscal years, the Company estimates that it will record aggregate pre-tax charges of $55,000 to $60,000 related to these programs, which represent employee termination benefits, contract termination costs, accelerated depreciation and facility closure and other exit costs, and will result in future cash outlays.
During the fiscal year ended March 31, 2016, the Company committed to a restructuring of certain of its businesses as well as the consolidation of certain of its facilities ("2016 Restructuring Plan"). The Company expects to reduce its footprint by approximately 3.5 million square feet and to reduce head count by 1,200 employees. Over the next few fiscal years, the Company estimates that it will record aggregate pre-tax charges of $140,000 to $150,000 related to these programs, which represent employee termination benefits, contract termination costs, accelerated depreciation and facility closure and other exit costs, and will result in future cash outlays.
The following table provides a summary of the Company's current aggregate cost estimates by major type of expense associated with the restructuring plans noted above:
Type of expense | Total estimated amount expected to be incurred | |||
Termination benefits | $ | 21,000 | ||
Facility closure and other exit costs (1) | 44,000 | |||
Contract termination costs | 18,000 | |||
Accelerated depreciation charges (2) | 37,000 | |||
Other (3) | 89,000 | |||
$ | 209,000 | |||
(1) Includes costs to transfer product lines among facilities and outplacement and employee relocation costs.
(2) Accelerated depreciation charges are recorded as part of Depreciation and amortization on the Consolidated Statement of Operations.
(3) Consists of other costs directly related to the plan, including project management, legal and regulatory costs.
The restructuring charges recognized by type and by segment consisted of the following:
96
TRIUMPH GROUP, INC.
NOTES TO CONSOLIDATED FINANCIAL STATEMENTS (Continued)
(Dollars in thousands, except per share data)
Fiscal year ended March 31, 2017 | ||||||||||||||||||
Integrated Systems | Aerospace Structures | Precision Components | Product Support | Corporate | Total | |||||||||||||
Termination benefits | $ | 1,449 | $ | 250 | $ | 1,419 | $ | 147 | $ | — | $ | 3,265 | ||||||
Facility closure and other exit costs | — | 1,648 | 3,637 | 526 | — | 5,811 | ||||||||||||
Other | 49 | 6,775 | 3,801 | 280 | 22,196 | 33,101 | ||||||||||||
Total restructuring | 1,498 | 8,673 | 8,857 | 953 | 22,196 | 42,177 | ||||||||||||
Depreciation and amortization | 732 | — | 9,886 | 180 | — | 10,798 | ||||||||||||
Total | $ | 2,230 | $ | 8,673 | $ | 18,743 | $ | 1,133 | $ | 22,196 | $ | 52,975 | ||||||
Fiscal year ended March 31, 2016 | ||||||||||||||||||
Integrated Systems | Aerospace Structures | Precision Components | Product Support | Corporate | Total | |||||||||||||
Termination benefits | $ | 100 | $ | 6,496 | $ | 5,246 | $ | 397 | $ | 4,061 | $ | 16,300 | ||||||
Facility closure and other exit costs | — | 12,908 | 1,387 | — | — | 14,295 | ||||||||||||
Other | — | — | — | — | 5,587 | 5,587 | ||||||||||||
Total restructuring | 100 | 19,404 | 6,633 | 397 | 9,648 | 36,182 | ||||||||||||
Depreciation and amortization | 46 | 1,741 | 10,442 | 145 | — | 12,374 | ||||||||||||
Included in Cost of sales: | ||||||||||||||||||
Contract termination costs | — | 12,100 | — | — | — | 12,100 | ||||||||||||
Accelerated depreciation | — | 10,018 | — | — | — | 10,018 | ||||||||||||
Other | — | 2,037 | 8,245 | — | — | 10,282 | ||||||||||||
Total | $ | 146 | $ | 45,300 | $ | 25,320 | $ | 542 | $ | 9,648 | $ | 80,956 | ||||||
Termination benefits include employee retention, severance and benefit payments for terminated employees. Facility closure costs include general operating costs incurred subsequent to production shutdown as well as equipment relocation and other associated costs. Contract termination costs include costs associated with terminating existing leases and supplier agreements. Other costs include legal, outplacement and employee relocation costs, and other employee-related costs.
Relocation to Red Oak
During the fiscal year ended March 31, 2013, the Company committed to relocate the operations of its largest facility in Dallas, Texas and to expand its Red Oak, Texas ("Red Oak") facility to accommodate this relocation. The Company incurred approximately $86,640 in capital expenditures during the fiscal years ended March 31, 2014, associated with this plan. The Company incurred $3,193 and $31,290 of moving expenses related to the relocation during the fiscal year ended March 31, 2015 and 2014, shown separately on the Consolidated Statements of Operations. The relocation was substantially completed during the fiscal year ended March 31, 2014.
19. | CUSTOMER CONCENTRATION |
Trade accounts receivable from The Boeing Company ("Boeing") represented approximately 5% and 18% of total accounts receivable as of March 31, 2017 and 2016, respectively. The Company had no other significant concentrations of credit risk.
Sales to Boeing for fiscal 2017 were $1,243,981, or 35% of net sales, of which $209,669, $575,623, $428,452 and $30,237 were from Integrated Systems, Aerospace Structures, Precision Components and Product Support, respectively. Sales to Boeing for fiscal 2016 were $1,472,641, or 38% of net sales, of which $199,826, $906,488, $331,229 and $35,098 were from Integrated Systems, Aerospace Structures, Precision Components and Product Support, respectively. Sales to Boeing for fiscal
97
TRIUMPH GROUP, INC.
NOTES TO CONSOLIDATED FINANCIAL STATEMENTS (Continued)
(Dollars in thousands, except per share data)
2015 were $1,634,367, or 42% of net sales, of which $160,907, $1,046,564, $395,616 and $31,280 were from Integrated Systems, Aerospace Structures, Precision Components and Product Support, respectively.
Sales to Gulfstream for fiscal 2017 were $440,998, or 12% of net sales, of which $1,881, $426,879, $12,001 and $237 were from Integrated Systems, Aerospace Structures, Precision Components and Product Support, respectively. Sales to Gulfstream for fiscal 2016 were $476,327, or 12% of net sales, of which $3,492, $465,791, $6,836 and $208 were from Integrated Systems, Aerospace Structures, Precision Components and Product Support, respectively. Sales to Gulfstream for fiscal 2015 were $338,719, or 9% of net sales, of which $3,745, $325,622, $9,326 and $26 were from Integrated Systems, Aerospace Structures, Precision Components and Product Support, respectively.
No other single customer accounted for more than 10% of the Company's net sales; however, the loss of any significant customer, including Boeing and/or Gulfstream, could have a material adverse effect on the Company and its operating subsidiaries.
The Company currently generates a majority of its revenue from clients in the commercial aerospace industry, the business jet industry and the military. The Company's growth and financial results are largely dependent on continued demand for its products and services from clients in these industries. If any of these industries experiences a downturn, clients in these sectors may conduct less business with the Company.
20. | COLLECTIVE BARGAINING AGREEMENTS |
Approximately 12% of the Company's labor force is covered under collective bargaining agreements. As of March 31, 2017, approximately 5% of the Company's collectively bargained workforce are working under contracts that have expired or are set to expire within one year.
The collective bargaining agreement with our union employees with International Association of Machinists and Aerospace Workers ("IAM") District 751 at our Spokane, Washington facility expired May 11, 2016, subsequently, the Company settled the strike and agreed to a new collective bargaining agreement with its union employees with IAM District 751, resulting in a charge of $15,700 due to disruption costs.
21. | SEGMENTS |
The Company reports financial performance based on the following four reportable segments: Integrated Systems, Aerospace Structures, Precision Components and Product Support. The Company's CODM utilizes Adjusted EBITDA as a primary measure of profitability to evaluate performance of its segments and allocate resources.
Integrated Systems consists of the Company’s operations that provides integrated solutions including design, development and support of proprietary components, subsystems and systems, as well as production of complex assemblies using external designs. Capabilities include hydraulic, mechanical and electro-mechanical actuation, power and control; a complete suite of aerospace gearbox solutions including engine accessory gearboxes and helicopter transmissions; active and passive heat exchange technology; fuel pumps, fuel metering units and Full Authority Digital Electronic Control fuel systems; hydro-mechanical and electromechanical primary and secondary flight controls; and a broad spectrum of surface treatment options.
Aerospace Structures consists of the Company’s operations that supply commercial, business, regional and military manufacturers with large metallic and composite structures. Products include wings, wing boxes, fuselage panels, horizontal and vertical tails and sub-assemblies such as floor grids. Inclusive of most of the former Vought Aircraft Division, Aerospace Structures also has the capability to engineer detailed structural designs in metal and composites.
Precision Components consists of the Company’s operations that produce close-tolerance parts primarily to customer designs and model-based definition, including a wide range of aluminum, hard metal and composite structure capabilities. Capabilities include complex machining, gear manufacturing, sheet metal fabrication, forming, advanced composite and interior structures, joining processes such as welding, autoclave bonding and conventional mechanical fasteners and a variety of special processes including: super plastic titanium forming, aluminum and titanium chemical milling and surface treatments.
Product Support consists of the Company’s operations that provides full life cycle solutions for commercial, regional and military aircraft. The Company’s extensive product and service offerings include full post-delivery value chain services that simplify the MRO supply chain. Through its line maintenance, component MRO and postproduction supply chain activities, Product Support is positioned to provide integrated planeside repair solutions globally. Capabilities include fuel tank repair,
98
TRIUMPH GROUP, INC.
NOTES TO CONSOLIDATED FINANCIAL STATEMENTS (Continued)
(Dollars in thousands, except per share data)
metallic and composite aircraft structures, nacelles, thrust reversers, interiors, auxiliary power units and a wide variety of pneumatic, hydraulic, fuel and mechanical accessories.
Segment Adjusted EBITDA is total segment revenue reduced by operating expenses (less depreciation and amortization) identifiable with that segment. Corporate includes general corporate administrative costs and any other costs not identifiable with one of the Company's segments, including restructuring of $22,196 for the fiscal year ended March 31, 2017.
Effective April 2016, the Company announced that it is realigning into four business units to better meet the evolving needs of its customers. The new structure better supports our go-to-market strategies and will allow us to more effectively satisfy the needs of our customers while continuing to deliver on our commitments, accelerate organic growth and drive predictable profitability.
The Company does not accumulate net sales information by product or service or groups of similar products and services, and therefore the Company does not disclose net sales by product or service because to do so would be impracticable.
Selected financial information for each reportable segment and the reconciliation of Adjusted EBITDA to operating income before interest is as follows:
Year Ended March 31, | |||||||||||
2017 | 2016 | 2015 | |||||||||
Net sales: | |||||||||||
Integrated Systems | $ | 1,040,805 | $ | 1,094,703 | $ | 1,014,267 | |||||
Aerospace Structures | 1,294,865 | 1,550,850 | 1,521,635 | ||||||||
Precision Components | 987,919 | 1,061,607 | 1,161,592 | ||||||||
Product Support | 338,325 | 311,394 | 304,013 | ||||||||
Elimination of inter-segment sales | (129,115 | ) | (132,482 | ) | (112,785 | ) | |||||
$ | 3,532,799 | $ | 3,886,072 | $ | 3,888,722 | ||||||
(Loss) income before income taxes: | |||||||||||
Operating (loss) income: | |||||||||||
Integrated Systems | $ | 201,294 | $ | 220,649 | $ | 183,558 | |||||
Aerospace Structures | (108,811 | ) | (1,354,640 | ) | (25,257 | ) | |||||
Precision Components | 18,322 | 75,734 | 146,726 | ||||||||
Product Support | 55,801 | 24,977 | 47,931 | ||||||||
Corporate | (109,717 | ) | (57,826 | ) | 81,715 | ||||||
56,889 | (1,091,106 | ) | 434,673 | ||||||||
Interest expense and other | 80,501 | 68,041 | 85,379 | ||||||||
$ | (23,612 | ) | $ | (1,159,147 | ) | $ | 349,294 | ||||
Depreciation and amortization: | |||||||||||
Integrated Systems | $ | 40,332 | $ | 42,086 | $ | 37,528 | |||||
Aerospace Structures | 72,227 | 63,916 | 63,492 | ||||||||
Precision Components | 53,889 | 59,102 | 46,476 | ||||||||
Product Support | 9,037 | 11,009 | 8,559 | ||||||||
Corporate | 1,461 | 1,642 | 2,268 | ||||||||
$ | 176,946 | $ | 177,755 | $ | 158,323 | ||||||
Impairment charge of intangible assets: | |||||||||||
Integrated Systems | $ | — | $ | 400 | $ | — | |||||
Aerospace Structures | 266,298 | 873,961 | — | ||||||||
$ | 266,298 | $ | 874,361 | $ | — | ||||||
99
TRIUMPH GROUP, INC.
NOTES TO CONSOLIDATED FINANCIAL STATEMENTS (Continued)
(Dollars in thousands, except per share data)
Year Ended March 31, | |||||||||||
2017 | 2016 | 2015 | |||||||||
Amortization of acquired contract liabilities, net: | |||||||||||
Integrated Systems | $ | 36,760 | $ | 41,585 | $ | 37,014 | |||||
Aerospace Structures | 81,805 | 87,524 | 33,704 | ||||||||
Precision Components | 2,439 | 3,254 | 5,015 | ||||||||
$ | 121,004 | $ | 132,363 | $ | 75,733 | ||||||
Adjusted EBITDA: | |||||||||||
Integrated Systems | $ | 204,866 | $ | 213,056 | $ | 184,072 | |||||
Aerospace Structures | 147,909 | (493,787 | ) | 4,531 | |||||||
Precision Components | 69,772 | 133,152 | 188,187 | ||||||||
Product Support | 64,838 | 37,886 | 56,490 | ||||||||
Corporate | (89,132 | ) | (57,428 | ) | (50,710 | ) | |||||
$ | 398,253 | $ | (167,121 | ) | $ | 382,570 | |||||
Year Ended March 31, | |||||||||||
2017 | 2016 | 2015 | |||||||||
Capital expenditures: | |||||||||||
Integrated Systems | $ | 16,487 | $ | 28,142 | $ | 26,434 | |||||
Aerospace Structures | 14,607 | 27,596 | 27,829 | ||||||||
Precision Components | 15,827 | 20,623 | 49,191 | ||||||||
Product Support | 2,630 | 2,700 | 5,645 | ||||||||
Corporate | 2,281 | 986 | 905 | ||||||||
$ | 51,832 | $ | 80,047 | $ | 110,004 | ||||||
March 31, | |||||||
2017 | 2016 | ||||||
Total Assets: | |||||||
Integrated Systems | $ | 1,281,828 | $ | 1,371,178 | |||
Aerospace Structures | 1,548,239 | 1,792,805 | |||||
Precision Components | 1,262,691 | 1,297,886 | |||||
Product Support | 284,231 | 350,674 | |||||
Corporate | 37,611 | 22,550 | |||||
$ | 4,414,600 | $ | 4,835,093 | ||||
During fiscal years ended March 31, 2017, 2016 and 2015, the Company had foreign sales of $768,703, $797,976 and $753,075, respectively. The Company reports as foreign sales those sales with delivery points outside of the United States. As of March 31, 2017 and 2016, the Company had foreign long-lived assets of $315,224 and $346,924, respectively.
100
TRIUMPH GROUP, INC.
NOTES TO CONSOLIDATED FINANCIAL STATEMENTS (Continued)
(Dollars in thousands, except per share data)
22. | SELECTED CONSOLIDATING FINANCIAL STATEMENTS OF PARENT, GUARANTORS AND NON-GUARANTORS |
The 2021 Notes and the 2022 Notes are fully and unconditionally guaranteed on a joint and several basis by Guarantor Subsidiaries. The total assets, stockholder's equity, revenue, earnings and cash flows from operating activities of the Guarantor Subsidiaries exceeded a majority of the consolidated total of such items as of and for the periods reported. The only consolidated subsidiaries of the Company that are not guarantors of the 2021 Notes and the 2022 Notes (the "Non-Guarantor Subsidiaries") are: (i) the receivables securitization special purpose entity, and (ii) the foreign operating subsidiaries. The following tables present condensed consolidating financial statements including Triumph Group, Inc. (the "Parent"), the Guarantor Subsidiaries, and the Non-Guarantor Subsidiaries. Such financial statements include balance sheets as of March 31, 2017 and 2016, statements of operations and comprehensive income for the fiscal years ended March 31, 2017, 2016 and 2015, and statements of cash flows for the fiscal years ended March 31, 2017, 2016 and 2015.
SUMMARY CONSOLIDATING BALANCE SHEETS:
March 31, 2017 | |||||||||||||||||||
Parent | Guarantor Subsidiaries | Non-Guarantor Subsidiaries | Eliminations | Consolidated Total | |||||||||||||||
Current assets: | |||||||||||||||||||
Cash and cash equivalents | $ | 19,942 | $ | 24,137 | $ | 25,554 | $ | — | $ | 69,633 | |||||||||
Trade and other receivables, net | 546 | 34,874 | 276,372 | — | 311,792 | ||||||||||||||
Inventories | — | 1,243,461 | 96,714 | — | 1,340,175 | ||||||||||||||
Prepaid expenses and other | 7,763 | 11,678 | 10,623 | — | 30,064 | ||||||||||||||
Assets held for sale | — | 3,250 | 18,005 | — | 21,255 | ||||||||||||||
Total current assets | 28,251 | 1,317,400 | 427,268 | — | 1,772,919 | ||||||||||||||
Property and equipment, net | 8,315 | 673,153 | 123,562 | — | 805,030 | ||||||||||||||
Goodwill and other intangible assets, net | — | 1,560,050 | 174,919 | — | 1,734,969 | ||||||||||||||
Other, net | 17,902 | 67,955 | 15,825 | — | 101,682 | ||||||||||||||
Intercompany investments and advances | 2,057,534 | 81,541 | 77,090 | (2,216,165 | ) | — | |||||||||||||
Total assets | $ | 2,112,002 | $ | 3,700,099 | $ | 818,664 | $ | (2,216,165 | ) | $ | 4,414,600 | ||||||||
Current liabilities: | |||||||||||||||||||
Current portion of long-term debt | $ | 33,298 | $ | 14,432 | $ | 112,900 | $ | — | $ | 160,630 | |||||||||
Accounts payable | 17,291 | 426,646 | 37,306 | — | 481,243 | ||||||||||||||
Accrued expenses | 53,829 | 578,457 | 42,093 | — | 674,379 | ||||||||||||||
Liabilities related to assets held for sale | — | — | 18,008 | — | 18,008 | ||||||||||||||
Total current liabilities | 104,418 | 1,019,535 | 210,307 | — | 1,334,260 | ||||||||||||||
Long-term debt, less current portion | 974,693 | 60,977 | — | — | 1,035,670 | ||||||||||||||
Intercompany debt | 178,381 | 1,754,529 | 370,907 | (2,303,817 | ) | — | |||||||||||||
Accrued pension and other postretirement benefits, noncurrent | 6,633 | 585,501 | — | — | 592,134 | ||||||||||||||
Deferred income taxes and other | 1,403 | 564,358 | 40,302 | — | 606,063 | ||||||||||||||
Total stockholders' equity | 846,474 | (284,801 | ) | 197,148 | 87,652 | 846,473 | |||||||||||||
Total liabilities and stockholders' equity | $ | 2,112,002 | $ | 3,700,099 | $ | 818,664 | $ | (2,216,165 | ) | $ | 4,414,600 | ||||||||
101
TRIUMPH GROUP, INC.
NOTES TO CONSOLIDATED FINANCIAL STATEMENTS (Continued)
(Dollars in thousands, except per share data)
SUMMARY CONSOLIDATING BALANCE SHEETS:
March 31, 2016 | |||||||||||||||||||
Parent | Guarantor Subsidiaries | Non-Guarantor Subsidiaries | Eliminations | Consolidated Total | |||||||||||||||
Current assets: | |||||||||||||||||||
Cash and cash equivalents | $ | 1,544 | $ | 201 | $ | 19,239 | $ | — | $ | 20,984 | |||||||||
Trade and other receivables, net | 2,057 | 127,968 | 314,183 | — | 444,208 | ||||||||||||||
Inventories | — | 1,127,275 | 108,915 | — | 1,236,190 | ||||||||||||||
Prepaid and other | 6,524 | 26,433 | 8,302 | — | 41,259 | ||||||||||||||
Total current assets | 10,125 | 1,281,877 | 450,639 | — | 1,742,641 | ||||||||||||||
Property and equipment, net | 7,324 | 746,455 | 135,955 | — | 889,734 | ||||||||||||||
Goodwill and other intangible assets, net | — | 1,898,401 | 195,465 | — | 2,093,866 | ||||||||||||||
Other, net | 11,878 | 76,262 | 20,712 | — | 108,852 | ||||||||||||||
Intercompany investments and advances | 2,301,054 | 81,540 | 82,930 | (2,465,524 | ) | — | |||||||||||||
Total assets | $ | 2,330,381 | $ | 4,084,535 | $ | 885,701 | $ | (2,465,524 | ) | $ | 4,835,093 | ||||||||
Current liabilities: | |||||||||||||||||||
Current portion of long-term debt | $ | 28,473 | $ | 13,968 | $ | — | $ | — | $ | 42,441 | |||||||||
Accounts payable | 11,154 | 346,602 | 52,469 | — | 410,225 | ||||||||||||||
Accrued expenses | 44,856 | 599,921 | 38,431 | — | 683,208 | ||||||||||||||
Total current liabilities | 84,483 | 960,491 | 90,900 | — | 1,135,874 | ||||||||||||||
Long-term debt, less current portion | 1,120,570 | 63,009 | 191,300 | — | 1,374,879 | ||||||||||||||
Intercompany debt | 171,480 | 1,972,729 | 330,176 | (2,474,385 | ) | — | |||||||||||||
Accrued pension and other postretirement benefits, noncurrent | 7,315 | 654,201 | 3,148 | — | 664,664 | ||||||||||||||
Deferred income taxes and other | 11,589 | 658,873 | 54,270 | — | 724,732 | ||||||||||||||
Total stockholders' equity | 934,944 | (224,768 | ) | 215,907 | 8,861 | 934,944 | |||||||||||||
Total liabilities and stockholders' equity | $ | 2,330,381 | $ | 4,084,535 | $ | 885,701 | $ | (2,465,524 | ) | $ | 4,835,093 | ||||||||
102
TRIUMPH GROUP, INC.
NOTES TO CONSOLIDATED FINANCIAL STATEMENTS (Continued)
(Dollars in thousands, except per share data)
CONDENSED CONSOLIDATING STATEMENTS OF OPERATIONS AND COMPREHENSIVE (LOSS) INCOME:
Fiscal year ended March 31, 2017 | |||||||||||||||||||
Parent | Guarantor Subsidiaries | Non-Guarantor Subsidiaries | Eliminations | Consolidated Total | |||||||||||||||
Net sales | $ | — | $ | 3,229,136 | $ | 379,960 | $ | (76,297 | ) | $ | 3,532,799 | ||||||||
Operating costs and expenses: | |||||||||||||||||||
Cost of sales | — | 2,462,270 | 303,845 | (76,297 | ) | 2,689,818 | |||||||||||||
Selling, general and administrative | 66,822 | 182,805 | 31,920 | — | 281,547 | ||||||||||||||
Depreciation and amortization | 1,461 | 158,757 | 16,728 | — | 176,946 | ||||||||||||||
Impairment of intangible assets | — | 266,298 | — | — | 266,298 | ||||||||||||||
Restructuring | 22,196 | 19,076 | 905 | — | 42,177 | ||||||||||||||
Loss on divestitures | 19,124 | — | — | — | 19,124 | ||||||||||||||
109,603 | 3,089,206 | 353,398 | (76,297 | ) | 3,475,910 | ||||||||||||||
Operating (loss) income | (109,603 | ) | 139,930 | 26,562 | — | 56,889 | |||||||||||||
Intercompany interest and charges | (183,115 | ) | 174,240 | 8,875 | — | — | |||||||||||||
Interest expense and other | 75,483 | 11,689 | (6,671 | ) | — | 80,501 | |||||||||||||
Loss (income) from continuing operations, before income taxes | (1,971 | ) | (45,999 | ) | 24,358 | — | (23,612 | ) | |||||||||||
Income tax expense (benefit) | 23,729 | (8,962 | ) | 4,573 | — | 19,340 | |||||||||||||
Net (loss) income | (25,700 | ) | (37,037 | ) | 19,785 | — | (42,952 | ) | |||||||||||
Other comprehensive income (loss) | 5,073 | (25,693 | ) | (28,396 | ) | — | (49,016 | ) | |||||||||||
Total comprehensive loss | $ | (20,627 | ) | $ | (62,730 | ) | $ | (8,611 | ) | $ | — | $ | (91,968 | ) | |||||
103
TRIUMPH GROUP, INC.
NOTES TO CONSOLIDATED FINANCIAL STATEMENTS (Continued)
(Dollars in thousands, except per share data)
CONDENSED CONSOLIDATING STATEMENTS OF OPERATIONS AND COMPREHENSIVE (LOSS) INCOME:
Fiscal year ended March 31, 2016 | |||||||||||||||||||
Parent | Guarantor Subsidiaries | Non-Guarantor Subsidiaries | Eliminations | Consolidated Total | |||||||||||||||
Net sales | $ | — | $ | 3,577,733 | $ | 369,954 | $ | (61,615 | ) | $ | 3,886,072 | ||||||||
Operating costs and expenses: | |||||||||||||||||||
Cost of sales | — | 3,343,038 | 315,876 | (61,615 | ) | 3,597,299 | |||||||||||||
Selling, general and administrative | 43,969 | 206,815 | 36,565 | — | 287,349 | ||||||||||||||
Depreciation and amortization | 1,642 | 154,740 | 21,373 | — | 177,755 | ||||||||||||||
Restructuring charge | 10,347 | 25,835 | — | — | 36,182 | ||||||||||||||
Legal settlement gain, net | — | 5,476 | — | — | 5,476 | ||||||||||||||
Impairment charge | — | 874,361 | — | — | 874,361 | ||||||||||||||
Curtailments, settlements and early retirement incentives | (1,244 | ) | — | — | — | (1,244 | ) | ||||||||||||
54,714 | 4,610,265 | 373,814 | (61,615 | ) | 4,977,178 | ||||||||||||||
Operating loss | (54,714 | ) | (1,032,532 | ) | (3,860 | ) | — | (1,091,106 | ) | ||||||||||
Intercompany interest and charges | (206,998 | ) | 194,188 | 12,810 | — | — | |||||||||||||
Interest expense and other | 60,950 | 10,239 | (3,148 | ) | — | 68,041 | |||||||||||||
Income (loss) from continuing operations, before income taxes | 91,334 | (1,236,959 | ) | (13,522 | ) | — | (1,159,147 | ) | |||||||||||
Income tax expense (benefit) | 17,161 | (132,648 | ) | 4,300 | — | (111,187 | ) | ||||||||||||
Net income (loss) | 74,173 | (1,104,311 | ) | (17,822 | ) | — | (1,047,960 | ) | |||||||||||
Other comprehensive loss | (163 | ) | (136,024 | ) | (12,065 | ) | — | (148,252 | ) | ||||||||||
Total comprehensive income (loss) | $ | 74,010 | $ | (1,240,335 | ) | $ | (29,887 | ) | $ | — | $ | (1,196,212 | ) | ||||||
104
TRIUMPH GROUP, INC.
NOTES TO CONSOLIDATED FINANCIAL STATEMENTS (Continued)
(Dollars in thousands, except per share data)
CONDENSED CONSOLIDATING STATEMENTS OF OPERATIONS AND COMPREHENSIVE INCOME (LOSS):
Fiscal year ended March 31, 2015 | |||||||||||||||||||
Parent | Guarantor Subsidiaries | Non-Guarantor Subsidiaries | Eliminations | Consolidated Total | |||||||||||||||
Net sales | $ | — | $ | 3,592,062 | $ | 320,907 | $ | (24,247 | ) | $ | 3,888,722 | ||||||||
Operating costs and expenses: | |||||||||||||||||||
Cost of sales | — | 2,900,408 | 265,292 | (24,247 | ) | 3,141,453 | |||||||||||||
Selling, general and administrative | 50,562 | 199,569 | 35,642 | — | 285,773 | ||||||||||||||
Depreciation and amortization | 2,269 | 141,561 | 14,493 | — | 158,323 | ||||||||||||||
Restructuring charge | — | 3,193 | — | — | 3,193 | ||||||||||||||
Legal settlement gain, net | (134,693 | ) | — | — | — | (134,693 | ) | ||||||||||||
(81,862 | ) | 3,244,731 | 315,427 | (24,247 | ) | 3,454,049 | |||||||||||||
Operating income | 81,862 | 347,331 | 5,480 | — | 434,673 | ||||||||||||||
Intercompany interest and charges | (205,075 | ) | 196,394 | 8,681 | — | — | |||||||||||||
Interest expense and other | 85,555 | 10,438 | (10,614 | ) | — | 85,379 | |||||||||||||
Income from continuing operations, before income taxes | 201,382 | 140,499 | 7,413 | — | 349,294 | ||||||||||||||
Income tax expense (benefit) | 58,049 | 54,359 | (1,811 | ) | — | 110,597 | |||||||||||||
Income from continuing operations | 143,333 | 86,140 | 9,224 | — | 238,697 | ||||||||||||||
Net income | 143,333 | 86,140 | 9,224 | — | 238,697 | ||||||||||||||
Other comprehensive loss | (4,253 | ) | (128,800 | ) | (46,949 | ) | — | (180,002 | ) | ||||||||||
Total comprehensive income (loss) | $ | 139,080 | $ | (42,660 | ) | $ | (37,725 | ) | $ | — | $ | 58,695 | |||||||
105
TRIUMPH GROUP, INC.
NOTES TO CONSOLIDATED FINANCIAL STATEMENTS (Continued)
(Dollars in thousands, except per share data)
CONDENSED CONSOLIDATING STATEMENTS OF CASH FLOWS:
Fiscal year ended March 31, 2017 | |||||||||||||||||||
Parent | Guarantor Subsidiaries | Non-Guarantor Subsidiaries | Eliminations | Consolidated Total | |||||||||||||||
Net (loss) income | $ | (25,700 | ) | $ | (37,037 | ) | $ | 19,785 | $ | — | $ | (42,952 | ) | ||||||
Adjustments to reconcile net (loss) income to net cash provided by operating activities | 36,295 | 260,469 | 12,443 | 15,267 | 324,474 | ||||||||||||||
Net cash provided by operating activities | 10,595 | 223,432 | 32,228 | 15,267 | 281,522 | ||||||||||||||
Capital expenditures | (2,281 | ) | (37,436 | ) | (12,115 | ) | — | (51,832 | ) | ||||||||||
Proceeds from sale of assets and businesses | 45,288 | 23,316 | 17,583 | — | 86,187 | ||||||||||||||
Cash used for businesses and intangible assets acquired | — | 9 | — | — | 9 | ||||||||||||||
Net cash provided by (used in) investing activities | 43,007 | (14,111 | ) | 5,468 | — | 34,364 | |||||||||||||
Net decrease in revolving credit facility | (110,000 | ) | — | — | — | (110,000 | ) | ||||||||||||
Proceeds on issuance of debt | — | — | 24,400 | — | 24,400 | ||||||||||||||
Retirements and repayments of debt | (28,473 | ) | (12,871 | ) | (102,800 | ) | — | (144,144 | ) | ||||||||||
Payments of deferred financing costs | (14,034 | ) | — | — | — | (14,034 | ) | ||||||||||||
Dividends paid | (7,927 | ) | — | — | — | (7,927 | ) | ||||||||||||
Repayment of governmental grant | — | (14,570 | ) | — | — | (14,570 | ) | ||||||||||||
Repurchase of restricted shares for minimum tax obligation | (182 | ) | — | — | — | (182 | ) | ||||||||||||
Intercompany financing and advances | 125,412 | (157,944 | ) | 47,799 | (15,267 | ) | — | ||||||||||||
Net cash used in financing activities | (35,204 | ) | (185,385 | ) | (30,601 | ) | (15,267 | ) | (266,457 | ) | |||||||||
Effect of exchange rate changes on cash and cash equivalents | — | — | (780 | ) | — | (780 | ) | ||||||||||||
Net change in cash and cash equivalents | 18,398 | 23,936 | 6,315 | — | 48,649 | ||||||||||||||
Cash and cash equivalents at beginning of year | 1,544 | 201 | 19,239 | — | 20,984 | ||||||||||||||
Cash and cash equivalents at end of year | $ | 19,942 | $ | 24,137 | $ | 25,554 | $ | — | $ | 69,633 | |||||||||
106
TRIUMPH GROUP, INC.
NOTES TO CONSOLIDATED FINANCIAL STATEMENTS (Continued)
(Dollars in thousands, except per share data)
CONDENSED CONSOLIDATING STATEMENTS OF CASH FLOWS:
Fiscal year ended March 31, 2016 | |||||||||||||||||||
Parent | Guarantor Subsidiaries | Non-Guarantor Subsidiaries | Eliminations | Consolidated Total | |||||||||||||||
Net income (loss) | $ | 74,173 | $ | (1,104,311 | ) | $ | (17,822 | ) | $ | — | $ | (1,047,960 | ) | ||||||
Adjustments to reconcile net income (loss) to net cash (used in)provided by operating activities | (106,837 | ) | 1,207,850 | 24,629 | 6,181 | 1,131,823 | |||||||||||||
Net cash (used in) provided by operating activities | (32,664 | ) | 103,539 | 6,807 | 6,181 | 83,863 | |||||||||||||
Capital expenditures | (986 | ) | (57,503 | ) | (21,558 | ) | — | (80,047 | ) | ||||||||||
Proceeds from sale of assets and businesses | — | 5,877 | 192 | — | 6,069 | ||||||||||||||
Cash used for businesses and intangible assets acquired | — | (48,051 | ) | (6,000 | ) | — | (54,051 | ) | |||||||||||
Net cash used in investing activities | (986 | ) | (99,677 | ) | (27,366 | ) | — | (128,029 | ) | ||||||||||
Net increase in revolving credit facility | (8,256 | ) | — | — | — | (8,256 | ) | ||||||||||||
Proceeds on issuance of debt | — | 6,497 | 128,300 | — | 134,797 | ||||||||||||||
Retirements and repayments of debt | (19,024 | ) | (24,893 | ) | (37,000 | ) | — | (80,917 | ) | ||||||||||
Payments of deferred financing costs | (185 | ) | — | — | — | (185 | ) | ||||||||||||
Dividends paid | (7,889 | ) | — | — | — | (7,889 | ) | ||||||||||||
Repayment of governmental grant | — | (5,000 | ) | — | — | (5,000 | ) | ||||||||||||
Repurchase of restricted shares for minimum tax obligation | (96 | ) | — | — | — | (96 | ) | ||||||||||||
Intercompany financing and advances | 70,024 | 19,316 | (83,159 | ) | (6,181 | ) | — | ||||||||||||
Net cash provided by (used in) financing activities | 34,574 | (4,080 | ) | 8,141 | (6,181 | ) | 32,454 | ||||||||||||
Effect of exchange rate changes on cash and cash equivalents | — | — | 79 | — | 79 | ||||||||||||||
Net change in cash and cash equivalents | 924 | (218 | ) | (12,339 | ) | — | (11,633 | ) | |||||||||||
Cash and cash equivalents at beginning of year | 620 | 419 | 31,578 | — | 32,617 | ||||||||||||||
Cash and cash equivalents at end of year | $ | 1,544 | $ | 201 | $ | 19,239 | $ | — | $ | 20,984 | |||||||||
107
TRIUMPH GROUP, INC.
NOTES TO CONSOLIDATED FINANCIAL STATEMENTS (Continued)
(Dollars in thousands, except per share data)
CONDENSED CONSOLIDATING STATEMENTS OF CASH FLOWS:
Fiscal year ended March 31, 2015 | |||||||||||||||||||
Parent | Guarantor Subsidiaries | Non-Guarantor Subsidiaries | Eliminations | Consolidated Total | |||||||||||||||
Net income | $ | 143,333 | $ | 86,140 | $ | 9,224 | $ | — | $ | 238,697 | |||||||||
Adjustments to reconcile net income to net cash provided by operating activities | (154,295 | ) | 397,607 | (25,590 | ) | 10,913 | 228,635 | ||||||||||||
Net cash (used in) provided by operating activities | (10,962 | ) | 483,747 | (16,366 | ) | 10,913 | 467,332 | ||||||||||||
Capital expenditures | (905 | ) | (92,686 | ) | (16,413 | ) | — | (110,004 | ) | ||||||||||
Reimbursements of capital expenditures | — | 653 | — | — | 653 | ||||||||||||||
Proceeds from sale of assets and businesses | — | 3,092 | 75 | — | 3,167 | ||||||||||||||
Cash used for businesses and intangible assets acquired | — | 112,110 | (73,829 | ) | — | 38,281 | |||||||||||||
Net cash (used in) provided by investing activities | (905 | ) | 23,169 | (90,167 | ) | — | (67,903 | ) | |||||||||||
Net increase in revolving credit facility | (46,150 | ) | — | — | — | (46,150 | ) | ||||||||||||
Proceeds on issuance of debt | 300,000 | 37,660 | 171,300 | — | 508,960 | ||||||||||||||
Retirements and repayments of debt | (401,232 | ) | (20,928 | ) | (233,700 | ) | — | (655,860 | ) | ||||||||||
Purchase of common stock | (184,380 | ) | — | — | — | (184,380 | ) | ||||||||||||
Payments of deferred financing costs | (6,487 | ) | — | — | — | (6,487 | ) | ||||||||||||
Dividends paid | (8,100 | ) | — | — | — | (8,100 | ) | ||||||||||||
Proceeds from governmental grant | — | (3,198 | ) | — | — | (3,198 | ) | ||||||||||||
Repurchase of restricted shares for minimum tax obligation | (673 | ) | — | — | — | (673 | ) | ||||||||||||
Proceeds from exercise of stock options, including excess tax benefit | 720 | — | — | — | 720 | ||||||||||||||
Intercompany financing and advances | 355,969 | (521,180 | ) | 176,124 | (10,913 | ) | — | ||||||||||||
Net cash provided by (used in) financing activities | 9,667 | (507,646 | ) | 113,724 | (10,913 | ) | (395,168 | ) | |||||||||||
Effect of exchange rate changes on cash and cash equivalents | — | — | (642 | ) | — | (642 | ) | ||||||||||||
Net change in cash and cash equivalents | (2,200 | ) | (730 | ) | 6,549 | — | 3,619 | ||||||||||||
Cash and cash equivalents at beginning of year | 2,820 | 1,149 | 25,029 | — | 28,998 | ||||||||||||||
Cash and cash equivalents at end of year | $ | 620 | $ | 419 | $ | 31,578 | $ | — | $ | 32,617 | |||||||||
108
TRIUMPH GROUP, INC.
NOTES TO CONSOLIDATED FINANCIAL STATEMENTS (Continued)
(Dollars in thousands, except per share data)
23. | QUARTERLY FINANCIAL INFORMATION (UNAUDITED) |
Fiscal 2017 | Fiscal 2016 | ||||||||||||||||||||||||||||||
June 30 | Sept. 30 | Dec. 31 | Mar. 31 (5) | June 30 | Sept. 30 | Dec. 31 (3) | Mar. 31 (4) | ||||||||||||||||||||||||
BUSINESS SEGMENT SALES | |||||||||||||||||||||||||||||||
Integrated Systems | $ | 257,356 | $ | 245,367 | $ | 256,080 | $ | 282,002 | $ | 258,571 | $ | 261,481 | $ | 271,849 | $ | 302,802 | |||||||||||||||
Aerospace Structures | 331,596 | 320,283 | 304,235 | 338,751 | 395,120 | 385,471 | 346,639 | 423,620 | |||||||||||||||||||||||
Precision Components | 254,602 | 259,458 | 226,294 | 247,565 | 265,141 | 265,825 | 250,284 | 280,357 | |||||||||||||||||||||||
Product Support | 84,199 | 85,826 | 87,292 | 81,008 | 74,745 | 73,777 | 78,127 | 84,745 | |||||||||||||||||||||||
Inter-segment Elimination | (34,500 | ) | (36,165 | ) | (29,038 | ) | (29,412 | ) | (33,939 | ) | (31,780 | ) | (33,033 | ) | (33,730 | ) | |||||||||||||||
TOTAL SALES | $ | 893,253 | $ | 874,769 | $ | 844,863 | $ | 919,914 | $ | 959,638 | $ | 954,774 | $ | 913,866 | $ | 1,057,794 | |||||||||||||||
GROSS PROFIT (1) | $ | 136,836 | $ | 171,427 | $ | 162,001 | $ | 256,929 | $ | 201,732 | $ | 197,742 | $ | 195,405 | $ | (420,767 | ) | ||||||||||||||
OPERATING INCOME (LOSS) | |||||||||||||||||||||||||||||||
Integrated Systems | $ | 47,986 | $ | 45,797 | $ | 51,596 | $ | 55,915 | $ | 50,557 | $ | 51,100 | $ | 52,321 | $ | 66,671 | |||||||||||||||
Aerospace Structures | 9,163 | 24,867 | 23,867 | (166,708 | ) | 41,798 | 36,682 | (210,938 | ) | (1,222,182 | ) | ||||||||||||||||||||
Precision Components | (7,782 | ) | 12,063 | 2,942 | 11,099 | 24,905 | 25,457 | 24,106 | 1,266 | ||||||||||||||||||||||
Product Support | 14,059 | 14,265 | 14,662 | 12,815 | 9,987 | 9,125 | 12,402 | (6,537 | ) | ||||||||||||||||||||||
Corporate | (16,700 | ) | (26,506 | ) | (37,901 | ) | (28,610 | ) | (19,381 | ) | (12,317 | ) | (4,141 | ) | (21,987 | ) | |||||||||||||||
TOTAL OPERATING INCOME (LOSS) | $ | 46,726 | $ | 70,486 | $ | 55,166 | $ | (115,489 | ) | $ | 107,866 | $ | 110,047 | (126,250 | ) | $ | (1,182,769 | ) | |||||||||||||
NET INCOME (LOSS) | $ | 19,734 | $ | 34,807 | $ | 29,332 | $ | (126,825 | ) | $ | 62,732 | $ | 61,612 | (88,649 | ) | $ | (1,083,655 | ) | |||||||||||||
Basic Earnings (Loss) per share | $ | 0.40 | $ | 0.71 | $ | 0.59 | $ | (2.57 | ) | $ | 1.28 | $ | 1.25 | $ | (1.80 | ) | $ | (22.01 | ) | ||||||||||||
Diluted Earnings (Loss) per share (2) | $ | 0.40 | $ | 0.70 | $ | 0.59 | $ | (2.57 | ) | $ | 1.27 | $ | 1.25 | $ | (1.80 | ) | $ | (22.01 | ) | ||||||||||||
* | Difference due to rounding. |
(1) | Gross profit includes depreciation. |
(2) | The sum of the diluted earnings per share for the four quarters does not necessarily equal the total year diluted earnings per share due to the dilutive effect of the potential common shares related to the convertible debt. |
(3) | Includes the results of Fairchild from October 21, 2015 (date of acquisition) through March 31, 2016 and impairment of intangible assets of $229,200. |
(4) | Includes impairment of intangible assets of $645,161, forward losses on the Bombardier and 747-8 programs of $131,400 and restructuring of $80,956. |
(5) | Includes impairment of goodwill of $266,298 in Aerospace Structures. |
109
TRIUMPH GROUP, INC.
SCHEDULE II—VALUATION AND QUALIFYING ACCOUNTS
(Dollars in thousands)
Balance at beginning of year | Additions charged to expense | Additions(1) | (Deductions)(2) | Balance at end of year | |||||||||||||
For year ended March 31, 2017: | |||||||||||||||||
Allowance for doubtful accounts receivable | $ | 6,492 | 202 | 307 | (2,442 | ) | $ | 4,559 | |||||||||
For year ended March 31, 2016: | |||||||||||||||||
Allowance for doubtful accounts receivable | $ | 6,475 | 2,028 | (47 | ) | (1,964 | ) | $ | 6,492 | ||||||||
For year ended March 31, 2015: | |||||||||||||||||
Allowance for doubtful accounts receivable | $ | 6,535 | 171 | 85 | (316 | ) | $ | 6,475 | |||||||||
(1) | Additions consist of trade and other receivable recoveries and miscellaneous adjustments. |
(2) | Deductions represent write-offs of related account balances. |
Item 9. | Changes in and Disagreements With Accountants on Accounting and Financial Disclosure |
None.
Item 9A. | Controls and Procedures |
Evaluation of Disclosure Controls and Procedures
We maintain disclosure controls and procedures that are designed to ensure that information required to be disclosed in our Exchange Act reports is recorded, processed, summarized and reported within the time periods specified in the SEC's rules and forms, and that such information is accumulated and communicated to our management, including our principal executive officer and principal financial officer, as appropriate, to allow timely decisions regarding required disclosure. In designing and evaluating the disclosure controls and procedures, management recognized that any controls and procedures, no matter how well designed and operated, can provide only reasonable assurance of achieving the desired control objectives, and management necessarily was required to apply its judgment in evaluating the cost-benefit relationship of possible controls and procedures.
As of March 31, 2017, we completed an evaluation, under the supervision and with the participation of our management, including our principal executive officer and principal financial officer, of the effectiveness of the design and operation of our disclosure controls and procedures. Based on the foregoing, our principal executive officer and principal financial officer concluded that our disclosure controls and procedures were effective at the reasonable assurance level as of March 31, 2017.
110
MANAGEMENT'S REPORT ON INTERNAL CONTROL OVER FINANCIAL REPORTING
The management of Triumph Group, Inc. ("Triumph") is responsible for establishing and maintaining adequate internal control over financial reporting as defined in Rules 13a-15(f) and 15d-15(f) under the Securities Exchange Act of 1934. Triumph's internal control system over financial reporting is designed to provide reasonable assurance regarding the reliability of financial reporting and the preparation of financial statements for external purposes in accordance with U.S. generally accepted accounting principles. The Company's internal control over financial reporting includes those policies and procedures that:
(i) | pertain to the maintenance of records that, in reasonable detail, accurately and fairly reflect the transactions and dispositions of the assets of the company; |
(ii) | provide reasonable assurance that transactions are recorded as necessary to permit preparation of financial statements in accordance with U.S. generally accepted accounting principles, and that receipts and expenditures of the company are being made only in accordance with authorizations of management and directors of the company; and |
(iii) | provide reasonable assurance regarding prevention or timely detection of unauthorized acquisition, use or disposition of the company's assets that could have a material effect on the financial statements. |
Because of inherent limitations, internal control over financial reporting may not prevent or detect misstatements. Therefore, even those systems determined to be effective can provide only reasonable assurance with respect to financial statement preparation and presentation. Also, projections of any evaluation of effectiveness to future periods are subject to risk that controls may become inadequate because of changes in condition, or that the degree of compliance with the policies or procedures may deteriorate.
Triumph's management assessed the effectiveness of Triumph's internal control over financial reporting as of March 31, 2017. In making this assessment, management used the criteria set forth by the Committee of Sponsoring Organizations of the Treadway Commission (2013 framework) ("COSO") in Internal Control—Integrated Framework. Based on management's assessment and those criteria, management believes that Triumph maintained effective internal control over financial reporting as of March 31, 2017.
Triumph's independent registered public accounting firm, Ernst & Young LLP, has audited Triumph's effectiveness of internal control over financial reporting. This report appears on the following page.
/s/ Daniel J. Crowley | |
Daniel J. Crowley President, Chief Executive Officer and Director | |
/s/ James F. McCabe, Jr. | |
James F. McCabe, Jr. Senior Vice President and Chief Financial Officer | |
/s/ Thomas A. Quigley, III | |
Thomas A. Quigley, III Vice President and Controller | |
May 24, 2017
111
Report of Independent Registered Public Accounting Firm
The Board of Directors and Stockholders of Triumph Group, Inc.
We have audited Triumph Group, Inc.'s internal control over financial reporting as of March 31, 2017, based on criteria established in Internal Control—Integrated Framework issued by the Committee of Sponsoring Organizations of the Treadway Commission (2013 framework) (the COSO criteria). Triumph Group, Inc.'s management is responsible for maintaining effective internal control over financial reporting, and for its assessment of the effectiveness of internal control over financial reporting included in the accompanying Management's Report on Internal Control Over Financial Reporting. Our responsibility is to express an opinion on the Company's internal control over financial reporting based on our audit.
We conducted our audit in accordance with the standards of the Public Company Accounting Oversight Board (United States). Those standards require that we plan and perform the audit to obtain reasonable assurance about whether effective internal control over financial reporting was maintained in all material respects. Our audit included obtaining an understanding of internal control over financial reporting, assessing the risk that a material weakness exists, testing and evaluating the design and operating effectiveness of internal control based on the assessed risk, and performing such other procedures as we considered necessary in the circumstances. We believe that our audit provides a reasonable basis for our opinion.
A company's internal control over financial reporting is a process designed to provide reasonable assurance regarding the reliability of financial reporting and the preparation of financial statements for external purposes in accordance with generally accepted accounting principles. A company's internal control over financial reporting includes those policies and procedures that (1) pertain to the maintenance of records that, in reasonable detail, accurately and fairly reflect the transactions and dispositions of the assets of the company; (2) provide reasonable assurance that transactions are recorded as necessary to permit preparation of financial statements in accordance with generally accepted accounting principles, and that receipts and expenditures of the company are being made only in accordance with authorizations of management and directors of the company; and (3) provide reasonable assurance regarding prevention or timely detection of unauthorized acquisition, use or disposition of the company's assets that could have a material effect on the financial statements.
Because of its inherent limitations, internal control over financial reporting may not prevent or detect misstatements. Also, projections of any evaluation of effectiveness to future periods are subject to the risk that controls may become inadequate because of changes in conditions, or that the degree of compliance with the policies or procedures may deteriorate.
In our opinion, Triumph Group, Inc. maintained, in all material respects, effective internal control over financial reporting as of March 31, 2017, based on the COSO criteria.
We also have audited, in accordance with the standards of the Public Company Accounting Oversight Board (United States), the consolidated balance sheets of Triumph Group, Inc., as of March 31, 2017 and 2016, and the related consolidated statements of operations, comprehensive (loss) income, stockholders' equity, and cash flows for each of the three years in the period ended March 31, 2017, of Triumph Group, Inc. and our report dated May 24, 2017, expressed an unqualified opinion thereon.
/s/ Ernst & Young LLP | |
Philadelphia, Pennsylvania
May 24, 2017
112
Changes in Internal Control Over Financial Reporting
In addition to management's evaluation of disclosure controls and procedures as discussed above, we continue to review and enhance our policies and procedures for internal control over financial reporting.
We have developed and implemented a formal set of internal controls and procedures for financial reporting in accordance with the SEC's rules regarding management's report on internal controls. As a result of continued review and testing by management and by our internal and independent auditors, additional changes may be made to our internal controls and procedures. However, we did not make any changes to our internal control over financial reporting in the fourth quarter of fiscal 2017 that has materially affected or is reasonably likely to materially affect our internal control over financial reporting.
Item 9B. | Other Information |
None.
PART III
Item 10. | Directors, Executive Officers and Corporate Governance |
The information required for directors is incorporated herein by reference to our definitive Proxy Statement for our 2017 Annual Meeting of Stockholders, which shall be filed within 120 days after the end of our fiscal year (the "2017 Proxy Statement"). Information required by this item concerning executive officers is included in Part I of this Annual Report on Form 10-K.
Section 16(a) Beneficial Ownership Reporting Compliance
The information required regarding Section 16(a) beneficial ownership reporting compliance is incorporated herein by reference to the 2017 Proxy Statement.
Code of Business Conduct
The information required regarding our Code of Business Conduct is incorporated herein by reference to the 2017 Proxy Statement.
Stockholder Nominations
The information required with respect to any material changes to the procedures by which stockholders may recommend nominees to the Company's board of directors is incorporated herein by reference to the 2017 Proxy Statement.
Audit Committee and Audit Committee Financial Expert
The information required with respect to the Audit Committee and Audit Committee financial experts is incorporated herein by reference to the 2017 Proxy Statement.
Item 11. | Executive Compensation |
The information required regarding executive compensation is incorporated herein by reference to the 2017 Proxy Statement.
Item 12. | Security Ownership of Certain Beneficial Owners and Management and Related Stockholder Matters |
The information required under this item is incorporated herein by reference to the 2017 Proxy Statement.
Item 13. | Certain Relationships and Related Transactions and Director Independence |
The information required under this item is incorporated herein by reference to the 2017 Proxy Statement.
Item 14. | Principal Accountant Fees and Services |
The information required under this item is incorporated herein by reference to the 2017 Proxy Statement.
113
PART IV
Item 15. Exhibits, Financial Statement Schedules
(a) Financial Statements
(1) The following consolidated financial statements are included in Item 8 of this report:
Triumph Group, Inc. | Page |
(2) The following financial statement schedule is included in this report:
All other schedules have been omitted as not applicable or because the information is included elsewhere in the Consolidated Financial Statements or notes thereto.
(3) The following is a list of exhibits. Where so indicated, exhibits which were previously filed are incorporated by reference.
Exhibit Number | Exhibit Description | Incorporated by Reference to | |||||
Form | File No. | Exhibit(s) | Filing Date | ||||
2.1 | Agreement and Plan of Merger, dated as of March 23, 2010, by and among Triumph Group, Inc., Vought Aircraft Industries, Inc., Spitfire Merger Corporation and TC Group, L.L.C., as the Holder Representative | 8-K | 001-12235 | 2.1 | March 23, 2010 | ||
3.1 | Amended and Restated Certificate of Incorporation of Triumph Group, Inc. | 10-K | 001-12235 | 3.1 | May 22, 2009 | ||
3.1.1 | Certificate of Amendment of Amended and Restated Certificate of Incorporation of Triumph Group, Inc. | 8-K | 001-12235 | 3.1 | July 20, 2012 | ||
3.2 | Amended and Restated By-Laws of Triumph Group, Inc. | 8-K/A | 001-12235 | 3.2 | August 2, 2012 | ||
4.1 | Form of certificate evidencing Common Stock of Triumph Group, Inc. | S-1 | 333-10777 | 4 | August 23, 1996 | ||
4.2 | Indenture, dated as of September 18, 2006, between Triumph Group, Inc. and The Bank of New York Trust Company, N.A. relating to the 2.625% Convertible Senior Subordinated Notes Due 2026 | 8-K | 001-12235 | 4.1 | September 22, 2006 | ||
4.2.1 | Form of the 2.625% Convertible Senior Subordinated Note Due 2026 (included as Exhibit A to Exhibit 4.1) | 8-K | 001-12235 | 4.2 | September 22, 2006 | ||
4.3 | Registration Rights Agreement, dated as of September 18, 2006, between Triumph Group, Inc. and Banc of America Securities LLC | 8-K | 001-12235 | 4.3 | September 22, 2006 | ||
114
Exhibit Number | Exhibit Description | Incorporated by Reference to | |||||
Form | File No. | Exhibit(s) | Filing Date | ||||
4.4 | Indenture, dated as of November 16, 2009, between Triumph Group, Inc. and U.S. Bank National Association, as trustee, relating to the 8% Senior Subordinated Notes due 2017. | 8-K | 001-12235 | 4.1 | November 19, 2009 | ||
4.4.1 | Form of 8% Senior Subordinated Notes due 2017 (included as Exhibit A to Indenture filed as Exhibit 4.1) | 8-K | 001-12235 | 4.2 | November 19, 2009 | ||
4.5 | Registration Rights Agreement, dated November 16, 2009, by and among Triumph Group, Inc., the Guarantors party thereto, and the other parties thereto. | 8-K | 001-12235 | 4.3 | November 19, 2009 | ||
4.6 | Indenture, dated as of June 16, 2010, between Triumph Group, Inc. and U.S. Bank National Association, as trustee, relating to the 8.625% Senior Subordinated Notes Due 2018 | 8-K | 001-12235 | 4.1 | June 22, 2010 | ||
4.7 | Registration Rights Agreement, dated as of June 16, 2010, by and among Triumph Group, Inc., the Guarantors party thereto and the other parties thereto | 8-K | 001-12235 | 4.3 | June 22, 2010 | ||
4.8 | Indenture, dated as of February 26, 2013, between Triumph Group, Inc. and U.S. Bank National Association, as trustee | 8-K | 001-12235 | 4.1 | March 1, 2013 | ||
4.8.1 | Form of 4.875% Senior Subordinated Notes due 2021(included as Exhibit A to Exhibit 4.1) | 8-K | 001-12235 | 4.2 | March 1, 2013 | ||
4.9 | Registration Rights Agreement, dated February 26, 2013 between Triumph Group, Inc. and the parties named therein | 8-K | 001-12235 | 4.3 | March 1, 2013 | ||
4.10 | Indenture, dated as of June 3, 2014, between Triumph Group, Inc. and U.S. Bank National Association, as trustee | 8-K | 001-12235 | 4.1 | June 5, 2014 | ||
4.10.1 | Form of 5.250% Senior Notes due 2022 (included as Exhibit A to the Indenture filed as Exhibit 4.1) | 8-K | 001-12235 | 4.2 | June 5, 2014 | ||
4.11 | Registration Rights Agreement, dated June 3, 2014, between Triumph Group, Inc. and parties named therein | 8-K | 001-12235 | 4.3 | June 5, 2014 | ||
4.12 | Second Supplemental Indenture dated as of May 18, 2016 by and among Triumph Group, Inc., the guarantors signatory thereto and U.S. Bank National Association, as trustee, relating to the 4.875% Senior Notes due 2021 | # | # | # | # | ||
10.1 | Amended and Restated Directors’ Stock Incentive Plan | 10-K | 001-12235 | 10.1 | May 29, 2012 | ||
10.1.1 | Form of Deferred Stock Unit Award Agreement under the Amended and Restated Directors’ Stock Incentive Plan | 10-K | 001-12235 | 10.2 | May 30, 2013 | ||
10.2 | Triumph Group, Inc. 2004 Stock Incentive Plan* | 10-K | 001-12235 | 10.3 | May 30, 2013 | ||
10.2.1 | Form of Stock Award Agreement under the 2004 Stock Incentive Plan* | 10-K | 001-12235 | 10.7 | May 22, 2009 | ||
10.2.2 | Form of letter confirming Stock Award Agreement under the 2004 Stock Incentive Plan* | 10-K | 001-12235 | 10.8 | May 22, 2009 | ||
10.3 | Triumph Group, Inc. Supplemental Executive Retirement Plan effective January 1, 2003* | 10-K | 001-12235 | 10.17 | June 12, 2003 | ||
115
Exhibit Number | Exhibit Description | Incorporated by Reference to | |||||
Form | File No. | Exhibit(s) | Filing Date | ||||
10.4 | Compensation for the non-employee members of the Board of Directors of Triumph Group, Inc. | 8-K | 001-12235 | 10.1 | November 15, 2016 | ||
10.5 | Description of the Triumph Group, Inc. Annual Cash Bonus Plan* | 8-K | 001-12235 | 10.1 | July 31, 2007 | ||
10.6 | Change of Control Employment Agreements with: Richard C. Ill and John B. Wright, II. | 8-K | 001-12235 | 10.1 and 10.3 | March 13, 2008 | ||
10.7 | Form of Receivables Purchase Agreement, dated August 7, 2008, by and among the Triumph Group, Inc., as Initial Servicer, Triumph Receivables, LLC, as Seller, the various Purchasers and Purchase Agents from time to time party thereto and PNC National Association, as Administrative Agent. | 8-K | 001-12235 | 10.1 | August 12, 2008 | ||
10.8 | Stockholders Agreement, dated as of March 23, 2010, among Triumph Group, Inc., Carlyle Partners III, L.P., Carlyle Partners II, L.P., Carlyle International Partners II, L.P., Carlyle-Aerostructures Partners, L.P., CHYP Holdings, L.L.C., Carlyle-Aerostructures Partners II, L.P., CP III Coinvestment, L.P., C/S International Partners, Carlyle-Aerostructures International Partners, L.P., Carlyle-Contour Partners, L.P., Carlyle SBC Partners II, L.P., Carlyle International Partners III, L.P., Carlyle-Aerostructures Management, L.P., Carlyle-Contour International Partners, L.P., Carlyle Investment Group, L.P. and TC Group, L.L.C | 8-K | 001-12235 | 10.1 | March 23, 2010 | ||
10.9 | Third Amendment to Receivables Purchase Agreement, dated as of June 21, 2010, by and among Triumph Receivables LLC, Triumph Group, Inc., Market Street Funding LLC and PNC Bank, National Association | 8-K | 001-12235 | 10.1 | June 25, 2010 | ||
10.10 | Triumph Group, Inc. Executive Incentive Plan, effective September 28, 2010 * | 10-Q | 001-12235 | 10.1 | November 5, 2010 | ||
10.11 | Form of letter informing Triumph Group, Inc. executives they are eligible to participate in the Company’s Long Term Incentive Plan * | 10-K | 001-12235 | 10.22 | May 18, 2011 | ||
10.12 | Form of letter informing Triumph Group, Inc. executives they have earned an award under the Company’s Long Term Incentive Plan and the amount of the award * | 10-K | 001-12235 | 10.23 | May 18, 2011 | ||
10.13 | Sixth Amendment to Receivables Purchase Agreement, dated as of February 26, 2013, by and among Triumph Receivables LLC, Triumph Group, Inc., Market Street Funding LLC and PNC Bank, National Association | 8-K | 001-12235 | 10.1 | March 1, 2013 | ||
116
Exhibit Number | Exhibit Description | Incorporated by Reference to | |||||
Form | File No. | Exhibit(s) | Filing Date | ||||
10.14 | Form of Third Amended and Restated Credit Agreement, dated as of November 19, 2013, by and among Triumph Group, Inc., and the other Borrowers party thereto and the Guarantors party thereto and the Banks party thereto and PNC Bank, National Association, as Administrative Agent, PNC Capital Markets LLC, J.P. Morgan Securities, LLC, RBC Capital Markets, RBS Citizens, N.A., and Santander Bank, N.A., as Joint Lead Arrangers and Joint Bookrunners, JPMorgan Chase Bank N.A., Royal Bank of Canada, Citizens Bank of Pennsylvania, and Santander Bank, N.A., as Syndication Agents, the Bank of Tokyo-Mitsubishi UFJ, Ltd, U.S. Bank National Association, TD Bank, N.A., and Manufacturers and Traders Trust Company, as Documentation Agents | 8-K | 001-12235 | 10.1 | November 25, 2013 | ||
10.15 | Form of Second Amended and Restated Guarantee and Collateral Agreement made by Triumph Group, Inc., and certain of its Subsidiaries in favor of PNC Bank, National Association, as Administrative Agent and as Collateral Agent for the other Secured Parties identified herein, dated as of November 19, 2013 | 8-K | 001-12235 | 10.2 | November 25, 2013 | ||
10.16 | Triumph Group, Inc. 2013 Equity and Cash Incentive Plan* | 10-K | 001-12235 | 10.23 | May 19, 2014 | ||
10.17 | Form of letter regarding eligibility to participate in the Triumph Group, Inc. Restricted Stock Plan* | 10-K | 001-12235 | 10.24 | May 19, 2014 | ||
10.18 | Form of letter regarding grant of award under the Triumph Group, Inc. Executive Incentive Plan* | 10-K | 001-12235 | 10.25 | May 19, 2014 | ||
10.19 | Tenth Amendment to Receivables Purchase Agreement dated as of November 25, 2014 | 8-K | 001-12235 | 10.1 | November 26, 2014 | ||
10.20 | Third Amendment to Third Amended and Restated Credit Agreement, dated as of February 3, 2015, by and among Triumph Group, Inc. and the other Borrowers party thereto and the Guarantors party thereto and the Banks party thereto and PNC Bank, National Association, as Administrative Agent | 10-Q | 001-12235 | 10.1 | February 9, 2015 | ||
10.21 | Separation letter agreement between Triumph Group, Inc. and Jeffry D. Frisby, dated April 7, 2015 * | 8-K | 001-12235 | 10.1 | April 8, 2015 | ||
10.22 | The First Amendment of the Triumph Group, Inc. Supplemental Executive Retirement Plan, effective as of May 1, 2015 * | 8-K | 001-12235 | 10.1 | May 7, 2015 | ||
10.23 | First Amendment to Triumph Group, Inc. 2013 Employee Stock Purchase Plan * | 10-Q | 001-12235 | 10.1 | August 4, 2015 | ||
10.24 | Consulting Agreement between Triumph Group, Inc. and Richard C. Ill, dated as of January 4, 2016 * | 8-K | 001-12235 | 10.1 | January 7, 2016 | ||
10.25 | Employment agreement between Triumph Group, Inc. and Daniel J. Crowley, dated as of April 1, 2016* | 8-K | 001-12235 | 10.1 | April 7, 2016 | ||
117
Exhibit Number | Exhibit Description | Incorporated by Reference to | |||||
Form | File No. | Exhibit(s) | Filing Date | ||||
10.26 | Form of Sixth Amendment to Third Amended and Restated Credit Agreement, dated May 3, 2016 | 8-K | 001-12235 | 10.1 | May 4, 2016 | ||
10.27 | Separation Letter between Triumph Group, Inc. and Jeffrey McRae dated May 26, 2016 * | 8-K | 001-12235 | 10.1 | June 1, 2016 | ||
10.28 | Employment letter between Triumph Group, Inc. and James F. McCabe dated July 26, 2016 * | 8-K | 001-12235 | 10.1 | July 27, 2016 | ||
10.29 | Form of Seventh Amendment to Third Amended and Restated Credit Agreement, dated October 21, 2016 | 10-Q | 001-12235 | 10.1 | November 9, 2016 | ||
10.30 | Triumph Group, Inc. Non-employee Director Compensation Program, effective July 21, 2016 | 8-K | 001-12235 | 10.1 | November 15, 2016 | ||
10.31 | Triumph Group, Inc. Directors' Deferred Compensation Plan, effective January 1, 2017 | 8-K | 001-12235 | 10.2 | November 15, 2016 | ||
10.32 | Eighth Amendment to the Third Amended and Restated Credit Agreement, dated May 1, 2017 | 8-K | 001-12235 | 10.1 | May 10, 2017 | ||
10.33 | Form of the 2016 Directors' Equity Compensation Plan, as amended | # | # | # | # | ||
10.34 | Form of Restricted Stock Unit Agreement under the 2016 Directors' Equity Compensation Plan, as amended | # | # | # | # | ||
10.35 | Triumph Group, Inc. Directors' Deferred Compensation Plan, effective January 1, 2017 | 8-K | 001-12235 | 10.2 | November 15, 2016 | ||
10.36 | Employment letter between Triumph Group, Inc. and Richard R. Lovely dated April 12, 2016 * | # | # | # | # | ||
21.1 | Subsidiaries of Triumph Group, Inc. | # | # | # | # | ||
23.1 | Consent of Ernst & Young LLP, Independent Registered Public Accounting Firm | # | # | # | # | ||
31.1 | Principal Executive Officer Certification Required by Rule 13a-14(a) or Rule 15d-14(a) under the Securities Exchange Act of 1934, as amended. | # | # | # | # | ||
31.2 | Principal Financial Officer Certification Required by Rule 13a-14(a) or Rule 15d-14(a) under the Securities Exchange Act of 1934, as amended. | # | # | # | # | ||
32.1 | Principal Executive Officer Certification Required by Rule 13a-14(b) or Rule 15d-14(b) under the Securities Exchange Act of 1934, as amended, and 18 U.S.C. Section 1350. | ## | ## | ## | ## | ||
32.2 | Principal Financial Officer Certification Required by Rule 13a-14(b) or Rule 15d-14(b) under the Securities Exchange Act of 1934, as amended, and 18 U.S.C. Section 1350. | ## | ## | ## | ## | ||
118
Exhibit Number | Exhibit Description | Incorporated by Reference to | |||||
Form | File No. | Exhibit(s) | Filing Date | ||||
101 | The following financial information from Triumph Group, Inc.’s Annual Report on Form 10-K for the fiscal year ended March 31, 2016 formatted in XBRL: (i) Consolidated Balance Sheets as of March 31, 2016 and 2015; (ii) Consolidated Statements of Income for the fiscal years ended March 31, 2016, 2015 and 2014; (iii) Consolidated Statements of Stockholders’ Equity for the fiscal years ended March 31, 2016, 2015 and 2014; (iv) Consolidated Statements of Cash Flows for the fiscal years ended March 31, 2016, 2015 and 2014; (v) Consolidated Statements of Comprehensive Income for the fiscal years ended March 31, 2016, 2015 and 2014; and (vi) Notes to the Consolidated Financial Statements. | # | # | # | # | ||
________________________________
In accordance with Item 601(b)(4)(iii)(A) of Regulations S-K, copies of specific instruments defining the rights of holders of long-term debt of the Company or its subsidiaries are not filed herewith. Pursuant to this regulation, we hereby agree to furnish a copy of any such instrument to the SEC upon request
* | Indicates management contract or compensatory plan or arrangement |
# | Filed herewith |
## | Furnished herewith |
Item 16. Form 10-K Summary
The Registrant has elected not to include a summary.
119
SIGNATURES
Pursuant to the requirements of Section 13 or 15(d) of the Securities Exchange Act of 1934, as amended, the Registrant has duly caused this report to be signed by the undersigned, thereunto duly authorized.
TRIUMPH GROUP, INC. | |||
/s/ Daniel J. Crowley | |||
Dated: | May 24, 2017 | By: | Daniel J. Crowley President, Chief Executive Officer and Director (Principal Executive Officer) |
Pursuant to the requirements of the Securities Exchange Act of 1934, as amended, this report has been signed below by the following persons on behalf of the Registrant and in the capacities and on the dates indicated.
/s/ Daniel J. Crowley | President, Chief Executive Officer and Director (Principal Executive Officer) | May 24, 2017 | |
Daniel J. Crowley | |||
/s/ James F. McCabe, Jr. | Senior Vice President and Chief Financial Officer (Principal Financial Officer) | May 24, 2017 | |
James F. McCabe, Jr. | |||
/s/ Thomas A. Quigley III | Vice President and Controller (Principal Accounting Officer) | May 24, 2017 | |
Thomas A. Quigley III | |||
/s/ Ralph E. Eberhart | Chairman and Director | May 24, 2017 | |
Ralph E. Eberhart | |||
/s/ Paul Bourgon | Director | May 24, 2017 | |
Paul Bourgon | |||
/s/ John G. Drosdick | Director | May 24, 2017 | |
John G. Drosdick | |||
/s/ Richard C. Gozon | Director | May 24, 2017 | |
Richard C. Gozon | |||
/s/ Dawne S. Hickton | Director | May 24, 2017 | |
Dawne S. Hickton | |||
/s/ Richard C. Ill | Director | May 24, 2017 | |
Richard C. Ill | |||
/s/ William L. Mansfield | Director | May 24, 2017 | |
William L. Mansfield | |||
/s/ Adam J. Palmer | Director | May 24, 2017 | |
Adam J. Palmer | |||
/s/ Joseph M. Silvestri | Director | May 24, 2017 | |
Joseph M. Silvestri | |||
120
EXHIBIT INDEX
Exhibit Number | Exhibit Description | Incorporated by Reference to | |||||
Form | File No. | Exhibit(s) | Filing Date | ||||
2.1 | Agreement and Plan of Merger, dated as of March 23, 2010, by and among Triumph Group, Inc., Vought Aircraft Industries, Inc., Spitfire Merger Corporation and TC Group, L.L.C., as the Holder Representative | 8-K | 001-12235 | 2.1 | March 23, 2010 | ||
3.1 | Amended and Restated Certificate of Incorporation of Triumph Group, Inc. | 10-K | 001-12235 | 3.1 | May 22, 2009 | ||
3.1.1 | Certificate of Amendment of Amended and Restated Certificate of Incorporation of Triumph Group, Inc. | 8-K | 001-12235 | 3.1 | July 20, 2012 | ||
3.2 | Amended and Restated By-Laws of Triumph Group, Inc. | 8-K/A | 001-12235 | 3.2 | August 2, 2012 | ||
4.1 | Form of certificate evidencing Common Stock of Triumph Group, Inc. | S-1 | 333-10777 | 4 | August 23, 1996 | ||
4.2 | Indenture, dated as of September 18, 2006, between Triumph Group, Inc. and The Bank of New York Trust Company, N.A. relating to the 2.625% Convertible Senior Subordinated Notes Due 2026 | 8-K | 001-12235 | 4.1 | September 22, 2006 | ||
4.2.1 | Form of the 2.625% Convertible Senior Subordinated Note Due 2026 (included as Exhibit A to Exhibit 4.1) | 8-K | 001-12235 | 4.2 | September 22, 2006 | ||
4.3 | Registration Rights Agreement, dated as of September 18, 2006, between Triumph Group, Inc. and Banc of America Securities LLC | 8-K | 001-12235 | 4.3 | September 22, 2006 | ||
4.4 | Indenture, dated as of November 16, 2009, between Triumph Group, Inc. and U.S. Bank National Association, as trustee, relating to the 8% Senior Subordinated Notes due 2017. | 8-K | 001-12235 | 4.1 | November 19, 2009 | ||
4.4.1 | Form of 8% Senior Subordinated Notes due 2017 (included as Exhibit A to Indenture filed as Exhibit 4.1) | 8-K | 001-12235 | 4.2 | November 19, 2009 | ||
4.5 | Registration Rights Agreement, dated November 16, 2009, by and among Triumph Group, Inc., the Guarantors party thereto, and the other parties thereto. | 8-K | 001-12235 | 4.3 | November 19, 2009 | ||
4.6 | Indenture, dated as of June 16, 2010, between Triumph Group, Inc. and U.S. Bank National Association, as trustee, relating to the 8.625% Senior Subordinated Notes Due 2018 | 8-K | 001-12235 | 4.1 | June 22, 2010 | ||
4.7 | Registration Rights Agreement, dated as of June 16, 2010, by and among Triumph Group, Inc., the Guarantors party thereto and the other parties thereto | 8-K | 001-12235 | 4.3 | June 22, 2010 | ||
4.8 | Indenture, dated as of February 26, 2013, between Triumph Group, Inc. and U.S. Bank National Association, as trustee | 8-K | 001-12235 | 4.1 | March 1, 2013 | ||
4.8.1 | Form of 4.875% Senior Subordinated Notes due 2021 (included as Exhibit A to Exhibit 4.1) | 8-K | 001-12235 | 4.2 | March 1, 2013 | ||
4.9 | Registration Rights Agreement, dated February 26, 2013, between Triumph Group, Inc. and the parties named therein | 8-K | 001-12235 | 4.3 | March 1, 2013 | ||
121
Exhibit Number | Exhibit Description | Incorporated by Reference to | |||||
Form | File No. | Exhibit(s) | Filing Date | ||||
4.10 | Indenture, dated as of June 3, 2014, between Triumph Group, Inc. and U.S. Bank National Association, as trustee | 8-K | 001-12235 | 4.1 | June 5, 2014 | ||
4.10.1 | Form of 5.250% Senior Notes due 2022 (included as Exhibit A to the Indenture filed as Exhibit 4.1) | 8-K | 001-12235 | 4.2 | June 5, 2014 | ||
4.11 | Registration Rights Agreement, dated June 3, 2014, between Triumph Group, Inc. and parties named therein | 8-K | 001-12235 | 4.3 | June 5, 2014 | ||
4.12 | Second Supplemental Indenture dated as of May 18, 2016 by and among Triumph Group, Inc., the guarantors signatory thereto and U.S. Bank National Association, as trustee, relating to the 4.875% Senior Notes due 2021 | # | # | # | # | ||
10.1 | Amended and Restated Directors’ Stock Incentive Plan | 10-K | 001-12235 | 10.1 | May 29, 2012 | ||
10.1.1 | Form of Deferred Stock Unit Award Agreement under the Amended and Restated Directors’ Stock Incentive Plan | 10-K | 001-12235 | 10.2 | May 30, 2013 | ||
10.2 | Triumph Group, Inc. 2004 Stock Incentive Plan* | 10-K | 001-12235 | 10.3 | May 30, 2013 | ||
10.2.1 | Form of Stock Award Agreement under the 2004 Stock Incentive Plan* | 10-K | 001-12235 | 10.7 | May 22, 2009 | ||
10.2.2 | Form of letter confirming Stock Award Agreement under the 2004 Stock Incentive Plan* | 10-K | 001-12235 | 10.8 | May 22, 2009 | ||
10.3 | Triumph Group, Inc. Supplemental Executive Retirement Plan effective January 1, 2003* | 10-K | 001-12235 | 10.17 | June 12, 2003 | ||
10.4 | Compensation for the non-employee members of the Board of Directors of Triumph Group, Inc. | 8-K | 001-12235 | 10.1 | November 15, 2016 | ||
10.5 | Description of the Triumph Group, Inc. Annual Cash Bonus Plan* | 8-K | 001-12235 | 10.1 | July 31, 2007 | ||
10.6 | Change of Control Employment Agreements with: Richard C. Ill and John B. Wright, II. | 8-K | 001-12235 | 10.1 and 10.3 | March 13, 2008 | ||
10.7 | Form of Receivables Purchase Agreement, dated August 7, 2008, by and among the Triumph Group, Inc., as Initial Servicer, Triumph Receivables, LLC, as Seller, the various Purchasers and Purchase Agents from time to time party thereto and PNC National Association, as Administrative Agent. | 8-K | 001-12235 | 10.1 | August 12, 2008 | ||
10.8 | Stockholders Agreement, dated as of March 23, 2010, among Triumph Group, Inc., Carlyle Partners III, L.P., Carlyle Partners II, L.P., Carlyle International Partners II, L.P., Carlyle-Aerostructures Partners, L.P., CHYP Holdings, L.L.C., Carlyle-Aerostructures Partners II, L.P., CP III Coinvestment, L.P., C/S International Partners, Carlyle-Aerostructures International Partners, L.P., Carlyle-Contour Partners, L.P., Carlyle SBC Partners II, L.P., Carlyle International Partners III, L.P., Carlyle-Aerostructures Management, L.P., Carlyle-Contour International Partners, L.P., Carlyle Investment Group, L.P. and TC Group, L.L.C | 8-K | 001-12235 | 10.1 | March 23, 2010 | ||
122
Exhibit Number | Exhibit Description | Incorporated by Reference to | |||||
Form | File No. | Exhibit(s) | Filing Date | ||||
10.9 | Third Amendment to Receivables Purchase Agreement, dated as of June 21, 2010, by and among Triumph Receivables LLC, Triumph Group, Inc., Market Street Funding LLC and PNC Bank, National Association | 8-K | 001-12235 | 10.1 | June 25, 2010 | ||
10.10 | Triumph Group, Inc. Executive Incentive Plan, effective September 28, 2010* | 10-Q | 001-12235 | 10.1 | November 5, 2010 | ||
10.11 | Form of letter informing Triumph Group, Inc. executives they are eligible to participate in the Company’s Long Term Incentive Plan * | 10-K | 001-12235 | 10.22 | May 18, 2011 | ||
10.12 | Form of letter informing Triumph Group, Inc. executives they have earned an award under the Company’s Long Term Incentive Plan and the amount of the award * | 10-K | 001-12235 | 10.23 | May 18, 2011 | ||
10.13 | Sixth Amendment to Receivables Purchase Agreement, dated as of February 26, 2013, by and among Triumph Receivables LLC, Triumph Group, Inc., Market Street Funding LLC and PNC Bank, National Association * | 8-K | 001-12235 | 10.1 | March 1, 2013 | ||
10.14 | Form of Third Amended and Restated Credit Agreement, dated as of November 19, 2013, by and among Triumph Group, Inc., and the other Borrowers party thereto and the Guarantors party thereto and the Banks party thereto and PNC Bank, National Association, as Administrative Agent, PNC Capital Markets LLC, J.P. Morgan Securities, LLC, RBC Capital Markets, RBS Citizens, N.A., and Santander Bank, N.A., as Joint Lead Arrangers and Joint Bookrunners, JPMorgan Chase Bank N.A., Royal Bank of Canada, Citizens Bank of Pennsylvania, and Santander Bank, N.A., as Syndication Agents, the Bank of Tokyo-Mitsubishi UFJ, Ltd, U.S. Bank National Association, TD Bank, N.A., and Manufacturers and Traders Trust Company, as Documentation Agents | 8-K | 001-12235 | 10.1 | November 25, 2013 | ||
10.15 | Form of Second Amended and Restated Guarantee and Collateral Agreement made by Triumph Group, Inc., and certain of its Subsidiaries in favor of PNC Bank, National Association, as Administrative Agent and as Collateral Agent for the other Secured Parties identified herein, dated as of November 19, 2013 | 8-K | 001-12235 | 10.2 | November 25, 2013 | ||
10.16 | Triumph Group, Inc. 2013 Equity and Cash Incentive Plan* | 10-K | 001-12235 | 10.23 | May 19, 2014 | ||
10.17 | Form of letter regarding eligibility to participate in the Triumph Group, Inc. Restricted Stock Plan* | 10-K | 001-12235 | 10.24 | May 19, 2014 | ||
10.18 | Form of letter regarding grant of award under the Triumph Group, Inc. Executive Incentive Plan* | 10-K | 001-12235 | 10.25 | May 19, 2014 | ||
10.19 | Tenth Amendment to Receivables Purchase Agreement dated as of November 25, 2014 | 8-K | 001-12235 | 10.1 | November 26, 2014 | ||
123
Exhibit Number | Exhibit Description | Incorporated by Reference to | |||||
Form | File No. | Exhibit(s) | Filing Date | ||||
10.20 | Third Amendment to Third Amended and Restated Credit Agreement, dated as of February 3, 2015, by and among Triumph Group, Inc. and the other Borrowers party thereto and the Guarantors party thereto and the Banks party thereto and PNC Bank, National Association, as Administrative Agent | 10-Q | 001-12235 | 10.1 | February 9, 2015 | ||
10.21 | Separation letter agreement between Triumph Group, Inc. and Jeffry D. Frisby, dated April 7, 2015 * | 8-K | 001-12235 | 10.1 | April 8, 2015 | ||
10.22 | The First Amendment of the Triumph Group, Inc. Supplemental Executive Retirement Plan, effective as of May 1, 2015 * | 8-K | 001-12235 | 10.1 | May 7, 2015 | ||
10.23 | First Amendment to Triumph Group, Inc. 2013 Employee Stock Purchase Plan * | 10-Q | 001-12235 | 10.1 | August 4, 2015 | ||
10.24 | Consulting Agreement between Triumph Group, Inc. and Richard C. Ill, dated as of January 4, 2016* | 8-K | 001-12235 | 10.1 | January 7, 2016 | ||
10.25 | Employment agreement between Triumph Group, Inc. and Daniel J. Crowley, dated as of April 1, 2016* | 8-K | 001-12235 | 10.1 | April 7, 2016 | ||
10.26 | Form of Sixth Amendment to Third Amended and Restated Credit Agreement, dated May 3, 2016 | 8-K | 001-12235 | 10.1 | May 4, 2016 | ||
10.27 | Separation Letter between Triumph Group, Inc. and Jeffrey McRae dated May 26, 2016 * | 8-K | 001-12235 | 10.1 | June 1, 2016 | ||
10.28 | Employment letter between Triumph Group, Inc. and James F. McCabe dated July 26, 2016 * | 8-K | 001-12235 | 10.1 | July 27, 2016 | ||
10.29 | Form of Seventh Amendment to Third Amended and Restated Credit Agreement, dated October 21, 2016 | 10-Q | 001-12235 | 10.1 | November 9, 2016 | ||
10.30 | Triumph Group, Inc. Non-employee Director Compensation Program, effective July 21, 2016 | 8-K | 001-12235 | 10.1 | November 15, 2016 | ||
10.31 | Triumph Group, Inc. Directors' Deferred Compensation Plan, effective January 1, 2017 | 8-K | 001-12235 | 10.2 | November 15, 2016 | ||
10.32 | Eighth Amendment to the Third Amended and Restated Credit Agreement, dated May 1, 2017 | 8-K | 001-12235 | 10.1 | May 10, 2017 | ||
10.33 | Form of the 2016 Directors' Equity Compensation Plan, as amended | # | # | # | # | ||
10.34 | Form of Restricted Stock Unit Agreement under the 2016 Directors' Equity Compensation Plan, as amended | # | # | # | # | ||
10.35 | Triumph Group, Inc. Directors' Deferred Compensation Plan, effective January 1, 2017 | 8-K | 001-12235 | 10.2 | November 15, 2016 | ||
10.36 | Employment letter between Triumph Group, Inc. and Richard R. Lovely dated April 12, 2016 * | # | # | # | # | ||
21.1 | Subsidiaries of Triumph Group, Inc. | # | # | # | # | ||
23.1 | Consent of Ernst & Young LLP, Independent Registered Public Accounting Firm | # | # | # | # | ||
31.1 | Principal Executive Officer Certification Required by Rule 13a-14(a) or Rule 15d-14(a) under the Securities Exchange Act of 1934, as amended. | # | # | # | # | ||
124
Exhibit Number | Exhibit Description | Incorporated by Reference to | |||||
Form | File No. | Exhibit(s) | Filing Date | ||||
31.2 | Principal Financial Officer Certification Required by Rule 13a-14(a) or Rule 15d-14(a) under the Securities Exchange Act of 1934, as amended. | # | # | # | # | ||
32.1 | Principal Executive Officer Certification Required by Rule 13a-14(b) or Rule 15d-14(b) under the Securities Exchange Act of 1934, as amended, and 18 U.S.C. Section 1350. | ## | ## | ## | ## | ||
32.2 | Principal Financial Officer Certification Required by Rule 13a-14(b) or Rule 15d-14(b) under the Securities Exchange Act of 1934, as amended, and 18 U.S.C. Section 1350. | ## | ## | ## | ## | ||
101 | The following financial information from Triumph Group, Inc.’s Annual Report on Form 10-K for the fiscal year ended March 31, 2016 formatted in XBRL: (i) Consolidated Balance Sheets as of March 31, 2016 and 2015; (ii) Consolidated Statements of Income for the fiscal years ended March 31, 2016, 2015 and 2014; (iii) Consolidated Statements of Stockholders’ Equity for the fiscal years ended March 31, 2016, 2015 and 2014; (iv) Consolidated Statements of Cash Flows for the fiscal years ended March 31, 2016, 2015 and 2014; (v) Consolidated Statements of Comprehensive Income for the fiscal years ended March 31, 2016, 2015 and 2014; and (vi) Notes to the Consolidated Financial Statements. | # | # | # | # | ||
________________________________
In accordance with Item 601(b)(4)(iii)(A) of Regulations S-K, copies of specific instruments defining the rights of holders of long-term debt of the Company or its subsidiaries are not filed herewith. Pursuant to this regulation, we hereby agree to furnish a copy of any such instrument to the SEC upon request
* | Indicates management contract or compensatory plan or arrangement |
# | Filed herewith |
## | Furnished herewith |
125