Attached files
| file | filename |
|---|---|
| EX-99.1 - EX-99.1 - Oaktree Specialty Lending Corp | d571599dex991.htm |
| 8-K - 8-K - Oaktree Specialty Lending Corp | d571599d8k.htm |
Third Quarter Fiscal Year 2018 Earnings Presentation August 8, 2018 Nasdaq: OCSL Exhibit 99.2
Forward Looking Statements Some of the statements in this presentation constitute forward-looking statements because they relate to future events or our future performance or financial condition. The forward-looking statements contained in this presentation may include statements as to: our future operating results and distribution projections; the ability of Oaktree Capital Management, L.P. (“Oaktree” or our “Investment Adviser”) to find lower-risk investments to reposition our portfolio and to implement our Investment Adviser’s future plans with respect to our business; our business prospects and the prospects of our portfolio companies; the impact of the investments that we expect to make; the ability of our portfolio companies to achieve their objectives; our expected financings and investments; the adequacy of our cash resources and working capital; the timing of cash flows, if any, from the operations of our portfolio companies; and the cost or potential outcome of any litigation to which we may be a party. In addition, words such as “anticipate,” “believe,” “expect,” “seek,” “plan,” “should,” “estimate,” “project” and “intend” indicate forward-looking statements, although not all forward-looking statements include these words. The forward-looking statements contained in this presentation involve risks and uncertainties. Our actual results could differ materially from those implied or expressed in the forward-looking statements for any reason, including the factors set forth in “Risk Factors” and elsewhere in our annual report on Form 10-K and our quarterly reports on Form 10-Q for the quarters ended March 31, 2018 and June 30, 2018. Other factors that could cause actual results to differ materially include: changes in the economy, financial markets and political environment; risks associated with possible disruption in our operations or the economy generally due to terrorism or natural disasters; future changes in laws or regulations (including the interpretation of these laws and regulations by regulatory authorities) and conditions in our operating areas, particularly with respect to business development companies or regulated investment companies; and other considerations that may be disclosed from time to time in our publicly disseminated documents and filings. We have based the forward-looking statements included in this presentation on information available to us on the date of this presentation, and we assume no obligation to update any such forward-looking statements. Although we undertake no obligation to revise or update any forward-looking statements, whether as a result of new information, future events or otherwise, you are advised to consult any additional disclosures that we may make directly to you or through reports that we in the future may file with the SEC, including annual reports on Form 10-K, quarterly reports on Form 10-Q and current reports on Form 8-K. Unless otherwise indicated, data provided herein are dated as of June 30, 2018.
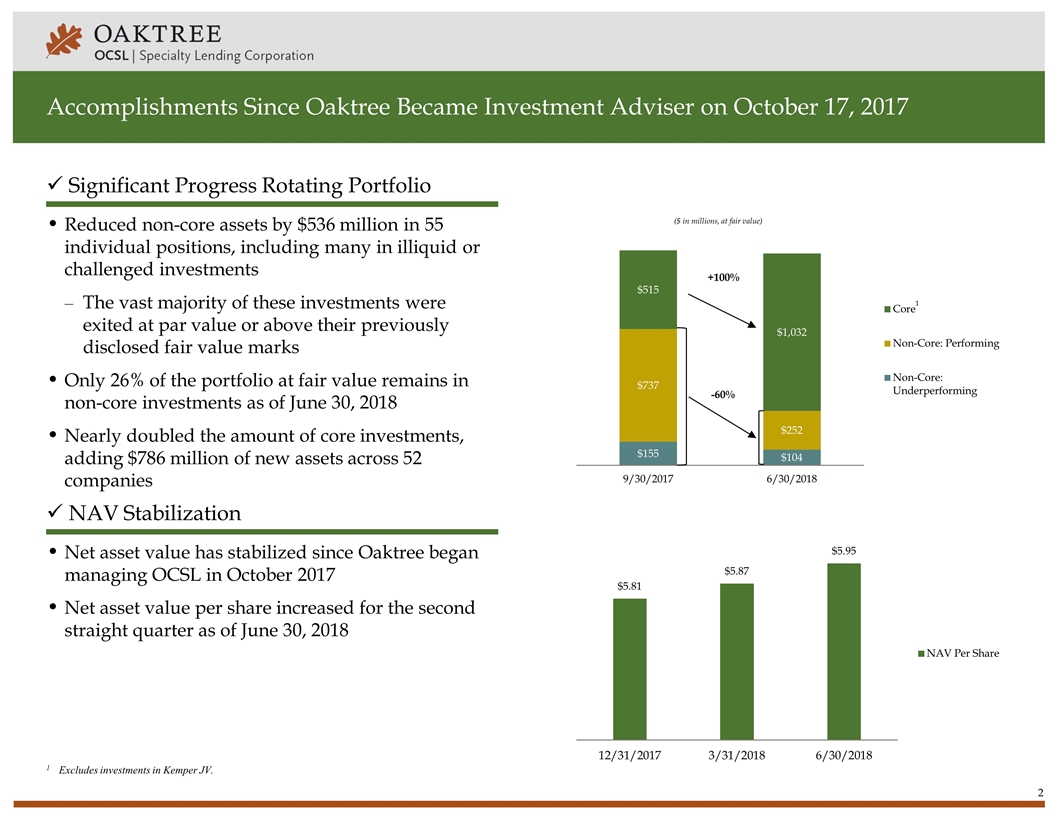
Accomplishments Since Oaktree Became Investment Adviser on October 17, 2017 ü Significant Progress Rotating Portfolio Reduced non-core assets by $536 million in 55 individual positions, including many in illiquid or challenged investments The vast majority of these investments were exited at par value or above their previously disclosed fair value marks Only 26% of the portfolio at fair value remains in non-core investments as of June 30, 2018 Nearly doubled the amount of core investments, adding $786 million of new assets across 52 companies ü NAV Stabilization Net asset value has stabilized since Oaktree began managing OCSL in October 2017 Net asset value per share increased for the second straight quarter as of June 30, 2018 ($ in millions, at fair value) +100% -60% 1Excludes investments in Kemper JV. 1
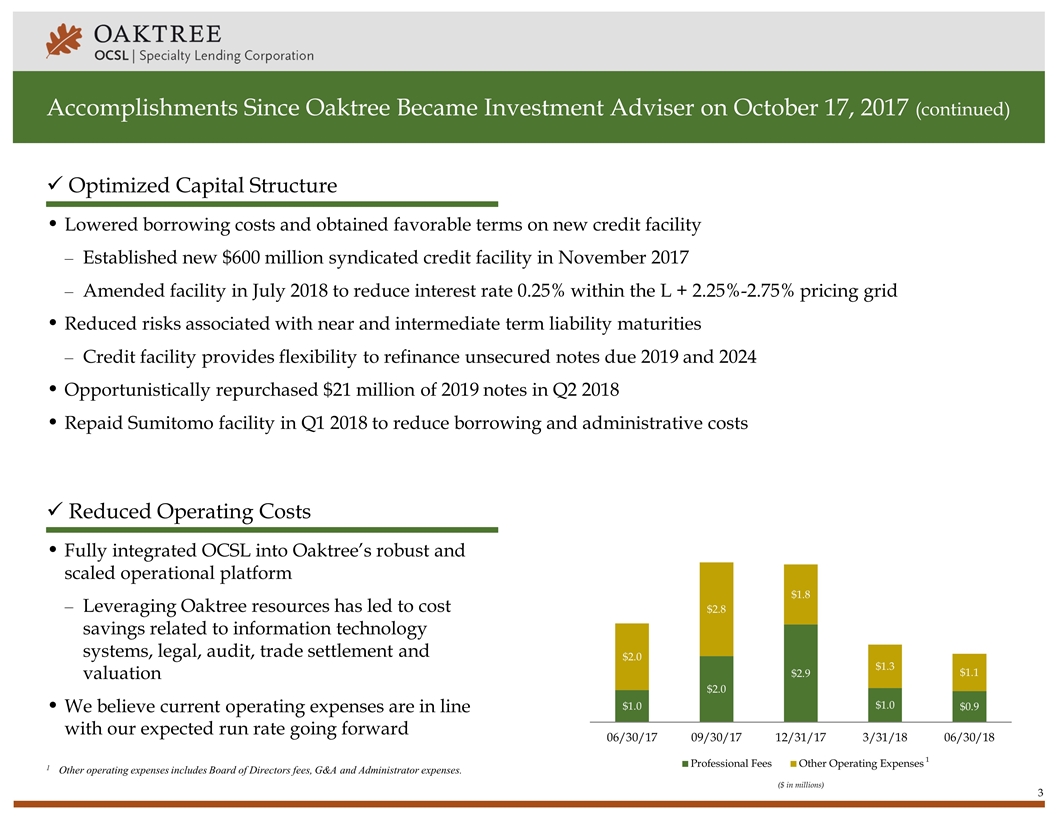
Accomplishments Since Oaktree Became Investment Adviser on October 17, 2017 (continued) ü Optimized Capital Structure Lowered borrowing costs and obtained favorable terms on new credit facility Established new $600 million syndicated credit facility in November 2017 Amended facility in July 2018 to reduce interest rate 0.25% within the L + 2.25%-2.75% pricing grid Reduced risks associated with near and intermediate term liability maturities Credit facility provides flexibility to refinance unsecured notes due 2019 and 2024 Opportunistically repurchased $21 million of 2019 notes in Q2 2018 Repaid Sumitomo facility in Q1 2018 to reduce borrowing and administrative costs ü Reduced Operating Costs Fully integrated OCSL into Oaktree’s robust and scaled operational platform Leveraging Oaktree resources has led to cost savings related to information technology systems, legal, audit, trade settlement and valuation We believe current operating expenses are in line with our expected run rate going forward 1Other operating expenses includes Board of Directors fees, G&A and Administrator expenses. 1 ($ in millions)
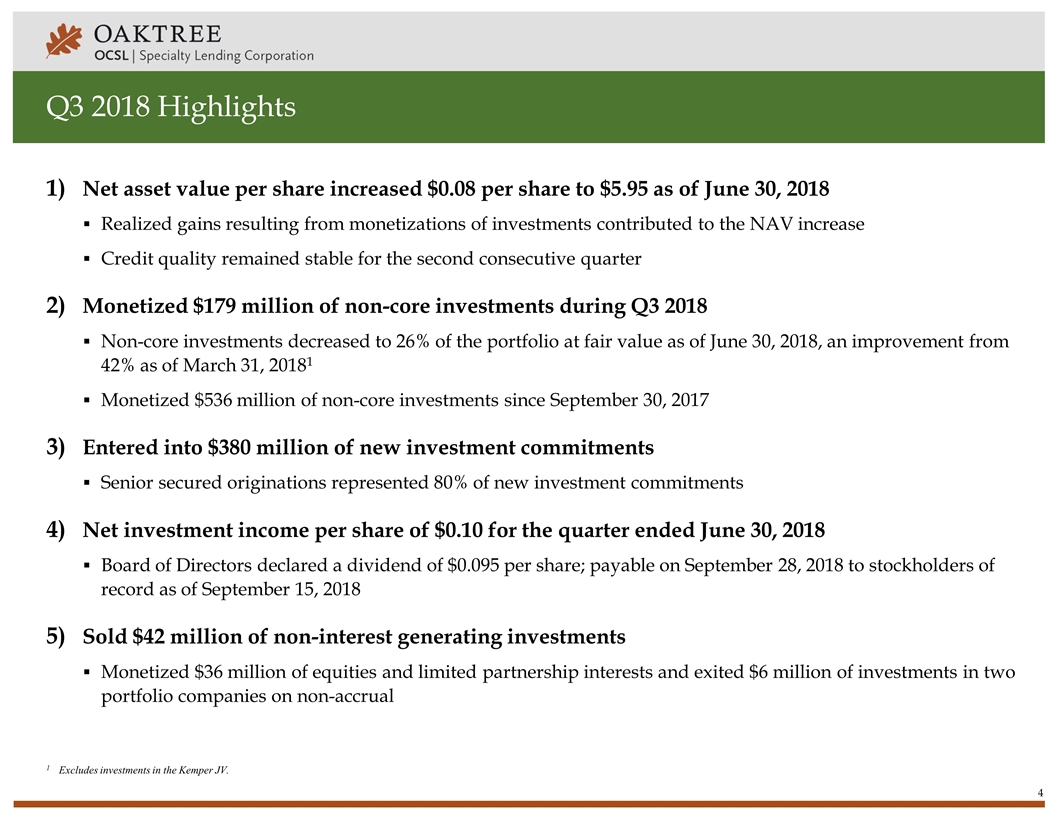
Q3 2018 Highlights Net asset value per share increased $0.08 per share to $5.95 as of June 30, 2018 Realized gains resulting from monetizations of investments contributed to the NAV increase Credit quality remained stable for the second consecutive quarter Monetized $179 million of non-core investments during Q3 2018 Non-core investments decreased to 26% of the portfolio at fair value as of June 30, 2018, an improvement from 42% as of March 31, 20181 Monetized $536 million of non-core investments since September 30, 2017 Entered into $380 million of new investment commitments Senior secured originations represented 80% of new investment commitments Net investment income per share of $0.10 for the quarter ended June 30, 2018 Board of Directors declared a dividend of $0.095 per share; payable on September 28, 2018 to stockholders of record as of September 15, 2018 Sold $42 million of non-interest generating investments Monetized $36 million of equities and limited partnership interests and exited $6 million of investments in two portfolio companies on non-accrual 1Excludes investments in the Kemper JV.
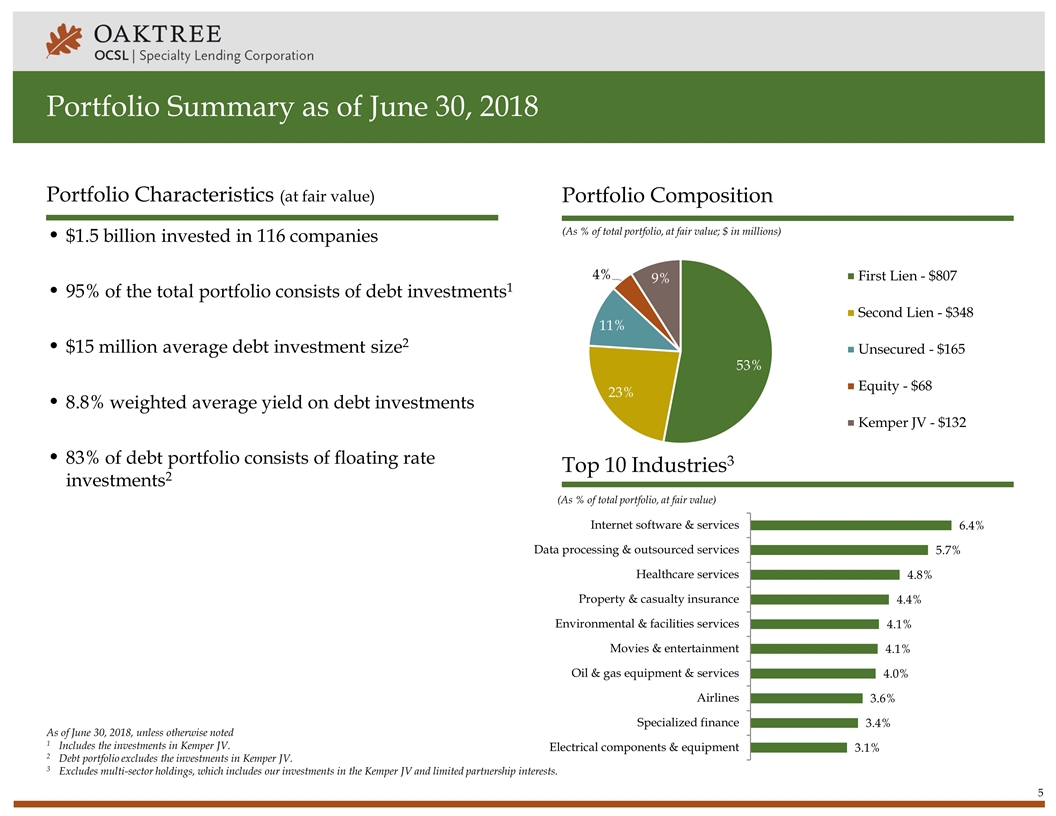
Portfolio Summary as of June 30, 2018 (As % of total portfolio, at fair value; $ in millions) (As % of total portfolio, at fair value) Portfolio Composition Top 10 Industries3 Portfolio Characteristics (at fair value) As of June 30, 2018, unless otherwise noted 1 Includes the investments in Kemper JV. 2Debt portfolio excludes the investments in Kemper JV. 3Excludes multi-sector holdings, which includes our investments in the Kemper JV and limited partnership interests. $1.5 billion invested in 116 companies 95% of the total portfolio consists of debt investments1 $15 million average debt investment size2 8.8% weighted average yield on debt investments 83% of debt portfolio consists of floating rate investments2
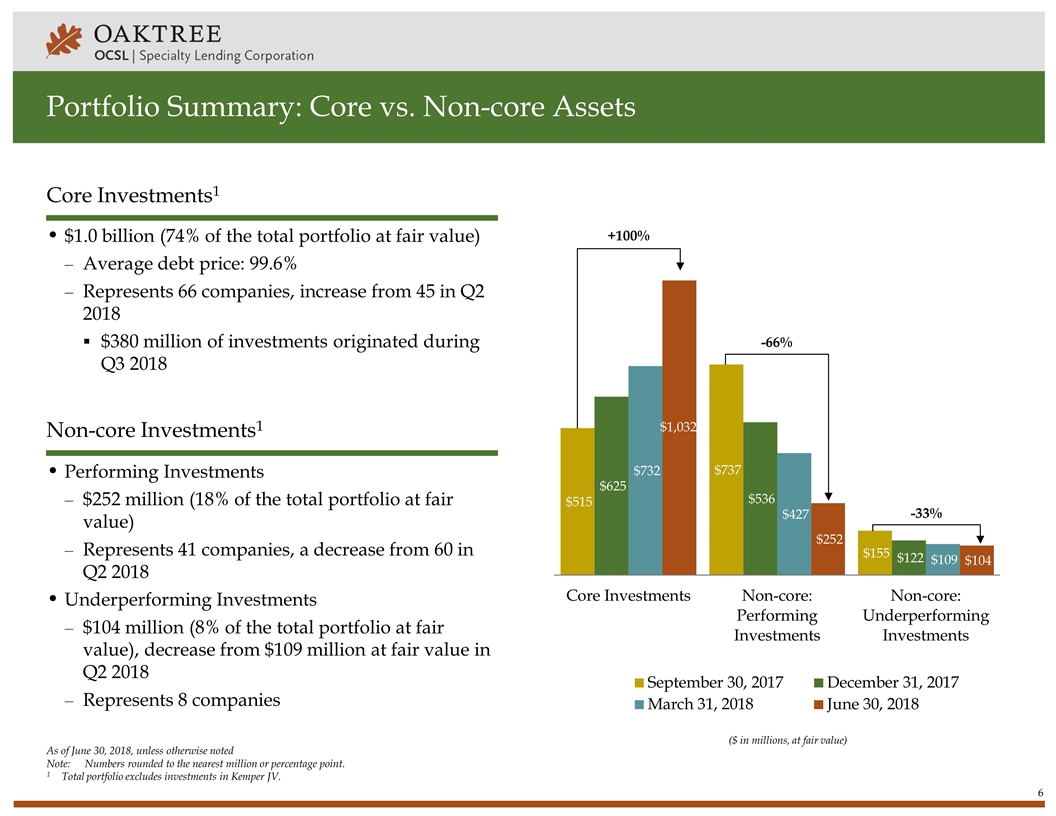
Portfolio Summary: Core vs. Non-core Assets $1.0 billion (74% of the total portfolio at fair value) Average debt price: 99.6% Represents 66 companies, increase from 45 in Q2 2018 $380 million of investments originated during Q3 2018 Non-core Investments1 Performing Investments $252 million (18% of the total portfolio at fair value) Represents 41 companies, a decrease from 60 in Q2 2018 Underperforming Investments $104 million (8% of the total portfolio at fair value), decrease from $109 million at fair value in Q2 2018 Represents 8 companies ($ in millions, at fair value) As of June 30, 2018, unless otherwise noted Note:Numbers rounded to the nearest million or percentage point. 1 Total portfolio excludes investments in Kemper JV. -33% Core Investments1
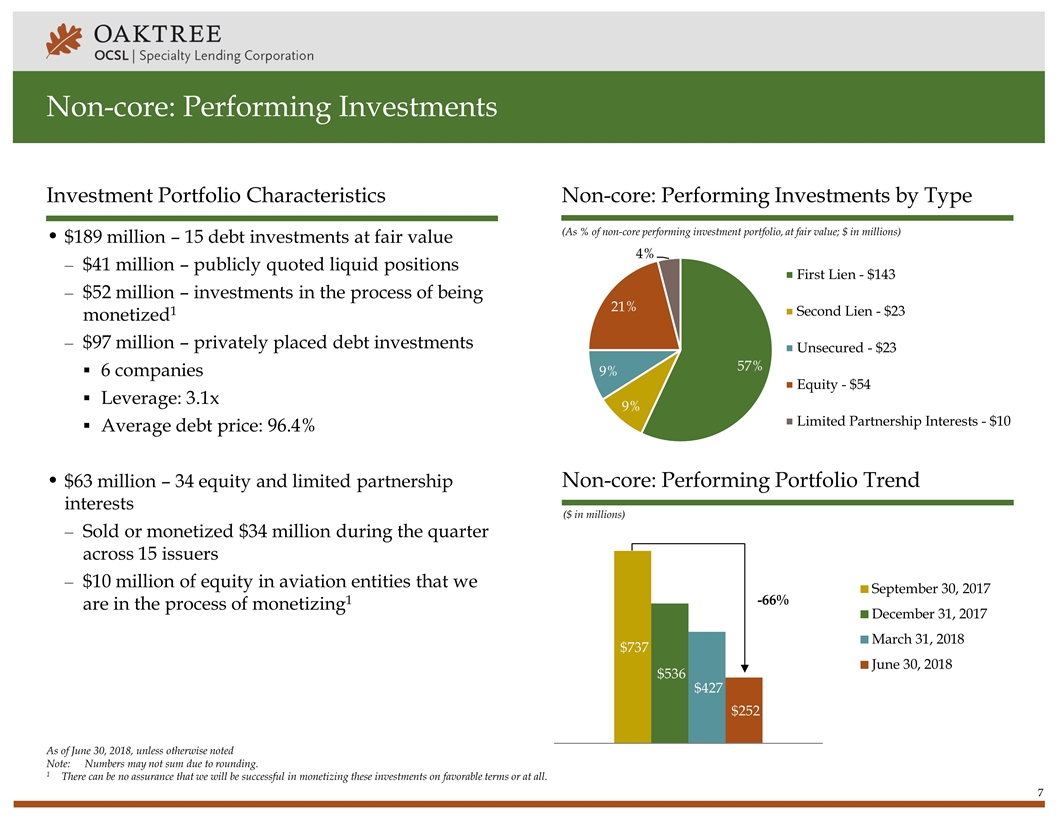
As of June 30, 2018, unless otherwise noted Note:Numbers may not sum due to rounding. 1 There can be no assurance that we will be successful in monetizing these investments on favorable terms or at all. Non-core: Performing Investments Investment Portfolio Characteristics $189 million – 15 debt investments at fair value $41 million – publicly quoted liquid positions $52 million – investments in the process of being monetized1 $97 million – privately placed debt investments 6 companies Leverage: 3.1x Average debt price: 96.4% $63 million – 34 equity and limited partnership interests Sold or monetized $34 million during the quarter across 15 issuers $10 million of equity in aviation entities that we are in the process of monetizing1 (As % of non-core performing investment portfolio, at fair value; $ in millions) Non-core: Performing Investments by Type -66% ($ in millions) Non-core: Performing Portfolio Trend
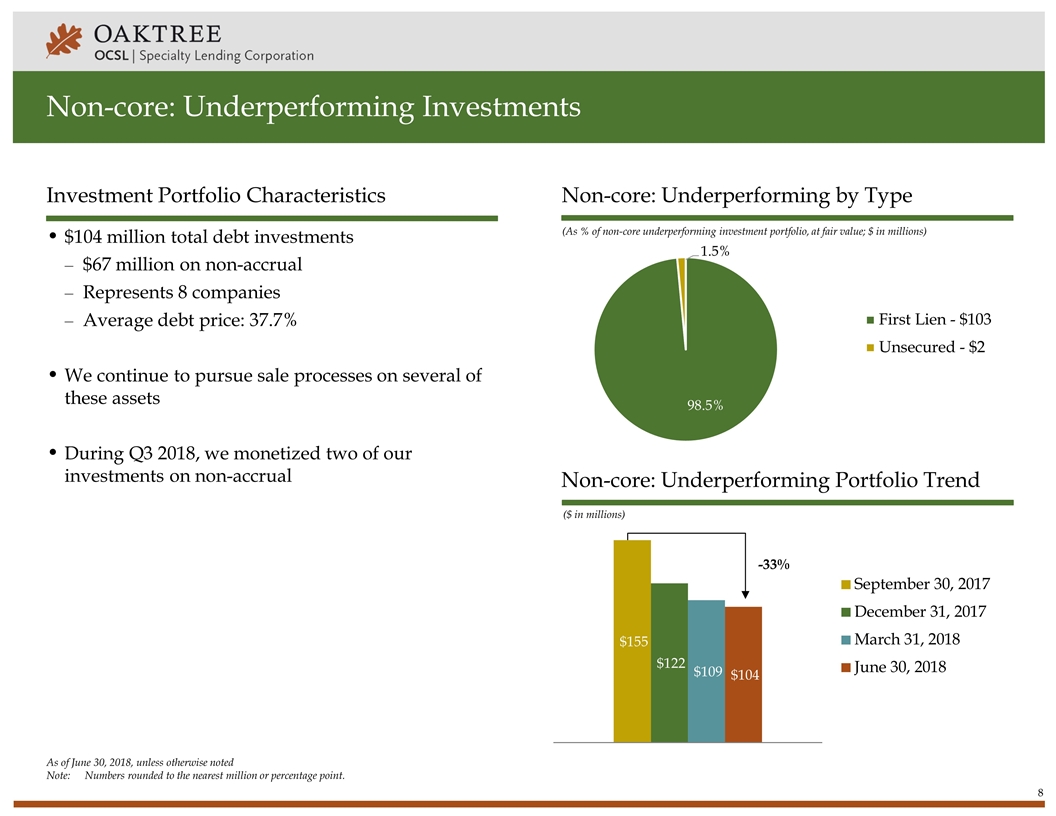
Non-core: Underperforming Investments Non-core: Underperforming by Type Investment Portfolio Characteristics (As % of non-core underperforming investment portfolio, at fair value; $ in millions) $104 million total debt investments $67 million on non-accrual Represents 8 companies Average debt price: 37.7% We continue to pursue sale processes on several of these assets During Q3 2018, we monetized two of our investments on non-accrual -33% ($ in millions) Non-core: Underperforming Portfolio Trend As of June 30, 2018, unless otherwise noted Note:Numbers rounded to the nearest million or percentage point.
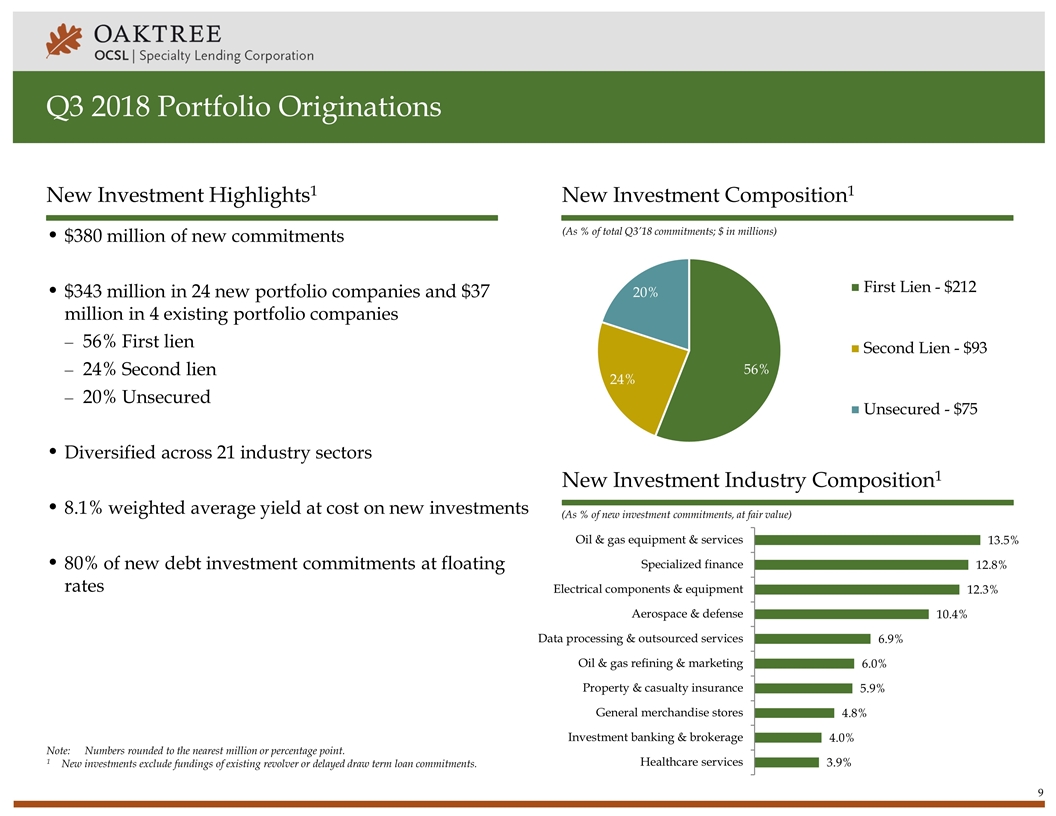
Q3 2018 Portfolio Originations $380 million of new commitments $343 million in 24 new portfolio companies and $37 million in 4 existing portfolio companies 56% First lien 24% Second lien 20% Unsecured Diversified across 21 industry sectors 8.1% weighted average yield at cost on new investments 80% of new debt investment commitments at floating rates New Investment Highlights1 (As % of new investment commitments, at fair value) New Investment Industry Composition1 (As % of total Q3’18 commitments; $ in millions) New Investment Composition1 Note:Numbers rounded to the nearest million or percentage point. 1 New investments exclude fundings of existing revolver or delayed draw term loan commitments.
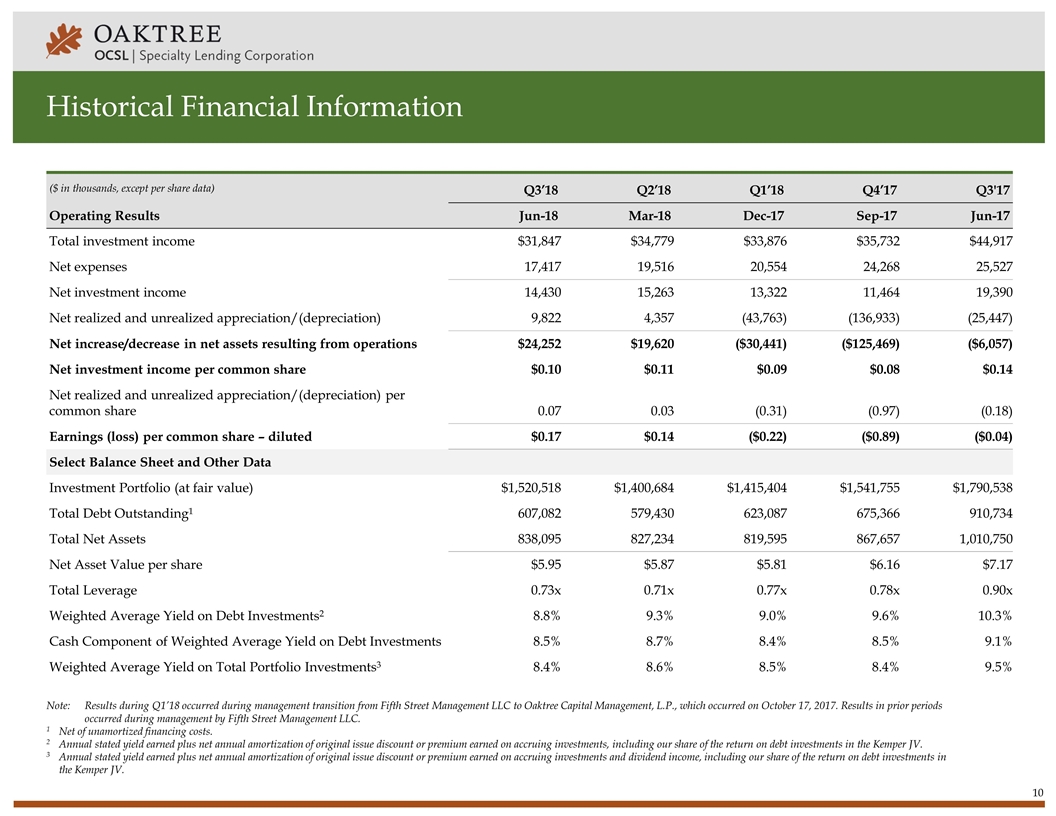
Historical Financial Information ($ in thousands, except per share data) Operating Results Q3’18 Q2’18 Q1’18 Q4’17 Q3'17 Jun-18 Mar-18 Dec-17 Sep-17 Jun-17 Total investment income $31,847 $34,779 $33,876 $35,732 $44,917 Net expenses 17,417 19,516 20,554 24,268 25,527 Net investment income 14,430 15,263 13,322 11,464 19,390 Net realized and unrealized appreciation/(depreciation) 9,822 4,357 (43,763) (136,933) (25,447) Net increase/decrease in net assets resulting from operations $24,252 $19,620 ($30,441) ($125,469) ($6,057) Net investment income per common share $0.10 $0.11 $0.09 $0.08 $0.14 Net realized and unrealized appreciation/(depreciation) per common share 0.07 0.03 (0.31) (0.97) (0.18) Earnings (loss) per common share – diluted $0.17 $0.14 ($0.22) ($0.89) ($0.04) Select Balance Sheet and Other Data Investment Portfolio (at fair value) $1,520,518 $1,400,684 $1,415,404 $1,541,755 $1,790,538 Total Debt Outstanding1 607,082 579,430 623,087 675,366 910,734 Total Net Assets 838,095 827,234 819,595 867,657 1,010,750 Net Asset Value per share $5.95 $5.87 $5.81 $6.16 $7.17 Total Leverage 0.73x 0.71x 0.77x 0.78x 0.90x Weighted Average Yield on Debt Investments2 8.8% 9.3% 9.0% 9.6% 10.3% Cash Component of Weighted Average Yield on Debt Investments 8.5% 8.7% 8.4% 8.5% 9.1% Weighted Average Yield on Total Portfolio Investments3 8.4% 8.6% 8.5% 8.4% 9.5% Note:Results during Q1’18 occurred during management transition from Fifth Street Management LLC to Oaktree Capital Management, L.P., which occurred on October 17, 2017. Results in prior periods occurred during management by Fifth Street Management LLC. 1Net of unamortized financing costs. 2 Annual stated yield earned plus net annual amortization of original issue discount or premium earned on accruing investments, including our share of the return on debt investments in the Kemper JV. 3 Annual stated yield earned plus net annual amortization of original issue discount or premium earned on accruing investments and dividend income, including our share of the return on debt investments in the Kemper JV.
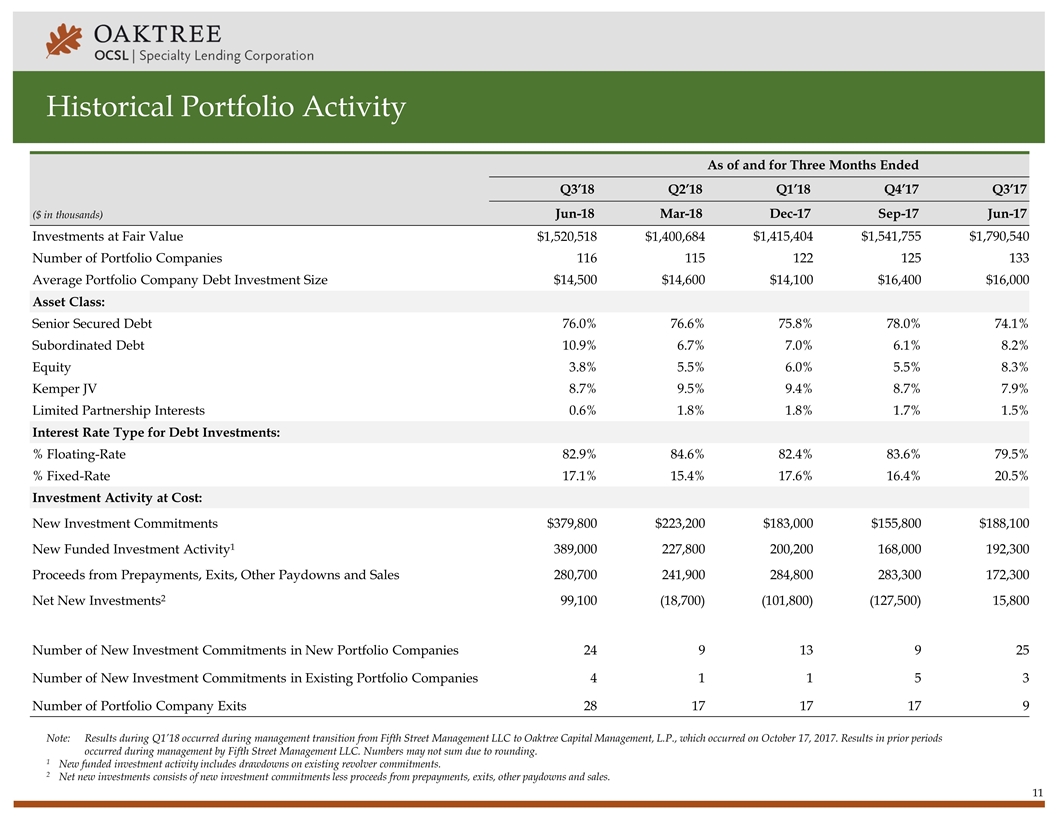
Historical Portfolio Activity ($ in thousands) As of and for Three Months Ended Q3’18 Q2’18 Q1’18 Q4’17 Q3’17 Jun-18 Mar-18 Dec-17 Sep-17 Jun-17 Investments at Fair Value $1,520,518 $1,400,684 $1,415,404 $1,541,755 $1,790,540 Number of Portfolio Companies 116 115 122 125 133 Average Portfolio Company Debt Investment Size $14,500 $14,600 $14,100 $16,400 $16,000 Asset Class: Senior Secured Debt 76.0% 76.6% 75.8% 78.0% 74.1% Subordinated Debt 10.9% 6.7% 7.0% 6.1% 8.2% Equity 3.8% 5.5% 6.0% 5.5% 8.3% Kemper JV 8.7% 9.5% 9.4% 8.7% 7.9% Limited Partnership Interests 0.6% 1.8% 1.8% 1.7% 1.5% Interest Rate Type for Debt Investments: % Floating-Rate 82.9% 84.6% 82.4% 83.6% 79.5% % Fixed-Rate 17.1% 15.4% 17.6% 16.4% 20.5% Investment Activity at Cost: New Investment Commitments $379,800 $223,200 $183,000 $155,800 $188,100 New Funded Investment Activity1 389,000 227,800 200,200 168,000 192,300 Proceeds from Prepayments, Exits, Other Paydowns and Sales 280,700 241,900 284,800 283,300 172,300 Net New Investments2 99,100 (18,700) (101,800) (127,500) 15,800 Number of New Investment Commitments in New Portfolio Companies 24 9 13 9 25 Number of New Investment Commitments in Existing Portfolio Companies 4 1 1 5 3 Number of Portfolio Company Exits 28 17 17 17 9 Note:Results during Q1’18 occurred during management transition from Fifth Street Management LLC to Oaktree Capital Management, L.P., which occurred on October 17, 2017. Results in prior periods occurred during management by Fifth Street Management LLC. Numbers may not sum due to rounding. 1New funded investment activity includes drawdowns on existing revolver commitments. 2Net new investments consists of new investment commitments less proceeds from prepayments, exits, other paydowns and sales.
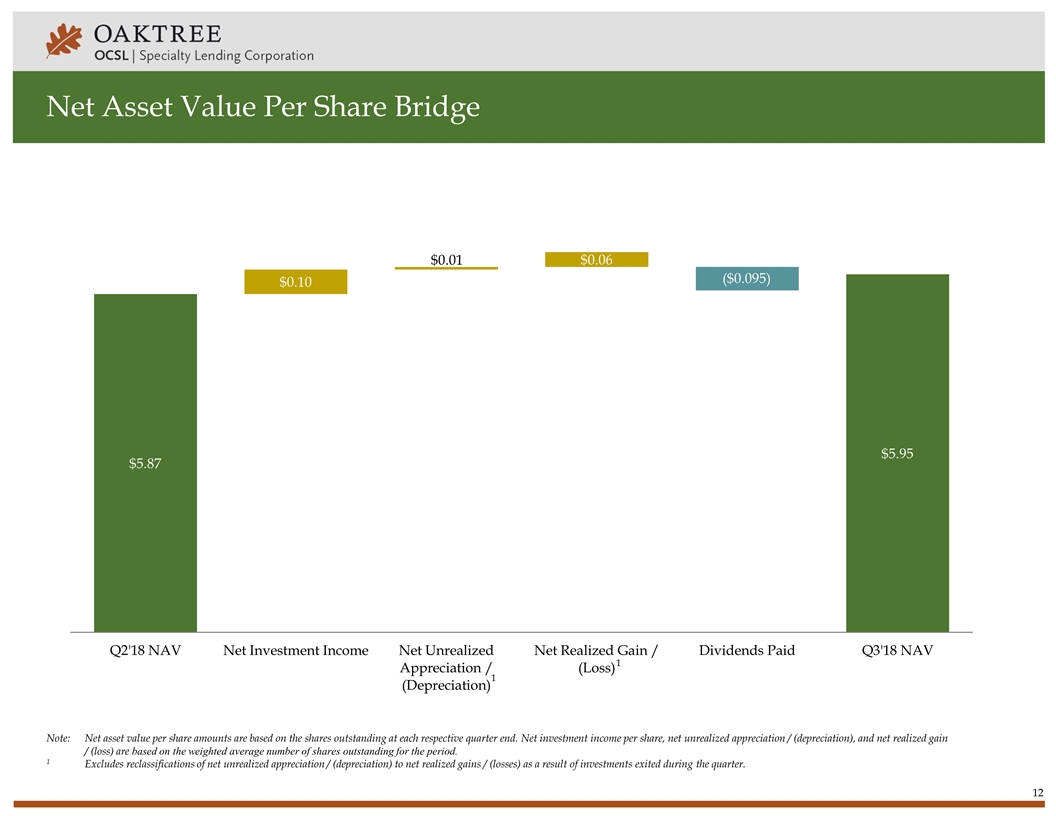
Net Asset Value Per Share Bridge ($0.095) Note:Net asset value per share amounts are based on the shares outstanding at each respective quarter end. Net investment income per share, net unrealized appreciation / (depreciation), and net realized gain / (loss) are based on the weighted average number of shares outstanding for the period. 1Excludes reclassifications of net unrealized appreciation / (depreciation) to net realized gains / (losses) as a result of investments exited during the quarter. 1 1 $0.01
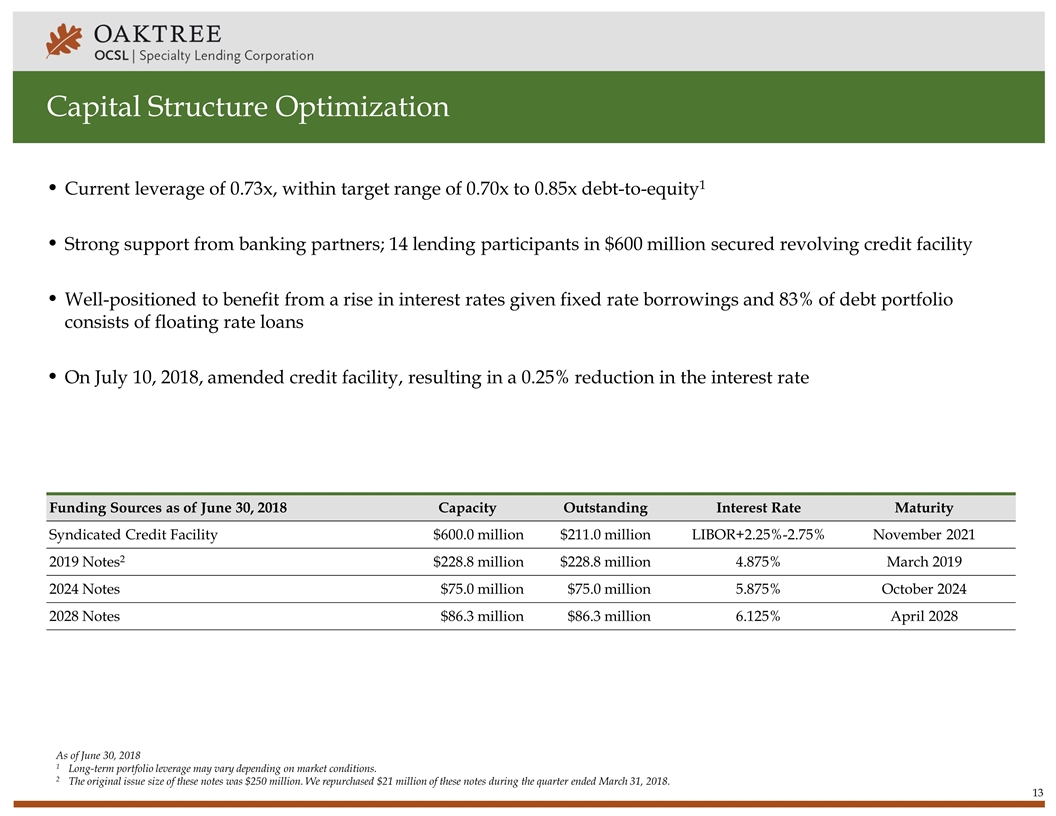
Capital Structure Optimization Funding Sources as of June 30, 2018 Capacity Outstanding Interest Rate Maturity Syndicated Credit Facility $600.0 million $211.0 million LIBOR+2.25%-2.75% November 2021 2019 Notes2 $228.8 million $228.8 million 4.875% March 2019 2024 Notes $75.0 million $75.0 million 5.875% October 2024 2028 Notes $86.3 million $86.3 million 6.125% April 2028 As of June 30, 2018 1Long-term portfolio leverage may vary depending on market conditions. 2 The original issue size of these notes was $250 million. We repurchased $21 million of these notes during the quarter ended March 31, 2018. Current leverage of 0.73x, within target range of 0.70x to 0.85x debt-to-equity1 Strong support from banking partners; 14 lending participants in $600 million secured revolving credit facility Well-positioned to benefit from a rise in interest rates given fixed rate borrowings and 83% of debt portfolio consists of floating rate loans On July 10, 2018, amended credit facility, resulting in a 0.25% reduction in the interest rate
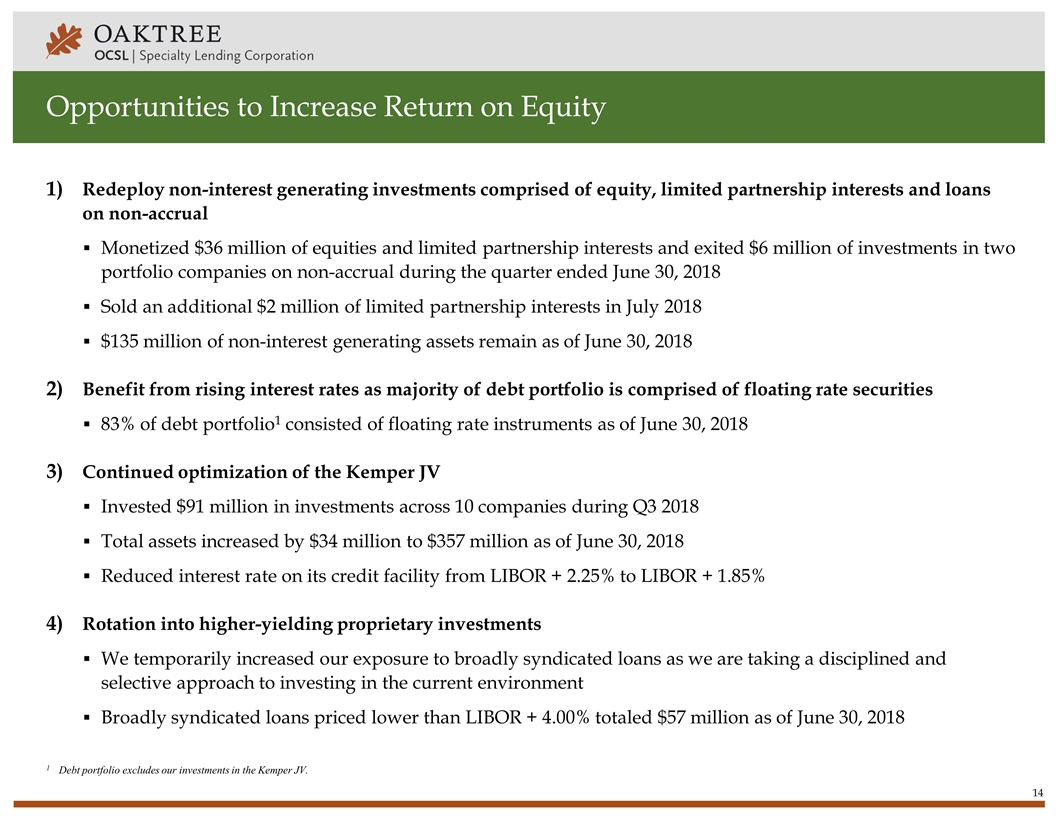
Opportunities to Increase Return on Equity Redeploy non-interest generating investments comprised of equity, limited partnership interests and loans on non-accrual Monetized $36 million of equities and limited partnership interests and exited $6 million of investments in two portfolio companies on non-accrual during the quarter ended June 30, 2018 Sold an additional $2 million of limited partnership interests in July 2018 $135 million of non-interest generating assets remain as of June 30, 2018 Benefit from rising interest rates as majority of debt portfolio is comprised of floating rate securities 83% of debt portfolio1 consisted of floating rate instruments as of June 30, 2018 Continued optimization of the Kemper JV Invested $91 million in investments across 10 companies during Q3 2018 Total assets increased by $34 million to $357 million as of June 30, 2018 Reduced interest rate on its credit facility from LIBOR + 2.25% to LIBOR + 1.85% Rotation into higher-yielding proprietary investments We temporarily increased our exposure to broadly syndicated loans as we are taking a disciplined and selective approach to investing in the current environment Broadly syndicated loans priced lower than LIBOR + 4.00% totaled $57 million as of June 30, 2018 1Debt portfolio excludes our investments in the Kemper JV.

Contact: Michael Mosticchio, Investor Relations ocsl-ir@oaktreecapital.com
