Attached files
| file | filename |
|---|---|
| EX-32.2 - EXHIBIT 32.2 - Oaktree Specialty Lending Corp | ocsl-ex322_0930201810xk.htm |
| EX-32.1 - EXHIBIT 32.1 - Oaktree Specialty Lending Corp | ocsl-ex321_0930201810xk.htm |
| EX-31.2 - EXHIBIT 31.2 - Oaktree Specialty Lending Corp | ocsl-ex312_0930201810xk.htm |
| EX-31.1 - EXHIBIT 31.1 - Oaktree Specialty Lending Corp | ocsl-ex311_0930201810xk.htm |
UNITED STATES SECURITIES AND EXCHANGE COMMISSION
Washington, DC 20549
Form 10-K
(Mark One)
þ | ANNUAL REPORT PURSUANT TO SECTION 13 OR 15(d) OF THE SECURITIES EXCHANGE ACT OF 1934 | |
For the fiscal year ended September 30, 2018 | ||
OR
¨ | TRANSITION REPORT PURSUANT TO SECTION 13 OR 15(d) OF THE SECURITIES EXCHANGE ACT OF 1934 | |
COMMISSION FILE NUMBER: 1-33901
Oaktree Specialty Lending Corporation
(EXACT NAME OF REGISTRANT AS SPECIFIED IN ITS CHARTER)
DELAWARE (State or jurisdiction of incorporation or organization) | 26-1219283 (I.R.S. Employer Identification No.) | |
333 South Grand Avenue, 28th Floor Los Angeles, CA (Address of principal executive office) | 90071 (Zip Code) | |
REGISTRANT’S TELEPHONE NUMBER, INCLUDING AREA CODE:
(213) 830-6300
SECURITIES REGISTERED PURSUANT TO SECTION 12(b) OF THE ACT:
Title of Each Class | Name of Each Exchange on Which Registered | |
Common Stock, par value $0.01 per share 5.875% Unsecured Notes due 2024 6.125% Unsecured Notes due 2028 | The Nasdaq Global Select Market The New York Stock Exchange The Nasdaq Global Select Market | |
SECURITIES REGISTERED PURSUANT TO SECTION 12(g) OF THE ACT: None
Indicate by check mark if the registrant is a well-known seasoned issuer, as defined in Rule 405 of the Securities Act. Yes ¨ No þ
Indicate by check mark if the registrant is not required to file reports pursuant to Section 13 or Section 15(d) of the Act. Yes ¨ No þ
Indicate by check mark whether the registrant (1) has filed all reports required to be filed by Section 13 or 15(d) of the Securities Exchange Act of 1934 during the preceding 12 months (or for such shorter periods as the registrant was required to file such reports), and (2) has been subject to such filing requirements for the past 90 days. Yes þ No ¨
Indicate by check mark whether the registrant has submitted electronically every Interactive Data File required to be submitted pursuant to Rule 405 of Regulation S-T during the preceding 12 months (or for such shorter period that the registrant was required to submit such files). Yes ¨ No ¨
Indicate by check mark if disclosure of delinquent filers pursuant to Item 405 of Regulation S-K is not contained herein, and will not be contained, to the best of registrant’s knowledge, in definitive proxy or information statements incorporated by reference in Part III of this Form 10-K or any amendment to this Form 10-K. þ
Indicate by check mark whether the registrant is a large accelerated filer, an accelerated filer, a non-accelerated filer, a smaller reporting company, or an emerging growth company. See the definitions of “large accelerated filer,” “accelerated filer,” “smaller reporting company” and "emerging growth company" in Rule 12b-2 of the Exchange Act.
Large accelerated filer ¨ | Accelerated filer þ | Non-accelerated filer ¨ | Smaller reporting company ¨ | |||
Emerging growth company ¨ | |||
If an emerging growth company, indicate by check mark if the registrant has elected not to use the extended transition period for complying with any new or revised financial accounting standards provided pursuant to Section 13(a) of the Exchange Act. ¨
Indicate by check mark whether the registrant is a shell company (as defined in Rule 12b-2 of the Act) Yes ¨ No þ
The aggregate market value of the registrant’s common stock held by non-affiliates of the registrant as of March 31, 2018 was $483.4 million. For the purposes of calculating the aggregate market value of common stock held by non-affiliates, the registrant has excluded (1) shares held by its current directors and officers and (2) those reported to be held by Fifth Street Holdings L.P. and Leonard M. Tannenbaum and his other affiliates. The registrant had 140,960,651 shares of common stock outstanding as of November 28, 2018.
DOCUMENTS INCORPORATED BY REFERENCE
Portions of the registrant’s definitive Proxy Statement relating to the registrant’s 2019 Annual Meeting of Stockholders, to be filed with the Securities and Exchange Commission, or the SEC, within 120 days following the end of the Company’s fiscal year, are incorporated by reference in Part III of this Annual Report on Form 10-K as indicated herein.
OAKTREE SPECIALTY LENDING CORPORATION
FORM 10-K FOR THE YEAR ENDED SEPTEMBER 30, 2018
TABLE OF CONTENTS
PART I | ||
Item 1. | ||
Item 1A. | ||
Item 1B. | ||
Item 2. | ||
Item 3. | ||
Item 4. | ||
PART II | ||
Item 5. | ||
Item 6. | ||
Item 7. | ||
Item 7A. | ||
Item 8. | ||
Item 9. | ||
Item 9A. | ||
Item 9B. | ||
PART III | ||
Item 10. | ||
Item 11. | ||
Item 12. | ||
Item 13. | ||
Item 14. | ||
PART IV | ||
Item 15. | ||
PART I
Item 1. Business
General
Oaktree Specialty Lending Corporation, a Delaware corporation, or together with its subsidiaries, where applicable, the Company, which may also be referred to as “we,” “us” or “our”, is a specialty finance company dedicated to providing customized, one-stop credit solutions to companies with limited access to public or syndicated capital markets. We were formed in late 2007 and currently operate as a closed-end, externally managed, non-diversified management investment company that has elected to be regulated as a Business Development Company under the Investment Company Act of 1940, as amended, or the Investment Company Act. In addition, we have qualified and elected to be treated as a regulated investment company, or RIC, under the Internal Revenue Code of 1986, as amended, or the Code, for tax purposes. See “Election to be Taxed as a Regulated Investment Company.” As a RIC, we generally will not have to pay corporate-level U.S. federal income taxes on any net ordinary income or net realized capital gains that we distribute to our stockholders if we meet certain source-of-income, income distribution and asset diversification requirements.
As of October 17, 2017, we are externally managed by Oaktree Capital Management, L.P., which we also refer to as “Oaktree” or our “Adviser,” pursuant to an Investment Advisory Agreement, dated October 17, 2017, or the Investment Advisory Agreement, between the Company and Oaktree. Oaktree is a subsidiary of Oaktree Capital Group, LLC, or OCG, a publicly traded Delaware limited liability company listed on the New York Stock Exchange under the ticker symbol "OAK". Oaktree Fund Administration, LLC, which we refer to as “Oaktree Administrator,” a subsidiary of our Adviser, provides certain administrative and other services necessary for us to operate. Prior to October 17, 2017, we were externally managed and advised by Fifth Street Management LLC, which we refer to as our “Former Adviser”, and we were named Fifth Street Finance Corp.
We seek to generate current income and capital appreciation by providing companies with flexible and innovative financing solutions, including first and second lien loans, unsecured and mezzanine loans and preferred equity. We may also seek to generate capital appreciation and income through secondary investments at discounts to par in either private or syndicated transactions. We invest in companies that typically possess business models we expect to be resilient in the future with underlying fundamentals that will provide strength in future downturns. We intend to deploy capital across credit and economic cycles with a focus on long-term results, which we believe will enable us to build lasting partnerships with financial sponsors and management teams, and we may seek to opportunistically take advantage of dislocations in the financial markets and other situations that may benefit from our Adviser’s credit and structuring expertise. Sponsors may include financial sponsors, such as an institutional investor or a private equity firm, or a strategic entity seeking to invest in a portfolio company.
Our Adviser intends to continue to reposition our portfolio into investments that are better aligned with our Adviser's overall approach to credit investing and that it believes have the potential to generate attractive returns across market cycles. Our Adviser is generally focused on middle-market companies, which we define as companies with enterprise values of between $100 million and $750 million. Going forward, we expect our portfolio to include a mix of approximately 40% to 60% of first and 35% to 55% of second lien loans, including asset backed loans, unitranche loans, mezzanine loans, approximately 5% to 15% of unsecured loans and 0% to 10% of preferred equity and certain equity co-investments. Our portfolio may also include certain structured finance and other non-traditional structures. We generally invest in securities that are rated below investment grade by rating agencies or that would be rated below investment grade if they were rated. Below investment grade securities, which are often referred to as “high yield” and “junk,” have predominantly speculative characteristics with respect to the issuer’s capacity to pay interest and repay principal.
Our portfolio totaled $1.5 billion at fair value as of September 30, 2018 and was comprised of 113 portfolio companies. These included loans to 87 companies, the investments in Senior Loan Fund JV I, LLC, or SLF JV I, and equity investments in 40 companies, including in SLF JV I and two private equity funds. Fifteen of the equity investments were in companies in which we also had a debt investment. At fair value, 95.0% of our portfolio consisted of debt investments and 75.4% of our portfolio consisted of senior secured loans as of September 30, 2018. The weighted average annual yield of our debt investments as of September 30, 2018, including the return on our mezzanine note investment in SLF JV I, was approximately 8.4%, including 8.2% representing cash payments. The weighted average annual yield of our debt investments is determined before the payment of, and therefore does not take into account, our expenses and the payment by an investor of any stockholder transaction expenses, and does not represent the return on investment for our stockholders.
We are permitted to, and expect to continue to, finance our investments through borrowings. We generally expect to target a debt to equity ratio of 0.70x to 0.85x (i.e., one dollar of equity for each $0.70 to $0.85 of debt outstanding). As of September 30, 2018, we had a debt to equity ratio of 0.75x (i.e., one dollar of equity for each $0.75 of debt outstanding). As a
Business Development Company, subject to certain limited exceptions, we are currently only allowed to borrow amounts such that our asset coverage, as defined in the Investment Company Act, equals at least 200% after such borrowing. On March 23, 2018, the Small Business Credit Availability Act, or the SBCAA, was enacted into law. The SBCAA, among other things, amended Section 61(a) of the Investment Company Act to add a new Section 61(a)(2) that reduces the asset coverage requirement applicable to Business Development Companies from 200% to 150% so long as the Business Development Company meets certain disclosure requirements and obtains certain approvals. Our Board of Directors has not taken any action to reduce the asset coverage requirements applicable to us.
Joint Venture
We and Trinity Universal Insurance Company, a subsidiary of Kemper Corporation, or Kemper, also co-invest through SLF JV I, an unconsolidated Delaware limited liability company. SLF JV I was formed in May 2014 to invest in middle-market and other corporate debt securities. As of September 30, 2018, we and Kemper had funded an aggregate of approximately $165.5 million to SLF JV I, of which $144.8 million was from us. As of September 30, 2018, we and Kemper had the option to fund additional debt investments in SLF JV I, subject to additional equity funding to SLF JV I from us and Kemper. Additionally, SLF JV I has a senior revolving credit facility with Deutsche Bank AG, New York Branch, as amended, or the Deutsche Bank I Facility, which permitted up to $200.0 million of borrowings as of September 30, 2018. Borrowings under the Deutsche Bank I Facility are secured by all of the assets of a special purpose financing subsidiary of SLF JV I. SLF JV I is managed by a four person Board of Directors, two of whom are selected by us and two of whom are selected by Kemper. SLF JV I is generally capitalized as transactions are completed and all portfolio decisions must be approved by its investment committee consisting of one representative selected by us and one representative selected by Kemper (with approval of each required). As of September 30, 2018, our investment in SLF JV I was approximately $129.4 million at fair value. We do not consolidate SLF JV I in our Consolidated Financial Statements.
Our Adviser
We are externally managed and advised by Oaktree, a registered investment adviser under the Investment Advisers Act of 1940, as amended, or the Advisers Act. Oaktree, subject to the overall supervision of our Board of Directors, manages our day-to-day operations, and provides investment advisory services to us pursuant to the Investment Advisory Agreement.
Our Adviser is a leading global investment management firm headquartered in Los Angeles, California, focused on less efficient markets and alternative investments. A number of our Adviser’s senior executives and investment professionals have been investing together for over 32 years and have generated impressive investment performance through multiple market cycles. As of September 30, 2018, our Adviser (together with its affiliates) had approximately $123.5 billion in assets under management1. Our Adviser emphasizes an opportunistic, value-oriented and risk-controlled approach to investments in distressed debt, corporate debt (including high-yield debt and senior loans), control investing, real estate, convertible securities and listed equities.
Our Adviser’s primary firm-wide goal is to achieve attractive returns while bearing less than commensurate risk. Our Adviser believes that it can achieve this goal by taking advantage of market inefficiencies in which financial markets and their participants fail to accurately value assets or fail to make available to companies the capital that they reasonably require.
Our Adviser believes that its defining characteristic is its adherence to the highest professional standards, which has yielded several important benefits. First and foremost, this characteristic has allowed our Adviser to attract and retain an extremely talented group of investment professionals, or the Investment Professionals. Further, it has permitted the investment team to build strong relationships with brokers, banks and other market participants. These institutional relationships have been instrumental in strengthening access to trading opportunities, to understanding the current market, and to executing the investment team’s investment strategies.
______________________
1 References to “assets under management” or “AUM” represent assets managed by our Adviser and a proportionate amount ($24.7 billion) of the AUM reported by DoubleLine Capital LP, or Doubleline, in which our Adviser owns a 20% minority interest. Our Adviser’s methodology for calculating AUM includes (i) the net asset value of assets managed directly by our Adviser, (ii) the leverage on which management fees are charged, (iii) undrawn capital that our Adviser is entitled to call from investors in Oaktree funds pursuant to their capital commitments, (iv) for collateralized loan obligation vehicles, or CLOs, the aggregate par value of collateral assets and principal cash, (v) for publicly-traded Business Development Companies, gross assets (including assets acquired with leverage), net of cash, and (vi) our Adviser’s pro rata portion of the AUM reported by DoubleLine. Our Adviser’s calculation of AUM may differ from the calculations of other asset managers and, as a result, our Adviser’s measurements of AUM may not be comparable to similar measures presented by other asset managers. Our Adviser’s definition of AUM is not based on the definitions of AUM that may be set forth in agreements governing the investment funds, vehicles or accounts that it manages and is not calculated pursuant to regulatory definitions.
2
Our Adviser and its affiliates provide discretionary investment management services to other managed accounts and investment funds, which may have overlapping investment objectives and strategies with our own and, accordingly, may invest in asset classes similar to those targeted by us. The activities of such managed accounts and investment funds may raise actual or potential conflicts of interest.
Oaktree Senior Executives
Our Adviser’s current senior executives are Howard Marks, Bruce Karsh, Jay Wintrob, John Frank and Sheldon Stone. The original founders formed Oaktree in April 1995 after having managed funds in the high-yield bond, distressed debt, private equity and convertible securities areas of Trust Company of the West for approximately 10 years. The senior executives have led the investment of clients’ funds in the consistent, risk-controlled manner called for by our Adviser’s philosophy, generally resulting in an impressive track record, reduced risk and highly satisfied clients.
Oaktree’s Professionals
Our Adviser is dedicated to highly professional management in a limited number of specialized investment niches. Its strength is its staff of over 900 people, including more than 350 investment, legal and compliance professionals and over 400 administrative and marketing professionals as of September 30, 2018. The professionals are active in portfolio management, investment analysis, trading, legal, client service and administration. The Strategic Credit group has 21 investment professionals who focus on the investment strategy employed by our Adviser and certain of its affiliates.
Strategic Credit
Our Adviser officially launched its Strategic Credit strategy in early 2013 as a step-out from its Distressed Debt strategy, to capture attractive investment opportunities that appear to offer too little return for distressed debt investors, but may pose too much uncertainty for high-yield bond creditors. The strategy seeks to achieve an attractive total return by investing in public and private performing debt.
Strategic Credit focuses on U.S. and non-U.S. investment opportunities that arise from pricing inefficiencies that occur in the primary and secondary markets or from the financing needs of healthy companies with limited access to traditional lenders or public markets. Typical investments will be in high yield bonds and senior secured loans for borrowers that are in need of direct loans, rescue financings, or other capital solutions or that have had challenged or unsuccessful primary offerings.
The Investment Professionals employ a fundamental, value-driven opportunistic approach to credit investing, which seeks to benefit from the resources, relationships and proprietary information of our Adviser’s global investment platform.
Oaktree’s Investment Approach
By implementing our investment strategy, the Investment Professionals seek to create value at all stages of the investing process. Our Adviser believes that the foundation for all investments, and the basis for the success that has been enjoyed by the Investment Professionals to date, is the thorough analysis of a company’s fundamentals and intrinsic value. The Investment Professionals start by capitalizing on investment opportunities (a) that they source or (b) that other Oaktree investment teams source but that do not meet their strategies’ return objectives. Next, the Investment Professionals execute trades in an attempt to obtain relatively low purchase prices that should provide additional “downside protection.” After an investment is made, the Investment Professionals monitor the progress of each investment, sometimes providing financial and strategic advice. Importantly, the Investment Professionals seek to determine the optimal time and strategy for exiting and maximizing the return on the investment.
The Transaction and the Investment Advisory Agreement with Oaktree
On July 13, 2017, Oaktree entered into an Asset Purchase Agreement, or the Purchase Agreement, with our Former Adviser and, for certain limited purposes, Fifth Street Asset Management Inc., or FSAM, the indirect, partial owner of our Former Adviser, and Fifth Street Holdings L.P., the direct, partial owner of our Former Adviser.
In order to ensure that the transactions contemplated by the Purchase Agreement, or the Transaction, complied with Section 15(f) of the Investment Company Act, our Adviser and our Former Adviser agreed to certain conditions. First, through October 17, 2020, at least 75% of the members of our Board of Directors must not be interested persons of Oaktree or our Former Adviser. Second, an “unfair burden” must not be imposed on us as a result of the closing of the Transaction or any express or implied terms, conditions or understandings applicable thereto during the two-year period after the closing of the Transaction. In addition, for the two-year period commencing on October 17, 2017, Oaktree will waive, to the extent necessary, any management or incentive fees payable under the Investment Advisory Agreement that exceed what would have been paid to the Former Adviser in the aggregate under the Former Investment Advisory Agreement (as defined below).
3
Upon the closing of the Transaction on October 17, 2017, Oaktree became the investment adviser to each of Oaktree Strategic Income Corporation (formerly known as Fifth Street Senior Floating Rate Corp.), or OCSI, and us. The closing of the Transaction resulted in an assignment for purposes of the Investment Company Act of the investment advisory agreement between our Former Adviser and us, or the Former Investment Advisory Agreement, and, as a result, its immediate termination. The material terms of the services provided under the Investment Advisory Agreement, other than the fee structure, are substantially the same as the Former Investment Advisory Agreement, except that services are provided by Oaktree.
Our Administrator
We entered into an administration agreement, or the Administration Agreement, with Oaktree Administrator, a Delaware limited liability company and a wholly owned subsidiary of Oaktree. The principal executive offices of Oaktree Administrator are located at 333 South Grand Avenue, 28th Floor, Los Angeles, CA 90071. Pursuant to the Administration Agreement, Oaktree Administrator provides services to us, and we reimburse Oaktree Administrator for costs and expenses incurred by Oaktree Administrator in performing its obligations under the Administration Agreement and providing personnel and facilities thereunder.
Business Strategy
We seek to generate current income and capital appreciation by providing companies with flexible and innovative financing solutions, including first and second lien loans, unsecured and mezzanine loans and preferred equity. We may also seek to generate capital appreciation and income through secondary investments at discounts to par in either private or syndicated transactions. We intend to invest in companies across a variety of industries that typically possess business models we expect to be resilient in the future with underlying fundamentals that will provide strength in future downturns. We intend to deploy capital across credit and economic cycles with a focus on long-term results, which we believe will enable us to build lasting partnerships with financial sponsors and management teams, and we may seek to opportunistically take advantage of dislocations in the financial markets and other situations that may benefit from our Adviser’s deep credit and structuring expertise. Our Adviser intends to implement the following business strategy to achieve our investment objective:
• | Completion of Portfolio Repositioning. Our Adviser intends to generate a competitive return on equity and sustainable, consistent dividends through (1) opportunistically investing across the capital structure, (2) seeking to take advantage of dislocations in financing markets and other situations that may benefit from our Adviser’s restructuring expertise and (3) generating capital appreciation and income through secondary investments at discounts to par in either private or syndicated transactions. |
• | Emphasis on Proprietary Deals. Our Adviser is primarily focused on proprietary opportunities as well as partnering with other lenders as appropriate. Dedicated sourcing professionals of our Adviser are in continuous contact with financial sponsors and corporate clients to originate proprietary deals and seek to leverage the networks and relationships of Oaktree’s over 250 Investment Professionals with management teams and corporations to originate non-sponsored transactions. Since 2005, our Adviser has invested more than $11 billion in over 250 directly originated loans, and the Oaktree platform has the capacity to invest in large deals and to solely underwrite transactions. |
• | Focus On Quality Companies And Extensive Diligence. Our Adviser seeks to maintain a conservative approach to investing with discipline around fundamental credit analysis and downside protection. Our Adviser intends to focus on companies with business models we expect to be resilient in the future, underlying fundamentals that will provide strength in future downturns, significant asset or enterprise value and seasoned management teams, although not all portfolio companies will meet each of these criteria. Our Adviser intends to leverage its deep credit and deal structuring expertise to lend to companies that have unique needs, complex business models or specific business challenges. Our Adviser conducts diligence on underlying collateral value, including cash flows, hard assets or intellectual property, and will typically model exit scenarios as part of the diligence process, including assessing potential “work-out” scenarios. |
• | Disciplined Portfolio Management. Our Adviser monitors our portfolio on an ongoing basis to manage risk and take preemptive action to resolve potential problems where possible. Our Adviser intends to seek to reduce the impact of individual investment risks by limiting positions to no more than 5% of our portfolio. |
• | Manage Risk Through Loan Structures. Our Adviser seeks to leverage its experience in identifying structural risks in prospective portfolio companies and developing customized solutions in an effort to enhance downside protection where possible. Our Adviser has the expertise to structure comprehensive, flexible and customized solutions for companies of all sizes across numerous industry sectors. Our Adviser employs a rigorous due diligence process and seeks to include covenant protections designed to ensure that we, as the lender, can negotiate with a portfolio company |
4
before a deal reaches impairment. The Oaktree platform has the ability to address a wide range of borrower needs, with capability to invest across the capital structure and to fund large loans, and our Adviser pays close attention to market trends. Our Adviser provides certainty to borrowers by seeking to provide fully underwritten financing commitments and has expertise in both performing credit as well as restructuring and turnaround situations, which we expect will allow us to invest and lend during times of market stress when our competitors may halt investment activity.
Our Adviser’s emphasis is on fundamental credit analysis, consistency and downside protection, all of which are key tenets of its investment philosophy. We believe this philosophy strongly aligns with the interests of our stockholders. Our Adviser controls primarily for risk, rather than return. Although this may lead us to underperform in bullish markets, we expect that prudence across the economic cycle and limiting losses will allow us to achieve our investment objectives.
Identification of Investment Opportunities
According to the National Center for the Middle Market, as of the second quarter of 2018, there were nearly 200,000 businesses with annual revenues of $10 million to $1 billion, which businesses represented one-third of private sector U.S. gross domestic product and accounted for approximately 48 million jobs in the United States and, according to the S&P Global Market Intelligence LCD Middle Market Review, during the first nine months of the 2018 calendar year, middle-market lending volume exceeded $20 billion for deal sizes of less than $350 million, much of which we believe has been used to finance leveraged buyouts, recapitalizations, capital expenditures and acquisitions. The Investment Professionals employ a rigorous process to identify and evaluate potential investments within this large market. Central to the Investment Professionals’ investment process is the goal of exploiting market dislocations and inefficiencies driven by macro factors, market-level changes and company characteristics.
Macro Factors
Macro factors that drive market dislocations occur throughout the global economy and include sovereign debt crises, political elections and other unexpected geopolitical events. These factors drive highly correlated “risk on” and “risk off” market swings and frequently result in the indiscriminate selling or buying of securities and obligations at prices that the Investment Professionals believe are well below or above their intrinsic values.
Market-Level Changes
We believe that many commercial banks have decreased their lending to middle-market companies in recent years, which has created an opportunity for non-traditional market participants. In addition, we believe that increased regulation of financial markets and its participants, such as Basel III and the Dodd-Frank Wall Street Reform and Consumer Protection Act of 2010, or the Dodd-Frank Act, has resulted in traditional capital providers focusing on only higher-quality and more liquid opportunities. The lower-rated portion of the market is often less efficiently priced due to limited capital availability, which allows for more attractive risk and return opportunities.
Company Characteristics
Company-specific factors that drive market dislocations include over-leveraged balance sheets, near-term liquidity or maturity issues, secular pressures on businesses, acute shock to company operations, asset-light businesses and new or relatively small issuers. These factors may result in mispriced securities or obligations or require a highly structured direct loan.
The Investment Professionals believe current market conditions give rise to two primary sources of investment opportunities with favorable risk-reward characteristics. The first source is private debt, which capitalizes on the Investment Professionals’ experience in negotiating and structuring complex debt investments. Private debt can include (a) loan portfolios that banks need to sell in response to regulatory capital pressure, (b) capital solutions, which involve customized, negotiated solutions for companies unable to access traditional syndicated loan and high yield markets, (c) rescue financings, which are transactions structured to provide liquidity to companies with overleveraged balance sheets, often on an urgent basis and (d) other direct loan investments to support acquisitions or capital projects that are unable to obtain financing via more traditional channels. The second source is marketable securities or other forms of traded debt, which the Investment Professionals intend to purchase on the secondary market at prices they believe are below their intrinsic value. Once the Investment Professionals have identified a potential investment opportunity, they will evaluate the opportunity against the following investment criteria and guidelines. However, not all of these criteria will be met by each prospective portfolio company in which we invest.
• | Equity Cushion. We generally expect to invest in loans that have covenants that may help to minimize our risk of capital loss and meaningful equity investments in the portfolio company. We intend to target investments that have |
5
strong credit protections, including default penalties, information rights and affirmative, negative and financial covenants, such as limitations on debt incurrence, lien protection and prohibitions on dividends.
• | Sustainable Cash Flow. Our investment philosophy places emphasis on fundamental analysis from an investor’s perspective and has a distinct value orientation. We intend to focus on companies with significant asset or enterprise value in which we can invest at relatively low multiples of normalized operating cash flow. Additionally, we anticipate investing in companies with a demonstrated ability or credible plan to de-lever. Typically, we will not invest in start-up companies, companies having speculative business plans or structures that could impair capital over the long-term although we may target certain earlier stage companies that have yet to reach profitability. |
• | Experienced Management Team. We generally will look to invest in portfolio companies with an experienced management team and proper incentive arrangements, including equity compensation, to induce management to succeed and to act in concert with our interests as investors. |
• | Strong Relative Position In Its Market. We intend to target companies with what we believe to be established and leading market positions within their respective markets and well-developed long-term business strategies. |
• | Exit Strategy. We generally intend to invest in companies that we believe will provide us with the opportunity to exit our investments in three to eight years, including through (1) the repayment of the remaining principal outstanding at maturity, (2) the recapitalization of the company resulting in our debt investments being repaid and (3) the sale of the company resulting in the repayment of all of its outstanding debt. |
• | Geography. As a Business Development Company, we will invest at least 70% of our investments in U.S. companies. To the extent we invest in non-U.S. companies, we intend to do so in accordance with Investment Company Act limitations and only in jurisdictions with established legal frameworks and a history of respecting creditor rights. |
Investment Process
Our investment process consists of the following five distinct stages.
Source
Strategic Credit has dedicated sourcing professionals and also leverages its strong market presences and relationships across Oaktree’s global platform, which includes more than 250 highly-experienced Investment Professionals, to gain access to opportunities from advisers, sponsors, banks, management teams, capital raising advisers and other sources. Our Adviser is a trusted partner to financial sponsors and management teams based on its long-term commitment and focus on lending across economic cycles. We believe this will give us access to proprietary deal flow and "first looks" at investment opportunities and that we are well-positioned for difficult and complex transactions.
Screen Using Investment Criteria
We expect to be highly selective in making new investments. The initial screening process will typically include a review of the proposed capital structure of the portfolio company, including level of assets or enterprise value coverage, an assessment by our Adviser of the company’s management team and its equity ownership levels as well as the viability of its long-term business model, and a review of forecasted financial statements and liquidity profile. In addition, our Adviser may assess the prospect of industry or macroeconomic catalysts that may create enhanced value in the investment as well as the potential ability to enforce creditor rights, particularly where collateral is located outside of the United States.
Research
Prior to making any new investment, our Adviser intends to engage in an extensive due diligence process led by investment analysts assigned to each transaction. The analysts will assess a company’s management team, products, services, competitive position in its markets, barriers to entry and operating and financial performance, as well as the growth potential of its markets. In performing this evaluation, the analysts may use financial, descriptive and other due diligence materials provided by the target company, commissioned third party reports and internal sources, including members of the investment team, industry participants and experts with whom our Adviser has relationships. As part of the research process, our Adviser’s analysts typically perform a “what-if” analysis that explores a range of values for each proposed investment and a range of potential credit events.
6
Evaluate
Our Adviser assesses each potential investment through a rigorous, collaborative decision-making process. Our Adviser applies disciplined investment criteria and evaluates potential risk and reward of each investment with significant focus on downside risk. Our Adviser sizes investments at the portfolio level across a variety of characteristics, including based on the investment criteria described above.
Monitor
Our Adviser prioritizes managing risk. In managing our portfolio, our Adviser intends to monitor each portfolio company and be well-positioned to make hold and exit decisions when credit events occur, our collateral becomes overvalued or opportunities with more attractive risk/reward profiles are identified. Investment analysts will be assigned to each investment to monitor industry developments, review company financial statements, attend company presentations and regularly speak with company management. In circumstances where a particular investment is underperforming, our Adviser intends to employ a variety of strategies to maximize its recovery based on the specific facts and circumstances of the underperforming investment, including actively working with the management to restructure all or a portion of the business, explore the possibility of a sale or merger of all or a portion of the assets, recapitalize or refinance the balance sheet, negotiate deferrals or other concessions from existing creditors and arrange new liquidity or new equity contributions. We believe that our Adviser’s experience with restructurings and our access to our Adviser’s deep knowledge, expertise and contacts in the distressed debt area will help us preserve the value of our investments.
Investments
Our investment objective is to generate current income and capital appreciation. We target debt investments that will generate current income and also provide the opportunity for capital appreciation through our ownership of equity securities in certain of our portfolio companies. We seek to structure our debt investments to provide downside protection through strong credit protections, including default penalties, information rights and affirmative, negative and financial covenants, such as limitations on debt incurrence, lien protection and prohibitions on dividends, although not all of our investments will meet each of the criteria. Our Adviser has expertise in creative, efficient structuring and institutional knowledge of bankruptcy and restructurings, enabling our Adviser to focus on risk control. Our debt investments may be collateralized by a first or second lien on the assets of the portfolio company. As of September 30, 2018, 75.4% of our portfolio at fair value consisted of debt investments that were secured by first or second priority liens on the assets of the portfolio company.
Debt Investments
We intend to tailor the terms of each investment by negotiating a structure that seeks to protect our rights and manage our risk while creating incentives for the portfolio company to achieve its business plan. A substantial source of return is monthly or quarterly cash interest that we collect on our debt investments. We expect that our Adviser will focus on middle-market companies, which we define as companies with enterprise values of between $100 and $750 million. Going forward, we expect our portfolio to include a mix of senior secured loans, including asset backed loans, unitranche loans, unsecured and mezzanine loans, bonds, preferred equity and certain equity co-investments as well as certain structured finance and other non-traditional structures.
• | First Lien Loans. Our first lien loans generally have terms of three to seven years, provide for a variable or fixed interest rate, contain prepayment penalties and are secured by a first priority security interest in all existing and future assets of the borrower. Our first lien loans may take many forms, including revolving lines of credit, term loans and acquisition lines of credit. |
• | Unitranche Loans. Our unitranche loans generally have terms of five to seven years and provide for a variable or fixed interest rate, contain prepayment penalties and are generally secured by a first priority security interest in all existing and future assets of the borrower. Our unitranche loans may take many forms, including revolving lines of credit, term loans and acquisition lines of credit. |
• | Second Lien Loans. Our second lien loans generally have terms of five to eight years, provide for a variable or fixed interest rate, contain prepayment penalties and are secured by a second priority security interest in all existing and future assets of the borrower. Our second lien loans may include payment-in-kind, or PIK, interest, which represents contractual interest accrued and added to the principal that generally becomes due at maturity. |
• | Mezzanine Loans. Our mezzanine loans generally have maturities of five to ten years. Mezzanine loans may take the form of a second priority lien on the assets of a portfolio company and have interest-only payments in the early years with cash or PIK payments with amortization of principal deferred to the later years. In some cases, we may invest in |
7
debt securities that, by their terms, convert into equity or additional debt securities or defer payments of interest for the first few years after our investment.
• | Unsecured Loans. Our unsecured investments generally have terms of five to ten years and provide for a fixed interest rate. We may make unsecured investments on a stand-alone basis, or in connection with a senior secured loan, a junior secured loan or a “one-stop” financing. Our unsecured investments may include PIK interest and an equity component, such as warrants to purchase common stock in the portfolio company. |
• | Bonds. We may selectively invest in high yield corporate bonds issued by middle-market companies that are rated below investment grade by rating agencies or that would be rated below investment grade if they were rated. The bonds in which we may invest are expected to have terms of five to eight years and provide for fixed interest rate payments. We do not expect that these bonds would be secured by any assets of the issuer. |
Equity Investments
When we make a debt investment, we may be granted equity in the company in the same class of security as the sponsor receives upon funding. In addition, from time to time we may make non-control, equity co-investments in connection with private equity sponsors. We generally seek to structure our equity investments, such as direct equity co-investments, to provide us with minority rights provisions and event-driven put rights. We also seek to obtain limited registration rights in connection with these investments, which may include “piggyback” registration rights.
SLF JV I
We have invested in SLF JV I, which as of September 30, 2018, primarily consisted of a portfolio of senior secured loans to 40 portfolio companies. The portfolio companies are in industries similar to the companies in our portfolio.
Monitoring and Sale of Investments
After an investment is made, the Investment Professionals monitor industry and company fundamentals and the risk-reward profile of the securities and obligations we hold, including where such securities or obligations sit in a company’s capital structure and the risk of any impairment to our holdings as a result of any refinancings or other restructurings or increased financial stress experienced by such company. Based on their monitoring, the Investment Professionals seek to determine the optimal time and strategy for exiting and maximizing the return on the investment, typically when prices or yields reach target valuations.
Valuation Procedures
As a Business Development Company, we generally invest in illiquid debt and equity securities issued by private middle-market companies. We are required to carry our portfolio investments at market value or, if there is no readily available market value, at fair value as determined by our Board of Directors. See “Item 7. Management’s Discussion and Analysis of Financial Condition and Results of Operations – Critical Accounting Policies – Investment Valuation” for a description of our investment valuation processes and procedures.
Investment Advisory Agreement
The following is a description of the Investment Advisory Agreement, which has been in effect since October 17, 2017.
Management Services
Subject to the overall supervision of our Board of Directors, Oaktree manages our day-to-day operations and provides us with investment advisory services. Under the Investment Advisory Agreement, Oaktree:
• | determines the composition of our portfolio, the nature and timing of the changes to our portfolio and the manner of implementing such changes; |
• | identifies, evaluates and negotiates the structure of the investments we make; |
• | executes, closes, monitors and services the investments we make; |
• | determines what securities and other assets we purchase, retain or sell; and |
• | performs due diligence on prospective portfolio companies. |
The Investment Advisory Agreement provides that Oaktree’s services are not exclusive to us and Oaktree is generally free to furnish similar services to other entities so long as its services to us are not impaired.
8
Management Fee
Under the Investment Advisory Agreement, we pay Oaktree a fee for its services under the investment advisory agreement consisting of two components: a base management fee and an incentive fee. The cost of both the base management fee payable to Oaktree and any incentive fees earned by Oaktree is ultimately borne by our common stockholders.
Base Management Fee
Under the Investment Advisory Agreement, the base management fee is calculated at an annual rate of 1.50% of total gross assets, including any investment made with borrowings, but excluding cash and cash equivalents.
Incentive Fee
The incentive fee consists of two parts. Under the Investment Advisory Agreement, the first part of the incentive fee, which is referred to as the incentive fee on income or the Part I incentive fee, is calculated and payable quarterly in arrears based upon our “pre-incentive fee net investment income” for the immediately preceding quarter. The payment of the incentive fee on income is subject to payment of a preferred return to investors each quarter (i.e., a “hurdle rate”), expressed as a rate of return on the value of our net assets at the end of the most recently completed quarter, of 1.50%, subject to a “catch up” feature.
For this purpose, “pre-incentive fee net investment income” means interest income, dividend income and any other income (including any other fees such as commitment, origination, structuring, diligence and consulting fees or other fees that we receive from portfolio companies, other than fees for providing managerial assistance) accrued during the fiscal quarter, minus our operating expenses for the quarter (including the base management fee, expenses payable under the Administration Agreement and any interest expense and dividends paid on any issued and outstanding preferred stock, but excluding the incentive fee). Pre-incentive fee net investment income includes, in the case of investments with a deferred interest feature (such as original issue discount, or OID, debt instruments with PIK interest and zero coupon securities), accrued income that we have not yet received in cash. Pre-incentive fee net investment income does not include any realized capital gains, realized capital losses or unrealized capital appreciation or depreciation.
Under the Investment Advisory Agreement, the calculation of the incentive fee on income for each quarter is as follows:
• | No incentive fee is payable to Oaktree in any quarter in which our pre-incentive fee net investment income does not exceed the preferred return rate of 1.50% (the “preferred return”) on net assets. |
• | 100% of our pre-incentive fee net investment income, if any, that exceeds the preferred return but is less than or equal to 1.8182% in any fiscal quarter is payable to Oaktree. We refer to this portion of the incentive fee on income as the “catch-up” provision, and it is intended to provide Oaktree with an incentive fee of 17.5% on all of our pre-incentive fee net investment income when our pre-incentive fee net investment income reaches 1.8182% on net assets in any fiscal quarter. |
• | For any quarter in which our pre-incentive fee net investment income exceeds 1.8182% on net assets, the incentive fee on income is equal to 17.5% of the amount of our pre-incentive fee net investment income, as the preferred return and catch-up will have been achieved. |
There is no accumulation of amounts on the hurdle rate from quarter to quarter and accordingly there is no clawback of amounts previously paid if subsequent quarters are below the quarterly hurdle.
The following is a graphical representation of the calculation of the incentive fee on income under the Investment Advisory Agreement:
Quarterly Incentive Fee on Income
Pre-incentive fee net investment income
(expressed as a percentage of net assets)
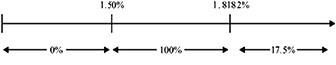
Percentage of pre-incentive fee net investment income allocated to income-related portion of incentive fee
9
Under the Investment Advisory Agreement, the second part of the incentive fee will be determined and payable in arrears as of the end of each fiscal year (or upon termination of the Investment Advisory Agreement, as of the termination date) commencing with the fiscal year ending September 30, 2019 and will equal 17.5% of our realized capital gains, if any, on a cumulative basis from the beginning of the fiscal year ending September 30, 2019 through the end of each fiscal year, computed net of all realized capital losses and unrealized capital depreciation on a cumulative basis, less the aggregate amount of any previously paid capital gain incentive fees under the Investment Advisory Agreement. Any realized capital gains, realized capital losses, unrealized capital appreciation and unrealized capital depreciation with respect to our portfolio as of the end of the fiscal year ending September 30, 2018 will be excluded from the calculations of the second part of the incentive fee.
Examples of Quarterly Incentive Fee Calculation under the Investment Advisory Agreement (A)
Example 1: Incentive Fee on Income for Each Quarter
Alternative 1
Assumptions
Investment income (including interest, dividends, fees, etc.) = 2%
Preferred return under the Investment Advisory Agreement1 = 1.50%
Management fee under the Investment Advisory Agreement2 = 0.375%
Other expenses (legal, accounting, custodian, transfer agent, etc.) = 0.20%
Pre-incentive fee net investment income
(investment income - (management fee + other expenses)) = 1.425%
Pre-incentive fee net investment income does not exceed the preferred return under the Investment Advisory Agreement, therefore there is no incentive fee on income under the Investment Advisory Agreement.
Alternative 2
Assumptions
Investment income (including interest, dividends, fees, etc.) = 2.375%
Preferred return under the Investment Advisory Agreement1 = 1.50%
Management fee under the Investment Advisory Agreement2 = 0.375%
Other expenses (legal, accounting, custodian, transfer agent, etc.) = 0.20%
Pre-incentive fee net investment income
(investment income - (management fee + other expenses)) = 1.80%
Incentive fee = 17.5% × pre-incentive fee net investment income, subject to “catch-up”3
= 100% × (1.80% - 1.50%)
= 0.30%
Alternative 3
Assumptions
Investment income (including interest, dividends, fees, etc.) = 3.5%
Preferred return under the Investment Advisory Agreement1 = 1.50%
Management fee under the Investment Advisory Agreement2 = 0.375%
Other expenses (legal, accounting, custodian, transfer agent, etc.) = 0.20%
Pre-incentive fee net investment income
(investment income - (management fee + other expenses)) = 2.925%
Incentive fee = 17.5% × pre-incentive fee net investment income, subject to “catch-up”3
Incentive fee = 100% × “catch-up” + (17.5% × (pre-incentive fee net investment income - 1.8182%))
Catch-up = 1.8182% - 1.50% = 0.3182%
Incentive fee = (100% × 0.3182%) + (17.5% × (2.925% - 1.8182%))
= 0.3182% + (17.5% × 1.1068%)
= 0.3182% + 0.1937%
= 0.5119%
Example 2: Incentive Fee on Capital Gains under the Investment Advisory Agreement
Assumptions
• | Year 1: $10 million investment made in Company A (“Investment A”), $10 million investment made in Company B (“Investment B”), $10 million investment made in Company C (“Investment C”), $10 million investment made in Company D (“Investment D”) and $10 million investment made in Company E (“Investment E”). |
10
• | Year 2: Investment A sold for $20 million, fair market value (“FMV”) of Investment B determined to be $8 million, FMV of Investment C determined to be $12 million, and FMV of Investments D and E each determined to be $10 million. |
• | Year 3: FMV of Investment B determined to be $8 million, FMV of Investment C determined to be $14 million, FMV of Investment D determined to be $14 million and FMV of Investment E determined to be $16 million. |
• | Year 4: Investment D sold for $12 million, FMV of Investment B determined to be $10 million, FMV of Investment C determined to be $16 million and FMV of Investment E determined to be $14 million. |
• | Year 5: Investment C sold for $20 million, FMV of Investment B determined to be $14 million and FMV of Investment E determined to be $10 million. |
• | Year 6: Investment B sold for $16 million and FMV of Investment E determined to be $8 million. |
• | Year 7: Investment E sold for $8 million and FMV. |
These assumptions are summarized in the following chart:
Investment A | Investment B | Investment C | Investment D | Investment E | Cumulative Unrealized Capital Depreciation | Cumulative Realized Capital Losses | Cumulative Realized Capital Gains | |
Year 1 | $10 million (cost basis) | $10 million (cost basis) | $10 million (cost basis) | $10 million (cost basis) | $10 million (cost basis) | -- | -- | -- |
Year 2 | $20 million (sale price) | $8 million FMV | $12 million FMV | $10 million FMV | $10 million FMV | $2 million | -- | $10 million |
Year 3 | -- | $8 million FMV | $14 million FMV | $14 million FMV | $16 million FMV | $2 million | -- | $10 million |
Year 4 | -- | $10 million FMV | $16 million FMV | $12 million (sale price) | $14 million FMV | -- | -- | $12 million |
Year 5 | -- | $14 million FMV | $20 million (sale price) | -- | $10 million FMV | -- | -- | $22 million |
Year 6 | -- | $16 million (sale price) | -- | -- | $8 million FMV | $2 million | -- | $28 million |
Year 7 | -- | -- | -- | -- | $8 million (sale price) | -- | $2 million | $28 million |
__________
(A) Solely for purposes of these illustrative examples, we have assumed that we have not incurred any leverage. However, we have in the past and expect to continue in the future to use leverage to partially finance our investments.
1. | Represents 6.0% annualized preferred return. |
2. | Represents 1.50% annualized management fee. |
3. | The “catch-up” provision is intended to provide our Adviser with an incentive fee of 17.5% on all of our pre-incentive fee net investment income as if a preferred return did not apply when our net investment income exceeds 1.50% in any calendar quarter and is not applied once our Adviser has received 17.5% of investment income in a quarter. The “catch-up” portion of our pre-incentive fee net investment income is the portion that exceeds the 1.50% preferred return but is less than or equal to approximately 1.8182% (that is, 1.50% divided by (1 - 0.175)) in any fiscal quarter. |
The Incentive Fee on Capital Gains under the Investment Advisory Agreement would be:
• | Year 1: None |
• | Year 2: Capital Gains Fee = 17.5% multiplied by ($10 million realized capital gains on sale of Investment A less $2 million cumulative capital depreciation) = $1.4 million |
• | Year 3: Capital Gains Fee = (17.5% multiplied by ($10 million cumulative realized capital gains less $2 million cumulative capital depreciation)) less $1.4 million cumulative Capital Gains Fee previously paid = $1.4 million less $1.4 million = $0.00 million |
• | Year 4: Capital Gains Fee = (17.5% multiplied by ($12 million cumulative realized capital gains)) less $1.4 million cumulative Capital Gains Fee previously paid = $2.1 million less $1.4 million = $0.7 million |
• | Year 5: Capital Gains Fee = (17.5% multiplied by ($22 million cumulative realized capital gains)) less $2.1 million cumulative Capital Gains Fee previously paid = $3.85 million less $2.1 million = $1.75 million |
• | Year 6: Capital Gains Fee = (17.5% multiplied by ($28 million cumulative realized capital gains less $2 million cumulative capital depreciation)) less $3.85 million cumulative Capital Gains Fee previously paid = $4.55 million less $3.85 million = $0.70 million |
11
• | Year 7: Capital Gains Fee = (17.5% multiplied by ($28 million cumulative realized capital gains less $2 million cumulative realized capital losses)) less $4.55 million cumulative Capital Gains Fee previously paid = $4.55 million less $4.55 million = $0.00 million |
Collection and Disbursement of Fees Owed to Our Former Adviser
Under the Former Investment Advisory Agreement described below, both the base management fee and incentive fee on income were calculated and paid to our Former Adviser at the end of each quarter. In order to ensure that our Former Adviser receives any compensation earned during the quarter ended December 31, 2017, the initial payment of the base management fee and incentive fee on income under the Investment Advisory Agreement covered the entire quarter in which the Investment Advisory Agreement became effective, and was calculated at a blended rate that reflected fee rates under the respective investment advisory agreements for the portion of the quarter in which our Former Adviser and Oaktree were serving as investment adviser. This structure allowed Oaktree to pay our Former Adviser the pro rata portion of the fees that were earned by, but not paid to, our Former Adviser for services rendered to us prior to October 17, 2017 of $1.1 million.
Duration and Termination
Unless earlier terminated as described below, the Investment Advisory Agreement will remain in effect until October 17, 2019 and thereafter from year-to-year if approved annually by our Board or by the affirmative vote of the holders of a majority of our outstanding voting securities, including, in either case, approval by a majority of our directors who are not interested persons. The Investment Advisory Agreement will automatically terminate in the event of its assignment. The Investment Advisory Agreement may be terminated by either party without penalty upon 60 days’ written notice to the other. The Investment Advisory Agreement may also be terminated, without penalty, upon the vote of a majority of our outstanding voting securities.
Indemnification
The Investment Advisory Agreement provides that, absent willful misfeasance, bad faith or gross negligence in the performance of their respective duties or by reason of the reckless disregard of their respective duties and obligations, Oaktree and its officers, managers, partners, agents, employees, controlling persons, members (or their owners) and any other person or entity affiliated with it, are entitled to indemnification from us for any damages, liabilities, costs and expenses (including reasonable attorneys’ fees and amounts reasonably paid in settlement) arising from the rendering of Oaktree’s services under the Investment Advisory Agreement or otherwise as our investment adviser.
Fee Waiver
For the two-year period commencing on October 17, 2017, Oaktree will waive, to the extent necessary, any management or incentive fees payable under the Investment Advisory Agreement that exceed what would have been paid to the Former Adviser in the aggregate under the Former Investment Advisory Agreement.
Organization of our Adviser
Our Adviser is a Delaware limited partnership that is registered as an investment adviser under the Advisers Act. The principal address of our Adviser is 333 South Grand Avenue, 28th Floor, Los Angeles, CA 90071.
Board Approval of the Investment Advisory Agreement
The then-current members of our Board of Directors met in person with Oaktree to consider the Investment Advisory Agreement on June 20, 2017 and July 13, 2017. At the in-person meeting held on July 13, 2017, such members of the Board of Directors, including all of the then-current independent directors, unanimously approved the Investment Advisory Agreement. Such independent directors met separately with independent counsel on multiple occasions in connection with their review of the Investment Advisory Agreement and the Transaction. In reaching its decision to approve the Investment Advisory Agreement, our Board of Directors, including all of the then-current independent directors, reviewed a significant amount of information, which had been furnished by Oaktree at the request of independent counsel, on behalf of the independent directors. In reaching a decision to approve the Investment Advisory Agreement, the then-current members of our Board of Directors considered, among other things:
• | the nature, extent and quality of services to be performed by Oaktree; |
• | the investment performance of us and funds managed by Oaktree; |
12
• | the expected costs of services to be provided and the anticipated profits to be realized by Oaktree and its affiliates from their relationship with us; |
• | the possible economies of scale that would be realized due to our potential growth; |
• | whether fee levels reflect such economies of scale for the benefit of investors; and |
• | comparisons of services to be rendered to and fees to be paid by us with the services provided by and the fees paid to other investment advisers and the services provided to and the fees paid by other Oaktree clients. |
The Board of Directors also considered other investment management services to be provided to us, such as the provision of managerial assistance, monitoring adherence to our investment restrictions and monitoring compliance with various of our policies and procedures and with applicable securities laws and regulations. The then-current members of our Board of Directors discussed Oaktree’s cyber security programs and those of its service providers. Based on the factors above, the then-current members of our Board of Directors concluded that they were satisfied with the nature, extent and quality of the services to be provided to us by Oaktree.
No single factor was determinative of the decision of the Board of Directors, including all of the then-current independent directors, to approve the Investment Advisory Agreement and individual directors may have weighed certain factors differently. Throughout the process, the independent directors were advised by independent counsel. Following this process, the then-current members of the Board of Directors, including all of the then-current independent directors, unanimously voted to approve the Investment Advisory Agreement subject to stockholder approval. Our stockholders approved the Investment Advisory Agreement on September 7, 2017.
Payment of Our Expenses
Our primary operating expenses are the payment of (i) a base management fee and any incentive fees and (ii) the allocable portion of overhead and other expenses incurred by Oaktree Administrator in performing its obligations under the Administration Agreement. Our management fee compensates our Adviser for its work in identifying, evaluating, negotiating, executing and servicing our investments. We generally bear all other expenses of our operations and transactions, including (without limitation) fees and expenses relating to:
• | expenses of offering our debt and equity securities; |
• | the investigation and monitoring of our investments; |
• | the cost of calculating our net asset value; |
• | the cost of effecting sales and repurchases of shares of our common stock and other securities; |
• | management and incentive fees payable pursuant to the investment advisory agreement; |
• | fees payable to third parties relating to, or associated with, making investments and valuing investments (including third-party valuation firms); |
• | transfer agent, trustee and custodial fees; |
• | interest payments and other costs related to our borrowings; |
• | fees and expenses associated with marketing efforts (including attendance at investment conferences and similar events); |
• | federal and state registration fees; |
• | any exchange listing fees; |
• | federal, state and local taxes; |
• | independent directors’ fees and expenses; |
• | brokerage commissions; |
• | costs of mailing proxy statements, stockholders’ reports and notices; |
• | costs of preparing government filings, including periodic and current reports with the SEC; |
• | fidelity bond, liability insurance and other insurance premiums; and |
• | printing, mailing, independent accountants and outside legal costs and all other direct expenses incurred by either our administrator or us in connection with administering our business, including payments under the administration agreement. |
13
Former Investment Advisory Agreement
The following is a description of the Former Investment Advisory Agreement, which was terminated on October 17, 2017. The Former Investment Advisory Agreement, dated March 20, 2017, was effective January 1, 2017 through its termination on October 17, 2017. The Former Investment Advisory Agreement amended and restated our third amended and restated investment advisory agreement with our Former Adviser, which was effective as of January 1, 2016, to impose a total return hurdle provision and reduce the “preferred return.”
Management Fee
Through October 17, 2017, we paid our Former Adviser a fee for its services under the Former Investment Advisory Agreement consisting of two components - a base management fee and an incentive fee. The cost of both the base management fee paid to our Former Adviser and any incentive fees earned by our Former Adviser were ultimately borne by our common stockholders.
Base Management Fee
As of January 1, 2016, the base management fee was calculated at an annual rate of 1.75% of our gross assets, including any borrowings for investment purposes but excluding cash and cash equivalents. The base management fee was payable quarterly in arrears and the fee for any partial month or quarter was appropriately prorated.
Incentive Fee
The incentive fee paid to our Former Adviser had two parts. The first part was calculated and payable quarterly in arrears based on our pre-incentive fee net investment income for the immediately preceding fiscal quarter. Pre-incentive fee net investment income, expressed as a rate of return on the value of our net assets at the end of the immediately preceding quarter, was compared to a “hurdle rate” of 1.75% per quarter (2% for periods prior to January 1, 2017), subject to a “catch-up” provision measured as of the end of each quarter. Our net investment income used to calculate this part of the incentive fee was also included in the amount of our gross assets used to calculate the 1.75% base management fee. The operation of the incentive fee with respect to our pre-incentive fee net investment income for each quarter was as follows:
• | No incentive fee was payable to the Former Adviser in any fiscal quarter in which our pre-incentive fee net investment income did not exceed the preferred return rate of 1.75% (2% for periods prior to January 1, 2017) (the “preferred return”); |
• | 100% of our pre-incentive fee net investment income, if any, that exceeded the preferred return rate but was less than or equal to 2.1875% (2.5% for periods prior to January 1, 2017) in any fiscal quarter was payable to our Former Adviser; and |
• | For any quarter in which our pre-incentive fee net investment income, if any, exceeded 2.1875% on net assets (2.5% for periods prior to January 1, 2017), the incentive fee on income was equal to 20% of the amount of our pre-incentive fee net investment income as the preferred return and catch-up would have been achieved. |
From January 1, 2017 to October 17, 2017, in the event the cumulative incentive fee on income accrued for the Lookback Period (after giving effect to any reduction(s) pursuant to this paragraph for any prior fiscal quarters of the Lookback Period but not the quarter of calculation) exceeded 20.0% of the cumulative net increase in net assets resulting from operations during the Lookback Period, then the incentive fee on income for the quarter was reduced by an amount equal to (1) 25% of the incentive fee on income calculated for such quarter (prior to giving effect to any reduction pursuant to this paragraph) less (2) any base management fees waived by our Former Adviser for such fiscal quarter. For this purpose, the “cumulative net increase in net assets resulting from operations” was an amount, if positive, equal to the sum of pre-incentive fee net investment income, base management fees, realized gains and losses and unrealized capital appreciation and depreciation of the Company for the Lookback Period. “Lookback Period” meant the period commencing January 1, 2017 and ending on the last day of the fiscal quarter for which the incentive fee on income was being calculated.
There was no accumulation of amounts on the hurdle rate from quarter to quarter and accordingly there was no clawback of amounts previously paid if subsequent quarters were below the quarterly hurdle and there was no delay of payment if prior quarters were below the quarterly hurdle.
The second part of the incentive fee was determined and payable in arrears as of the end of each fiscal year (or upon termination of the Former Investment Advisory Agreement, as of the termination date) and equaled 20% of our realized capital gains, if any, on a cumulative basis from inception through the end of each fiscal year, computed net of all realized capital losses and unrealized capital depreciation on a cumulative basis, less the aggregate amount of any previously paid capital gain incentive fees, provided that, the incentive fee determined as of September 30, 2008 was calculated for a period of shorter than twelve calendar months to take into account any realized capital gains computed net of all realized capital losses and unrealized capital depreciation from inception.
14
Administration Agreement
We entered into the Administration Agreement with Oaktree Administrator on October 17, 2017. Pursuant to the Administration Agreement, Oaktree Administrator provides administrative services to us necessary for our operations, which include providing office facilities, equipment, clerical, bookkeeping and record keeping services at such facilities and such other services as Oaktree Administrator, subject to review by our Board of Directors, shall from time to time deem to be necessary or useful to perform its obligations under the Administration Agreement. Oaktree Administrator may, on behalf of us, conduct relations and negotiate agreements with custodians, trustees, depositories, attorneys, underwriters, brokers and dealers, corporate fiduciaries, insurers, banks and such other persons in any such other capacity deemed to be necessary or desirable. Oaktree Administrator will make reports to our Board of Directors of its performance of obligations under the Administration Agreement and furnish advice and recommendations with respect to such other aspects of our business and affairs, in each case, as it shall determine to be desirable or as reasonably required by our Board of Directors; provided that Oaktree Administrator shall not provide any investment advice or recommendation.
Oaktree Administrator also provides portfolio collection functions for interest income, fees and warrants and is responsible for the financial and other records that we are required to maintain, and prepares, prints and disseminates reports to our stockholders and all other materials filed with the SEC. In addition, Oaktree Administrator assists us in determining and publishing our net asset value, overseeing the preparation and filing of our tax returns, and generally overseeing the payment of our expenses and the performance of administrative and professional services rendered to us by others. Oaktree Administrator may also offer to provide, on our behalf, managerial assistance to our portfolio companies.
For providing these services, facilities and personnel, we reimburse Oaktree Administrator the allocable portion of overhead and other expenses incurred by Oaktree Administrator in performing its obligations under the Administration Agreement, including our allocable portion of the rent of our principal executive offices at market rates and our allocable portion of the costs of compensation and related expenses of our Chief Financial Officer, Chief Compliance Officer, their staffs and other non-investment professionals at Oaktree that perform duties for us. Such reimbursement is at cost, with no profit to, or markup by, Oaktree Administrator.
The Administration Agreement provides that, absent willful misfeasance, bad faith or gross negligence in the performance of their respective duties or by reason of the reckless disregard of their respective duties and obligations, Oaktree Administrator and its officers, managers, partners, agents, employees, controlling persons, members (or their owners) and any other person or entity affiliated with it, are entitled to indemnification from us for any damages, liabilities, costs and expenses (including reasonable attorneys’ fees and amounts reasonably paid in settlement) arising from the rendering of Oaktree Administrator’s services under the Administration Agreement or otherwise as our administrator.
Unless earlier terminated as described below, the Administration Agreement will remain in effect until October 17, 2019 and thereafter from year-to-year if approved annually by our Board of Directors or by the affirmative vote of the holders of a majority of our outstanding voting securities, including, in either case, approval by a majority of our directors who are not interested persons. The Administration Agreement may be terminated by either party without penalty upon 60 days’ written notice to the other. The Administration Agreement may also be terminated, without penalty, upon the vote of a majority of our outstanding voting securities.
Former Administration Agreement
The Former Administration Agreement was terminated on October 17, 2017. Pursuant to the Former Administration Agreement, our Former Administrator provided services substantially similar to those provided by Oaktree Administrator as described above under “– Administration Agreement.” For providing these services, facilities and personnel, we reimbursed the Former Administrator the allocable portion of overhead and other expenses incurred by it in performing its obligations under the Former Administration Agreement, including rent and our allocable portion of the costs of compensation and related expenses of our Chief Financial Officer and Chief Compliance Officer and their staffs. Such reimbursement was at cost, with no profit to, or markup by, our Former Administrator. Our allocable portion of our Former Administrator’s costs was determined based upon costs attributable to our operations versus costs attributable to the operations of other entities for which our Former Administrator provided administrative services.
Competition
We operate in a highly competitive market for investment opportunities. We compete for investments with various other investors, such as other public and private funds, other Business Development Companies, commercial and investment banks, commercial finance companies and to the extent they provide an alternative form of financing, private equity funds, some of which may be our affiliates. Other Oaktree funds may have investment objectives that overlap with ours, which may create competition for investment opportunities. Many competitors are substantially larger and have considerably greater financial,
15
technical and marketing resources than we do. For example, some competitors may have a lower cost of funds and access to funding sources that will not be available to us. In addition, some of our competitors may have higher risk tolerances or different risk assessments than we do, which could allow them to consider a wider variety of investments and establish more relationships than us. Furthermore, many of our competitors are not subject to the regulatory restrictions that the Investment Company Act and the Code impose on us. The competitive pressures could impair our business, financial condition and results of operations. As a result of this competition, we may not be able to take advantage of attractive investment opportunities. See “Item 1A. Risk Factors – Risks Relating to Our Business and Structure – We may face increasing competition for investment opportunities, which could reduce returns and result in losses."
Staffing
We do not currently have any employees and do not expect to have any employees. Services necessary for our business are provided through the Administration Agreement and the Investment Advisory Agreement.
Allocation of Investment Opportunities and Potential Conflicts of Interest
Our executive officers and directors, and certain members of our Adviser, serve or may serve as officers, directors or principals of entities that operate in the same or a related line of business as we do or of investment funds managed by our affiliates. For example, Oaktree presently serves as the investment adviser to OCSI, a publicly-traded Business Development Company, and Oaktree Strategic Income II, Inc., or OSI II, a privately offered Business Development Company. OCSI has historically invested in senior secured loans, including first lien, unitranche and second lien debt instruments that pay interest at rates which are determined periodically on the basis of a floating base lending rate, made to private middle-market companies whose debt is rated below investment grade, similar to those we target for investment. OSI II may also make similar investments. Therefore, there may be certain investment opportunities that satisfy the investment criteria for OCSI, OSI II and us. OCSI and OSI II operate as distinct and separate companies and any investment in our common stock will not be an investment in either OCSI or OSI II. In addition, all of our executive officers serve in substantially similar capacities for OCSI and OSI II and three of our independent directors serve as independent directors of OCSI. Oaktree and its affiliates also manage and sub-advise private investment funds and accounts, and may manage other such funds and accounts in the future, which have investment mandates that are similar, in whole and in part, with ours. Accordingly, they may have obligations to investors in those entities, the fulfillment of which might not be in the best interests of us or our stockholders. For example, the personnel of our Adviser may face conflicts of interest in the allocation of investment opportunities to us and such other funds and accounts.
Oaktree has investment allocation guidelines that govern the allocation of investment opportunities among the investment funds and accounts managed or sub-advised by Oaktree and its affiliates. To the extent an investment opportunity is appropriate for us or OCSI, OSI II or any other investment fund or account managed or sub-advised by Oaktree or its affiliates, Oaktree will adhere to its investment allocation guidelines in order to determine a fair and equitable allocation.
We may invest alongside funds and accounts managed or sub-advised by our Adviser and its affiliates in certain circumstances where doing so is consistent with applicable law and SEC staff interpretations. For example, we may invest alongside such accounts consistent with guidance promulgated by the staff of the SEC permitting us and such other accounts to purchase interests in a single class of privately placed securities so long as certain conditions are met, including that our Adviser, acting on our behalf and on behalf of other clients, negotiates no term other than price or terms related to price.
In addition, on October 18, 2017, our Adviser received exemptive relief from the SEC to allow certain managed funds and accounts, each of whose investment adviser is Oaktree or an investment adviser controlling, controlled by or under common control with Oaktree, to participate in negotiated co-investment transactions where doing so is consistent with the applicable registered fund’s or Business Development Company’s investment objective and strategies as well as regulatory requirements and other pertinent factors, and pursuant to the conditions of the exemptive relief. Each potential co-investment opportunity that falls under the terms of the exemptive relief and is appropriate for us and any affiliated fund or account, and satisfies the then-current board-established criteria, will be offered to us and such other eligible funds and accounts. If there is a sufficient amount of securities to satisfy all participants, the securities will be allocated among the participants in accordance with their proposed order size and if there is an insufficient amount of securities to satisfy all participants, the securities will be allocated pro rata based on the investment proposed by the applicable investment adviser to such participant, up to the amount proposed to be invested by each, which is reviewed and approved by an independent committee of legal, compliance and accounting professionals at our Adviser.
16
Although Oaktree will endeavor to allocate investment opportunities in a fair and equitable manner, we and our common stockholders could be adversely affected to the extent investment opportunities are allocated among us and other investment vehicles managed or sponsored by, or affiliated with, our executive officers, directors and members of our Adviser. We might not participate in each individual opportunity, but will, on an overall basis, be entitled to participate equitably with other entities managed by Oaktree and its affiliates. Oaktree is committed to treating all clients fairly and equitably such that none receive preferential treatment vis-à-vis the others over time, in a manner consistent with its fiduciary duty to each of them; however, in some instances, especially in instances of limited liquidity, the factors may not result in pro rata allocations or may result in situations where certain funds or accounts receive allocations where others do not.
Pursuant to the Investment Advisory Agreement, our Adviser’s liability is limited and we are required to indemnify our Adviser against certain liabilities. This may lead our Adviser to act in a riskier manner in performing its duties and obligations under the Investment Advisory Agreement than it would if it were acting for its own account, and creates a potential conflict of interest.
Pursuant to the Administration Agreement, Oaktree Administrator furnishes us with the facilities, including our principal executive office, and administrative services necessary to conduct our day-to-day operations. We pay Oaktree Administrator its allocable portion of overhead and other expenses incurred by Oaktree Administrator in performing its obligations under the Administration Agreement, including, without limitation, a portion of the rent at market rates and compensation of our Chief Financial Officer, Chief Compliance Officer, their respective staffs and other non-investment professionals at Oaktree that perform duties for us.
Election to be Taxed as a Regulated Investment Company
We have elected to be treated, and intend to qualify annually, as a RIC for U.S. federal income tax purposes under Subchapter M of the Code. As a RIC, we generally will not be required to pay corporate-level federal income taxes on any ordinary income or capital gains that we distribute to our stockholders as dividends. To continue to qualify as a RIC, we must, among other things, meet certain source-of-income and asset diversification requirements (as described below). In addition, to qualify for RIC tax treatment we must distribute to our stockholders, for each taxable year, at least 90% of the Company’s “investment company taxable income” for that year, which is generally its ordinary income plus the excess of its realized net short-term capital gains over its realized net long-term capital losses, or the Annual Distribution Requirement.
If we:
• | qualify as a RIC; and |
• | satisfy the Annual Distribution Requirement; |
then we will not be subject to federal income tax on the portion of our investment company taxable income and net capital gain (i.e., realized net long-term capital gains in excess of realized net short-term capital losses) we distribute to stockholders. We are subject to U.S. federal income tax at the regular corporate rates on any income or capital gain not distributed (or deemed distributed) to our stockholders.
We will be subject to a 4% nondeductible federal excise tax on certain undistributed income unless we distribute in a timely manner an amount at least equal to the sum of (1) 98% of our ordinary income for each calendar year, (2) 98.2% of our capital gain net income for the one-year period ending October 31 in that calendar year and (3) any income realized, but not distributed, and on which we paid no federal income tax, in preceding years.
In order to maintain our qualification as a RIC for federal income tax purposes, we must, among other things:
• | at all times during each taxable year, have in effect an election to be treated as a Business Development Companies under the Investment Company Act; |
• | derive in each taxable year at least 90% of our gross income from (a) dividends, interest, payments with respect to certain securities (including loans), gains from the sale of stock or other securities or currencies, or other income derived with respect to our business of investing in such stock, securities or currencies and (b) net income derived from an interest in a “qualified publicly traded partnership;” (the “90% Gross Income Test”) and |
• | diversify our holdings so that at the end of each quarter of the taxable year: |
◦ | (i) at least 50% of the value of our assets consists of cash, cash equivalents, U.S. government securities, securities of other RICs, and other securities if such other securities of any one issuer do not represent more than 5% of |
17
the value of its assets or more than 10% of the outstanding voting securities of the issuer; and
◦ | (ii) no more than 25% of the value of our assets is invested in (a) the securities, other than U.S. government securities or securities of other RICs, of one issuer, (b) the securities of two or more issuers that are controlled, as determined under applicable tax rules, by us and that are engaged in the same or similar or related trades or businesses or (c) the securities of one or more “qualified publicly traded partnerships” ((i) and (ii) collectively, the “Diversification Tests”). |
We may be required to recognize taxable income in circumstances in which we do not receive cash. For example, if we hold debt obligations that are treated under applicable tax rules as having original issue discount (such as debt instruments with increasing interest rates or debt instruments issued with warrants), we must include in income each year a portion of the original issue discount that accrues over the life of the obligation, regardless of whether cash representing such income is received by us in the same taxable year. Because any original issue discount accrued will be included in our investment company taxable income for the year of accrual, we may be required to make a distribution to our stockholders in order to satisfy the Annual Distribution Requirement, even though we will not have received any corresponding cash amount.
Because we use debt financing, we are subject to certain asset coverage ratio requirements under the Investment Company Act described above and financial covenants under loan and credit agreements that could, under certain circumstances, restrict us from making distributions necessary to satisfy the Annual Distribution Requirement. If we are unable to obtain cash from other sources or are otherwise limited in our ability to make distributions, we could fail to qualify for RIC tax treatment and thus become subject to corporate-level income tax.
Certain of our investment practices may be subject to special and complex U.S. federal income tax provisions that may, among other things: (a) disallow, suspend or otherwise limit the allowance of certain losses or deductions; (b) convert lower taxed long-term capital gain into higher taxed short-term capital gain or ordinary income; (c) convert an ordinary loss or a deduction into a capital loss (the deductibility of which is more limited); (d) cause us to recognize income or gain without a corresponding receipt of cash; (e) adversely affect the time as to when a purchase or sale of securities is deemed to occur; (f) adversely alter the characterization of certain complex financial transactions; or (g) produce income that will not be qualifying income for purposes of the 90% gross income test described above. We will monitor our transactions and may make certain tax elections in order to mitigate the potential adverse effect of these provisions.
If, in any particular taxable year, we do not qualify as a RIC, all of our taxable income (including our net capital gains) will be subject to tax at regular corporate rates without any deduction for distributions to stockholders, and distributions will be taxable to the stockholders as ordinary dividends to the extent of our current and accumulated earnings and profits.
Business Development Company Regulations
We have elected to be a Business Development Company under the Investment Company Act. As with other companies regulated by the Investment Company Act, a Business Development Company must adhere to certain substantive regulatory requirements. The Investment Company Act contains prohibitions and restrictions relating to transactions between Business Development Companies and their affiliates (including any investment advisers), principal underwriters and affiliates of those affiliates or underwriters.
The Investment Company Act further requires that a majority of our directors be persons other than “interested persons,” as that term is defined in the Investment Company Act. In addition, we may not change the nature of our business so as to cease to be, or withdraw our election as, a Business Development Company unless authorized by a vote of a majority of the outstanding voting securities, as required by the Investment Company Act. A majority of the outstanding voting securities of a company is defined under the Investment Company Act as the lesser of: (a) 67% or more of such company’s voting securities present at a meeting if more than 50% of the outstanding voting securities of such company are present or represented by proxy, or (b) more than 50% of the outstanding voting securities of such company. We do not anticipate any substantial change in the nature of our business.
We are not generally able to issue and sell our common stock at a price below net asset value per share. We may, however, sell our common stock, warrants, options or rights to acquire our common stock, at a price below the current net asset value of the common stock if our Board of Directors determines that such sale is in our best interests and that of our stockholders, and our stockholders approve such sale. In any such case, the price at which our securities are to be issued and sold may not be less than a price which, in the determination of our Board of Directors, closely approximates the market value of such securities (less any distributing commission or discount). We may also make rights offerings to our stockholders at prices per share less than the net asset value per share, subject to applicable requirements of the Investment Company Act.
18
Investment Restrictions
We do not intend to acquire securities issued by any investment company that exceed the limits imposed by the Investment Company Act. Under such limits, except for registered money market funds, we generally cannot acquire more than 3% of the voting stock of any registered investment company, invest more than 5% of the value of our total assets in the securities of one registered investment company or invest more than 10% of the value of our total assets in the securities of registered investment companies in the aggregate. The portion of our portfolio invested in securities issued by investment companies ordinarily will subject stockholders to additional indirect expenses. None of the policies described above are fundamental and each such policy may be changed without stockholder approval, subject to any limitations imposed by the Investment Company Act. Our investment portfolio is also subject to certain source-of-income and asset diversification requirements by virtue of its intended status to be a RIC for U.S. tax purposes. See “– Election to be Taxed as a Regulated Investment Company” above for more information.
Qualifying Assets
Under the Investment Company Act, a Business Development Company may not acquire any asset other than assets of the type listed in Section 55(a) of the Investment Company Act, which are referred to as qualifying assets, unless, at the time the acquisition is made, qualifying assets represent at least 70% of the company’s total assets. The principal categories of qualifying assets relevant to our business are any of the following:
(1) Securities purchased in transactions not involving any public offering from the issuer of such securities, which issuer (subject to certain limited exceptions) is an eligible portfolio company, or from any person who is, or has been during the preceding 13 months, an affiliated person of an eligible portfolio company, or from any other person, subject to such rules as may be prescribed by the SEC. An eligible portfolio company is defined in the Investment Company Act as any issuer which:
(a) is organized under the laws of, and has its principal place of business in, the United States;
(b) is not an investment company (other than a small business investment company wholly owned by the Business Development Company) or a company that would be an investment company but for certain exclusions under the Investment Company Act; and
(c) satisfies any of the following:
(i) does not have any class of securities that is traded on a national securities exchange;
(ii) has a class of securities listed on a national securities exchange, but has an aggregate market value of outstanding voting and non-voting common equity of less than $250 million;
(iii) is controlled by a Business Development Company or a group of companies including a Business Development Company and the Business Development Company has an affiliated person who is a director of the eligible portfolio company; or
(iv) is a small and solvent company having total assets of not more than $4 million and capital and surplus of not less than $2 million;
(2) Securities of any eligible portfolio company that we control;
(3) Securities purchased in a private transaction from a U.S. issuer that is not an investment company or from an affiliated person of the issuer, or in transactions incident thereto, if the issuer is in bankruptcy and subject to reorganization or if the issuer, immediately prior to the purchase of its securities was unable to meet its obligations as they came due without material assistance other than conventional lending or financing arrangements;
(4) Securities of an eligible portfolio company purchased from any person in a private transaction if there is no ready market for such securities and we already own 60% of the outstanding equity of the eligible portfolio company;
(5) Securities received in exchange for or distributed on or with respect to securities described in (1) through (4) above, or pursuant to the exercise of warrants or rights relating to such securities; or
(6) Cash, cash equivalents, U.S. government securities or high-quality debt securities maturing in one year or less from the time of investment.
In addition, a Business Development Company must be operated for the purpose of making investments in the types of securities described in (1), (2) or (3) above.
19
Managerial Assistance to Portfolio Companies
A Business Development Company must have been organized under the laws of, and have its principal place of business in, any state or states within the United States and must be operated for the purpose of making investments in the types of securities described in (1), (2) or (3) above. However, in order to count portfolio securities as qualifying assets for the purpose of the 70% test, a Business Development Company must either control the issuer of the securities or must offer to make available to the issuer of the securities (other than small and solvent companies described above) significant managerial assistance. However, when a Business Development Company purchases securities in conjunction with one or more other persons acting together, one of the other persons in the group may make available such managerial assistance. Making available managerial assistance includes any arrangement whereby a Business Development Company, through its directors, officers or employees, offers to provide, and, if accepted, does so provide, significant guidance and counsel concerning the management, operations or business objectives and policies of a portfolio company.
Temporary Investments
Pending investment in other types of "qualifying assets," as described above, our investments may consist of cash, cash equivalents, U.S. government securities or high-quality debt securities maturing in one year or less from the time of investment (collectively, “temporary investments”) so that 70% of our assets are qualifying assets. We may also invest in U.S. Treasury bills or in repurchase agreements, provided that such agreements are fully collateralized by cash or securities issued by the U.S. government or its agencies. A repurchase agreement involves the purchase by an investor, such as the Company, of a specified security and the simultaneous agreement by the seller to repurchase it at an agreed-upon future date and at a price which is greater than the purchase price by an amount that reflects an agreed-upon interest rate. There is no percentage restriction on the proportion of our assets that may be invested in such repurchase agreements. However, if more than 25% of our gross assets constitute repurchase agreements from a single counterparty, we would not meet the diversification tests in order to qualify as a RIC. Thus, we do not intend to enter into repurchase agreements with a single counterparty in excess of this limit. Our Adviser will monitor the creditworthiness of the counterparties with which we enter into repurchase agreement transactions.
Senior Securities
Consistent with applicable legal and regulatory requirements, we are permitted, under specified conditions, to issue multiple classes of indebtedness and one class of stock senior to our common stock if our asset coverage, as calculated as provided in the Investment Company Act, is at least 200% immediately after each such issuance. In addition, while any senior securities remain outstanding, we may make provisions to prohibit any distribution to our stockholders or the repurchase of such securities or shares unless we meet the applicable asset coverage ratios at the time of the distribution or repurchase. We would also be permitted to borrow amounts up to 5% of the value of our total assets for generally up to 60 days for temporary purposes without regard to asset coverage.
On March 23, 2018, the SBCAA, was enacted into law. The SBCAA, among other things, amended Section 61(a) of the Investment Company Act to add a new Section 61(a)(2) that reduces the asset coverage requirement applicable to Business Development Companies from 200% to 150% so long as the Business Development Company meets certain disclosure requirements and obtains certain approvals. Our Board of Directors has not taken any action to reduce the asset coverage requirements applicable to us.
Other
We are subject to periodic examination by the SEC for compliance with the Investment Company Act.
We are required to provide and maintain a bond issued by a reputable fidelity insurance company to protect us against larceny and embezzlement. Furthermore, as a Business Development Company, we are prohibited from protecting any director or officer against any liability to us or our stockholders arising from willful misfeasance, bad faith, gross negligence or reckless disregard of the duties involved in the conduct of such person’s office.
We and our Adviser will each be required to adopt and implement written policies and procedures reasonably designed to prevent violation of the U.S. federal securities laws, review these policies and procedures annually for their adequacy and the effectiveness of their implementation, and designate a Chief Compliance Officer to be responsible for administering the policies and procedures.
Code of Ethics
We have adopted a joint code of ethics with OCSI pursuant to Rule 17j-1 under the Investment Company Act and we have also approved the investment adviser’s code of ethics that was adopted by it under Rule 17j-1 under the Investment
20
Company Act and Rule 204A-1 under the Advisers Act. These codes establish procedures for personal investments and restrict certain personal securities transactions. Personnel subject to the code may invest in securities for their personal investment accounts, including securities that may be purchased or held by us, so long as such investments are made in accordance with the code’s requirements. You may read and copy the codes of ethics at the SEC’s Public Reference Room located at 100 F Street, NE, Washington, DC 20549. You may obtain information on the operation of the Public Reference Room by calling the SEC at 1-800-SEC-0330. In addition, the codes of ethics are available on the EDGAR Database on the SEC’s website at http://www.sec.gov and are available at the Investors: Corporate Governance portion of our website at www.oaktreespecialtylending.com.
Proxy Voting Policies and Procedures
We have delegated our proxy voting responsibility to our Adviser. The proxy voting policies and procedures of our Adviser are set forth below. These guidelines are reviewed periodically by our Adviser and our independent directors, and, accordingly, are subject to change.
An investment adviser registered under the Advisers Act has a fiduciary duty to act solely in the best interests of its clients. As part of this duty, our Adviser recognizes that it must vote portfolio securities in a timely manner free of conflicts of interest and in the best interests of its clients.
These policies and procedures for voting proxies are intended to comply with Section 206 of, and Rule 206(4)-6 under, the Advisers Act.
Our Adviser will vote proxies relating to our portfolio securities, if any, in what it perceives to be the best interest of our stockholders. Our Adviser will review on a case-by-case basis each proposal submitted to a shareholder vote to determine its impact on portfolio securities held by us. Although our Adviser will generally vote against proposals that may have a negative impact on our portfolio securities, it may vote for such a proposal if there are compelling long-term reasons to do so.
Our Adviser’s proxy voting decisions will be made by officers who are responsible for monitoring each of our investments. To ensure that the vote is not the product of a conflict of interest, our Adviser will require that: (1) anyone involved in the decision-making process disclose to the Chief Compliance Officer any potential conflict that he or she is aware of and any contact that he or she has had with any interested party regarding a proxy vote; and (2) employees involved in the decision-making process or vote administration are prohibited from revealing how our Adviser intends to vote on a proposal, in order to reduce any attempted influence from interested parties.
Stockholders may obtain information regarding how we voted proxies by making a written request for proxy voting information to: Oaktree Specialty Lending Corporation, Chief Compliance Officer, 333 South Grand Avenue 28th Floor, Los Angeles, CA 90071.
Reporting Obligations
We furnish our stockholders with annual reports containing audited financial statements, quarterly reports, and such other periodic reports as we determine to be appropriate or as may be required by law. We are required to comply with all periodic reporting, proxy solicitation and other applicable requirements under the Securities Exchange Act of 1934, as amended, the Exchange Act.
We make available on or through our website certain reports and amendments to those reports that we file with or furnish to the SEC in accordance with the Exchange Act. These include our annual reports on Form 10-K, our quarterly reports on Form 10-Q and our current reports on Form 8-K. We make this information available on our website free of charge as soon as reasonably practicable after we electronically file the information with, or furnish it to, the SEC. The SEC also maintains a website that contains reports, proxy and information statements and other information we file with the SEC at www.sec.gov.
We maintain a website at www.oaktreespecialtylending.com. The information on our website is not incorporated by reference in this annual report on Form 10-K.
Sarbanes-Oxley Act Compliance
We are subject to the reporting and disclosure requirements of the Exchange Act, including the filing of quarterly, annual and current reports, proxy statements and other required items. In addition, we are subject to the Sarbanes-Oxley Act of 2002, or the Sarbanes-Oxley Act, which imposes a wide variety of regulatory requirements on publicly-held companies and their insiders. For example:
21
• | pursuant to Rule 13a-14 under the Exchange Act, our chief executive officer and chief financial officer are required to certify the accuracy of the financial statements contained in our periodic reports; |
• | pursuant to Item 307 of Regulation S-K, our periodic reports are required to disclose our conclusions about the effectiveness of our disclosure controls and procedures; and |
• | pursuant to Rule 13a-15 under the Exchange Act, our management is required to prepare a report regarding its assessment of our internal control over financial reporting. Our independent registered public accounting firm is required to audit our internal control over financial reporting. |
The Sarbanes-Oxley Act requires us to review our current policies and procedures to determine whether we comply with the Sarbanes-Oxley Act and the regulations promulgated thereunder. We will continue to monitor compliance with all regulations that are adopted under the Sarbanes-Oxley Act and will take actions necessary to ensure that we are in compliance therewith.
Stock Exchange Corporate Governance Regulations
Each of the Nasdaq Global Select Market and the New York Stock Exchange has adopted corporate governance regulations that listed companies must comply with. We are in compliance with such corporate governance regulations applicable to Business Development Companies.
Item 1A. Risk Factors
Investing in our securities involves a number of significant risks. In addition to the other information contained in this annual report on Form 10-K, you should consider carefully the following information before making an investment in our securities. The risks set out below are not the only risks we face. Additional risks and uncertainties not presently known to us or not presently deemed material by us might also impair our operations and performance. If any of the following events occur, our business, financial condition and results of operations could be materially and adversely affected. In such case, our net asset value and the trading price of our securities could decline, and you may lose part or all of your investment.
Risks Relating to Economic Conditions
Economic recessions or downturns may have a material adverse effect on our business, financial condition and results of operations, and could impair the ability of our portfolio companies to repay debt or pay interest.
Economic recessions or downturns may result in a prolonged period of market illiquidity which could have a material adverse effect on our business, financial condition and results of operations. Unfavorable economic conditions also could increase our funding costs, limit our access to the capital markets or result in a decision by lenders not to extend credit to us. These events could limit our investment originations, limit our ability to grow and negatively impact our operating results. In addition, uncertainty with regard to economic recovery from recessions or downturns could also have a negative impact on our business, financial condition and results of operations.
When recessionary conditions exist, the financial results of small and mid-sized companies, like those in which we invest, typically experience deterioration, which could ultimately lead to difficulty in meeting debt service requirements and an increase in defaults. Additionally, the end markets for certain of our portfolio companies’ products and services would likely experience negative economic trends. Further, adverse economic conditions may decrease the value of collateral securing some of our loans and the value of our equity investments. As a result, we may need to modify the payment terms of our investments, including changes in PIK interest provisions and/or cash interest rates. The performance of certain of our portfolio companies have been, and may continue to be, negatively impacted by these economic or other conditions, which may result in our receipt of a reduced level of interest income from our portfolio companies and/or losses or charge offs related to our investments, and, in turn, may adversely affect distributable income and have a material adverse effect on our results of operations.
22
Global economic, political and market conditions, including downgrades of the U.S. credit rating, may adversely affect our business, results of operations and financial condition, including our revenue growth and profitability.
The current worldwide financial market situation, as well as various social and political tensions in the United States and around the world, may contribute to increased market volatility, may have long-term effects on the United States and worldwide financial markets and may cause economic uncertainties or deterioration in the U.S. and worldwide. The impact of downgrades by rating agencies to the U.S. government’s sovereign credit rating or its perceived creditworthiness as well as potential government shutdowns could adversely affect the U.S. and global financial markets and economic conditions. Since 2010, several European Union, or EU, countries have faced budget issues, some of which may have negative long-term effects for the economies of those countries and other EU countries. There is continued concern about national-level support for the Euro and the accompanying coordination of fiscal and wage policy among European Economic and Monetary Union member countries. In addition, the fiscal policy of foreign nations, such as Russia and China, may have a severe impact on the worldwide and U.S. financial markets. The decision made in the United Kingdom referendum to leave the EU (the so-called "Brexit") has led to volatility in global financial markets and may lead to weakening in consumer, corporate and financial confidence in the United Kingdom and Europe. While the United Kingdom is currently expected to leave the EU on March 29, 2019, uncertainty remains as to the exact timing and process, which may lead to continued volatility. Additionally, volatility in the Chinese stock markets and global markets for commodities may affect other financial markets worldwide. We cannot predict the effects of these or similar events in the future on the U.S. and global economies and securities markets or on our investments. We monitor developments in economic, political and market conditions and seek to manage our investments in a manner consistent with achieving our investment objective, but there can be no assurance that we will be successful in doing so.
Risks Relating to Our Business and Structure
Our Adviser has limited experience operating under the constraints imposed on us as a Business Development Company, which may hinder the achievement of our investment objectives.
The Investment Company Act imposes numerous constraints on the operations of Business Development Companies that do not apply to other investment vehicles managed by Oaktree and its affiliates. Business Development Companies are required, for example, to invest at least 70% of their total assets primarily in securities of U.S. private or thinly-traded public companies, cash, cash equivalents, U.S. government securities and other high-quality debt instruments that mature in one year or less from the date of investment. Our Adviser does not have significant experience operating under these constraints, which may hinder our ability to take advantage of attractive investment opportunities and to achieve our investment objective. Our Adviser's track record and achievements are not necessarily indicative of the future results it will achieve. Accordingly, we can offer no assurance that we will replicate the historical performance of other investment companies with which our investment professionals have been affiliated, and we caution that our investment returns could be substantially lower than the returns achieved by such other companies.
Changes in interest rates, changes in the method for determining LIBOR and the potential replacement of LIBOR may affect our cost of capital and net investment income.
General interest rate fluctuations and changes in credit spreads on floating rate loans may have a substantial negative impact on our investments and investment opportunities and, accordingly, may have a material adverse effect on our rate of return on invested capital, our net investment income, our net asset value and the market price of our common stock. The majority of our debt investments have, and are expected to have, variable interest rates that reset periodically based on benchmarks such as LIBOR, the federal funds rate or prime rate. An increase in interest rates may make it more difficult for our portfolio companies to service their obligations under the debt investments that we will hold and increase defaults even where our investment income increases. Rising interest rates could also cause borrowers to shift cash from other productive uses to the payment of interest, which may have a material adverse effect on their business and operations and could, over time, lead to increased defaults. Additionally, as interest rates increase and the corresponding risk of a default by borrowers increases, the liquidity of higher interest rate loans may decrease as fewer investors may be willing to purchase such loans in the secondary market in light of the increased risk of a default by the borrower and the heightened risk of a loss of an investment in such loans. Decreases in credit spreads on debt that pays a floating rate of return would have an impact on the income generation of our floating rate assets. Trading prices for debt that pays a fixed rate of return tend to fall as interest rates rise. Trading prices tend to fluctuate more for fixed rate securities that have longer maturities.
Conversely, if interest rates decline, borrowers may refinance their loans at lower interest rates, which could shorten the average life of the loans and reduce the associated returns on the investment, as well as require our Adviser and the Investment Professionals to incur management time and expense to re-deploy such proceeds, including on terms that may not be as favorable as our existing loans.
23
In addition, because we borrow to fund our investments, a portion of our net investment income is dependent upon the difference between the interest rate at which we borrow funds and the interest rate at which we invest these funds. Portions of our investment portfolio and our borrowings have floating rate components. As a result, a significant change in market interest rates could have a material adverse effect on our net investment income. In periods of rising interest rates, our cost of funds could increase, which would reduce our net investment income. We may hedge against interest rate fluctuations by using standard hedging instruments such as interest rate swap agreements, futures, options and forward contracts, subject to applicable legal requirements, including all necessary registrations (or exemptions from registration) with the Commodity Futures Trading Commission. These activities may limit our ability to participate in the benefits of lower interest rates with respect to the hedged borrowings. Adverse developments resulting from changes in interest rates or hedging transactions could have a material adverse effect on our business, financial condition and results of operations.
As a result of concerns about the accuracy of the calculation of LIBOR, a number of British Bankers’ Association, or BBA, member banks entered into settlements with certain regulators and law enforcement agencies with respect to the alleged manipulation of LIBOR. Actions by the BBA, regulators or law enforcement agencies as a result of these or future events, may result in changes to the manner in which LIBOR is determined. Potential changes, or uncertainty related to such potential changes may adversely affect the market for LIBOR-based securities, including our portfolio of LIBOR-indexed, floating-rate debt securities and our borrowings. In addition, changes or reforms to the determination or supervision of LIBOR may result in a sudden or prolonged increase or decrease in reported LIBOR, which could have an adverse impact on the market for LIBOR-based securities or the value of our portfolio of LIBOR-indexed, floating-rate debt securities and our borrowings.
In July 2017, the head of the United Kingdom Financial Conduct Authority announced the desire to phase out the use of LIBOR by the end of 2021. The U.S. Federal Reserve, in conjunction with the Alternative Reference Rates Committee, a steering committee comprised of large U.S. financial institutions, is considering replacing U.S.-dollar LIBOR with the Secured Overnight Financing Rate, or SOFR, a new index calculated by short-term repurchase agreements, backed by Treasury securities. Although there have been a few issuances utilizing SOFR or the Sterling Over Night Index Average, an alternative reference rate that is based on transactions, it is unknown whether these alternative reference rates will attain market acceptance as replacements for LIBOR.
If LIBOR ceases to exist, we may need to renegotiate any credit agreements extending beyond 2021 with our prospective portfolio companies that utilize LIBOR as a factor in determining the interest rate. There is currently no definitive information regarding the future utilization of LIBOR or of any particular replacement rate. As such, the potential effect of any such event on our cost of capital and net investment income cannot yet be determined.
A general increase in interest rates will likely have the effect of increasing our net investment income, which would make it easier for our Adviser to receive incentive fees.
Any general increase in interest rates would likely have the effect of increasing the interest rate that we receive on many of our debt investments. Accordingly, a general increase in interest rates may make it easier for our Adviser to meet the quarterly hurdle rate for payment of income incentive fees under the Investment Advisory Agreement and may result in a substantial increase in the amount of incentive fee on income payable to our Adviser.
A significant portion of our investment portfolio is and will continue to be recorded at fair value as determined in good faith by our Board of Directors and, as a result, there is and will continue to be uncertainty as to the value of our portfolio investments.
Under the Investment Company Act, we are required to carry our portfolio investments at market value or, if there is no readily available market value, at fair value as determined in good faith by our Board of Directors. Typically, there is not a public market for the securities of the privately held companies in which we have invested and will generally continue to invest. As a result, we value these securities quarterly at fair value as determined in good faith by our Board of Directors. The fair value of such securities may change, potentially materially, between the date of the fair value determination by our Board of Directors and the release of the financial results for the corresponding period or the next date at which fair value is determined.
Certain factors that may be considered in determining the fair value of our investments include the nature and realizable value of any collateral, the portfolio company’s earnings and its ability to make payments on its indebtedness, the markets in which the portfolio company does business, comparison to comparable publicly-traded companies, discounted cash flow and other relevant factors. Because such valuations, and particularly valuations of private securities and private companies, are inherently uncertain, may fluctuate over short periods of time and may be based on estimates, our determinations of fair value may differ materially from the values that would have been used if a ready market for these securities existed. In addition, any investments that include OID or PIK interest may have unreliable valuations because their continuing accruals require ongoing judgments about the collectability of their deferred payments and the value of their underlying collateral. Due to these uncertainties, our fair value determinations may cause our net asset value on a given date to materially understate or overstate the value that we may ultimately realize upon the sale of one or more of our investments. As a result, investors purchasing our
24
common stock based on an overstated net asset value would pay a higher price than the realizable value of our investments might warrant.
In addition, the participation of the Investment Professionals in the valuation process, and the indirect pecuniary interest of John B. Frank, an interested member of our Board of Directors, could result in a conflict of interest as the management fee payable to our Adviser is based on our gross assets and the incentive fees earned by the Adviser will be based, in part, on unrealized gains and losses.
Our ability to achieve our investment objective depends on our Adviser’s ability to support our investment process; if our Adviser were to lose key personnel or they were to resign, our ability to achieve our investment objective could be significantly harmed.
We depend on the investment expertise, skill and network of business contacts of the senior personnel of our Adviser. Our Adviser evaluates, negotiates, structures, executes, monitors and services our investments. Key personnel of our Adviser could depart at any time. Our Adviser’s capabilities in structuring the investment process, providing competent, attentive and efficient services to us, and facilitating access to financing on acceptable terms depend on the employment of investment professionals in adequate number and of adequate sophistication to match the corresponding flow of transactions. The departure of key personnel or of a significant number of the investment professionals or partners of our Adviser, could have a material adverse effect on our ability to achieve our investment objective. Our Adviser may need to hire, train, supervise and manage new investment professionals to participate in our investment selection and monitoring process and may not be able to find investment professionals in a timely manner or at all.
In addition, our Adviser may resign on 60 days’ notice. If we are unable to quickly find a new investment adviser or hire internal management with similar expertise and ability to provide the same or equivalent services on acceptable terms, our operations are likely to experience a disruption and our ability to achieve our investment objective and pay distributions would likely be materially and adversely affected.
Our business model depends to a significant extent upon strong referral relationships, and the inability of the personnel associated with our Adviser to maintain or develop these relationships, or the failure of these relationships to generate investment opportunities, could adversely affect our business.
We expect that personnel associated with our Adviser will maintain and develop their relationships with intermediaries, banks and other sources, and we will rely to a significant extent upon these relationships to provide us with potential investment opportunities. If these individuals fail to maintain their existing relationships or develop new relationships with other sources of investment opportunities, we may not be able to grow or maintain our investment portfolio. In addition, individuals with whom the personnel associated with our Adviser have relationships are not obligated to provide us with investment opportunities, and, therefore, there is no assurance that such relationships will generate investment opportunities for us. The failure of the personnel associated with our Adviser to maintain existing relationships, grow new relationships, or for those relationships to generate investment opportunities could have an adverse effect on our business, financial condition and results of operations.
We may face increasing competition for investment opportunities, which could reduce returns and result in losses.
We compete for investments with other Business Development Companies, public and private funds (including hedge funds, mezzanine funds and CLOs) and private equity funds (to the extent they provide an alternative form of financing), as well as traditional financial services companies such as commercial and investment banks, commercial financing companies and other sources of financing. Many of our competitors are substantially larger and have considerably greater financial, technical and marketing resources than we do. For example, some competitors may have a lower cost of capital and access to funding sources that are not available to us. In addition, some of our competitors may have higher risk tolerances or different risk assessments than we have. These characteristics could allow our competitors to consider a wider variety of investments, establish more relationships and offer better pricing and more flexible structuring than we are able to do. We may lose investment opportunities if we do not match our competitors’ pricing, terms and structure. If we are forced to match our competitors’ pricing, terms and structure, we may not be able to achieve acceptable returns on our investments or may bear substantial risk of capital loss. A significant increase in the number and/or the size of our competitors in this target market could force us to accept less attractive investment terms. Furthermore, many of our competitors are not subject to, the regulatory restrictions that the Investment Company Act imposes on us as a Business Development Company.
25
Our incentive fee may induce our Adviser to make speculative investments.
The incentive fee payable by us to our Adviser may create an incentive for it to make investments on our behalf that are risky or more speculative than would be the case in the absence of such compensation arrangement, which could result in higher investment losses, particularly during cyclical economic downturns. The incentive fee payable to our Adviser includes a component based on a percentage of our net investment income (subject to a hurdle rate), which may encourage our Adviser to use leverage to increase the return on our investments or otherwise manipulate our income so as to recognize income in quarters where the hurdle rate is exceeded and may result in an obligation for us to pay an incentive fee to the Adviser even if we have incurred a loss for an applicable period.
The incentive fee payable by us to our Adviser also may create an incentive for our Adviser to invest on our behalf in instruments that have a deferred interest feature. Under these investments, we would accrue the interest over the life of the investment but would not receive the cash income from the investment until the end of the investment’s term, if at all. Our net investment income used to calculate the income portion of our incentive fee, however, includes accrued interest. Thus, a portion of the incentive fee would be based on income that we have not yet received in cash and may never receive in cash if the portfolio company is unable to satisfy such interest payment obligation to us. While we may make incentive fee payments on income accruals that we may not collect in the future and with respect to which we do not have a formal “clawback” right against our Adviser, the amount of accrued income written off in any period will reduce the income in the period in which such write-off was taken and thereby reduce such period’s incentive fee payment.
In addition, commencing with the fiscal year ending September 30, 2019, our Adviser will receive an incentive fee based upon net capital gains realized on our investments. Unlike the portion of the incentive fee based on income, there is no performance threshold applicable to the portion of the incentive fee based on net capital gains. As a result, our Adviser may have a tendency to invest more in investments that are likely to result in capital gains as compared to income producing securities. Such a practice could result in our investing in more speculative securities than would otherwise be the case, which could result in higher investment losses, particularly during economic downturns.
Given the subjective nature of the investment decisions made by our Adviser on our behalf, we will be unable to monitor these potential conflicts of interest between us and our Adviser.
Our base management fee may induce our Adviser to incur leverage.
Our base management fee is payable based upon our gross assets, which includes borrowings for investment purposes, which may encourage our Adviser to use leverage to make additional investments. Given the subjective nature of the investment decisions made by our Adviser on our behalf, we may not be able to monitor this potential conflict of interest.
The incentive fee we pay to our Adviser relating to capital gains may be effectively greater than 17.5%.
Commencing with the fiscal year ending September 30, 2019, the Adviser can earn an incentive fee based on our capital gains, calculated on a cumulative basis from the beginning of the fiscal year ending September 30, 2019 through the end of each fiscal year. As a result of the operation of the cumulative method of calculating such capital gains portion of the incentive fee, the cumulative aggregate capital gains fee received by our Adviser could be effectively greater than 17.5%, depending on the timing and extent of subsequent net realized capital losses or net unrealized depreciation. This result would occur to the extent that, following receipt by the Adviser of a capital gain incentive fee, we subsequently realized capital depreciation and capital losses in excess of cumulative realized capital gains. We cannot predict whether, or to what extent, this payment calculation would affect your investment in our stock.
Because we borrow money, the potential for loss on amounts invested in us will be magnified and may increase the risk of investing in us.
Borrowings, also known as leverage, magnify the potential for loss on invested equity capital. We expect to continue to use leverage to partially finance our investments, through borrowings from banks and other lenders, which will increase the risks of investing in our common stock, including the likelihood of default. We borrow under our secured syndicated revolving credit facility with certain lenders party thereto from time to time and ING Capital LLC, as administrative agent, as amended, or the ING Facility, have issued 4.875% unsecured notes due 2019, or the 2019 Notes, 5.875% unsecured notes due 2024, or the 2024 Notes, and 6.125% unsecured notes due 2028, or the 2028 Notes, and may issue other debt securities or enter into other types of borrowing arrangements in the future. If the value of our assets decreases, leveraging would cause net asset value to decline more sharply than it otherwise would have had we not leveraged. Similarly, any decrease in our income would cause net income to decline more sharply than it would have had we not borrowed. Such a decline could negatively affect our ability to make common stock distributions or scheduled debt payments. Leverage is generally considered a speculative investment technique and we only intend to use leverage if expected returns will exceed the cost of borrowing.
26
As of September 30, 2018, we had $241.0 million of outstanding indebtedness under the ING Facility, $228.8 million of outstanding 2019 Notes, $75.0 million of outstanding 2024 Notes, $86.3 million of outstanding 2028 Notes and $12.3 million of secured borrowings outstanding. These debt instruments require periodic payments of interest. The weighted average interest rate charged on our borrowings as of September 30, 2018 was 5.1% (exclusive of deferred financing costs). We will need to generate sufficient cash flow to make these required interest payments. In order for us to cover our annual interest payments on indebtedness, we must achieve annual returns on our September 30, 2018 total assets of at least 2.12%. If we are unable to meet the financial obligations under our credit facilities, the lenders under the credit facilities will have a superior claim to our assets over our stockholders. If we are unable to meet the financial obligations under the 2019 Notes, 2024 Notes or 2028 Notes, the holders thereof will have the right to declare the principal amount and accrued and unpaid interest on such notes to be due and payable immediately.
As a Business Development Company, under the Investment Company Act we generally are not permitted to incur indebtedness unless immediately after such borrowing we have an asset coverage for total borrowings of at least 200% (i.e., the amount of debt may not exceed 50% of the value of our assets). We have received exemptive relief from the SEC to permit us to exclude the debt of any SBIC subsidiaries guaranteed by the SBA from the definition of senior securities in the 200% asset coverage ratio we are required to maintain under the Investment Company Act. As a result of our receipt of this relief, we have the ability to incur leverage in excess of the amounts set forth in the Investment Company Act. In addition, the SBCAA enacted into law in March 2018, among other things, amended Section 61(a) of the Investment Company Act to add a new Section 61(a)(2) that reduces the asset coverage requirement applicable to Business Development Companies from 200% to 150% (i.e., the amount of debt may not exceed 66.67% of the value of the Business Development Company’s assets) so long as the Business Development Company meets certain disclosure requirements and obtains certain approvals. If we incur additional leverage, our net asset value will decline more sharply if the value of our assets declines than if we had not incurred such additional leverage and the effects of leverage described above will be magnified.
Illustration. The following table illustrates the effect of leverage on returns from an investment in our common stock assuming various annual returns, net of expenses. The calculations in the table below are hypothetical and actual returns may be higher or lower than those appearing below.
Assumed Return on Portfolio (Net of Expenses) | - 10% | - 5% | 0% | 5% | 10% | ||||||||||
Corresponding net return to common stockholder | -21.92% | -12.88% | -3.84% | 5.20% | 14.24% | ||||||||||
For purposes of this table, we have assumed $1.6 billion in total assets, $643.4 million in debt outstanding, $858.0 million in net assets as of September 30, 2018, and a weighted average interest rate of 5.1% as of September 30, 2018 (exclusive of deferred financing costs). Actual interest payments may be different.
Substantially all of our assets are subject to security interests under the ING Facility and if we default on our obligations under such facility, we may suffer adverse consequences, including foreclosure on our assets.
As of September 30, 2018, substantially all of our assets were pledged as collateral under the ING Facility and may be pledged as collateral under future credit facilities. If we default on our obligations under these facilities, the lenders may have the right to foreclose upon and sell, or otherwise transfer, the collateral subject to their security interests or their superior claim. In such event, we may be forced to sell our investments to raise funds to repay our outstanding borrowings in order to avoid foreclosure and these forced sales may be at times and at prices we would not consider advantageous. Moreover, such deleveraging of our company could significantly impair our ability to effectively operate our business in the manner in which we have historically operated. As a result, we could be forced to curtail or cease new investment activities and lower or eliminate the distributions that we have historically paid to our stockholders.
In addition, if the lenders exercise their right to sell the assets pledged under our credit facilities, such sales may be completed at distressed sale prices, thereby diminishing or potentially eliminating the amount of cash available to us after repayment of the amounts outstanding under the credit facilities.
27
Because we intend to distribute at least 90% of our taxable income each taxable year to our stockholders in connection with our election to be treated as a RIC, we will continue to need additional capital to finance our growth.
In order to qualify for the tax benefits available to RICs and to minimize corporate-level U.S. federal income taxes, we intend to distribute to our stockholders at least 90% of our taxable income each taxable year, except that we may retain certain net capital gains for investment, and treat such amounts as deemed distributions to our stockholders. If we elect to treat any amounts as deemed distributions, we would be subject to income taxes at the corporate rate applicable to net capital gains on such deemed distributions on behalf of our stockholders. As a result of these requirements, we will likely need to raise capital from other sources to grow our business. As a Business Development Company, we are currently required to meet a coverage ratio of total assets, less liabilities and indebtedness not represented by senior securities, to total senior securities, which includes all of our borrowings and any outstanding preferred stock, of at least 200%. These requirements limit the amount that we may borrow. Because we will continue to need capital to grow our investment portfolio, these limitations may prevent us from incurring debt and require us to raise additional equity at a time when it may be disadvantageous to do so.
While we may, in the future, issue additional equity securities, we cannot assure you that equity financing will be available to us on favorable terms, or at all. Also, as a Business Development Company, we generally are not permitted to issue equity securities priced below net asset value without stockholder approval. If additional funds are not available to us, we could be forced to curtail or cease new investment activities, and our net asset value and share price could decline.
Our ability to enter into transactions with our affiliates is restricted.
We are prohibited under the Investment Company Act from participating in certain transactions with certain of our affiliates without the prior approval of our independent directors and, in some cases, the SEC. Any person that owns, directly or indirectly, 5% or more of our outstanding voting securities is our affiliate for purposes of the Investment Company Act, and we are generally prohibited from buying or selling any securities (other than our securities) from or to such affiliate, absent the prior approval of our independent directors. The Investment Company Act also prohibits certain “joint” transactions with certain of our affiliates, which could include investments in the same portfolio company (whether at the same or different times), without prior approval of our independent directors and, in some cases, the SEC. If a person acquires more than 25% of our voting securities, we will be prohibited from buying or selling any security (other than any security of which we are the issuer) from or to such person or certain of that person’s affiliates, or entering into prohibited joint transactions with such person, absent the prior approval of the SEC. Similar restrictions limit our ability to transact business with our officers or directors or their affiliates. As a result of these restrictions, we may be prohibited from buying or selling any security (other than any security of which we are the issuer) from or to any portfolio company of a private equity fund managed by our Adviser without the prior approval of the SEC, which may limit the scope of investment opportunities that would otherwise be available to us.
Our Adviser has received exemptive relief from the SEC to allow certain managed funds and accounts to co-invest, subject to the conditions of the relief granted by the SEC, where doing so is consistent with the applicable registered fund’s or Business Development Company’s investment strategy as well as applicable law (including the terms and conditions of the exemptive order issued by the SEC). Under the terms of this exemptive relief permitting us to co-invest with other funds managed by our Adviser and its affiliates, a “required majority” (as defined in Section 57(o) of the Investment Company Act) of our independent directors must make certain conclusions in connection with a co-investment transaction, including that (1) the terms of the proposed transaction, including the consideration to be paid, are reasonable and fair to us and our stockholders and do not involve overreaching of us or our stockholders on the part of any person concerned, (2) the transaction is consistent with the interests of our stockholders and is consistent with our investment objectives and strategies and (3) the investment by other funds advised by our Adviser or its affiliates would not disadvantage us and our participation would not be on a basis different from, or less advantageous than, that of any other fund advised by our Adviser or its affiliates participating in the transaction. We intend to co-invest, subject to the conditions included in the exemptive order we received from the SEC, with certain of our affiliates. We may also invest alongside funds managed by our Adviser and its affiliates in certain circumstances where doing so is consistent with applicable law and SEC staff interpretations. For example, we may invest alongside such accounts consistent with guidance promulgated by the staff of the SEC permitting us and such other accounts to purchase interests in a single class of privately placed securities so long as certain conditions are met, including that our Adviser, acting on our behalf and on behalf of other clients, negotiates no term other than price.
There are significant potential conflicts of interest that could adversely impact our investment returns.
Our executive officers and directors, and certain members of our Adviser, serve or may serve as officers, directors or principals of entities that operate in the same or a related line of business as we do or of investment funds managed by our affiliates. For example, Oaktree presently serves as the investment adviser to OCSI, a publicly-traded Business Development Company, and OSI II, a privately offered Business Development Company. OCSI has historically invested in senior secured loans, including first lien, unitranche and second lien debt instruments that pay interest at rates which are determined
28
periodically on the basis of a floating base lending rate, made to private middle-market companies whose debt is rated below investment grade, similar to those we target for investment. OSI II may also make similar investments. Therefore, there may be certain investment opportunities that satisfy the investment criteria for OCSI, OSI II and us. OCSI and OSI II operate as distinct and separate companies and any investment in our common stock will not be an investment in OCSI or OSI II. In addition, all of our executive officers serve in substantially similar capacities for OCSI and OSI II and three of our independent directors serve as independent directors of OCSI. Oaktree and its affiliates also manage and sub-advise private investment funds and accounts, and may manage other such funds and accounts in the future, which have investment mandates that are similar, in whole and in part, with ours. Accordingly, they may have obligations to investors in those entities, the fulfillment of which might not be in the best interests of us or our stockholders. For example, the personnel of our Adviser may face conflicts of interest in the allocation of investment opportunities to us and such other funds and accounts. Moreover, the Adviser and the Investment Professionals are engaged in other business activities which divert their time and attention. The Investment Professionals will devote as much time to us as such professionals deem appropriate to perform their duties in accordance with the Investment Advisory Agreement. However, such persons may be committed to providing investment advisory and other services for other clients, and engage in other business ventures in which we have no interest. As a result of these separate business activities, the Adviser may have conflicts of interest in allocating management time, services and functions among us, other advisory clients and other business ventures.
Oaktree has investment allocation guidelines that govern the allocation of investment opportunities among the investment funds and accounts managed or sub-advised by Oaktree and its affiliates. To the extent an investment opportunity is appropriate for us or OCSI or any other investment fund or account managed or sub-advised by Oaktree or its affiliates, Oaktree will adhere to its investment allocation guidelines in order to determine a fair and equitable allocation.
We may invest alongside funds and accounts managed or sub-advised by our Adviser and its affiliates in certain circumstances where doing so is consistent with applicable law and SEC staff interpretations. For example, we may invest alongside such accounts consistent with guidance promulgated by the staff of the SEC permitting us and such other accounts to purchase interests in a single class of privately placed securities so long as certain conditions are met, including that our Adviser, acting on our behalf and on behalf of other clients, negotiates no term other than price or terms related to price.
In addition, on October 18, 2017, our Adviser received exemptive relief from the SEC to allow certain managed funds and accounts, each of whose investment adviser is Oaktree or an investment adviser controlling, controlled by or under common control with Oaktree, to participate in negotiated co-investment transactions where doing so is consistent with the applicable registered fund’s or Business Development Company’s investment objective and strategies as well as regulatory requirements and other pertinent factors, and pursuant to the conditions of the exemptive relief. Each potential co-investment opportunity that falls under the terms of the exemptive relief and is appropriate for us and any affiliated fund or account, and satisfies the then-current board-established criteria, will be offered to us and such other eligible funds and accounts. If there is a sufficient amount of securities to satisfy all participants, the securities will be allocated among the participants in accordance with their proposed order size and if there is an insufficient amount of securities to satisfy all participants, the securities will be allocated pro rata based on the investment proposed by the applicable investment adviser to such participant, up to the amount proposed to be invested by each, which is reviewed and approved by an independent committee of legal, compliance and accounting professionals at our Adviser. Although Oaktree will endeavor to allocate investment opportunities in a fair and equitable manner, we and our common stockholders could be adversely affected to the extent investment opportunities are allocated among us and other investment vehicles managed or sponsored by, or affiliated with, our executive officers, directors and members of our Adviser. We might not participate in each individual opportunity, but will, on an overall basis, be entitled to participate equitably with other entities managed by Oaktree and its affiliates. Oaktree seeks to treat all clients fairly and equitably such that none receive preferential treatment vis-à-vis the others over time, in a manner consistent with its fiduciary duty to each of them; however, in some instances, especially in instances of limited liquidity, the factors may not result in pro rata allocations or may result in situations where certain funds or accounts receive allocations where others do not.
Pursuant to the Investment Advisory Agreement, our Adviser’s liability is limited and we are required to indemnify our Adviser against certain liabilities. This may lead our Adviser to act in a riskier manner in performing its duties and obligations under the Investment Advisory Agreement than it would if it were acting for its own account, and creates a potential conflict of interest.
Pursuant to the Administration Agreement, Oaktree Administrator furnishes us with the facilities, including our principal executive office, and administrative services necessary to conduct our day-to-day operations. We pay Oaktree Administrator its allocable portion of overhead and other expenses incurred by Oaktree Administrator in performing its obligations under the Administration Agreement, including, without limitation a portion of the rent at market rates and the compensation of our Chief Financial Officer, Chief Compliance Officer, their respective staffs and other non-investment professionals at Oaktree that perform duties for us. This arrangement creates conflicts of interest that our Board of Directors must monitor.
29
A failure on our part to maintain our qualification as a Business Development Company would significantly reduce our operating flexibility.
If we fail to continuously qualify as a Business Development Company, we might be subject to regulation as a registered closed-end investment company under the Investment Company Act, which would significantly decrease our operating flexibility. In addition, failure to comply with the requirements imposed on Business Development Companies by the Investment Company Act could cause the SEC to bring an enforcement action against us. See “ Business — Business Development Company Regulations.”
Regulations governing our operation as a Business Development Company and RIC affect our ability to raise, and the way in which we raise, additional capital or borrow for investment purposes, which may have a negative effect on our growth.
In order to qualify for the tax benefits available to RICs and to minimize corporate-level U.S. federal income taxes, we intend to distribute to our stockholders at least 90% of our taxable income each taxable year, except that we may retain certain net capital gains for investment, and treat such amounts as deemed distributions to our stockholders. If we elect to treat any amounts as deemed distributions, we would be subject to income taxes at the corporate rate on such deemed distributions on behalf of our stockholders.
As a Business Development Company, we may issue “senior securities,” including borrowing money from banks or other financial institutions only in amounts such that our asset coverage, as defined in the Investment Company Act, equals at least 200% after such incurrence or issuance, provided that, pursuant to exemptive relief we received from the SEC, we are permitted to exclude the debt of any SBIC subsidiaries guaranteed by the SBA from the definition of senior securities in calculating our 200% asset coverage ratio under the Investment Company Act. The SBCAA, which was enacted into law in March 2018, among other things, amended Section 61(a) of the Investment Company Act to add a new Section 61(a)(2) that reduces the asset coverage requirement applicable to Business Development Companies from 200% to 150% so long as the Business Development Company meets certain disclosure requirements and obtains certain approvals. These requirements limit the amount that we may borrow, may unfavorably limit our investment opportunities and may reduce our ability in comparison to other companies to profit from favorable spreads between the rates at which we can borrow and the rates at which we can lend. If the value of our assets declines, we may be unable to satisfy the asset coverage test, which could prohibit us from paying distributions and could prevent us from being subject to tax as a RIC. If we cannot satisfy the asset coverage test, we may be required to sell a portion of our investments and, depending on the nature of our debt financing, repay a portion of our indebtedness at a time when such sales may be disadvantageous.
Because we will continue to need capital to grow our investment portfolio, these limitations may prevent us from incurring debt and require us to raise additional equity at a time when it may be disadvantageous to do so. As a result of these requirements we need to periodically access the capital markets to raise cash to fund new investments at a more frequent pace than our privately owned competitors. We generally are not able to issue or sell our common stock at a price below net asset value per share, which may be a disadvantage as compared with other public companies or private investment funds. If our common stock trades at a discount to net asset value, this restriction could adversely affect our ability to raise capital. We may, however, sell our common stock, or warrants, options or rights to acquire our common stock, at a price below the current net asset value of the common stock if our Board of Directors and independent directors determine that such sale is in our best interests and the best interests of our stockholders, and our stockholders as well as those stockholders that are not affiliated with us approve such sale in accordance with the requirements of the Investment Company Act. In any such case, the price at which our securities are to be issued and sold may not be less than a price that, in the determination of our Board of Directors, closely approximates the market value of such securities (less any underwriting commission or discount).
We also may make rights offerings to our stockholders at prices less than net asset value, subject to applicable requirements of the Investment Company Act. If we raise additional funds by issuing more shares of our common stock or issuing senior securities convertible into, or exchangeable for, our common stock, the percentage ownership of our stockholders may decline at that time and such stockholders may experience dilution. Moreover, we can offer no assurance that we will be able to issue and sell additional equity securities in the future, on terms favorable to us or at all.
In addition, we may in the future seek to securitize our portfolio securities to generate cash for funding new investments. To securitize loans, we would likely create a wholly-owned subsidiary and contribute a pool of loans to the subsidiary. We would then sell interests in the subsidiary on a non-recourse basis to purchasers and we would retain all or a portion of the equity in the subsidiary. An inability to successfully securitize our loan portfolio could limit our ability to grow our business or fully execute our business strategy and may decrease our earnings, if any. The securitization market is subject to changing market conditions and we may not be able to access this market when we would otherwise deem appropriate. Moreover, the successful securitization of our portfolio might expose us to losses as the residual investments in which we do not sell interests will tend to be those that are riskier and more apt to generate losses. The Investment Company Act also may impose restrictions on the structure of any securitization.
30
We may experience fluctuations in our quarterly results.
We could experience fluctuations in our quarterly results due to a number of factors, including our ability or inability to make investments in companies that meet our investment criteria, the interest rate payable on the debt securities we acquire, changes in accrual status of our portfolio company investments, distributions, the level of our expenses, variations in and the timing of the recognition of realized and unrealized gains or losses, the degree to which we encounter competition in our market and general economic conditions. As a result of these factors, results for any period should not be relied upon as being indicative of performance in future periods.
Our Board of Directors may change our investment objective, operating policies and strategies without prior notice or stockholder approval, the effects of which may be adverse.
Our Board of Directors has the authority to modify or waive our current investment objective, operating policies and strategies without prior notice and without stockholder approval. We cannot predict the effect any changes to our current investment objective, operating policies and strategies would have on our business, net asset value, operating results and value of our stock. However, the effects might be adverse, which could negatively impact our ability to pay you distributions and cause you to lose part or all of your investment.
We may not be able to pay you distributions, our distributions may not grow over time and a portion of our distributions may be a return of capital.
We intend to pay distributions to our stockholders out of assets legally available for distribution. We cannot assure you that we will achieve investment results that will allow us to sustain a specified level of cash distributions or periodic increases in cash distributions. In addition, the inability to satisfy the asset coverage test applicable to us as a Business Development Company can limit our ability to pay distributions. All distributions will be paid at the discretion of our Board of Directors and will depend on our earnings, our financial condition, maintenance of our ability to be subject to tax as a RIC, compliance with applicable Business Development Company regulations and such other factors as our Board of Directors may deem relevant from time to time. We cannot assure you that we will continue to pay distributions to our stockholders at current levels, or at all.
When we make distributions, our distributions generally will be treated as dividends for U.S. federal income tax purposes to the extent such distributions are paid out of our current or accumulated earnings and profits. Distributions in excess of current and accumulated earnings and profits will be treated as a non-taxable return of capital to the extent of a stockholder's basis in our stock and, assuming that a stockholder holds our stock as a capital asset, thereafter as a capital gain. A return of capital generally is a return of a stockholder’s investment rather than a return of earnings or gains derived from our investment activities. Moreover, we may pay all or a substantial portion of our distributions from the proceeds of the sale of shares of our common stock or from borrowings in anticipation of future cash flow, which could constitute a return of stockholders’ capital and will lower such stockholders’ tax basis in our shares, which may result in increased tax liability to stockholders when they sell or otherwise dispose of such shares. The tax liability incurred by such stockholders upon the sale or other disposition of shares of our common stock may increase even if such shares are sold at a loss.
We will be subject to corporate-level U.S. federal income tax if we are unable to maintain our qualification as a RIC under Subchapter M of the Code or do not satisfy the Annual Distribution Requirement.
To maintain our tax status as a RIC and be relieved of U.S. federal taxes on income and gains distributed to our stockholders, we must meet the following annual distribution, income source and asset diversification requirements:
• | The Annual Distribution Requirement will be satisfied if we distribute dividends to our stockholders each taxable year of an amount generally at least equal to 90% of the sum of our net taxable income plus realized net short-term capital gains in excess of realized net long-term capital losses, if any. Because we use debt financing, we are and may, in the future, be subject to certain financial covenants under our debt arrangements that could, under certain circumstances, restrict us from making distributions necessary to satisfy the Annual Distribution Requirement. If we are unable to obtain cash from other sources, we could fail to qualify for RIC tax treatment and thus could become subject to corporate-level income tax. |
• | The 90% Gross Income Test will be satisfied if we earn at least 90% of our gross income for each taxable year from dividends, interest, gains from the sale of stock or securities or similar sources. |
• | The Diversification Tests will be satisfied if, at the end of each quarter of our taxable year, at least 50% of the value of our assets consist of cash, cash equivalents, U.S. government securities, securities of other RICs, and other acceptable securities; and no more than 25% of the value of our assets can be invested in the securities, other than U.S. government securities or securities of other RICs, of one issuer, of two or more issuers that are controlled, as determined under applicable Code rules, by us and that are engaged in the same or similar or related trades or businesses or of certain “qualified publicly traded partnerships.” Failure to meet these requirements may result in our having to dispose of certain investments quickly in order to prevent the loss of RIC status. Because most of our investments will be in private |
31
companies, and therefore will be relatively illiquid, any such dispositions could be made at disadvantageous prices and could cause us to incur substantial losses.
If we fail to be subject to tax as a RIC and are subject to entity-level U.S. federal corporate income tax, the resulting corporate taxes could substantially reduce our net assets, the amount of income available for distribution and the amount of our distributions.
We may have difficulty paying our required distributions if we are required to recognize income for U.S. federal income tax purposes before or without receiving cash representing such income.
For U.S. federal income tax purposes, we generally are required to include in income certain amounts that we have not yet received in cash, such as OID or certain income accruals on contingent payment debt instruments, which may occur if we receive warrants in connection with the origination of a loan or possibly in other circumstances. Such OID is generally required to be included in income before we receive any corresponding cash payments. In addition, our loans typically contain PIK interest provisions. Any PIK interest, computed at the contractual rate specified in each loan agreement, is generally required to be added to the principal balance of the loan and recorded as interest income. We also may be required to include in income certain other amounts that we do not receive, and may never receive, in cash. To avoid the imposition of corporate-level tax on us, this non-cash source of income may need to be distributed to our stockholders in cash or, in the event that we determine to do so, in shares of our common stock, even though we may have not yet collected and may never collect the cash relating to such income.
Since, in certain cases, we may recognize income before or without receiving cash representing such income, we may have difficulty meeting the Annual Distribution Requirement necessary to be relieved of entity-level U.S. federal taxes on income and gains distributed to our stockholders. Accordingly, we may have to sell or otherwise dispose of some of our investments at times and/or at prices we would not consider advantageous, raise additional debt or equity capital or forgo new investment opportunities for this purpose. If we are not able to obtain cash from other sources, we may fail to satisfy the Annual Distribution Requirement and thus become subject to corporate-level U.S. federal income tax.
We may in the future choose to pay distributions partly in our own stock, in which case you may be subject to tax in excess of the cash you receive.
We may distribute taxable distributions that are payable in part in our stock. In accordance with certain applicable Treasury regulations and other related administrative pronouncements issued by the Internal Revenue Service, or the IRS, a RIC may be eligible to treat a distribution of its own stock as fulfilling its RIC distribution requirements if each stockholder is permitted to elect to receive his or her entire distribution in either cash or stock of the RIC, subject to the satisfaction of certain guidelines. If too many stockholders elect to receive cash (which generally may not be less than 20% of the value of the overall distribution), each stockholder electing to receive cash must receive a pro rata amount of cash (with the balance of the distribution paid in stock). If these and certain other requirements are met, for U.S. federal income tax purposes, the amount of the distribution paid in stock generally will be equal to the amount of cash that could have been received instead of stock. Taxable stockholders receiving such distributions will be required to include the full amount of the distribution as ordinary income (or as long-term capital gain to the extent such distribution is properly reported as a capital gain dividend) to the extent of their share of our current and accumulated earnings and profits for U.S. federal income tax purposes. As a result, a U.S. stockholder may be subject to tax with respect to such distributions in excess of any cash received. If a U.S. stockholder sells the stock it receives as a distribution in order to pay this tax, the sales proceeds may be less than the amount included in income with respect to the distribution, depending on the market price of our stock at the time of the sale. Furthermore, with respect to non-U.S. stockholders, we may be required to withhold U.S. tax with respect to such distribution, including in respect of all or a portion of such distribution that is payable in stock. In addition, if a significant number of our stockholders determine to sell shares of our stock in order to pay taxes owed on a distribution, such sales may put downward pressure on the trading price of our stock.
We may enter into reverse repurchase agreements, which are another form of leverage.
We may enter into reverse repurchase agreements as part of our management of our temporary investment portfolio. Our entry into any such reverse repurchase agreements would be subject to the Investment Company Act limitations on leverage. In connection with entry into a reverse repurchase agreement, we would effectively pledge our assets as collateral to secure a short-term loan. Generally, the other party to the agreement would make a loan to us in an amount equal to a percentage of the fair value of the collateral we have pledged. At the maturity of the reverse repurchase agreement, we will be required to repay the loan and then receive back our collateral. While used as collateral, the assets continue to pay principal and interest which are for the benefit of us.
32
Our use of reverse repurchase agreements, if any, involves many of the same risks involved in our use of leverage. For example, the market value of the securities acquired in the reverse repurchase agreement may decline below the price of the securities that we have sold but we would remain obligated to purchase those securities, meaning that we bear the risk of loss that the proceeds at settlement are less than the fair value of the securities pledged. In addition, the market value of the securities retained by us may decline. If a buyer of securities under a reverse repurchase agreement were to file for bankruptcy or experience insolvency, we would be adversely affected. In addition, due to the interest costs associated with reverse repurchase agreements, our net asset value would decline, and, in some cases, we may be worse off than if we had not used such agreements.
We are currently subject to an SEC investigation that could adversely affect our financial condition, business and results of operations.
We have responded to requests arising from a SEC investigation principally related to the activities of our Former Adviser. Although we believe based on communications from SEC Staff that our obligations with respect to the matter are concluded, SEC investigations are subject to inherent uncertainties and management’s view of these matters may change in the future.
Changes in laws or regulations governing our operations may adversely affect our business or cause us to alter our business strategy.
We and our portfolio companies are subject to regulation at the local, state and federal level. New legislation may be enacted or new interpretations, rulings or regulations could be adopted, including those governing the types of investments we are permitted to make or that impose limits on our ability to pledge a significant amount of our assets to secure loans or that restrict the operations of a portfolio company, any of which could harm us and our stockholders and the value of our investments, potentially with retroactive effect. For example, certain provisions of the Dodd-Frank Wall Street Reform and Consumer Protection Act, which influences many aspects of the financial services industry, have been amended or repealed and the Code has been substantially amended and reformed. Any amendment or repeal of legislation, or changes in regulations or regulatory interpretations thereof, could create uncertainty in the near term, which could have a material adverse impact on our business, financial condition and results of operations.
Additionally, any changes to the laws and regulations governing our operations relating to permitted investments may cause us to alter our investment strategy in order to avail ourselves of new or different opportunities. Such changes could result in material differences to the strategies and plans set forth herein and may result in our investment focus shifting from the areas of expertise of our Adviser to other types of investments in which our Adviser may have less expertise or little or no experience. Thus, any such changes, if they occur, could have a material adverse effect on our results of operations and the value of your investment.
Future control deficiencies could prevent us from accurately and timely reporting our financial results.
We may identify deficiencies in our internal control over financial reporting in the future, including significant deficiencies and material weaknesses. A “significant deficiency” is a deficiency, or a combination of deficiencies, in internal control over financial reporting that is less severe than a material weakness, yet important enough to merit attention by those responsible for oversight of a company’s financial reporting. A "material weakness" is a deficiency, or a combination of deficiencies, in internal control over financial reporting such that there is a reasonable possibility that a material misstatement of the company’s annual or interim financial statements will not be prevented or detected on a timely basis. A "deficiency" in internal control exists when the design or operation of a control does not allow management or employees, in the normal course of performing their assigned functions, to prevent or detect misstatements on a timely basis.
Our failure to identify deficiencies in our internal control over financial reporting in a timely manner or remediate any deficiencies, or the identification of material weaknesses or significant deficiencies in the future could prevent us from accurately and timely reporting our financial results.
We are subject to risks associated with communications and information systems.
We depend on the communications and information systems of our Adviser and its affiliates as well as certain third-party service providers. As these systems became more important to our business, the risks posed to these communications and information systems have continued to increase. Any failure or interruption in these systems could cause disruptions in our activities, including because we do not maintain any such systems of our own. In addition, these systems are subject to potential attacks, including through adverse events that threaten the confidentiality, integrity or availability of our information resources. These attacks, which may include cyber incidents, may involve a third party gaining unauthorized access to our communications or information systems for purposes of misappropriating assets, stealing confidential information related to our operations or portfolio companies, corrupting data or causing operational disruption. Any such attack could result in disruption to our business, misstated or unreliable financial data, liability for stolen assets or information, increased cybersecurity
33
protection and insurance costs, litigation and damage to our business relationships, any of which could have a material adverse effect on our business, financial condition and results of operations.
We may be unable to invest a significant portion of the net proceeds from an offering of our securities on acceptable terms within an attractive timeframe.
Delays in investing the net proceeds raised in an offering of our securities may cause our performance to be worse than that of fully invested Business Development Companies or other lenders or investors pursuing comparable investment strategies. We cannot assure you that we will be able to identify any investments that meet our investment objective or that any investment that we make will produce a positive return. We may be unable to invest the net proceeds of any offering on acceptable terms within the time period that we anticipate or at all, which could harm our financial condition and operating results.
We anticipate that, depending on market conditions, it may take us a substantial period of time to invest substantially all of the net proceeds of any offering in securities meeting our investment objective. During this period, we will invest the net proceeds of an offering primarily in cash, cash equivalents, U.S. government securities, repurchase agreements and high-quality debt instruments maturing in one year or less from the time of investment, which may produce returns that are significantly lower than the returns which we expect to achieve when our portfolio is fully invested in securities meeting our investment objective. As a result, any distributions that we pay during this period may be substantially lower than the distributions that we may be able to pay when our portfolio is fully invested in securities meeting our investment objective. In addition, until such time as the net proceeds of an offering are invested in securities meeting our investment objective, the market price for our common stock may decline. Thus, the return on your investment may be lower than when, if ever, our portfolio is fully invested in securities meeting our investment objective.
We incur significant costs as a result of being a publicly traded company.
As a publicly-traded company, we incur legal, accounting and other expenses, including costs associated with the periodic reporting requirements applicable to a company whose securities are registered under the Exchange Act, as well as additional corporate governance requirements, including requirements under the Sarbanes-Oxley Act, and other rules implemented by the SEC and the listing standards of the Nasdaq Global Select Market and the New York Stock Exchange.
Risks Relating to Our Investments
Our investments in portfolio companies may be risky, and we could lose all or parts of our investments.
The companies in which we invest are typically highly leveraged, and, in most cases, our investments in such companies are not rated by any rating agency. If such investments were rated, we believe that they would likely receive a rating from a nationally recognized statistical rating organization of below investment grade (i.e., below BBB- or Baa), which is often referred to as "high yield" and “junk.” Exposure to below investment grade securities involves certain risks, and those securities are viewed as having predominately speculative characteristics with respect to the issuer's capacity to pay interest and repay principal. Investing in small and mid-sized companies involves a number of significant risks.
Certain our debt portfolio at fair value consisted of debt securities for which issuers were not required to make principal payments until the maturity of such debt securities, which could result in a substantial loss to us if such issuers are unable to refinance or repay their debt at maturity. Increases in interest rates may affect the ability of our portfolio companies to repay debt or pay interest, which may in turn affect the value of our portfolio investments, and our business, financial condition and results of operations.
Among other things, our portfolio companies:
• | may have limited financial resources, may have limited or negative EBITDA and may be unable to meet their obligations under their debt instruments that we hold, which may be accompanied by a deterioration in the value of any collateral and a reduction in the likelihood of us realizing any guarantees from subsidiaries or affiliates of our portfolio companies that we may have obtained in connection with our investments, as well as a corresponding decrease in the value of the equity components of our investments; |
• | may have shorter operating histories, narrower product lines, smaller market shares and/or significant customer concentrations than larger businesses, which tend to render them more vulnerable to competitors’ actions and market conditions, as well as general economic downturns; |
• | may operate in regulated industries and/or provide services to federal, state or local governments, or operate in industries that provide services to regulated industries or federal, state or local governments, any of which could lead to delayed payments for services or subject the company to changing payment and reimbursement rates or other terms; |
34
• | may not have collateral sufficient to pay any outstanding interest or principal due to us in the event of a default by these companies; |
• | are more likely to depend on the management talents and efforts of a small group of people; therefore, the death, disability, resignation or termination of one or more of these persons could have a material adverse impact on our portfolio company and, in turn, on us; |
• | may have difficulty accessing the capital markets to fund capital needs, which may limit their ability to grow or repay outstanding indebtedness at maturity; |
• | generally have less predictable operating results, may from time to time be parties to litigation, may be engaged in rapidly changing businesses with products subject to a substantial risk of obsolescence, and may require substantial additional capital to support their operations, finance expansion or maintain their competitive position; and |
• | generally have less publicly available information about their businesses, operations and financial condition. |
In addition, in the course of providing managerial assistance to certain of our portfolio companies, certain of our officers and directors may serve as directors on the boards of such companies. To the extent that litigation arises out of our investments in these companies, our officers and directors may be named as defendants in such litigation, which could result in an expenditure of funds (through our indemnification of such officers and directors) and the diversion of management time and resources.
Finally, as noted above, little public information generally exists about privately owned companies, and these companies may not have third-party debt ratings or audited financial statements. We must therefore rely on the ability of our Adviser to obtain adequate information through due diligence to evaluate the creditworthiness and potential returns from investing in these companies. Additionally, these companies and their financial information will not generally be subject to the Sarbanes-Oxley Act and other rules that govern public companies.
We may be exposed to higher risks with respect to our investments that include OID or PIK interest.
Our investments may include OID and contractual PIK interest, which represents contractual interest added to a loan balance and due at the end of such loan’s term. To the extent OID or PIK interest constitute a portion of our income, we are exposed to typical risks associated with such income being required to be included in taxable and accounting income prior to receipt of cash, including the following:
•OID and PIK instruments may have higher yields, which reflect the payment deferral and credit risk associated with these instruments;
•OID and PIK accruals may create uncertainty about the source of our distributions to stockholders;
•OID and PIK instruments may have unreliable valuations because their continuing accruals require continuing judgments about the collectability of the deferred payments and the value of the collateral; and
•OID and PIK instruments may represent a higher credit risk than coupon loans.
If we acquire the securities and obligations of distressed or bankrupt companies, such investments may be subject to significant risks, including lack of income, extraordinary expenses, uncertainty with respect to satisfaction of debt, lower-than-expected investment values or income potentials and resale restrictions.
We may acquire the securities and other obligations of distressed or bankrupt companies. At times, distressed debt obligations may not produce income and may require us to bear certain extraordinary expenses (including legal, accounting, valuation and transaction expenses) in order to protect and recover our investment. Therefore, to the extent we invest in distressed debt, our ability to achieve current income for our stockholders may be diminished, particularly where the portfolio company has negative EBITDA.
We also will be subject to significant uncertainty as to when and in what manner and for what value the distressed debt we invest in will eventually be satisfied whether through a liquidation, an exchange offer or plan of reorganization involving the distressed debt securities or a payment of some amount in satisfaction of the obligation. In addition, even if an exchange offer is made or plan of reorganization is adopted with respect to distressed debt held by us, there can be no assurance that the securities or other assets received by us in connection with such exchange offer or plan of reorganization will not have a lower value or income potential than may have been anticipated when the investment was made.
Moreover, any securities received by us upon completion of an exchange offer or plan of reorganization may be restricted as to resale. As a result of our participation in negotiations with respect to any exchange offer or plan of reorganization with respect to an issuer of distressed debt, we may be restricted from disposing of such securities.
35
Our portfolio companies may prepay loans, which may reduce our yields if capital returned cannot be invested in transactions with equal or greater expected yields.
The loans in our investment portfolio may be prepaid at any time, generally with little advance notice. Whether a loan is prepaid will depend both on the continued positive performance of the portfolio company and the existence of favorable financing market conditions that allow such company the ability to replace existing financing with less expensive capital. As market conditions change, we do not know when, and if, prepayment may be possible for each portfolio company. In some cases, the prepayment of a loan may reduce our achievable yield if the capital returned cannot be invested in transactions with equal or greater expected yields, which could have a material adverse effect on our business, financial condition and results of operations.
The lack of liquidity in our investments may adversely affect our business.
We invest, and will continue to invest, in companies whose securities are not publicly traded, and whose securities are subject to legal and other restrictions on resale or are otherwise less liquid than publicly traded securities. In fact, all of our assets may be invested in illiquid securities. The illiquidity of these investments may make it difficult for us to sell these investments when desired. In addition, if we are required to liquidate all or a portion of our portfolio quickly, we may realize significantly less than the value at which we had previously recorded these investments. Our investments may be subject to contractual or legal restrictions on resale or are otherwise illiquid because there is usually no established trading market for such investments. In addition, we may also face restrictions on our ability to liquidate our investments if our Adviser or any of its affiliates have material nonpublic information regarding the portfolio company. The illiquidity of most of our investments may make it difficult for us to dispose of them at a favorable price, and, as a result, we may suffer losses.
We may not have the funds or ability to make additional investments in our portfolio companies.
After our initial investment in a portfolio company, we may be called upon from time to time to provide additional funds to such company or have the opportunity to increase our investment through a follow-on investment. There is no assurance that we will make, or will have sufficient funds to make, follow-on investments. Any decisions not to make a follow-on investment or any inability on our part to make such an investment may have a negative impact on a portfolio company in need of such an investment, may result in a missed opportunity for us to increase our participation in a successful operation, may reduce the expected yield on the investment or impair the value of our investment in any such portfolio company.
Our portfolio companies may be highly leveraged.
Our investments may include companies whose capital structures have significant leverage. Such investments are inherently more sensitive to declines in revenues and to increases in expenses and interest rates. The leveraged capital structure of such investments will increase the exposure of the portfolio companies to adverse economic factors, such as downturns in the economy or deterioration in the condition of the portfolio company or its industry. Additionally, the securities acquired by us may be the most junior in what will typically be a complex capital structure, and thus subject to the greatest risk of loss.
Our portfolio companies may incur debt that ranks equally with, or senior to, our investments in such companies.
We invest primarily in first lien, second lien and subordinated debt issued by small and mid-sized companies. Our portfolio companies may have, or may be permitted to incur, other debt that ranks equally with, or senior to, the debt in which we invest. By their terms, such debt instruments may entitle the holders to receive payments of interest or principal on or before the dates on which we are entitled to receive payments with respect to the debt instruments in which we invest. Also, in the event of insolvency, liquidation, dissolution, reorganization or bankruptcy of a portfolio company, holders of debt instruments ranking senior to our investment in that portfolio company would typically be entitled to receive payment in full before we receive any distribution. After repaying such senior creditors, such portfolio company may not have any remaining assets to use for repaying its obligation to us. In the case of debt ranking equally with debt instruments in which we invest, we would have to share on an equal basis any distributions with other creditors holding such debt in the event of an insolvency, liquidation, dissolution, reorganization or bankruptcy of the relevant portfolio company.
The disposition of our investments may result in contingent liabilities.
In connection with the disposition of an investment in private securities, we may be required to make representations about the business and financial affairs of the portfolio company typical of those made in connection with the sale of a business. We may also be required to indemnify the purchasers of such investment to the extent that any such representations turn out to be inaccurate or with respect to certain potential liabilities. These arrangements may result in contingent liabilities that ultimately yield funding obligations that must be satisfied through our return of certain distributions previously made to us.
36
There may be circumstances where our debt investments could be subordinated to claims of other creditors or we could be subject to lender liability claims.
Even though we have structured some of our investments as senior loans, if one of our portfolio companies were to enter bankruptcy proceedings, a bankruptcy court might re-characterize our debt investment and subordinate all or a portion of our claim to that of other creditors, depending on the facts and circumstances, including the extent to which we actually provided managerial assistance to that portfolio company. We may also be subject to lender liability claims for actions taken by us with respect to a borrower’s business or instances where we exercise control over the borrower. It is possible that we could become subject to a lender’s liability claim, including as a result of actions taken in rendering significant managerial assistance.
Second priority liens on collateral securing loans that we make to our portfolio companies may be subject to control by senior creditors with first priority liens. If there is a default, the value of the collateral may not be sufficient to repay in full both the first priority creditors and us.
Certain loans that we make to portfolio companies will be secured on a second priority basis by the same collateral securing senior secured debt of such companies. The first priority liens on the collateral will secure the portfolio company’s obligations under any outstanding senior debt and may secure certain other future debt that may be permitted to be incurred by the company under the agreements governing the loans. The holders of obligations secured by the first priority liens on the collateral will generally control the liquidation of and be entitled to receive proceeds from any realization of the collateral to repay their obligations in full before us. In addition, the value of the collateral in the event of liquidation will depend on market and economic conditions, the availability of buyers and other factors. There can be no assurance that the proceeds, if any, from the sale or sales of all of the collateral would be sufficient to satisfy the loan obligations secured by the second priority liens after payment in full of all obligations secured by the first priority liens on the collateral. If such proceeds are not sufficient to repay amounts outstanding under the loan obligations secured by the second priority liens, then we, to the extent not repaid from the proceeds of the sale of the collateral, will only have an unsecured claim against the company’s remaining assets, if any.
The rights we may have with respect to the collateral securing the loans we make to our portfolio companies with senior debt outstanding may also be limited pursuant to the terms of one or more inter-creditor agreements that we enter into with the holders of senior debt. Under such an inter-creditor agreement, at any time that obligations that have the benefit of the first priority liens are outstanding, any of the following actions may be taken with respect to the collateral and will be at the direction of the holders of the obligations secured by the first priority liens: the ability to cause the commencement of enforcement proceedings against the collateral; the ability to control the conduct of such proceedings; the approval of amendments to collateral documents; releases of liens on the collateral; and waivers of past defaults under collateral documents. We may not have the ability to control or direct such actions, even if our rights are adversely affected.
If we make unsecured debt investments, we may lack adequate protection in the event our portfolio companies become distressed or insolvent and will likely experience a lower recovery than more senior debtholders in the event such portfolio companies default on their indebtedness.
We have made, and may in the future make, unsecured debt investments in portfolio companies. Unsecured debt investments are unsecured and junior to other indebtedness of the portfolio company. As a consequence, the holder of an unsecured debt investment may lack adequate protection in the event the portfolio company becomes distressed or insolvent and will likely experience a lower recovery than more senior debtholders in the event the portfolio company defaults on its indebtedness. In addition, unsecured debt investments of small and mid-sized companies are often highly illiquid and in adverse market conditions may experience steep declines in valuation even if they are fully performing.
We may incur greater risk with respect to investments we acquire through assignments or participations of interests.
Although we originate a substantial portion of our loans, we may acquire loans through assignments or participations of interests in such loans. The purchaser of an assignment typically succeeds to all the rights and obligations of the assigning institution and becomes a lender under the credit agreement with respect to such debt obligation. However, the purchaser’s rights can be more restricted than those of the assigning institution, and we may not be able to unilaterally enforce all rights and remedies under an assigned debt obligation and with regard to any associated collateral. A participation typically results in a contractual relationship only with the institution participating out the interest and not directly with the borrower. Sellers of participations typically include banks, broker-dealers, other financial institutions and lending institutions. In purchasing participations, we generally will have no right to enforce compliance by the borrower with the terms of the loan agreement against the borrower, and we may not directly benefit from the collateral supporting the debt obligation in which we have purchased the participation. As a result, we will be exposed to the credit risk of both the borrower and the institution selling the participation. Further, in purchasing participations in lending syndicates, we will not be able to conduct the same level of due diligence on a borrower or the quality of the loan with respect to which we are buying a participation as we would conduct if we were investing directly in the loan. This difference may result in us being exposed to greater credit or fraud risk with respect to such loans than we expected when initially purchasing the participation.
37
We generally do not, and do not expect to, control our portfolio companies.
We do not, and do not expect to, control most of our portfolio companies. As a result, we are subject to the risk that a portfolio company in which we invest may make business decisions with which we disagree and the management of such company, as representatives of the holders of their common equity, may take risks or otherwise act in ways that do not serve our interests as a debt investor, including actions that could decrease the value of our investment. Due to the lack of liquidity for our investments in non-traded companies, we may not be able to dispose of our interests in our portfolio companies as readily as we would like or at an appropriate valuation.
Defaults by our portfolio companies would harm our operating results.
A portfolio company’s failure to satisfy financial or operating covenants imposed by us or other lenders could lead to defaults and, potentially, termination of its loans and foreclosure on its secured assets, which could trigger cross-defaults under other agreements and jeopardize a portfolio company’s ability to meet its obligations under the debt or equity securities that we hold. We may incur expenses to the extent necessary to seek recovery upon default or to negotiate new terms, which may include the waiver of certain financial covenants, with a defaulting portfolio company. In addition, we may write-down the value of a portfolio company investment upon the worsening of the financial condition of the portfolio company or in anticipation of a default, which could also have a material adverse effect on our business, financial condition and results of operations.
Our portfolio companies may experience financial distress and our investments in such companies may be restructured.
Our portfolio companies may experience financial distress from time to time. Debt investments in such companies may cease to be income-producing, may require us to bear certain expenses to protect our investment and may subject us to uncertainty as to when, in what manner and for what value such distressed debt will eventually be satisfied, including through liquidation, reorganization or bankruptcy. Any restructuring can fundamentally alter the nature of the related investment, and restructurings may not be subject to the same underwriting standards that our Adviser employs in connection with the origination of an investment. In addition, we may write-down the value of our investment in any such company to reflect the status of financial distress and future prospects of the business. Any restructuring could alter, reduce or delay the payment of interest or principal on any investment, which could delay the timing and reduce the amount of payments made to us. For example, if an exchange offer is made or plan of reorganization is adopted with respect to the debt securities we currently hold, there can be no assurance that the securities or other assets received by us in connection with such exchange offer or plan of reorganization will have a value or income potential similar to what we anticipated when our original investment was made or even at the time of restructuring. Restructurings of investments might also result in extensions of the term thereof, which could delay the timing of payments made to us, or we may receive equity securities, which may require significantly more of our management’s time and attention or carry restrictions on their disposition. We cannot assure you that any particular restructuring strategy pursued by our Adviser will maximize the value of or recovery on any investment.
We may not realize gains from our equity investments.
Certain investments that we have made in the past and may make in the future include warrants or other equity securities. In addition, we have made in the past and may make in the future direct equity investments in companies. Our goal is ultimately to realize gains upon our disposition of such equity interests. However, the equity interests we receive may not appreciate in value and, in fact, may decline in value. Accordingly, we may not be able to realize gains from our equity interests, and any gains that we do realize on the disposition of any equity interests may not be sufficient to offset any other losses we experience. We also may be unable to realize any value if a portfolio company does not have a liquidity event, such as a sale of the business, recapitalization or public offering, which would allow us to sell the underlying equity interests. We may seek puts or similar rights to give us the right to sell our equity securities back to the portfolio company issuer. We may be unable to exercise these put rights for the consideration provided in our investment documents if the issuer is in financial distress.
We are subject to certain risks associated with foreign investments.
We have made in the past and may make in the future investments in foreign companies. Investing in foreign companies may expose us to additional risks not typically associated with investing in U.S. companies. These risks include changes in foreign exchange rates, exchange control regulations, political and social instability, expropriation, imposition of foreign taxes, less liquid markets and less available information than is generally the case in the U.S., higher transaction costs, less government supervision of exchanges, brokers and issuers, less developed bankruptcy laws, difficulty in enforcing contractual obligations, lack of uniform accounting and auditing standards and greater price volatility. In addition, our foreign investments generally do not constitute "qualifying assets" under the Investment Company Act, under which qualifying assets must represent at least 70% of our total assets. See “Business Development Company Regulations — Qualifying Assets.”
Our success will depend, in part, on our ability to anticipate and effectively manage these and other risks. We cannot assure you that these and other factors will not have a material adverse effect on our business as a whole.
38
We may have foreign currency risks related to our investments denominated in currencies other than the U.S. dollar.
As of September 30, 2018, a portion of our investments are, and may continue to be, denominated in currencies other than the U.S. dollar. Changes in the rates of exchange between the U.S. dollar and other currencies will have an effect, which could be adverse, on our performance, amounts available for withdrawal and the value of securities distributed by us. Among the factors that may affect currency values are trade balances, the level of short-term interest rates, differences in relative values of similar assets in different currencies, long-term opportunities for investment and capital appreciation and political developments. Additionally, a particular foreign country may impose exchange controls, devalue its currency or take other measures relating to its currency which could adversely affect us. Finally, we could incur costs in connection with conversions between various currencies.
We may expose ourselves to risks if we engage in hedging transactions.
Subject to applicable provisions of the Investment Company Act and applicable regulations promulgated by the Commodities Futures Trading Commission, we have in the past and may in the future enter into hedging transactions, which may expose us to risks associated with such transactions. Such hedging may utilize instruments such as forward contracts, currency options and interest rate swaps, caps, collars and floors to seek to hedge against fluctuations in the relative values of our portfolio positions and amounts due under any credit facility from changes in currency exchange rates and market interest rates. Use of these hedging instruments may include counterparty credit risk. Hedging against a decline in the values of our portfolio positions does not eliminate the possibility of fluctuations in the values of such positions and amounts due under our credit facilities or prevent losses if the values of such positions decline. However, such hedging can establish other positions designed to gain from those same developments, thereby offsetting the decline in the value of such portfolio positions. Such hedging transactions may also limit the opportunity for gain if the values of the underlying portfolio positions should increase. Moreover, it may not be possible to hedge against an exchange rate or interest rate fluctuation that is so generally anticipated that we are not able to enter into a hedging transaction at an acceptable price.
The success of any hedging transactions will depend on our ability to correctly predict movements in currencies and interest rates. Therefore, while we may enter into such transactions to seek to reduce currency exchange rate and interest rate risks, unanticipated changes in currency exchange rate or interest rates may result in poorer overall investment performance than if we had not engaged in any such hedging transactions. In addition, the degree of correlation between price movements of the instruments used in a hedging strategy and price movements in the portfolio positions being hedged may vary. Moreover, for a variety of reasons, we may not seek to (or be able to) establish a perfect correlation between such hedging instruments and the portfolio holdings or credit facilities being hedged. Any such imperfect correlation may prevent us from achieving the intended hedge and expose us to risk of loss. In addition, it may not be possible to hedge fully or perfectly against currency fluctuations affecting the value of securities denominated in non-U.S. currencies because the value of those securities is likely to fluctuate as a result of factors not related to currency fluctuations.
We are a non-diversified investment company within the meaning of the Investment Company Act, and therefore have few restrictions with respect to the proportion of our assets that may be invested in securities of a single industry or issuer.
We are classified as a non-diversified investment company within the meaning of the Investment Company Act, which means that we are not limited by the Investment Company Act with respect to the proportion of our assets that we may invest in securities of a single industry or issuer, excluding limitations on investments in other investment companies. We cannot predict the industries or sectors in which our investment strategy may cause us to concentrate and cannot predict the level of our diversification among industries or issuers. To the extent that we assume large positions in a certain type of security or the securities of a small number of industries or issuers, our net asset value may fluctuate to a greater extent than that of a diversified investment company as a result of changes in the financial condition or the market’s assessment of the security, industry or issuer. We may also be more susceptible to any single economic or regulatory occurrence than a diversified investment company. Beyond RIC diversification requirements, we do not have fixed guidelines for diversification, and our investments could be concentrated in relatively few industries or issuers.
Our portfolio may be concentrated in a limited number of portfolio companies and industries, which will subject us to a risk of significant loss if any of these companies defaults on its obligations under any of its debt instruments or if there is a downturn in a particular industry.
Our portfolio may be concentrated in a limited number of portfolio companies and industries. As a result, the aggregate returns we realize may be significantly and adversely affected if a small number of investments perform poorly or if we need to write down the value of any one investment. Additionally, while we are not targeting any specific industries, our investments may be concentrated in relatively few industries. As a result, a downturn in any particular industry in which we are invested could also significantly impact the aggregate returns we realize.
39
We may allocate the net proceeds from an offering in ways with which you may not agree.
We have significant flexibility in investing the net proceeds of an offering, and may do so in a way with which you may not agree. Additionally, our Adviser will select our investments subsequent to the closing of an offering, and our stockholders will have no input with respect to such investment decisions. Further, other than general limitations that may be included in a future credit facility, the holders of our debt securities will generally not have veto power or a vote in approving any changes to our investment or operational policies. These factors increase the uncertainty, and thus the risk, of investing in our securities. In addition, pending such investments, we will invest the net proceeds from an offering primarily in high quality, short-term debt securities, consistent with our Business Development Company election and our election to be taxed as a RIC, at yields significantly below the returns which we expect to achieve when our portfolio is fully invested in securities meeting our investment objective. If we are not able to identify or gain access to suitable investments, our income may be limited.
Risks Relating to Our Common Stock
Shares of closed-end investment companies, including Business Development Companies, may trade at a discount to their net asset value.
Shares of closed-end investment companies, including Business Development Companies, may trade at a discount from net asset value. This characteristic of closed-end investment companies and Business Development Companies is separate and distinct from the risk that our net asset value per share may decline. During the last two years, shares of our common stock have regularly traded below our net asset value. We cannot predict whether our common stock will trade at, above or below net asset value.
Investing in our common stock may involve an above average degree of risk.
The investments we make in accordance with our investment objective may result in a higher amount of risk than alternative investment options and a higher risk of volatility or loss of principal. Our investments in portfolio companies involve higher levels of risk, and therefore, an investment in our shares may not be suitable for someone with lower risk tolerance.
The market price of our common stock may fluctuate significantly.
The market price and liquidity of the market for shares of our common stock may be significantly affected by numerous factors, some of which are beyond our control and may not be directly related to our operating performance. These factors include:
• | significant volatility in the market price and trading volume of securities of Business Development Companies or other companies in our sector, which are not necessarily related to the operating performance of these companies; |
• | inability to obtain any exemptive relief that may be required by us from the SEC; |
• | changes in regulatory policies, accounting pronouncements or tax guidelines, particularly with respect to RICs and Business Development Companies; |
• | loss of our Business Development Company or RIC status; |
• | changes in earnings or variations in operating results; |
• | increases in expenses associated with defense of litigation and responding to SEC inquiries; |
• | changes in the value of our portfolio of investments; |
• | any shortfall in revenue or net income or any increase in losses from levels expected by investors or securities analysts; |
• | departure of our Adviser’s key personnel; and |
• | general economic trends and other external factors. |
Sales of substantial amounts of our common stock in the public market may have an adverse effect on the market price of our common stock.
Sales of substantial amounts of our common stock, including by large stockholders, or the availability of such common stock for sale, could adversely affect the prevailing market prices for our common stock. If this occurs and continues for a sustained period of time, it could impair our ability to raise additional capital through the sale of securities should we desire to do so.
40
Certain provisions of our restated certificate of incorporation and third amended and restated bylaws as well as the Delaware General Corporation Law could deter takeover attempts and have an adverse impact on the price of our common stock.
Our restated certificate of incorporation and our third amended and restated bylaws as well as the Delaware General Corporation Law contain provisions that may have the effect of discouraging a third party from making an acquisition proposal for us. These anti-takeover provisions may inhibit a change in control in circumstances that could give the holders of our common stock the opportunity to realize a premium over the market price for our common stock.
Stockholders may incur dilution if we issue securities to subscribe to, convert to or purchase shares of our common stock.
The Investment Company Act prohibits us from selling shares of our common stock at a price below the current net asset value per share of such stock with certain exceptions. One such exception is prior stockholder approval of issuances of securities to subscribe to, convert to or purchase shares of our common stock even if the subscription, conversion or purchase price per share of our common stock is below the net asset value per share of our common stock at the time of any such subscription, conversion or purchase. At our 2011 annual meeting of stockholders, our stockholders approved a proposal to authorize us to issue securities to subscribe to, convert to, or purchase shares of our common stock in one or more offerings, including under such circumstance. Such authorization has no expiration. Any decision to sell securities to subscribe to, convert to, or purchase shares of our common stock will be subject to the determination by our Board of Directors that such issuance is in our and our stockholders’ best interests. If we issue securities to subscribe to, convert to or purchase shares of common stock, the exercise or conversion of such securities would increase the number of outstanding shares of our common stock. Any such exercise or conversion would be dilutive on the voting power of existing stockholders, and could be dilutive with regard to distributions and our net asset value, and other economic aspects of the common stock.
Because the number of shares of common stock that could be so issued and the timing of any issuance is not currently known, the actual dilutive effect cannot be predicted; however, the table below illustrates the impact on the net asset value per common share of a Business Development Company that would be experienced upon the exercise of a subscription right to acquire shares of common stock of the Business Development Company.
Example of Impact of Exercise of Subscription Right to Acquire Common Stock on Net Asset Value Per Share
The example assumes that the Business Development Company has 1,000,000 shares of common stock outstanding, $15,000,000 in total assets and $5,000,000 in total liabilities at the time of the exercise of the subscription right. As a result, the net asset value and net asset value per common share of the Business Development Company are $10,000,000 and $10.00, respectively.
Further, the example assumes that the subscription right permits the holder thereof to acquire 250,000 common shares under the following three different scenarios: (i) with an exercise price equal to a 10% premium to the Business Development Company’s net asset value per share at the time of exercise, or $11.00 per share, (ii) with an exercise price equal to the Business Development Company’s net asset value per share at the time of exercise, or $10.00 per share, and (iii) with an exercise price equal to a 10% discount to the Business Development Company’s net asset value per share at the time of exercise, or $9.00 per share.
Subscription Rights Exercise Price | Net Asset Value Per Share Prior To Exercise | Net Asset Value Per Share After Exercise | ||||||
10% premium to net asset value per common share | $ | 10.00 | $ | 10.20 | ||||
Net asset value per common share | $ | 10.00 | $ | 10.00 | ||||
10% discount to net asset value per common share | $ | 10.00 | $ | 9.80 | ||||
Although have we chosen to demonstrate the impact on the net asset value per common share of a Business Development Company that would be experienced by existing stockholders of the Business Development Company upon the exercise of a subscription right to acquire shares of common stock of the Business Development Company, the results noted above would be similar in connection with the exercise or conversion of other securities exercisable or convertible into shares of the Business Development Company’s common stock. In addition, the example does not take into account the impact of other securities that may be issued in connection with the issuance of exercisable or convertible securities (e.g., the issuance of shares of common stock in conjunction with the issuance of subscription rights to acquire shares of common stock).
41
Risks Related to Our Notes
The Notes are unsecured and therefore are effectively subordinated to any secured indebtedness we have currently incurred or may incur in the future.
Our 2028 Notes, 2024 Notes, and 2019 Notes, or, collectively, the Notes, are not secured by any of our assets or any of the assets of our subsidiaries. As a result, the Notes are effectively subordinated to any secured indebtedness we or our subsidiaries have currently incurred and may incur in the future (or any indebtedness that is initially unsecured to which we subsequently grant security) to the extent of the value of the assets securing such indebtedness. In any liquidation, dissolution, bankruptcy or other similar proceeding, the holders of any of our existing or future secured indebtedness and the secured indebtedness of our subsidiaries may assert rights against the assets pledged to secure that indebtedness in order to receive full payment of their indebtedness before the assets may be used to pay other creditors, including the holders of the Notes. As of September 30, 2018, we had $241.0 million of outstanding borrowings under our ING Facility.
The Notes are structurally subordinated to the indebtedness and other liabilities of our subsidiaries.
The Notes are obligations exclusively of Oaktree Specialty Lending Corporation and not of any of our subsidiaries. None of our subsidiaries is a guarantor of the Notes and the Notes are not required to be guaranteed by any subsidiaries we may acquire or create in the future. The assets of such subsidiaries are not directly available to satisfy the claims of our creditors, including holders of the Notes.
Except to the extent we are a creditor with recognized claims against our subsidiaries, all claims of creditors (including trade creditors) and holders of preferred stock, if any, of our subsidiaries have priority over our equity interests in such subsidiaries (and therefore the claims of our creditors, including holders of the Notes) with respect to the assets of such subsidiaries. Even if we are recognized as a creditor of one or more of our subsidiaries, our claims are effectively subordinated to any security interests in the assets of any such subsidiary and to any indebtedness or other liabilities of any such subsidiary senior to our claims. Consequently, the Notes are structurally subordinated to all indebtedness and other liabilities (including trade payables) of any of our subsidiaries and any subsidiaries that we may in the future acquire or establish as financing vehicles or otherwise.
In addition, our subsidiaries may incur substantial additional indebtedness in the future, all of which would be structurally senior to the Notes.
The indentures under which the Notes are issued contains limited protection for holders of the Notes.
The indentures under which the Notes are issued offers limited protection to holders of the Notes. The terms of the indentures and the Notes do not restrict our or any of our subsidiaries’ ability to engage in, or otherwise be a party to, a variety of corporate transactions, circumstances or events that could have a material adverse impact on investments in the Notes. In particular, the terms of the indenture and the Notes do not place any restrictions on our or our subsidiaries’ ability to:
• | issue securities or otherwise incur additional indebtedness or other obligations, including (1) any indebtedness or other obligations that would be equal in right of payment to the Notes, (2) any indebtedness or other obligations that would be secured and therefore rank effectively senior in right of payment to the Notes to the extent of the values of the assets securing such debt, (3) indebtedness of ours that is guaranteed by one or more of our subsidiaries and which therefore is structurally senior to the Notes and (4) securities, indebtedness or obligations issued or incurred by our subsidiaries that would be senior to our equity interests in our subsidiaries and therefore rank structurally senior to the Notes with respect to the assets of our subsidiaries, in each case other than an incurrence of indebtedness or other obligation that would cause a violation of Section 18(a)(1)(A) of the Investment Company Act as modified by Section 61(a)(1) of the Investment Company Act or any successor provisions, whether or not we continue to be subject to such provisions of the Investment Company Act, but giving effect, in either case, to any exemptive relief granted to us by the SEC (currently, these provisions generally prohibit us from making additional borrowings, including through the issuance of additional debt or the sale of additional debt securities, unless our asset coverage, as defined in the Investment Company Act, equals at least 200% after such borrowings); |
• | pay dividends on, or purchase or redeem or make any payments in respect of, capital stock or other securities ranking junior in right of payment to the Notes, including subordinated indebtedness, in each case, while the Notes remain outstanding, other than dividends, purchases, redemptions or payments that would cause a violation of Section 18(a)(1)(B) of the Investment Company Act as modified by Section 61(a)(1) of the Investment Company Act, or any successor provisions giving effect to any exemptive relief granted to us by the SEC (currently these provisions generally prohibit us from declaring any cash dividend or distribution upon any class of our capital stock, or purchasing any such capital stock if our asset coverage, as defined in the Investment Company Act, is below 200% at the time of the declaration of the dividend or distribution or the purchase and after deducting the amount of such dividend, distribution or purchase); |
• | sell assets (other than certain limited restrictions on our ability to consolidate, merge or sell all or substantially all of our assets); |
42
• | enter into transactions with affiliates; |
• | create liens (including liens on the shares of our subsidiaries) or enter into sale and leaseback transactions; |
• | make investments; or |
• | create restrictions on the payment of dividends or other amounts to us from our subsidiaries and maintain our ability to be subject to tax as a RIC. |
Furthermore, the terms of the indenture and the Notes do not protect holders of the Notes in the event that we experience changes (including significant adverse changes) in our financial condition, results of operations or credit ratings, as they do not require that we or our subsidiaries adhere to any financial tests or ratios or specified levels of net worth, revenues, income, cash flow or liquidity.
Our ability to recapitalize, incur additional debt and take a number of other actions that are not limited by the terms of the Notes may have important consequences for holders of the Notes, including making it more difficult for us to satisfy our obligations with respect to the Notes or negatively affecting the trading value of the Notes.
Certain of our current debt instruments include more protections for their holders than the indenture and the Notes. In addition, other debt we issue or incur in the future could contain more protections for its holders than the indenture and the Notes, including additional covenants and events of default. The issuance or incurrence of any such debt with incremental protections could affect the market for and trading levels and prices of the Notes.
An active trading market for the Notes may not exist, which could limit your ability to sell the Notes or affect the market price of the Notes.
We cannot provide any assurances that an active trading market for the Notes will exist in the future or that holders will be able to sell their Notes. Even if an active trading market does exist, the Notes may trade at a discount from their initial offering price depending on prevailing interest rates, the market for similar securities, our credit ratings, if any, general economic conditions, our financial condition, performance and prospects and other factors. To the extent an active trading market does not exist, the liquidity and trading price for the Notes may be harmed. Accordingly, holder of the Notes may be required to bear the financial risk of an investment in the Notes for an indefinite period of time.
If we default on our obligations to pay our other indebtedness, we may not be able to make payments on the Notes.
Any default under the agreements governing our indebtedness, including the ING Facility and our Notes or other indebtedness to which we may be a party that is not waived by the required lenders or holders, and the remedies sought by the holders of such indebtedness could make us unable to pay principal, premium, if any, and interest on the Notes and substantially decrease the market value of the Notes. If we are unable to generate sufficient cash flow and are otherwise unable to obtain funds necessary to meet required payments of principal, premium, if any, and interest on our indebtedness, or if we otherwise fail to comply with the various covenants, including financial and operating covenants, in the instruments governing our indebtedness, we could be in default under the terms of the agreements governing such indebtedness. In the event of such default, the holders of such indebtedness could elect to declare all the funds borrowed thereunder to be due and payable, together with accrued and unpaid interest, the lenders under the ING Facility or other debt we may incur in the future could elect to terminate their commitments, cease making further loans and institute foreclosure proceedings against our assets, and we could be forced into bankruptcy or liquidation. If our operating performance declines, we may in the future need to seek to obtain waivers from the required lenders under the ING Facility or the required holders of our Notes or other debt that we may incur in the future to avoid being in default. If we breach our covenants under the ING Facility, our Notes or other debt and seek a waiver, we may not be able to obtain a waiver from the required lenders or holders. If this occurs, we would be in default and our lenders or debt holders could exercise their rights as described above, and we could be forced into bankruptcy or liquidation. If we are unable to repay debt, lenders having secured obligations, including the lenders under the ING Facility, could proceed against the collateral securing the debt. Because the ING Facility and our Notes have, and any future credit facilities will likely have, customary cross-default provisions, if the indebtedness thereunder or under any future credit facility is accelerated, we may be unable to repay or finance the amounts due. In the event holders of any debt securities we have outstanding exercise their rights to accelerate following a cross-default, those holders would be entitled to receive the principal amount of their investment, subject to any subordination arrangements that may be in place. We cannot assure you that we will have sufficient liquidity to be able to repay such amounts, in which case we would be in default under the accelerated debt and holders would have the ability to sue us to recover amounts then owing.
Item 1B. Unresolved Staff Comments
None.
43
Item 2. Properties
We do not own any real estate or other physical properties material to our operations. Our administrative and principal executive offices are located at 333 South Grand Avenue, 28th Floor, Los Angeles, CA 90071. We believe that our office facilities are suitable and adequate for our business as it is presently conducted.
Item 3. Legal Proceedings
Although we may, from time to time, be involved in litigation arising out of our operations in the normal course of business or otherwise, we are currently not a party to any pending material legal proceedings except as described below.
SEC Examination and Investigation
On March 23, 2016, the Division of Enforcement of the SEC sent document subpoenas and document preservation notices to us, FSAM, FSCO GP LLC - General Partner of Fifth Street Opportunities Fund, L.P., or FSOF, and OCSI. The subpoenas sought production of documents relating to a variety of issues principally related to the activities of our Former Adviser, including those raised in an ordinary-course examination of the Former Adviser by the SEC’s Office of Compliance Inspections and Examinations that began in October 2015, and in the previously disclosed securities class actions and other previously disclosed litigation. The subpoenas were issued pursuant to a formal order of private investigation captioned In the Matter of the Fifth Street Group of Companies, No. HO-12925, dated March 23, 2016, which addresses (among other things) (i) the valuation of our portfolio companies and investments, (ii) the expenses allocated or charged to us and OCSI, (iii) FSOF’s trading in the securities of publicly traded Business Development Companies, (iv) statements to our Board of Directors, other representatives of pooled investment vehicles, investors, or prospective investors concerning the fair value of our portfolio companies or investments as well as expenses allocated or charged to us and OCSI, (v) various issues relating to adoption and implementation of policies and procedures under the Advisers Act, (vi) statements and/or potential omissions in the entities’ SEC filings, (vii) the entities’ books, records, and accounts and whether they fairly and accurately reflected the entities’ transactions and dispositions of assets, and (viii) several other issues relating to corporate books and records. The formal order cites various provisions of the Securities Act of 1933, as amended, the Exchange Act and the Advisers Act, as well as rules promulgated under those Acts, as the bases of the investigation. We are cooperating with the Division of Enforcement investigation, have produced requested documents, and believe our obligations with respect to the matter are concluded. Oaktree is not subject to these subpoenas.
Item 4. Mine Safety Disclosures
Not applicable.
PART II
Item 5. Market for Registrant’s Common Equity, Related Stockholder Matters and Issuer Purchases of Equity Securities
Common Stock
Our common stock currently trades on the Nasdaq Global Select Market under the symbol “OCSL.” Through October 17, 2017, our common stock traded under the symbol “FSC.” The last reported price for our common stock on November 27, 2018 was $4.53 per share. As of November 27, 2018, we had 62 stockholders of record, which did not include stockholders for whom shares are held in nominee or “street” name.
Sales of Unregistered Securities
We did not engage in any sales of unregistered securities during the fiscal year ended September 30, 2018.
Stock Performance Graph
The following graph compares the cumulative 5-year total return provided to shareholders on Oaktree Specialty Lending Corporation’s common stock relative to the cumulative total returns of the NYSE Composite index, the Standard & Poor’s 500 Index, the Nasdaq Financial Index, the Russell 2000 Financial Services Index and a customized peer group of five companies that includes: Apollo Investment Corporation, Ares Capital Corporation, Blackrock Capital Investment Corporation, Gladstone Capital Corporation and MVC Capital, Inc. An investment of $100 (with reinvestment of all dividends) is assumed to have been made in our common stock, in each index and in the peer group on September 30, 2013 and its relative performance is tracked through September 30, 2018. The stock performance graph shows returns during management by the Former Adviser for the periods from September 30, 2013 through October 16, 2017 and during management by Oaktree for the period from October 17, 2017 through September 30, 2018.
For the fiscal year ended September 30, 2017, we included a comparison to a customized peer group of Business Development Companies, which had a total return of $45.57 for the period from October 1, 2013 to September 30, 2018. For the fiscal year ending September 30, 2018, we have switched to a comparison to the Russell 2000 Financial Services Index and the Standard & Poor’s 500 Stock Index in the below chart to be consistent with current market practice.
45
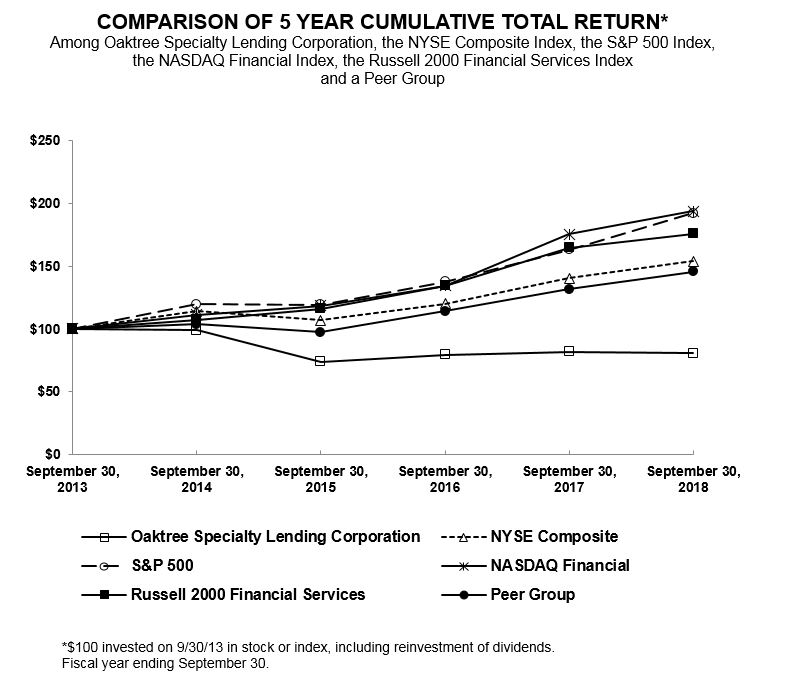
September 30, 2013 | September 30, 2014 | September 30, 2015 | September 30, 2016 | September 30, 2017 | September 30, 2018 | ||||||||
Oaktree Specialty Lending Corporation | 100.00 | 98.99 | 73.90 | 79.39 | 81.64 | 80.51 | |||||||
NYSE Composite | 100.00 | 113.92 | 106.88 | 120.08 | 140.19 | 153.94 | |||||||
S&P 500 | 100.00 | 119.73 | 119.00 | 137.36 | 162.92 | 192.10 | |||||||
NASDAQ Financial | 100.00 | 111.32 | 118.54 | 134.46 | 175.28 | 193.76 | |||||||
Russell 2000 Financial Services | 100.00 | 107.05 | 115.83 | 134.26 | 164.44 | 175.60 | |||||||
Peer Group | 100.00 | 103.66 | 97.28 | 114.08 | 131.45 | 145.57 | |||||||
Stock Repurchase Program
On November 30, 2015, our Board of Directors approved a $100 million common stock repurchase program through November 30, 2016. For the fiscal year ended September 30, 2016, we repurchased 7,004,139 shares at the weighted average price of $5.34 per share, resulting in $37.6 million of cash paid under the stock repurchase program.
On November 28, 2016, our Board of Directors approved a new common stock repurchase program authorizing us to repurchase up to $12.5 million in the aggregate of our outstanding common stock through November 28, 2017. Common stock repurchases under the program were made in the open market. During the year ended September 30, 2017, we repurchased 2,298,247 shares of our common stock for $12.5 million, including commissions, under the common stock repurchase plan, and the authorization was fully utilized.
46
We did not repurchase shares of our common stock during the year ended September 30, 2018.
Item 6. Selected Financial Data
The table below sets forth our selected historical financial data for the periods indicated. Our historical results are not necessarily indicative of future results. The selected financial data in this section is not intended to replace the financial statements and is qualified in its entirety by the financial statements and related notes included in this filing.
The following selected financial data should be read together with the information contained in Part II, Item 7 of this Form 10-K, “Management’s Discussion and Analysis of Financial Condition and Results of Operations,” and the audited financial statements and the notes thereto in Part II, Item 8 of this Form 10-K, "Financial Statements and Supplementary Data." The financial information as of and for the fiscal years ended September 30, 2018, 2017, 2016, 2015 and 2014 set forth below was derived from our audited financial statements and related notes which are included in "Financial Statements and Supplementary Data" in Part II, Item 8 of this Form 10-K.
47
As of and for the Years Ended | ||||||||||
(dollars in thousands, except per share amounts) | September 30, 2018 | September 30, 2017 | September 30, 2016 | September 30, 2015 | September 30, 2014 | |||||
Statement of Operations data: | ||||||||||
Total investment income | $138,722 | $177,964 | $247,872 | $265,475 | $293,954 | |||||
Base management fee | 22,652 | 31,369 | 41,483 | 51,615 | 51,735 | |||||
Part I incentive fee | 10,485 | 10,713 | 22,091 | 28,575 | 35,472 | |||||
Fees Waived | (1,342) | (240) | (338) | (546) | (687) | |||||
All other expenses | 46,881 | 64,729 | 97,338 | 70,891 | 64,860 | |||||
Insurance recoveries | — | (1,259) | (19,429) | — | — | |||||
Net investment income | 60,046 | 72,652 | 106,727 | 114,940 | 142,574 | |||||
Net unrealized appreciation (depreciation) on investments and foreign currency | 100,252 | (97,543) | (47,924) | (71,674) | (32,164) | |||||
Net unrealized (appreciation) depreciation on secured borrowings | 2,353 | (296) | (76) | 658 | (53) | |||||
Realized gain (loss) on investments, secured borrowings, foreign currency and unsecured notes payable | (115,267) | (171,782) | (125,283) | (28,529) | 2,175 | |||||
Provision for income taxes | (622) | — | — | — | — | |||||
Net increase (decrease) in net assets resulting from operations | 46,762 | (196,969) | (66,556) | 15,395 | 112,532 | |||||
Per share data: | ||||||||||
Net asset value per common share at period end | $6.09 | $6.16 | $7.97 | $9.00 | $9.64 | |||||
Market price at period end | 4.96 | 5.47 | 5.81 | 6.17 | 9.18 | |||||
Net investment income | 0.43 | 0.51 | 0.72 | 0.75 | 1.00 | |||||
Net realized and unrealized loss on investments, secured borrowings, foreign currency and unsecured notes payable | (0.10) | (1.90) | (1.17) | (0.65) | (0.21) | |||||
Net increase (decrease) in net assets resulting from operations | 0.33 | (1.39) | (0.45) | 0.10 | 0.79 | |||||
Distributions per common share | 0.40 | 0.465 | 0.72 | 0.79 | 1.00 | |||||
Balance Sheet data at period end: | ||||||||||
Total investments at fair value | $1,491,201 | $1,541,755 | $2,165,491 | $2,402,495 | $2,495,914 | |||||
Cash, cash equivalents and restricted cash | 13,489 | 59,913 | 130,362 | 143,484 | 109,046 | |||||
Other assets | 46,768 | 14,380 | 47,432 | 39,678 | 63,258 | |||||
Total assets | 1,551,458 | 1,616,048 | 2,343,285 | 2,585,657 | 2,668,218 | |||||
Total liabilities | 693,423 | 748,391 | 1,200,997 | 1,232,563 | 1,189,743 | |||||
Total net assets | 858,035 | 867,657 | 1,142,288 | 1,353,094 | 1,478,475 | |||||
Other data: | ||||||||||
Weighted average yield on debt investments (1) | 8.4% | 9.6% | 10.4% | 10.8% | 11.1% | |||||
Number of portfolio companies at period end | 113 | 125 | 129 | 135 | 124 | |||||
(1) | Weighted average yield is calculated based upon our debt investments at fair value, including the return on the subordinated note investment in SLF JV I, at the end of the period. |
48
Item 7. Management's Discussion and Analysis of Financial Condition and Results of Operations
The following discussion should be read in connection with our Consolidated Financial Statements and the notes thereto included elsewhere in this annual report on Form 10-K.
Some of the statements in this annual report on Form 10-K constitute forward-looking statements because they relate to future events or our future performance or financial condition. The forward-looking statements contained in this annual report on Form 10-K may include statements as to:
• | our future operating results and distribution projections; |
• | the ability of our Adviser to find lower-risk investments to reposition our portfolio and to implement our Adviser's future plans with respect to our business; |
• | our business prospects and the prospects of our portfolio companies; |
• | the impact of the investments that we expect to make; |
• | the ability of our portfolio companies to achieve their objectives; |
• | our expected financings and investments and additional leverage we may seek to incur in the future; |
• | the adequacy of our cash resources and working capital; |
• | the timing of cash flows, if any, from the operations of our portfolio companies; and |
• | the cost or potential outcome of any litigation to which we may be a party. |
In addition, words such as “anticipate,” “believe,” “expect,” “seek,” “plan,” “should,” “estimate,” “project” and “intend” indicate forward-looking statements, although not all forward-looking statements include these words. The forward-looking statements contained in this annual report on Form 10-K involve risks and uncertainties. Our actual results could differ materially from those implied or expressed in the forward-looking statements for any reason, including the factors set forth in “Item 1A. Risk Factors” and elsewhere in this annual report on Form 10-K.
Other factors that could cause actual results to differ materially include:
• | changes in the economy, financial markets and political environment; |
• | risks associated with possible disruption in our operations or the economy generally due to terrorism or natural disasters; |
• | future changes in laws or regulations (including the interpretation of these laws and regulations by regulatory authorities) and conditions in our operating areas, particularly with respect to Business Development Companies or RICs; and |
• | other considerations that may be disclosed from time to time in our publicly disseminated documents and filings. |
We have based the forward-looking statements included in this annual report on Form 10-K on information available to us on the date of this annual report, and we assume no obligation to update any such forward-looking statements. Although we undertake no obligation to revise or update any forward-looking statements, whether as a result of new information, future events or otherwise, you are advised to consult any additional disclosures that we may make directly to you or through reports that we in the future may file with the SEC, including annual reports on Form 10-K, quarterly reports on Form 10-Q and current reports on Form 8-K.
All dollar amounts in tables are in thousands, except share and per share amounts, percentages and as otherwise indicated.
Business Overview
We are a specialty finance company that looks to provide customized, one-stop credit solutions to companies with limited access to public or syndicated capital markets. We are a closed-end, externally managed, non-diversified management investment company that has elected to be regulated as a Business Development Company under the Investment Company Act. In addition, we have qualified and elected to be treated as a RIC under the Code for tax purposes.
As of October 17, 2017, we are externally managed by Oaktree, a subsidiary of OCG, pursuant to the Investment Advisory Agreement. Oaktree Administrator, a subsidiary of Oaktree, also provides certain administrative and other services necessary for us to operate pursuant to the Administration Agreement.
We seek to generate current income and capital appreciation by providing companies with flexible and innovative financing solutions, including first and second lien loans, unsecured and mezzanine loans and preferred equity. We may also seek to generate capital appreciation and income through secondary investments at discounts to par in either private or syndicated transactions. We invest in companies that typically possess business models we expect to be resilient in the future with underlying fundamentals that will provide strength in future downturns. We intend to deploy capital across credit and economic cycles with a focus on long-term results, which we believe will enable us to build lasting partnerships with financial sponsors and management teams, and we may seek to opportunistically take advantage of dislocations in the financial markets and other situations that may benefit from our Adviser’s credit and structuring
49
expertise. Sponsors may include financial sponsors, such as an institutional investor or a private equity firm, or a strategic entity seeking to invest in a portfolio company.
Oaktree intends to continue to reposition our portfolio into investments that are better aligned with Oaktree's overall approach to credit investing and that it believes have the potential to generate attractive returns across market cycles. Oaktree is generally focused on middle-market companies, which we define as companies with enterprise values of between $100 million and $750 million. Going forward, we expect our portfolio to include a mix of approximately 40% to 60% of first lien loans and 35% to 55% of second lien loans, including asset backed loans, unitranche loans, mezzanine loans, approximately 5% to 15% of unsecured loans and 0% to 10% of preferred equity and certain equity co-investments. Our portfolio may also include certain structured finance and other non-traditional structures. We generally invest in securities that are rated below investment grade by rating agencies or that would be rated below investment grade if they were rated. Below investment grade securities, which are often referred to as “high yield” and “junk,” have predominantly speculative characteristics with respect to the issuer’s capacity to pay interest and repay principal.
Since becoming our investment adviser, Oaktree has performed a comprehensive review of our portfolio and categorized our portfolio into core investments, non-core performing investments and underperforming investments. Certain additional information on such categorization and our portfolio composition is included in investor presentations that we file with the SEC.
Since becoming our investment adviser, Oaktree has reduced the investments it has identified as non-core by over $500 million, at fair value. Over time, Oaktree intends to rotate us out of the approximately $324 million of non-core investments at fair value that remain as of September 30, 2018.
Business Environment and Developments
We believe that the shift of commercial banks away from lending to middle-market companies following the 2008 financial crisis, including as a result of the passage of the Dodd-Frank Wall Street Reform and Consumer Protection Act, and the adoption of the Basel III Accord continues to create opportunities for non-bank lenders such as us. We believe middle-market companies represent a significant opportunity for direct lending as there are nearly 200,000 middle-market businesses, representing one-third of private sector gross domestic product and accounting for approximately 48 million jobs according to the National Center for the Middle Market. In addition, according to the S&P Global Market Intelligence LCD Middle Market Review, during the first nine months of the 2018 calendar year, middle-market lending volume exceeded $20 billion for deal sizes of less than $350 million.
We believe that quantitative easing and other similar monetary policies implemented by central banks worldwide in reaction to the 2008 financial crisis have created significant inflows of capital, including from private equity sponsors, focused on yield-driven products such as sub-investment grade debt. While we believe that private equity sponsors continue to have a large pool of available capital and will continue to pursue acquisitions in the middle market, increased competition from other lenders to middle-market companies together with increased capital focused on the sector have led to spread compression across the middle market, resulting in spreads near historically low levels.
We believe that the fundamentals of middle-market companies remain strong. In this environment, we believe attractive risk-adjusted returns can be achieved by investing in companies that cannot efficiently access traditional debt capital markets. We believe that the Company has the resources and experience to source, diligence and structure investments in these companies and is well placed to generate attractive returns for investors.
Investment Advisory Agreement with Oaktree
Upon the closing of the Transaction contemplated by the Purchase Agreement on October 17, 2017, Oaktree became the investment adviser to each of OCSI and us. The closing of the Transaction resulted in an assignment for purposes of the Investment Company Act of the Former Investment Advisory Agreement, and, as a result, its immediate termination. See “Note 11. Related Party Transactions– Investment Advisory Agreement” and “– Administrative Services” in the notes to the accompanying Consolidated Financial Statements.
Critical Accounting Policies
Basis of Presentation
Our Consolidated Financial Statements have been prepared in accordance with accounting principles generally accepted in the United States of America, or GAAP, and pursuant to the requirements for reporting on Form 10-K and Regulation S-X. All intercompany balances and transactions have been eliminated. We are an investment company following the accounting and reporting guidance in Financial Accounting Standards Board, or FASB, Accounting Standards Codification, or ASC, Topic 946, Financial Services-Investment Companies, or ASC 946.
50
Investment Valuation
We value our investments in accordance with FASB ASC Topic 820, Fair Value Measurements and Disclosures, or ASC 820, which defines fair value as the amount that would be received to sell an asset or paid to transfer a liability in an orderly transaction between market participants at the measurement date. We report our investments for which current market values are not readily available at fair value. A liability’s fair value is defined as the amount that would be paid to transfer the liability to a new obligor, not the amount that would be paid to settle the liability with the creditor. ASC 820 prioritizes the use of observable market prices derived from such prices over entity-specific inputs. Where observable prices or inputs are not available or reliable, valuation techniques are applied. These valuation techniques involve some level of management estimation and judgment, the degree of which is dependent on the price transparency for the investments or market and the investments’ complexity.
Hierarchical levels, defined by ASC 820 and directly related to the amount of subjectivity associated with the inputs to fair valuation of these assets and liabilities, are as follows:
• | Level 1 — Unadjusted, quoted prices in active markets for identical assets or liabilities as of the measurement date. |
• | Level 2 — Observable inputs other than Level 1 prices, such as quoted prices for similar assets or liabilities; quoted prices in markets that are not active; or other inputs that are observable or can be corroborated by observable market data at the measurement date for substantially the full term of the assets or liabilities. |
• | Level 3 — Unobservable inputs that reflect management’s best estimate of what market participants would use in pricing the asset or liability at the measurement date. Consideration is given to the risk inherent in the valuation technique and the risk inherent in the inputs to the model. |
If inputs used to measure fair value fall into different levels of the fair value hierarchy, an investment's level is based on the lowest level of input that is significant to the fair value measurement. Our assessment of the significance of a particular input to the fair value measurement in its entirety requires judgment, and considers factors specific to the investment. This includes investment securities that are valued using "bid" and "ask" prices obtained from independent third party pricing services or directly from brokers. These investments may be classified as Level 3 because the quoted prices may be indicative in nature for securities that are in an inactive market, may be for similar securities or may require adjustments for investment-specific factors or restrictions.
Financial instruments with readily available quoted prices generally will have a higher degree of market price observability and a lesser degree of judgment inherent in measuring fair value. As such, Oaktree obtains and analyzes readily available market quotations provided by pricing vendors and brokers for all of our investments for which quotations are available. In determining the fair value of a particular investment, pricing vendors and brokers use observable market information, including both binding and non-binding indicative quotations.
We seek to obtain at least two quotations for the subject or similar securities, typically from pricing vendors. If we are unable to obtain two quotes from pricing vendors, or if the prices obtained from pricing vendors are not within our set threshold, we seek to obtain a quote directly from a broker making a market for the asset. Oaktree evaluates the quotations provided by pricing vendors and brokers based on available market information, including trading activity of the subject or similar securities, or by performing a comparable security analysis to ensure that fair values are reasonably estimated. Oaktree also performs back-testing of valuation information obtained from pricing vendors and brokers against actual prices received in transactions. In addition to ongoing monitoring and back-testing, Oaktree performs due diligence procedures over pricing vendors to understand their methodology and controls to support their use in the valuation process. Generally, we do not adjust any of the prices received from these sources.
If the quotations obtained from pricing vendors or brokers are determined to not be reliable or are not readily available, we value such investments using any of three different valuation techniques. The first valuation technique is the transaction precedent technique, which utilizes recent or expected future transactions of the investment to determine fair value, to the extent applicable. The second valuation technique is an analysis of the enterprise value, or EV, of the portfolio company. EV means the entire value of the portfolio company to a market participant, including the sum of the values of debt and equity securities used to capitalize the enterprise at a point in time. The EV analysis is typically performed to determine (i) the value of equity investments, (ii) whether there is credit impairment for debt investments and (iii) the value for debt investments that we are deemed to control under the Investment Company Act. To estimate the EV of a portfolio company, Oaktree analyzes various factors, including the portfolio company’s historical and projected financial results, macroeconomic impacts on the company, and competitive dynamics in the company’s industry. Oaktree also utilizes some or all of the following information based on the individual circumstances of the portfolio company: (i) valuations of comparable public companies, (ii) recent sales of private and public comparable companies in similar industries or having similar business or earnings characteristics, (iii) purchase price multiples as a multiple of their earnings or cash flow, (iv) the portfolio company’s ability to meet its forecasts and its business prospects, (v) a discounted cash flow analysis, (vi) estimated liquidation or collateral value of the portfolio company’s assets and (vii) offers from third parties to buy the portfolio company. We may probability weight potential sale outcomes with respect to a portfolio company when uncertainty exists as of the valuation date. The third valuation technique is a market yield technique, which is typically performed for non-credit impaired debt investments. In the market yield technique, a current price is imputed for the investment based upon an assessment of the expected market yield for a similarly structured investment with a similar level of risk, and we consider the
51
current contractual interest rate, the capital structure and other terms of the investment relative to risk of the company and the specific investment. A key determinant of risk, among other things, is the leverage through the investment relative to the EV of the portfolio company. As debt investments held by us are substantially illiquid with no active transaction market, we depend on primary market data, including newly funded transactions and industry-specific market movements, as well as secondary market data with respect to high yield debt instruments and syndicated loans, as inputs in determining the appropriate market yield, as applicable.
In accordance with ASC 820-10, certain investments that qualify as investment companies in accordance with ASC 946 may be valued using net asset value as a practical expedient for fair value. Consistent with FASB guidance under ASC 820, these investments are excluded from the hierarchical levels.
We estimate the fair value of privately held warrants using a Black Scholes pricing model, which includes an analysis of various factors and subjective assumptions, including the current stock price (by using an EV analysis as described above), the expected period until exercise, expected volatility of the underlying stock price, expected dividends and the risk-free rate. Changes in the subjective input assumptions can materially affect the fair value estimates.
Our Board of Directors undertakes a multi-step valuation process each quarter in connection with determining the fair value of our investments:
• | The quarterly valuation process begins with each portfolio company or investment being initially valued by Oaktree’s valuation team in conjunction with Oaktree’s portfolio management team and investment professionals responsible for each portfolio investment; |
•Preliminary valuations are then reviewed and discussed with management of Oaktree;
• | Separately, independent valuation firms engaged by our Board of Directors prepare valuations of our investments, on a selected basis, for which market quotations are not readily available or are readily available but deemed not reflective of the fair value of the investment, and submit the reports to us and provide such reports to Oaktree and the Audit Committee of our Board of Directors; |
• | Oaktree compares and contrasts its preliminary valuations to the valuations of the independent valuation firms and prepares a valuation report for the Audit Committee; |
• | The Audit Committee reviews the preliminary valuations with Oaktree, and Oaktree responds and supplements the preliminary valuations to reflect any discussions between Oaktree and the Audit Committee; |
• | The Audit Committee makes a recommendation to our full Board of Directors regarding the fair value of the investments in our portfolio; and |
• | Our Board of Directors discusses valuations and determines the fair value of each investment in our portfolio. |
The fair value of our investments as of September 30, 2018 and September 30, 2017 was determined in good faith by our Board of Directors. Our Board of Directors has and will continue to engage independent valuation firms to provide assistance regarding the determination of the fair value of a portion of our portfolio securities for which market quotations are not readily available or are readily available but deemed not reflective of the fair value of the investment each quarter, and the Board of Directors may reasonably rely on that assistance. As of September 30, 2018, 87.5% of our portfolio at fair value was valued either based on market quotations, the transactions precedent approach or by independent valuation firms. However, our Board of Directors is responsible for the ultimate valuation of the portfolio investments at fair value as determined in good faith pursuant to our valuation policy and a consistently applied valuation process.
As of September 30, 2018 and September 30, 2017, approximately 96.1% and 95.4%, respectively, of our total assets represented investments at fair value.
Revenue Recognition
Interest and Dividend Income
Interest income, adjusted for accretion of OID, is recorded on the accrual basis to the extent that such amounts are expected to be collected. We stop accruing interest on investments when it is determined that interest is no longer collectible. Investments that are expected to pay regularly scheduled interest in cash are generally placed on non-accrual status when there is reasonable doubt that principal or interest cash payments will be collected. Cash interest payments received on investments may be recognized as income or a return of capital depending upon management’s judgment. A non-accrual investment is restored to accrual status if past due principal and interest are paid in cash, and the portfolio company, in management’s judgment, is likely to continue timely payment of its remaining obligations. As of September 30, 2018, there were eight investments on which we had stopped accruing cash and/or PIK interest or OID income.
52
In connection with our investment in a portfolio company, we sometimes receive nominal cost equity that is valued as part of the negotiation process with the portfolio company. When we receive nominal cost equity, we allocate our cost basis in the investment between debt securities and the nominal cost equity at the time of origination. Any resulting discount from recording the loan, or otherwise purchasing a security at a discount, is accreted into interest income over the life of the loan.
We generally recognize dividend income on the ex-dividend date. Distributions received from equity investments are evaluated to determine if the distribution should be recorded as dividend income or a return of capital. Generally, we will not record distributions from such equity investments as dividend income unless there are sufficient earnings at the portfolio company prior to the distribution. Distributions that are classified as a return of capital are recorded as a reduction in the cost basis of the investment.
Fee Income
We receive a variety of fees in the ordinary course of business, including servicing, advisory, amendment, structuring and prepayment fees, which are classified as fee income and recognized as they are earned.
We have also structured exit fees across certain of our portfolio investments to be received upon the future exit of those investments. Exit fees are payable upon the exit of a debt security. These fees are to be paid to us upon the sooner to occur of (i) a sale of the borrower or substantially all of the assets of the borrower, (ii) the maturity date of the loan or (iii) the date when full prepayment of the loan occurs. The receipt of such fees is contingent upon the occurrence of one of the events listed above for each of the investments. A percentage of these fees is included in net investment income over the life of the loan.
PIK Interest
Our investments in debt securities may contain PIK interest provisions. PIK interest, which represents contractually deferred interest added to the loan balance that is generally due at the end of the loan term, is generally recorded on the accrual basis to the extent such amounts are expected to be collected. We generally cease accruing PIK interest if there is insufficient value to support the accrual or if we do not expect the portfolio company to be able to pay all principal and interest due. Our decision to cease accruing PIK interest involves subjective judgments and determinations based on available information about a particular portfolio company, including whether the portfolio company is current with respect to its payment of principal and interest on its loans and debt securities; financial statements and financial projections for the portfolio company; our assessment of the portfolio company's business development success; information obtained by us in connection with periodic formal update interviews with the portfolio company's management and, if appropriate, the private equity sponsor; and information about the general economic and market conditions in which the portfolio company operates. Based on this and other information, we determine whether to cease accruing PIK interest on a loan or debt security. Our determination to cease accruing PIK interest is generally made well before our full write-down of a loan or debt security. In addition, if it is subsequently determined that we will not be able to collect any previously accrued PIK interest, the fair value of the loans or debt securities would be reduced by the amount of such previously accrued, but uncollectible, PIK interest. The accrual of PIK interest on our debt investments increases the recorded cost bases of these investments in our Consolidated Financial Statements and, as a result, increases the cost bases of these investments for purposes of computing the capital gains incentive fee payable by us to Oaktree beginning in the fiscal year ending September 30, 2019. To maintain our status as a RIC, income from PIK interest may be required to be distributed to our stockholders even though we have not yet collected the cash and may never do so.
Portfolio Composition
Our investments principally consist of loans, purchased equity investments and equity grants in privately-held companies and SLF JV I. Our loans are typically secured by a first, second or subordinated lien on the assets of the portfolio company and generally have terms of up to ten years (but an expected average life of between three and four years). We believe the environment for direct lending remains active, and, as a result, a number of our portfolio companies were able to refinance and repay their loans during the fiscal year ended September 30, 2018.
During the year ended September 30, 2018, we originated $1.0 billion of investment commitments in 59 new and nine existing portfolio companies and funded $1.0 billion of investments.
During the year ended September 30, 2018, we received $1.1 billion of proceeds from prepayments, exits, other paydowns and sales and exited 80 portfolio companies.
53
A summary of the composition of our investment portfolio at cost and fair value as a percentage of total investments is shown in the following tables:
September 30, 2018 | September 30, 2017 | |||||
Cost: | ||||||
Senior secured debt | 74.69 | % | 74.73 | % | ||
Subordinated debt | 11.85 | 6.42 | ||||
Debt investments in SLF JV I | 8.05 | 7.32 | ||||
LLC equity interests of SLF JV I | 1.01 | 0.92 | ||||
Purchased equity | 3.70 | 6.40 | ||||
Equity grants | 0.25 | 2.78 | ||||
Limited partnership interests | 0.45 | 1.43 | ||||
Total | 100.00 | % | 100.00 | % | ||
September 30, 2018 | September 30, 2017 | |||||
Fair value: | ||||||
Senior secured debt | 75.40 | % | 78.01 | % | ||
Subordinated debt | 10.97 | 6.06 | ||||
Debt investments in SLF JV I | 8.67 | 8.35 | ||||
LLC equity interests of SLF JV I | — | 0.36 | ||||
Purchased equity | 3.99 | 5.10 | ||||
Equity grants | 0.44 | 0.45 | ||||
Limited partnership interests | 0.53 | 1.67 | ||||
Total | 100.00 | % | 100.00 | % | ||
The industry composition of our portfolio at cost and fair value as a percentage of total investments was as follows:
September 30, 2018 | September 30, 2017 (revised) | September 30, 2017 (as reported) | |||||||
Cost (1): | |||||||||
Multi-sector holdings (2) | 9.85 | % | 9.87 | % | 9.87 | % | |||
Healthcare services | 7.43 | 11.98 | 11.98 | ||||||
Data processing & outsourced services | 5.45 | 4.11 | 4.42 | ||||||
Application software | 5.34 | 13.04 | 2.93 | ||||||
Pharmaceuticals | 4.30 | 3.46 | 3.46 | ||||||
Property & casualty insurance | 4.13 | — | — | ||||||
Oil & gas equipment & services | 3.53 | 1.57 | 1.57 | ||||||
Healthcare technology | 3.19 | — | — | ||||||
Specialized finance | 3.02 | 0.18 | 0.18 | ||||||
Healthcare equipment | 2.98 | 5.67 | 5.67 | ||||||
Aerospace & defense | 2.86 | 0.19 | — | ||||||
Specialty stores | 2.73 | 3.33 | 3.33 | ||||||
Auto parts & equipment | 2.65 | 1.21 | 1.21 | ||||||
Advertising | 2.64 | 4.82 | 4.82 | ||||||
Electrical components & equipment | 2.42 | — | — | ||||||
Oil & gas exploration & production | 2.16 | — | — | ||||||
Research & consulting services | 2.15 | 2.16 | 2.16 | ||||||
Technology distributors | 2.14 | — | — | ||||||
Integrated telecommunication services | 2.10 | 1.75 | 1.75 | ||||||
Airlines | 2.03 | 3.28 | 3.28 | ||||||
Specialty chemicals | 1.98 | 1.70 | — | ||||||
Construction & engineering | 1.89 | 3.86 | 3.86 | ||||||
Industrial machinery | 1.87 | 0.86 | 0.86 | ||||||
Managed healthcare | 1.73 | — | — | ||||||
General merchandise stores | 1.43 | — | — | ||||||
Oil & gas refining & marketing | 1.40 | — | — | ||||||
Consumer electronics | 1.38 | 1.32 | 1.32 | ||||||
Food retail | 1.37 | — | 0.24 | ||||||
54
September 30, 2018 | September 30, 2017 (revised) | September 30, 2017 (as reported) | |||||||
Healthcare distributors | 1.22 | % | — | — | |||||
Movies & entertainment | 1.21 | — | — | ||||||
Personal products | 1.20 | — | — | ||||||
Diversified support services | 1.20 | 0.96 | % | 1.29 | % | ||||
Apparel, accessories & luxury goods | 1.14 | 0.29 | 0.29 | ||||||
Systems software | 0.99 | 1.47 | — | ||||||
Education services | 0.86 | 2.85 | 2.85 | ||||||
Investment banking & brokerage | 0.78 | — | — | ||||||
Biotechnology | 0.74 | — | — | ||||||
Security & alarm services | 0.69 | 0.75 | 0.75 | ||||||
Household appliances | 0.49 | — | — | ||||||
Coal & consumable fuels | 0.46 | 0.42 | — | ||||||
Trading companies & distributors | 0.43 | 0.40 | — | ||||||
Environmental & facilities services | 0.37 | 3.18 | 2.84 | ||||||
Commercial printing | 0.36 | 0.34 | 0.34 | ||||||
Internet services & infrastructure | 0.34 | 3.78 | — | ||||||
Leisure facilities | 0.34 | 1.76 | 1.76 | ||||||
Thrifts & mortgage finance | 0.33 | 0.41 | — | ||||||
Restaurants | 0.19 | 0.28 | 0.28 | ||||||
Commodity chemicals | 0.18 | — | — | ||||||
Hypermarkets & super centers | 0.13 | 0.92 | 0.68 | ||||||
Human resource & employment services | 0.10 | — | — | ||||||
IT consulting & other services | 0.05 | 0.04 | 0.23 | ||||||
Department stores | 0.04 | — | — | ||||||
Other diversified financial services | 0.01 | 0.69 | 0.69 | ||||||
Air freight & logistics | — | 1.85 | — | ||||||
Leisure products | — | — | — | ||||||
Casinos & gaming | — | 1.33 | 1.33 | ||||||
Home improvement retail | — | 1.31 | 1.31 | ||||||
Distributors | — | 0.85 | 0.85 | ||||||
Real estate services | — | 0.74 | 0.74 | ||||||
Computer & electronics retail | — | 0.67 | 0.36 | ||||||
Multi-utilities | — | 0.35 | 0.35 | ||||||
Internet software & services | — | — | 15.37 | ||||||
Air freight and logistics | — | — | 1.85 | ||||||
Housewares & specialties | — | — | 1.70 | ||||||
Precious metals & minerals | — | — | 0.42 | ||||||
Thrift & mortgage finance | — | — | 0.41 | ||||||
Trucking | — | — | 0.40 | ||||||
Total | 100.00 | % | 100.00 | % | 100.00 | % | |||
September 30, 2018 | September 30, 2017 (revised) | September 30, 2017 (as reported) | |||||||
Fair value (1): | |||||||||
Multi-sector holdings (2) | 9.57 | % | 10.67 | % | 10.67 | % | |||
Application software | 6.47 | 14.68 | 3.50 | ||||||
Data processing & outsourced services | 4.98 | 4.08 | 4.43 | ||||||
Pharmaceuticals | 4.82 | 4.07 | 4.07 | ||||||
Property & casualty insurance | 4.52 | — | — | ||||||
Healthcare services | 4.50 | 6.09 | 6.09 | ||||||
Oil & gas equipment & services | 4.01 | 1.84 | 1.84 | ||||||
Healthcare technology | 3.50 | 0.00 | — | ||||||
Specialized finance | 3.24 | 0.21 | 0.21 | ||||||
Aerospace & defense | 3.11 | 0.22 | — | ||||||
Specialty stores | 2.95 | 3.69 | 3.69 | ||||||
Auto parts & equipment | 2.89 | 1.41 | 1.41 | ||||||
Electrical components & equipment | 2.70 | — | — | ||||||
Research & consulting services | 2.44 | 2.50 | 2.50 | ||||||
Oil & gas exploration & production | 2.38 | — | — | ||||||
Technology distributors | 2.32 | — | — | ||||||
Advertising | 2.19 | 5.43 | 5.43 | ||||||
Airlines | 2.18 | 3.86 | 3.86 | ||||||
Construction & engineering | 2.14 | 3.26 | 3.26 | ||||||
Specialty chemicals | 2.06 | 1.93 | — | ||||||
Industrial machinery | 1.97 | 0.97 | 0.97 | ||||||
Integrated telecommunication services | 1.90 | 2.03 | 2.03 | ||||||
55
September 30, 2018 | September 30, 2017 (revised) | September 30, 2017 (as reported) | |||||||
Managed healthcare | 1.88 | % | — | — | |||||
Consumer electronics | 1.57 | 1.56 | % | 1.56 | % | ||||
General merchandise stores | 1.55 | — | — | ||||||
Oil & gas refining & marketing | 1.52 | — | — | ||||||
Food retail | 1.48 | — | 0.28 | ||||||
Personal products | 1.31 | — | — | ||||||
Movies & entertainment | 1.31 | — | — | ||||||
Healthcare distributors | 1.30 | — | — | ||||||
Diversified support services | 1.23 | 1.07 | 1.46 | ||||||
Systems software | 1.08 | 1.68 | — | ||||||
Apparel, accessories & luxury goods | 0.91 | 0.08 | 0.08 | ||||||
Investment banking & brokerage | 0.86 | — | — | ||||||
Leisure products | 0.81 | 0.38 | 0.38 | ||||||
Biotechnology | 0.80 | — | — | ||||||
Security & alarm services | 0.73 | 0.85 | 0.85 | ||||||
Healthcare equipment | 0.66 | 4.73 | 4.73 | ||||||
Leisure facilities | 0.55 | 2.11 | 2.11 | ||||||
Household appliances | 0.53 | — | — | ||||||
Coal & consumable fuels | 0.50 | 0.48 | — | ||||||
Trading companies & distributors | 0.47 | 0.46 | — | ||||||
Environmental & facilities services | 0.42 | 3.67 | 3.29 | ||||||
Commercial printing | 0.40 | 0.39 | 0.39 | ||||||
Internet services & infrastructure | 0.37 | 4.36 | — | ||||||
Thrifts & mortgage finance | 0.32 | 0.40 | — | ||||||
Commodity chemicals | 0.21 | — | — | ||||||
Restaurants | 0.21 | 0.32 | 0.32 | ||||||
Hypermarkets & super centers | 0.14 | 1.02 | 0.75 | ||||||
Human resource & employment services | 0.11 | — | — | ||||||
Department stores | 0.04 | — | — | ||||||
IT consulting & other services | 0.03 | 0.03 | 0.25 | ||||||
Education services | (0.14 | ) | 2.48 | 2.48 | |||||
Other diversified financial services | — | 0.76 | 0.76 | ||||||
Air freight & logistics | — | 0.12 | — | ||||||
Casinos & gaming | — | 1.52 | 1.52 | ||||||
Home improvement retail | — | 1.61 | 1.61 | ||||||
Distributors | — | 0.96 | 0.96 | ||||||
Real estate services | — | 0.84 | 0.84 | ||||||
Computer & electronics retail | — | 0.77 | 0.42 | ||||||
Multi-utilities | — | 0.41 | 0.41 | ||||||
Internet software & services | — | — | 17.20 | ||||||
Housewares & specialties | — | — | 1.93 | ||||||
Precious metals & minerals | — | — | 0.48 | ||||||
Trucking | — | — | 0.46 | ||||||
Thrift & mortgage finance | — | — | 0.40 | ||||||
Air freight and logistics | — | — | 0.12 | ||||||
Total | 100.00 | % | 100.00 | % | 100.00 | % | |||
___________________
(1) | As of September 30, 2018, certain industry classifications were modified primarily as a result of changes to industry information provided by a third party source. We disclosed both the revised and previously reported industry classifications as of September 30, 2017 above. |
(2) | This industry includes our investment in SLF JV I. |
Loans and Debt Securities on Non-Accrual Status
As of each of September 30, 2018 and September 30, 2017, there were eight investments on which we had stopped accruing cash and/or PIK interest or OID income.
The percentages of our debt investments at cost and fair value by accrual status as of September 30, 2018 and 2017 were as follows:
56
September 30, 2018 | September 30, 2017 | |||||||||||||||||||||||||||
Cost | % of Debt Portfolio | Fair Value | % of Debt Portfolio | Cost | % of Debt Portfolio | Fair Value | % of Debt Portfolio | |||||||||||||||||||||
Accrual | $ | 1,298,999 | 85.46 | % | $ | 1,318,531 | 93.03 | % | $ | 1,344,535 | 86.46 | % | $ | 1,357,794 | 95.29 | % | ||||||||||||
PIK non-accrual (1) | 12,661 | 0.83 | — | — | 10,227 | 0.66 | 379 | 0.03 | ||||||||||||||||||||
Cash non-accrual (2) | 208,345 | 13.71 | 98,760 | 6.97 | 200,210 | 12.88 | 66,636 | 4.68 | ||||||||||||||||||||
Total | $ | 1,520,005 | 100.00 | % | $ | 1,417,291 | 100.00 | % | $ | 1,554,972 | 100.00 | % | $ | 1,424,809 | 100.00 | % | ||||||||||||
___________________
(1) | PIK non-accrual status is inclusive of other non-cash income, where applicable. |
(2) | Cash non-accrual status is inclusive of PIK and other non-cash income, where applicable. |
Senior Loan Fund JV I, LLC
In May 2014, we entered into a limited liability company, or LLC, agreement with Kemper to form SLF JV I. On July 1, 2014, SLF JV I began investing in senior secured loans of middle-market companies and other corporate debt securities. We co-invest in these securities with Kemper through our investment in SLF JV I. SLF JV I is managed by a four person Board of Directors, two of whom are selected by us and two of whom are selected by Kemper. All portfolio decisions and investment decisions in respect of SLF JV I must be approved by the SLF JV I investment committee, which consists of one representative selected by us and one representative selected by Kemper (with approval from a representative of each required). SLF JV I is capitalized pro rata with LLC equity interests as transactions are completed and may be capitalized with additional Class A mezzanine senior secured deferrable floating rate notes and Class B mezzanine senior secured deferrable fixed rate notes, or, collectively, the mezzanine notes, issued to us and Kemper by SLF Repack Issuer 2016 LLC, a wholly-owned subsidiary of SLF JV I. The mezzanine notes mature on October 12, 2036. As of September 30, 2018 and September 30, 2017, we and Kemper owned, in the aggregate, 87.5% and 12.5%, respectively, of the LLC equity interests of SLF JV I and the outstanding mezzanine notes.
SLF JV I's portfolio primarily consisted of senior secured loans to 40 and 32 portfolio companies as of September 30, 2018 and September 30, 2017, respectively. The portfolio companies in SLF JV I are in industries similar to those in which we may invest directly.
SLF JV I has entered into the Deutsche Bank I Facility, which permitted up to $200.0 million of borrowings as of each of September 30, 2018 and September 30, 2017. Borrowings under the Deutsche Bank I Facility are secured by all of the assets of a special purpose financing subsidiary of SLF JV I. As of September 30, 2018, the reinvestment period of the Deutsche bank I Facility was scheduled to expire June 28, 2021 and the maturity date for the Deutsche Bank I Facility was June 28, 2026. As of September 30, 2018, borrowings under the Deutsche Bank I Facility accrued interest at a rate equal to the 3-month LIBOR plus 1.85% per annum during the reinvestment period and 3-month LIBOR plus 2.00% per annum during the amortization period. There was $153.0 million and $71.5 million outstanding under the Deutsche Bank I Facility as of September 30, 2018 and September 30, 2017, respectively.
Prior to December 21, 2017, SLF JV I also had an additional $200.0 million senior credit facility with Deutsche Bank AG, New York Branch, or the Deutsche Bank II Facility. Effective December 21, 2017, SLF JV I merged its financing subsidiaries and, in connection with such merger, terminated the Deutsche Bank II Facility. As of September 30, 2017, there were $41.6 million of borrowings outstanding under the Deutsche Bank II Facility.
As of September 30, 2018 and September 30, 2017, SLF JV I had total assets of $314.2 million and $276.8 million, respectively. As of September 30, 2018, our investment in SLF JV I consisted of LLC equity interests of $0.0 million, at fair value, and Class A mezzanine secured deferrable floating rate notes and Class B mezzanine secured deferrable fixed rate notes of $99.8 million and $29.5 million, at fair value, respectively. As of September 30, 2017, our investment in SLF JV I consisted of LLC equity interests of $5.5 million, at fair value, and Class A mezzanine secured deferrable floating rate notes and Class B mezzanine secured deferrable fixed rate notes of $101.0 million and $27.6 million, at fair value, respectively. In connection with the restructuring of our and Kemper’s investment in SLF JV I in December 2016, we and Kemper exchanged our holdings of subordinated notes of SLF JV I for the mezzanine notes issued by SLF Repack Issuer 2016, LLC, a newly formed, wholly-owned, special purpose issuer subsidiary of SLF JV I, which are secured by SLF JV I’s LLC equity interests in the special purpose entities serving as borrowers under the Deutsche Bank I Facility and, prior to its termination, the Deutsche Bank II Facility. The mezzanine notes are senior in right of payment to the SLF JV I LLC equity interests and any contributions we make to fund investments of SLF JV I through SLF Repack Issuer 2016, LLC.
As of each of September 30, 2018 and September 30, 2017, we and Kemper had funded approximately $165.5 million to SLF JV I, of which $144.8 million was from us. As of September 30, 2018 and September 30, 2017, we and Kemper had the option to fund additional mezzanine notes, subject to additional equity funding to SLF JV I. As of each of September 30, 2018 and September 30, 2017, we had commitments to fund LLC equity interests in SLF JV I of $17.5 million, of which $1.3 million was unfunded.
57
Below is a summary of SLF JV I's portfolio, followed by a listing of the individual loans in SLF JV I's portfolio as of September 30, 2018 and September 30, 2017:
September 30, 2018 | September 30, 2017 | |||
Senior secured loans (1) | $297,053 | $245,063 | ||
Weighted average interest rate on senior secured loans (2) | 7.20% | 7.70% | ||
Number of borrowers in SLF JV I | 40 | 32 | ||
Largest exposure to a single borrower (1) | $17,512 | $18,374 | ||
Total of five largest loan exposures to borrowers (1) | $66,507 | $82,728 | ||
__________________
(1) At principal amount.
(2) Computed using the weighted average annual interest rate on accruing senior secured loans at fair value.
58
SLF JV I Portfolio as of September 30, 2018
Portfolio Company | Industry | Investment Type | Maturity Date | Current Interest Rate(1)(2) | Cash Interest Rate | Principal | Cost | Fair Value (3) | |||||||||||||||
Accudyne Industries, LLC | Industrial machinery | First Lien Term Loan B | 8/18/2024 | LIBOR+3% (1% floor) | 5.24 | % | $ | 9,088 | $ | 9,088 | $ | 9,134 | |||||||||||
AdVenture Interactive, Corp. (4) | Advertising | 927 Common Stock Shares | 1,390 | 670 | |||||||||||||||||||
AI Ladder (Luxembourg) Subco S.a.r.l (4) | Electrical components & equipment | First Lien Term Loan B | 7/9/2025 | LIBOR+4.5% | 7.02 | % | 11,300 | 10,970 | 11,367 | ||||||||||||||
Air Newco LP | IT consulting & other services | First Lien Term Loan B | 5/31/2024 | LIBOR+4.75% | 6.88 | % | 10,000 | 9,975 | 10,100 | ||||||||||||||
AL Midcoast Holdings LLC | Oil & gas storage & transportation | First Lien Term Loan B | 8/1/2025 | LIBOR+5.5% | 7.84 | % | 10,000 | 9,900 | 10,041 | ||||||||||||||
Allied Universal Holdco LLC (4) | Security & alarm services | First Lien Term Loan | 7/28/2022 | LIBOR+3.75% (1% floor) | 6.14 | % | 6,912 | 6,956 | 6,821 | ||||||||||||||
Altice France S.A. | Integrated telecommunication services | First Lien Term Loan B13 | 8/14/2026 | LIBOR+4% | 6.16 | % | 7,500 | 7,313 | 7,457 | ||||||||||||||
Alvogen Pharma US, Inc. | Pharmaceuticals | First Lien Term Loan B | 4/1/2022 | LIBOR+4.75% (1% floor) | 6.99 | % | 9,822 | 9,822 | 9,918 | ||||||||||||||
Asset International, Inc. | Research & consulting services | First Lien Term Loan | 12/30/2024 | LIBOR+4.5% (1% floor) | 6.89 | % | 6,948 | 6,824 | 6,917 | ||||||||||||||
Blackhawk Network Holdings, Inc. | Data processing & outsourced services | First Lien Term Loan | 6/15/2025 | LIBOR+3% | 5.39 | % | 9,975 | 9,951 | 10,049 | ||||||||||||||
Brazos Delaware II, LLC | Oil & gas equipment & services | First Lien Term Loan B | 5/21/2025 | LIBOR+4% | 6.17 | % | 7,481 | 7,446 | 7,458 | ||||||||||||||
Chloe Ox Parent LLC | Healthcare services | First Lien Term Loan | 12/23/2024 | LIBOR+4.5% (1% floor) | 6.89 | % | 9,950 | 9,860 | 9,987 | ||||||||||||||
Clearent Newco, LLC | Application software | First Lien Term Loan | 3/20/2024 | LIBOR+4% (1% floor) | 6.24 | % | 6,894 | 6,800 | 6,796 | ||||||||||||||
Delayed Draw Term Loan | 3/20/2024 | LIBOR+4% (1% floor) | 6.19 | % | 337 | 310 | 309 | ||||||||||||||||
First Lien Revolver | 3/20/2023 | PRIME+3% (1% floor) | 8.00 | % | 852 | 837 | 836 | ||||||||||||||||
Total Clearent Newco, LLC | 8,083 | 7,947 | 7,941 | ||||||||||||||||||||
EOS Fitness Opco Holdings, LLC (4) | Leisure facilities | First Lien Term Loan | 12/30/2019 | LIBOR+8.25% (0.75% floor) | 10.36 | % | 17,512 | 17,399 | 17,512 | ||||||||||||||
Eton (4) | Research & consulting services | Second Lien Term Loan | 5/1/2026 | LIBOR+7.5% | 9.74 | % | 6,000 | 5,971 | 6,030 | ||||||||||||||
Everi Payments Inc. | Casinos & gaming | First Lien Term Loan B | 5/9/2024 | LIBOR+3% (1% floor) | 5.24 | % | 4,938 | 4,914 | 4,973 | ||||||||||||||
Falmouth Group Holdings Corp. | Specialty chemicals | First Lien Term Loan B | 12/14/2021 | LIBOR+6.75% (1% floor) | 8.99 | % | 4,330 | 4,300 | 4,330 | ||||||||||||||
Garretson Resolution Group, Inc. (5) | Diversified support services | First Lien Term Loan | 5/22/2021 | LIBOR+6.5% (1% floor) | 5,797 | 5,772 | 1,159 | ||||||||||||||||
Gigamon Inc. | Systems software | First Lien Term Loan | 12/27/2024 | LIBOR+4.5% (1% floor) | 6.89 | % | 7,940 | 7,869 | 8,000 | ||||||||||||||
IBC Capital Ltd. | Metal & glass containers | First Lien Term Loan B | 9/11/2023 | LIBOR+3.75% | 6.09 | % | 8,955 | 8,933 | 9,028 | ||||||||||||||
InMotion Entertainment Group, LLC (4) | Consumer electronics | First Lien Term Loan A | 10/1/2021 | LIBOR+7.25% (1.25% floor) | 9.65 | % | 8,375 | 8,389 | 8,375 | ||||||||||||||
First Lien Term Loan B | 10/1/2021 | LIBOR+7.25% (1.25% floor) | 9.65 | % | 8,375 | 8,306 | 8,375 | ||||||||||||||||
Total InMotion Entertainment Group, LLC | 16,750 | 16,695 | 16,750 | ||||||||||||||||||||
59
Portfolio Company | Industry | Investment Type | Maturity Date | Current Interest Rate(1)(2) | Cash Interest Rate | Principal | Cost | Fair Value (3) | |||||||||||||||
Keypath Education, Inc. (4) | Advertising | First Lien Term Loan | 4/3/2022 | LIBOR+7% (1.00% floor) cash | 9.39 | % | $ | 1,855 | $ | 1,853 | $ | 1,854 | |||||||||||
927 shares Common Stock | 1,088 | 816 | |||||||||||||||||||||
Total Keypath Education, Inc. | 1,855 | 2,941 | 2,670 | ||||||||||||||||||||
KIK Custom Products Inc. | Household products | First Lien Term Loan B | 5/15/2023 | LIBOR+4% (1% floor) cash | 6.24 | % | 8,000 | 7,965 | 7,975 | ||||||||||||||
McDermott Technology (Americas) Inc. (4) | Oil & gas equipment & services | First Lien Term Loan B | 5/12/2025 | LIBOR+5% (1% floor) cash | 7.24 | % | 9,950 | 9,760 | 10,097 | ||||||||||||||
Morphe LLC (4) | Personal products | First Lien Term Loan | 2/10/2023 | LIBOR+6% (1% floor) cash | 8.40 | % | 4,388 | 4,348 | 4,388 | ||||||||||||||
New IPT, Inc. (4) | Oil & gas equipment & services | First Lien Term Loan | 3/17/2021 | LIBOR+5% (1% floor) cash | 7.39 | % | 1,794 | 1,794 | 1,794 | ||||||||||||||
Second Lien Term Loan | 9/17/2021 | LIBOR+5.1% (1% floor) cash | 7.49 | % | 634 | 634 | 634 | ||||||||||||||||
21.876 Class A Common Units | — | — | 1,001 | ||||||||||||||||||||
Total New IPT, Inc. | 2,428 | 2,428 | 3,429 | ||||||||||||||||||||
Northern Star Industries Inc. | Electrical components & equipment | First Lien Term Loan B | 3/31/2025 | LIBOR+4.75% (1% floor) cash | 7.08 | % | 6,965 | 6,933 | 6,974 | ||||||||||||||
Novetta Solutions, LLC | Application software | First Lien Term Loan B | 10/17/2022 | LIBOR+5% (1% floor) cash | 7.25 | % | 6,055 | 6,012 | 5,881 | ||||||||||||||
OCI Beaumont LLC | Commodity chemicals | First Lien Term Loan B | 3/13/2025 | LIBOR+4% (1% floor) cash | 6.39 | % | 7,960 | 7,951 | 8,089 | ||||||||||||||
Refac Optical Group (4) | Specialty stores | First Lien Term Loan A | 9/30/2018 | LIBOR+8% cash | 10.26 | % | 2,573 | 2,476 | 2,573 | ||||||||||||||
Salient CRGT, Inc. (4) | Aerospace & defense | First Lien Term Loan | 2/28/2022 | LIBOR+5.75% (1% floor) cash | 7.99 | % | 2,267 | 2,235 | 2,301 | ||||||||||||||
Scientific Games International, Inc. | Casinos & gaming | First Lien Term Loan B-5 | 8/14/2024 | LIBOR+2.75% (1% floor) cash | 5.03 | % | 6,582 | 6,552 | 6,579 | ||||||||||||||
SHO Holding I Corporation | Footwear | First Lien Term Loan | 11/18/2022 | LIBOR+5% (1% floor) cash | 7.34 | % | 8,507 | 8,484 | 8,082 | ||||||||||||||
Sirva Worldwide, Inc. | Diversified support services | First Lien Term Loan | 8/4/2025 | LIBOR+5.5% cash | 7.75 | % | 5,000 | 4,925 | 5,019 | ||||||||||||||
TravelCLICK, Inc. (4) | Data Processing & outsourced services | Second Lien Term Loan | 11/6/2021 | LIBOR+7.75% (1% floor) cash | 9.99 | % | 2,871 | 2,871 | 2,871 | ||||||||||||||
TV Borrower US, LLC | Integrated telecommunications services | First Lien Term Loan | 2/22/2024 | LIBOR+4.75% (1% floor) cash | 7.14 | % | 2,019 | 2,011 | 2,026 | ||||||||||||||
Uber Technologies Inc. | Application software | First Lien Term Loan | 4/4/2025 | LIBOR+4% (1% floor) cash | 6.12 | % | 9,975 | 9,928 | 10,055 | ||||||||||||||
Uniti Group LP | Specialized REITs | First Lien Term Loan B | 10/24/2022 | LIBOR+3% (1% floor) cash | 5.24 | % | 6,467 | 6,225 | 6,198 | ||||||||||||||
Veritas US Inc. | Application software | First Lien Term Loan B-1 | 1/27/2023 | LIBOR+4.5% (1% floor) cash | 6.78 | % | 6,965 | 6,915 | 6,801 | ||||||||||||||
Verra Mobility, Corp. (4) | Data processing & outsourced services | First Lien Term Loan B | 2/28/2025 | LIBOR+3.75% (1% floor) cash | 5.99 | % | 10,945 | 10,961 | 11,013 | ||||||||||||||
WP CPP Holdings, LLC | Aerospace & defense | Second Lien Term Loan | 4/30/2026 | LIBOR+7.75% cash | 10.15 | % | 6,000 | 5,942 | 6,013 | ||||||||||||||
$ | 291,053 | $ | 291,216 | $ | 288,663 | ||||||||||||||||||
__________________
(1) Represents the current interest rate as of September 30, 2018. All interest rates are payable in cash, unless otherwise noted.
(2) The interest rate on the principal balance outstanding for all floating rate loans is indexed to LIBOR and/or an alternate base rate (e.g., prime rate), which typically resets semi-annually, quarterly, or monthly at the borrower's option. The borrower may also elect to have multiple interest reset periods for each loan. For each of these loans, we have provided the applicable margin over LIBOR or the alternate base rate based on each respective credit agreement and the cash interest rate as of period end. All LIBOR shown above is in U.S. dollars unless otherwise noted. As of September 30, 2018, the reference rates for SLF JV I's variable rate loans were the 30-day LIBOR at 2.24%, 60-day LIBOR at 2.29%, the 90-day LIBOR at 2.39%, the 180-day LIBOR at 2.59% and the PRIME at 5.25%.
(3) Represents the current determination of fair value as of September 30, 2018 utilizing a similar technique as us in accordance with ASC 820. However, the determination of such fair value is not included in our Board of Directors' valuation process described elsewhere herein.
(4) This investment is held by both us and SLF JV I as of September 30, 2018.
60
(5) This investment was on cash non-accrual status as of September 30, 2018. Cash non-accrual status is inclusive of PIK and other non-cash income, where applicable.
SLF JV I Portfolio as of September 30, 2017
Portfolio Company | Industry | Investment Type | Maturity Date | Current Interest Rate(1)(2) | Cash Interest Rate | Principal | Cost | Fair Value (3) | |||||||||||||||
AdVenture Interactive, Corp. (4) | Advertising | 927 Common Stock Shares | $ | 1,088 | $ | 1,412 | |||||||||||||||||
Allied Universal Holdco LLC (4) | Security & alarm services | First Lien | 7/28/2022 | LIBOR+3.75% (1% floor) | 5.08 | % | $ | 6,982 | 7,040 | 6,976 | |||||||||||||
Ameritox Ltd. (4)(5) | Healthcare services | First Lien | 4/11/2021 | LIBOR+5% (1% floor) 3% PIK | 6.33 | % | 5,759 | 5,638 | 668 | ||||||||||||||
301,913.06 Class B Preferred Units | 302 | — | |||||||||||||||||||||
928.96 Class A Common Units | 5,474 | — | |||||||||||||||||||||
Total Ameritox, Ltd. | 5,759 | 11,414 | 668 | ||||||||||||||||||||
BeyondTrust Software, Inc. (4) | Application software | First Lien | 9/25/2019 | LIBOR+7% (1% floor) | 8.33 | % | 15,330 | 15,231 | 15,329 | ||||||||||||||
BJ's Wholesale Club, Inc. (4) | Hypermarkets & super centers | First Lien | 1/26/2024 | LIBOR+3.75% (1% floor) | 4.99 | % | 4,988 | 4,993 | 4,793 | ||||||||||||||
Compuware Corporation | Internet software & services | First Lien B3 | 12/15/2021 | LIBOR+4.25% (1% floor) | 5.49 | % | 11,154 | 11,041 | 11,293 | ||||||||||||||
DFT Intermediate LLC (4) | Specialized finance | First Lien | 3/1/2023 | LIBOR+5.5% (1% floor) | 6.74 | % | 10,723 | 10,474 | 10,652 | ||||||||||||||
Digital River, Inc. | Internet software & services | First Lien | 2/12/2021 | LIBOR+6.5% (1% floor) | 7.82 | % | 4,524 | 4,541 | 4,546 | ||||||||||||||
Dodge Data & Analytics LLC (4) | Data processing & outsourced services | First Lien | 10/31/2019 | LIBOR+8.75% (1% floor) | 10.13 | % | 9,339 | 9,372 | 8,744 | ||||||||||||||
DTZ U.S. Borrower, LLC (4) | Real estate services | First Lien | 11/4/2021 | LIBOR+3.25% (1% floor) | 4.57 | % | 6,964 | 6,998 | 6,990 | ||||||||||||||
Edge Fitness, LLC | Leisure facilities | First Lien | 12/31/2019 | LIBOR+7.75% (1% floor) | 9.05 | % | 10,600 | 10,602 | 10,600 | ||||||||||||||
EOS Fitness Opco Holdings, LLC (4) | Leisure facilities | First Lien | 12/30/2019 | LIBOR+8.75% (0.75% floor) | 9.99 | % | 18,374 | 18,182 | 18,557 | ||||||||||||||
Everi Payments Inc.(4) | Casinos & gaming | First Lien | 5/9/2024 | LIBOR+4.5% (1% floor) | 5.74 | % | 4,988 | 4,964 | 5,039 | ||||||||||||||
Falmouth Group Holdings Corp. | Specialty chemicals | First Lien | 12/13/2021 | LIBOR+6.75% (1% floor) | 8.08 | % | 4,610 | 4,578 | 4,610 | ||||||||||||||
Garretson Resolution Group, Inc. | Diversified support services | First Lien | 5/22/2021 | LIBOR+6.5% (1% floor) | 7.83 | % | 5,836 | 5,818 | 5,766 | ||||||||||||||
InMotion Entertainment Group, LLC (4) | Consumer electronics | First Lien | 10/1/2018 | LIBOR+7.75% (1.25% floor) | 9.09 | % | 8,875 | 8,884 | 8,875 | ||||||||||||||
First Lien B | 10/1/2018 | LIBOR+7.75% (1.25% floor) | 9.09 | % | 8,875 | 8,828 | 8,871 | ||||||||||||||||
Total InMotion Entertainment Group, LLC | 17,750 | 17,712 | 17,746 | ||||||||||||||||||||
Keypath Education, Inc. (4) | Advertising | First Lien | 4/3/2022 | LIBOR+7% (1.00% floor) | 8.33 | % | 2,040 | 2,040 | 2,039 | ||||||||||||||
927 shares Common Stock | 1,391 | 809 | |||||||||||||||||||||
2,040 | 3,431 | 2,848 | |||||||||||||||||||||
Lift Brands, Inc. (4) | Leisure facilities | First Lien | 12/23/2019 | LIBOR+7.5% (1% floor) | 8.83 | % | 18,276 | 18,257 | 18,275 | ||||||||||||||
Metamorph US 3, LLC (4)(5) | Internet software & services | First Lien | 12/1/2020 | LIBOR+5.5% (1% floor) 2% PIK | 6.74 | % | 9,969 | 9,481 | 3,786 | ||||||||||||||
Motion Recruitment Partners LLC | Human resources & employment services | First Lien | 2/13/2020 | LIBOR+6% (1% floor) | 7.24 | % | 4,330 | 4,281 | 4,330 | ||||||||||||||
NAVEX Global, Inc. | Internet software & services | First Lien | 11/19/2021 | LIBOR+4.75% (1% floor) | 5.49 | % | 5,959 | 5,925 | 5,982 | ||||||||||||||
New IPT, Inc. (4) | Oil & gas equipment & services | First Lien | 3/17/2021 | LIBOR+5% (1% floor) | 6.33 | % | 1,794 | 1,794 | 1,794 | ||||||||||||||
Second Lien | 9/17/2021 | LIBOR+5.1% (1% floor) | 6.43 | % | 1,094 | 1,094 | 1,094 | ||||||||||||||||
21.876 Class A Common Units | — | 321 | |||||||||||||||||||||
Total New IPT, Inc. | 2,888 | 2,888 | 3,209 | ||||||||||||||||||||
61
Portfolio Company | Industry | Investment Type | Maturity Date | Current Interest Rate(1)(2) | Cash Interest Rate | Principal | Cost | Fair Value (3) | |||||||||||||||
Novetta Solutions, LLC | Internet software & services | First Lien | 9/30/2022 | LIBOR+5% (1% floor) | 6.34 | % | $ | 6,118 | $ | 6,066 | $ | 5,950 | |||||||||||
OmniSYS Acquisition Corporation (4) | Diversified support services | First Lien | 11/21/2018 | LIBOR+7.5% (1% floor) | 8.83 | % | 10,896 | 10,900 | 10,833 | ||||||||||||||
Refac Optical Group (4) | Specialty stores | First Lien A | 9/30/2018 | LIBOR+8% | 9.23 | % | 4,623 | 4,605 | 4,623 | ||||||||||||||
Salient CRGT, Inc. (4) | IT consulting & other services | First Lien | 2/28/2022 | LIBOR+5.75% (1% floor) | 6.99 | % | 2,457 | 2,412 | 2,440 | ||||||||||||||
Scientific Games International, Inc. (4) | Casinos & gaming | First Lien | 8/14/2024 | LIBOR+3.25% (1% floor) | 4.58 | % | 6,632 | 6,598 | 6,651 | ||||||||||||||
SHO Holding I Corporation | Footwear | First Lien | 10/27/2022 | LIBOR+5% (1% floor) | 6.24 | % | 8,594 | 8,566 | 8,487 | ||||||||||||||
TravelCLICK, Inc. (4) | Internet software & services | Second Lien | 11/6/2021 | LIBOR+7.75% (1% floor) | 8.99 | % | 5,127 | 5,127 | 5,153 | ||||||||||||||
TV Borrower US, LLC | Integrated telecommunications services | First Lien | 2/22/2024 | LIBOR+4.75% (1% floor) | 6.08 | % | 3,582 | 3,565 | 3,607 | ||||||||||||||
Valet Merger Sub, Inc. (4) | Environmental & facilities services | First Lien | 9/24/2021 | LIBOR+7% (1% floor) | 8.24 | % | 12,998 | 12,862 | 12,998 | ||||||||||||||
Vubiquity, Inc. | Application software | First Lien | 8/12/2021 | LIBOR+5.5% (1% floor) | 6.83 | % | 2,653 | 2,636 | 2,633 | ||||||||||||||
$ | 245,063 | $ | 251,648 | $ | 235,526 | ||||||||||||||||||
___________________
(1) Represents the current interest rate as of September 30, 2017. All interest rates are payable in cash, unless otherwise noted.
(2) The interest rate on the principal balance outstanding for all floating rate loans is indexed to LIBOR and an alternate base rate (e.g., prime rate), which typically resets semi-annually, quarterly, or monthly at the borrower's option. The borrower may also elect to have multiple interest reset periods for each loan. For each of these loans, we have provided the applicable margin over LIBOR based on each respective credit agreement.
(3) Represents the current determination of fair value as of September 30, 2017 utilizing a similar technique as us in accordance with ASC 820. However, the determination of such fair value is not included in our Board of Directors' valuation process described elsewhere herein.
(4) This investment is held by both us and SLF JV I as of September 30, 2017.
(5) This investment is on cash non-accrual status as of September 30, 2017. Cash non-accrual status is inclusive of PIK and other non-cash income, where applicable.
Both the cost and fair value of the Class A mezzanine secured deferrable floating rate notes of SLF JV I held by us were $99.8 million and $101.0 million as of September 30, 2018 and September 30, 2017, respectively. We earned cash interest of $7.4 million and $5.2 million on our investments in these notes for the years ended September 30, 2018 and 2017, respectively. Both the cost and fair value of the Class B mezzanine secured deferrable fixed rate notes of SLF JV I held by us were $29.5 million and $27.6 million as of September 30, 2018 and September 30, 2017, respectively. We earned interest of $3.8 million, of which $3.1 million was PIK interest, and $3.0 million, all of which was PIK interest, on our investments in these notes for the years ended September 30, 2018 and 2017, respectively. On June 28, 2018, the Class B mezzanine secured deferrable fixed rate notes of SLF JV I were amended to bear interest at a fixed cash rate of 10% per annum. Prior to such amendment, these notes bore interest at a fixed PIK rate of 15% per annum. Prior to their repayment, the subordinated notes of SLF JV I bore interest at a rate of LIBOR plus 8.0% per annum, and we earned interest income of $2.9 million and $12.0 million on our investments in these notes for the period from September 30, 2016 through their redemption in December 2016 and the year ended September 30, 2016, respectively. The cost and fair value of the LLC equity interests in SLF JV I held by us was $16.2 million and $0.0 million, respectively, as of September 30, 2018, and $16.2 million and $5.5 million, respectively, as of September 30, 2017. We earned dividend income of $1.6 million, $1.1 million and $5.8 million for the years ended September 30, 2018, 2017 and 2016, respectively, with respect to our investment in the LLC equity interests of SLF JV I. The LLC equity interests of SLF JV I are dividend producing to the extent SLF JV I has residual cash to be distributed on a quarterly basis.
62
Below is certain summarized financial information for SLF JV I as of September 30, 2018 and September 30, 2017 and for the years ended September 30, 2018 and 2017:
September 30, 2018 | September 30, 2017 | |||||||
Selected Balance Sheet Information: | ||||||||
Investments in loans at fair value (cost September 30, 2018: $297,158; cost September 30, 2017: $251,648) | $ | 294,676 | $ | 235,526 | ||||
Receivables from secured financing arrangements at fair value (cost September 30, 2018: $9,801; cost September 30, 2017: $9,783) | 7,069 | 8,305 | ||||||
Cash and cash equivalents | 3,226 | 24,389 | ||||||
Restricted cash | 4,808 | 5,097 | ||||||
Other assets | 4,418 | 3,485 | ||||||
Total assets | $ | 314,197 | $ | 276,802 | ||||
Senior credit facilities payable | $ | 153,010 | $ | 113,053 | ||||
Debt securities payable at fair value (proceeds September 30, 2018: $147,808; proceeds September 30, 2017: $147,052) | 147,808 | 147,052 | ||||||
Other liabilities | 13,331 | 10,383 | ||||||
Total liabilities | 314,149 | 270,488 | ||||||
Members' equity | 48 | 6,314 | ||||||
Total liabilities and members' equity | $ | 314,197 | $ | 276,802 | ||||
Year ended September 30, 2018 | Year ended September 30, 2017 | |||||||
Selected Statements of Operations Information: | ||||||||
Interest income | $ | 20,574 | $ | 23,222 | ||||
Other income | 65 | 869 | ||||||
Total investment income | 20,639 | 24,091 | ||||||
Interest expense | 20,713 | 22,195 | ||||||
Other expenses | 473 | 700 | ||||||
Total expenses (1) | 21,186 | 22,895 | ||||||
Net unrealized appreciation (depreciation) | 12,386 | (22,789 | ) | |||||
Net realized gain (loss) | (16,311 | ) | 13,350 | |||||
Net loss | $ | (4,472 | ) | $ | (8,243 | ) | ||
__________
(1) There are no management fees or incentive fees charged at SLF JV I.
SLF JV I has elected to fair value the debt securities issued to us and Kemper under ASC Topic 825, Financial Instruments, or ASC 825. The debt securities are valued based on the total assets less the total liabilities senior to the mezzanine notes of SLF JV I in an amount not exceeding par under the enterprise value technique.
During the year ended September 30, 2018, we sold $8.0 million of senior secured debt investments to SLF JV I at fair value in exchange for $8.0 million cash consideration. During the year ended September 30, 2017, we sold $10.5 million of senior secured debt investments to SLF JV I at fair value in exchange for $10.5 million cash consideration. No gain or loss was recognized by us on these transactions.
Discussion and Analysis of Results and Operations
Results of Operations
The principal measure of our financial performance is the net increase (decrease) in net assets resulting from operations, which includes net investment income, net realized gain (loss) and net unrealized appreciation (depreciation). Net investment income is the difference between our income from interest, dividends, fees, and other investment income and total expenses. Net realized gain (loss) on investments and secured borrowings is the difference between the proceeds received from dispositions of investments related assets and liabilities and their stated costs. Net unrealized appreciation (depreciation) is the net change in the fair value of our investment related
63
assets and liabilities carried at fair value during the reporting period, including the reversal of previously recorded unrealized appreciation (depreciation) when gains or losses are realized.
Comparison of Years ended September 30, 2018 and September 30, 2017
Total Investment Income
Total investment income includes interest on our investments, fee income and dividend and other income.
Total investment income for the years ended September 30, 2018 and September 30, 2017 was $138.7 million and $178.0 million, respectively. For the year ended September 30, 2018, this amount consisted of $124.3 million of interest income from portfolio investments (which included $5.8 million of PIK interest), $9.4 million of fee income and $5.0 million of dividend income. For the year ended September 30, 2017, this amount primarily consisted of $163.4 million of interest income from portfolio investments (which included $11.1 million of PIK interest), $10.5 million of fee income and $4.0 million of dividend income. The decrease of $39.2 million, or 22.1%, in our total investment income for the year ended September 30, 2018, as compared to the year ended September 30, 2017, was due primarily to a $39.1 million decrease in interest income, which was attributable to a decrease in both the size and yield of our investment portfolio, partially offset by increases in LIBOR, and a $1.1 million decrease in fee income, which was attributable to lower advisory fees earned, offset by a $1.0 million increase in dividend income, which was attributable to higher dividend income earned on our investment in SLF JV I and one of our portfolio companies during the year ended September 30, 2018.
Expenses
Net expenses (expenses net of fee waivers and insurance recoveries) for the years ended September 30, 2018 and September 30, 2017 were $78.7 million and $105.3 million, respectively. Net expenses decreased for the year ended September 30, 2018, as compared to the year ended September 30, 2017, by $26.6 million, or 25.3%, due primarily to a $10.0 million decrease in base management fees and Part I incentive fees (net of fee waivers), which was attributable to a reduction in the size of our portfolio and lower pre-incentive fee net investment income, a $14.2 million decrease in interest expense, which was attributable to lower levels of outstanding debt, and a $2.9 million decrease in general and administrative expenses, partially offset by a $1.2 million increase in professional fees (net of insurance recoveries).
Net Investment Income
As a result of the $39.2 million decrease in total investment income and the $26.6 million decrease in net expenses, net investment income for the year ended September 30, 2018 decreased by $12.6 million, or 17.4%, compared to the year ended September 30, 2017.
Realized Gain (Loss)
Realized gains or losses are measured by the difference between the net proceeds from the sale or redemption of investments, secured borrowings and foreign currency and the cost basis without regard to unrealized appreciation or depreciation previously recognized, and includes investments written-off during the period, net of recoveries. Realized losses may also be recorded in connection with our determination that certain investments are considered worthless securities and/or meet the conditions for loss recognition per the applicable tax rules.
During the year ended September 30, 2018, we recorded an aggregate net realized loss of $115.1 million primarily in connection with the exit of our investments in Ameritox Ltd., TransTrade Operators and Traffic Solutions Holdings, Inc. During the year ended September 30, 2017, we recorded an aggregate net realized loss of $171.8 million primarily in connection with the restructuring or disposition of investments in five portfolio companies previously on non-accrual status as well as the restructuring of SLF JV I.
See “Note 9. Realized Gains or Losses and Net Unrealized Appreciation or Depreciation” in the Consolidated Financial Statements for more details regarding investment realization events for the years ended September 30, 2018 and 2017.
Net Unrealized Appreciation (Depreciation)
Net unrealized appreciation or depreciation is the net change in the fair value of our investments, secured borrowings and foreign currency during the reporting period, including the reversal of previously recorded unrealized appreciation or depreciation when gains or losses are realized.
During the year ended September 30, 2018 and September 30, 2017, we recorded net unrealized appreciation (depreciation) of $102.6 million and $(97.8) million, respectively. For the year ended September 30, 2018, this consisted of $127.4 million of net reclassifications to realized losses (resulting in unrealized appreciation), $2.4 million of net unrealized depreciation on secured borrowings
64
and $2.2 million of net unrealized appreciation on equity investments, offset by $29.4 million of net unrealized depreciation on debt investments. For the year ended September 30, 2017, this consisted of $163.4 million of net unrealized depreciation on debt investments, $93.1 million of net unrealized depreciation on equity investments and $0.3 million of net unrealized appreciation on secured borrowings, offset by $159.0 million of net reclassifications to realized losses (resulting in unrealized appreciation).
Comparison of Years ended September 30, 2017 and September 30, 2016
Total Investment Income
Total investment income includes interest on our investments, fee income and dividend and other income.
Total investment income for the years ended September 30, 2017 and September 30, 2016 was $178.0 million and $247.9 million, respectively. For the year ended September 30, 2017, this amount primarily consisted of $163.4 million of interest income from portfolio investments (which included $11.1 million of PIK interest), $10.5 million of fee income and $4.0 million of dividend income. For the year ended September 30, 2016, this amount primarily consisted of $211.2 million of interest income from portfolio investments (which included $14.0 million of PIK interest), $22.7 million of fee income and $14.0 million of dividend income.
The decrease of $69.9 million in our total investment income for the year ended September 30, 2017, as compared to the year ended September 30, 2016, was due primarily to a $47.8 million decrease in interest income, which was attributable to a decrease in the size of our investment portfolio, a $12.2 million decrease in fee income, which was attributable to a lower number of direct originations during the current year, and a $10.0 million decrease in dividend income, which was attributable to lower dividend income earned on our investments in Yeti Acquisition, LLC and SLF JV I in the current year.
Expenses
Net expenses (expenses net of base management fee waivers and insurance recoveries) for the years ended September 30, 2017 and September 30, 2016 were $105.3 million and $141.1 million, respectively. Net expenses decreased for the year ended September 30, 2017, as compared to the year ended September 30, 2016, by $35.8 million, or 25.4%, due primarily to a $10.1 million decrease in base management fees, which was attributable to a reduction in the size of our portfolio, an $11.4 million decrease in Part I incentive fees, which was attributable to lower pre-incentive fee net investment income in the current year, a $9.5 million decrease in professional fees due to the settlement of litigation matters and a $4.7 million decrease in interest expense attributable to lower levels of outstanding debt in the current year.
Net Investment Income
As a result of the $69.9 million decrease in total investment income and the $35.8 million decrease in net expenses, net investment income for the year ended September 30, 2017 decreased by $34.1 million, or 31.9%, compared to the year ended September 30, 2016.
Realized Gain (Loss)
Realized gain (loss) is the difference between the net proceeds received from dispositions of portfolio investments and secured borrowings and their stated costs. Realized losses may also be recorded in connection with our determination that certain investments are considered worthless securities and/or meet the conditions for loss recognition per the applicable tax rules.
Realized losses on investments and secured borrowings increased from $125.3 million for the year ended September 30, 2016 to $171.8 million for the year ended September 30, 2017. Realized losses for the year ended September 30, 2017 were primarily the result of the restructuring or disposition of investments in five portfolio companies on non-accrual status as well as the restructuring of SLF JV I. For the year ended September 30, 2016, realized losses were driven primarily by the restructuring or disposition of investments in four portfolio companies on non-accrual status.
See “Note 9. Realized Gains or Losses and Net Unrealized Appreciation or Depreciation on Investments and Secured Borrowings” in the Consolidated Financial Statements for more details regarding investment realization events for the years ended September 30, 2017 and September 30, 2016.
Net Unrealized Appreciation (Depreciation)
Net unrealized appreciation or depreciation is the net change in the fair value of our investments and secured borrowings during the reporting period, including the reversal of previously recorded unrealized appreciation or depreciation when gains or losses are realized.
Net unrealized depreciation on investments and secured borrowings increased from $48.0 million for the year ended September 30, 2016 to $97.8 million for the year ended September 30, 2017. Net unrealized depreciation for the year ended September 30, 2017 was primarily the result of significant write-downs on our investment portfolio, including $111.9 million of aggregate write-downs on four
65
investments, partially offset by net reclassifications to realized losses (resulting in unrealized appreciation). Net unrealized depreciation for the year ended September 30, 2016 was primarily the result of significant write-downs on our investment portfolio, including $67.4 million of aggregate write-downs on four investments, partially offset by net reclassifications to realized losses (resulting in unrealized appreciation).
See “Note 9. Realized Gains or Losses and Net Unrealized Appreciation or Depreciation on Investments and Secured Borrowings” in the Consolidated Financial Statements for more details regarding unrealized appreciation (depreciation) on investments and secured borrowings for the years ended September 30, 2017 and September 30, 2016.
Financial Condition, Liquidity and Capital Resources
We have a number of alternatives available to fund our investment portfolio and our operations, including raising equity, increasing or refinancing debt and funding from operational cash flow. We generally expect to fund the growth of our investment portfolio through (i) equity offerings in public or private offerings, which offerings will depend on future market conditions, funding needs and other factors, and (ii) additional debt capital (to the extent permissible under the Investment Company Act). In the future, we may also securitize a portion of our investments. To securitize investments, we would likely create a wholly-owned subsidiary and contribute a pool of loans to the subsidiary. We would then sell interests in the subsidiary on a non-recourse basis to purchasers and we would retain all or a portion of the equity in the subsidiary. We cannot assure you, however, that our efforts to grow our portfolio will be successful. For example, our common stock has generally traded at prices below net asset value for the past several years, and we are currently limited in our ability to raise additional equity at prices below the then-current net asset value per share. Additionally, to generate liquidity we may reduce investment size by syndicating a portion of any given transaction. We intend to continue to generate cash primarily from cash flows from operations, including interest earned and future borrowings. We intend to fund our future distribution obligations through operating cash flow or with funds obtained through future equity and debt offerings or credit facilities, as we deem appropriate.
Our primary uses of funds are investments in our targeted asset classes and cash distributions to holders of our common stock. We may from time to time repurchase or redeem some or all of our outstanding notes in open-market transactions, privately negotiated transactions or otherwise. We generally expect to target a debt to equity ratio of 0.70x to 0.85x (i.e., one dollar of equity for each $0.70 to $0.85 of debt outstanding). On March 23, 2018, the SBCAA was enacted into law. The SBCAA, among other things, amended Section 61(a) of the Investment Company Act to add a new Section 61(a)(2) that reduces the asset coverage requirement applicable to Business Development Companies from 200% to 150% so long as the Business Development Company meets certain disclosure requirements and obtains certain approvals. Our Board of Directors has not taken any action to reduce the asset coverage requirements applicable to us.
For the year ended September 30, 2018, we experienced a net decrease in cash and cash equivalents of $39.6 million. During that period, we received $60.3 million of net cash from operating activities, primarily from $1,106.8 million of principal payments and sale proceeds received and the cash activities related to $60.0 million of net investment income, partially offset by funding $1,059.6 million of investments and net revolvers. During the same period, net cash used in financing activities was $99.9 million, primarily consisting of $15.0 million of net repayments under our credit facilities, $21.2 million of repurchases of unsecured notes, $1.2 million of repayments of secured borrowings, $55.0 million of cash distributions paid to our stockholders, $6.2 million of payments of deferred financing costs and $1.4 million of repurchases of common stock under our dividend reinvestment plan, or DRIP.
For the year ended September 30, 2017, we experienced a net decrease in cash and cash equivalents of $64.9 million. During that period, we received $492.4 million of net cash from operating activities, primarily from $945.4 million of principal payments, PIK payments and sale proceeds received and the cash activities related to $72.7 million of net investment income, partially offset by funding $568.3 million of investments and net revolvers. During the same period, net cash used by financing activities was $557.3 million, primarily consisting of $260.3 million of net repayments under our credit facilities, $213.3 million of repayments of borrowings under SBA debentures payable, $62.5 million of cash distributions paid to our stockholders, $14.8 million of repurchases of common stock under our stock repurchase program and DRIP, and $5.4 million of repayments of secured borrowings.
For the year ended September 30, 2016, we experienced a net decrease in cash and cash equivalents of $20.5 million. During that period, we received $164.8 million of net cash from operating activities, primarily from $818.2 million of principal payments, PIK payments and sale proceeds received and the cash activities related to $106.7 million of net investment income, partially offset by funding $735.5 million of investments and net revolvers. During the same period, net cash used by financing activities was $185.2 million, primarily consisting of $100.3 million of cash distributions paid to our stockholders, $37.6 million of repurchases of common stock under stock repurchase program, $11.7 million of repayments of SBA debentures payable, $6.4 million of repurchases of common stock under our DRIP and $2.9 million of repayments of secured borrowings, partially offset by $89.0 million of net borrowings under our credit facilities (including borrowings to repay the $115.0 million convertible notes redeemed at maturity on April 1, 2016).
As of September 30, 2018, we had $13.5 million in cash and cash equivalents (including $0.1 million of restricted cash), portfolio investments (at fair value) of $1.5 billion, $10.3 million of interest, dividends and fees receivable, $10.5 million of net payables from
66
unsettled transactions, $241.0 million of borrowings outstanding under our credit facilities, $386.5 million of unsecured notes payable (net of unamortized financing costs), $9.7 million of secured borrowings (at fair value) and unfunded commitments of $52.7 million.
As of September 30, 2017, we had $59.9 million in cash and cash equivalents (including $6.9 million of restricted cash), portfolio investments (at fair value) of $1.5 billion, $6.9 million of interest, dividends and fees receivable, $58.7 million of net payables from unsettled transactions, $256.0 million of borrowings outstanding under our credit facilities, $406.1 million of unsecured notes payable (net of unamortized financing costs), $13.3 million of secured borrowings (at fair value) and unfunded commitments of $118.1 million. As of September 30, 2017, included in restricted cash was $6.8 million that was held at U.S. Bank, National Association in connection with our credit facility with Sumitomo Mitsui Banking Corporation, or SMBC.
Significant Capital Transactions
The following table reflects the distributions per share that we have paid, including shares issued under our DRIP, on our common stock since October 1, 2016:
Date Declared | Record Date | Payment Date | Amount per Share | Cash Distribution | DRIP Shares Issued (1) | DRIP Shares Value | |||||||||
August 3, 2016 | October 14, 2016 | October 31, 2016 | $ | 0.06 | $ 8.2 million | 81,391 | $ 0.4 million | ||||||||
August 3, 2016 | November 15, 2016 | November 30, 2016 | 0.06 | 8.2 million | 80,962 | 0.4 million | |||||||||
October 18, 2016 | December 15, 2016 | December 30, 2016 | 0.06 | 7.7 million | 70,316 | 0.4 million | |||||||||
October 18, 2016 | January 13, 2017 | January 31, 2017 | 0.06 | 8.0 million | 73,940 | 0.4 million | |||||||||
October 18, 2016 | February 15, 2017 | February 28, 2017 | 0.06 | 8.0 million | 86,120 | 0.4 million | |||||||||
February 6, 2017 | March 15, 2017 | March 31, 2017 | 0.02 | 2.7 million | 27,891 | 0.1 million | |||||||||
February 6, 2017 | June 15, 2017 | June 30, 2017 | 0.02 | 2.7 million | 20,502 | 0.1 million | |||||||||
February 6, 2017 | September 15, 2017 | September 29, 2017 | 0.125 | 17.0 million | 118,992 | 0.7 million | |||||||||
August 7, 2017 | December 15, 2017 | December 29, 2017 | 0.125 | 17.3 million | 58,456 | 0.3 million | |||||||||
February 5, 2018 | March 15, 2018 | March 30, 2018 | 0.085 | 11.5 million | 122,884 | 0.5 million | |||||||||
May 3, 2018 | June 15, 2018 | June 29, 2018 | 0.095 | 13.0 million | 87,283 | 0.4 million | |||||||||
August 1, 2018 | September 15, 2018 | September 28, 2018 | 0.095 | 13.2 million | 34,575 | 0.2 million | |||||||||
______________
(1) | Shares were purchased on the open market and distributed. |
On November 30, 2015, our Board of Directors approved a $100 million common stock repurchase program through November 30, 2016. For the fiscal year ended September 30, 2016, we repurchased 7,004,139 shares at the weighted average price of $5.34 per share, resulting in $37.6 million of cash paid under the stock repurchase program.
On November 28, 2016, our Board of Directors approved a new common stock repurchase program authorizing us to repurchase up to $12.5 million in the aggregate of our outstanding common stock through November 28, 2017. Common stock repurchases under the program were made in the open market. During the year ended September 30, 2017, we repurchased 2,298,247 shares of our common stock for $12.5 million, including commissions, under the common stock repurchase plan, and the authorization was fully utilized.
We did not repurchase shares of our common stock during the year ended September 30, 2018.
Indebtedness
See “Note 6. Borrowings” in the Consolidated Financial Statements for more details regarding our indebtedness and secured borrowings.
Excluded Subsidiaries
As of September 30, 2017, Fifth Street Mezzanine Partners IV, L.P., or FSMP IV, and Fifth Street Mezzanine Partners V, L.P., or FSMP V, had no SBA guaranteed debentures outstanding. On January 17, 2018, the SBA approved FSMP IV's and FSMP V's requests to surrender their respective licenses to operate as a small business investment company, and the licenses were surrendered in January 2018.
For the years ended September 30, 2017 and 2016, we recorded aggregate interest expense of $9.3 million and $9.5 million,
respectively, related to the SBA-guaranteed debentures of both FSMP IV and FSMP V.
67
ING Facility
On November 30, 2017, we entered into the ING Facility, pursuant to a Senior Secured Revolving Credit Agreement, as amended, or the ING Credit Agreement, with the lenders party thereto, ING Capital LLC, as administrative agent, ING Capital LLC, JPMorgan Chase Bank, N.A. and Merrill Lynch, Pierce, Fenner & Smith Incorporated as joint lead arrangers and joint bookrunners, and JPMorgan Chase Bank, N.A. and Bank of America, N.A., as syndication agents. As of September 30, 2018, the ING Facility permits up to $600 million of borrowings and includes an “accordion” feature that permits us, under certain circumstances, to increase the size of the ING Facility up to $800 million. Borrowings under the ING Credit Agreement bear interest at a rate equal to, at our election, either (a) LIBOR (1-, 2-, 3- or 6-month, at our option) plus a margin of 2.25%, 2.50% or 2.75% per annum depending on our senior debt coverage ratio as calculated under the ING Credit Agreement, with no LIBOR floor or (b) an alternate base rate plus a margin of 1.25%, 1.50% or 1.75% per annum depending on our senior debt coverage ratio as calculated under the ING Credit Agreement. The period during which we may make drawings under the ING Facility expires on November 29, 2020, or the Revolving Termination Date, and the final maturity date of the ING Facility will occur one year following the Revolving Termination Date.
Each loan or letter of credit originated under the ING Facility is subject to the satisfaction of certain conditions. We cannot be assured that we will be able to borrow funds under the ING Facility at any particular time or at all.
The following table describes significant financial covenants, as of September 30, 2018, with which we must comply under the ING Facility on a quarterly basis:
Financial Covenant | Description | Target Value | June 30, 2018 Reported Value (1) | |||
Minimum shareholders' equity | Net assets shall not be less than the greater of (a) 40% of total assets and (b) $700 million plus 50% of the aggregate net proceeds of all sales of equity interests after November 30, 2017 | $700 million | $838 million | |||
Asset coverage ratio | Asset coverage ratio shall not be less than 2.00:1 | 2.00:1 | 2.38:1 | |||
Interest coverage ratio | Interest coverage ratio shall not be less than 2.00:1 | 2.00:1 | 2.46:1 | |||
Minimum net worth | Net worth shall not be less than $650 million | $650 million | $835 million | |||
___________
(1) As contractually required, we report financial covenants based on the last filed quarterly or annual report, in this case our Quarterly Report on Form 10-Q for the three months ended June 30, 2018. We were in compliance with all financial covenants under the ING Facility based on the financial information contained in this Annual Report on Form 10-K.
From May 27, 2010 through November 30, 2017, we were party to a secured syndicated revolving credit facility with certain lenders party thereto from time to time and ING Capital LLC, as administrative agent, as amended, or the Prior ING Facility. In connection with the entry into the ING Credit Agreement, we repaid all outstanding borrowings under the Prior ING Facility following which the Prior ING Facility was terminated. Obligations under the Prior ING Facility would have otherwise matured on August 6, 2018.
As of September 30, 2018, we had $241.0 million of borrowings outstanding under the ING Facility, which had a fair value of $241.0 million. Our borrowings under the ING Facility bore interest at a weighted average interest rate of 4.254% for the period from November 30, 2017 to September 30, 2018. As of September 30, 2017, we had $226.5 million of borrowings outstanding under the Prior ING Facility. Our borrowings under the Prior ING Facility bore interest at a weighted average interest rate of 3.705%, 3.191% and 2.781% for the period from October 1, 2017 to November 30, 2017 and the years ended September 30, 2017 and 2016, respectively.
For the year ended September 30, 2018, we recorded interest expense of $11.6 million, in the aggregate, related to the Prior ING Facility and the ING Facility. For the years ended September 30, 2017 and 2016, we recorded interest expense of $13.6 million and $15.1 million, respectively, related to the Prior ING Facility.
Sumitomo Facility
On September 16, 2011, a consolidated wholly-owned bankruptcy remote, special purpose subsidiary entered into a credit facility, as amended, or the Sumitomo Facility, with SMBC, an affiliate of Sumitomo Mitsui Financial Group, Inc., as administrative agent, and each of the lenders from time to time party thereto. Prior to its termination on November 24, 2017, the Sumitomo Facility permitted up to $125 million of borrowings (subject to collateral requirements) and borrowings under the Sumitomo Facility bore interest at a rate of either (i) LIBOR (1-month) plus 2.00% per annum, with no LIBOR floor, if the borrowings under the Sumitomo Facility were greater than 35% of the aggregate available borrowings under the Sumitomo Facility or (ii) LIBOR (1-month) plus 2.25% per annum, if the borrowings under the Sumitomo Facility were less than or equal to 35% of the aggregate available borrowings under the Sumitomo Facility. On November 24, 2017, all outstanding borrowings under the Sumitomo Facility were repaid, following which the Sumitomo Facility was terminated. Obligations under the Sumitomo Facility would have otherwise matured on the earlier of August 6, 2018 or the date on which the Prior ING Facility was repaid, refinanced or terminated.
68
Our borrowings under the Sumitomo Facility bore interest at a weighted average interest rate of 3.501%, 3.108% and 2.432% for the period from October 1, 2017 through termination on November 24, 2017, and the years ended September 30, 2017 and September 2016, respectively. For the year ended September 30, 2018, we recorded interest expense of $0.7 million, including $0.5 million of debt issuance that were expensed related to the Sumitomo Facility. For the years ended September 30, 2017 and 2016, we recorded interest expense of $2.4 million and $1.9 million, respectively, related to the Sumitomo Facility.
2019 Notes
For the years ended September 30, 2018, 2017 and 2016, we recorded interest expense of $12.6 million, $13.3 million and $13.3 million, respectively, related to the 2019 Notes. During the year ended September 30, 2018, we repurchased and subsequently canceled $21.2 million of the 2019 Notes. We recognized a loss of $0.1 million in connection with such transaction. We did not repurchase any 2019 Notes during the years ended September 30, 2017 and 2016.
As of September 30, 2018, there were $228.8 million of 2019 Notes outstanding, which had a carrying value and fair value of $228.3 million and $230.5 million, respectively. As of September 30, 2017, there were $250.0 million of 2019 Notes outstanding, which had a carrying value and fair value of $248.4 million and $250.6 million, respectively.
2024 Notes
For each the years ended September 30, 2018, 2017 and 2016, we recorded interest expense of $4.6 million, respectively, related to the 2024 Notes. During the years ended September 30, 2018, 2017 and 2016, we did not repurchase any of the 2024 Notes in the open market.
As of September 30, 2018, there were $75.0 million of 2024 Notes outstanding, which had a carrying value and fair value of $73.7 million and $75.7 million, respectively. As of September 30, 2017, there were $75.0 million of 2024 Notes outstanding, which had a carrying value and fair value of $73.5 million and $76.0 million, respectively. As of September 30, 2018, the 2024 Notes were listed on the New York Stock Exchange under the trading symbol “OSLE” with a par value of $25.00 per note.
2028 Notes
For each of the years ended September 30, 2018, 2017 and 2016, we recorded interest expense of $5.5 million, respectively, related to the 2028 Notes. During the years ended September 30, 2018, 2017 and 2016, we did not repurchase any of the 2028 Notes in the open market.
As of September 30, 2018, there were $86.3 million of 2028 Notes outstanding, which had a carrying value and fair value of $84.4 million and $86.9 million, respectively. As of September 30, 2017, there were $84.2 million of 2028 Notes outstanding, which had a carrying value and fair value of $84.2 million and $87.5 million, respectively. As of September 30, 2018, the 2028 Notes were listed on the Nasdaq Global Select Market under the trading symbol “OCSLL” with a par value of $25.00 per note.
Secured Borrowings
We follow the guidance in ASC Topic 860, Transfers and Servicing, when accounting for loan participations and other partial loan sales. Such guidance requires a participation or other partial loan sale to meet the definition of a "participating interest," as defined in the guidance, in order for sale treatment to be allowed. Participations or other partial loan sales which do not meet the definition of a participating interest remain on our Consolidated Statements of Assets and Liabilities and the proceeds are recorded as a secured borrowing until the definition is met. Secured borrowings are carried at fair value to correspond with the related investments, which are carried at fair value.
As of September 30, 2018, there were $12.3 million of secured borrowings outstanding. As of September 30, 2018, secured borrowings at fair value totaled $9.7 million and the fair value of the loan that is associated with these secured borrowings was $34.3 million. These secured borrowings were the result of the completion of partial loan sales totaling $22.8 million of a senior secured debt investment during the fiscal year ended September 30, 2014 that did not meet the definition of a participating interest. As a result, sale treatment was not allowed and these partial loan sales were treated as secured borrowings. During the years ended September 30, 2018, 2017 and 2016, there were $1.2 million, $5.4 million and $2.9 million of net repayments on secured borrowings, respectively.
For the years ended September 30, 2018, 2017 and 2016, the secured borrowings bore interest at a weighted average interest rate of 5.34%, 8.08% and 7.26%, respectively. For the years ended September 30, 2018, 2017 and 2016, we recorded interest expense of $0.7 million, $1.2 million and $1.5 million, respectively, related to the secured borrowings.
69
Off-Balance Sheet Arrangements
We may be a party to financial instruments with off-balance sheet risk in the normal course of business to meet the financial needs of our portfolio companies. As of September 30, 2018, our only off-balance sheet arrangements consisted of $52.7 million of unfunded commitments, which was comprised of $46.7 million to provide debt financing to certain of our portfolio companies, $1.3 million to provide equity financing to SLF JV I and $4.7 million related to unfunded limited partnership interests. As of September 30, 2017, our only off-balance sheet arrangements consisted of $118.1 million of unfunded commitments, which was comprised of $107.3 million to provide debt financing to certain of our portfolio companies, $1.3 million to provide equity financing to SLF JV I and $9.5 million related to unfunded limited partnership interests. Such commitments are subject to our portfolio companies' satisfaction of certain financial and nonfinancial covenants and may involve, to varying degrees, elements of credit risk in excess of the amount recognized in our Consolidated Statements of Assets and Liabilities.
A list of unfunded commitments by investment (consisting of revolvers, term loans with delayed draw components, SLF JV I subordinated notes and LLC equity interests, and limited partnership interests) as of September 30, 2018 and September 30, 2017 is shown in the table below:
70
September 30, 2018 | September 30, 2017 | |||||||
P2 Upstream Acquisition Co. | $ | 10,000 | $ | 10,000 | ||||
InMotion Entertainment Group, LLC | 7,534 | 7,544 | ||||||
EOS Fitness Opco Holdings, LLC | 5,000 | 5,000 | ||||||
Pingora MSR Opportunity Fund I, LP (limited partnership interest) | 4,656 | 2,760 | ||||||
Dominion Diagnostics, LLC | 4,180 | 4,180 | ||||||
TerSera Therapeutics, LLC | 3,281 | — | ||||||
Keypath Education, Inc. | 3,000 | 3,000 | ||||||
PLATO Learning Inc. (1) | 2,671 | 2,664 | ||||||
Datto Inc. | 2,356 | — | ||||||
4 Over International, LLC | 2,232 | 2,232 | ||||||
New IPT, Inc. | 2,229 | 2,229 | ||||||
Senior Loan Fund JV 1, LLC | 1,328 | 1,328 | ||||||
Thing5, LLC (1)(2) | 1,298 | 3,000 | ||||||
iCIMs, Inc. | 882 | — | ||||||
Access CIG LLC | 765 | — | ||||||
Ministry Brands, LLC | 700 | 1,708 | ||||||
Cenegenics, LLC (1)(2) | 297 | 297 | ||||||
GKD Index Partners LLC | 289 | — | ||||||
Refac Optical Group | — | 2,080 | ||||||
TransTrade Operators, Inc. | — | 1,052 | ||||||
Valet Merger Sub, Inc. | — | 9,326 | ||||||
Sterling Capital Partners IV, L.P. (limited partnership interest) | — | 490 | ||||||
ACON Equity Partners III, LP (limited partnership interest) | — | 239 | ||||||
Lift Brands Holdings, Inc. | — | 15,000 | ||||||
Edge Fitness, LLC | — | 8,353 | ||||||
Impact Sales, LLC | — | 3,234 | ||||||
WeddingWire, Inc. | — | 3,000 | ||||||
Motion Recruitment Partners LLC | — | 2,900 | ||||||
Traffic Solutions Holdings, Inc. | — | 2,998 | ||||||
OmniSYS Acquisition Corporation | — | 2,500 | ||||||
SPC Partners VI, L.P. (limited partnership interest) | — | 2,000 | ||||||
Metamorph US 3, LLC | — | 1,470 | ||||||
Riverside Fund V, LP (limited partnership interest) | — | 539 | ||||||
Webster Capital III, L.P. (limited partnership) | — | 736 | ||||||
Tailwind Capital Partners II, L.P. (limited partnership interest) | — | 391 | ||||||
Beecken Petty O'Keefe Fund IV, L.P. (limited partnership interest) | — | 472 | ||||||
Moelis Capital Partners Opportunity Fund I-B, L.P. (limited partnership interest) | — | 365 | ||||||
Riverside Fund IV, LP (limited partnership interest) | — | 254 | ||||||
Bunker Hill Capital II (QP), LP (limited partnership interest) | — | 183 | ||||||
SPC Partners V, L.P. (limited partnership interest) | — | 159 | ||||||
Riverlake Equity Partners II, LP (limited partnership interest) | — | 129 | ||||||
Milestone Partners IV, LP (limited partnership interest) | — | 180 | ||||||
BeyondTrust Software, Inc. | — | 5,995 | ||||||
Systems, Inc. | — | 3,030 | ||||||
Ping Identity Corporation | — | 2,500 | ||||||
Sailpoint Technologies, Inc. | — | 1,500 | ||||||
Garretson Firm Resolution Group, Inc. | — | 508 | ||||||
RCP Direct II, LP (limited partnership interest) | — | 364 | ||||||
RCP Direct, LP (limited partnership interest) | — | 184 | ||||||
Total | $ | 52,698 | $ | 118,073 | ||||
___________
(1) This investment was on cash or PIK non-accrual status as of September 30, 2018.
(2) This portfolio company does not have the ability to draw on this unfunded commitment as of September 30, 2018.
71
Contractual Obligations
The following table reflects information pertaining to our debt outstanding under the ING Facility, the Sumitomo Facility, the 2019 Notes, the 2024 Notes, the 2028 Notes and our secured borrowings:
Debt Outstanding as of September 30, 2017 | Debt Outstanding as of September 30, 2018 | Weighted average debt outstanding for the year ended September 30, 2018 | Maximum debt outstanding for the year ended September 30, 2018 | |||||||||||||
ING Facility (1) | $ | 226,495 | $ | 241,000 | $ | 192,894 | $ | 316,000 | ||||||||
Sumitomo Facility | 29,500 | — | 4,445 | 29,500 | ||||||||||||
2019 Notes | 250,000 | 228,825 | 236,831 | 250,000 | ||||||||||||
2024 Notes | 75,000 | 75,000 | 75,000 | 75,000 | ||||||||||||
2028 Notes | 86,250 | 86,250 | 86,250 | 86,250 | ||||||||||||
Secured borrowings | 13,489 | 12,314 | 13,133 | 13,489 | ||||||||||||
Total debt | $ | 680,734 | $ | 643,389 | $ | 608,553 | ||||||||||
___________
(1) Includes the Prior ING Facility for periods prior to November 30, 2017.
The following table reflects our contractual obligations arising from the ING Facility, our secured borrowings, our 2019 Notes, our 2024 Notes and our 2028 Notes:
Payments due by period as of September 30, 2018 | ||||||||||||||||||||
Contractual Obligations | Total | Less than 1 year | 1-3 years | 3-5 years | More than 5 years | |||||||||||||||
ING Facility | $ | 241,000 | $ | — | $ | — | $ | 241,000 | $ | — | ||||||||||
Interest due on ING Facility | 33,870 | 10,694 | 21,389 | 1,787 | — | |||||||||||||||
Secured borrowings | 12,314 | — | 12,314 | — | — | |||||||||||||||
Interest due on secured borrowings | 2,855 | 1,405 | 1,450 | — | — | |||||||||||||||
2019 Notes | 228,825 | 228,825 | — | — | — | |||||||||||||||
Interest due on 2019 Notes | 4,645 | 4,645 | — | — | — | |||||||||||||||
2024 Notes | 75,000 | — | — | — | 75,000 | |||||||||||||||
Interest due on 2024 Notes | 26,824 | 4,406 | 8,813 | 8,813 | 4,792 | |||||||||||||||
2028 Notes | 86,250 | — | — | — | 86,250 | |||||||||||||||
Interest due on 2028 Notes | 50,657 | 5,283 | 10,566 | 10,566 | 24,242 | |||||||||||||||
Total | $ | 762,240 | $ | 255,258 | $ | 54,532 | $ | 262,166 | $ | 190,284 | ||||||||||
Regulated Investment Company Status and Distributions
We have qualified and elected to be treated as a RIC under Subchapter M of the Code for tax purposes. As long as we continue to qualify as a RIC, we will not be subject to tax on our investment company taxable income (determined without regard to any deduction for dividends paid) or realized net capital gains, to the extent that such taxable income or gains is distributed, or deemed to be distributed as dividends, to stockholders on a timely basis.
Taxable income generally differs from net income for financial reporting purposes due to temporary and permanent differences in the recognition of income and expenses, and generally excludes net unrealized appreciation or depreciation. Distributions declared and paid by us in a taxable year may differ from taxable income for that taxable year as such distributions may include the distribution of taxable income derived from the current taxable year or the distribution of taxable income derived from the prior taxable year carried forward into and distributed in the current taxable year. Distributions also may include returns of capital.
To maintain RIC tax treatment, we must, among other things, distribute dividends, with respect to each taxable year, of an amount at least equal to 90% of our investment company taxable income (i.e., our net ordinary income and our realized net short-term capital gains in excess of realized net long-term capital losses, if any), determined without regard to any deduction for dividends paid. As a RIC, we are also subject to a federal excise tax, based on distribution requirements of our taxable income on a calendar year basis. We anticipate timely distribution of our taxable income in accordance with tax rules. We did not incur a U.S. federal excise tax for calendar years 2016 and 2017 and do not expect to incur a U.S. federal excise tax for the calendar year 2018. We may incur a federal excise tax in future years.
72
We intend to distribute at least 90% of our annual taxable income (which includes our taxable interest and fee income) to our stockholders. The covenants contained in the ING Facility may prohibit us from making distributions to our stockholders, and, as a result, could hinder our ability to satisfy the distribution requirement associated with our ability to be subject to tax as a RIC. In addition, we may retain for investment some or all of our net capital gains (i.e., realized net long-term capital gains in excess of realized net short-term capital losses) and treat such amounts as deemed distributions to our stockholders. If we do this, our stockholders will be treated as if they received actual distributions of the capital gains we retained and then reinvested the net after-tax proceeds in our common stock. Our stockholders also may be eligible to claim tax credits (or, in certain circumstances, tax refunds) equal to their allocable share of the tax we paid on the capital gains deemed distributed to them. To the extent our taxable earnings for a fiscal and taxable year fall below the total amount of our dividend distributions for that fiscal and taxable year, a portion of those distributions may be deemed a return of capital to our stockholders.
We may not be able to achieve operating results that will allow us to make distributions at a specific level or to increase the amount of these distributions from time to time. In addition, we may be limited in our ability to make distributions due to the asset coverage test for borrowings applicable to us as a Business Development Company under the Investment Company Act and due to provisions in our credit facilities and debt instruments. If we do not distribute a certain percentage of our taxable income annually, we will suffer adverse tax consequences, including possible loss of our ability to be subject to tax as a RIC. We cannot assure stockholders that they will receive any distributions or distributions at a particular level.
A RIC may treat a distribution of its own stock as fulfilling its RIC distribution requirements if each stockholder elects to receive his or her entire distribution in either cash or stock of the RIC, subject to certain limitations regarding the aggregate amount of cash to be distributed to all stockholders. If these and certain other requirements are met, for U.S federal income tax purposes, the amount of the dividend paid in stock will be equal to the amount of cash that could have been received instead of stock. We have no current intention of paying dividends in shares of our stock in accordance with these guidelines.
We may generate qualified net interest income or qualified net short-term capital gains that may be exempt from U.S. withholding tax when distributed to foreign stockholders. A RIC is permitted to designate distributions of qualified net interest income and qualified short-term capital gains as exempt from U.S. withholding tax when paid to non-U.S. shareholders with proper documentation. The following table, which may be subject to change as we finalize our annual tax filings, lists the percentage of qualified net interest income and qualified short-term capital gains for the year ended September 30, 2018, our last tax year end.
Year Ended | Qualified Net Interest Income | Qualified Short-Term Capital Gains | |||
September 30, 2018 | 82.1 | % | — | ||
We have adopted a DRIP that provides for the reinvestment of any distributions that we declare in cash on behalf of our stockholders, unless a stockholder elects to receive cash. As a result, if our Board of Directors declares a cash distribution, then our stockholders who have not “opted out” of the DRIP will have their cash distributions automatically reinvested in additional shares of our common stock, rather than receiving a cash distribution. If our shares are trading at a premium to net asset value, we typically issue new shares to implement the DRIP, with such shares issued at the greater of the most recently computed net asset value per share of our common stock or 95% of the current market value per share of our common stock on the payment date for such distribution. If our shares are trading at a discount to net asset value, we typically purchase shares in the open market in connection with our obligations under the DRIP.
Related Party Transactions
We have entered into the Investment Advisory Agreement with Oaktree and the Administration Agreement with Oaktree Administrator, a wholly-owned subsidiary of Oaktree. Mr. John B. Frank, an interested member of our Board of Directors, has an indirect pecuniary interest in Oaktree. Oaktree is a registered investment adviser under the Advisers Act that is partially and indirectly owned by OCG. See “Note 11. Related Party Transactions – Investment Advisory Agreement” and “– Administrative Services” in the notes to the accompanying Consolidated Financial Statements.
Prior to October 17, 2017, we were externally managed and advised by our Former Adviser, and our administrator was our Former Administrator, a wholly-owned subsidiary of our Former Adviser. Messrs. Bernard D. Berman, Patrick J. Dalton, Ivelin M. Dimitrov, Alexander C. Frank, Todd G. Owens and Sandeep K. Khorana, each an interested member of our Board of Directors for all or a portion of our fiscal year ended September 30, 2017 and prior to October 17, 2017, had a direct or indirect pecuniary interest in our Former Adviser. See “Note 11. Related Party Transactions – Former Investment Advisory Agreements” and “– Administrative Services” in the notes to the accompanying Consolidated Financial Statements.
73
Recent Developments
Distribution Declaration
On November 19, 2018, our Board of Directors declared a quarterly distribution of $0.095 per share, payable on December 28, 2018 to stockholders of record on December 17, 2018.
Recently Issued Accounting Standards
See “Note 2. Significant Accounting Policies” in the Consolidated Financial Statements for a description of recent accounting pronouncements, including the expected dates of adoption and the anticipated impact on our Consolidated Financial Statements.
Item 7A. Quantitative and Qualitative Disclosures about Market Risk
We are subject to financial market risks, including changes in the valuations of our investment portfolio and interest rates.
Valuation Risk
Our investments may not have a readily available market price, and we value these investments at fair value as determined in good faith by our Board of Directors, with the assistance of the Audit Committee and the Adviser. There is no single standard for determining fair value in good faith and valuation methodologies involve a significant degree of management judgment. In addition, our valuation methodology utilizes discount rates in part in valuing our investments, and changes in those discount rates may have an impact on the valuation of our investments. Accordingly, valuations by us do not necessarily represent the amounts which may eventually be realized from sales or other dispositions of investments. Estimated fair values may differ from the values that would have been used had a ready market for the investment existed, and the differences could be material to the financial statements.
Interest Rate Risk
We are subject to financial market risks, including changes in interest rates. Changes in interest rates may affect both our cost of funding and our interest income from portfolio investments, cash and cash equivalents and idle funds investments. Our risk management systems and procedures are designed to identify and analyze our risk, to set appropriate policies and limits and to continually monitor these risks and limits by means of reliable administrative and information systems and other policies and programs. Our investment income will be affected by changes in various interest rates, including LIBOR and prime rates, to the extent our debt investments include floating interest rates.
As of September 30, 2018, 83.2% of our debt investment portfolio (at fair value) and 81.8% of our debt investment portfolio (at cost) bore interest at floating rates. The composition of our floating rate debt investments by cash interest rate floor (excluding PIK) as of September 30, 2018 and September 30, 2017 was as follows:
September 30, 2018 | September 30, 2017 | |||||||||||||
($ in thousands) | Fair Value | % of Floating Rate Portfolio | Fair Value | % of Floating Rate Portfolio | ||||||||||
Under 1% | $ | 282,999 | 23.99 | % | $ | 201,365 | 16.91 | % | ||||||
1% to under 2% | 896,574 | 76.01 | 989,575 | 83.09 | ||||||||||
2% to under 3% | — | — | — | — | ||||||||||
3% and over | — | — | — | — | ||||||||||
Total | $ | 1,179,573 | 100.00 | % | $ | 1,190,940 | 100.00 | % | ||||||
Based on our Consolidated Statement of Assets and Liabilities as of September 30, 2018, the following table shows the approximate annualized increase (decrease) in components of net assets resulting from operations of hypothetical base rate changes in interest rates, assuming no changes in our investment and capital structure. However, there can be no assurances our portfolio companies will be able to meet their contractual obligations at any or all levels on increases in interest rates.
74
($ in thousands) | ||||||||||||
Basis point increase | Interest income | Interest expense | Net increase (decrease) | |||||||||
300 | $ | 32,938 | $ | (7,200 | ) | $ | 25,738 | |||||
200 | 21,960 | (4,800 | ) | 17,160 | ||||||||
100 | 10,981 | (2,400 | ) | 8,581 | ||||||||
Basis point decrease | Interest Income | Interest Expense | Net increase (decrease) | |||||||||
100 | $ | (10,975 | ) | $ | 2,400 | $ | (8,575 | ) | ||||
200 (1) | (16,008 | ) | 4,800 | (11,208 | ) | |||||||
__________
(1) The effect of a 200 basis point decrease or greater is limited by interest rate floors on certain investments.
We regularly measure exposure to interest rate risk. We assess interest rate risk and manage our interest rate exposure on an ongoing basis by comparing our interest rate sensitive assets to our interest rate sensitive liabilities. Based on this review, we determine whether or not any hedging transactions are necessary to mitigate exposure to changes in interest rates. The following table shows a comparison of the interest rate base for our interest-bearing cash and outstanding investments, at principal, and our outstanding borrowings as of September 30, 2018 and September 30, 2017:
September 30, 2018 | September 30, 2017 | |||||||||||||||
($ in thousands) | Interest Bearing Cash and Investments | Borrowings | Interest Bearing Cash and Investments | Borrowings | ||||||||||||
Money market rate | $ | 9,108 | $ | — | $ | 59,913 | $ | — | ||||||||
Prime rate | 1,011 | — | 1,061 | — | ||||||||||||
LIBOR | ||||||||||||||||
30 day | 609,755 | 241,000 | 42,165 | 255,993 | ||||||||||||
60 day | 55,949 | — | — | — | ||||||||||||
90 day | 606,856 | 12,314 | 1,254,246 | 13,491 | ||||||||||||
180 day | 15,000 | — | — | — | ||||||||||||
Fixed rate | 296,031 | 390,075 | 290,427 | 411,250 | ||||||||||||
Total | $ | 1,593,710 | $ | 643,389 | $ | 1,647,812 | $ | 680,734 | ||||||||
75
Item 8. | Financial Statements and Supplementary Data |
Index to Consolidated Financial Statements
76
Report of Independent Registered Public Accounting Firm
To the Shareholders and Board of Directors of Oaktree Specialty Lending Corporation
Opinion on the Financial Statements
We have audited the accompanying consolidated statement of assets and liabilities of Oaktree Specialty Lending Corporation (the Company), including the consolidated schedule of investments, as of September 30, 2018, the related consolidated statements of operations, changes in net assets, and cash flows for the year then ended, and the related notes (collectively referred to as the “consolidated financial statements”). In our opinion, the consolidated financial statements present fairly, in all material respects, the financial position of the Company at September 30, 2018, and the results of its operations, changes in its net assets, and its cash flows for the year then ended, in conformity with U.S. generally accepted accounting principles.
We also have audited, in accordance with the standards of the Public Company Accounting Oversight Board (United States) (PCAOB), the Company's internal control over financial reporting as of September 30, 2018, based on criteria established in Internal Control - Integrated Framework issued by the Committee of Sponsoring Organizations of the Treadway Commission (2013 framework), and our report dated November 28, 2018 expressed an unqualified opinion thereon.
Basis for Opinion
These financial statements are the responsibility of the Company’s management. Our responsibility is to express an opinion on the Company’s financial statements based on our audit. We are a public accounting firm registered with the PCAOB and are required to be independent with respect to the Company in accordance with the U.S. federal securities laws and the applicable rules and regulations of the Securities and Exchange Commission and the PCAOB.
We conducted our audit in accordance with the standards of the PCAOB. Those standards require that we plan and perform the audit to obtain reasonable assurance about whether the financial statements are free of material misstatement, whether due to error or fraud. Our audit included performing procedures to assess the risks of material misstatement of the financial statements, whether due to error or fraud, and performing procedures that respond to those risks. Such procedures included examining, on a test basis, evidence regarding the amounts and disclosures in the financial statements. Our procedures included confirmation of investments owned as of September 30, 2018, by correspondence with the custodians, syndication agents and underlying investee companies, and by other appropriate auditing procedures where confirmation was not received. Our audit also included evaluating the accounting principles used and significant estimates made by management, as well as evaluating the overall presentation of the financial statements. We believe that our audit provides a reasonable basis for our opinion.
/s/ Ernst & Young LLP
We have served as the Company’s auditor since 2018.
Los Angeles, CA
November 28, 2018
77
Report of Independent Registered Public Accounting Firm
To the Shareholders and Board of Directors of Oaktree Specialty Lending Corporation
Opinion on Internal Control over Financial Reporting
We have audited Oaktree Specialty Lending Corporation’s internal control over financial reporting as of September 30, 2018, based on criteria established in Internal Control - Integrated Framework issued by the Committee of Sponsoring Organizations of the Treadway Commission (2013 framework) (the COSO criteria). In our opinion, Oaktree Specialty Lending Corporation (the Company) maintained, in all material respects, effective internal control over financial reporting as of September 30, 2018, based on the COSO criteria.
We also have audited, in accordance with the standards of the Public Company Accounting Oversight Board (United States) (PCAOB), the consolidated statement of financial condition of the Company, including the consolidated schedule of investments, as of September 30, 2018, the related consolidated statements of operations, changes in net assets, and cash flows for the year then ended, and the related notes and our report dated November 28, 2018 expressed an unqualified opinion thereon.
Basis for Opinion
The Company’s management is responsible for maintaining effective internal control over financial reporting and for its assessment of the effectiveness of internal control over financial reporting included in the accompanying Management’s Report on Internal Control Over Financial Reporting. Our responsibility is to express an opinion on the Company’s internal control over financial reporting based on our audit. We are a public accounting firm registered with the PCAOB and are required to be independent with respect to the Company in accordance with the U.S. federal securities laws and the applicable rules and regulations of the Securities and Exchange Commission and the PCAOB.
We conducted our audit in accordance with the standards of the PCAOB. Those standards require that we plan and perform the audit to obtain reasonable assurance about whether effective internal control over financial reporting was maintained in all material respects.
Our audit included obtaining an understanding of internal control over financial reporting, assessing the risk that a material weakness exists, testing and evaluating the design and operating effectiveness of internal control based on the assessed risk, and performing such other procedures as we considered necessary in the circumstances. We believe that our audit provides a reasonable basis for our opinion.
Definition and Limitations of Internal Control over Financial Reporting
A company’s internal control over financial reporting is a process designed to provide reasonable assurance regarding the reliability of financial reporting and the preparation of financial statements for external purposes in accordance with generally accepted accounting principles. A company’s internal control over financial reporting includes those policies and procedures that (1) pertain to the maintenance of records that, in reasonable detail, accurately and fairly reflect the transactions and dispositions of the assets of the company; (2) provide reasonable assurance that transactions are recorded as necessary to permit preparation of financial statements in accordance with generally accepted accounting principles, and that receipts and expenditures of the company are being made only in accordance with authorizations of management and directors of the company; and (3) provide reasonable assurance regarding prevention or timely detection of unauthorized acquisition, use, or disposition of the company’s assets that could have a material effect on the financial statements.
Because of its inherent limitations, internal control over financial reporting may not prevent or detect misstatements. Also, projections of any evaluation of effectiveness to future periods are subject to the risk that controls may become inadequate because of changes in conditions, or that the degree of compliance with the policies or procedures may deteriorate.
/s/ Ernst & Young LLP
Los Angeles, California
November 28, 2018
78
Report of Independent Registered Public Accounting Firm
To the Board of Directors and Shareholders of Oaktree Specialty Lending Corporation
In our opinion, the consolidated statement of assets and liabilities, including the consolidated schedule of investments, as of September 30, 2017 and the related consolidated statements of operations, changes in net assets and cash flows for each of the two years in the period ended September 30, 2017 present fairly, in all material respects, the financial position of Oaktree Specialty Lending Corporation (formerly known as Fifth Street Finance Corp.) and its subsidiaries as of September 30, 2017, and the results of their operations and their cash flows for each of the two years in the period ended September 30, 2017, in conformity with accounting principles generally accepted in the United States of America. In addition, in our opinion, the financial statement schedule for the year ended September 30, 2017 presents fairly, in all material respects, the information set forth therein when read in conjunction with the related consolidated financial statements. These financial statements and financial statement schedule are the responsibility of the Company's management. Our responsibility is to express an opinion on these financial statements and financial statement schedule based on our audits. We conducted our audits of these financial statements in accordance with the standards of the Public Company Accounting Oversight Board (United States). Those standards require that we plan and perform the audit to obtain reasonable assurance about whether the financial statements are free of material misstatement. An audit includes examining, on a test basis, evidence supporting the amounts and disclosures in the financial statements, assessing the accounting principles used and significant estimates made by management, and evaluating the overall financial statement presentation. We believe that our audits, which included confirmation of securities as of September 30, 2017 by correspondence with the custodian, transfer agent and brokers, and the application of alternative auditing procedures where confirmation had not been received, provide a reasonable basis for our opinion.
/s/ PricewaterhouseCoopers LLP
New York, New York
November 29, 2017
79
Oaktree Specialty Lending Corporation
Consolidated Statements of Assets and Liabilities
(in thousands, except per share amounts)
September 30, 2018 | September 30, 2017 | |||||||
ASSETS | ||||||||
Investments at fair value: | ||||||||
Control investments (cost September 30, 2018: $213,470; cost September 30, 2017: $444,826) | $ | 196,874 | $ | 305,271 | ||||
Affiliate investments (cost September 30, 2018: $1,080; cost September 30, 2017: $33,743) | 2,161 | 36,983 | ||||||
Non-control/Non-affiliate investments (cost September 30, 2018: $1,392,383; cost September 30, 2017: $1,279,096) | 1,292,166 | 1,199,501 | ||||||
Total investments at fair value (cost September 30, 2018: $1,606,933; cost September 30, 2017: $1,757,665) | 1,491,201 | 1,541,755 | ||||||
Cash and cash equivalents | 13,380 | 53,018 | ||||||
Restricted cash | 109 | 6,895 | ||||||
Interest, dividends and fees receivable | 10,272 | 6,892 | ||||||
Due from portfolio companies | 1,357 | 5,670 | ||||||
Receivables from unsettled transactions | 26,760 | — | ||||||
Deferred financing costs | 5,209 | 1,304 | ||||||
Derivative asset at fair value | 162 | — | ||||||
Other assets | 3,008 | 514 | ||||||
Total assets | $ | 1,551,458 | $ | 1,616,048 | ||||
LIABILITIES AND NET ASSETS | ||||||||
Liabilities: | ||||||||
Accounts payable, accrued expenses and other liabilities | $ | 3,581 | $ | 2,417 | ||||
Base management fee and Part I incentive fee payable | 8,223 | 6,750 | ||||||
Due to affiliate | 3,274 | 1,815 | ||||||
Interest payable | 3,365 | 3,167 | ||||||
Amounts payable to syndication partners | 109 | 1 | ||||||
Director fees payable | — | 184 | ||||||
Payables from unsettled transactions | 37,236 | 58,691 | ||||||
Deferred tax liability | 422 | — | ||||||
Credit facilities payable | 241,000 | 255,995 | ||||||
Unsecured notes payable (net of $3,483 and $4,737 of unamortized financing costs as of September 30, 2018 and September 30, 2017, respectively) | 386,485 | 406,115 | ||||||
Secured borrowings at fair value (proceeds September 30, 2018: $12,314; proceeds September 30, 2017: $13,489) | 9,728 | 13,256 | ||||||
Total liabilities | 693,423 | 748,391 | ||||||
Commitments and contingencies (Note 16) | ||||||||
Net assets: | ||||||||
Common stock, $0.01 par value, 250,000 shares authorized; 140,961 shares issued and outstanding as of September 30, 2018 and September 30, 2017 | 1,409 | 1,409 | ||||||
Additional paid-in-capital | 1,492,739 | 1,579,278 | ||||||
Accumulated overdistributed earnings | (636,113 | ) | (713,030 | ) | ||||
Total net assets (equivalent to $6.09 and $6.16 per common share as of September 30, 2018 and September 30, 2017, respectively) (Note 12) | 858,035 | 867,657 | ||||||
Total liabilities and net assets | $ | 1,551,458 | $ | 1,616,048 | ||||
80
Oaktree Specialty Lending Corporation
Consolidated Statements of Operations
(in thousands, except per share amounts)
Year ended September 30, 2018 | Year ended September 30, 2017 | Year ended September 30, 2016 | ||||||||||
Interest income: | ||||||||||||
Control investments | $ | 12,698 | $ | 14,230 | $ | 17,122 | ||||||
Affiliate investments | 2,027 | 3,939 | 4,110 | |||||||||
Non-control/Non-affiliate investments | 103,223 | 133,344 | 175,584 | |||||||||
Interest on cash and cash equivalents | 563 | 810 | 380 | |||||||||
Total interest income | 118,511 | 152,323 | 197,196 | |||||||||
PIK interest income: | ||||||||||||
Control investments | 3,446 | 6,631 | 4,987 | |||||||||
Affiliate investments | 416 | 788 | 822 | |||||||||
Non-control/Non-affiliate investments | 1,907 | 3,674 | 8,219 | |||||||||
Total PIK interest income | 5,769 | 11,093 | 14,028 | |||||||||
Fee income: | ||||||||||||
Control investments | 951 | 1,244 | 2,715 | |||||||||
Affiliate investments | 48 | 753 | 320 | |||||||||
Non-control/Non-affiliate investments | 8,433 | 8,510 | 19,643 | |||||||||
Total fee income | 9,432 | 10,507 | 22,678 | |||||||||
Dividend and other income: | ||||||||||||
Control investments | 5,010 | 3,954 | 9,175 | |||||||||
Non-control/Non-affiliate investments | — | 87 | 4,795 | |||||||||
Total dividend and other income | 5,010 | 4,041 | 13,970 | |||||||||
Total investment income | 138,722 | 177,964 | 247,872 | |||||||||
Expenses: | ||||||||||||
Base management fee | 22,652 | 31,369 | 41,483 | |||||||||
Part I incentive fee | 10,485 | 10,713 | 22,091 | |||||||||
Professional fees | 5,696 | 5,703 | 15,232 | |||||||||
Directors fees | 650 | 872 | 966 | |||||||||
Interest expense | 35,728 | 49,935 | 54,621 | |||||||||
Administrator expense | 1,687 | 2,217 | 1,891 | |||||||||
General and administrative expenses | 3,120 | 5,999 | 5,128 | |||||||||
Loss on legal settlements | — | 3 | 19,500 | |||||||||
Total expenses | 80,018 | 106,811 | 160,912 | |||||||||
Fees waived | (1,342 | ) | (240 | ) | (338 | ) | ||||||
Insurance recoveries | — | (1,259 | ) | (19,429 | ) | |||||||
Net expenses | 78,676 | 105,312 | 141,145 | |||||||||
Net investment income | 60,046 | 72,652 | 106,727 | |||||||||
Unrealized appreciation (depreciation) on investments and foreign currency: | ||||||||||||
Control investments | 115,906 | (71,329 | ) | (53,599 | ) | |||||||
Affiliate investments | (2,159 | ) | (1,574 | ) | 845 | |||||||
Non-control/Non-affiliate investments | (13,657 | ) | (24,640 | ) | 4,830 | |||||||
Foreign currency forward contracts | 162 | — | — | |||||||||
Net unrealized appreciation (depreciation) on investments and foreign currency | 100,252 | (97,543 | ) | (47,924 | ) | |||||||
Net unrealized (appreciation) depreciation on secured borrowings | 2,353 | (296 | ) | (76 | ) | |||||||
Realized gain (loss) on investments, secured borrowings and foreign currency: | ||||||||||||
Control investments | (122,801 | ) | (59,722 | ) | (9,318 | ) | ||||||
Affiliate investments | 2,048 | — | 3 | |||||||||
Non-control/Non-affiliate investments | 6,042 | (112,060 | ) | (115,968 | ) | |||||||
Foreign currency forward contracts | (436 | ) | — | — | ||||||||
Net realized loss on investments, secured borrowings and foreign currency | (115,147 | ) | (171,782 | ) | (125,283 | ) | ||||||
Redemption premium on unsecured notes payable | (120 | ) | — | — | ||||||||
Provision for income taxes | (622 | ) | — | — | ||||||||
Net increase (decrease) in net assets resulting from operations | $ | 46,762 | $ | (196,969 | ) | $ | (66,556 | ) | ||||
Net investment income per common share — basic | $ | 0.43 | $ | 0.51 | $ | 0.72 | ||||||
Earnings (loss) per common share — basic | $ | 0.33 | $ | (1.39 | ) | $ | (0.45 | ) | ||||
Weighted average common shares outstanding — basic | 140,961 | 141,438 | 147,422 | |||||||||
Net investment income per common share — diluted | $ | 0.43 | $ | 0.51 | $ | 0.71 | ||||||
Earnings (loss) per common share — diluted (Note 5) | $ | 0.33 | $ | (1.39 | ) | $ | (0.45 | ) | ||||
Weighted average common shares outstanding — diluted | 140,961 | 141,438 | 151,339 | |||||||||
See notes to Consolidated Financial Statements.
81
Oaktree Specialty Lending Corporation
Consolidated Statements of Changes in Net Assets
(in thousands, except per share amounts)
Year ended September 30, 2018 | Year ended September 30, 2017 | Year ended September 30, 2016 | ||||||||||
Operations: | ||||||||||||
Net investment income | $ | 60,046 | $ | 72,652 | $ | 106,727 | ||||||
Net unrealized appreciation (depreciation) on investments and foreign currency | 100,252 | (97,543 | ) | (47,924 | ) | |||||||
Net unrealized (appreciation) depreciation on secured borrowings | 2,353 | (296 | ) | (76 | ) | |||||||
Net realized loss on investments, secured borrowings and foreign currency | (115,147 | ) | (171,782 | ) | (125,283 | ) | ||||||
Redemption premium on unsecured notes payable | (120 | ) | — | — | ||||||||
Provision for income taxes | (622 | ) | — | — | ||||||||
Net increase (decrease) in net assets resulting from operations | 46,762 | (196,969 | ) | (66,556 | ) | |||||||
Stockholder transactions: | ||||||||||||
Contributions from stockholders | — | 287 | — | |||||||||
Distributions to stockholders | (38,699 | ) | (65,449 | ) | (99,419 | ) | ||||||
Tax return of capital | (17,685 | ) | — | (7,239 | ) | |||||||
Net decrease in net assets from stockholder transactions | (56,384 | ) | (65,162 | ) | (106,658 | ) | ||||||
Capital share transactions: | ||||||||||||
Issuance of common stock under dividend reinvestment plan | 1,411 | 2,924 | 6,398 | |||||||||
Repurchases of common stock under stock repurchase program | — | (12,500 | ) | (37,592 | ) | |||||||
Repurchases of common stock under dividend reinvestment program | (1,411 | ) | (2,924 | ) | (6,398 | ) | ||||||
Net decrease in net assets from capital share transactions | — | (12,500 | ) | (37,592 | ) | |||||||
Total decrease in net assets | (9,622 | ) | (274,631 | ) | (210,806 | ) | ||||||
Net assets at beginning of period | 867,657 | 1,142,288 | 1,353,094 | |||||||||
Net assets at end of period | $ | 858,035 | $ | 867,657 | $ | 1,142,288 | ||||||
Net asset value per common share | $ | 6.09 | $ | 6.16 | $ | 7.97 | ||||||
Common shares outstanding at end of period | 140,961 | 140,961 | 143,259 | |||||||||
See notes to Consolidated Financial Statements.
82
Oaktree Specialty Lending Corporation
Consolidated Statements of Cash Flows
(in thousands)
Year ended September 30, 2018 | Year ended September 30, 2017 | Year ended September 30, 2016 | ||||||||||
Operating activities: | ||||||||||||
Net increase (decrease) in net assets resulting from operations | $ | 46,762 | $ | (196,969 | ) | $ | (66,556 | ) | ||||
Adjustments to reconcile net increase (decrease) in net assets resulting from operations to net cash provided by operating activities: | ||||||||||||
Net unrealized (appreciation) depreciation on investments | (100,252 | ) | 97,543 | 47,924 | ||||||||
Net unrealized appreciation (depreciation) on secured borrowings | (2,353 | ) | 296 | 76 | ||||||||
Net realized losses on investments and secured borrowings | 115,147 | 171,782 | 125,283 | |||||||||
Redemption premium on unsecured notes payable | 120 | — | — | |||||||||
PIK interest income, net of PIK interest income collected | (4,380 | ) | (6,786 | ) | (11,952 | ) | ||||||
Non-cash fee income | — | (186 | ) | (1,793 | ) | |||||||
Accretion of original issue discount on investments | (7,331 | ) | (11,474 | ) | (4,248 | ) | ||||||
Accretion of original issue discount on unsecured notes payable | 266 | 266 | 266 | |||||||||
Amortization of deferred financing costs | 3,443 | 6,082 | 4,975 | |||||||||
Deferred taxes | 422 | — | — | |||||||||
Purchases of investments and net revolver activity | (1,059,603 | ) | (568,270 | ) | (735,544 | ) | ||||||
Principal payments received on investments (scheduled payments) | 51,679 | 29,447 | 30,321 | |||||||||
Principal payments received on investments (payoffs) | 751,285 | 818,959 | 543,950 | |||||||||
Proceeds from the sale of investments | 303,862 | 92,721 | 241,902 | |||||||||
Changes in operating assets and liabilities: | ||||||||||||
(Increase) decrease in restricted cash | 6,786 | 5,544 | (7,332 | ) | ||||||||
(Increase) decrease in interest, dividends and fees receivable | (3,380 | ) | 8,676 | 1,280 | ||||||||
(Increase) decrease in due from portfolio companies | 4,313 | (1,593 | ) | (1,436 | ) | |||||||
(Increase) decrease in receivables from unsettled transactions | (26,760 | ) | 5,346 | (178 | ) | |||||||
(Increase) decrease in insurance recoveries receivable | — | 19,729 | (19,729 | ) | ||||||||
(Increase) in other assets | (2,494 | ) | (36 | ) | (347 | ) | ||||||
Increase (decrease) in accounts payable, accrued expenses and other liabilities | 1,164 | (116 | ) | (2,413 | ) | |||||||
Increase (decrease) in base management fee and Part I incentive fee payable | 1,473 | (9,208 | ) | (573 | ) | |||||||
Increase (decrease) in due to affiliate | 1,459 | (389 | ) | (761 | ) | |||||||
Increase (decrease) in interest payable | 198 | (745 | ) | (388 | ) | |||||||
Increase (decrease) in payables from unsettled transactions | (21,455 | ) | 52,457 | 2,586 | ||||||||
Increase (decrease) in director fees payable | (184 | ) | (382 | ) | 506 | |||||||
Increase (decrease) in legal settlements payable | — | (19,500 | ) | 19,500 | ||||||||
Increase (decrease) in amounts payable to syndication partners | 108 | (753 | ) | (562 | ) | |||||||
Net cash provided by operating activities | 60,295 | 492,441 | 164,757 | |||||||||
Financing activities: | ||||||||||||
Contributions received in cash | — | 287 | — | |||||||||
Distributions paid in cash | (54,973 | ) | (62,525 | ) | (100,260 | ) | ||||||
Repayments of borrowings under SBA debentures | — | (213,300 | ) | (11,700 | ) | |||||||
Borrowings under credit facilities | 434,000 | 219,082 | 695,000 | |||||||||
Repayments of borrowings under credit facilities | (448,995 | ) | (479,382 | ) | (606,000 | ) | ||||||
Repurchase of unsecured notes | (21,188 | ) | — | — | ||||||||
Repayments of secured borrowings | (1,191 | ) | (5,440 | ) | (2,858 | ) | ||||||
Repayments of unsecured convertible notes | — | — | (115,000 | ) | ||||||||
Repurchases of common stock under stock repurchase program | — | (12,500 | ) | (37,592 | ) | |||||||
Repurchases of common stock under dividend reinvestment plan | (1,411 | ) | (2,924 | ) | (6,398 | ) | ||||||
Deferred financing costs paid | (6,175 | ) | (644 | ) | (403 | ) | ||||||
Net cash used in financing activities | (99,933 | ) | (557,346 | ) | (185,211 | ) | ||||||
Net decrease in cash and cash equivalents | (39,638 | ) | (64,905 | ) | (20,454 | ) | ||||||
Cash and cash equivalents, beginning of period | 53,018 | 117,923 | 138,377 | |||||||||
Cash and cash equivalents, end of period | $ | 13,380 | $ | 53,018 | $ | 117,923 | ||||||
Supplemental information: | ||||||||||||
Cash paid for interest | $ | 31,821 | $ | 44,332 | $ | 49,768 | ||||||
Non-cash operating activities: | ||||||||||||
Purchases of investments from restructurings | $ | — | $ | (165,759 | ) | $ | (78,834 | ) | ||||
Proceeds from investment restructurings | $ | — | $ | 165,759 | $ | 78,834 | ||||||
Non-cash financing activities: | ||||||||||||
Issuance of shares of common stock under dividend reinvestment plan | $ | 1,411 | $ | 2,924 | $ | 6,398 | ||||||
See notes to Consolidated Financial Statements.
83
Oaktree Specialty Lending Corporation
Consolidated Schedule of Investments
September 30, 2018
(dollar amounts in thousands)
Portfolio Company/Type of Investment (1)(2)(5)(9)(14) | Cash Interest Rate (13) | Industry | Principal (8) | Cost | Fair Value | ||||||||||||
Control Investments (3)(15) | |||||||||||||||||
First Star Speir Aviation Limited (16) | Airlines | ||||||||||||||||
First Lien Term Loan, 9% cash due 12/15/2020 (11) | $ | 32,510 | $ | 24,102 | $ | 32,510 | |||||||||||
100% equity interest (6)(11) | 8,500 | — | |||||||||||||||
32,602 | 32,510 | ||||||||||||||||
Keypath Education, Inc. (25) | Advertising | ||||||||||||||||
First Lien Term Loan, LIBOR+7% (1% floor) cash due 4/3/2022 (13) | 9.39 | % | 18,146 | 18,146 | 18,146 | ||||||||||||
First Lien Revolver, LIBOR+7.75% (1% floor) cash due 4/3/2022 (13) | — | — | |||||||||||||||
9,073 Class A Units in FS AVI Holdco, LLC | 10,648 | 7,984 | |||||||||||||||
28,794 | 26,130 | ||||||||||||||||
New IPT, Inc. | Oil & gas equipment services | ||||||||||||||||
First Lien Term Loan, LIBOR+5% (1% floor) cash due 3/17/2021 (13) | 7.39 | % | 4,107 | 4,107 | 4,107 | ||||||||||||
Second Lien Term Loan, LIBOR+5.1% (1% floor) cash due 9/17/2021 (13) | 7.49 | % | 1,453 | 1,453 | 1,453 | ||||||||||||
First Lien Revolver, LIBOR+5% (1% floor) cash due 3/17/2021 (13) | 7.39 | % | 1,009 | 1,009 | 1,009 | ||||||||||||
50.087 Class A Common Units in New IPT Holdings, LLC | — | 2,291 | |||||||||||||||
6,569 | 8,860 | ||||||||||||||||
Senior Loan Fund JV I, LLC (17)(18) | Multi-sector holdings | ||||||||||||||||
Class A Mezzanine Secured Deferrable Floating Rate Notes due 2036 in SLF Repack Issuer 2016 LLC (11)(13) | 8.33 | % | 99,813 | 99,813 | 99,813 | ||||||||||||
Class B Mezzanine Secured Deferrable Fixed Rate Notes, 10% cash due 2036 in SLF Repack Issuer 2016 LLC (11) | 29,520 | 29,520 | 29,520 | ||||||||||||||
87.5% LLC equity interest (6)(11)(24) | 16,172 | 41 | |||||||||||||||
145,505 | 129,374 | ||||||||||||||||
Total Control Investments (22.9% of net assets) | $ | 213,470 | $ | 196,874 | |||||||||||||
Affiliate Investments (4) | |||||||||||||||||
Caregiver Services, Inc. | Healthcare services | ||||||||||||||||
1,080,399 shares of Series A Preferred Stock, 10% | $ | 1,080 | $ | 2,161 | |||||||||||||
1,080 | 2,161 | ||||||||||||||||
Total Affiliate Investments (0.3% of net assets) | $ | 1,080 | $ | 2,161 | |||||||||||||
Non-Control/Non-Affiliate Investments (7) | |||||||||||||||||
4 Over International, LLC | Commercial printing | ||||||||||||||||
First Lien Term Loan, LIBOR+6% (1% floor) cash due 6/7/2022 (13) | 8.24 | % | 5,922 | $ | 5,873 | $ | 5,922 | ||||||||||
First Lien Revolver, LIBOR+6% (1% floor) cash due 6/7/2021 (10)(13) | (17 | ) | — | ||||||||||||||
5,856 | 5,922 | ||||||||||||||||
99 Cents Only Stores LLC | General merchandise stores | ||||||||||||||||
First Lien Term Loan LIBOR+5% cash 1.5% PIK due 1/13/2022 (13)(21) | 7.35 | % | 23,832 | 22,958 | 23,058 | ||||||||||||
22,958 | 23,058 | ||||||||||||||||
Access CIG LLC | Diversified support services | ||||||||||||||||
Second Lien Term Loan, LIBOR+7.75% cash due 2/27/2026 (13)(21) | 9.99 | % | 14,235 | 14,118 | 14,316 | ||||||||||||
Second Lien Delayed Draw Term Loan, LIBOR+7.75% cash due 2/27/2026 (13)(21) | — | 4 | |||||||||||||||
14,118 | 14,320 | ||||||||||||||||
Aden & Anais Merger Sub, Inc. | Apparel, accessories & luxury goods | ||||||||||||||||
51,645 Common Units in Aden & Anais Holdings, Inc. | 5,165 | — | |||||||||||||||
5,165 | — | ||||||||||||||||
Advanced Pain Management | Healthcare services | ||||||||||||||||
First Lien Term Loan, LIBOR+8.5% (1.25% floor) cash due 11/30/2018 (13)(22) | 25,267 | 22,596 | — | ||||||||||||||
22,596 | — | ||||||||||||||||
See notes to Consolidated Financial Statements.
84
Oaktree Specialty Lending Corporation
Consolidated Schedule of Investments
September 30, 2018
(dollar amounts in thousands)
Portfolio Company/Type of Investment (1)(2)(5)(9)(14) | Cash Interest Rate (13) | Industry | Principal (8) | Cost | Fair Value | ||||||||||||
AdVenture Interactive, Corp. (25) | Advertising | ||||||||||||||||
9,073 shares of common stock | $ | 13,611 | $ | 6,557 | |||||||||||||
13,611 | 6,557 | ||||||||||||||||
AI Ladder (Luxembourg) Subco S.a.r.l | Electrical components & equipment | ||||||||||||||||
First Lien Term Loan B, LIBOR+4.5% cash due 7/9/2025 (11)(13)(21) | 7.02 | % | $ | 40,000 | 38,831 | 40,238 | |||||||||||
38,831 | 40,238 | ||||||||||||||||
AI Sirona (Luxembourg) Acquisition S.a.r.l | Pharmaceuticals | ||||||||||||||||
Second Lien Term Loan, EURIBOR+7.25% (0% Floor) cash due 7/10/2026 (11)(13)(21) | 7.25 | % | € | 17,500 | 20,035 | 20,225 | |||||||||||
20,035 | 20,225 | ||||||||||||||||
AirStrip Technologies, Inc. | Application software | ||||||||||||||||
22,858.71 Series C-1 Preferred Stock Warrants (exercise price $34.99757) expiration date 5/11/2025 | 90 | — | |||||||||||||||
90 | — | ||||||||||||||||
Airxcel, Inc. | Household appliances | ||||||||||||||||
First Lien Term Loan, LIBOR+4.5% cash due 4/28/2025 (13)(21) | 6.74 | % | $ | 7,980 | 7,905 | 7,943 | |||||||||||
7,905 | 7,943 | ||||||||||||||||
Algeco Scotsman Global Finance Plc | Construction & engineering | ||||||||||||||||
Fixed Rate Bond 10% cash due 8/15/2023 (11)(21) | 15,000 | 14,539 | 15,450 | ||||||||||||||
Fixed Rate Bond 8% cash due 2/15/2023 (11)(21) | 16,000 | 15,898 | 16,480 | ||||||||||||||
30,437 | 31,930 | ||||||||||||||||
Allen Media, LLC | Movies & entertainment | ||||||||||||||||
First Lien Term Loan B, LIBOR+6.5% (1% floor) cash due 8/30/2023 (13) | 8.81 | % | 20,000 | 19,503 | 19,475 | ||||||||||||
19,503 | 19,475 | ||||||||||||||||
Allied Universal Holdco LLC | Security & alarm services | ||||||||||||||||
First Lien Term Loan, LIBOR+3.75% (1% floor) cash due 7/28/2022 (13)(21) | 6.14 | % | 9,853 | 9,904 | 9,724 | ||||||||||||
Second Lien Term Loan, LIBOR+8.5% (1% floor) cash due 7/28/2023 (13)(21) | 10.79 | % | 1,149 | 1,167 | 1,142 | ||||||||||||
11,071 | 10,866 | ||||||||||||||||
Altice France S.A. | Integrated telecommunication services | ||||||||||||||||
Fixed Rate Bond 8.125% cash due 1/15/2024 (11)(21) | 3,000 | 3,054 | 3,056 | ||||||||||||||
Fixed Rate Bond 7.625% cash due 2/15/2025 (11)(21) | 2,000 | 2,014 | 1,808 | ||||||||||||||
5,068 | 4,864 | ||||||||||||||||
Ancile Solutions, Inc. | Application software | ||||||||||||||||
First Lien Term Loan, LIBOR+7% (1% floor) cash due 6/30/2021 (13) | 9.39 | % | 9,585 | 9,433 | 9,528 | ||||||||||||
9,433 | 9,528 | ||||||||||||||||
Aretec Group, Inc. | Investment banking & brokerage | ||||||||||||||||
Second Lien Exit Term Loan, PRIME+2% cash due 5/23/2021 (13)(21) | 7.25 | % | 12,679 | 12,539 | 12,759 | ||||||||||||
12,539 | 12,759 | ||||||||||||||||
Asset International, Inc. | Research & consulting services | ||||||||||||||||
Second Lien Term Loan, LIBOR+9.25% (1% floor) cash due 6/29/2025 (13) | 11.64 | % | 15,000 | 14,691 | 14,836 | ||||||||||||
14,691 | 14,836 | ||||||||||||||||
Asurion, LLC | Property & casualty insurance | ||||||||||||||||
First Lien Term Loan B2, LIBOR+6.5% (1% floor) cash due 8/4/2025 (13)(21) | 8.74 | % | 22,000 | 21,946 | 22,653 | ||||||||||||
21,946 | 22,653 | ||||||||||||||||
See notes to Consolidated Financial Statements.
85
Oaktree Specialty Lending Corporation
Consolidated Schedule of Investments
September 30, 2018
(dollar amounts in thousands)
Portfolio Company/Type of Investment (1)(2)(5)(9)(14) | Cash Interest Rate (13) | Industry | Principal (8) | Cost | Fair Value | ||||||||||||
Avantor Inc. | Commodity chemicals | ||||||||||||||||
Fixed Rate Bond 9% cash due 10/1/2025 (21) | $ | 3,000 | $ | 2,972 | $ | 3,100 | |||||||||||
2,972 | 3,100 | ||||||||||||||||
Belk Inc. | Department stores | ||||||||||||||||
First Lien Term Loan B, LIBOR+4.75% (1% Floor) cash due 12/12/2022 (13)(21) | 6.88 | % | 662 | 573 | 581 | ||||||||||||
573 | 581 | ||||||||||||||||
BeyondTrust Holdings LLC | Application software | ||||||||||||||||
3.01% Class A membership interests | 4,500 | 15,831 | |||||||||||||||
4,500 | 15,831 | ||||||||||||||||
Blackhawk Network Holdings, Inc. | Data processing & outsourced services | ||||||||||||||||
Second Lien Term Loan, LIBOR+7% (1% Floor) cash due 6/15/2026 (13)(21) | 9.38 | % | 26,250 | 25,978 | 26,545 | ||||||||||||
25,978 | 26,545 | ||||||||||||||||
Blueline Rental Finance Corp | Industrial machinery | ||||||||||||||||
Fixed Rate Bond 9.25% cash due 3/15/2024 (21) | 5,000 | 5,342 | 5,259 | ||||||||||||||
5,342 | 5,259 | ||||||||||||||||
California Pizza Kitchen, Inc. | Restaurants | ||||||||||||||||
First Lien Term Loan, LIBOR+6% (1% floor) cash due 8/23/2022 (13)(21) | 8.39 | % | 3,154 | 3,129 | 3,076 | ||||||||||||
3,129 | 3,076 | ||||||||||||||||
Cenegenics, LLC | Healthcare services | ||||||||||||||||
First Lien Term Loan, 9.75% cash 2% PIK due 9/30/2019 (22) | 29,134 | 27,738 | 8,464 | ||||||||||||||
First Lien Revolver, 15% cash due 9/30/2019 (22) | 2,203 | 2,203 | 429 | ||||||||||||||
452,914.87 Common Units in Cenegenics, LLC | 598 | — | |||||||||||||||
345,380.141 Preferred Units in Cenegenics, LLC | 300 | — | |||||||||||||||
30,839 | 8,893 | ||||||||||||||||
CITGO Holdings Inc. | Oil & gas refining & marketing | ||||||||||||||||
Fixed Rate Bond 10.75% cash due 2/15/2020 (21) | 21,300 | 22,494 | 22,685 | ||||||||||||||
22,494 | 22,685 | ||||||||||||||||
Comprehensive Pharmacy Services LLC | Pharmaceuticals | ||||||||||||||||
20,000 Common Shares in MCP CPS Group Holdings, Inc. | 2,000 | 2,848 | |||||||||||||||
2,000 | 2,848 | ||||||||||||||||
Conviva Inc. | Application software | ||||||||||||||||
417,851 Series D Preferred Stock Warrants (exercise price $1.1966) expiration date 2/28/2021 | 105 | 442 | |||||||||||||||
105 | 442 | ||||||||||||||||
Covia Holdings Corporation | Oil & gas equipment & services | ||||||||||||||||
First Lien Term Loan, LIBOR+3.75% (1% Floor) cash due 6/1/2025 (11)(13)(21) | 6.14 | % | 7,980 | 7,980 | 7,568 | ||||||||||||
7,980 | 7,568 | ||||||||||||||||
DAE Aviation Holdings | Aerospace & defense | ||||||||||||||||
Fixed Rate Bond 10% cash due 7/15/2023 (21) | 1,500 | 1,616 | 1,622 | ||||||||||||||
1,616 | 1,622 | ||||||||||||||||
Datto Inc. | Technology distributors | ||||||||||||||||
First Lien Term Loan, LIBOR+8% (1% floor) cash due 12/7/2022 (13) | 10.15 | % | 35,000 | 34,414 | 34,622 | ||||||||||||
First Lien Revolver, LIBOR+8% (1% floor) cash due 12/7/2022 (10)(13) | 10.15 | % | (39 | ) | (25 | ) | |||||||||||
34,375 | 34,597 | ||||||||||||||||
See notes to Consolidated Financial Statements.
86
Oaktree Specialty Lending Corporation
Consolidated Schedule of Investments
September 30, 2018
(dollar amounts in thousands)
Portfolio Company/Type of Investment (1)(2)(5)(9)(14) | Cash Interest Rate (13) | Industry | Principal (8) | Cost | Fair Value | ||||||||||||
Dodge Data & Analytics LLC | Data processing & outsourced services | ||||||||||||||||
500,000 Class A Common Units in Skyline Data, News and Analytics LLC | $ | 500 | $ | 258 | |||||||||||||
500 | 258 | ||||||||||||||||
Dominion Diagnostics, LLC | Healthcare services | ||||||||||||||||
Subordinated Term Loan, 11% cash 1% PIK due 10/18/2019 (22) | $ | 20,052 | 15,589 | 1,043 | |||||||||||||
First Lien Term Loan, LIBOR+5% (1% floor) cash due 4/8/2019 (13) | 7.34 | % | 46,435 | 34,964 | 40,538 | ||||||||||||
First Lien Revolver, LIBOR+5% (1% floor) cash due 4/8/2019 (10)(13) | — | (531 | ) | ||||||||||||||
50,553 | 41,050 | ||||||||||||||||
Eagleview Technology Corporation | Application software | ||||||||||||||||
Second Lien Term Loan, LIBOR+7.5% (1% Floor) cash due 8/14/2026 (13) | 9.63 | % | 12,000 | 11,880 | 12,240 | ||||||||||||
11,880 | 12,240 | ||||||||||||||||
EHR Canada, LLC | Food retail | ||||||||||||||||
First Lien Term Loan, LIBOR+8% (1% Floor) cash due 9/28/2020 (13) | 10.30 | % | 22,500 | 22,052 | 22,050 | ||||||||||||
22,052 | 22,050 | ||||||||||||||||
EOS Fitness Opco Holdings, LLC | Leisure facilities | ||||||||||||||||
First Lien Term Loan, LIBOR+8.25% (0.75% floor) cash due 12/30/2019 (13) | 10.36 | % | 3,502 | 3,502 | 3,502 | ||||||||||||
First Lien Revolver, LIBOR+8.25% (0.75% floor) cash due 12/30/2019 (13) | — | — | |||||||||||||||
487.5 Class A Preferred Units, 12% | 488 | 760 | |||||||||||||||
12,500 Class B Common Units | 13 | 872 | |||||||||||||||
4,003 | 5,134 | ||||||||||||||||
Eton | Research & consulting services | ||||||||||||||||
Second Lien Term Loan, LIBOR+7.5% cash due 5/1/2026 (13)(21) | 9.74 | % | 20,000 | 19,904 | 20,100 | ||||||||||||
19,904 | 20,100 | ||||||||||||||||
ExamSoft Worldwide, Inc. | Application software | ||||||||||||||||
180,707 Class C Units in ExamSoft Investor LLC | 181 | — | |||||||||||||||
181 | — | ||||||||||||||||
Garretson Firm Resolution Group, Inc. | Diversified support services | ||||||||||||||||
First Lien Revolver, PRIME+5.5% cash due 5/22/2020 (13)(22) | 711 | 711 | 142 | ||||||||||||||
4,950,000 Preferred Units in GRG Holdings, LP, 8% | 495 | — | |||||||||||||||
50,000 Common Units in GRG Holdings, LP | 5 | — | |||||||||||||||
1,211 | 142 | ||||||||||||||||
Gentiva Health Services, Inc. | Healthcare services | ||||||||||||||||
Second Lien Term Loan, LIBOR+7% cash due 7/2/2026 (13)(21) | 9.34 | % | 14,500 | 14,401 | 14,935 | ||||||||||||
14,401 | 14,935 | ||||||||||||||||
GI Chill Acquisition LLC | Managed healthcare | ||||||||||||||||
First Lien Term Loan, LIBOR+4% cash due 8/6/2025 (13) | 6.39 | % | 18,000 | 17,910 | 18,113 | ||||||||||||
Second Lien Term Loan, LIBOR+7.5% cash due 8/6/2026 (13) | 9.68 | % | 10,000 | 9,902 | 9,900 | ||||||||||||
27,812 | 28,013 | ||||||||||||||||
GKD Index Partners, LLC | Specialized finance | ||||||||||||||||
First Lien Term Loan, LIBOR+7.25% (1% Floor) cash due 6/29/2023 (13) | 9.64 | % | 24,379 | 24,147 | 24,135 | ||||||||||||
First Lien Revolver, LIBOR+7.25% (1% Floor) cash due 6/29/2023 (13) | 9.60 | % | 867 | 856 | 855 | ||||||||||||
25,003 | 24,990 | ||||||||||||||||
GOBP Holdings Inc. | Hypermarkets & super centers | ||||||||||||||||
Second Lien Term Loan, LIBOR+8.25% (1% floor) cash due 10/21/2022 (13)(21) | 10.49 | % | 2,071 | 2,057 | 2,082 | ||||||||||||
2,057 | 2,082 | ||||||||||||||||
See notes to Consolidated Financial Statements.
87
Oaktree Specialty Lending Corporation
Consolidated Schedule of Investments
September 30, 2018
(dollar amounts in thousands)
Portfolio Company/Type of Investment (1)(2)(5)(9)(14) | Cash Interest Rate (13) | Industry | Principal (8) | Cost | Fair Value | ||||||||||||
Golden State Medical Supply, Inc. | Pharmaceuticals | ||||||||||||||||
Mezzanine Term Loan, 10% cash 2.5% PIK due 4/24/2021 | $ | 15,000 | $ | 15,000 | $ | 15,001 | |||||||||||
15,000 | 15,001 | ||||||||||||||||
HC2 Holdings Inc. | Multi-sector holdings | ||||||||||||||||
Fixed Rate Bond 11% cash due 12/1/2019 (11)(21) | 10,500 | 10,555 | 10,605 | ||||||||||||||
10,555 | 10,605 | ||||||||||||||||
HealthEdge Software, Inc. | Application software | ||||||||||||||||
482,453 Series A-3 Preferred Stock Warrants (exercise price $1.450918) expiration date 9/30/2023 | 213 | 773 | |||||||||||||||
213 | 773 | ||||||||||||||||
I Drive Safely, LLC | Education services | ||||||||||||||||
125,079 Class A Common Units of IDS Investments, LLC | 1,000 | — | |||||||||||||||
1,000 | — | ||||||||||||||||
IBG Borrower LLC | Apparel, accessories & luxury goods | ||||||||||||||||
First Lien Term Loan, LIBOR+7% (1% floor) cash due 8/2/2022 (13) | 9.44 | % | 14,809 | 13,143 | 13,624 | ||||||||||||
13,143 | 13,624 | ||||||||||||||||
iCIMs, Inc. | Application software | ||||||||||||||||
First Lien Term Loan, LIBOR+6.5% (1% Floor) cash due 9/12/2024 (13) | 8.64 | % | 14,118 | 13,838 | 13,835 | ||||||||||||
First Lien Revolver, LIBOR+6.5% (1% Floor) cash due 9/12/2024 (10)(13) | (17 | ) | (18 | ) | |||||||||||||
13,821 | 13,817 | ||||||||||||||||
InMotion Entertainment Group, LLC | Consumer electronics | ||||||||||||||||
First Lien Term Loan A, LIBOR+7.25% (1.25% floor) cash due 10/1/2021 (13) | 9.65 | % | 11,568 | 11,529 | 11,568 | ||||||||||||
First Lien Term Loan B, LIBOR+7.25% (1.25% floor) cash due 10/1/2021 (13) | 9.65 | % | 5,043 | 4,955 | 5,043 | ||||||||||||
Letter of Credit 6.25% cash due 10/1/2021 | 3,904 | 3,897 | 3,904 | ||||||||||||||
First Lien Revolver, LIBOR+6.75% (1.25% floor) cash due 10/1/2021 (13) | — | — | |||||||||||||||
CapEx Line, LIBOR+7.75% (1.25% floor) cash due 10/1/2021 (13) | 10.15 | % | 755 | 747 | 755 | ||||||||||||
1,000,000 Class A Units in InMotion Entertainment Holdings, LLC | 1,000 | 2,167 | |||||||||||||||
22,128 | 23,437 | ||||||||||||||||
Integral Development Corporation | Other diversified financial services | ||||||||||||||||
1,078,284 Common Stock Warrants (exercise price $0.9274) expiration date 7/10/2024 | 113 | — | |||||||||||||||
113 | — | ||||||||||||||||
Internet Pipeline, Inc. | Internet services & infrastructure | ||||||||||||||||
Incremental First Lien Term Loan, LIBOR+4.75% (1% floor) cash due 8/1/2022 (13) | 7.00 | % | 5,510 | 5,454 | 5,509 | ||||||||||||
5,454 | 5,509 | ||||||||||||||||
Janrain, Inc. | Application software | ||||||||||||||||
218,008 Common Stock Warrants (exercise price $1.3761) expiration date 12/5/2024 | 45 | — | |||||||||||||||
45 | — | ||||||||||||||||
Jones Energy, Inc. | Oil & gas exploration & production | ||||||||||||||||
Fixed Rate Bond 9.25% cash due 3/15/2023 (21) | 12,000 | 11,808 | 12,390 | ||||||||||||||
11,808 | 12,390 | ||||||||||||||||
Kason Corporation | Industrial machinery | ||||||||||||||||
Mezzanine Term Loan, 11.5% cash 1.75% PIK due 10/28/2019 | 6,113 | 6,113 | 5,606 | ||||||||||||||
498.6 Class A Preferred Units in Kason Investment, LLC, 8% | 499 | 249 | |||||||||||||||
5,540 Class A Common Units in Kason Investment, LLC | 55 | — | |||||||||||||||
6,667 | 5,855 | ||||||||||||||||
See notes to Consolidated Financial Statements.
88
Oaktree Specialty Lending Corporation
Consolidated Schedule of Investments
September 30, 2018
(dollar amounts in thousands)
Portfolio Company/Type of Investment (1)(2)(5)(9)(14) | Cash Interest Rate (13) | Industry | Principal (8) | Cost | Fair Value | ||||||||||||
Kellermeyer Bergensons Services, LLC | Environmental & facilities services | ||||||||||||||||
Second Lien Term Loan, LIBOR+8.5% (1% floor) cash due 4/29/2022 (13) | 10.84 | % | $ | 6,105 | $ | 5,923 | $ | 6,189 | |||||||||
5,923 | 6,189 | ||||||||||||||||
L Squared Capital Partners LLC | Multi-sector holdings | ||||||||||||||||
2% limited partnership interest (11)(24) | 1,824 | 3,058 | |||||||||||||||
1,824 | 3,058 | ||||||||||||||||
Lanai Holdings III, Inc. | Healthcare distributors | ||||||||||||||||
First Lien Term Loan B, LIBOR+4.75% (1% floor) cash due 8/29/2022 (13)(21) | 7.09 | % | 20,099 | 19,683 | 19,395 | ||||||||||||
19,683 | 19,395 | ||||||||||||||||
Lannett Company, Inc. | Pharmaceuticals | ||||||||||||||||
First Lien Term Loan A, LIBOR+4.75% (1% Floor) cash due 11/25/2020 (11)(13)(21) | 6.99 | % | 1,883 | 1,885 | 1,792 | ||||||||||||
1,885 | 1,792 | ||||||||||||||||
Lift Brands Holdings, Inc. | Leisure facilities | ||||||||||||||||
2,000,000 Class A Common Units in Snap Investments, LLC | 1,398 | 3,020 | |||||||||||||||
1,398 | 3,020 | ||||||||||||||||
Long's Drugs Incorporated | Pharmaceuticals | ||||||||||||||||
50 Series A Preferred Shares in Long's Drugs Incorporated | 385 | 761 | |||||||||||||||
25 Series B Preferred Shares in Long's Drugs Incorporated | 210 | 491 | |||||||||||||||
595 | 1,252 | ||||||||||||||||
LTI Holdings, Inc. | Auto parts & equipment | ||||||||||||||||
Second Lien Term Loan, LIBOR+6.75% cash due 9/6/2026 (13)(21) | 8.99 | % | 9,000 | 9,000 | 9,024 | ||||||||||||
9,000 | 9,024 | ||||||||||||||||
Lytx Holdings, LLC | Research & consulting services | ||||||||||||||||
3,500 Class B Units | — | 1,423 | |||||||||||||||
— | 1,423 | ||||||||||||||||
Maravai Intermediate Holdings, LLC | Biotechnology | ||||||||||||||||
First Lien Term Loan, LIBOR+4.25% cash due 8/2/2025 (13) | 6.38 | % | 12,000 | 11,880 | 11,963 | ||||||||||||
11,880 | 11,963 | ||||||||||||||||
Maverick Healthcare Group, LLC (20) | Healthcare equipment | ||||||||||||||||
First Lien Term Loan A, LIBOR+7.5% cash (1.75% floor) cash due 3/15/2019 (13)(22) | 11,068 | 8,181 | 9,102 | ||||||||||||||
First Lien Term Loan B, LIBOR+11% cash (1.75% floor) cash due 3/15/2019 (13)(22) | 50,740 | 39,110 | — | ||||||||||||||
CapEx Line, LIBOR+7.75% (1.75% floor) cash due 3/15/2019 (13)(22) | 863 | 611 | 710 | ||||||||||||||
47,902 | 9,812 | ||||||||||||||||
Mayfield Agency Borrower Inc. | Property & casualty insurance | ||||||||||||||||
First Lien Term Loan, LIBOR+4.5% (1% floor) cash due 2/28/2025 (13)(21) | 6.74 | % | 7,481 | 7,447 | 7,537 | ||||||||||||
Second Lien Term Loan, LIBOR+8.5% (1% floor) cash due 3/2/2026 (13) | 10.74 | % | 37,500 | 36,977 | 37,219 | ||||||||||||
44,424 | 44,756 | ||||||||||||||||
McAfee, LLC | Systems software | ||||||||||||||||
First Lien Term Loan B, LIBOR+4.5% (1% floor) cash due 9/30/2024 (13)(21) | 6.74 | % | 7,920 | 7,853 | 7,995 | ||||||||||||
Second Lien Term Loan LIBOR+8.5% (1% floor) cash due 9/29/2025 (13)(21) | 10.74 | % | 8,000 | 8,045 | 8,180 | ||||||||||||
15,898 | 16,175 | ||||||||||||||||
See notes to Consolidated Financial Statements.
89
Oaktree Specialty Lending Corporation
Consolidated Schedule of Investments
September 30, 2018
(dollar amounts in thousands)
Portfolio Company/Type of Investment (1)(2)(5)(9)(14) | Cash Interest Rate (13) | Industry | Principal (8) | Cost | Fair Value | ||||||||||||
McDermott Technology (Americas), Inc. | Oil & gas equipment services | ||||||||||||||||
First Lien Term Loan B, LIBOR+5% (1% floor) cash due 5/12/2025 (11)(13)(21) | 7.24 | % | $ | 31,144 | $ | 30,725 | $ | 31,604 | |||||||||
30,725 | 31,604 | ||||||||||||||||
MHE Intermediate Holdings, LLC | Diversified support services | ||||||||||||||||
First Lien Term Loan, LIBOR+5% (1% floor) cash due 3/8/2024 (13) | 7.39 | % | 2,963 | 2,938 | 2,935 | ||||||||||||
2,938 | 2,935 | ||||||||||||||||
Ministry Brands, LLC | Application software | ||||||||||||||||
Second Lien Term Loan, LIBOR+9.25% (1% floor) cash due 6/2/2023 (13) | 11.75 | % | 7,056 | 6,980 | 7,090 | ||||||||||||
Second Lien Delayed Draw Term Loan, LIBOR+9.25% (1% floor) cash due 6/2/2023 (13) | 11.75 | % | 1,944 | 1,923 | 1,953 | ||||||||||||
First Lien Revolver PRIME+4% (1% floor) cash due 12/2/2022 (13) | 9.25 | % | 300 | 291 | 300 | ||||||||||||
9,194 | 9,343 | ||||||||||||||||
Morphe LLC | Personal products | ||||||||||||||||
First Lien Term Loan, LIBOR+6% (1% floor) cash due 2/10/2023 (13) | 8.40 | % | 19,500 | 19,327 | 19,500 | ||||||||||||
19,327 | 19,500 | ||||||||||||||||
Natural Resource Partners LP | Coal & consumable fuels | ||||||||||||||||
Fixed Rate Bond 10.5% cash due 3/15/2022 (11)(21) | 7,000 | 7,329 | 7,525 | ||||||||||||||
7,329 | 7,525 | ||||||||||||||||
Navicure, Inc. | Healthcare technology | ||||||||||||||||
Second Lien Term Loan, LIBOR+7.5% (1% floor) cash due 10/31/2025 (13) | 9.74 | % | 14,500 | 14,371 | 14,500 | ||||||||||||
14,371 | 14,500 | ||||||||||||||||
Numericable SFR SA | Integrated telecommunication services | ||||||||||||||||
Fixed Rate Bond 7.375% cash due 5/1/2026 (11)(21) | 5,000 | 5,116 | 5,024 | ||||||||||||||
5,116 | 5,024 | ||||||||||||||||
OmniSYS Acquisition Corporation | Diversified support services | ||||||||||||||||
100,000 Common Units in OSYS Holdings, LLC | 1,000 | 898 | |||||||||||||||
1,000 | 898 | ||||||||||||||||
Onvoy, LLC | Integrated telecommunication services | ||||||||||||||||
Second Lien Term Loan, LIBOR+10.5% (1% floor) cash due 2/10/2025 (13) | 12.89 | % | 16,750 | 16,750 | 13,479 | ||||||||||||
19,666.67 Class A Units in GTCR Onvoy Holdings, LLC | 1,967 | 166 | |||||||||||||||
13,664.73 Series 3 Class B Units in GTCR Onvoy Holdings, LLC | — | — | |||||||||||||||
18,717 | 13,645 | ||||||||||||||||
P2 Upstream Acquisition Co. | Application software | ||||||||||||||||
First Lien Revolver, LIBOR+4% (1% floor) cash due 11/1/2018 (10)(13)(21) | — | (94 | ) | ||||||||||||||
— | (94 | ) | |||||||||||||||
Pingora MSR Opportunity Fund I-A, LP | Thrift & mortgage finance | ||||||||||||||||
1.86% limited partnership interest (11)(24) | 5,343 | 4,759 | |||||||||||||||
5,343 | 4,759 | ||||||||||||||||
PLATO Learning Inc. (27) | Education services | ||||||||||||||||
Unsecured Senior PIK Note, 8.5% PIK due 12/9/2021 (23) | 2,649 | 2,434 | — | ||||||||||||||
Unsecured Junior PIK Note, 10% PIK due 12/9/2021 (23) | 12,490 | 10,227 | — | ||||||||||||||
Unsecured Revolver, 5% cash due 12/9/2021 (22) | 60 | (40 | ) | (2,124 | ) | ||||||||||||
126,127.80 Class A Common Units of Edmentum | 126 | — | |||||||||||||||
12,747 | (2,124 | ) | |||||||||||||||
See notes to Consolidated Financial Statements.
90
Oaktree Specialty Lending Corporation
Consolidated Schedule of Investments
September 30, 2018
(dollar amounts in thousands)
Portfolio Company/Type of Investment (1)(2)(5)(9)(14) | Cash Interest Rate (13) | Industry | Principal (8) | Cost | Fair Value | ||||||||||||
ProFrac Services, LLC | Industrial machinery | ||||||||||||||||
First Lien Term Loan B, LIBOR+5.75% (1% Floor) cash due 9/15/2023 (13) | 8.07 | % | $ | 18,300 | $ | 18,118 | $ | 18,209 | |||||||||
18,118 | 18,209 | ||||||||||||||||
QuorumLabs, Inc. | Application software | ||||||||||||||||
64,887,669 Junior-2 Preferred Stock | 375 | — | |||||||||||||||
375 | — | ||||||||||||||||
Refac Optical Group (26) | Specialty stores | ||||||||||||||||
First Lien Term Loan A, LIBOR+8% cash due 9/30/2018 (13)(22) | 2,242 | 2,149 | 2,241 | ||||||||||||||
First Lien Term Loan B, LIBOR+9% cash 1.75% PIK due 9/30/2018 (13)(22) | 34,994 | 33,700 | 34,994 | ||||||||||||||
First Lien Term Loan C, 12.5% cash due 9/30/2018 (22) | 3,416 | 3,308 | 3,245 | ||||||||||||||
First Lien Revolver, LIBOR+8% cash due 9/30/2018 (13)(22) | 3,520 | 3,424 | 3,520 | ||||||||||||||
1,550.9435 Shares of Common Stock in Refac Holdings, Inc. | 1 | — | |||||||||||||||
550.9435 Shares of Series A-2 Preferred Stock in Refac Holdings, Inc., 10% | 305 | — | |||||||||||||||
1,000 Shares of Series A Preferred Stock Units in Refac Holdings, Inc., 10% | 999 | — | |||||||||||||||
43,886 | 44,000 | ||||||||||||||||
Salient CRGT, Inc. | Aerospace & defense | ||||||||||||||||
First Lien Term Loan, LIBOR+5.75% (1% floor) cash due 2/28/2022 (13)(21) | 7.99 | % | 3,174 | 3,129 | 3,222 | ||||||||||||
3,129 | 3,222 | ||||||||||||||||
Scilex Pharmaceuticals Inc. | Pharmaceuticals | ||||||||||||||||
Fixed Rate Zero Coupon Bond due 8/15/2026 | 16,000 | 10,000 | 10,000 | ||||||||||||||
10,000 | 10,000 | ||||||||||||||||
Sequa Mezzanine Holdings, LLC | Aerospace & defense | ||||||||||||||||
First Lien Term Loan B, LIBOR+5% (1% Floor) cash due 11/28/2021 (13)(21) | 7.19 | % | 8,479 | 8,411 | 8,355 | ||||||||||||
Second Lien Term Loan, LIBOR+9% (1% Floor) cash due 4/28/2022 (13)(21) | 11.20 | % | 2,000 | 2,023 | 1,973 | ||||||||||||
10,434 | 10,328 | ||||||||||||||||
ShareThis, Inc. | Application software | ||||||||||||||||
345,452 Series C Preferred Stock Warrants (exercise price $3.0395) expiration date 3/4/2024 | 367 | 4 | |||||||||||||||
367 | 4 | ||||||||||||||||
Swordfish Merger Sub LLC | Auto parts & equipment | ||||||||||||||||
Second Lien Term Loan, LIBOR+6.75% (1% floor) cash due 2/2/2026 (13)(21) | 8.86 | % | 12,500 | 12,442 | 12,406 | ||||||||||||
12,442 | 12,406 | ||||||||||||||||
TerSera Therapeutics, LLC | Pharmaceuticals | ||||||||||||||||
Second Lien Term Loan, LIBOR+9.25% (1% floor) cash due 3/30/2024 (13) | 11.64 | % | 15,000 | 14,651 | 14,945 | ||||||||||||
Second Lien Incremental Term loan, LIBOR+9.25% cash due 3/30/2024 (13) | 11.59 | % | 3,281 | 3,202 | 3,269 | ||||||||||||
Second Lien Incremental Delayed Draw Term Loan, LIBOR+9.25% cash due 12/31/2018 (10)(13) | 11.59 | % | — | (12 | ) | ||||||||||||
668,879 Common Units of TerSera Holdings LLC | 1,731 | 2,626 | |||||||||||||||
19,584 | 20,828 | ||||||||||||||||
See notes to Consolidated Financial Statements.
91
Oaktree Specialty Lending Corporation
Consolidated Schedule of Investments
September 30, 2018
(dollar amounts in thousands)
Portfolio Company/Type of Investment (1)(2)(5)(9)(14) | Cash Interest Rate (13) | Industry | Principal (8) | Cost | Fair Value | ||||||||||||
Thing5, LLC | Data processing & outsourced services | ||||||||||||||||
First Lien Term Loan, LIBOR+7.5% (1% floor) cash 2% PIK due 10/11/2020 (12)(13)(22) | $ | 46,906 | $ | 46,462 | $ | 34,292 | |||||||||||
First Lien Revolver, LIBOR+7.5% (1% floor) cash due 10/11/2020 (13)(22) | 2,702 | 2,603 | 2,702 | ||||||||||||||
2,000,000 Units in T5 Investment Vehicle, LLC | 2,000 | — | |||||||||||||||
51,065 | 36,994 | ||||||||||||||||
TigerText, Inc. | Application software | ||||||||||||||||
299,110 Series B Preferred Stock Warrants (exercise price $1.3373) expiration date 12/8/2024 | 60 | 544 | |||||||||||||||
60 | 544 | ||||||||||||||||
TravelCLICK, Inc. | Data processing & outsourced services | ||||||||||||||||
Second Lien Term Loan, LIBOR+7.75% (1% floor) cash due 11/6/2021 (13) | 9.99 | % | 1,510 | 1,376 | 1,510 | ||||||||||||
1,376 | 1,510 | ||||||||||||||||
Tribe Buyer LLC | Human resource & employment services | ||||||||||||||||
First Lien Term Loan, LIBOR+4.5% (1% floor) cash due 2/16/2024 (13)(21) | 6.74 | % | 1,581 | 1,581 | 1,593 | ||||||||||||
1,581 | 1,593 | ||||||||||||||||
Truck Hero, Inc. | Auto parts & equipment | ||||||||||||||||
Second Lien Term Loan, LIBOR+8.25% (1% floor) cash due 4/21/2025 (13) | 10.46 | % | 21,500 | 21,191 | 21,715 | ||||||||||||
21,191 | 21,715 | ||||||||||||||||
UOS, LLC | Trading companies & distributors | ||||||||||||||||
First Lien Term Loan B, LIBOR+5.5% (1% floor) cash due 4/18/2023 (13)(21) | 7.74 | % | 6,847 | 6,981 | 7,009 | ||||||||||||
6,981 | 7,009 | ||||||||||||||||
Veritas US Inc. | Application software | ||||||||||||||||
First Lien Term Loan B-1, LIBOR+4.5% (1% floor) cash due 1/27/2023 (13)(21) | 6.81 | % | 34,551 | 34,902 | 33,741 | ||||||||||||
34,902 | 33,741 | ||||||||||||||||
Verra Mobility, Corp. | Data processing & outsourced services | ||||||||||||||||
Second Lien Term Loan, LIBOR+7.75% cash due 2/27/2026 (13) | 9.99 | % | 8,750 | 8,698 | 8,958 | ||||||||||||
8,698 | 8,958 | ||||||||||||||||
Verscend Holding Corp. | Healthcare technology | ||||||||||||||||
First Lien Term Loan B, LIBOR+4.50% cash due 8/27/2025 (13)(21) | 6.74 | % | 25,000 | 24,887 | 25,255 | ||||||||||||
Fixed Rate Bond 9.75% cash due 8/15/2026 (21) | 12,000 | 12,025 | 12,405 | ||||||||||||||
36,912 | 37,660 | ||||||||||||||||
Vertex Aerospace Services Corp. | Aerospace & defense | ||||||||||||||||
First Lien Term Loan B, LIBOR+4.75% cash due 6/29/2025 (13)(21) | 6.99 | % | 15,960 | 15,883 | 16,135 | ||||||||||||
15,883 | 16,135 | ||||||||||||||||
Vine Oil & Gas LP | Oil & gas exploration & production | ||||||||||||||||
First Lien Term Loan B, LIBOR+6.875% (1% floor) cash due 11/25/2021 (13)(21) | 9.12 | % | 23,000 | 22,919 | 23,173 | ||||||||||||
22,919 | 23,173 | ||||||||||||||||
Vitalyst Holdings, Inc. | IT consulting & other services | ||||||||||||||||
675 Series A Preferred Units of PCH Support Holdings, Inc., 10% | 675 | 497 | |||||||||||||||
7,500 Class A Common Stock Units of PCH Support Holdings, Inc. | 75 | — | |||||||||||||||
750 | 497 | ||||||||||||||||
See notes to Consolidated Financial Statements.
92
Oaktree Specialty Lending Corporation
Consolidated Schedule of Investments
September 30, 2018
(dollar amounts in thousands)
Portfolio Company/Type of Investment (1)(2)(5)(9)(14) | Cash Interest Rate (13) | Industry | Principal (8) | Cost | Fair Value | ||||||||||||
Weatherford International | Oil & gas equipment services | ||||||||||||||||
Fixed Rate Bond 9.875% cash due 2/15/2024 (11)(21) | $ | 12,000 | $ | 11,479 | $ | 11,790 | |||||||||||
11,479 | 11,790 | ||||||||||||||||
WeddingWire, Inc. | Internet services & infrastructure | ||||||||||||||||
Earn-out (19) | — | 70 | |||||||||||||||
— | 70 | ||||||||||||||||
Windstream Services, LLC | Integrated telecommunication services | ||||||||||||||||
Fixed Rate Bond 8.625% cash due 10/31/2025 (11)(21) | 5,000 | 4,867 | 4,825 | ||||||||||||||
4,867 | 4,825 | ||||||||||||||||
WP CPP Holdings, LLC | Aerospace & defense | ||||||||||||||||
Second Lien Term Loan, LIBOR+7.75% (1% floor) cash due 4/30/2026 (13)(21) | 10.15 | % | 15,000 | 14,855 | 15,033 | ||||||||||||
14,855 | 15,033 | ||||||||||||||||
xMatters, Inc. | Application software | ||||||||||||||||
600,000 Common Stock Warrants (exercise price $0.593333) expiration date 2/26/2025 | 709 | 287 | |||||||||||||||
709 | 287 | ||||||||||||||||
Yeti Acquisition, LLC | Leisure products | ||||||||||||||||
2,000,000 Common Stock Units of Yeti Holdings, Inc. | — | 12,073 | |||||||||||||||
— | 12,073 | ||||||||||||||||
Zep Inc. | Specialty chemicals | ||||||||||||||||
Second Lien Term Loan, LIBOR+8.25% (1% floor) cash due 8/11/2025 (13) | 10.64 | % | 30,000 | 29,870 | 28,800 | ||||||||||||
First Lien Term Loan B, LIBOR+4.00% (1% floor) cash due 8/12/2024 (13)(21) | 6.39 | % | 1,995 | 1,903 | 1,904 | ||||||||||||
31,773 | 30,704 | ||||||||||||||||
Zephyr Bidco Limited | Specialized finance | ||||||||||||||||
Second Lien Term Loan, UK LIBOR+7.50% cash due 7/23/2026 (11)(13)(21) | 8.22 | % | £ | 18,000 | 23,568 | 23,258 | |||||||||||
23,568 | 23,258 | ||||||||||||||||
Total Non-Control/Non-Affiliate Investments (150.6% of net assets) | $ | 1,392,383 | $ | 1,292,166 | |||||||||||||
Total Portfolio Investments (173.8% of net assets) | $ | 1,606,933 | $ | 1,491,201 | |||||||||||||
Cash and Cash Equivalents | |||||||||||||||||
JP Morgan Prime Money Market Fund, Institutional Shares | $ | 9,108 | $ | 9,108 | |||||||||||||
Other cash accounts | 4,272 | 4,272 | |||||||||||||||
Total Cash and Cash Equivalents (1.6% of net assets) | $ | 13,380 | $ | 13,380 | |||||||||||||
Total Portfolio Investments, Cash and Cash Equivalents (175.4% of net assets) | $ | 1,620,313 | $ | 1,504,581 | |||||||||||||
Derivative Instrument | Notional Amount to be Purchased | Notional Amount to be Sold | Maturity Date | Counterparty | Unrealized Appreciation /(Depreciation) | |||||||||||
Foreign currency forward contract | $ | 23,113 | £ | 17,579 | 10/26/2018 | J.P. Morgan | $ | 162 | ||||||||
See notes to Consolidated Financial Statements.
(1) | All debt investments are income producing unless otherwise noted. All equity investments are non-income producing unless otherwise noted. |
(2) | See Note 3 in the accompanying notes to the Consolidated Financial Statements for portfolio composition by geographic region. |
(3) | Control Investments generally are defined by the Investment Company Act of 1940, as amended ("Investment Company Act"), as investments in companies in which the Company owns more than 25% of the voting securities or maintains greater than 50% of the board representation. |
(4) | Affiliate Investments generally are defined by the Investment Company Act as investments in companies in which the Company owns between 5% and 25% of the voting securities. |
(5) | Equity ownership may be held in shares or units of companies related to the portfolio companies. |
(6) | Income producing through payment of dividends or distributions. |
(7) | Non-Control/Non-Affiliate Investments are investments that are neither Control Investments nor Affiliate Investments. |
93
Oaktree Specialty Lending Corporation
Consolidated Schedule of Investments
September 30, 2018
(dollar amounts in thousands)
(8) | Principal includes accumulated payment in kind ("PIK") interest and is net of repayments. “£” signifies the investment is denominated in British Pounds. "€" signifies the investment is denominated in Euros. All other investments are denominated in U.S. dollars. |
(9) | Interest rates may be adjusted from period to period on certain term loans and revolvers. These rate adjustments may be either temporary in nature due to tier pricing arrangements or financial or payment covenant violations in the original credit agreements or permanent in nature per loan amendment or waiver documents. |
(10) | Investment has undrawn commitments. Unamortized fees are classified as unearned income which reduces cost basis, which may result in a negative cost basis. A negative fair value may result from the unfunded commitment being valued below par. |
(11) | Investment is not a "qualifying asset" as defined under Section 55(a) of the Investment Company Act. Under the Investment Company Act, the Company may not acquire any non-qualifying asset unless, at the time the acquisition is made, qualifying assets represent at least 70% of the Company's total assets. As of September 30, 2018, qualifying assets represented 73.4% of the Company's total assets and non-qualifying assets represented 26.6% of the Company's total assets. |
(12) | The sale of a portion of this loan does not qualify for true sale accounting under Financial Accounting Standards Board ("FASB") Accounting Standards Codification ("ASC") Topic 860 - Transfers and Servicing ("ASC 860"), and therefore, the entire debt investment remains in the Consolidated Schedule of Investments. Accordingly, the fair value of the Company's debt investments as of September 30, 2018 includes $9.7 million related to the Company's secured borrowings. (See Note 14 in the accompanying notes to the Consolidated Financial Statements.) |
(13) | The interest rate on the principal balance outstanding for all floating rate loans is indexed to the London Interbank Offered Rate ("LIBOR") and/or an alternate base rate (e.g., prime rate), which typically resets semi-annually, quarterly, or monthly at the borrower's option. The borrower may also elect to have multiple interest reset periods for each loan. For each of these loans, the Company has provided the applicable margin over LIBOR or the alternate based rate based on each respective credit agreement and the cash interest rate as of period end. All LIBOR shown above is in U.S. dollars unless otherwise noted. As of September 30, 2018, the reference rates for our variable rate loans were the 30-day LIBOR at 2.24%, 60-day LIBOR at 2.29%, the 90-day LIBOR at 2.39%, the 180-day LIBOR at 2.59%, the PRIME at 5.25%, the 30-day UK LIBOR at 0.72% and the 30-day EURIBOR at (0.40)%. |
(14) | With the exception of investments held by the Company’s wholly-owned subsidiaries that each formerly held a license from the U.S. Small Business Administration (“SBA”) to operate as a small business investment company (“SBIC”), each of the Company's investments is pledged as collateral under its credit facility. |
(15) | As defined in the Investment Company Act, the Company is deemed to be both an "Affiliated Person" of and to "Control" this portfolio company as the Company owns more than 25% of the portfolio company's outstanding voting securities or has the power to exercise control over management or policies of such portfolio company (including through a management agreement). See Schedule 12-14 in the accompanying notes to the Consolidated Financial Statements for transactions during the year ended September 30, 2018 in which the issuer was both an Affiliated Person and a portfolio company that the Company is deemed to control. |
(16) | First Star Speir Aviation 1 Limited is a wholly-owned holding company formed by the Company in order to facilitate its investment strategy. In accordance with Accounting Standards Update ("ASU") 2013-08, the Company has deemed the holding company to be an investment company under accounting principles generally accepted in the United States ("GAAP") and therefore deemed it appropriate to consolidate the financial results and financial position of the holding company and to recognize dividend income versus a combination of interest income and dividend income. Accordingly, the debt and equity investments in the wholly-owned holding company are disregarded for accounting purposes since the economic substance of these instruments are equity investments in the operating entities. |
(17) | See Note 3 in the accompanying notes to the Consolidated Financial Statements for portfolio composition. |
(18) | The Class A Mezzanine Secured Deferrable Floating Rate Notes bear interest at a rate of LIBOR plus the applicable margin as defined in the indenture. The Class A Mezzanine Secured Deferrable Floating Rate Notes and Class B Mezzanine Secured Deferrable Fixed Rate Notes are collectively referred to as the "mezzanine notes". |
(19) | During the year ended September 30, 2018, the Company exited its investments in WeddingWire, Inc. ("WeddingWire") in exchange for cash and the right to receive contingent payments in the future based on the performance of WeddingWire, which is referred to as an "earn-out" in the consolidated schedule of investments. |
(20) | Payments on the Company's investment in Maverick Healthcare Group, LLC ("Maverick Healthcare") are currently past due. In May 2017, the Company entered into a forbearance agreement with Maverick Healthcare in which the Company has temporarily agreed not to take action against Maverick Healthcare. The forbearance agreement, as amended in June 2018, currently extends to March 15, 2019. |
(21) | As of September 30, 2018, these investments are categorized as Level 2 within the fair value hierarchy established by FASB ASC Topic 820, Fair Value Measurements and Disclosures ("ASC 820"). All other investments are categorized as Level 3 as of September 30, 2018 and were valued using significant unobservable inputs. |
(22) | This investment was on cash non-accrual status as of September 30, 2018. Cash non-accrual status is inclusive of PIK and other non-cash income, where applicable. |
(23) | This investment was on PIK non-accrual status as of September 30, 2018. PIK non-accrual status is inclusive of other non-cash income, where applicable. |
(24) | This investment was valued using net asset value as a practical expedient for fair value. Consistent with FASB guidance under ASC 820, these investments are excluded from the hierarchical levels. |
94
Oaktree Specialty Lending Corporation
Consolidated Schedule of Investments
September 30, 2018
(dollar amounts in thousands)
(25) | AdVenture Interactive, Corp. completed a reorganization in which it separated its marketing services business from its online program management business. In connection with the reorganization, FS AVI Holdco LLC was formed as a separate entity and is the parent company to Keypath Education, Inc., which represents the former marketing services business, and the Company's first lien term loan and revolver with AdVenture Interactive, Corp. were assigned to Keypath Education, Inc. Subsequent to the reorganization, AdVenture Interactive, Corp. holds preferred units in Keypath Education Holdings, LLC, which conducts the online program management business. Subsequent to the reorganization, the Company is not deemed to control Keypath Education Holdings, LLC under the Investment Company Act. This investment was reclassified from Control investments to Non-Control/Non-Affiliate Investments during the year ended September 30, 2018. |
(26) | Payments on the Company's investment in Refac Optical Group are currently past due. In October 2018, the Company entered into a forbearance agreement with Refac Optical Group in which the Company has temporarily agreed not to take action against Refac Optical Group. The forbearance agreement currently extends to January 9, 2019. |
(27) | This investment was renamed PLATO Learning Inc. as of September 30, 2018. Prior to September 30, 2018, this investment was previously named Edmentum, Inc. |
See notes to Consolidated Financial Statements.
95
Oaktree Specialty Lending Corporation
Consolidated Schedule of Investments
September 30, 2017
(dollar amounts in thousands)
Portfolio Company/Type of Investment (1)(2)(5)(9)(14) | Cash Interest Rate (13) | Industry | Principal (8) | Cost | Fair Value | ||||||||||||
Control Investments (3)(15) | |||||||||||||||||
AdVenture Interactive, Corp. | Advertising | ||||||||||||||||
9,073 shares of common stock | $ | 13,611 | $ | 13,818 | |||||||||||||
13,611 | 13,818 | ||||||||||||||||
Ameritox Ltd. | Healthcare services | ||||||||||||||||
First Lien Term Loan, LIBOR+5% (1% floor) cash 3% PIK due 4/11/2021 (13)(23) | 6.33 | % | $ | 38,338 | 37,539 | 4,445 | |||||||||||
14,090,126.4 Class A Preferred Units in Ameritox Holdings II, LLC | 14,090 | — | |||||||||||||||
1,602,260.83 Class B Preferred Units in Ameritox Holdings II, LLC | 1,602 | — | |||||||||||||||
4,930.03 Class A Units in Ameritox Holdings II, LLC | 29,049 | — | |||||||||||||||
82,280 | 4,445 | ||||||||||||||||
Eagle Hospital Physicians, LLC | Healthcare services | ||||||||||||||||
Earn-out (19) | 7,851 | 4,986 | |||||||||||||||
7,851 | 4,986 | ||||||||||||||||
First Star Bermuda Aviation Limited (11)(16) | Airlines | ||||||||||||||||
First Lien Term Loan, 9% cash 3% PIK due 8/19/2018 | 11,868 | 11,868 | 11,868 | ||||||||||||||
100% equity interest (6) | 2,693 | 2,323 | |||||||||||||||
14,561 | 14,191 | ||||||||||||||||
First Star Speir Aviation Limited (11)(16) | Airlines | ||||||||||||||||
First Lien Term Loan, 9% cash due 12/15/2020 | 41,395 | 34,542 | 41,395 | ||||||||||||||
100% equity interest (6) | 8,500 | 3,926 | |||||||||||||||
43,042 | 45,321 | ||||||||||||||||
Keypath Education, Inc. (20) | Advertising | ||||||||||||||||
First Lien Term Loan, LIBOR+7% (1% floor) cash due 4/3/2022 (13) | 8.33 | % | 19,960 | 19,960 | 19,960 | ||||||||||||
First Lien Revolver, LIBOR+7% (1% floor) cash due 4/3/2022 (13) | 8.33 | % | — | — | — | ||||||||||||
9,073 Class A Units in FS AVI Holdco, LLC | 10,648 | 7,918 | |||||||||||||||
30,608 | 27,878 | ||||||||||||||||
New IPT, Inc. | Oil & gas equipment services | ||||||||||||||||
First Lien Term Loan, LIBOR+5% (1% floor) cash due 3/17/2021 (13) | 6.33 | % | 4,107 | 4,107 | 4,107 | ||||||||||||
Second Lien Term Loan, LIBOR+5.1% (1% floor) cash due 9/17/2021 (13) | 6.43 | % | 2,504 | 2,504 | 2,504 | ||||||||||||
First Lien Revolver, LIBOR+5% (1% floor) cash due 3/17/2021 (13) | 6.33 | % | 1,009 | 1,009 | 1,009 | ||||||||||||
50.087 Class A Common Units in New IPT Holdings, LLC | — | 736 | |||||||||||||||
7,620 | 8,356 | ||||||||||||||||
Senior Loan Fund JV I, LLC (11)(17)(18) | Multi-sector holdings | ||||||||||||||||
Class A Mezzanine Secured Deferrable Floating Rate Notes due 2036 in SLF Repack Issuer 2016 LLC (13) | 6.88 | % | 101,030 | 101,030 | 101,030 | ||||||||||||
Class B Mezzanine Secured Deferrable Fixed Rate Notes, 15% PIK due 2036 in SLF Repack Issuer 2016 LLC | 27,641 | 27,641 | 27,641 | ||||||||||||||
87.5% LLC equity interest (6)(25) | 16,172 | 5,525 | |||||||||||||||
144,843 | 134,196 | ||||||||||||||||
Traffic Solutions Holdings, Inc. | Construction and engineering | ||||||||||||||||
First Lien Term Loan, LIBOR+7% (1% floor) cash 2% PIK due 4/1/2021 (13) | 8.34 | % | 36,567 | 36,539 | 36,568 | ||||||||||||
First Lien Revolver, LIBOR+6% (1% floor) cash due 4/1/2021 (13) | 7.34 | % | 1,250 | 1,247 | 1,250 | ||||||||||||
LC Facility, 6% cash due 4/1/2021 | 4,752 | 4,748 | 4,752 | ||||||||||||||
746,114 Series A Preferred Units, 10% | 20,029 | 7,700 | |||||||||||||||
746,114 Shares of Common Stock | 5,316 | — | |||||||||||||||
67,879 | 50,270 | ||||||||||||||||
TransTrade Operators, Inc. | Air freight & logistics | ||||||||||||||||
First Lien Term Loan, 5% cash due 12/31/2017 (23) | 15,973 | 15,574 | 1,810 | ||||||||||||||
First Lien Revolver, 8% cash due 12/31/2017 (23) | 7,757 | 7,757 | — | ||||||||||||||
596.67 Series A Common Units | — | — | |||||||||||||||
4,000 Series A Preferred Units in TransTrade Holdings LLC | 4,000 | — | |||||||||||||||
5,200,000 Series B Preferred Units in TransTrade Holdings LLC | 5,200 | — | |||||||||||||||
32,531 | 1,810 | ||||||||||||||||
Total Control Investments (35.2% of net assets) | $ | 444,826 | $ | 305,271 | |||||||||||||
See notes to Consolidated Financial Statements.
96
Oaktree Specialty Lending Corporation
Consolidated Schedule of Investments
September 30, 2017
(dollar amounts in thousands)
Portfolio Company/Type of Investment (1)(2)(5)(9)(14) | Cash Interest Rate (13) | Industry | Principal (8) | Cost | Fair Value | ||||||||||||
Affiliate Investments (4) | |||||||||||||||||
AmBath/ReBath Holdings, Inc. | Home improvement retail | ||||||||||||||||
First Lien Term Loan B, 12.5% cash 2.5% PIK due 8/31/2018 | $ | 22,955 | $ | 22,944 | $ | 22,957 | |||||||||||
4,668,788 Shares of Preferred Stock | — | 1,827 | |||||||||||||||
22,944 | 24,784 | ||||||||||||||||
Caregiver Services, Inc. | Healthcare services | ||||||||||||||||
Second Lien Term Loan, 10% cash 2% PIK due 6/30/2019 | 9,719 | 9,719 | 9,665 | ||||||||||||||
1,080,399 Shares of Series A Preferred Stock, 10% | 1,080 | 2,534 | |||||||||||||||
10,799 | 12,199 | ||||||||||||||||
Total Affiliate Investments (4.3% of net assets) | $ | 33,743 | $ | 36,983 | |||||||||||||
Non-Control/Non-Affiliate Investments (7) | |||||||||||||||||
4 Over International, LLC | Commercial printing | ||||||||||||||||
First Lien Term Loan, LIBOR+6% (1% floor) cash due 6/7/2022 (13) | 7.24 | % | 6,045 | $ | 6,001 | $ | 6,045 | ||||||||||
First Lien Revolver, LIBOR+6% (1% floor) cash due 6/7/2021 (10)(13) | 7.24 | % | (17 | ) | — | ||||||||||||
5,984 | 6,045 | ||||||||||||||||
Access Medical Acquisition, Inc. | Healthcare services | ||||||||||||||||
450,000 Shares of Class A Common Stock in CMG Holding Company, LLC (6) | 151 | 970 | |||||||||||||||
151 | 970 | ||||||||||||||||
Accudyne Industries, LLC | Oil & gas equipment services | ||||||||||||||||
First Lien Term Loan, LIBOR+3.75% (1% floor) cash due 8/18/2024 (13)(22) | 5.01 | % | 19,915 | 19,977 | 19,990 | ||||||||||||
19,977 | 19,990 | ||||||||||||||||
ACON Equity Partners III, LP | Multi-sector holdings | ||||||||||||||||
0.13% limited partnership interest (11)(25) | 785 | 962 | |||||||||||||||
785 | 962 | ||||||||||||||||
Aden & Anais Merger Sub, Inc. | Apparel, accessories & luxury goods | ||||||||||||||||
51,645 Common Units in Aden & Anais Holdings, Inc. | 5,165 | 1,241 | |||||||||||||||
5,165 | 1,241 | ||||||||||||||||
Advanced Pain Management | Healthcare services | ||||||||||||||||
First Lien Term Loan, LIBOR+8.5% (1.25% floor) cash due 2/26/2018 (13)(23) | 9.75 | % | 24,000 | 23,409 | 1,157 | ||||||||||||
23,409 | 1,157 | ||||||||||||||||
AirStrip Technologies, Inc. | Internet software & services | ||||||||||||||||
22,858.71 Series C-1 Preferred Stock Warrants (exercise price $34.99757) expiration date 5/11/2025 | 90 | — | |||||||||||||||
90 | — | ||||||||||||||||
Allied Universal Holdco LLC | Security & alarm services | ||||||||||||||||
First Lien Term Loan, LIBOR+3.75% (1% floor) cash due 7/28/2022 (13)(22) | 5.08 | % | 11,970 | 12,043 | 11,958 | ||||||||||||
Second Lien Term Loan, LIBOR+8.5% (1% floor) cash due 7/27/2023 (13)(22) | 9.81 | % | 1,149 | 1,171 | 1,145 | ||||||||||||
13,214 | 13,103 | ||||||||||||||||
Ancile Solutions, Inc. | Internet software & services | ||||||||||||||||
First Lien Term Loan, LIBOR+7% (1% floor) cash due 6/30/2021 (13) | 8.33 | % | 10,330 | 10,104 | 10,248 | ||||||||||||
10,104 | 10,248 | ||||||||||||||||
Aptean, Inc. | Internet software & services | ||||||||||||||||
Second Lien Term Loan, LIBOR+9.5% (1% floor) cash due 12/20/2023 (13) | 10.84 | % | 5,900 | 5,821 | 5,952 | ||||||||||||
5,821 | 5,952 | ||||||||||||||||
See notes to Consolidated Financial Statements.
97
Oaktree Specialty Lending Corporation
Consolidated Schedule of Investments
September 30, 2017
(dollar amounts in thousands)
Portfolio Company/Type of Investment (1)(2)(5)(9)(14) | Cash Interest Rate (13) | Industry | Principal (8) | Cost | Fair Value | ||||||||||||
Aptos, Inc. | Data processing & outsourced services | ||||||||||||||||
First Lien Term Loan B, LIBOR+6.75% (1% floor) cash due 9/1/2022 (13) | 8.08 | % | $ | 5,445 | $ | 5,354 | $ | 5,391 | |||||||||
5,354 | 5,391 | ||||||||||||||||
Argon Medical Devices, Inc. | Healthcare equipment | ||||||||||||||||
Second Lien Term Loan, LIBOR+9.5% (1% floor) cash due 6/23/2022 (13) | 10.74 | % | 43,000 | 43,000 | 43,002 | ||||||||||||
43,000 | 43,002 | ||||||||||||||||
ASHCO, LLC | Specialty stores | ||||||||||||||||
First Lien Term Loan, LIBOR+5% (1% floor) cash due 12/15/2023 (13) | 6.24 | % | 12,000 | 11,762 | 11,335 | ||||||||||||
11,762 | 11,335 | ||||||||||||||||
Baird Capital Partners V, LP | Multi-sector holdings | ||||||||||||||||
0.4% limited partnership interest (11)(25) | 994 | 601 | |||||||||||||||
994 | 601 | ||||||||||||||||
Beecken Petty O'Keefe Fund IV, L.P. | Multi-sector holdings | ||||||||||||||||
0.5% limited partnership interest (11)(25) | 1,014 | 1,310 | |||||||||||||||
1,014 | 1,310 | ||||||||||||||||
BeyondTrust Software, Inc. | Application software | ||||||||||||||||
First Lien Term Loan, LIBOR+7% (1% floor) cash due 9/25/2019 (13) | 8.33 | % | 26,677 | 26,174 | 26,676 | ||||||||||||
First Lien Revolver, LIBOR+7% (1% floor) cash due 9/25/2019 (10)(13) | 8.33 | % | (54 | ) | — | ||||||||||||
3.01% Class A membership interests in BeyondTrust Holdings LLC | 4,500 | 5,660 | |||||||||||||||
30,620 | 32,336 | ||||||||||||||||
BJ's Wholesale Club, Inc. | Hypermarkets & super centers | ||||||||||||||||
First Lien Term Loan, LIBOR+3.75% (1% floor) cash due 1/26/2024 (13)(22) | 4.99 | % | 11,970 | 11,979 | 11,504 | ||||||||||||
11,979 | 11,504 | ||||||||||||||||
BMC Acquisition, Inc. | Other diversified financial services | ||||||||||||||||
500 Series A Preferred Shares | 500 | 763 | |||||||||||||||
50,000 Common Shares (6) | 1 | 67 | |||||||||||||||
501 | 830 | ||||||||||||||||
BMC Software Finance, Inc. | Internet software & services | ||||||||||||||||
First Lien Term Loan, LIBOR+4% (1% floor) cash due 9/10/2022 (13)(22) | 5.24 | % | 16,881 | 16,999 | 16,993 | ||||||||||||
16,999 | 16,993 | ||||||||||||||||
Bunker Hill Capital II (QP), L.P. | Multi-sector holdings | ||||||||||||||||
0.51% limited partnership interest (11)(25) | 826 | 1,056 | |||||||||||||||
826 | 1,056 | ||||||||||||||||
Cablevision Systems Corp. | Integrated telecommunication services | ||||||||||||||||
Fixed Rate Bond 10.875% cash due 10/15/2025 (22) | 5,897 | 7,077 | 7,298 | ||||||||||||||
7,077 | 7,298 | ||||||||||||||||
California Pizza Kitchen, Inc. | Restaurants | ||||||||||||||||
First Lien Term Loan, LIBOR+6% (1% floor) cash due 8/23/2022 (13) | 7.24 | % | 4,950 | 4,910 | 4,917 | ||||||||||||
4,910 | 4,917 | ||||||||||||||||
CCC Information Services Inc. | Internet software & services | ||||||||||||||||
Second Lien Term Loan, LIBOR+6.75% (1% floor) cash due 3/13/2025 (13) | 7.99 | % | 2,500 | 2,559 | 2,581 | ||||||||||||
2,559 | 2,581 | ||||||||||||||||
Cenegenics, LLC | Healthcare services | ||||||||||||||||
First Lien Term Loan, 9.75% cash 2% PIK due 9/30/2019 (23) | 28,600 | 27,737 | 15,811 | ||||||||||||||
First Lien Revolver, 15% cash due 9/30/2019 (23) | 2,203 | 2,203 | 1,218 | ||||||||||||||
452,914.87 Common Units in Cenegenics, LLC | 598 | — | |||||||||||||||
345,380.141 Preferred Units in Cenegenics, LLC | 300 | — | |||||||||||||||
30,838 | 17,029 | ||||||||||||||||
98
Oaktree Specialty Lending Corporation
Consolidated Schedule of Investments
September 30, 2017
(dollar amounts in thousands)
Portfolio Company/Type of Investment (1)(2)(5)(9)(14) | Cash Interest Rate (13) | Industry | Principal (8) | Cost | Fair Value | ||||||||||||
Comprehensive Pharmacy Services LLC | Pharmaceuticals | ||||||||||||||||
20,000 Common Shares in MCP CPS Group Holdings, Inc. | $ | 2,000 | $ | 2,776 | |||||||||||||
2,000 | 2,776 | ||||||||||||||||
Conviva Inc. | Application software | ||||||||||||||||
417,851 Series D Preferred Stock Warrants (exercise price $1.1966) expiration date 2/28/2021 | 105 | 169 | |||||||||||||||
105 | 169 | ||||||||||||||||
Credit Infonet, Inc. | Data processing & outsourced services | ||||||||||||||||
Subordinated Term Loan, 12.25% cash 0.75% PIK due 10/26/2020 | $ | 13,940 | 13,940 | 13,941 | |||||||||||||
13,940 | 13,941 | ||||||||||||||||
DFT Intermediate LLC | Specialized finance | ||||||||||||||||
First Lien Term Revolver, LIBOR+5.5% (1% floor) cash due 3/1/2022 (13) | 6.74 | % | 3,300 | 3,224 | 3,278 | ||||||||||||
3,224 | 3,278 | ||||||||||||||||
DigiCert, Inc. | Internet software & services | ||||||||||||||||
Second Lien Term Loan, LIBOR+9% (1% floor) cash due 10/21/2022 (13) | 10.24 | % | 61,500 | 60,980 | 61,500 | ||||||||||||
60,980 | 61,500 | ||||||||||||||||
Dodge Data & Analytics LLC | Data processing & outsourced services | ||||||||||||||||
First Lien Term Loan, LIBOR+8.75% (1% floor) cash due 10/31/2019 (13) | 10.13 | % | 7,348 | 7,348 | 6,881 | ||||||||||||
500,000 Class A Common Units in Skyline Data, News and Analytics LLC | 500 | 202 | |||||||||||||||
7,848 | 7,083 | ||||||||||||||||
Dominion Diagnostics, LLC | Healthcare services | ||||||||||||||||
Subordinated Term Loan, 11% cash 1% PIK due 10/8/2019 (23) | 19,866 | 17,625 | 8,534 | ||||||||||||||
First Lien Term Loan, LIBOR+5% (1% floor) cash due 4/8/2019 (13) | 6.30 | % | 49,414 | 37,574 | 44,592 | ||||||||||||
First Lien Revolver, LIBOR+5% (1% floor) cash due 4/8/2019 (13) | 6.30 | % | — | — | |||||||||||||
55,199 | 53,126 | ||||||||||||||||
DTZ U.S. Borrower, LLC | Real estate services | ||||||||||||||||
First Lien Term Loan, LIBOR+3.25% (1% floor) cash due 11/4/2021 (13)(22) | 4.57 | % | 12,967 | 13,011 | 13,014 | ||||||||||||
13,011 | 13,014 | ||||||||||||||||
Edge Fitness, LLC | Leisure facilities | ||||||||||||||||
Delayed Draw Term Loan, LIBOR+7.75% (1% floor) cash due 6/30/2020 (13) | 9.05 | % | 3,398 | 3,398 | 3,397 | ||||||||||||
3,398 | 3,397 | ||||||||||||||||
Edmentum, Inc. | Education services | ||||||||||||||||
Unsecured Senior PIK Note, 8.5% PIK due 6/9/2020 | 2,434 | 2,434 | 1,922 | ||||||||||||||
Unsecured Junior PIK Note, 10% PIK due 6/9/2020 (24) | 11,304 | 10,227 | 379 | ||||||||||||||
Unsecured Revolver, 5% cash due 6/9/2020 | — | — | |||||||||||||||
126,127.80 Class A Common Units | 126 | — | |||||||||||||||
12,787 | 2,301 | ||||||||||||||||
EOS Fitness Opco Holdings, LLC | Leisure facilities | ||||||||||||||||
First Lien Term Loan, LIBOR+8.75% (0.75% floor) cash due 12/30/2019 (13) | 9.99 | % | 3,675 | 3,675 | 3,711 | ||||||||||||
First Lien Revolver, LIBOR+8.75% (0.75% floor) cash due 12/30/2019 (13) | 9.99 | % | — | 50 | |||||||||||||
487.5 Class A Preferred Units, 12% | 488 | 678 | |||||||||||||||
12,500 Class B Common Units | 13 | 463 | |||||||||||||||
4,176 | 4,902 | ||||||||||||||||
See notes to Consolidated Financial Statements.
99
Oaktree Specialty Lending Corporation
Consolidated Schedule of Investments
September 30, 2017
(dollar amounts in thousands)
Portfolio Company/Type of Investment (1)(2)(5)(9)(14) | Cash Interest Rate (13) | Industry | Principal (8) | Cost | Fair Value | ||||||||||||
Everi Payments Inc. | Casinos & gaming | ||||||||||||||||
First Lien Term Loan, LIBOR+4.5% (1% floor) cash due 5/9/2024 (13)(22) | 5.74 | % | $ | 11,970 | $ | 11,996 | $ | 12,093 | |||||||||
11,996 | 12,093 | ||||||||||||||||
ExamSoft Worldwide, Inc. | Internet software & services | ||||||||||||||||
180,707 Class C Units in ExamSoft Investor LLC | 181 | 135 | |||||||||||||||
181 | 135 | ||||||||||||||||
Garretson Firm Resolution Group, Inc. | Diversified support services | ||||||||||||||||
First Lien Revolver, PRIME+5.5% cash due 5/22/2020 (13) | 9.75 | % | 25 | 25 | 25 | ||||||||||||
4,950,000 Preferred Units in GRG Holdings, LP, 8% | 495 | 198 | |||||||||||||||
50,000 Common Units in GRG Holdings, LP | 5 | — | |||||||||||||||
525 | 223 | ||||||||||||||||
GOBP Holdings Inc. | Food retail | ||||||||||||||||
Second Lien Term Loan, LIBOR+8.25% (1% floor) cash due 10/21/2022 (13) | 9.58 | % | 4,214 | 4,176 | 4,251 | ||||||||||||
4,176 | 4,251 | ||||||||||||||||
Golden State Medical Supply, Inc. | Pharmaceuticals | ||||||||||||||||
Mezzanine Term Loan, 10% cash 2.5% PIK due 4/24/2021 | 15,001 | 15,001 | 14,835 | ||||||||||||||
15,001 | 14,835 | ||||||||||||||||
HC2 Holdings Inc. | Multi-sector holdings | ||||||||||||||||
Fixed Rate Bond 11% cash due 12/1/2019 (11)(22) | 10,500 | 10,666 | 10,631 | ||||||||||||||
10,666 | 10,631 | ||||||||||||||||
HealthEdge Software, Inc. | Application software | ||||||||||||||||
482,453 Series A-3 Preferred Stock Warrants (exercise price $1.450918) expiration date 9/30/2023 | 213 | 768 | |||||||||||||||
213 | 768 | ||||||||||||||||
Hyland Software Inc. | Internet software & services | ||||||||||||||||
Second Lien Term Loan, LIBOR+7% (1% floor) cash due 7/7/2025 (13) | 8.24 | % | 2,000 | 1,991 | 1,980 | ||||||||||||
1,991 | 1,980 | ||||||||||||||||
I Drive Safely, LLC | Education services | ||||||||||||||||
125,079 Class A Common Units of IDS Investments, LLC | 1,000 | — | |||||||||||||||
1,000 | — | ||||||||||||||||
Idera, Inc. | Internet software & services | ||||||||||||||||
First Lien Term Loan B, LIBOR+5% (1% floor) cash due 6/27/2024 (13) | 6.24 | % | 6,926 | 6,910 | 6,978 | ||||||||||||
6,910 | 6,978 | ||||||||||||||||
Impact Sales, LLC | Advertising | ||||||||||||||||
First Lien Term Loan, LIBOR+7% (1% floor) cash due 12/30/2021 (13) | 8.30 | % | 11,166 | 10,955 | 11,145 | ||||||||||||
Delayed Draw Term Loan, LIBOR+7% (1% floor) cash due 12/30/2021 (13) | 8.30 | % | 513 | 443 | 506 | ||||||||||||
11,398 | 11,651 | ||||||||||||||||
InMotion Entertainment Group, LLC | Consumer electronics | ||||||||||||||||
First Lien Term Loan A, LIBOR+7.75% (1.25% floor) cash due 10/1/2018 (13) | 9.09 | % | 12,259 | 12,223 | 12,259 | ||||||||||||
First Lien Term Loan B, LIBOR+7.75% (1.25% floor) cash due 10/1/2018 (13) | 9.09 | % | 5,344 | 5,265 | 5,344 | ||||||||||||
First Lien Revolver, LIBOR+6.25% cash due 10/1/2018 (13) | 6.25 | % | 3,904 | 3,897 | 3,904 | ||||||||||||
CapEx Line, LIBOR+7.75% (1.25% floor) cash due 10/1/2018 (13) | 9.09 | % | 797 | 789 | 797 | ||||||||||||
1,000,000 Class A Units in InMotion Entertainment Holdings, LLC | 1,000 | 1,761 | |||||||||||||||
23,174 | 24,065 | ||||||||||||||||
See notes to Consolidated Financial Statements.
100
Oaktree Specialty Lending Corporation
Consolidated Schedule of Investments
September 30, 2017
(dollar amounts in thousands)
Portfolio Company/Type of Investment (1)(2)(5)(9)(14) | Cash Interest Rate (13) | Industry | Principal (8) | Cost | Fair Value | ||||||||||||
Integral Development Corporation | Other diversified financial services | ||||||||||||||||
First Lien Term Loan, LIBOR+9.5% (1% floor) cash due 7/10/2019 (13) | 10.80 | % | $ | 11,500 | $ | 11,466 | $ | 10,815 | |||||||||
1,078,284 Common Stock Warrants (exercise price $0.9274) expiration date 7/10/2024 | 113 | — | |||||||||||||||
11,579 | 10,815 | ||||||||||||||||
Internet Pipeline, Inc. | Internet software & services | ||||||||||||||||
Incremental First Lien Term Loan, LIBOR+6.25% (1% floor) cash due 8/1/2022 (13) | 7.48 | % | 5,565 | 5,513 | 5,677 | ||||||||||||
5,513 | 5,677 | ||||||||||||||||
Janrain, Inc. | Internet software & services | ||||||||||||||||
218,008 Common Stock Warrants (exercise price $1.3761) expiration date 12/5/2024 | 45 | — | |||||||||||||||
45 | — | ||||||||||||||||
Kason Corporation | Industrial machinery | ||||||||||||||||
Mezzanine Term Loan, 11.5% cash 1.75% PIK due 10/28/2019 | 6,006 | 6,006 | 5,850 | ||||||||||||||
498.6 Class A Preferred Units in Kason Investment, LLC, 8% | 499 | 569 | |||||||||||||||
5,540 Class A Common Units in Kason Investment, LLC | 55 | — | |||||||||||||||
6,560 | 6,419 | ||||||||||||||||
Kellermeyer Bergensons Services, LLC | Diversified support services | ||||||||||||||||
Second Lien Term Loan, LIBOR+8.50% (1% floor) cash due 4/29/2022 (13) | 9.81 | % | 6,105 | 5,907 | 5,983 | ||||||||||||
5,907 | 5,983 | ||||||||||||||||
L Squared Capital Partners LLC | Multi-sector holdings | ||||||||||||||||
2% limited partnership interest (11)(25) | 2,660 | 2,660 | |||||||||||||||
2,660 | 2,660 | ||||||||||||||||
Lift Brands, Inc. | Leisure facilities | ||||||||||||||||
First Lien Term Loan, LIBOR+7.5% (1% floor) cash due 12/23/2019 (13) | 8.83 | % | 21,371 | 21,358 | 21,370 | ||||||||||||
First Lien Revolver, LIBOR+7.5% (1% floor) cash due 12/23/2019 (10)(13) | 8.83 | % | (3 | ) | (1 | ) | |||||||||||
2,000,000 Class A Common Units in Snap Investments, LLC | 2,004 | 2,922 | |||||||||||||||
23,359 | 24,291 | ||||||||||||||||
Loftware, Inc. | Internet software & services | ||||||||||||||||
Mezzanine Term Loan, 11% cash 1% PIK due 7/18/2020 | 6,198 | 6,198 | 6,198 | ||||||||||||||
300,000 Class A Common Units in RPLF Holdings, LLC | 300 | 220 | |||||||||||||||
6,498 | 6,418 | ||||||||||||||||
Long's Drugs Incorporated | Pharmaceuticals | ||||||||||||||||
Second Lien Term Loan, LIBOR+11.25% cash due 2/19/2022 (13) | 12.49 | % | 26,909 | 26,909 | 27,447 | ||||||||||||
50 Series A Preferred Shares in Long's Drugs Incorporated | 813 | 1,267 | |||||||||||||||
27,722 | 28,714 | ||||||||||||||||
LSF9 Atlantis Holdings, LLC | Computer & electronics retail | ||||||||||||||||
First Lien Term Loan, LIBOR+6% (1% floor) cash due 5/1/2023 (13) | 7.24 | % | 6,459 | 6,399 | 6,498 | ||||||||||||
6,399 | 6,498 | ||||||||||||||||
Lytx Holdings, LLC | Research & consulting services | ||||||||||||||||
3,500 Class A Units | 2,478 | 2,459 | |||||||||||||||
3,500 Class B Units | — | 559 | |||||||||||||||
2,478 | 3,018 | ||||||||||||||||
See notes to Consolidated Financial Statements.
101
Oaktree Specialty Lending Corporation
Consolidated Schedule of Investments
September 30, 2017
(dollar amounts in thousands)
Portfolio Company/Type of Investment (1)(2)(5)(9)(14) | Cash Interest Rate (13) | Industry | Principal (8) | Cost | Fair Value | ||||||||||||
Maverick Healthcare Group, LLC (21) | Healthcare equipment | ||||||||||||||||
First Lien Term Loan A, LIBOR+7.5% cash (1.75% floor) cash due 4/30/2017 (13)(23) | 9.25 | % | $ | 16,309 | $ | 16,204 | $ | 14,209 | |||||||||
First Lien Term Loan B, LIBOR+11% cash (1.75% floor) cash due 4/30/2017 (13)(23) | 12.75 | % | 41,739 | 39,110 | 14,531 | ||||||||||||
CapEx Line, LIBOR+7.75% (1.75% floor) cash due 4/30/2017 (13)(23) | 9.50 | % | 1,272 | 1,261 | 1,124 | ||||||||||||
First Lien Revolver, PRIME+6.5% cash due 4/30/2017 (13)(23) | 10.75 | % | 55 | 40 | 55 | ||||||||||||
56,615 | 29,919 | ||||||||||||||||
McAfee, LLC | Internet software & services | ||||||||||||||||
First Lien Term Loan, LIBOR+4.5% (1% floor) cash due 9/30/2024 (13) | 5.83 | % | 8,000 | 7,921 | 8,083 | ||||||||||||
7,921 | 8,083 | ||||||||||||||||
Metamorph US 3, LLC | Internet software & services | ||||||||||||||||
First Lien Term Loan, LIBOR+5.5% (1% floor) cash 2% PIK due 12/1/2020 (13)(23) | 6.74 | % | 9,969 | 9,550 | 3,816 | ||||||||||||
First Lien Revolver, LIBOR+6.5% (1% floor) cash due 12/1/2020 (10)(13)(23) | 7.74 | % | 2,205 | 2,203 | (74 | ) | |||||||||||
11,753 | 3,742 | ||||||||||||||||
MHE Intermediate Holdings, LLC | Diversified support services | ||||||||||||||||
First Lien Term Loan, LIBOR+5% (1% floor) cash due 3/8/2024 (13) | 6.33 | % | 2,993 | 2,964 | 2,993 | ||||||||||||
2,964 | 2,993 | ||||||||||||||||
Micro Holding Corp. | Internet software & services | ||||||||||||||||
First Lien Term Loan, LIBOR+3.5% (1% floor) cash due 9/15/2024 (13) | 4.82 | % | 6,000 | 5,970 | 5,978 | ||||||||||||
5,970 | 5,978 | ||||||||||||||||
Milestone Partners IV, L.P. | Multi-sector holdings | ||||||||||||||||
0.82% limited partnership interest (11)(25) | 948 | 1,527 | |||||||||||||||
948 | 1,527 | ||||||||||||||||
Ministry Brands, LLC | Internet software & services | ||||||||||||||||
First Lien Term Loan, LIBOR+5% (1% floor) cash due 12/2/2022 (13) | 6.24 | % | 3,891 | 3,857 | 3,891 | ||||||||||||
First Lien Delayed Draw Term Loan, LIBOR+5% (1% floor) cash due 12/2/2022 (13) | 6.24 | % | 1,352 | 1,336 | 1,352 | ||||||||||||
Second Lien Term Loan, LIBOR+9.25% (1% floor) cash due 6/2/2023 (13) | 10.49 | % | 7,056 | 6,964 | 7,056 | ||||||||||||
Second Lien Delayed Draw Term Loan, LIBOR+9.25% (1% floor) cash due 6/2/2023 (13) | 10.49 | % | 1,944 | 1,918 | 1,944 | ||||||||||||
First Lien Revolver LIBOR+5% (1% floor) cash due 12/2/2022 (10)(13) | 6.24 | % | (9 | ) | — | ||||||||||||
14,066 | 14,243 | ||||||||||||||||
Moelis Capital Partners Opportunity Fund I-B, LP | Multi-sector holdings | ||||||||||||||||
1.0% limited partnership interest (11)(25) | 1,045 | 1,457 | |||||||||||||||
1,045 | 1,457 | ||||||||||||||||
Motion Recruitment Partners LLC | Human resources & employment services | ||||||||||||||||
First Lien Revolver, LIBOR+6% (1% floor) cash due 2/13/2020 (10)(13) | 7.24 | % | (6 | ) | — | ||||||||||||
(6 | ) | — | |||||||||||||||
Natural Resource Partners LP | Precious metals & minerals | ||||||||||||||||
Fixed Rate Bond 10.5% cash due 3/15/2022 (11)(22) | 7,000 | 7,459 | 7,464 | ||||||||||||||
7,459 | 7,464 | ||||||||||||||||
OmniSYS Acquisition Corporation | Diversified support services | ||||||||||||||||
First Lien Term Loan, LIBOR+7.5% (1% floor) cash due 11/21/2018 (13) | 8.83 | % | 5,500 | 5,495 | 5,468 | ||||||||||||
First Lien Revolver, LIBOR+7.5% (1% floor) cash due 11/21/2018 (10)(13) | 8.83 | % | — | (15 | ) | ||||||||||||
100,000 Common Units in OSYS Holdings, LLC | 1,000 | 903 | |||||||||||||||
6,495 | 6,356 | ||||||||||||||||
See notes to Consolidated Financial Statements.
102
Oaktree Specialty Lending Corporation
Consolidated Schedule of Investments
September 30, 2017
(dollar amounts in thousands)
Portfolio Company/Type of Investment (1)(2)(5)(9)(14) | Cash Interest Rate (13) | Industry | Principal (8) | Cost | Fair Value | ||||||||||||
OnCourse Learning Corporation | Education services | ||||||||||||||||
264,312 Class A Units in CIP OCL Investments, LLC | $ | 2,726 | $ | 1,988 | |||||||||||||
2,726 | 1,988 | ||||||||||||||||
Onvoy, LLC | Integrated telecommunication services | ||||||||||||||||
Second Lien Term Loan, LIBOR+10.5% (1% floor) cash due 2/10/2025 (13) | 11.83 | % | $ | 16,750 | 16,750 | 16,704 | |||||||||||
19,666.67 Class A Units in GTCR Onvoy Holdings, LLC | 1,967 | 2,088 | |||||||||||||||
13,664.73 Series 3 Class B Units in GTCR Onvoy Holdings, LLC | — | — | |||||||||||||||
18,717 | 18,792 | ||||||||||||||||
P2 Upstream Acquisition Co. | Application software | ||||||||||||||||
First Lien Revolver, LIBOR+4% (1% floor) cash due 11/1/2018 (10)(13) | 5.33 | % | — | (238 | ) | ||||||||||||
— | (238 | ) | |||||||||||||||
Ping Identity Corporation | Internet software & services | ||||||||||||||||
First Lien Term Loan, LIBOR+9.25% (1% floor) cash due 6/30/2021 (13) | 10.49 | % | 42,500 | 41,557 | 43,176 | ||||||||||||
First Lien Revolver, LIBOR+9.25% (1% floor) cash due 6/30/2021 (10)(13) | 10.49 | % | (55 | ) | 40 | ||||||||||||
41,502 | 43,216 | ||||||||||||||||
Pingora MSR Opportunity Fund I-A, LP | Thrift & mortgage finance | ||||||||||||||||
1.86% limited partnership interest (11)(25) | 7,240 | 6,129 | |||||||||||||||
7,240 | 6,129 | ||||||||||||||||
Poseidon Merger Sub, Inc. | Advertising | ||||||||||||||||
Second Lien Term Loan, LIBOR+8.5% (1% floor) cash due 8/15/2023 (13) | 9.81 | % | 30,000 | 29,101 | 30,300 | ||||||||||||
29,101 | 30,300 | ||||||||||||||||
PowerPlan Holdings, LLC | Internet software & services | ||||||||||||||||
First Lien Term Loan, LIBOR+5.25% (1% floor) cash due 2/23/2022 (13) | 6.49 | % | 4,988 | 4,941 | 4,987 | ||||||||||||
4,941 | 4,987 | ||||||||||||||||
PSC Industrial Holdings Corp. | Diversified support services | ||||||||||||||||
Second Lien Term Loan, LIBOR+8.25% (1% floor) cash due 12/3/2021 (13) | 9.49 | % | 7,000 | 6,839 | 7,000 | ||||||||||||
6,839 | 7,000 | ||||||||||||||||
QuorumLabs, Inc. | Internet software & services | ||||||||||||||||
2,727,939 Common Stock Warrants (exercise price $0.0001) expiration date 7/8/2025 | 375 | — | |||||||||||||||
375 | — | ||||||||||||||||
RCPDirect, L.P. | Multi-sector holdings | ||||||||||||||||
0.9% limited partnership interest (11)(25) | 354 | 559 | |||||||||||||||
354 | 559 | ||||||||||||||||
RCPDirect II, LP | Multi-sector holdings | ||||||||||||||||
0.4% limited partnership interest (11)(25) | 617 | 719 | |||||||||||||||
617 | 719 | ||||||||||||||||
Refac Optical Group | Specialty stores | ||||||||||||||||
First Lien Term Loan A, LIBOR+8% cash due 9/30/2018 (13) | 9.23 | % | 4,027 | 3,997 | 4,027 | ||||||||||||
First Lien Term Loan B, LIBOR+9% cash, 1.75% PIK due 9/30/2018 (13) | 10.23 | % | 34,621 | 34,533 | 34,275 | ||||||||||||
First Lien Term Loan C, 12.5% cash due 9/30/2018 | 3,416 | 3,416 | 3,314 | ||||||||||||||
First Lien Revolver, LIBOR+8% cash due 9/30/2018 (13) | 9.23 | % | 3,520 | 3,516 | 3,520 | ||||||||||||
1,550.9435 Shares of Common Stock in Refac Holdings, Inc. | 1 | — | |||||||||||||||
550.9435 Shares of Series A-2 Preferred Stock in Refac Holdings, Inc., 10% | 305 | — | |||||||||||||||
1,000 Shares of Series A Preferred Stock Units in Refac Holdings, Inc., 10% | 999 | 397 | |||||||||||||||
46,767 | 45,533 | ||||||||||||||||
See notes to Consolidated Financial Statements.
103
Oaktree Specialty Lending Corporation
Consolidated Schedule of Investments
September 30, 2017
(dollar amounts in thousands)
Portfolio Company/Type of Investment (1)(2)(5)(9)(14) | Cash Interest Rate (13) | Industry | Principal (8) | Cost | Fair Value | ||||||||||||
Riverlake Equity Partners II, LP | Multi-sector holdings | ||||||||||||||||
1.92% limited partnership interest (11)(25) | $ | 870 | $ | 625 | |||||||||||||
870 | 625 | ||||||||||||||||
Riverside Fund IV, LP | Multi-sector holdings | ||||||||||||||||
0.34% limited partnership interest (11)(25) | 219 | 397 | |||||||||||||||
219 | 397 | ||||||||||||||||
Riverside Fund V, L.P. | Multi-sector holdings | ||||||||||||||||
0.48% limited partnership interest (11)(25) | 1,452 | 1,405 | |||||||||||||||
1,452 | 1,405 | ||||||||||||||||
Sailpoint Technologies, Inc. | Application software | ||||||||||||||||
First Lien Term Loan, LIBOR+7% (1% floor) cash due 8/16/2021 (13) | 8.33 | % | $ | 20,870 | 20,529 | 20,870 | |||||||||||
First Lien Revolver, LIBOR+7% (1% floor) cash due 8/16/2021 (10)(13) | 8.33 | % | (22 | ) | — | ||||||||||||
20,507 | 20,870 | ||||||||||||||||
Salient CRGT Inc. | IT consulting & other services | ||||||||||||||||
First Lien Term Loan, LIBOR+5.75% (1% floor) cash due 2/28/2022 (13) | 6.99 | % | 3,440 | 3,377 | 3,416 | ||||||||||||
3,377 | 3,416 | ||||||||||||||||
Schulman Associates Institutional Board Review, Inc. | Research & consulting services | ||||||||||||||||
Second Lien Term Loan, LIBOR+8% (1% floor) cash due 6/3/2021 (13) | 9.30 | % | 17,000 | 17,000 | 17,000 | ||||||||||||
17,000 | 17,000 | ||||||||||||||||
Scientific Games International, Inc. | Casinos & gaming | ||||||||||||||||
First Lien Term Loan B4, LIBOR+3.25% cash due 8/14/2024 (13)(22) | 4.58 | % | 11,368 | 11,313 | 11,402 | ||||||||||||
11,313 | 11,402 | ||||||||||||||||
ShareThis, Inc. | Internet software & services | ||||||||||||||||
345,452 Series C Preferred Stock Warrants (exercise price $3.0395) expiration date 3/4/2024 | 367 | 8 | |||||||||||||||
367 | 8 | ||||||||||||||||
SPC Partners V, L.P. | Multi-sector holdings | ||||||||||||||||
0.571% limited partnership interest (11)(25) | 1,762 | 1,857 | |||||||||||||||
1,762 | 1,857 | ||||||||||||||||
Staples, Inc. | Distributors | ||||||||||||||||
First Lien Term Loan, LIBOR+4% (1% floor) cash due 8/12/2024 (13)(22) | 5.31 | % | 10,000 | 9,976 | 9,967 | ||||||||||||
Fixed Rate Bond 8.5% cash due 9/15/2025 (22) | 5,000 | 4,988 | 4,863 | ||||||||||||||
14,964 | 14,830 | ||||||||||||||||
Sterling Capital Partners IV, L.P. | Multi-sector holdings | ||||||||||||||||
0.2% limited partnership interest (11)(25) | 1,770 | 1,297 | |||||||||||||||
1,770 | 1,297 | ||||||||||||||||
Survey Sampling International, LLC | Research & consulting services | ||||||||||||||||
Second Lien Term Loan, LIBOR+9% (1% floor) cash due 12/16/2021 (13) | 10.27 | % | 18,700 | 18,475 | 18,513 | ||||||||||||
18,475 | 18,513 | ||||||||||||||||
Systems, Inc. | Industrial machinery | ||||||||||||||||
First Lien Term Loan, LIBOR+5.25% (1% floor) cash due 3/3/2022 (13) | 6.57 | % | 8,668 | 8,553 | 8,625 | ||||||||||||
First Lien Revolver, LIBOR+5.25% (1% floor) cash due 3/3/2022 (10)(13) | 6.57 | % | (40 | ) | (40 | ) | |||||||||||
8,513 | 8,585 | ||||||||||||||||
Tailwind Capital Partners II, L.P. | Multi-sector holdings | ||||||||||||||||
0.3% limited partnership interest (11)(25) | 1,583 | 1,956 | |||||||||||||||
1,583 | 1,956 | ||||||||||||||||
See notes to Consolidated Financial Statements.
104
Oaktree Specialty Lending Corporation
Consolidated Schedule of Investments
September 30, 2017
(dollar amounts in thousands)
Portfolio Company/Type of Investment (1)(2)(5)(9)(14) | Cash Interest Rate (13) | Industry | Principal (8) | Cost | Fair Value | ||||||||||||
Teaching Strategies, LLC | Education services | ||||||||||||||||
Second Lien Term Loan, LIBOR+9.5% (1% floor) cash due 8/27/2023 (13) | 10.83 | % | $ | 33,500 | $ | 33,500 | $ | 33,964 | |||||||||
33,500 | 33,964 | ||||||||||||||||
Terraform Power Operating | Multi-utilities | ||||||||||||||||
Fixed Rate Bond 6.375% cash due 2/1/2023 (11)(22) | 6,000 | 6,201 | 6,255 | ||||||||||||||
6,201 | 6,255 | ||||||||||||||||
TerSera Therapeutics, LLC | Pharmaceuticals | ||||||||||||||||
Second Lien Term Loan, LIBOR+9.25% (1% floor) cash due 3/30/2024 (13) | 10.58 | % | 15,000 | 14,586 | 14,629 | ||||||||||||
668,879 Common Units of TerSera Holdings LLC | 1,500 | 1,816 | |||||||||||||||
16,086 | 16,445 | ||||||||||||||||
Thing5, LLC | Data processing & outsourced services | ||||||||||||||||
First Lien Term Loan, LIBOR+7.5% (1% floor) cash 2% PIK due 10/11/2020 (12)(13) | 8.83 | % | 47,530 | 47,530 | 40,900 | ||||||||||||
First Lien Revolver, LIBOR+7.5% (1% floor) cash due 10/11/2020 (13) | 8.83 | % | 1,000 | 1,000 | 1,000 | ||||||||||||
2,000,000 Units in T5 Investment Vehicle, LLC | 2,000 | — | |||||||||||||||
50,530 | 41,900 | ||||||||||||||||
TigerText, Inc. | Internet software & services | ||||||||||||||||
299,110 Series B Preferred Stock Warrants (exercise price $1.3373) expiration date 12/8/2024 | 60 | 409 | |||||||||||||||
60 | 409 | ||||||||||||||||
TravelCLICK, Inc. | Internet software & services | ||||||||||||||||
Second Lien Term Loan, LIBOR+7.75% (1% floor) cash due 11/6/2021 (13) | 8.99 | % | 2,697 | 2,475 | 2,710 | ||||||||||||
2,475 | 2,710 | ||||||||||||||||
Truck Hero, Inc. | Auto parts & equipment | ||||||||||||||||
Second Lien Term Loan, LIBOR+8.25% (1% floor) cash due 4/21/2025 (13) | 9.58 | % | 21,500 | 21,191 | 21,715 | ||||||||||||
21,191 | 21,715 | ||||||||||||||||
UOS, LLC | Trucking | ||||||||||||||||
First Lien Term Loan, LIBOR+5.5% (1% floor) cash due 4/18/2023 (13) | 6.74 | % | 6,916 | 7,081 | 7,106 | ||||||||||||
7,081 | 7,106 | ||||||||||||||||
Valet Merger Sub, Inc. | Environmental & facilities services | ||||||||||||||||
First Lien Term Loan, LIBOR+7% (1% floor) cash due 9/24/2021 (13) | 8.24 | % | 50,661 | 50,016 | 50,660 | ||||||||||||
First Lien Revolver, LIBOR+7% (1% floor) cash due 9/24/2021 (10)(13) | 8.24 | % | (115 | ) | — | ||||||||||||
49,901 | 50,660 | ||||||||||||||||
Veritas US Inc. | Internet software & services | ||||||||||||||||
First Lien Term Loan, LIBOR+4.5% (1% floor) cash due 1/27/2023 (13)(22) | 5.83 | % | 34,947 | 35,379 | 35,336 | ||||||||||||
35,379 | 35,336 | ||||||||||||||||
Virgin Media | Integrated telecommunication services | ||||||||||||||||
Fixed Rate Bond 5.5% cash due 8/15/2026 (11)(22) | 2,000 | 2,038 | 2,108 | ||||||||||||||
Fixed Rate Bond 5.25% cash due 1/15/2026 (11)(22) | 3,000 | 3,009 | 3,161 | ||||||||||||||
5,047 | 5,269 | ||||||||||||||||
Vitalyst Holdings, Inc. | IT consulting & other services | ||||||||||||||||
675 Series A Preferred Units of PCH Support Holdings, Inc., 10% | 675 | 511 | |||||||||||||||
7,500 Class A Common Stock Units of PCH Support Holdings, Inc. | 75 | — | |||||||||||||||
750 | 511 | ||||||||||||||||
See notes to Consolidated Financial Statements.
105
Oaktree Specialty Lending Corporation
Consolidated Schedule of Investments
September 30, 2017
(dollar amounts in thousands)
Portfolio Company/Type of Investment (1)(2)(5)(9)(14) | Cash Interest Rate (13) | Industry | Principal (8) | Cost | Fair Value | ||||||||||||
Webster Capital III, L.P. | Multi-sector holdings | ||||||||||||||||
0.754% limited partnership interest (11)(25) | $ | 1,020 | $ | 1,296 | |||||||||||||
1,020 | 1,296 | ||||||||||||||||
WeddingWire, Inc. | Internet software & services | ||||||||||||||||
First Lien Term Loan, LIBOR+8.5% (1% floor) cash due 2/20/2020 (13) | 9.84 | % | $ | 25,781 | 25,781 | 25,911 | |||||||||||
First Lien Revolver, LIBOR+8.5% (1% floor) cash due 2/20/2020 (13) | 9.84 | % | — | 15 | |||||||||||||
483,645 Common Shares of WeddingWire, Inc. | 1,200 | 1,607 | |||||||||||||||
26,981 | 27,533 | ||||||||||||||||
xMatters, Inc. | Internet software & services | ||||||||||||||||
600,000 Common Stock Warrants (exercise price $0.593333) expiration date 2/26/2025 | 709 | 368 | |||||||||||||||
709 | 368 | ||||||||||||||||
Yeti Acquisition, LLC | Leisure products | ||||||||||||||||
3,000,000 Common Stock Units of Yeti Holdings, Inc. | — | 5,900 | |||||||||||||||
— | 5,900 | ||||||||||||||||
Zep Inc. | Housewares & specialties | ||||||||||||||||
Second Lien Term Loan, LIBOR+8.25% (1% floor) cash due 8/11/2025 (13) | 9.48 | % | 30,000 | 29,852 | 29,775 | ||||||||||||
29,852 | 29,775 | ||||||||||||||||
Total Non-Control/Non-Affiliate Investments (138.2% of net assets) | $ | 1,279,096 | $ | 1,199,501 | |||||||||||||
Total Portfolio Investments (177.7% of net assets) | $ | 1,757,665 | $ | 1,541,755 | |||||||||||||
Cash and Cash Equivalents | |||||||||||||||||
JP Morgan Prime Money Market Fund | $ | 48,808 | $ | 48,808 | |||||||||||||
Other cash accounts | 4,210 | 4,210 | |||||||||||||||
Total Cash and Cash Equivalents (6.1% of net assets) | $ | 53,018 | $ | 53,018 | |||||||||||||
Total Portfolio Investments, Cash and Cash Equivalents (183.8% of net assets) | $ | 1,810,683 | $ | 1,594,773 | |||||||||||||
See notes to Consolidated Financial Statements.
(1) | All debt investments are income producing unless otherwise noted. All equity investments are non-income producing unless otherwise noted. |
(2) | See Note 3 in the accompanying notes to the Consolidated Financial Statements for portfolio composition by geographic region. |
(3) | Control Investments generally are defined by the Investment Company Act, as investments in companies in which the Company owns more than 25% of the voting securities or maintains greater than 50% of the board representation. |
(4) | Affiliate Investments generally are defined by the Investment Company Act as investments in companies in which the Company owns between 5% and 25% of the voting securities. |
(5) | Equity ownership may be held in shares or units of companies related to the portfolio companies. |
(6) | Income producing through payment of dividends or distributions. |
(7) | Non-Control/Non-Affiliate Investments are investments that are neither Control Investments nor Affiliate Investments. |
(8) | Principal includes accumulated PIK interest and is net of repayments. |
(9) | Interest rates may be adjusted from period to period on certain term loans and revolvers. These rate adjustments may be either temporary in nature due to tier pricing arrangements or financial or payment covenant violations in the original credit agreements or permanent in nature per loan amendment or waiver documents. |
(10) | Investment has undrawn commitments. Unamortized fees are classified as unearned income which reduces cost basis, which may result in a negative cost basis. A negative fair value may result from the unfunded commitment being valued below par. |
(11) | Investment is not a "qualifying asset" as defined under Section 55(a) of the Investment Company Act. Under the Investment Company Act, the Company may not acquire any non-qualifying asset unless, at the time the acquisition is made, qualifying assets represent at least 70% of the Company's total assets. As of September 30, 2017, qualifying assets represented 83.6% of the Company's total assets and non-qualifying assets represented 16.4% of the Company's total assets. |
(12) | The sale of a portion of this loan does not qualify for true sale accounting under ASC 860, and therefore, the entire debt investment remains in the Consolidated Schedule of Investments. Accordingly, the fair value of the Company's debt investments as of September 30, 2017 includes $13.3 million related to the Company's secured borrowings. (See Note 14 in the accompanying notes to the Consolidated Financial Statements.) |
(13) | The interest rate on the principal balance outstanding for all floating rate loans is indexed to LIBOR and/or an alternate base rate (e.g., prime rate), which typically resets semi-annually, quarterly, or monthly at the borrower's option. The borrower may also elect to have multiple interest reset |
106
Oaktree Specialty Lending Corporation
Consolidated Schedule of Investments
September 30, 2017
(dollar amounts in thousands)
periods for each loan. For each of these loans, the Company has provided the applicable margin over LIBOR or the alternate based rate based on each respective credit agreement and the cash interest rate as of period end.
(14) | With the exception of investments held by the Company’s wholly-owned subsidiaries that each held a license from the SBA to operate as a SBIC as of September 30, 2017, each of the Company's investments is pledged as collateral under one or more of its credit facilities. A single investment may be divided into parts that are individually pledged as collateral to separate credit facilities. These licenses were surrendered in January 2018 (see Note 6 in the accompanying notes to the Consolidated Financial Statements). |
(15) | As defined in the Investment Company Act, the Company is deemed to be both an "Affiliated Person" of and to "Control" this portfolio company as the Company owns more than 25% of the portfolio company's outstanding voting securities or has the power to exercise control over management or policies of such portfolio company (including through a management agreement). |
(16) | First Star Bermuda Aviation Limited and First Star Speir Aviation 1 Limited are wholly-owned holding companies formed by the Company in order to facilitate its investment strategy. In accordance with ASU 2013-08, the Company has deemed the holding companies to be investment companies under GAAP and therefore deemed it appropriate to consolidate the financial results and financial position of the holding companies and to recognize dividend income versus a combination of interest income and dividend income. Accordingly, the debt and equity investments in the wholly-owned holding companies are disregarded for accounting purposes since the economic substance of these instruments are equity investments in the operating entities. |
(17) | See Note 3 in the accompanying notes to the Consolidated Financial Statements for portfolio composition. |
(18) | In December 2016, the Company restructured its investment in Senior Loan Fund JV I, LLC. As part of the restructuring, the Company exchanged its subordinated notes for Class A Mezzanine Secured Deferrable Floating Rate Notes and Class B Mezzanine Secured Deferrable Fixed Rate Notes issued by a newly formed, wholly owned subsidiary, SLF Repack Issuer 2016 LLC. The Class A Mezzanine Secured Deferrable Floating Rate Notes bear interest at a rate of LIBOR plus the applicable margin as defined in the indenture. The Class A Mezzanine Secured Deferrable Floating Rate Notes and Class B Mezzanine Secured Deferrable Fixed Rate Notes are collectively referred to as the "mezzanine notes". |
(19) | In June 2017, the Company sold all of its investments in Eagle Physicians in exchange for cash and the right to receive contingent payments in the future based on the performance of Eagle Physicians, which is referred to as an "earn-out" in the consolidated schedule of investments. Prior to the sale of its investments in Eagle Physicians, the Company may have been deemed to control Eagle Physicians within the meaning of the Investment Company Act due to the fact that the Company owned greater than 25% of the voting securities in Eagle Physicians. After the sale and as of September 30, 2017, the Company no longer owns any of the voting securities in Eagle Physicians and was not deemed to control Eagle Physicians within the meaning of the Investment Company Act. |
(20) | In June 2017, AdVenture Interactive, Corp. completed a reorganization in which it separated its marketing services business from its online program management business. In connection with the reorganization, FS AVI Holdco LLC was formed as a separate entity and is the parent to Keypath Education, Inc., which represents the former marketing services business, and the Company's first lien term loan and revolver with AdVenture Interactive, Corp. were assigned to Keypath Education, Inc. Subsequent to the reorganization, AdVenture Interactive, Corp. holds preferred units in Keypath Education Holdings, LLC, which conducts the online program management business. The Company is not deemed to control Keypath Education Holdings, LLC under the Investment Company Act. |
(21) | The Company's investment in Maverick Healthcare is currently past due. In May 2017, the Company entered into a forbearance agreement with Maverick Healthcare in which the Company has temporarily agreed not to take action against Maverick Healthcare. |
(22) | As of September 30, 2017, these investments are categorized as Level 2 within the fair value hierarchy established by ASC 820. All other investments are categorized as Level 3 as of September 30, 2017 and were valued using significant unobservable inputs. |
(23) | This investment was on cash non-accrual status as of September 30, 2017. Cash non-accrual status is inclusive of PIK and other non-cash income, where applicable. |
(24) | This investment was on PIK non-accrual status as of September 30, 2017. PIK non-accrual status is inclusive of other non-cash income, where applicable. |
(25) | This investment was valued using net asset value as a practical expedient for fair value. Consistent with FASB guidance under ASC 820, these investments are excluded from the hierarchical levels. |
See notes to Consolidated Financial Statements.
107
OAKTREE SPECIALTY LENDING CORPORATION
NOTES TO CONSOLIDATED FINANCIAL STATEMENTS
(in thousands, except share and per share amounts, percentages and as otherwise indicated)
Note 1. Organization
Oaktree Specialty Lending Corporation (together with its consolidated subsidiaries, the "Company") is a specialty finance company that looks to provide customized, one-stop credit solutions to companies with limited access to public or syndicated capital markets. The Company was formed in late 2007 and operates as a closed-end, externally managed, non-diversified management investment company that has elected to be regulated as a Business Development Company under the Investment Company Act. The Company has qualified and elected to be treated as a regulated investment company ("RIC") under the Internal Revenue Code of 1986, as amended (the "Code"), for tax purposes.
The Company seeks to generate current income and capital appreciation by providing companies with flexible and innovative financing solutions, including first and second lien loans, unsecured and mezzanine loans and preferred equity. The Company may also seek to generate capital appreciation and income through secondary investments at discounts to par in either private or syndicated transactions.
As of October 17, 2017, the Company is externally managed by Oaktree Capital Management, L.P. (“Oaktree”), a subsidiary of Oaktree Capital Group, LLC (“OCG”), a publicly traded Delaware limited liability company listed on the New York Stock Exchange under the ticker "OAK", pursuant to an investment advisory agreement between the Company and Oaktree (the “Investment Advisory Agreement”). Oaktree Fund Administration, LLC (“Oaktree Administrator”), a subsidiary of Oaktree, provides certain administrative and other services necessary for the Company to operate pursuant to an administration agreement between the Company and Oaktree Administrator (the “Administration Agreement”). See Note 11.
Prior to October 17, 2017, the Company was externally managed by Fifth Street Management LLC (the "Former Adviser”), an indirect, partially-owned subsidiary of Fifth Street Asset Management Inc. (“FSAM”) and was named Fifth Street Finance Corp. FSC CT LLC (the "Former Administrator"), a subsidiary of the Former Adviser, also provided certain administrative and other services necessary for the Company to operate pursuant to an administration agreement (the "Former Administration Agreement").
On September 7, 2017, stockholders of the Company approved the Investment Advisory Agreement to take effect upon the closing of the transactions contemplated by the Asset Purchase Agreement (the “Purchase Agreement”), by and among Oaktree, the Former Adviser, and, for certain limited purposes, FSAM, and Fifth Street Holdings L.P., the direct, partial owner of the Former Adviser (the “Transaction”). Upon the closing of the Transaction on October 17, 2017, Oaktree became the investment adviser to each of Oaktree Strategic Income Corporation (“OCSI”) and the Company. The closing of the Transaction resulted in an assignment for purposes of the Investment Company Act of the fourth amended and restated investment advisory agreement between the Former Adviser and the Company (the "Former Investment Advisory Agreement") and, as a result, its immediate termination.
Note 2. Significant Accounting Policies
Basis of Presentation:
The Consolidated Financial Statements of the Company have been prepared in accordance with accounting principles generally accepted in the United States of America ("GAAP") and pursuant to the requirements for reporting on Form 10-K and Regulation S-X. All intercompany balances and transactions have been eliminated. Certain prior-year financial information has been reclassified to conform to current year presentation. The Company is an investment company following the accounting and reporting guidance in FASB ASC Topic 946, Financial Services - Investment Companies ("ASC 946").
Use of Estimates:
The preparation of the financial statements in conformity with GAAP requires management to make certain estimates and assumptions affecting amounts reported in the financial statements and accompanying notes. These estimates are based on the information that is currently available to the Company and on various other assumptions that the Company believes to be reasonable under the circumstances. Changes in the economic and political environments, financial markets and any other parameters used in determining these estimates could cause actual results to differ and such differences could be material. Significant estimates include the valuation of investments and revenue recognition.
Consolidation:
The accompanying Consolidated Financial Statements include the accounts of Oaktree Specialty Lending Corporation and its consolidated subsidiaries. Each consolidated subsidiary is wholly-owned and, as such, consolidated into the Consolidated Financial Statements. Certain subsidiaries that hold investments are treated as pass through entities for tax purposes. The assets of certain of the consolidated subsidiaries are not directly available to satisfy the claims of the creditors of Oaktree Specialty Lending Corporation or any of its other subsidiaries. As of September 30, 2018, the consolidated subsidiaries were Fifth Street Fund of Funds LLC ("Fund of Funds"), Fifth Street Mezzanine Partners IV, L.P. ("FSMP IV"), Fifth Street Mezzanine Partners V, L.P. ("FSMP V" and together with
108
OAKTREE SPECIALTY LENDING CORPORATION
NOTES TO CONSOLIDATED FINANCIAL STATEMENTS
(in thousands, except share and per share amounts, percentages and as otherwise indicated)
FSMP IV, the "Excluded Subsidiaries"), FSMP IV GP, LLC, FSMP V GP, LLC and FSFC Holdings, Inc. ("Holdings"). In addition, the Company consolidates various holding companies held in connection with its equity investments in certain portfolio investments.
As an investment company, portfolio investments held by the Company are not consolidated into the Consolidated Financial Statements but rather are included on the Statements of Assets and Liabilities as investments at fair value.
Fair Value Measurements:
The Company values its investments in accordance with ASC 820, which defines fair value as the amount that would be received to sell an asset or paid to transfer a liability in an orderly transaction between market participants at the measurement date. The Company is required to report its investments for which current market values are not readily available at fair value. A liability's fair value is defined as the amount that would be paid to transfer the liability to a new obligor, not the amount that would be paid to settle the liability with the creditor. ASC 820 prioritizes the use of observable market prices over entity-specific inputs. Where observable prices or inputs are not available or reliable, valuation techniques are applied. These valuation techniques involve some level of management estimation and judgment, the degree of which is dependent on the price transparency for the investments or market and the investments' complexity.
Hierarchical levels, defined by ASC 820 and directly related to the amount of subjectivity associated with the inputs to fair valuation of these assets and liabilities, are as follows:
• | Level 1 — Unadjusted, quoted prices in active markets for identical assets or liabilities as of the measurement date. |
• | Level 2 — Observable inputs other than Level 1 prices, such as quoted prices for similar assets or liabilities; quoted prices in markets that are not active; or other inputs that are observable or can be corroborated by observable market data at the measurement date for substantially the full term of the assets or liabilities. |
• | Level 3 — Unobservable inputs that reflect management's best estimate of what market participants would use in pricing the asset or liability at the measurement date. Consideration is given to the risk inherent in the valuation technique and the risk inherent in the inputs to the model. |
If inputs used to measure fair value fall into different levels of the fair value hierarchy, an investment's level is based on the lowest level of input that is significant to the fair value measurement. The Company's assessment of the significance of a particular input to the fair value measurement in its entirety requires judgment, and considers factors specific to the investment. This includes investment securities that are valued using "bid" and "ask" prices obtained from independent third party pricing services or directly from brokers. These investments may be classified as Level 3 because the quoted prices may be indicative in nature for securities that are in an inactive market, may be for similar securities or may require adjustments for investment-specific factors or restrictions.
Financial instruments with readily available quoted prices generally will have a higher degree of market price observability and a lesser degree of judgment inherent in measuring fair value. As such, Oaktree obtains and analyzes readily available market quotations provided by pricing vendors and brokers for all of the Company's investments for which quotations are available. In determining the fair value of a particular investment, pricing vendors and brokers use observable market information, including both binding and non-binding indicative quotations.
The Company seeks to obtain at least two quotations for the subject or similar securities, typically from pricing vendors. If the Company is unable to obtain two quotes from pricing vendors, or if the prices obtained from pricing vendors are not within the Company's set threshold, the Company seeks to obtain a quote directly from a broker making a market for the asset. Oaktree evaluates the quotations provided by pricing vendors and brokers based on available market information, including trading activity of the subject or similar securities, or by performing a comparable security analysis to ensure that fair values are reasonably estimated. Oaktree also performs back-testing of valuation information obtained from pricing vendors and brokers against actual prices received in transactions. In addition to ongoing monitoring and back-testing, Oaktree performs due diligence procedures over pricing vendors to understand their methodology and controls to support their use in the valuation process. Generally, the Company does not adjust any of the prices received from these sources.
If the quotations obtained from pricing vendors or brokers are determined to not be reliable or are not readily available, the Company values such investments using any of three different valuation techniques. The first valuation technique is the transaction precedent technique, which utilizes recent or expected future transactions of the investment to determine fair value, to the extent applicable. The second valuation technique is an analysis of the enterprise value ("EV") of the portfolio company. EV means the entire value of the portfolio company to a market participant, including the sum of the values of debt and equity securities used to capitalize the enterprise at a point in time. The EV analysis is typically performed to determine (i) the value of equity investments, (ii) whether there is credit impairment for debt investments and (iii) the value for debt investments that the Company is deemed to control under the Investment Company Act. To estimate the EV of a portfolio company, Oaktree analyzes various factors, including the portfolio company’s historical and projected financial results, macroeconomic impacts on the company, and competitive dynamics in the
109
OAKTREE SPECIALTY LENDING CORPORATION
NOTES TO CONSOLIDATED FINANCIAL STATEMENTS
(in thousands, except share and per share amounts, percentages and as otherwise indicated)
company’s industry. Oaktree also utilizes some or all of the following information based on the individual circumstances of the portfolio company: (i) valuations of comparable public companies, (ii) recent sales of private and public comparable companies in similar industries or having similar business or earnings characteristics, (iii) purchase price multiples as a multiple of their earnings or cash flow, (iv) the portfolio company’s ability to meet its forecasts and its business prospects, (v) a discounted cash flow analysis, (vi) estimated liquidation or collateral value of the portfolio company's assets and (vii) offers from third parties to buy the portfolio company. The Company may probability weight potential sale outcomes with respect to a portfolio company when uncertainty exists as of the valuation date. The third valuation technique is a market yield technique, which is typically performed for non-credit impaired debt investments. In the market yield technique, a current price is imputed for the investment based upon an assessment of the expected market yield for a similarly structured investment with a similar level of risk, and the Company considers the current contractual interest rate, the capital structure and other terms of the investment relative to risk of the company and the specific investment. A key determinant of risk, among other things, is the leverage through the investment relative to the EV of the portfolio company. As debt investments held by the Company are substantially illiquid with no active transaction market, the Company depends on primary market data, including newly funded transactions and industry specific market movements, as well as secondary market data with respect to high yield debt instruments and syndicated loans, as inputs in determining the appropriate market yield, as applicable.
In accordance with ASC 820-10, certain investments that qualify as investment companies in accordance with ASC 946 may be valued using net asset value as a practical expedient for fair value. Consistent with FASB guidance under ASC 820, these investments are excluded from the hierarchical levels.
The Company estimates the fair value of privately held warrants using a Black Scholes pricing model, which includes an analysis of various factors and subjective assumptions, including the current stock price (by using an EV analysis as described above), the expected period until exercise, expected volatility of the underlying stock price, expected dividends and the risk free rate. Changes in the subjective input assumptions can materially affect the fair value estimates.
The Company's Board of Directors undertakes a multi-step valuation process each quarter in connection with determining the fair value of the Company's investments:
• | The quarterly valuation process begins with each portfolio company or investment being initially valued by Oaktree's valuation team in conjunction with Oaktree's portfolio management team and investment professionals responsible for each portfolio investment; |
•Preliminary valuations are then reviewed and discussed with management of Oaktree;
• | Separately, independent valuation firms engaged by the Board of Directors prepare valuations of the Company's investments, on a selected basis, for which market quotations are not readily available or are readily available but deemed not reflective of the fair value of the investment, and submit the reports to the Company and provide such reports to Oaktree and the Audit Committee of the Board of Directors; |
• | Oaktree compares and contrasts its preliminary valuations to the valuations of the independent valuation firms and prepares a valuation report for the Audit Committee; |
• | The Audit Committee reviews the preliminary valuations with Oaktree, and Oaktree responds and supplements the preliminary valuations to reflect any discussions between Oaktree and the Audit Committee; |
• | The Audit Committee makes a recommendation to the full Board of Directors regarding the fair value of the investments in the Company's portfolio; and |
• | The Board of Directors discusses valuations and determines the fair value of each investment in the Company's portfolio. |
The fair value of the Company's investments as of September 30, 2018 and September 30, 2017 was determined in good faith by the Board of Directors. The Board of Directors has and will continue to engage independent valuation firms to provide assistance regarding the determination of the fair value of a portion of the Company's portfolio securities for which market quotations are not readily available or are readily available but deemed not reflective of the fair value of the investment each quarter, and the Board of Directors may reasonably rely on that assistance. However, the Board of Directors is responsible for the ultimate valuation of the portfolio investments at fair value as determined in good faith pursuant to the Company's valuation policy and a consistently applied valuation process.
With the exception of the line items entitled "deferred financing costs," "other assets," "deferred tax liability," "credit facilities payable" and "unsecured notes payable," which are reported at amortized cost, all assets and liabilities approximate fair value on the Consolidated Statement of Assets and Liabilities. The carrying value of the line items titled "interest, dividends and fees receivable," "due from portfolio companies," "receivables from unsettled transactions," "accounts payable, accrued expenses and other liabilities," "base management fee and Part I incentive fee payable," "due to affiliate," "interest payable," "amounts payable to syndication partners," "director fees payable" and "payables from unsettled transactions" approximate fair value due to their short maturities.
110
OAKTREE SPECIALTY LENDING CORPORATION
NOTES TO CONSOLIDATED FINANCIAL STATEMENTS
(in thousands, except share and per share amounts, percentages and as otherwise indicated)
Foreign Currency Translation
The accounting records of the Company are maintained in U.S. dollars. All assets and liabilities denominated in foreign currencies are translated into U.S. dollars based on the prevailing foreign exchange rate on the reporting date. The Company does not isolate that portion of the results of operations resulting from changes in foreign exchange rates on investments and investment related assets and liabilities from the fluctuations arising from changes in market prices of securities held. The Company’s investments in foreign securities may involve certain risks, including foreign exchange restrictions, expropriation, taxation or other political, social or economic risks, all of which could affect the market and/or credit risk of the investment. In addition, changes in the relationship of foreign currencies to the U.S. dollar can significantly affect the value of these investments and therefore the earnings of the Company.
Derivative Instruments
The Company does not utilize hedge accounting and as such values its derivative instruments at fair value with the unrealized gains or losses recorded in “net unrealized appreciation (depreciation) on investments and foreign currency” in the Company’s Consolidated Statement of Operations.
Investment Income:
Interest Income
Interest income, adjusted for accretion of original issue discount ("OID"), is recorded on an accrual basis to the extent that such amounts are expected to be collected. The Company stops accruing interest on investments when it is determined that interest is no longer collectible. Investments that are expected to pay regularly scheduled interest in cash are generally placed on non-accrual status when there is reasonable doubt that principal or interest cash payments will be collected. Cash interest payments received on investments may be recognized as income or a return of capital depending upon management’s judgment. A non-accrual investment is restored to accrual status if past due principal and interest are paid in cash, and the portfolio company, in management’s judgment, is likely to continue timely payment of its remaining obligations.
In connection with its investment in a portfolio company, the Company sometimes receives nominal cost equity that is valued as part of the negotiation process with the portfolio company. When the Company receives nominal cost equity, the Company allocates its cost basis in the investment between debt securities and the nominal cost equity at the time of origination. Any resulting discount from recording the loan, or otherwise purchasing a security at a discount, is accreted into interest income over the life of the loan.
For the Company's secured borrowings, the interest earned on the entire loan balance is recorded within interest income and the interest earned by the buyer from the partial loan sales is recorded within interest expense in the Consolidated Statements of Operations.
PIK Interest Income
The Company's investments in debt securities may contain PIK interest provisions. PIK interest, which represents contractually deferred interest added to the loan balance that is generally due at the end of the loan term, is generally recorded on the accrual basis to the extent such amounts are expected to be collected. The Company generally ceases accruing PIK interest if there is insufficient value to support the accrual or if the Company does not expect the portfolio company to be able to pay all principal and interest due. The Company's decision to cease accruing PIK interest involves subjective judgments and determinations based on available information about a particular portfolio company, including whether the portfolio company is current with respect to its payment of principal and interest on its loans and debt securities; financial statements and financial projections for the portfolio company; the Company's assessment of the portfolio company's business development success; information obtained by the Company in connection with periodic formal update interviews with the portfolio company's management and, if appropriate, the private equity sponsor; and information about the general economic and market conditions in which the portfolio company operates. Based on this and other information, the Company determines whether to cease accruing PIK interest on a loan or debt security. The Company's determination to cease accruing PIK interest is generally made well before the Company's full write-down of a loan or debt security. In addition, if it is subsequently determined that the Company will not be able to collect any previously accrued PIK interest, the fair value of the loans or debt securities would be reduced by the amount of such previously accrued, but uncollectible, PIK interest. The accrual of PIK interest on the Company’s debt investments increases the recorded cost bases of these investments in the Consolidated Financial Statements and, as a result, increases the cost bases of these investments for purposes of computing the capital gain incentive fee payable by the Company to Oaktree beginning in the fiscal year ending September 30, 2019. To maintain its status as a RIC, certain income from PIK interest may be required to be distributed to the Company’s stockholders, even though the Company has not yet collected the cash and may never do so.
111
OAKTREE SPECIALTY LENDING CORPORATION
NOTES TO CONSOLIDATED FINANCIAL STATEMENTS
(in thousands, except share and per share amounts, percentages and as otherwise indicated)
Fee Income
The Company receives a variety of fees in the ordinary course of business, including servicing, advisory, amendment, structuring and prepayment fees, which are classified as fee income and recognized as they are earned.
The Company may structure exit fees across certain of its portfolio investments to be received upon the future exit of those investments. These fees are typically paid to the Company upon the earliest to occur of (i) a sale of the borrower or substantially all of its assets of the borrower, (ii) the maturity date of the loan or (iii) the date when full prepayment of the loan occurs. The receipt of such fees is contingent upon the occurrence of one of the events listed above for each of the investments. A percentage of these fees is included in net investment income over the life of the loan.
Dividend Income
The Company generally recognizes dividend income on the ex-dividend date. Distributions received from equity investments are evaluated to determine if the distribution should be recorded as dividend income or a return of capital. Generally, the Company will not record distributions from equity investments as dividend income unless there are sufficient earnings at the portfolio company prior to the distribution. Distributions that are classified as a return of capital are recorded as a reduction in the cost basis of the investment.
Cash and Cash Equivalents and Restricted Cash:
Cash and cash equivalents and restricted cash consist of demand deposits and highly liquid investments with maturities of three months or less when acquired. The Company places its cash and cash equivalents and restricted cash with financial institutions and, at times, cash held in bank accounts may exceed the Federal Deposit Insurance Corporation ("FDIC") insurance limit. Cash and cash equivalents are classified as Level 1 assets and are included on the Company's Consolidated Schedule of Investments.
As of September 30, 2017, included in cash and cash equivalents was $25.2 million held in bank accounts of the Excluded Subsidiaries. These cash and cash equivalents were permitted only for certain uses, including funding operating expenses of the Excluded Subsidiaries. This cash was not permitted to be used to fund the Company's investments that were held outside the Excluded Subsidiaries or for other corporate purposes of the Company. As of September 30, 2018, there were no cash and cash equivalents held in bank accounts of the Excluded Subsidiaries.
As of September 30, 2017, included in restricted cash was $6.8 million that was held at U.S. Bank, National Association in connection with the Company's Sumitomo Facility (as defined in Note 6). The Company was restricted in terms of access to this cash until the occurrence of the periodic distribution dates and, in connection therewith, the Company’s submission of its required periodic reporting schedules and verifications of the Company’s compliance with the terms of the credit agreement.
Due from Portfolio Companies:
Due from portfolio companies consists of amounts payable to the Company from its portfolio companies, including proceeds from the sale of portfolio companies not yet received or being held in escrow, and excluding those amounts attributable to interest, dividends or fees receivable. These amounts are recognized as they become payable to the Company (e.g., principal payments on the scheduled amortization payment date).
Receivables/Payables From Unsettled Transactions:
Receivables/payables from unsettled transactions consists of amounts receivable to or payable by the Company for transactions that have not settled at the reporting date.
Deferred Financing Costs:
Deferred financing costs consist of fees and expenses paid in connection with the closing or amending of credit facilities and debt offerings. Deferred financing costs in connection with credit facilities are capitalized as an asset at the time of payment. Deferred financing costs in connection with all other debt arrangements are a direct deduction from the related debt liability at the time of payment. Deferred financing costs are amortized using the effective interest method over the terms of the respective debt arrangement. This amortization expense is included in interest expense in the Company's Consolidated Statements of Operations. Upon early termination or modification of a credit facility, all or a portion of unamortized fees related to such facility may be accelerated into interest expense.
112
OAKTREE SPECIALTY LENDING CORPORATION
NOTES TO CONSOLIDATED FINANCIAL STATEMENTS
(in thousands, except share and per share amounts, percentages and as otherwise indicated)
Income Taxes:
The Company has elected to be subject to tax as a RIC under Subchapter M of the Code and operates in a manner so as to qualify for the tax treatment applicable to RICs. In order to be subject to tax as a RIC, among other things, the Company is required to meet certain source of income and asset diversification requirements and timely distribute dividends to its stockholders of an amount generally at least equal to 90% of investment company taxable income, as defined by the Code and determined without regard to any deduction for dividends paid, for each taxable year. As a RIC, the Company is not subject to federal income tax on the portion of its taxable income and gains distributed currently to stockholders as a dividend. Depending on the level of taxable income earned during a taxable year, the Company may choose to retain taxable income in excess of current year dividend distributions and would distribute such taxable income in the next taxable year. The Company would then incur a 4% excise tax on such income, as required. To the extent that the Company determines that its estimated current year annual taxable income, determined on a calendar year basis, could exceed estimated current calendar year dividend distributions, the Company accrues excise tax, if any, on estimated excess taxable income as taxable income is earned. The Company anticipates timely distribution of its taxable income within the tax rules under Subchapter M of the Code. The Company did not incur a U.S. federal excise tax for calendar years 2016 and 2017 and does not expect to incur a U.S. federal excise tax for calendar year 2018.
The Company holds certain portfolio investments through taxable subsidiaries, including Fund of Funds and Holdings. The purpose of the Company's taxable subsidiaries is to permit the Company to hold equity investments in portfolio companies which are "pass through" entities for U.S. federal income tax purposes in order to comply with the RIC tax requirements. The taxable subsidiaries are consolidated for financial reporting purposes, and portfolio investments held by them are included in the Company’s Consolidated Financial Statements as portfolio investments and recorded at fair value. The taxable subsidiaries are not consolidated with the Company for U.S. federal income tax purposes and may generate income tax expense, or benefit, and the related tax assets and liabilities, as a result of their ownership of certain portfolio investments. This income tax expense, if any, would be reflected in the Company's Consolidated Statements of Operations. The Company uses the liability method to account for its taxable subsidiaries' income taxes. Using this method, the Company recognizes deferred tax assets and liabilities for the estimated future tax effects attributable to temporary differences between financial reporting and tax bases of assets and liabilities. In addition, the Company recognizes deferred tax benefits associated with net operating loss carry forwards that it may use to offset future tax obligations. The Company measures deferred tax assets and liabilities using the enacted tax rates expected to apply to taxable income in the years in which it expects to recover or settle those temporary differences.
FASB ASC Topic 740, Accounting for Uncertainty in Income Taxes ("ASC 740"), provides guidance for how uncertain tax positions should be recognized, measured, presented, and disclosed in the Company's Consolidated Financial Statements. ASC 740 requires the evaluation of tax positions taken or expected to be taken in the course of preparing the Company's tax returns to determine whether the tax positions are "more-likely-than-not" of being sustained by the applicable tax authority. Tax positions not deemed to meet the more-likely-than-not threshold are recorded as a tax benefit or expense in the current year. Management's determinations regarding ASC 740 may be subject to review and adjustment at a later date based upon factors including an ongoing analysis of tax laws, regulations and interpretations thereof. The Company recognizes the tax benefits of uncertain tax positions only where the position is "more-likely-than-not" to be sustained assuming examination by tax authorities. Management has analyzed the Company's tax positions and has concluded that no liability for unrecognized tax benefits should be recorded related to uncertain tax positions taken on returns filed for open tax years 2015, 2016 or 2017. The Company identifies its major tax jurisdictions as U.S. Federal and California, and the Company is not aware of any tax positions for which it is reasonably possible that the total amounts of unrecognized tax benefits will change materially in the next 12 months.
Secured Borrowings:
The Company follows the guidance in ASC 860 when accounting for loan participations and other partial loan sales. Such guidance provides accounting and reporting standards for transfers and servicing of financial assets and requires a participation or other partial loan sales to meet the definition of a "participating interest," as defined in the guidance, in order for sale treatment to be allowed. Participations or other partial loan sales which do not meet the definition of a participating interest or which are not eligible for sale accounting remain on the Company's Consolidated Statements of Assets and Liabilities and the proceeds are recorded as a secured borrowing until the definition is met. Secured borrowings are carried at fair value to correspond with the related investments, which are carried at fair value. See Note 14 for additional information.
Amounts Payable to Syndication Partners:
The Company acts as administrative agent for certain loans it originates and then syndicates. As administrative agent, the Company receives interest, principal and/or other payments from borrowers that is redistributed to syndication partners. If not redistributed by the reporting date, such amounts are classified in restricted cash and a payable is recorded to syndication partners on the Consolidated Statements of Assets and Liabilities.
113
OAKTREE SPECIALTY LENDING CORPORATION
NOTES TO CONSOLIDATED FINANCIAL STATEMENTS
(in thousands, except share and per share amounts, percentages and as otherwise indicated)
Fair Value Option:
The Company adopted certain principles under FASB ASC Topic 825, Financial Instruments – Fair Value Option ("ASC 825"), and elected the fair value option for its secured borrowings, which had a cost basis of $12.3 million and $13.5 million in the aggregate as of each of September 30, 2018 and September 30, 2017, respectively. The Company believes that by electing the fair value option for these financial instruments, it provides consistent measurement of the assets and liabilities which relate to the partial loan sales mentioned above.
Recent Accounting Pronouncements:
In May 2014, the FASB issued ASU 2014-09, Revenue from Contracts with Customers ("ASU 2014-09"), which requires an entity to recognize the amount of revenue to which it expects to be entitled for the transfer of promised goods or services to customers. ASU 2014-09 will replace most existing revenue recognition guidance in GAAP when it becomes effective. In March 2016, the FASB issued ASU 2016-08, Revenue from Contracts with Customers (Topic 606) - Principal versus Agent Considerations. This ASU is intended to clarify revenue recognition accounting when a third party is involved in providing goods or services to a customer. In April 2016, the FASB issued ASU 2016-10, Revenue from Contracts with Customers (Topic 606) - Identifying Performance Obligations and Licensing. This ASU is intended to clarify two aspects of Topic 606: identifying performance obligations and licensing implementation guidance. In May 2016, the FASB issued ASU 2016-12, Revenue from Contracts with Customers (Topic 606) - Narrow-Scope Improvements and Practical Expedients. This ASU amends certain aspects of ASU 2014-09, addresses certain implementation issues identified and clarifies the new revenue standards’ core revenue recognition principles. The new standards will be effective for the Company on October 1, 2018 and early adoption is permitted. The Company did not early adopt the new guidance during the year ended September 30, 2018. The standard permits the use of either the retrospective or cumulative effect transition method. The majority of Company's revenues is accounted for under FASB ASC Topic 320, Investments - Debt and Equity Securities, which is excluded from this standard. The application of this guidance is not expected to have a material impact on the Company’s Consolidated Financial Statements.
In November 2016, the FASB issued ASU 2016-18, Statement of Cash Flows (Topic 230) which requires that a statement of cash flows explain the change during the period in the total of cash, cash equivalents, and amounts generally described as restricted cash or restricted cash equivalents. Therefore, amounts generally described as restricted cash and restricted cash equivalents should be included within cash and cash equivalents when reconciling the beginning-of-period and end-of-period total amounts shown on the statement of cash flows. The new guidance is effective for fiscal years beginning after December 15, 2017, including interim periods therein, and early adoption is permitted. The amendment should be adopted retrospectively. The Company did not early adopt the new guidance during the year ended September 30, 2018. The new guidance is not expected to have a material effect on the Company's Consolidated Financial Statements other than a change in presentation of individual line items on the Consolidated Statement of Cash Flows.
In August 2018, the FASB issued ASU 2018-13, Disclosure Framework – Changes to the Disclosure Requirements for Fair Value Measurement, which changes the fair value disclosure requirements. The new guidance includes new, eliminated and modified fair value disclosures. Among other requirements, the guidance requires disclosure of the range and weighted average of the significant unobservable inputs for Level 3 fair value measurements and the way it is calculated. The guidance also eliminated the following disclosures: (i) amount and reason for transfers between Level 1 and Level 2, (ii) policy for timing of transfers between levels of the fair value hierarchy and (iii) valuation processes for Level 3 fair value measurement. The guidance is effective for all entities for interim and annual periods beginning after December 15, 2019. Early adoption is permitted upon issuance of the guidance. The adoption of this guidance is not expected to have a material effect on the Company’s Consolidated Financial Statements.
In August 2018, the SEC adopted amendments to certain disclosure requirements intended to eliminate redundant, duplicative, overlapping, outdated, or superseded, in light of other SEC disclosure requirements, US GAAP requirements, or changes in the information environment in its Disclosure Update and Simplification release (the “DUS Release”). In part, the DUS Release requires an investment company to present distributable earnings in total, rather than showing the three components of distributable earnings. The compliance date for the DUS Release was for all filings on or after November 5, 2018. The Company has adopted the DUS Release on November 5, 2018, which did not have a material impact on the Company’s Consolidated Financial Statements.
114
OAKTREE SPECIALTY LENDING CORPORATION
NOTES TO CONSOLIDATED FINANCIAL STATEMENTS
(in thousands, except share and per share amounts, percentages and as otherwise indicated)
Note 3. Portfolio Investments
As of September 30, 2018, 173.8% of net assets at fair value, or $1.5 billion, was invested in 113 portfolio companies, including the Company's investment in Class A mezzanine secured deferrable floating rate notes, Class B mezzanine secured deferrable fixed rate notes and limited liability company ("LLC") equity interests in Senior Loan Fund JV I, LLC (together with its consolidated subsidiaries, "SLF JV I"), which had a fair value of $99.8 million, $29.5 million and $0.0 million, respectively. As of September 30, 2018, 1.6% of net assets at fair value, or $13.5 million, was invested in cash and cash equivalents (including restricted cash). In comparison, as of September 30, 2017, 177.7% of net assets at fair value, or $1.5 billion, was invested in 125 portfolio investments, including the Company's investment in Class A mezzanine secured deferrable floating rate notes, Class B mezzanine secured deferrable fixed rate notes and LLC equity interests in SLF JV I, which had a fair value of $101.0 million, $27.6 million and $5.5 million, respectively, and 6.9% of net assets at fair value, or $59.9 million, was invested in cash and cash equivalents (including restricted cash). As of September 30, 2018, 75.4% of the Company's portfolio at fair value consisted of senior secured debt investments and 19.6% consisted of subordinated notes, including debt investments in SLF JV I. As of September 30, 2017, 78.0% of the Company's portfolio at fair value consisted of senior secured debt investments and 14.4% consisted of subordinated notes, including debt investments in SLF JV I.
The Company also held equity investments in certain of its portfolio companies consisting of common stock, preferred stock, warrants, limited partnership interests or LLC equity interests. These instruments generally do not produce a current return but are held for potential investment appreciation and capital gain.
During the years ended September 30, 2018, 2017 and 2016, the Company recorded net realized losses on investments, secured borrowings and foreign currency of $115.1 million, $171.8 million and $125.3 million, respectively. During the years ended September 30, 2018, 2017 and 2016, the Company recorded net unrealized appreciation (depreciation) on investments, secured borrowings and foreign currency of $102.6 million, $(97.8) million and $(48.0) million, respectively.
The composition of the Company's investments as of September 30, 2018 and September 30, 2017 at cost and fair value was as follows:
September 30, 2018 | September 30, 2017 | |||||||||||||||
Cost | Fair Value | Cost | Fair Value | |||||||||||||
Investments in debt securities | $ | 1,390,672 | $ | 1,287,958 | $ | 1,426,301 | $ | 1,296,138 | ||||||||
Investments in equity securities | 70,756 | 73,869 | 186,521 | 111,421 | ||||||||||||
Debt investments in SLF JV I | 129,333 | 129,333 | 128,671 | 128,671 | ||||||||||||
Equity investment in SLF JV I | 16,172 | 41 | 16,172 | 5,525 | ||||||||||||
Total | $ | 1,606,933 | $ | 1,491,201 | $ | 1,757,665 | $ | 1,541,755 | ||||||||
The composition of the Company's debt investments as of September 30, 2018 and September 30, 2017 at fixed rates and floating rates was as follows:
September 30, 2018 | September 30, 2017 | |||||||||||||
Fair Value | % of Debt Portfolio | Fair Value | % of Debt Portfolio | |||||||||||
Fixed rate debt securities, including debt investments in SLF JV I | $ | 237,718 | 16.77 | % | $ | 233,869 | 16.41 | % | ||||||
Floating rate debt securities, including debt investments in SLF JV I | 1,179,573 | 83.23 | 1,190,940 | 83.59 | ||||||||||
Total | $ | 1,417,291 | 100.00 | % | $ | 1,424,809 | 100.00 | % | ||||||
115
OAKTREE SPECIALTY LENDING CORPORATION
NOTES TO CONSOLIDATED FINANCIAL STATEMENTS
(in thousands, except share and per share amounts, percentages and as otherwise indicated)
The following table presents the financial instruments carried at fair value as of September 30, 2018 on the Company's Consolidated Statement of Assets and Liabilities for each of the three levels of hierarchy established by ASC 820:
Level 1 | Level 2 | Level 3 | Measured at Net Asset Value (a) | Total | ||||||||||||||||
Investments in debt securities (senior secured) | $ | — | $ | 485,436 | $ | 638,971 | $ | — | $ | 1,124,407 | ||||||||||
Investments in debt securities (subordinated, including debt investments in SLF JV I) | — | 134,025 | 158,859 | — | 292,884 | |||||||||||||||
Investments in equity securities (preferred) | — | — | 4,918 | — | 4,918 | |||||||||||||||
Investments in equity securities (common and warrants, including LLC equity interests of SLF JV I) | — | — | 61,134 | 7,858 | 68,992 | |||||||||||||||
Total investments at fair value | — | 619,461 | 863,882 | 7,858 | 1,491,201 | |||||||||||||||
Cash equivalents | 9,108 | — | — | — | 9,108 | |||||||||||||||
Derivative asset | — | 162 | — | — | 162 | |||||||||||||||
Total assets at fair value | $ | 9,108 | $ | 619,623 | $ | 863,882 | $ | 7,858 | $ | 1,500,471 | ||||||||||
Secured borrowings | — | — | 9,728 | — | 9,728 | |||||||||||||||
Total liabilities at fair value | $ | — | $ | — | $ | 9,728 | $ | — | $ | 9,728 | ||||||||||
__________
(a) | In accordance with ASC 820-10, certain investments that are measured using the net asset value per share (or its equivalent) as a practical expedient for fair value have not been classified in the fair value hierarchy. These investments are generally not redeemable. The fair value amounts presented in this table are intended to permit reconciliation of the fair value hierarchy to the amounts presented in the Consolidated Statements of Assets and Liabilities. |
The following table presents the financial instruments carried at fair value as of September 30, 2017 on the Company's Consolidated Statement of Assets and Liabilities for each of the three levels of hierarchy established by ASC 820:
Level 1 | Level 2 | Level 3 | Measured at Net Asset Value (a) | Total | ||||||||||||||||
Investments in debt securities (senior secured) | $ | — | $ | 142,257 | $ | 1,060,442 | $ | — | $ | 1,202,699 | ||||||||||
Investments in debt securities (subordinated, including debt investments in SLF JV I) | — | 41,778 | 180,331 | — | 222,109 | |||||||||||||||
Investments in equity securities (preferred) | — | — | 16,445 | — | 16,445 | |||||||||||||||
Investments in equity securities (common and warrants, including LLC equity interests of SLF JV I) | — | — | 69,164 | 31,338 | 100,502 | |||||||||||||||
Total investments at fair value | — | 184,035 | 1,326,382 | 31,338 | 1,541,755 | |||||||||||||||
Cash equivalents | 48,808 | — | — | — | 48,808 | |||||||||||||||
Total assets at fair value | $ | 48,808 | $ | 184,035 | $ | 1,326,382 | $ | 31,338 | $ | 1,590,563 | ||||||||||
Secured borrowings | — | — | 13,256 | — | 13,256 | |||||||||||||||
Total liabilities at fair value | $ | — | $ | — | $ | 13,256 | $ | — | $ | 13,256 | ||||||||||
__________
(a) | In accordance with ASC 820-10, certain investments that are measured using the net asset value per share (or its equivalent) as a practical expedient for fair value have not been classified in the fair value hierarchy. These investments are generally not redeemable. The fair value amounts presented in this table are intended to permit reconciliation of the fair value hierarchy to the amounts presented in the Consolidated Statements of Assets and Liabilities. |
When a determination is made to classify a financial instrument within Level 3 of the valuation hierarchy, the determination is based upon the fact that the unobservable factors are significant to the overall fair value measurement. However, Level 3 financial instruments typically include, in addition to the unobservable or Level 3 components, observable components (i.e. components that are actively quoted and can be validated by external sources). Accordingly, the appreciation (depreciation) in the tables below includes changes in fair value due in part to observable factors that are part of the valuation methodology. Transfers between levels are recognized at the beginning of the reporting period.
116
OAKTREE SPECIALTY LENDING CORPORATION
NOTES TO CONSOLIDATED FINANCIAL STATEMENTS
(in thousands, except share and per share amounts, percentages and as otherwise indicated)
The following table provides a roll-forward in the changes in fair value from September 30, 2017 to September 30, 2018 for all investments and secured borrowings for which the Company determined fair value using unobservable (Level 3) factors:
Investments | Liabilities | |||||||||||||||||||||||
Senior Secured Debt | Subordinated Debt (including debt investments in SLF JV I) | Preferred Equity | Common Equity and Warrants | Total | Secured Borrowings | |||||||||||||||||||
Fair value as of September 30, 2017 | $ | 1,060,442 | $ | 180,331 | $ | 16,445 | $ | 69,164 | $ | 1,326,382 | $ | 13,256 | ||||||||||||
New investments & net revolver activity | 381,905 | 12,662 | — | 2,500 | 397,067 | — | ||||||||||||||||||
Redemptions/repayments/sales | (749,161 | ) | (26,403 | ) | (12,398 | ) | (27,819 | ) | (815,781 | ) | (1,191 | ) | ||||||||||||
Transfers out (a) | (34,657 | ) | — | — | — | (34,657 | ) | — | ||||||||||||||||
Net accrual of PIK interest income | 1,603 | 2,294 | — | — | 3,897 | 16 | ||||||||||||||||||
Accretion of OID | 4,769 | — | — | — | 4,769 | — | ||||||||||||||||||
Net unrealized appreciation (depreciation) on investments | 33,436 | (10,023 | ) | 34,112 | 44,107 | 101,632 | — | |||||||||||||||||
Net unrealized depreciation on secured borrowings | — | — | — | — | — | (2,353 | ) | |||||||||||||||||
Realized loss on investments | (59,366 | ) | (2 | ) | (33,241 | ) | (26,818 | ) | (119,427 | ) | — | |||||||||||||
Fair value as of September 30, 2018 | $ | 638,971 | $ | 158,859 | $ | 4,918 | $ | 61,134 | $ | 863,882 | $ | 9,728 | ||||||||||||
Net unrealized depreciation relating to Level 3 assets & liabilities still held as of September 30, 2018 and reported within net unrealized appreciation (depreciation) on investments and foreign currency and net unrealized (appreciation) depreciation on secured borrowings in the Consolidated Statement of Operations for the year ended September 30, 2018 | $ | (18,318 | ) | $ | (4,130 | ) | $ | (1,018 | ) | $ | (4,003 | ) | $ | (27,469 | ) | $ | (2,353 | ) | ||||||
__________
(a) There were transfers out of Level 3 to Level 2 for certain investments during the year ended September 30, 2018 as a result of an increased number of market quotes available and/or increased market liquidity.
The following table provides a roll-forward in the changes in fair value from September 30, 2016 to September 30, 2017 for all investments and secured borrowings for which the Company determined fair value using unobservable (Level 3) factors:
Investments | Liabilities | |||||||||||||||||||||||
Senior Secured Debt | Subordinated Debt (including debt investments in SLF JV I) | Preferred Equity | Common Equity and Warrants | Total | Secured Borrowings | |||||||||||||||||||
Fair value as of September 30, 2016 | $ | 1,689,535 | $ | 285,277 | $ | 47,749 | $ | 106,540 | $ | 2,129,101 | $ | 18,400 | ||||||||||||
New investments & net revolver activity | 329,904 | 127,844 | — | 58,272 | 516,020 | — | ||||||||||||||||||
Redemptions/repayments/sales | (807,528 | ) | (227,711 | ) | (652 | ) | (37,264 | ) | (1,073,155 | ) | (5,440 | ) | ||||||||||||
Net accrual of PIK interest income | 1,640 | 3,675 | 1,470 | — | 6,785 | — | ||||||||||||||||||
Accretion of OID | 12,178 | — | — | — | 12,178 | — | ||||||||||||||||||
Net change in unearned income | 150 | 36 | — | — | 186 | — | ||||||||||||||||||
Net unrealized appreciation (depreciation) on investments | (10,533 | ) | 11,052 | (25,170 | ) | (67,653 | ) | (92,304 | ) | — | ||||||||||||||
Net unrealized appreciation on secured borrowings | — | — | — | — | — | 296 | ||||||||||||||||||
Realized loss on investments | (154,904 | ) | (19,842 | ) | (6,952 | ) | 9,269 | (172,429 | ) | — | ||||||||||||||
Fair value as of September 30, 2017 | $ | 1,060,442 | $ | 180,331 | $ | 16,445 | $ | 69,164 | $ | 1,326,382 | $ | 13,256 | ||||||||||||
Net unrealized appreciation (depreciation) relating to Level 3 assets & liabilities still held as of September 30, 2017 and reported within net unrealized appreciation (depreciation) on investments and foreign currency and net unrealized (appreciation) depreciation on secured borrowings in the Consolidated Statement of Operations for the year ended September 30, 2017 | $ | (101,985 | ) | $ | (4,491 | ) | $ | (15,049 | ) | $ | (47,501 | ) | $ | (169,026 | ) | $ | 296 | |||||||
117
OAKTREE SPECIALTY LENDING CORPORATION
NOTES TO CONSOLIDATED FINANCIAL STATEMENTS
(in thousands, except share and per share amounts, percentages and as otherwise indicated)
Significant Unobservable Inputs for Level 3 Investments
The following table provides quantitative information related to the significant unobservable inputs for Level 3 investments and secured borrowings, which are carried at fair value, as of September 30, 2018:
Asset | Fair Value | Valuation Technique | Unobservable Input | Range | Weighted Average (a) | ||||||||||
Senior secured debt | $ | 241,522 | Market yield technique | Market yield | (b) | 7.4% | - | 20.0% | 12.1% | ||||||
97,057 | Enterprise value technique | EBITDA multiple | (c) | 2.8x | - | 7.6x | 5.1x | ||||||||
32,510 | Enterprise value technique | Asset multiple | (c) | 0.9x | - | 1.1x | 1.0x | ||||||||
55,343 | Transactions precedent technique | Transaction price | (d) | N/A | - | N/A | N/A | ||||||||
212,539 | Market quotations | Broker quoted price | (e) | N/A | - | N/A | N/A | ||||||||
Subordinated debt | 30,608 | Market yield technique | Market yield | (b) | 10.4% | - | 24.2% | 14.2% | |||||||
(1,082 | ) | Enterprise value technique | EBITDA multiple | (c) | 4.8x | - | 7.2x | 6.4x | |||||||
SLF JV I debt investments | 129,333 | Enterprise value technique | N/A | (f) | N/A | - | N/A | N/A | |||||||
Preferred & common equity | 24,654 | Enterprise value technique | Revenue multiple | (c) | 0.4x | - | 10.9x | 4.8x | |||||||
41,286 | Enterprise value technique | EBITDA multiple | (c) | 2.8x | - | 18.0x | 8.7x | ||||||||
112 | Enterprise value technique | Asset multiple | (c) | 0.9x | - | 1.1x | 1.0x | ||||||||
Total | $ | 863,882 | |||||||||||||
Secured borrowings | 9,728 | Enterprise value technique | EBITDA multiple | (c) | 5.8x | - | 6.0x | 5.9x | |||||||
Total | $ | 9,728 | |||||||||||||
(a) | Weighted averages are calculated based on fair value of investments or secured borrowings. |
(b) | Used when market participant would take into account market yield when pricing the investment. |
(c) | Used when market participant would use such multiples when pricing the investment or secured borrowings. |
(d) | Used when there is an observable transaction or pending event for the investment. |
(e) | The Company generally uses prices provided by an independent pricing service which are non-binding indicative prices on or near the valuation date as the primary basis for the fair value determinations for quoted senior secured debt investments. Since these prices are non-binding, they may not be indicative of fair value. The Company evaluates the quotations provided by pricing vendors and brokers based on available market information, including trading activity of the subject or similar securities, or by performing a comparable security analysis to ensure that fair values are reasonably estimated. Each quoted price is evaluated by the Audit Committee of the Company's Board of Directors in conjunction with additional information compiled by Oaktree. |
(f) | The Company determined the value of its mezzanine notes of SLF JV I based on the total assets less the total liabilities senior to the mezzanine notes held at SLF JV I in an amount not exceeding par under the enterprise value technique. |
Under the market yield technique, the significant unobservable input used in the fair value measurement of the Company's investments in debt securities as of September 30, 2018 is the market yield. Increases or decreases in the market yield may result in a lower or higher fair value measurement, respectively.
Under the enterprise value technique, the significant unobservable input used in the fair value measurement of the Company's investments in debt or equity securities and secured borrowings as of September 30, 2018 is the earnings before interest, taxes, depreciation and amortization ("EBITDA"), revenue or asset multiple, as applicable. Increases or decreases in the valuation multiples in isolation may result in a higher or lower fair value measurement, respectively.
118
OAKTREE SPECIALTY LENDING CORPORATION
NOTES TO CONSOLIDATED FINANCIAL STATEMENTS
(in thousands, except share and per share amounts, percentages and as otherwise indicated)
The following table provides quantitative information related to the significant unobservable inputs for Level 3 investments and secured borrowings, which are carried at fair value, as of September 30, 2017:
Asset | Fair Value | Valuation Technique | Unobservable Input | Range | Weighted Average (a) | ||||||||||
Senior secured debt | $ | 632,835 | Market yield technique | Capital structure premium | (b) | 0.0% | - | 2.0% | 0.7% | ||||||
Tranche specific risk premium/(discount) | (b) | (2.5)% | - | 10.5% | 2.9% | ||||||||||
Size premium | (b) | 0.5% | - | 2.0% | 1.0% | ||||||||||
Industry premium/(discount) | (b) | (1.2)% | - | 2.6% | 0.4% | ||||||||||
58,815 | Enterprise value technique | Revenue multiple | (c) | 0.2x | - | 0.6x | 0.5x | ||||||||
107,313 | Enterprise value technique | EBITDA multiple | (c) | 0.1x | - | 7.2x | 4.6x | ||||||||
98,800 | Transactions precedent technique | Transaction price | (d) | N/A | - | N/A | N/A | ||||||||
162,679 | Market quotations | Broker quoted price | (e) | N/A | - | N/A | N/A | ||||||||
Subordinated debt | 40,825 | Market yield technique | Capital structure premium | (b) | 2.0% | - | 2.0% | 2.0% | |||||||
Tranche specific risk premium | (b) | 1.8% | - | 5.9% | 3.4% | ||||||||||
Size premium | (b) | 2.0% | - | 2.0% | 2.0% | ||||||||||
Industry premium/(discount) | (b) | (0.5)% | - | 2.6% | 0.6% | ||||||||||
10,835 | Enterprise value technique | EBITDA multiple | (c) | 6.3x | - | 7.0x | 6.4x | ||||||||
SLF JV I debt investments | 128,671 | Enterprise value technique | N/A | (f) | N/A | - | N/A | N/A | |||||||
Preferred & common equity | 85,609 | Enterprise value technique | EBITDA multiple | (c) | 0.1x | - | 15.6x | 6.8x | |||||||
Revenue multiple | (c) | 0.9x | 10.9x | 2.7x | |||||||||||
Total | $ | 1,326,382 | |||||||||||||
Secured borrowings | 13,256 | Market yield technique | Tranche specific risk premium (discount) | (b) | (2.0)% | - | 6.5% | 5.7% | |||||||
Size premium | (b) | 2.0% | - | 2.0% | 2.0% | ||||||||||
Industry premium | (b) | 0.2% | - | 0.2% | 0.2% | ||||||||||
Total | $ | 13,256 | |||||||||||||
__________
(a) | Weighted averages are calculated based on fair value of investments or secured borrowings. |
(b) | Used when market participant would take into account this premium or discount when pricing the investment or secured borrowings based on a market yield. |
(c) | Used when market participant would use such multiples when pricing the investment. |
(d) | Used when there is an observable transaction or pending event for the investment. |
(e) | The Company generally uses prices provided by an independent pricing service which are non-binding indicative prices on or near the valuation date as the primary basis for the fair value determinations for quoted senior secured debt investments. Since these prices are non-binding, they may not be indicative of fair value. The Company evaluates the quotations provided by pricing vendors and brokers based on available market information, including trading activity of the subject or similar securities, or by performing a comparable security analysis to ensure that fair values are reasonably estimated. Each quoted price is evaluated by the Audit Committee of the Company's Board of Directors in conjunction with additional information compiled by Oaktree. |
(f) | The Company determined the value of its mezzanine notes of SLF JV I based on the total assets less the total liabilities senior to the mezzanine notes held at SLF JV I in an amount not exceeding par under the enterprise value technique |
Under the market yield technique, the significant unobservable inputs used in the fair value measurement of the Company's investments in debt securities and secured borrowings as of September 30, 2017 are capital structure premium, tranche specific risk premium (discount), size premium and industry premium (discount). Increases or decreases in any of those inputs in isolation may result in a lower or higher fair value measurement, respectively.
Under the enterprise value technique, the significant unobservable input used in the fair value measurement of the Company's investments in debt or equity securities as of September 30, 2017 is the EBITDA or revenue multiple, as applicable. Increases or decreases in the valuation multiples in isolation may result in a higher or lower fair value measurement, respectively.
119
OAKTREE SPECIALTY LENDING CORPORATION
NOTES TO CONSOLIDATED FINANCIAL STATEMENTS
(in thousands, except share and per share amounts, percentages and as otherwise indicated)
Financial Instruments Disclosed, But Not Carried, At Fair Value
The following table presents the carrying value and fair value of the Company's financial liabilities disclosed, but not carried, at fair value as of September 30, 2018 and the level of each financial liability within the fair value hierarchy:
Carrying Value | Fair Value | Level 1 | Level 2 | Level 3 | ||||||||||||||||
Credit facility payable | $ | 241,000 | $ | 241,000 | $ | — | $ | — | $ | 241,000 | ||||||||||
Unsecured notes payable (net of unamortized financing costs) | 386,485 | 393,144 | — | 162,626 | 230,518 | |||||||||||||||
Total | $ | 627,485 | $ | 634,144 | $ | — | $ | 162,626 | $ | 471,518 | ||||||||||
The following table presents the carrying value and fair value of the Company's financial liabilities disclosed, but not carried, at fair value as of September 30, 2017 and the level of each financial liability within the fair value hierarchy:
Carrying Value | Fair Value | Level 1 | Level 2 | Level 3 | ||||||||||||||||
Credit facilities payable | $ | 255,995 | $ | 255,995 | $ | — | $ | — | $ | 255,995 | ||||||||||
Unsecured notes payable (net of unamortized financing costs) | 406,115 | 414,067 | — | 163,517 | 250,550 | |||||||||||||||
Total | $ | 662,110 | $ | 670,062 | $ | — | $ | 163,517 | $ | 506,545 | ||||||||||
The principal values of the credit facilities payable approximate their fair values due to their variable interest rates and are included in Level 3 of the hierarchy.
The Company uses the non-binding indicative quoted price as of the valuation date to estimate the fair value of its 4.875% unsecured notes due 2019 ("2019 Notes"), which are included in Level 3 of the hierarchy.
The Company uses the unadjusted quoted price as of the valuation date to calculate the fair value of its 5.875% unsecured notes due 2024 ("2024 Notes") and its 6.125% unsecured notes due 2028 ("2028 Notes"), which currently trade under the symbol "OSLE" on the New York Stock Exchange and the symbol "OCSLL" on the Nasdaq Global Select Market, respectively. Although these securities are publicly traded, the market is relatively inactive, and accordingly, these securities are included in Level 2 of the hierarchy.
Portfolio Composition
Summaries of the composition of the Company's investment portfolio at cost as a percentage of total investments and at fair value as a percentage of total investments and total net assets are shown in the following tables:
September 30, 2018 | September 30, 2017 | |||||||||||||
Cost: | % of Total Investments | % of Total Investments | ||||||||||||
Senior secured debt | $ | 1,200,242 | 74.69 | % | $ | 1,313,432 | 74.73 | % | ||||||
Subordinated debt | 190,430 | 11.85 | 112,869 | 6.42 | ||||||||||
Debt investments in SLF JV I | 129,333 | 8.05 | 128,671 | 7.32 | ||||||||||
LLC equity interests of SLF JV I | 16,172 | 1.01 | 16,172 | 0.92 | ||||||||||
Purchased equity | 59,524 | 3.70 | 112,558 | 6.40 | ||||||||||
Equity grants | 4,064 | 0.25 | 48,805 | 2.78 | ||||||||||
Limited partnership interests | 7,168 | 0.45 | 25,158 | 1.43 | ||||||||||
Total | $ | 1,606,933 | 100.00 | % | $ | 1,757,665 | 100.00 | % | ||||||
120
OAKTREE SPECIALTY LENDING CORPORATION
NOTES TO CONSOLIDATED FINANCIAL STATEMENTS
(in thousands, except share and per share amounts, percentages and as otherwise indicated)
September 30, 2018 | September 30, 2017 | |||||||||||||||||||
Fair Value: | % of Total Investments | % of Total Net Assets | % of Total Investments | % of Total Net Assets | ||||||||||||||||
Senior secured debt | $ | 1,124,408 | 75.40 | % | 131.05 | % | $ | 1,202,699 | 78.01 | % | 138.61 | % | ||||||||
Subordinated debt | 163,550 | 10.97 | % | 19.06 | % | 93,438 | 6.06 | % | 10.77 | % | ||||||||||
Debt investments in SLF JV I | 129,333 | 8.67 | % | 15.07 | % | 128,671 | 8.35 | % | 14.83 | % | ||||||||||
LLC equity interests of SLF JV I | 41 | 0.00 | % | 0.00 | % | 5,525 | 0.36 | % | 0.64 | % | ||||||||||
Purchased equity | 59,550 | 3.99 | % | 6.94 | % | 78,655 | 5.10 | % | 9.07 | % | ||||||||||
Equity grants | 6,502 | 0.44 | % | 0.76 | % | 6,954 | 0.45 | % | 0.80 | % | ||||||||||
Limited partnership interests | 7,817 | 0.53 | % | 0.91 | % | 25,813 | 1.67 | % | 2.97 | % | ||||||||||
Total | $ | 1,491,201 | 100.00 | % | 173.79 | % | $ | 1,541,755 | 100.00 | % | 177.69 | % | ||||||||
The geographic composition is determined by the location of the corporate headquarters of the portfolio company, which may not be indicative of the primary source of the portfolio company's business. The following tables show the portfolio composition by geographic region at cost as a percentage of total investments and at fair value as a percentage of total investments and total net assets:
September 30, 2018 | September 30, 2017 | |||||||||||||
Cost: | % of Total Investments | % of Total Investments | ||||||||||||
Northeast | $ | 539,568 | 33.58 | % | $ | 648,105 | 36.87 | % | ||||||
Midwest | 278,632 | 17.34 | % | 258,895 | 14.73 | % | ||||||||
West | 247,831 | 15.42 | % | 328,673 | 18.70 | % | ||||||||
Southwest | 200,904 | 12.50 | % | 271,484 | 15.45 | % | ||||||||
Southeast | 172,461 | 10.73 | % | 176,460 | 10.04 | % | ||||||||
International | 155,657 | 9.69 | % | 62,649 | 3.56 | % | ||||||||
Northwest | 11,880 | 0.74 | % | 11,399 | 0.65 | % | ||||||||
Total | $ | 1,606,933 | 100.00 | % | $ | 1,757,665 | 100.00 | % | ||||||
September 30, 2018 | September 30, 2017 | |||||||||||||||||||
Fair Value: | % of Total Investments | % of Total Net Assets | % of Total Investments | % of Total Net Assets | ||||||||||||||||
Northeast | $ | 495,942 | 33.26 | % | 57.80 | % | $ | 539,803 | 35.01 | % | 62.22 | % | ||||||||
West | 230,117 | 15.43 | % | 26.82 | % | 297,716 | 19.31 | % | 34.31 | % | ||||||||||
Midwest | 229,222 | 15.37 | % | 26.71 | % | 224,111 | 14.54 | % | 25.83 | % | ||||||||||
Southwest | 188,608 | 12.65 | % | 21.98 | % | 224,233 | 14.54 | % | 25.84 | % | ||||||||||
Southeast | 177,024 | 11.87 | % | 20.63 | % | 179,460 | 11.64 | % | 20.68 | % | ||||||||||
International | 158,048 | 10.60 | % | 18.42 | % | 64,780 | 4.20 | % | 7.47 | % | ||||||||||
Northwest | 12,240 | 0.82 | % | 1.43 | % | 11,652 | 0.76 | % | 1.34 | % | ||||||||||
Total | $ | 1,491,201 | 100.00 | % | 173.79 | % | $ | 1,541,755 | 100.00 | % | 177.69 | % | ||||||||
The composition of the Company's portfolio by industry at cost as a percentage of total investments and at fair value as a percentage of total investments and total net assets as of September 30, 2018 and September 30, 2017 was as follows:
121
OAKTREE SPECIALTY LENDING CORPORATION
NOTES TO CONSOLIDATED FINANCIAL STATEMENTS
(in thousands, except share and per share amounts, percentages and as otherwise indicated)
September 30, 2018 | September 30, 2017 (revised) | September 30, 2017 (as reported) | |||||||||||||||||||
Cost (1): | % of Total Investments | % of Total Investments | % of Total Investments | ||||||||||||||||||
Multi-sector holdings (2) | $ | 157,883 | 9.85 | % | $ | 173,427 | 9.87 | % | $ | 173,427 | 9.87 | % | |||||||||
Healthcare services | 119,468 | 7.43 | 210,527 | 11.98 | 210,527 | 11.98 | |||||||||||||||
Data processing & outsourced services | 87,617 | 5.45 | 72,319 | 4.11 | 77,673 | 4.42 | |||||||||||||||
Application software | 85,875 | 5.34 | 229,241 | 13.04 | 51,444 | 2.93 | |||||||||||||||
Pharmaceuticals | 69,098 | 4.30 | 60,810 | 3.46 | 60,810 | 3.46 | |||||||||||||||
Property & casualty insurance | 66,370 | 4.13 | — | — | — | — | |||||||||||||||
Oil & gas equipment & services | 56,753 | 3.53 | 27,598 | 1.57 | 27,598 | 1.57 | |||||||||||||||
Healthcare technology | 51,283 | 3.19 | — | — | — | — | |||||||||||||||
Specialized finance | 48,571 | 3.02 | 3,224 | 0.18 | 3,224 | 0.18 | |||||||||||||||
Healthcare equipment | 47,901 | 2.98 | 99,614 | 5.67 | 99,614 | 5.67 | |||||||||||||||
Aerospace & defense | 45,918 | 2.86 | 3,377 | 0.19 | — | — | |||||||||||||||
Specialty stores | 43,887 | 2.73 | 58,530 | 3.33 | 58,530 | 3.33 | |||||||||||||||
Auto parts & equipment | 42,633 | 2.65 | 21,191 | 1.21 | 21,191 | 1.21 | |||||||||||||||
Advertising | 42,405 | 2.64 | 84,720 | 4.82 | 84,720 | 4.82 | |||||||||||||||
Electrical components & equipment | 38,831 | 2.42 | — | — | — | — | |||||||||||||||
Oil & gas exploration & production | 34,727 | 2.16 | — | — | — | — | |||||||||||||||
Research & consulting services | 34,595 | 2.15 | 37,952 | 2.16 | 37,952 | 2.16 | |||||||||||||||
Technology distributors | 34,375 | 2.14 | — | — | — | — | |||||||||||||||
Integrated telecommunication services | 33,768 | 2.10 | 30,840 | 1.75 | 30,840 | 1.75 | |||||||||||||||
Airlines | 32,602 | 2.03 | 57,602 | 3.28 | 57,602 | 3.28 | |||||||||||||||
Specialty chemicals | 31,773 | 1.98 | 29,852 | 1.70 | — | — | |||||||||||||||
Construction & engineering | 30,437 | 1.89 | 67,879 | 3.86 | 67,879 | 3.86 | |||||||||||||||
Industrial machinery | 30,127 | 1.87 | 15,074 | 0.86 | 15,074 | 0.86 | |||||||||||||||
Managed healthcare | 27,812 | 1.73 | — | — | — | — | |||||||||||||||
General merchandise stores | 22,959 | 1.43 | — | — | — | — | |||||||||||||||
Oil & gas refining & marketing | 22,493 | 1.40 | — | — | — | — | |||||||||||||||
Consumer electronics | 22,128 | 1.38 | 23,176 | 1.32 | 23,176 | 1.32 | |||||||||||||||
Food retail | 22,052 | 1.37 | — | — | 4,176 | 0.24 | |||||||||||||||
Healthcare distributors | 19,683 | 1.22 | — | — | — | — | |||||||||||||||
Movies & entertainment | 19,504 | 1.21 | — | — | — | — | |||||||||||||||
Personal products | 19,327 | 1.20 | — | — | — | — | |||||||||||||||
Diversified support services | 19,266 | 1.20 | 16,817 | 0.96 | 22,724 | 1.29 | |||||||||||||||
Apparel, accessories & luxury goods | 18,308 | 1.14 | 5,165 | 0.29 | 5,165 | 0.29 | |||||||||||||||
Systems software | 15,898 | 0.99 | 25,900 | 1.47 | — | — | |||||||||||||||
Education services | 13,748 | 0.86 | 50,013 | 2.85 | 50,013 | 2.85 | |||||||||||||||
Investment banking & brokerage | 12,539 | 0.78 | — | — | — | — | |||||||||||||||
Biotechnology | 11,880 | 0.74 | — | — | — | — | |||||||||||||||
Security & alarm services | 11,071 | 0.69 | 13,214 | 0.75 | 13,214 | 0.75 | |||||||||||||||
Household appliances | 7,905 | 0.49 | — | — | — | — | |||||||||||||||
Coal & consumable fuels | 7,329 | 0.46 | 7,459 | 0.42 | — | — | |||||||||||||||
Trading companies & distributors | 6,981 | 0.43 | 7,081 | 0.40 | — | — | |||||||||||||||
Environmental & facilities services | 5,923 | 0.37 | 55,809 | 3.18 | 49,902 | 2.84 | |||||||||||||||
Commercial printing | 5,856 | 0.36 | 5,983 | 0.34 | 5,983 | 0.34 | |||||||||||||||
Internet services & infrastructure | 5,454 | 0.34 | 66,493 | 3.78 | — | — | |||||||||||||||
Leisure facilities | 5,401 | 0.34 | 30,931 | 1.76 | 30,931 | 1.76 | |||||||||||||||
Thrifts & mortgage finance | 5,344 | 0.33 | 7,240 | 0.41 | — | — | |||||||||||||||
Restaurants | 3,129 | 0.19 | 4,910 | 0.28 | 4,910 | 0.28 | |||||||||||||||
Commodity chemicals | 2,972 | 0.18 | — | — | — | — | |||||||||||||||
Hypermarkets & super centers | 2,057 | 0.13 | 16,156 | 0.92 | 11,979 | 0.68 | |||||||||||||||
Human resource & employment services | 1,581 | 0.10 | — | — | — | — | |||||||||||||||
IT consulting & other services | 750 | 0.05 | 750 | 0.04 | 4,127 | 0.23 | |||||||||||||||
Department stores | 573 | 0.04 | — | — | — | — | |||||||||||||||
Other diversified financial services | 113 | 0.01 | 12,079 | 0.69 | 12,079 | 0.69 | |||||||||||||||
Air freight & logistics | — | — | 32,530 | 1.85 | — | — | |||||||||||||||
Casinos & gaming | — | — | 23,309 | 1.33 | 23,309 | 1.33 | |||||||||||||||
Home improvement retail | — | — | 22,944 | 1.31 | 22,944 | 1.31 | |||||||||||||||
Distributors | — | — | 14,963 | 0.85 | 14,963 | 0.85 | |||||||||||||||
Real estate services | — | — | 13,011 | 0.74 | 13,011 | 0.74 | |||||||||||||||
Computer & electronics retail | — | — | 11,754 | 0.67 | 6,399 | 0.36 | |||||||||||||||
Multi-utilities | — | — | 6,201 | 0.35 | 6,201 | 0.35 | |||||||||||||||
122
OAKTREE SPECIALTY LENDING CORPORATION
NOTES TO CONSOLIDATED FINANCIAL STATEMENTS
(in thousands, except share and per share amounts, percentages and as otherwise indicated)
September 30, 2018 | September 30, 2017 (revised) | September 30, 2017 (as reported) | |||||||||||||||||||
Cost (1): | % of Total Investments | % of Total Investments | % of Total Investments | ||||||||||||||||||
Internet software & services | — | — | — | — | $ | 270,192 | 15.37 | % | |||||||||||||
Air freight and logistics | — | — | — | — | 32,530 | 1.85 | |||||||||||||||
Housewares & specialties | — | — | — | — | 29,852 | 1.70 | |||||||||||||||
Precious metals & minerals | — | — | — | — | 7,459 | 0.42 | |||||||||||||||
Thrift & mortgage finance | — | — | — | — | 7,240 | 0.41 | |||||||||||||||
Trucking | — | — | — | — | 7,081 | 0.40 | |||||||||||||||
Total | $ | 1,606,933 | 100.00 | % | $ | 1,757,665 | 100.00 | % | $ | 1,757,665 | 100.00 | % | |||||||||
September 30, 2018 | September 30, 2017 (revised) | September 30, 2017 (as reported) | ||||||||||||||||||||||||||||
Fair Value (1): | % of Total Investments | % of Total Net Assets | % of Total Investments | % of Total Net Assets | % of Total Investments | % of Total Net Assets | ||||||||||||||||||||||||
Multi-sector holdings (2) | $ | 143,037 | 9.57 | % | 16.66 | % | $ | 164,510 | 10.67 | % | 18.96 | % | $ | 164,511 | 10.67 | % | 18.96 | % | ||||||||||||
Application software | 96,457 | 6.47 | 11.24 | 225,853 | 14.68 | 26.04 | 53,905 | 3.50 | 6.21 | |||||||||||||||||||||
Data processing & outsourced services | 74,266 | 4.98 | 8.66 | 62,924 | 4.08 | 7.25 | 68,314 | 4.43 | 7.87 | |||||||||||||||||||||
Pharmaceuticals | 71,946 | 4.82 | 8.39 | 62,770 | 4.07 | 7.23 | 62,770 | 4.07 | 7.23 | |||||||||||||||||||||
Property & casualty insurance | 67,409 | 4.52 | 7.86 | — | — | — | — | — | — | |||||||||||||||||||||
Healthcare services | 67,039 | 4.50 | 7.81 | 93,912 | 6.09 | 10.82 | 93,912 | 6.09 | 10.82 | |||||||||||||||||||||
Oil & gas equipment & services | 59,822 | 4.01 | 6.97 | 28,347 | 1.84 | 3.27 | 28,347 | 1.84 | 3.27 | |||||||||||||||||||||
Healthcare technology | 52,160 | 3.50 | 6.08 | — | — | — | — | — | — | |||||||||||||||||||||
Specialized finance | 48,248 | 3.24 | 5.62 | 3,278 | 0.21 | 0.38 | 3,278 | 0.21 | 0.38 | |||||||||||||||||||||
Aerospace & defense | 46,338 | 3.11 | 5.40 | 3,416 | 0.22 | 0.39 | — | 0.00 | 0.00 | |||||||||||||||||||||
Specialty stores | 44,001 | 2.95 | 5.13 | 56,867 | 3.69 | 6.55 | 56,867 | 3.69 | 6.55 | |||||||||||||||||||||
Auto parts & equipment | 43,146 | 2.89 | 5.03 | 21,715 | 1.41 | 2.50 | 21,715 | 1.41 | 2.50 | |||||||||||||||||||||
Electrical components & equipment | 40,238 | 2.70 | 4.69 | — | — | — | — | — | — | |||||||||||||||||||||
Research & consulting services | 36,359 | 2.44 | 4.24 | 38,531 | 2.50 | 4.44 | 38,531 | 2.50 | 4.44 | |||||||||||||||||||||
Oil & gas exploration & production | 35,562 | 2.38 | 4.14 | — | — | — | — | — | — | |||||||||||||||||||||
Technology distributors | 34,597 | 2.32 | 4.03 | — | — | — | — | — | — | |||||||||||||||||||||
Advertising | 32,687 | 2.19 | 3.81 | 83,648 | 5.43 | 9.64 | 83,648 | 5.43 | 9.64 | |||||||||||||||||||||
Airlines | 32,510 | 2.18 | 3.79 | 59,511 | 3.86 | 6.86 | 59,511 | 3.86 | 6.86 | |||||||||||||||||||||
Construction & engineering | 31,930 | 2.14 | 3.72 | 50,269 | 3.26 | 5.79 | 50,269 | 3.26 | 5.79 | |||||||||||||||||||||
Specialty chemicals | 30,704 | 2.06 | 3.58 | 29,775 | 1.93 | 3.43 | — | — | — | |||||||||||||||||||||
Industrial machinery | 29,323 | 1.97 | 3.42 | 15,004 | 0.97 | 1.73 | 15,004 | 0.97 | 1.73 | |||||||||||||||||||||
Integrated telecommunication services | 28,358 | 1.90 | 3.30 | 31,358 | 2.03 | 3.61 | 31,358 | 2.03 | 3.61 | |||||||||||||||||||||
Managed healthcare | 28,012 | 1.88 | 3.26 | — | — | — | — | — | — | |||||||||||||||||||||
Consumer electronics | 23,438 | 1.57 | 2.73 | 24,066 | 1.56 | 2.77 | 24,066 | 1.56 | 2.77 | |||||||||||||||||||||
General merchandise stores | 23,058 | 1.55 | 2.69 | — | — | — | — | — | — | |||||||||||||||||||||
Oil & gas refining & marketing | 22,684 | 1.52 | 2.64 | — | — | — | — | — | — | |||||||||||||||||||||
Food retail | 22,050 | 1.48 | 2.57 | — | — | — | 4,251 | 0.28 | 0.49 | |||||||||||||||||||||
Personal products | 19,500 | 1.31 | 2.27 | — | — | — | — | — | — | |||||||||||||||||||||
Movies & entertainment | 19,475 | 1.31 | 2.27 | — | — | — | — | — | — | |||||||||||||||||||||
Healthcare distributors | 19,395 | 1.30 | 2.26 | — | — | — | — | — | — | |||||||||||||||||||||
Diversified support services | 18,295 | 1.23 | 2.13 | 16,571 | 1.07 | 1.91 | 22,554 | 1.46 | 2.60 | |||||||||||||||||||||
Systems software | 16,175 | 1.08 | 1.89 | 25,951 | 1.68 | 2.99 | — | — | — | |||||||||||||||||||||
Apparel, accessories & luxury goods | 13,624 | 0.91 | 1.59 | 1,241 | 0.08 | 0.14 | 1,241 | 0.08 | 0.14 | |||||||||||||||||||||
Investment banking & brokerage | 12,759 | 0.86 | 1.49 | — | — | — | — | — | — | |||||||||||||||||||||
Leisure products | 12,073 | 0.81 | 1.41 | 5,900 | 0.38 | 0.68 | 5,900 | 0.38 | 0.68 | |||||||||||||||||||||
Biotechnology | 11,963 | 0.80 | 1.39 | — | — | — | — | — | — | |||||||||||||||||||||
Security & alarm services | 10,865 | 0.73 | 1.27 | 13,103 | 0.85 | 1.51 | 13,103 | 0.85 | 1.51 | |||||||||||||||||||||
Healthcare equipment | 9,812 | 0.66 | 1.14 | 72,922 | 4.73 | 8.40 | 72,922 | 4.73 | 8.40 | |||||||||||||||||||||
Leisure facilities | 8,154 | 0.55 | 0.95 | 32,591 | 2.11 | 3.76 | 32,591 | 2.11 | 3.76 | |||||||||||||||||||||
Household appliances | 7,943 | 0.53 | 0.93 | — | — | — | — | — | — | |||||||||||||||||||||
Coal & consumable fuels | 7,525 | 0.50 | 0.88 | 7,464 | 0.48 | 0.86 | — | — | — | |||||||||||||||||||||
Trading companies & distributors | 7,009 | 0.47 | 0.82 | 7,106 | 0.46 | 0.82 | — | — | — | |||||||||||||||||||||
Environmental & facilities services | 6,189 | 0.42 | 0.72 | 56,642 | 3.67 | 6.53 | 50,659 | 3.29 | 5.84 | |||||||||||||||||||||
Commercial printing | 5,922 | 0.40 | 0.69 | 6,045 | 0.39 | 0.70 | 6,045 | 0.39 | 0.70 | |||||||||||||||||||||
Internet services & infrastructure | 5,580 | 0.37 | 0.65 | 67,177 | 4.36 | 7.74 | — | — | — | |||||||||||||||||||||
Thrifts & mortgage finance | 4,759 | 0.32 | 0.55 | 6,129 | 0.40 | 0.71 | — | — | — | |||||||||||||||||||||
Commodity chemicals | 3,101 | 0.21 | 0.36 | — | — | — | — | — | — | |||||||||||||||||||||
Restaurants | 3,076 | 0.21 | 0.36 | 4,917 | 0.32 | 0.57 | 4,917 | 0.32 | 0.57 | |||||||||||||||||||||
Hypermarkets & super centers | 2,082 | 0.14 | 0.24 | 15,755 | 1.02 | 1.82 | 11,504 | 0.75 | 1.33 | |||||||||||||||||||||
Human resource & employment services | 1,593 | 0.11 | 0.19 | — | — | — | — | — | — | |||||||||||||||||||||
Department stores | 581 | 0.04 | 0.07 | — | — | — | — | — | — | |||||||||||||||||||||
IT consulting & other services | 497 | 0.03 | 0.06 | 511 | 0.03 | 0.06 | 3,927 | 0.25 | 0.45 | |||||||||||||||||||||
Education services | (2,125 | ) | (0.14 | ) | (0.25 | ) | 38,254 | 2.48 | 4.41 | 38,254 | 2.48 | 4.41 | ||||||||||||||||||
123
OAKTREE SPECIALTY LENDING CORPORATION
NOTES TO CONSOLIDATED FINANCIAL STATEMENTS
(in thousands, except share and per share amounts, percentages and as otherwise indicated)
September 30, 2018 | September 30, 2017 (revised) | September 30, 2017 (as reported) | ||||||||||||||||||||||||||||
Fair Value (1): | % of Total Investments | % of Total Net Assets | % of Total Investments | % of Total Net Assets | % of Total Investments | % of Total Net Assets | ||||||||||||||||||||||||
Other diversified financial services | — | — | — | $ | 11,646 | 0.76 | % | 1.34 | % | $ | 11,646 | 0.76 | % | 1.34 | % | |||||||||||||||
Air freight & logistics | — | — | — | 1,810 | 0.12 | 0.21 | — | — | — | |||||||||||||||||||||
Casinos & gaming | — | — | — | 23,495 | 1.52 | 2.71 | 23,495 | 1.52 | 2.71 | |||||||||||||||||||||
Home improvement retail | — | — | — | 24,784 | 1.61 | 2.86 | 24,784 | 1.61 | 2.86 | |||||||||||||||||||||
Distributors | — | — | — | 14,829 | 0.96 | 1.71 | 14,829 | 0.96 | 1.71 | |||||||||||||||||||||
Real estate services | — | — | — | 13,014 | 0.84 | 1.50 | 13,014 | 0.84 | 1.50 | |||||||||||||||||||||
Computer & electronics retail | — | — | — | 11,889 | 0.77 | 1.37 | 6,498 | 0.42 | 0.75 | |||||||||||||||||||||
Multi-utilities | — | — | — | 6,255 | 0.41 | 0.72 | 6,255 | 0.41 | 0.72 | |||||||||||||||||||||
Internet software & services | — | — | — | — | — | — | 265,076 | 17.20 | 30.56 | |||||||||||||||||||||
Housewares & specialties | — | — | — | — | — | — | 29,775 | 1.93 | 3.43 | |||||||||||||||||||||
Precious metals & minerals | — | — | — | — | — | — | 7,464 | 0.48 | 0.86 | |||||||||||||||||||||
Trucking | — | — | — | — | — | — | 7,106 | 0.46 | 0.82 | |||||||||||||||||||||
Thrift & mortgage finance | — | — | — | — | — | — | 6,129 | 0.40 | 0.71 | |||||||||||||||||||||
Air freight and logistics | — | — | — | — | — | — | 1,810 | 0.12 | 0.21 | |||||||||||||||||||||
Total | $ | 1,491,201 | 100.00 | % | 173.79 | % | $ | 1,541,755 | 100.00 | % | 177.69 | % | $ | 1,541,755 | 100.00 | % | 177.69 | % | ||||||||||||
___________________
(1) | As of September 30, 2018, certain industry classifications were modified primarily as a result of changes to industry information provided by a third party source. The Company has disclosed both the revised and previously reported industry classifications as of September 30, 2017 above. |
(2) | This industry includes the Company's investment in SLF JV I. |
As of September 30, 2018 and September 30, 2017, the Company had no single investment that represented greater than 10% of the total investment portfolio at fair value. Income, consisting of interest, dividends, fees, other investment income and realization of gains or losses, can fluctuate upon repayment or sale of an investment and in any given period can be highly concentrated among several investments. For the years ended September 30, 2018, 2017 and 2016, no individual investment produced investment income that exceeded 10% of total investment income.
Senior Loan Fund JV I, LLC
In May 2014, the Company entered into an LLC agreement with Trinity Universal Insurance Company, a subsidiary of Kemper Corporation ("Kemper"), to form SLF JV I. On July 1, 2014, SLF JV I began investing in senior secured loans of middle-market companies and other corporate debt securities. The Company co-invests in these securities with Kemper through its investment in SLF JV I. SLF JV I is managed by a four person Board of Directors, two of whom are selected by the Company and two of whom are selected by Kemper. All portfolio decisions and investment decisions in respect of SLF JV I must be approved by the SLF JV I investment committee, which consists of one representative selected by the Company and one representative selected by Kemper (with approval from a representative of each required). Since the Company does not have a controlling financial interest in SLF JV I, the Company does not consolidate SLF JV I. As of September 30, 2018, SLF JV I is capitalized pro rata with LLC equity interests as transactions are completed and may be capitalized with additional mezzanine notes issued to the Company and Kemper by SLF Repack Issuer 2016, LLC, which mature on October 12, 2036. As of September 30, 2018 and September 30, 2017, the Company and Kemper owned, in the aggregate, 87.5% and 12.5%, respectively, of the LLC equity interests of SLF JV I and the outstanding mezzanine notes.
SLF JV I has a senior revolving credit facility with Deutsche Bank AG, New York Branch (as amended, the "Deutsche Bank I Facility"), which permitted up to $200.0 million of borrowings as of September 30, 2018 and September 30, 2017. Borrowings under the Deutsche Bank I Facility are secured by all of the assets of a special purpose financing subsidiary of SLF JV I. As of September 30, 2018, the reinvestment period of the Deutsche Bank I Facility was scheduled to expire June 28, 2021 and the maturity date for the Deutsche Bank I Facility was June 28, 2026. As of September 30, 2018, borrowings under the Deutsche Bank I Facility accrued interest at a rate equal to the 3-month LIBOR plus 1.85% per annum during the reinvestment period and 3-month LIBOR plus 2.00% per annum during the amortization period. Under the Deutsche Bank I Facility, $153.0 million and $71.5 million of borrowings were outstanding as of September 30, 2018 and September 30, 2017, respectively.
Prior to December 21, 2017, SLF JV I also had an additional $200.0 million senior credit facility with Deutsche Bank AG, New York Branch (the "Deutsche Bank II Facility"). Effective December 21, 2017, SLF JV I merged its financing subsidiaries and, in connection with such merger, terminated the Deutsche Bank II Facility. As of September 30, 2017, there were $41.6 million of borrowings outstanding under the Deutsche Bank II Facility.
As of September 30, 2018 and September 30, 2017, SLF JV I had total assets of $314.2 million and $276.8 million, respectively. As of September 30, 2018, the Company's investment in SLF JV I consisted of LLC equity interests of $0.0 million, at fair value, and
124
OAKTREE SPECIALTY LENDING CORPORATION
NOTES TO CONSOLIDATED FINANCIAL STATEMENTS
(in thousands, except share and per share amounts, percentages and as otherwise indicated)
Class A mezzanine secured deferrable floating rate notes and Class B mezzanine secured deferrable fixed rate notes of $99.8 million and $29.5 million, at fair value, respectively. As of September 30, 2017, the Company's investment in SLF JV I consisted of LLC equity interests of $5.5 million, at fair value, and Class A mezzanine secured deferrable floating rate notes and Class B mezzanine secured deferrable fixed rate notes of $101.0 million and $27.6 million, at fair value, respectively. In connection with the restructuring in December 2016 of the Company’s and Kemper’s investment in SLF JV I, the Company and Kemper exchanged their holdings of subordinated notes of SLF JV I for the mezzanine notes issued by SLF Repack Issuer 2016, LLC, a newly formed, wholly owned special purpose issuer subsidiary of SLF JV I, which are secured by SLF JV I’s LLC equity interests in the special purpose entities serving as borrowers under the Deutsche Bank I Facility and, prior to its termination, the Deutsche Bank II Facility. The mezzanine notes are senior in right of payment to the SLF JV I LLC equity interests and any contributions made by the Company to fund investments of SLF JV I through SLF Repack Issuer 2016, LLC. SLF JV I's portfolio primarily consisted of senior secured loans to 40 and 32 portfolio companies as of September 30, 2018 and September 30, 2017, respectively. The portfolio companies in SLF JV I are in industries similar to those in which the Company may invest directly.
As of each of September 30, 2018 and September 30, 2017, the Company and Kemper had funded approximately $165.5 million to SLF JV I, of which $144.8 million was from the Company. As of September 30, 2018 and September 30, 2017, the Company and Kemper had the option to fund additional mezzanine notes, subject to additional equity funding to SLF JV I. As of each of September 30, 2018 and September 30, 2017, the Company had commitments to fund LLC equity interests in SLF JV I of $17.5 million, of which $1.3 million was unfunded.
Below is a summary of SLF JV I's portfolio, followed by a listing of the individual loans in SLF JV I's portfolio as of September 30, 2018 and September 30, 2017:
September 30, 2018 | September 30, 2017 | |||
Senior secured loans (1) | $297,053 | $245,063 | ||
Weighted average interest rate on senior secured loans (2) | 7.20% | 7.70% | ||
Number of borrowers in SLF JV I | 40 | 32 | ||
Largest exposure to a single borrower (1) | $17,512 | $18,374 | ||
Total of five largest loan exposures to borrowers (1) | $66,507 | $82,728 | ||
(1) At principal amount.
(2) Computed using the weighted average annual interest rate on accruing senior secured loans at fair value.
125
OAKTREE SPECIALTY LENDING CORPORATION
NOTES TO CONSOLIDATED FINANCIAL STATEMENTS
(in thousands, except share and per share amounts, percentages and as otherwise indicated)
SLF JV I Portfolio as of September 30, 2018
Portfolio Company | Industry | Investment Type | Maturity Date | Current Interest Rate(1)(2) | Cash Interest Rate | Principal | Cost | Fair Value (3) | |||||||||||||||
Accudyne Industries, LLC | Industrial machinery | First Lien Term Loan B | 8/18/2024 | LIBOR+3% (1% floor) | 5.24 | % | $ | 9,088 | $ | 9,088 | $ | 9,134 | |||||||||||
AdVenture Interactive, Corp. (4) | Advertising | 927 Common Stock Shares | 1,390 | 670 | |||||||||||||||||||
AI Ladder (Luxembourg) Subco S.a.r.l (4) | Electrical components & equipment | First Lien Term Loan B | 7/9/2025 | LIBOR+4.5% | 7.02 | % | 11,300 | 10,970 | 11,367 | ||||||||||||||
Air Newco LP | IT consulting & other services | First Lien Term Loan B | 5/31/2024 | LIBOR+4.75% | 6.88 | % | 10,000 | 9,975 | 10,100 | ||||||||||||||
AL Midcoast Holdings LLC | Oil & gas storage & transportation | First Lien Term Loan B | 8/1/2025 | LIBOR+5.5% | 7.84 | % | 10,000 | 9,900 | 10,041 | ||||||||||||||
Allied Universal Holdco LLC (4) | Security & alarm services | First Lien Term Loan | 7/28/2022 | LIBOR+3.75% (1% floor) | 6.14 | % | 6,912 | 6,956 | 6,821 | ||||||||||||||
Altice France S.A. | Integrated telecommunication services | First Lien Term Loan B13 | 8/14/2026 | LIBOR+4% | 6.16 | % | 7,500 | 7,313 | 7,457 | ||||||||||||||
Alvogen Pharma US, Inc. | Pharmaceuticals | First Lien Term Loan B | 4/1/2022 | LIBOR+4.75% (1% floor) | 6.99 | % | 9,822 | 9,822 | 9,918 | ||||||||||||||
Asset International, Inc. | Research & consulting services | First Lien Term Loan | 12/30/2024 | LIBOR+4.5% (1% floor) | 6.89 | % | 6,948 | 6,824 | 6,917 | ||||||||||||||
Blackhawk Network Holdings, Inc. | Data processing & outsourced services | First Lien Term Loan | 6/15/2025 | LIBOR+3% | 5.39 | % | 9,975 | 9,951 | 10,049 | ||||||||||||||
Brazos Delaware II, LLC | Oil & gas equipment & services | First Lien Term Loan B | 5/21/2025 | LIBOR+4% | 6.17 | % | 7,481 | 7,446 | 7,458 | ||||||||||||||
Chloe Ox Parent LLC | Healthcare services | First Lien Term Loan | 12/23/2024 | LIBOR+4.5% (1% floor) | 6.89 | % | 9,950 | 9,860 | 9,987 | ||||||||||||||
Clearent Newco, LLC | Application software | First Lien Term Loan | 3/20/2024 | LIBOR+4% (1% floor) | 6.24 | % | 6,894 | 6,800 | 6,796 | ||||||||||||||
Delayed Draw Term Loan | 3/20/2024 | LIBOR+4% (1% floor) | 6.19 | % | 337 | 310 | 309 | ||||||||||||||||
First Lien Revolver | 3/20/2023 | PRIME+3% (1% floor) | 8.00 | % | 852 | 837 | 836 | ||||||||||||||||
Total Clearent Newco, LLC | 8,083 | 7,947 | 7,941 | ||||||||||||||||||||
EOS Fitness Opco Holdings, LLC (4) | Leisure facilities | First Lien Term Loan | 12/30/2019 | LIBOR+8.25% (0.75% floor) | 10.36 | % | 17,512 | 17,399 | 17,512 | ||||||||||||||
Eton (4) | Research & consulting services | Second Lien Term Loan | 5/1/2026 | LIBOR+7.5% | 9.74 | % | 6,000 | 5,971 | 6,030 | ||||||||||||||
Everi Payments Inc. | Casinos & gaming | First Lien Term Loan B | 5/9/2024 | LIBOR+3% (1% floor) | 5.24 | % | 4,938 | 4,914 | 4,973 | ||||||||||||||
Falmouth Group Holdings Corp. | Specialty chemicals | First Lien Term Loan B | 12/14/2021 | LIBOR+6.75% (1% floor) | 8.99 | % | 4,330 | 4,300 | 4,330 | ||||||||||||||
Garretson Resolution Group, Inc. (5) | Diversified support services | First Lien Term Loan | 5/22/2021 | LIBOR+6.5% (1% floor) | 5,797 | 5,772 | 1,159 | ||||||||||||||||
Gigamon Inc. | Systems software | First Lien Term Loan | 12/27/2024 | LIBOR+4.5% (1% floor) | 6.89 | % | 7,940 | 7,869 | 8,000 | ||||||||||||||
IBC Capital Ltd. | Metal & glass containers | First Lien Term Loan B | 9/11/2023 | LIBOR+3.75% | 6.09 | % | 8,955 | 8,933 | 9,028 | ||||||||||||||
InMotion Entertainment Group, LLC (4) | Consumer electronics | First Lien Term Loan A | 10/1/2021 | LIBOR+7.25% (1.25% floor) | 9.65 | % | 8,375 | 8,389 | 8,375 | ||||||||||||||
First Lien Term Loan B | 10/1/2021 | LIBOR+7.25% (1.25% floor) | 9.65 | % | 8,375 | 8,306 | 8,375 | ||||||||||||||||
Total InMotion Entertainment Group, LLC | 16,750 | 16,695 | 16,750 | ||||||||||||||||||||
126
OAKTREE SPECIALTY LENDING CORPORATION
NOTES TO CONSOLIDATED FINANCIAL STATEMENTS
(in thousands, except share and per share amounts, percentages and as otherwise indicated)
Portfolio Company | Industry | Investment Type | Maturity Date | Current Interest Rate(1)(2) | Cash Interest Rate | Principal | Cost | Fair Value (3) | |||||||||||||||
Keypath Education, Inc. (4) | Advertising | First Lien Term Loan | 4/3/2022 | LIBOR+7% (1.00% floor) cash | 9.39 | % | $ | 1,855 | $ | 1,853 | $ | 1,854 | |||||||||||
927 shares Common Stock | 1,088 | 816 | |||||||||||||||||||||
Total Keypath Education, Inc. | 1,855 | 2,941 | 2,670 | ||||||||||||||||||||
KIK Custom Products Inc. | Household products | First Lien Term Loan B | 5/15/2023 | LIBOR+4% (1% floor) cash | 6.24 | % | 8,000 | 7,965 | 7,975 | ||||||||||||||
McDermott Technology (Americas) Inc. (4) | Oil & gas equipment & services | First Lien Term Loan B | 5/12/2025 | LIBOR+5% (1% floor) cash | 7.24 | % | 9,950 | 9,760 | 10,097 | ||||||||||||||
Morphe LLC (4) | Personal products | First Lien Term Loan | 2/10/2023 | LIBOR+6% (1% floor) cash | 8.40 | % | 4,388 | 4,348 | 4,388 | ||||||||||||||
New IPT, Inc. (4) | Oil & gas equipment & services | First Lien Term Loan | 3/17/2021 | LIBOR+5% (1% floor) cash | 7.39 | % | 1,794 | 1,794 | 1,794 | ||||||||||||||
Second Lien Term Loan | 9/17/2021 | LIBOR+5.1% (1% floor) cash | 7.49 | % | 634 | 634 | 634 | ||||||||||||||||
21.876 Class A Common Units | — | — | 1,001 | ||||||||||||||||||||
Total New IPT, Inc. | 2,428 | 2,428 | 3,429 | ||||||||||||||||||||
Northern Star Industries Inc. | Electrical components & equipment | First Lien Term Loan B | 3/31/2025 | LIBOR+4.75% (1% floor) cash | 7.08 | % | 6,965 | 6,933 | 6,974 | ||||||||||||||
Novetta Solutions, LLC | Application software | First Lien Term Loan B | 10/17/2022 | LIBOR+5% (1% floor) cash | 7.25 | % | 6,055 | 6,012 | 5,881 | ||||||||||||||
OCI Beaumont LLC | Commodity chemicals | First Lien Term Loan B | 3/13/2025 | LIBOR+4% (1% floor) cash | 6.39 | % | 7,960 | 7,951 | 8,089 | ||||||||||||||
Refac Optical Group (4) | Specialty stores | First Lien Term Loan A | 9/30/2018 | LIBOR+8% cash | 10.26 | % | 2,573 | 2,476 | 2,573 | ||||||||||||||
Salient CRGT, Inc. (4) | Aerospace & defense | First Lien Term Loan | 2/28/2022 | LIBOR+5.75% (1% floor) cash | 7.99 | % | 2,267 | 2,235 | 2,301 | ||||||||||||||
Scientific Games International, Inc. | Casinos & gaming | First Lien Term Loan B-5 | 8/14/2024 | LIBOR+2.75% (1% floor) cash | 5.03 | % | 6,582 | 6,552 | 6,579 | ||||||||||||||
SHO Holding I Corporation | Footwear | First Lien Term Loan | 11/18/2022 | LIBOR+5% (1% floor) cash | 7.34 | % | 8,507 | 8,484 | 8,082 | ||||||||||||||
Sirva Worldwide, Inc. | Diversified support services | First Lien Term Loan | 8/4/2025 | LIBOR+5.5% cash | 7.75 | % | 5,000 | 4,925 | 5,019 | ||||||||||||||
TravelCLICK, Inc. (4) | Data Processing & outsourced services | Second Lien Term Loan | 11/6/2021 | LIBOR+7.75% (1% floor) cash | 9.99 | % | 2,871 | 2,871 | 2,871 | ||||||||||||||
TV Borrower US, LLC | Integrated telecommunications services | First Lien Term Loan | 2/22/2024 | LIBOR+4.75% (1% floor) cash | 7.14 | % | 2,019 | 2,011 | 2,026 | ||||||||||||||
Uber Technologies Inc. | Application software | First Lien Term Loan | 4/4/2025 | LIBOR+4% (1% floor) cash | 6.12 | % | 9,975 | 9,928 | 10,055 | ||||||||||||||
Uniti Group LP | Specialized REITs | First Lien Term Loan B | 10/24/2022 | LIBOR+3% (1% floor) cash | 5.24 | % | 6,467 | 6,225 | 6,198 | ||||||||||||||
Veritas US Inc. | Application software | First Lien Term Loan B-1 | 1/27/2023 | LIBOR+4.5% (1% floor) cash | 6.78 | % | 6,965 | 6,915 | 6,801 | ||||||||||||||
Verra Mobility, Corp. (4) | Data processing & outsourced services | First Lien Term Loan B | 2/28/2025 | LIBOR+3.75% (1% floor) cash | 5.99 | % | 10,945 | 10,961 | 11,013 | ||||||||||||||
WP CPP Holdings, LLC | Aerospace & defense | Second Lien Term Loan | 4/30/2026 | LIBOR+7.75% cash | 10.15 | % | 6,000 | 5,942 | 6,013 | ||||||||||||||
$ | 297,053 | $ | 297,158 | $ | 294,676 | ||||||||||||||||||
__________
(1) Represents the interest rate as of September 30, 2018. All interest rates are payable in cash, unless otherwise noted.
(2) The interest rate on the principal balance outstanding for all floating rate loans is indexed to LIBOR and/or an alternate base rate (e.g., prime rate), which typically resets semi-annually, quarterly, or monthly at the borrower's option. The borrower may also elect to have multiple interest reset periods for each loan. For each of these loans, the Company has provided the applicable margin over LIBOR or the alternate base rate based on each respective credit agreement and the cash interest rate as of period end. All LIBOR shown above is in U.S. dollars unless otherwise noted. As of September 30, 2018, the reference rates for SLF JV I's variable rate loans were the 30-day LIBOR at 2.24%, 60-day LIBOR at 2.29%, the 90-day LIBOR at 2.39%, the 180-day LIBOR at 2.59% and the PRIME at 5.25%.
(3) Represents the current determination of fair value as of September 30, 2018 utilizing a similar technique as the Company in accordance with ASC 820. However, the determination of such fair value is not included in the Company's Board of Directors' valuation process described elsewhere herein.
(4) This investment is held by both the Company and SLF JV I as of September 30, 2018.
127
OAKTREE SPECIALTY LENDING CORPORATION
NOTES TO CONSOLIDATED FINANCIAL STATEMENTS
(in thousands, except share and per share amounts, percentages and as otherwise indicated)
(5) This investment was on cash non-accrual status as of September 30, 2018. Cash non-accrual status is inclusive of PIK and other non-cash income, where applicable.
SLF JV I Portfolio as of September 30, 2017
Portfolio Company | Industry | Investment Type | Maturity Date | Current Interest Rate(1)(2) | Cash Interest Rate | Principal | Cost | Fair Value (3) | |||||||||||||||
AdVenture Interactive, Corp. (4) | Advertising | 927 Common Stock Shares | $ | 1,088 | $ | 1,412 | |||||||||||||||||
Allied Universal Holdco LLC (4) | Security & alarm services | First Lien Term Loan | 7/28/2022 | LIBOR+3.75% (1% floor) cash | 5.08 | % | $ | 6,982 | 7,040 | 6,976 | |||||||||||||
Ameritox Ltd. (4)(5) | Healthcare services | First Lien Term Loan | 4/11/2021 | LIBOR+5% (1% floor) cash 3% PIK | 6.33 | % | 5,759 | 5,638 | 668 | ||||||||||||||
301,913.06 Class B Preferred Units | 302 | — | |||||||||||||||||||||
928.96 Class A Common Units | 5,474 | — | |||||||||||||||||||||
Total Ameritox Ltd. | 5,759 | 11,414 | 668 | ||||||||||||||||||||
BeyondTrust Software, Inc. (4) | Application software | First Lien Term Loan | 9/25/2019 | LIBOR+7% (1% floor) cash | 8.33 | % | 15,330 | 15,231 | 15,329 | ||||||||||||||
BJ's Wholesale Club, Inc. (4) | Hypermarkets & super centers | First Lien Term Loan | 1/26/2024 | LIBOR+3.75% (1% floor) cash | 4.99 | % | 4,988 | 4,993 | 4,793 | ||||||||||||||
Compuware Corporation | Internet software & services | First Lien Term Loan B3 | 12/15/2021 | LIBOR+4.25% (1% floor) cash | 5.49 | % | 11,154 | 11,041 | 11,293 | ||||||||||||||
DFT Intermediate LLC (4) | Specialized finance | First Lien Term Loan | 3/1/2023 | LIBOR+5.5% (1% floor) cash | 6.74 | % | 10,723 | 10,474 | 10,652 | ||||||||||||||
Digital River, Inc. | Internet software & services | First Lien Term Loan | 2/12/2021 | LIBOR+6.5% (1% floor) cash | 7.82 | % | 4,524 | 4,541 | 4,546 | ||||||||||||||
Dodge Data & Analytics LLC (4) | Data processing & outsourced services | First Lien Term Loan | 10/31/2019 | LIBOR+8.75% (1% floor) cash | 10.13 | % | 9,339 | 9,372 | 8,744 | ||||||||||||||
DTZ U.S. Borrower, LLC (4) | Real estate services | First Lien Term Loan | 11/4/2021 | LIBOR+3.25% (1% floor) cash | 4.57 | % | 6,964 | 6,998 | 6,990 | ||||||||||||||
Edge Fitness, LLC | Leisure facilities | First Lien Term Loan | 12/31/2019 | LIBOR+7.75% (1% floor) cash | 9.05 | % | 10,600 | 10,602 | 10,600 | ||||||||||||||
EOS Fitness Opco Holdings, LLC (4) | Leisure facilities | First Lien Term Loan | 12/30/2019 | LIBOR+8.75% (0.75% floor) cash | 9.99 | % | 18,374 | 18,182 | 18,557 | ||||||||||||||
Everi Payments Inc.(4) | Casinos & gaming | First Lien Term Loan | 5/9/2024 | LIBOR+4.5% (1% floor) cash | 5.74 | % | 4,988 | 4,964 | 5,039 | ||||||||||||||
Falmouth Group Holdings Corp. | Specialty chemicals | First Lien Term Loan | 12/13/2021 | LIBOR+6.75% (1% floor) cash | 8.08 | % | 4,610 | 4,578 | 4,610 | ||||||||||||||
Garretson Resolution Group, Inc. | Diversified support services | First Lien Term Loan | 5/22/2021 | LIBOR+6.5% (1% floor) cash | 7.83 | % | 5,836 | 5,818 | 5,766 | ||||||||||||||
InMotion Entertainment Group, LLC (4) | Consumer electronics | First Lien Term Loan | 10/1/2018 | LIBOR+7.75% (1.25% floor) cash | 9.09 | % | 8,875 | 8,884 | 8,875 | ||||||||||||||
First Lien Term Loan B | 10/1/2018 | LIBOR+7.75% (1.25% floor) cash | 9.09 | % | 8,875 | 8,828 | 8,871 | ||||||||||||||||
Total InMotion Entertainment Group, LLC | 17,750 | 17,712 | 17,746 | ||||||||||||||||||||
Keypath Education, Inc. (4) | Advertising | First Lien Term Loan | 4/3/2022 | LIBOR+7% (1.00% floor) cash | 8.33 | % | 2,040 | 2,040 | 2,039 | ||||||||||||||
927 shares Common Stock | 1,391 | 809 | |||||||||||||||||||||
2,040 | 3,431 | 2,848 | |||||||||||||||||||||
Lift Brands, Inc. (4) | Leisure facilities | First Lien Term Loan | 12/23/2019 | LIBOR+7.5% (1% floor) cash | 8.83 | % | 18,276 | 18,257 | 18,275 | ||||||||||||||
Metamorph US 3, LLC (4)(5) | Internet software & services | First Lien Term Loan | 12/1/2020 | LIBOR+5.5% (1% floor) cash 2% PIK | 6.74 | % | 9,969 | 9,481 | 3,786 | ||||||||||||||
Motion Recruitment Partners LLC | Human resources & employment services | First Lien Term Loan | 2/13/2020 | LIBOR+6% (1% floor) cash | 7.24 | % | 4,330 | 4,281 | 4,330 | ||||||||||||||
NAVEX Global, Inc. | Internet software & services | First Lien Term Loan | 11/19/2021 | LIBOR+4.75% (1% floor) cash | 5.49 | % | 5,959 | 5,925 | 5,982 | ||||||||||||||
128
OAKTREE SPECIALTY LENDING CORPORATION
NOTES TO CONSOLIDATED FINANCIAL STATEMENTS
(in thousands, except share and per share amounts, percentages and as otherwise indicated)
Portfolio Company | Industry | Investment Type | Maturity Date | Current Interest Rate(1)(2) | Cash Interest Rate | Principal | Cost | Fair Value (3) | |||||||||||||||
New IPT, Inc. (4) | Oil & gas equipment & services | First Lien Term Loan | 3/17/2021 | LIBOR+5% (1% floor) cash | 6.33 | % | $ | 1,794 | $ | 1,794 | $ | 1,794 | |||||||||||
Second Lien | 9/17/2021 | LIBOR+5.1% (1% floor) cash | 6.43 | % | 1,094 | 1,094 | 1,094 | ||||||||||||||||
21.876 Class A Common Units | — | 321 | |||||||||||||||||||||
Total New IPT, Inc. | 2,888 | 2,888 | 3,209 | ||||||||||||||||||||
Novetta Solutions, LLC | Internet software & services | First Lien Term Loan | 9/30/2022 | LIBOR+5% (1% floor) cash | 6.34 | % | 6,118 | 6,066 | 5,950 | ||||||||||||||
OmniSYS Acquisition Corporation (4) | Diversified support services | First Lien Term Loan | 11/21/2018 | LIBOR+7.5% (1% floor) cash | 8.83 | % | 10,896 | 10,900 | 10,833 | ||||||||||||||
Refac Optical Group (4) | Specialty stores | First Lien Term Loan A | 9/30/2018 | LIBOR+8% cash | 9.23 | % | 4,623 | 4,605 | 4,623 | ||||||||||||||
Salient CRGT, Inc. (4) | IT consulting & other services | First Lien Term Loan | 2/28/2022 | LIBOR+5.75% (1% floor) cash | 6.99 | % | 2,457 | 2,412 | 2,440 | ||||||||||||||
Scientific Games International, Inc. (4) | Casinos & gaming | First Lien Term Loan | 8/14/2024 | LIBOR+3.25% (1% floor) cash | 4.58 | % | 6,632 | 6,598 | 6,651 | ||||||||||||||
SHO Holding I Corporation | Footwear | First Lien Term Loan | 10/27/2022 | LIBOR+5% (1% floor) cash | 6.24 | % | 8,594 | 8,566 | 8,487 | ||||||||||||||
TravelCLICK, Inc. (4) | Internet software & services | Second Lien Term Loan | 11/6/2021 | LIBOR+7.75% (1% floor) cash | 8.99 | % | 5,127 | 5,127 | 5,153 | ||||||||||||||
TV Borrower US, LLC | Integrated telecommunications services | First Lien Term Loan | 2/22/2024 | LIBOR+4.75% (1% floor) cash | 6.08 | % | 3,582 | 3,565 | 3,607 | ||||||||||||||
Valet Merger Sub, Inc. (4) | Environmental & facilities services | First Lien Term Loan | 9/24/2021 | LIBOR+7% (1% floor) cash | 8.24 | % | 12,998 | 12,862 | 12,998 | ||||||||||||||
Vubiquity, Inc. | Application software | First Lien Term Loan | 8/12/2021 | LIBOR+5.5% (1% floor) cash | 6.83 | % | 2,653 | 2,636 | 2,633 | ||||||||||||||
$ | 245,063 | $ | 251,648 | $ | 235,526 | ||||||||||||||||||
__________
(1) Represents the interest rate as of September 30, 2017. All interest rates are payable in cash, unless otherwise noted.
(2) The interest rate on the principal balance outstanding for all floating rate loans is indexed to LIBOR and/or an alternate base rate (e.g., prime rate), which typically resets semi-annually, quarterly, or monthly at the borrower's option. The borrower may also elect to have multiple interest reset periods for each loan. For each of these loans, the Company has provided the applicable margin over LIBOR or the alternate base rate based on each respective credit agreement.
(3) Represents the current determination of fair value as of September 30, 2017 utilizing a similar technique as the Company in accordance with ASC 820. However, the determination of such fair value is not included in the Company's Board of Directors' valuation process described elsewhere herein.
(4) This investment is held by both the Company and SLF JV I as of September 30, 2017.
(5) This investment was on cash non-accrual status as of September 30, 2017. Cash non-accrual status is inclusive of PIK and other non-cash income, where applicable.
Both the cost and fair value of the Class A mezzanine secured deferrable floating rate notes of SLF JV I held by the Company were $99.8 million and $101.0 million as of September 30, 2018 and September 30, 2017, respectively. The Company earned interest of $7.4 million and $5.2 million on its investments in these notes for the years ended September 30, 2018 and 2017, respectively. Both the cost and fair value of the Class B mezzanine secured deferrable fixed rate notes of SLF JV I held by the Company were $29.5 million and $27.6 million as of September 30, 2018 and September 30, 2017, respectively. The Company earned interest of $3.8 million, of which $3.1 million was PIK interest, and $3.0 million, all of which was PIK interest, on its investments in these notes for the years ended September 30, 2018 and 2017, respectively. On June 28, 2018, the Class B mezzanine secured deferrable fixed rate notes of SLF JV I were amended to bear interest at a fixed cash rate of 10% per annum. Prior to such amendment, these notes bore interest at a fixed PIK rate of 15% per annum. Prior to their repayment, the subordinated notes of SLF JV I bore interest at a rate of LIBOR plus 8.0% per annum, and the Company earned interest income of $2.9 million and $12.0 million on its investments in these notes for the period from September 30, 2016 through their redemption in December 2016 and the year ended September 30, 2016, respectively. The cost and fair value of the LLC equity interests in SLF JV I held by the Company was $16.2 million and $0.0 million, respectively, as of September 30, 2018, and $16.2 million and $5.5 million, respectively, as of September 30, 2017. The Company earned dividend income of $1.6 million, $1.1 million and $5.8 million for the years ended September 30, 2018, 2017 and 2016, respectively, with respect to its investment in the LLC equity interests of SLF JV I. The LLC equity interests of SLF JV I are income producing to the extent SLF JV I has residual cash to be distributed on a quarterly basis.
129
OAKTREE SPECIALTY LENDING CORPORATION
NOTES TO CONSOLIDATED FINANCIAL STATEMENTS
(in thousands, except share and per share amounts, percentages and as otherwise indicated)
Below is certain summarized financial information for SLF JV I as of September 30, 2018 and September 30, 2017 and for the years ended September 30, 2018 and 2017:
September 30, 2018 | September 30, 2017 | |||||||
Selected Balance Sheet Information: | ||||||||
Investments in loans at fair value (cost September 30, 2018: $297,158; cost September 30, 2017: $251,648) | $ | 294,676 | $ | 235,526 | ||||
Receivables from secured financing arrangements at fair value (cost September 30, 2018: $9,801; cost September 30, 2017: $9,783) | 7,069 | 8,305 | ||||||
Cash and cash equivalents | 3,226 | 24,389 | ||||||
Restricted cash | 4,808 | 5,097 | ||||||
Other assets | 4,418 | 3,485 | ||||||
Total assets | $ | 314,197 | $ | 276,802 | ||||
Senior credit facilities payable | $ | 153,010 | $ | 113,053 | ||||
Debt securities payable at fair value (proceeds September 30, 2018: $147,808; proceeds September 30, 2017: $147,052) | 147,808 | 147,052 | ||||||
Other liabilities | 13,331 | 10,383 | ||||||
Total liabilities | $ | 314,149 | $ | 270,488 | ||||
Members' equity | 48 | 6,314 | ||||||
Total liabilities and members' equity | $ | 314,197 | $ | 276,802 | ||||
Year ended September 30, 2018 | Year ended September 30, 2017 | |||||||
Selected Statements of Operations Information: | ||||||||
Interest income | $ | 20,574 | $ | 23,222 | ||||
Other income | 65 | 869 | ||||||
Total investment income | 20,639 | 24,091 | ||||||
Interest expense | 20,713 | 22,195 | ||||||
Other expenses | 473 | 700 | ||||||
Total expenses (1) | 21,186 | 22,895 | ||||||
Net unrealized appreciation (depreciation) | 12,386 | (22,789 | ) | |||||
Net realized gain (loss) | (16,311 | ) | 13,350 | |||||
Net loss | $ | (4,472 | ) | $ | (8,243 | ) | ||
__________
(1) There are no management fees or incentive fees charged at SLF JV I.
SLF JV I has elected to fair value the debt securities issued to the Company and Kemper under ASC 825. The debt securities are valued based on the total assets less the total liabilities senior to the mezzanine notes of SLF JV I in an amount not exceeding par under the enterprise value technique.
During the year ended September 30, 2018, the Company sold $8.0 million of senior secured debt investments to SLF JV I at fair value in exchange for $8.0 million cash consideration. No gain or loss was recognized by the Company on these transactions. During the year ended September 30, 2017, the Company sold $10.5 million of senior secured debt investments to SLF JV I at fair value in exchange for $10.5 million cash consideration. No gain or loss was recognized by the Company on these transactions.
The Company determined that the SLF JV I is a significant subsidiary for the years ended September 30, 2018 and September 30, 2017 under at least one of the significance conditions of Rule 4-08(g) of SEC Regulation S-X. The related summary financial information is presented in this footnote.
130
OAKTREE SPECIALTY LENDING CORPORATION
NOTES TO CONSOLIDATED FINANCIAL STATEMENTS
(in thousands, except share and per share amounts, percentages and as otherwise indicated)
Note 4. Fee Income
The Company receives a variety of fees in the ordinary course of business, including servicing, advisory, amendment, structuring and prepayment fees, which are classified as fee income and recognized as they are earned.
For the years ended September 30, 2018, 2017 and 2016, the Company recorded total fee income of $9.4 million, $10.5 million, and $22.7 million, respectively, of which $1.2 million, $1.9 million and $6.2 million, respectively, was recurring in nature. Recurring fee income primarily consisted of servicing fees and exit fees.
Note 5. Share Data and Distributions
Earnings per Share
The following table sets forth the computation of basic and diluted earnings per share, pursuant to FASB ASC Topic 260-10, Earnings per Share, for the years ended September 30, 2018, 2017 and 2016:
(Share amounts in thousands) | Year ended September 30, 2018 | Year ended September 30, 2017 | Year ended September 30, 2016 (1) | |||||||||
Earnings (loss) per common share — basic: | ||||||||||||
Net increase (decrease) in net assets resulting from operations | $ | 46,762 | $ | (196,969 | ) | $ | (66,556 | ) | ||||
Weighted average common shares outstanding — basic | 140,961 | 141,438 | 147,422 | |||||||||
Earnings (loss) per common share — basic | $ | 0.33 | $ | (1.39 | ) | $ | (0.45 | ) | ||||
Earnings (loss) per common share — diluted: | ||||||||||||
Net increase (decrease) in net assets resulting from operations | $ | 46,762 | $ | (196,969 | ) | $ | (66,556 | ) | ||||
Weighted average common shares outstanding — basic | 140,961 | 141,438 | 147,422 | |||||||||
Adjustments for dilutive effect of convertible notes | — | — | 3,917 | |||||||||
Weighted average common shares outstanding — diluted | 140,961 | 141,438 | 151,339 | |||||||||
Earnings (loss) per common share — diluted | $ | 0.33 | $ | (1.39 | ) | $ | (0.45 | ) | ||||
__________
(1) The effect of the convertible notes outstanding were anti-dilutive to earnings per share and have been excluded from the diluted earnings per share calculation. For the year ended September 30, 2016, anti-dilution would have totaled approximately $0.01.
Distributions
Distributions to common stockholders are recorded on the ex-dividend date. The Company is required to distribute dividends each taxable year to its stockholders of an amount generally at least equal to 90% of its investment company taxable income, determined without regard to any deduction for dividends paid, in order to be eligible for tax benefits allowed to a RIC under Subchapter M of the Code. The Company anticipates paying out as a distribution all or substantially all of those amounts. The amount to be paid out as a dividend is determined by the Board of Directors and is based on management’s estimate of the Company’s annual taxable income. Net realized capital gains, if any, are generally distributed, although the Company may decide to retain such net realized capital gains for investment.
The Company has adopted a dividend reinvestment plan (“DRIP”) that provides for reinvestment of any distributions the Company declares in cash on behalf of its stockholders, unless a stockholder elects to receive cash. As a result, if the Company’s Board of Directors declares a cash distribution, then the Company’s stockholders who have not “opted out” of the Company’s DRIP will have their cash distribution automatically reinvested in additional shares of the Company’s common stock, rather than receiving the cash distribution. If the Company’s shares are trading at a premium to net asset value, the Company typically issues new shares to implement the DRIP with such shares issued at the greater of the most recently computed net asset value per share of common stock or 95% of the current market price per share of common stock on the payment date for such distribution. If the Company’s shares are trading at a discount to net asset value, the Company typically purchases shares in the open market in connection with the Company’s obligations under the DRIP.
For income tax purposes, the Company estimates that its distributions for the 2018 calendar year will be composed primarily of ordinary income and the actual character of such distributions will be appropriately reported to the Internal Revenue Service and stockholders for the 2018 calendar year. To the extent that the Company’s taxable earnings for a fiscal and taxable year fall below the amount of dividend distributions paid for the fiscal and taxable year, a portion of the total amount of the Company’s distributions for
131
OAKTREE SPECIALTY LENDING CORPORATION
NOTES TO CONSOLIDATED FINANCIAL STATEMENTS
(in thousands, except share and per share amounts, percentages and as otherwise indicated)
the fiscal and taxable year may be deemed a return of capital for tax purposes to the Company’s stockholders. For the year ended September 30, 2018, $17.7 million of the Company's distributions were deemed a return of capital for tax purposes.
The following table reflects the distributions per share that the Company has paid, including shares issued under the DRIP, on its common stock during the years ended September 30, 2018, 2017 and 2016:
Date Declared | Record Date | Payment Date | Amount per Share | Cash Distribution | DRIP Shares Issued (1) | DRIP Shares Value | |||||||||
August 7, 2017 | December 15, 2017 | December 29, 2017 | $ | 0.125 | $ 17.3 million | 58,456 | $ 0.3 million | ||||||||
February 5, 2018 | March 15, 2018 | March 30, 2018 | 0.085 | 11.5 million | 122,884 | 0.5 million | |||||||||
May 3, 2018 | June 15, 2018 | June 29, 2018 | 0.095 | 13.0 million | 87,283 | 0.4 million | |||||||||
August 1, 2018 | September 15, 2018 | September 28, 2018 | 0.095 | 13.2 million | 34,575 | 0.2 million | |||||||||
Total for the year ended September 30, 2018 | $ | 0.40 | $ 55.0 million | 303,198 | $ 1.4 million | ||||||||||
Date Declared | Record Date | Payment Date | Amount per Share | Cash Distribution | DRIP Shares Issued (1) | DRIP Shares Value | |||||||||
August 3, 2016 | October 14, 2016 | October 31, 2016 | $ | 0.06 | $ 8.2 million | 81,391 | $ 0.4 million | ||||||||
August 3, 2016 | November 15, 2016 | November 30, 2016 | 0.06 | 8.2 million | 80,962 | 0.4 million | |||||||||
October 18, 2016 | December 15, 2016 | December 30, 2016 | 0.06 | 7.7 million | 70,316 | 0.4 million | |||||||||
October 18, 2016 | January 13, 2017 | January 31, 2017 | 0.06 | 8.0 million | 73,940 | 0.4 million | |||||||||
October 18, 2016 | February 15, 2017 | February 28, 2017 | 0.06 | 8.0 million | 86,120 | 0.4 million | |||||||||
February 6, 2017 | March 15, 2017 | March 31, 2017 | 0.02 | 2.7 million | 27,891 | 0.1 million | |||||||||
February 6, 2017 | June 15, 2017 | June 30, 2017 | 0.02 | 2.7 million | 20,502 | 0.1 million | |||||||||
February 6, 2017 | September 15, 2017 | September 29, 2017 | 0.125 | 17.0 million | 118,992 | 0.7 million | |||||||||
Total for the year ended September 30, 2017 | $ | 0.465 | $ 62.5 million | 560,114 | $ 2.9 million | ||||||||||
Date Declared | Record Date | Payment Date | Amount per Share | Cash Distribution (2) | DRIP Shares Issued (1) | DRIP Shares Value | |||||||||
August 4, 2015 | October 15, 2015 | October 30, 2015 | $ | 0.06 | $ 8.4 million | 106,185 | $ 0.6 million | ||||||||
August 4, 2015 | November 16, 2015 | November 30, 2015 | 0.06 | 8.4 million | 91,335 | 0.6 million | |||||||||
November 30, 2015 | December 15, 2015 | December 30, 2015 | 0.06 | 8.4 million | 99,673 | 0.6 million | |||||||||
November 30, 2015 | January 15, 2016 | January 28, 2016 | 0.06 | 8.4 million | 113,905 | 0.7 million | |||||||||
November 30, 2015 | February 12, 2016 | February 26, 2016 | 0.06 | 8.4 million | 123,342 | 0.6 million | |||||||||
February 8, 2016 | March 15, 2016 | March 31, 2016 | 0.06 | 8.6 million | 86,806 | 0.4 million | |||||||||
February 8, 2016 | April 15, 2016 | April 29, 2016 | 0.06 | 8.2 million | 112,569 | 0.6 million | |||||||||
February 8, 2016 | May 13, 2016 | May 31, 2016 | 0.06 | 8.4 million | 76,432 | 0.4 million | |||||||||
May 5, 2016 | June 15, 2016 | June 30, 2016 | 0.06 | 8.2 million | 108,629 | 0.5 million | |||||||||
May 5, 2016 | July 15, 2016 | July 29, 2016 | 0.06 | 8.2 million | 100,268 | 0.6 million | |||||||||
May 5, 2016 | August 15, 2016 | August 31, 2016 | 0.06 | 8.3 million | 59,026 | 0.4 million | |||||||||
August 3, 2016 | September 15, 2016 | September 30, 2016 | 0.06 | 8.3 million | 65,170 | 0.4 million | |||||||||
Total for the year ended September 30, 2016 | $ | 0.72 | $ 100.3 million | 1,143,340 | $ 6.4 million | ||||||||||
__________
(1) Shares were purchased on the open market and distributed.
(2) Totals do not sum due to rounding
Common Stock Offering
There were no common stock offerings during the years ended September 30, 2018, 2017 and 2016.
Stock Repurchase Program
On November 30, 2015, the Company’s Board of Directors approved a common stock repurchase program authorizing the Company to repurchase up to $100 million in the aggregate of its outstanding common stock through November 30, 2016. During the year ended September 30, 2016, the Company repurchased 7,004,139 shares of its common stock for $37.6 million, including commissions.
132
OAKTREE SPECIALTY LENDING CORPORATION
NOTES TO CONSOLIDATED FINANCIAL STATEMENTS
(in thousands, except share and per share amounts, percentages and as otherwise indicated)
On November 28, 2016, the Company’s Board of Directors approved a common stock repurchase program authorizing the Company to repurchase up to $12.5 million in the aggregate of its outstanding common stock through November 28, 2017. During the year ended September 30, 2017, the Company repurchased 2,298,247 shares of its common stock for $12.5 million, including commissions, under the common stock repurchase plan, and the authorization was fully utilized.
There were no shares repurchases during the year ended September 30, 2018.
Note 6. Borrowings
ING Facility
On November 30, 2017, the Company entered into a senior secured revolving credit facility (as amended, the “ING Facility”) pursuant to a Senior Secured Revolving Credit Agreement (as amended, the “ING Credit Agreement”) with the lenders party thereto, ING Capital LLC, as administrative agent, ING Capital LLC, JPMorgan Chase Bank, N.A. and Merrill Lynch, Pierce, Fenner & Smith Incorporated as joint lead arrangers and joint bookrunners, and JPMorgan Chase Bank, N.A. and Bank of America, N.A., as syndication agents. The ING Facility provides that the Company may use the proceeds of the loans and issuances of letters of credit under the ING Facility for general corporate purposes, including acquiring and funding leveraged loans, mezzanine loans, high-yield securities, convertible securities, preferred stock, common stock and other investments. The ING Credit Agreement further allows the Company to request letters of credit from ING Capital LLC, as the issuing bank.
The ING Facility permits up to $600 million of borrowings and includes an “accordion” feature that permits the Company, under certain circumstances, to increase the size of the ING Facility up to $800 million. Borrowings under the ING Credit Agreement bear interest at a rate equal to, at the Company’s election, either (a) LIBOR (1-, 2-, 3- or 6-month, at the Company’s option) plus a margin of 2.25%, 2.50% or 2.75% per annum depending on the Company’s senior debt coverage ratio as calculated under the ING Credit Agreement, with no LIBOR floor or (b) an alternate base rate plus a margin of 1.25%, 1.50% or 1.75% per annum depending on the Company’s senior debt coverage ratio as calculated under the ING Credit Agreement. The period during which the Company may make drawings under the ING Facility expires on November 29, 2020 (the “Revolving Termination Date”) and the final maturity date of the ING Facility will occur one year following the Revolving Termination Date.
The ING Facility is secured by substantially all of the Company’s assets (excluding, among other things, investments held in and by certain subsidiaries of the Company or investments in certain portfolio companies of the Company) and guaranteed by certain subsidiaries of the Company pursuant to a Guarantee, Pledge and Security Agreement (“ING Security Agreement”) entered into in connection with the ING Credit Agreement, among the Company, the other obligors party thereto, and ING Capital LLC, as collateral agent to the secured parties. The Company pledged its entire equity interest in certain subsidiaries to the collateral agent pursuant to the terms of the ING Security Agreement. As of September 30, 2018, except for assets that were held by the Excluded Subsidiaries and certain other immaterial subsidiaries, substantially all of the Company's assets are pledged as collateral under the ING Facility.
The ING Credit Agreement and related agreements governing the ING Facility require the Company to, among other things, (i) make representations and warranties regarding the collateral as well as each of the Company’s portfolio companies’ businesses, (ii) agree to certain indemnification obligations, and (iii) comply with various affirmative and negative covenants, reporting requirements and other customary requirements for similar revolving credit facilities, including covenants related to: (A) limitations on the incurrence of additional indebtedness and liens, (B) limitations on certain investments, (C) limitations on certain asset transfers and restricted payments, (D) maintaining a certain minimum stockholders’ equity, (E) maintaining a ratio of total assets (less total liabilities) to total indebtedness, of the Company and its subsidiaries (subject to certain exceptions), of not less than 2.0 to 1.0, (F) maintaining a ratio of consolidated EBITDA to consolidated interest expense, of the Company and its subsidiaries (subject to certain exceptions), of not less than (1) 2.0 to 1.0 until November 30, 2018 and (2) 2.25 to 1.00 thereafter, (G) maintaining a minimum liquidity and net worth, and (H) limitations on the creation or existence of agreements that prohibit liens on certain properties of the Company and certain of its subsidiaries. The ING Facility also includes usual and customary default provisions such as the failure to make timely payments under the ING Facility, the occurrence of a change in control, and the failure by the Company to materially perform under the ING Credit Agreement and related agreements governing the ING Facility, which, if not complied with, could accelerate repayment under the ING Facility. As of September 30, 2018, the Company was in compliance with all financial covenants under the ING Facility.
Each loan or letter of credit originated under the ING Facility is subject to the satisfaction of certain conditions. The Company cannot be assured that it will be able to borrow funds under the ING Facility at any particular time or at all.
From May 27, 2010 through November 30, 2017, the Company was party to a secured syndicated revolving credit facility with certain lenders party thereto from time to time and ING Capital LLC, as administrative agent (as amended, the “Prior ING Facility”). In connection with the entry into the ING Credit Agreement, the Company repaid all outstanding borrowings under the Prior ING Facility following which the Prior ING Facility was terminated. Obligations under the Prior ING Facility would have otherwise matured on
133
OAKTREE SPECIALTY LENDING CORPORATION
NOTES TO CONSOLIDATED FINANCIAL STATEMENTS
(in thousands, except share and per share amounts, percentages and as otherwise indicated)
August 6, 2018. During the year ended September 30, 2018, the Company expensed $0.2 million of unamortized deferred financing costs related to the Prior ING Facility.
As of September 30, 2018, the Company had $241.0 million of borrowings outstanding under the ING Facility, which had a fair value of $241.0 million. The Company's borrowings under the ING Facility bore interest at a weighted average interest rate of 4.254% for the period from November 30, 2017 to September 30, 2018. As of September 30, 2017, the Company had $226.5 million of borrowings outstanding under the Prior ING Facility. The Company’s borrowings under the Prior ING Facility bore interest at a weighted average interest rate of 3.705%, 3.191% and 2.781% for the period from October 1, 2017 to November 30, 2017 and the years ended September 30, 2017 and 2016, respectively. For the years ended September 30, 2018, 2017 and 2016, the Company recorded interest expense of $11.6 million, $13.6 million and $15.1 million in the aggregate, related to the Prior ING Facility and the ING Facility.
Sumitomo Facility
On September 16, 2011, a consolidated wholly-owned bankruptcy remote, special purpose subsidiary of the Company entered into a Loan and Servicing Agreement (as subsequently amended, the "Sumitomo Agreement") with respect to a credit facility (as amended, "Sumitomo Facility") with Sumitomo Mitsui Banking Corporation, an affiliate of Sumitomo Mitsui Financial Group, Inc., as administrative agent, and each of the lenders from time to time party thereto.
Prior to its termination on November 24, 2017, the Sumitomo Facility permitted up to $125 million of borrowings (subject to collateral requirements). Borrowings under the Sumitomo Facility bore interest at a rate of either (i) LIBOR (1-month) plus 2.00% per annum, with no LIBOR floor, if the borrowings under the Sumitomo Facility were greater than 35% of the aggregate available borrowings under the Sumitomo Facility or (ii) LIBOR (1-month) plus 2.25% per annum, if the borrowings under the Sumitomo Facility were less than or equal to 35% of the aggregate available borrowings under the Sumitomo Facility. The period during which the Company could have made and reinvested borrowings under the Sumitomo Facility expired on September 16, 2017. On November 24, 2017, the borrower under the Sumitomo Facility, repaid all outstanding borrowings thereunder, following which the Sumitomo Facility was terminated. Obligations under the Sumitomo Facility would have otherwise matured on the earlier of August 6, 2018 or the date on which the Prior ING Facility was repaid, refinanced or terminated.
As of September 30, 2018, there were no borrowings outstanding under the Sumitomo Facility. As of September 30, 2017, the Company had $29.5 million of borrowings outstanding under the Sumitomo Facility. The Company's borrowings under the Sumitomo Facility bore interest at a weighted average interest rate of 3.501%, 3.108% and 2.432% for the period from October 1, 2017 through termination on November 24, 2017, and the years ended September 30, 2017 and 2016, respectively. For the year ended September 30, 2018, the Company recorded interest expense of $0.7 million, including $0.5 million of debt issuance costs that were expensed, related to the Sumitomo Facility. For the years ended September 30, 2017 and 2016, the Company recorded interest expense of $2.4 million and $1.9 million, respectively, related to the Sumitomo Facility.
Excluded Subsidiaries
As of September 30, 2017, FSMP IV and FSMP V had no SBA-guaranteed debentures outstanding. On January 17, 2018, the SBA approved FSMP IV's and FSMP V's requests to surrender their licenses to operate as a SBIC, previously issued in 2010 and 2012, respectively, and the licenses were surrendered in January 2018.
During the years ended September 30, 2017 and 2016, the outstanding SBA-guaranteed debentures held by the Excluded Subsidiaries carried a weighted average interest rate of 3.781% and 3.793% (excluding the SBA annual charge), respectively. For the years ended September 30, 2017 and 2016, the Company recorded aggregate interest expense of $9.3 million and $9.5 million, respectively, related to the SBA-guaranteed debentures of the Excluded Subsidiaries.
See Notes 13 through 14 for discussion of additional debt obligations of the Company.
134
OAKTREE SPECIALTY LENDING CORPORATION
NOTES TO CONSOLIDATED FINANCIAL STATEMENTS
(in thousands, except share and per share amounts, percentages and as otherwise indicated)
Principal Payments
Scheduled principal payments for debt obligations as of September 30, 2018 are as follows:
Payments due during fiscal years ended September 30, | ||||||||||||||||||||||||
Total | 2019 | 2020 | 2021 | 2022 | 2023 and Thereafter | |||||||||||||||||||
ING Facility | $ | 241,000 | $ | — | $ | — | $ | — | $ | 241,000 | $ | — | ||||||||||||
Secured borrowings | 12,314 | — | — | 12,314 | — | — | ||||||||||||||||||
2019 Notes | 228,825 | 228,825 | — | — | — | — | ||||||||||||||||||
2024 Notes | 75,000 | — | — | — | — | 75,000 | ||||||||||||||||||
2028 Notes | 86,250 | — | — | — | — | 86,250 | ||||||||||||||||||
Total | $ | 643,389 | $ | 228,825 | $ | — | $ | 12,314 | $ | 241,000 | $ | 161,250 | ||||||||||||
Note 7. Interest and Dividend Income
See Note 2 "Investment Income" for a description of the Company's accounting treatment of investment income.
As of each of September 30, 2018 and September 30, 2017, there were eight investments on which the Company had stopped accruing cash and/or PIK interest or OID income. The percentages of the Company's debt investments at cost and fair value by accrual status as of September 30, 2018 and 2017 were as follows:
September 30, 2018 | September 30, 2017 | |||||||||||||||||||||||||||
Cost | % of Debt Portfolio | Fair Value | % of Debt Portfolio | Cost | % of Debt Portfolio | Fair Value | % of Debt Portfolio | |||||||||||||||||||||
Accrual | $ | 1,298,999 | 85.46 | % | $ | 1,318,531 | 93.03 | % | $ | 1,344,535 | 86.46 | % | $ | 1,357,794 | 95.29 | % | ||||||||||||
PIK non-accrual (1) | 12,661 | 0.83 | — | — | 10,227 | 0.66 | 379 | 0.03 | ||||||||||||||||||||
Cash non-accrual (2) | 208,345 | 13.71 | 98,760 | 6.97 | 200,210 | 12.88 | 66,636 | 4.68 | ||||||||||||||||||||
Total | $ | 1,520,005 | 100.00 | % | $ | 1,417,291 | 100.00 | % | $ | 1,554,972 | 100.00 | % | $ | 1,424,809 | 100.00 | % | ||||||||||||
___________________
(1) | PIK non-accrual status is inclusive of other non-cash income, where applicable. |
(2) | Cash non-accrual status is inclusive of PIK and other non-cash income, where applicable. |
Note 8. Taxable/Distributable Income and Dividend Distributions
Taxable income differs from net increase (decrease) in net assets resulting from operations primarily due to: (1) unrealized appreciation (depreciation) on investments, secured borrowings and foreign currency, as gains and losses are not included in taxable income until they are realized; (2) origination and exit fees received in connection with investments in portfolio companies; (3) organizational and deferred offering costs; (4) income or loss recognition on exited investments; (5) recognition of interest income on certain loans and (6) related to investments in controlled foreign corporations.
As of September 30, 2018, the Company had net capital loss carryforwards of $535.1 million to offset net capital gains, to the extent available and permitted by U.S. federal income tax law. Of the capital loss carryforwards, $10.3 million will expire on September 30, 2019 and $524.8 million will not expire, of which $135.1 million are available to offset future short-term capital gains and $389.7 million are available to offset future long-term capital gains.
135
OAKTREE SPECIALTY LENDING CORPORATION
NOTES TO CONSOLIDATED FINANCIAL STATEMENTS
(in thousands, except share and per share amounts, percentages and as otherwise indicated)
Listed below is a reconciliation of "net increase (decrease) in net assets resulting from operations" to taxable income for the years ended September 30, 2018 and 2017.
Year ended September 30, 2018 | Year ended September 30, 2017 | |||||||
Net increase (decrease) in net assets resulting from operations | $ | 46,762 | $ | (196,969 | ) | |||
Net unrealized (appreciation) depreciation on investments, secured borrowings and foreign currency | (102,605 | ) | 97,839 | |||||
Book/tax difference due to loan fees | — | (188 | ) | |||||
Book/tax difference due to exit fees | — | 1,081 | ||||||
Book/tax difference due to organizational and deferred offering costs | (87 | ) | (87 | ) | ||||
Book/tax difference due to interest income on certain loans | 1,348 | 23,748 | ||||||
Book/tax difference due to capital losses not recognized | 99,431 | 171,782 | ||||||
Other book/tax differences | (6,147 | ) | (7,348 | ) | ||||
Taxable/Distributable Income (1) | $ | 38,702 | $ | 89,858 | ||||
(1) The Company's taxable income for the year ended September 30, 2018 is an estimate and will not be finally determined until the Company files its tax return. Therefore, the final taxable income may be different than the estimate.
The Company uses the liability method to account for its taxable subsidiaries' income taxes. Using this method, the Company recognizes deferred tax assets and liabilities for the estimated future tax effects attributable to temporary differences between financial reporting and tax bases of assets and liabilities. In addition, the Company recognizes deferred tax benefits associated with net loss carry forwards that it may use to offset future tax obligations. The Company measures deferred tax assets and liabilities using the enacted tax rates expected to apply to taxable income in the years in which it expects to recover or settle those temporary differences.
For the year ended September 30, 2018, the Company recognized a total provision for income taxes of $0.6 million and was comprised of (i) current income taxes of approximately $0.2 million, which resulted from realized gains on investments held by the Company's wholly-owned taxable subsidiaries, and (ii) deferred income taxes of approximately $0.4 million, which was the net effect of a deferred tax liability of $0.7 million resulting from unrealized appreciation on investments held by the Company’s wholly-owned taxable subsidiaries and a deferred tax asset of $0.3 million resulting from unrealized depreciation on investments and capital losses of the Company’s wholly-owned taxable subsidiaries.
As a RIC, the Company is also subject to a U.S. federal excise tax based on distribution requirements of its taxable income on a calendar year basis. The Company did not incur a U.S. federal excise tax for calendar years 2016 and 2017 and does not expect to incur a U.S. federal excise tax for calendar year 2018.
For the year ended September 30, 2018, the Company reclassified $86.5 million of additional paid-in-capital to accumulated overdistributed earnings on the Consolidated Statement of Assets and Liabilities to reflect expired capital loss carryforwards and distributions that were deemed to be a return of capital for income tax purposes. Of the $86.5 million, $68.8 million relates to distributions and expired capital loss carryforwards that occurred prior to September 30, 2017. These reclassification entries did not impact total net assets.
As of September 30, 2018, the Company's last tax year end, the components of accumulated overdistributed earnings on a tax basis were as follows:
Undistributed ordinary income, net | $ | — | |
Net realized capital losses | (535,102 | ) | |
Unrealized losses, net | (101,011 | ) | |
The aggregate cost of investments for income tax purposes was $1.6 billion as of September 30, 2018. As of September 30, 2018, the aggregate gross unrealized appreciation for all investments in which there was an excess of value over cost for income tax purposes was $77.8 million. As of September 30, 2018, the aggregate gross unrealized depreciation for all investments in which there was an excess of cost for income tax purposes over value was $178.8 million. Net unrealized depreciation based on the aggregate cost of investments for income tax purposes was $101.0 million.
136
OAKTREE SPECIALTY LENDING CORPORATION
NOTES TO CONSOLIDATED FINANCIAL STATEMENTS
(in thousands, except share and per share amounts, percentages and as otherwise indicated)
Note 9. Realized Gains or Losses and Net Unrealized Appreciation or Depreciation
Realized Gains or Losses
Realized gains or losses are measured by the difference between the net proceeds from the sale or redemption and the cost basis of the investment without regard to unrealized appreciation or depreciation previously recognized, and include investments written-off during the period, net of recoveries. Realized losses may also be recorded in connection with the Company's determination that certain investments are considered worthless securities and/or meet the conditions for loss recognition per the applicable tax rules.
During the year ended September 30, 2018, the Company recorded an aggregate net realized loss on investments, secured borrowings and foreign currency of $115.1 million, which consisted of the following:
($ in millions) | |||
Portfolio Company | Net Realized Gain (Loss) | ||
Ameritox Ltd. | $ | (74.8 | ) |
TransTrade Operators, Inc. | (32.5 | ) | |
Traffic Solutions Holdings, Inc. | (15.8 | ) | |
Metamorph US 3, LLC | (6.7 | ) | |
Lytx, Inc. | 4.4 | ||
Other, net | 10.3 | ||
Total, net | $ | (115.1 | ) |
During the year ended September 30, 2017, the Company recorded an aggregate net realized loss on investments, secured borrowings and foreign currency of $171.8 million, which consisted of the following:
($ in millions) | |||
Portfolio Company | Net Realized Gain (Loss) | ||
AdVenture Interactive, Corp. | $ | (47.4 | ) |
Answers Corporation | (37.3 | ) | |
ERS Acquisition Corp. | (34.3 | ) | |
Express Group Holdings LLC | (22.3 | ) | |
Senior Loan Fund JV I, LLC | (19.9 | ) | |
Eagle Hospital Physicians, LLC | (13.1 | ) | |
Integrated Petroleum Technologies, Inc. | (11.1 | ) | |
First Star Aviation, LLC | (3.8 | ) | |
Dexter Axle Company | 7.7 | ||
Vandelay Industries Merger Sub, Inc. | 5.6 | ||
Other, net | 4.1 | ||
Total, net | $ | (171.8 | ) |
During the year ended September 30, 2016, the Company recorded an aggregate net realized loss on investments and secured borrowings of $125.3 million, which consisted of the following:
($ in millions) | |||
Portfolio Company | Net Realized Gain (Loss) | ||
Ameritox Ltd. | $ | (42.8 | ) |
Phoenix Brands Merger Sub LLC | (28.7 | ) | |
JTC Education, Inc. | (22.3 | ) | |
CCCG, LLC | (17.2 | ) | |
Miche Group, LLC | (8.1 | ) | |
QuorumLabs, Inc. | (4.2 | ) | |
Other, net | (2.0 | ) | |
Total, net | $ | (125.3 | ) |
137
OAKTREE SPECIALTY LENDING CORPORATION
NOTES TO CONSOLIDATED FINANCIAL STATEMENTS
(in thousands, except share and per share amounts, percentages and as otherwise indicated)
Net Unrealized Appreciation or Depreciation on Investments and Secured Borrowings
Net unrealized appreciation or depreciation reflects the net change in the valuation of the portfolio pursuant to the Company's valuation guidelines and the reclassification of any prior period unrealized appreciation or depreciation.
During the three years ended September 30, 2018, 2017 and 2016, the Company recorded net unrealized appreciation (depreciation) on investments, secured borrowings and foreign currency of $102.6 million, $(97.8) million and $(48.0) million, respectively. For the year ended September 30, 2018, this consisted of $127.4 million of net reclassifications to realized losses (resulting in unrealized appreciation), $2.4 million of net unrealized depreciation on secured borrowings and $2.2 million of net unrealized appreciation on equity investments, offset by $29.4 million of net unrealized depreciation on debt investments . For the year ended September 30, 2017, this consisted of $163.4 million of net unrealized depreciation on debt investments, $93.1 million of net unrealized depreciation on equity investments and $0.3 million of net unrealized appreciation on secured borrowings, offset by $159.0 million of net reclassifications to realized losses (resulting in unrealized appreciation). For the year ended September 30, 2016, the Company's net unrealized depreciation consisted of $147.0 million of net unrealized depreciation on debt investments, $0.6 million of net unrealized depreciation on equity investments and $0.1 million of net unrealized appreciation on secured borrowings, offset by $99.7 million of net reclassifications to realized losses (resulting in unrealized appreciation).
Note 10. Concentration of Credit Risks
The Company deposits its cash with financial institutions and at times such balances may be in excess of the FDIC insurance limit. The Company limits its exposure to credit loss by depositing its cash with high credit quality financial institutions and monitoring their financial stability.
Note 11. Related Party Transactions
As of September 30, 2018 and September 30, 2017, the Company had a liability on its Consolidated Statements of Assets and Liabilities in the amount of $8.2 million and $6.8 million, respectively, reflecting the unpaid portion of the base management fees and incentive fees payable to Oaktree and the Former Adviser, respectively.
Investment Advisory Agreement
Effective October 17, 2017 and as of September 30, 2018, the Company is party to the Investment Advisory Agreement with Oaktree. Under the Investment Advisory Agreement, the Company pays Oaktree a fee for its services under the Investment Advisory Agreement consisting of two components: a base management fee and an incentive fee. The cost of both the base management fee payable to Oaktree and any incentive fees earned by Oaktree is ultimately borne by common stockholders of the Company.
Unless earlier terminated as described below, the Investment Advisory Agreement will remain in effect until October 17, 2019 and thereafter from year-to-year if approved annually by the Board of Directors of the Company or by the affirmative vote of the holders of a majority of the Company’s outstanding voting securities, including, in either case, approval by a majority of the directors of the Company who are not interested persons. The Investment Advisory Agreement will automatically terminate in the event of its assignment. The Investment Advisory Agreement may be terminated by either party without penalty upon 60 days’ written notice to the other. The Investment Advisory Agreement may also be terminated, without penalty, upon the vote of a majority of the outstanding voting securities of the Company.
Base Management Fee
Under the Investment Advisory Agreement, the base management fee is calculated at an annual rate of 1.50% of total gross assets, including any investment made with borrowings, but excluding cash and cash equivalents. The base management fee is payable quarterly in arrears and the fee for any partial month or quarter is appropriately prorated.
For the period from October 17, 2017 to September 30, 2018, the base management fee (net of waivers) incurred under the Investment Advisory Agreement was $21.4 million, which was payable to Oaktree. For the period from October 17, 2017 to September 30, 2018, Oaktree waived a portion of the base management fee, which resulted in waivers of $0.2 million, which amounts may be subject to recovery by Oaktree.
138
OAKTREE SPECIALTY LENDING CORPORATION
NOTES TO CONSOLIDATED FINANCIAL STATEMENTS
(in thousands, except share and per share amounts, percentages and as otherwise indicated)
Incentive Fee
The incentive fee consists of two parts. Under the Investment Advisory Agreement, the first part of the incentive fee (the “incentive fee on income” or "Part I incentive fee") is calculated and payable quarterly in arrears based upon the “pre-incentive fee net investment income” of the Company for the immediately preceding quarter. The payment of the incentive fee on income is subject to payment of a preferred return to investors each quarter (i.e., a “hurdle rate”), expressed as a rate of return on the value of the Company’s net assets at the end of the most recently completed quarter, of 1.50%, subject to a “catch up” feature.
For this purpose, “pre-incentive fee net investment income” means interest income, dividend income and any other income (including any other fees such as commitment, origination, structuring, diligence and consulting fees or other fees that the Company receives from portfolio companies, other than fees for providing managerial assistance) accrued during the fiscal quarter, minus the Company’s operating expenses for the quarter (including the base management fee, expenses payable under the Administration Agreement and any interest expense and dividends paid on any issued and outstanding preferred stock, but excluding the incentive fee). Pre-incentive fee net investment income includes, in the case of investments with a deferred interest feature (such as OID debt, instruments with PIK interest and zero coupon securities), accrued income that the Company has not yet received in cash. Pre-incentive fee net investment income does not include any realized capital gains, realized capital losses or unrealized capital appreciation or depreciation.
Under the Investment Advisory Agreement, the calculation of the incentive fee on income for each quarter is as follows:
• | No incentive fee is payable to Oaktree in any quarter in which the Company’s pre-incentive fee net investment income does not exceed the preferred return rate of 1.50% (the “preferred return”) on net assets; |
• | 100% of the Company’s pre-incentive fee net investment income, if any, that exceeds the preferred return but is less than or equal to 1.8182% in any fiscal quarter is payable to Oaktree. This portion of the incentive fee on income is referred to as the “catch-up” provision, and it is intended to provide Oaktree with an incentive fee of 17.5% on all of the Company’s pre-incentive fee net investment income when the Company’s pre-incentive fee net investment income exceeds 1.8182% on net assets in any fiscal quarter; and |
• | For any quarter in which the Company’s pre-incentive fee net investment income exceeds 1.8182% on net assets, the incentive fee on income is equal to 17.5% of the amount of the Company’s pre-incentive fee net investment income, as the preferred return and catch-up will have been achieved. |
There is no accumulation of amounts on the hurdle rate from quarter to quarter and accordingly there is no clawback of amounts previously paid if subsequent quarters are below the quarterly hurdle.
For the period from October 17, 2017 to September 30, 2018, the first part of the incentive fee (net of waivers) incurred under the Investment Advisory Agreement was $9.3 million. To ensure compliance of the transactions contemplated by the Purchase Agreement with Section 15(f) of the Investment Company Act, Oaktree entered into a two-year contractual fee waiver with the Company that will waive, to the extent necessary, any management or incentive fees payable under the Investment Advisory Agreement that exceed what would have been paid to the Former Adviser in the aggregate under the Former Investment Advisory Agreement. Amounts potentially subject to waiver are accrued quarterly on a cumulative basis and, to the extent required, any fees will be waived or reimbursed as soon as practicable after the end of the two-year period. As of September 30, 2018, Oaktree had accrued an aggregate amount of $1.2 million of incentive fees potentially subject to waiver, which was included in base management fee and Part I incentive fee payable.
Under the Investment Advisory Agreement, the second part of the incentive fee will be determined and payable in arrears as of the end of each fiscal year (or upon termination of the Investment Advisory Agreement, as of the termination date) commencing with the fiscal year ending September 30, 2019 and will equal 17.5% of the Company’s realized capital gains, if any, on a cumulative basis from the beginning of the fiscal year ending September 30, 2019 through the end of each fiscal year, computed net of all realized capital losses and unrealized capital depreciation on a cumulative basis, less the aggregate amount of any previously paid capital gain incentive fees under the Investment Advisory Agreement. Any realized capital gains, realized capital losses, unrealized capital appreciation and unrealized capital depreciation with respect to the Company’s portfolio as of the end of the fiscal year ending September 30, 2018 will be excluded from the calculations of the second part of the incentive fee.
Indemnification
The Investment Advisory Agreement provides that, absent willful misfeasance, bad faith or gross negligence in the performance of their respective duties or by reason of the reckless disregard of their respective duties and obligations, Oaktree and its officers, managers, partners, members (and their members, including the owners of their members), agents, employees, controlling persons and
139
OAKTREE SPECIALTY LENDING CORPORATION
NOTES TO CONSOLIDATED FINANCIAL STATEMENTS
(in thousands, except share and per share amounts, percentages and as otherwise indicated)
any other person or entity affiliated with it, are entitled to indemnification from the Company for any damages, liabilities, costs and expenses (including reasonable attorneys' fees and amounts reasonably paid in settlement) arising from the rendering of Oaktree's services under the Investment Advisory Agreement or otherwise as investment adviser.
Collection and Disbursement of Fees Owed to the Former Adviser
Under the Former Investment Advisory Agreement described below, both the base management fee and incentive fee on income were calculated and paid to the Former Adviser at the end of each quarter. In order to ensure that the Former Adviser received the compensation earned during the quarter ended December 31, 2017, the initial payment of the base management fee and incentive fee on income under the Investment Advisory Agreement covered the entire quarter in which the Investment Advisory Agreement became effective, and was calculated at a blended rate that reflected fee rates under the respective investment advisory agreements for the portion of the quarter in which the Former Adviser and Oaktree were serving as investment adviser. This structure allowed Oaktree to pay the Former Adviser in early 2018, the pro rata portion of the fees that were earned by, but not paid to, the Former Adviser for services rendered to the Company prior to October 17, 2017.
Former Investment Advisory Agreement
The following is a description of the Former Investment Advisory Agreement, which was terminated on October 17, 2017. The Former Investment Advisory Agreement, dated March 20, 2017, was effective January 1, 2017 through its termination on October 17, 2017. The Former Investment Advisory Agreement amended and restated the Company’s third amended and restated investment advisory agreement with the Former Adviser, which was effective as of January 1, 2016, to impose a total return hurdle provision and reduce the “preferred return.”
Through October 17, 2017, the Company paid the Former Adviser a fee for its services under the Former Investment Advisory Agreement consisting of two components: a base management fee and an incentive fee. The cost of both the base management fee paid to the Former Adviser and any incentive fees earned by the Former Adviser were ultimately borne by common stockholders of the Company.
Base Management Fee
Prior to January 1, 2016, the base management fee was calculated at an annual rate of 2.0% of the Company’s gross assets,
including any borrowings for investment purposes but excluding cash and cash equivalents. For the period from January 1, 2016 to October 17, 2017, the base management fee on total gross assets was reduced from 2.0% to 1.75%. The base management fee was payable quarterly in arrears and the fee for any partial month or quarter was appropriately prorated.
For the period from October 1, 2017 to October 17, 2017 and the years ended September 30, 2017 and 2016, the base management fee (net of waivers) incurred under the investment advisory agreements with the Former Adviser was $1.1 million, $31.1 million and $41.1 million, respectively, all of which were payable to the Former Adviser. For the period from October 1, 2017 to October 17, 2017, the years ended September 30, 2017 and 2016, the Former Adviser voluntarily waived a portion of the base management fee, which resulted in waivers of less than $0.1 million, $0.2 million and $0.3 million, respectively.
Incentive Fee
The incentive fee paid to the Former Adviser had two parts. The first part was calculated and payable quarterly in arrears at a rate of 20% based on the Company’s pre-incentive fee net investment income for the immediately preceding fiscal quarter subject to a “hurdle rate” of 1.75% per quarter (2% for periods prior to January 1, 2017) and a “catch-up” provision. The Company’s net investment income used to calculate this part of the incentive fee was also included in the amount of its gross assets used to calculate the 1.75% base management fee.
From January 1, 2017 to October 17, 2017, in the event the cumulative incentive fee on income accrued from January 1, 2017 (after giving effect to any reduction(s) pursuant to this paragraph for any prior fiscal quarters but not the quarter of calculation) exceeded 20.0% of the cumulative net increase in net assets resulting from operations since January 1, 2017, then the incentive fee on income for the quarter was reduced by an amount equal to (1) 25% of the incentive fee on income calculated for such quarter (prior to giving effect to any reduction pursuant to this paragraph) less (2) any base management fees waived by the Former Adviser for such fiscal quarter. For this purpose, the “cumulative net increase in net assets resulting from operations” was an amount, if positive, equal to
140
OAKTREE SPECIALTY LENDING CORPORATION
NOTES TO CONSOLIDATED FINANCIAL STATEMENTS
(in thousands, except share and per share amounts, percentages and as otherwise indicated)
the sum of pre-incentive fee net investment income, base management fees, realized gains and losses and unrealized capital appreciation and depreciation of the Company from January 1, 2017.
There was no accumulation of amounts on the hurdle rate from quarter to quarter and accordingly there was no clawback of amounts previously paid if subsequent quarters were below the quarterly hurdle and there was no delay of payment if prior quarters were below the quarterly hurdle.
The second part of the incentive fee was determined and payable in arrears as of the end of each fiscal year (or upon termination of the Former Investment Advisory Agreement, as of the termination date) and equaled 20% of the Company’s realized capital gains, if any, on a cumulative basis from inception through the end of each fiscal year, computed net of all realized capital losses and unrealized capital depreciation on a cumulative basis, less the aggregate amount of any previously paid capital gain incentive fees.
For the period from October 1, 2017 to October 17, 2017, no incentive fee was incurred under the Former Investment Advisory Agreement. For the years ended September 30, 2017 and 2016, incentive fees incurred under the investment advisory agreement with the Former Adviser were $10.7 million (net of a $1.1 million reduction due to the total return hurdle) and $22.1 million, respectively.
GAAP Accruals
GAAP requires the Company to accrue for the theoretical capital gain incentive fee that would be payable after giving effect to the net unrealized capital appreciation. A fee so calculated and accrued would not be payable under applicable law and may never be paid based upon the computation of capital gain incentive fees in subsequent periods. Amounts ultimately paid under the Investment Advisory Agreement will be consistent with the formula reflected in the Investment Advisory Agreement. The Company did not accrue for capital gain incentive fees as of September 30, 2018 because the capital gain incentive fee under the Investment Advisory Agreement will not be charged until the fiscal year ending September 30, 2019.
Administrative Services
The Company entered into the Administration Agreement with Oaktree Administrator on October 17, 2017. Pursuant to the Administration Agreement, Oaktree Administrator provides administrative services to the Company necessary for the operations of the Company, which include providing office facilities, equipment, clerical, bookkeeping and record keeping services at such facilities and such other services as Oaktree Administrator, subject to review by the Company’s Board of Directors, shall from time to time deem to be necessary or useful to perform its obligations under the Administration Agreement. Oaktree Administrator may, on behalf of the Company, conduct relations and negotiate agreements with custodians, trustees, depositories, attorneys, underwriters, brokers and dealers, corporate fiduciaries, insurers, banks and such other persons in any such other capacity deemed to be necessary or desirable. Oaktree Administrator makes reports to the Company’s Board of Directors of its performance of obligations under the Administration Agreement and furnishes advice and recommendations with respect to such other aspects of the Company’s business and affairs, in each case, as it shall determine to be desirable or as reasonably required by the Company’s Board of Directors; provided that Oaktree Administrator shall not provide any investment advice or recommendation.
Oaktree Administrator also provides portfolio collection functions for interest income, fees and warrants and is responsible for the financial and other records that the Company is required to maintain and prepares, prints and disseminates reports to the Company’s stockholders and all other materials filed with the SEC. In addition, Oaktree Administrator assists the Company in determining and publishing the Company’s net asset value, overseeing the preparation and filing of the Company’s tax returns, and generally overseeing the payment of the Company’s expenses and the performance of administrative and professional services rendered to the Company by others. Oaktree Administrator may also offer to provide, on the Company’s behalf, managerial assistance to the Company’s portfolio companies.
For providing these services, facilities and personnel, the Company reimburses Oaktree Administrator the allocable portion of overhead and other expenses incurred by Oaktree Administrator in performing its obligations under the Administration Agreement, including the Company’s allocable portion of the rent of the Company’s principal executive offices at market rates and the Company’s allocable portion of the costs of compensation and related expenses of its Chief Financial Officer, Chief Compliance Officer, their staffs and other non-investment professionals at Oaktree that perform duties for the Company. Such reimbursement is at cost, with no profit to, or markup by, Oaktree Administrator. The Administration Agreement may be terminated by either party without penalty upon 60 days’ written notice to the other. The Administration Agreement may also be terminated, without penalty, upon the vote of a majority of the Company’s outstanding voting securities.
141
OAKTREE SPECIALTY LENDING CORPORATION
NOTES TO CONSOLIDATED FINANCIAL STATEMENTS
(in thousands, except share and per share amounts, percentages and as otherwise indicated)
Prior to its termination by its terms on October 17, 2017 and throughout the Company’s 2017 fiscal year, the Company was party to the Former Administration Agreement with the Former Administrator. The Former Administrator was a wholly-owned subsidiary of the Former Adviser. Pursuant to the Former Administration Agreement, the Former Administrator provided services substantially similar to those provided by Oaktree Administrator as described above. For providing these services, facilities and personnel, the Company reimbursed the Former Administrator the allocable portion of overhead and other expenses incurred by it in performing its obligations under the Former Administration Agreement.
For the year ended September 30, 2018, the Company accrued administrative expenses of $2.1 million, including $0.4 million of general and administrative expenses. Of the accrued administrative expenses of $2.1 million for the year ended September 30, 2018, $0.2 million was due to the Former Administrator for administrative expenses incurred prior to October 17, 2017 and $1.9 million was due to Oaktree Administrator. For the year ended September 30, 2017, the Company accrued administrative expenses of $4.3 million, including $2.1 million of general and administrative expenses, which was due to the Former Administrator. For the year ended September 30, 2016, the Company accrued administrative expenses of $4.0 million, including $2.1 million of general and administrative expenses, which was due to the Former Administrator.
As of September 30, 2018 and September 30, 2017, $3.3 million and $1.8 million was included in “Due to affiliate” in the Consolidated Statements of Assets and Liabilities, respectively, reflecting the unpaid portion of administrative expenses payable to Oaktree Administrator and the Former Administrator, respectively.
Note 12. Financial Highlights
(Share amounts in thousands) | Year ended September 30, 2018 (1) | Year ended September 30, 2017 | Year ended September 30, 2016 | Year ended September 30, 2015 | Year ended September 30, 2014 | |||||
Net asset value per share at beginning of period | $6.16 | $7.97 | $9.00 | $9.64 | $9.85 | |||||
Net investment income (2) | 0.43 | 0.51 | 0.72 | 0.75 | 1.00 | |||||
Net unrealized appreciation (depreciation) on investments, secured borrowings and foreign currency (2) | 0.73 | (0.69) | (0.33) | (0.46) | (0.23) | |||||
Net realized gain (loss) on investments, secured borrowings, foreign currency and unsecured notes payable (2) | (0.83) | (1.21) | (0.84) | (0.19) | 0.02 | |||||
Distributions to stockholders (2) | (0.27) | (0.47) | (0.67) | (0.79) | (0.94) | |||||
Tax return of capital (2) | (0.13) | — | (0.05) | — | (0.06) | |||||
Net issuance/repurchases of common stock (2) | — | 0.05 | 0.14 | 0.05 | — | |||||
Net asset value per share at end of period | $6.09 | $6.16 | $7.97 | $9.00 | $9.64 | |||||
Per share market value at beginning of period | $5.47 | $5.81 | $6.17 | $9.18 | $10.29 | |||||
Per share market value at end of period | $4.96 | $5.47 | $5.81 | $6.17 | $9.18 | |||||
Total return (3) | (1.49)% | 2.84% | 7.02% | (27.18)% | (0.97)% | |||||
Common shares outstanding at beginning of period | 140,961 | 143,259 | 150,263 | 153,340 | 139,041 | |||||
Common shares outstanding at end of period | 140,961 | 140,961 | 143,259 | 150,263 | 153,340 | |||||
Net assets at beginning of period | $867,657 | $1,142,288 | $1,353,094 | $1,478,475 | $1,368,872 | |||||
Net assets at end of period | $858,035 | $867,657 | $1,142,288 | $1,353,094 | $1,478,475 | |||||
Average net assets (4) | $841,583 | $1,018,498 | $1,229,639 | $1,413,357 | $1,393,635 | |||||
Ratio of net investment income to average net assets | 7.13% | 7.13% | 8.68% | 8.13% | 10.23% | |||||
Ratio of total expenses to average net assets | 9.51% | 10.49% | 13.09% | 10.69% | 10.91% | |||||
Ratio of net expenses to average net assets | 9.35% | 10.35% | 11.48% | 10.65% | 10.86% | |||||
Ratio of portfolio turnover to average investments at fair value | 67.66% | 39.06% | 23.39% | 23.02% | 25.50% | |||||
Weighted average outstanding debt (5) | $608,553 | $982,372 | $1,190,105 | $1,228,413 | $1,110,021 | |||||
Average debt per share (2) | $4.32 | $6.95 | $8.07 | $8.02 | $7.82 | |||||
Asset coverage ratio | 232.98% | 227.58% | 220.84% | 238.95% | 273.48% | |||||
__________
142
OAKTREE SPECIALTY LENDING CORPORATION
NOTES TO CONSOLIDATED FINANCIAL STATEMENTS
(in thousands, except share and per share amounts, percentages and as otherwise indicated)
(1) | Beginning on October 17, 2017, the Company is externally managed by Oaktree. Prior to October 17, 2017, the Company was externally managed by the Former Adviser. |
(2) | Calculated based upon weighted average shares outstanding for the period. |
(3) | Total return equals the increase or decrease of ending market value over beginning market value, plus distributions, divided by the beginning market value, assuming dividend reinvestment prices obtained under the Company's DRIP. |
(4) | Calculated based upon the weighted average net assets for the period. |
(5) | Calculated based upon the weighted average of loans payable for the period. |
Note 13. Unsecured Notes
2019 Notes
On February 26, 2014, the Company issued $250.0 million in aggregate principal amount of its 4.875% unsecured 2019 Notes for net proceeds of $244.4 million after deducting OID of $1.4 million, underwriting commissions and discounts of $3.7 million and offering costs of $0.5 million. The OID on the 2019 Notes is amortized based on the effective interest method over the term of the notes.
The 2019 Notes were issued pursuant to an indenture, dated April 30, 2012, as supplemented by the supplemental indenture, dated February 26, 2014 (collectively, the "2019 Notes Indenture"), between the Company and Deutsche Bank Trust Company Americas (the "Trustee"). The 2019 Notes are the Company's general unsecured obligations that rank senior in right of payment to all of the Company's existing and future indebtedness that is expressly subordinated in right of payment to the 2019 Notes. The 2019 Notes rank equally in right of payment with all of the Company's existing and future liabilities that are not so subordinated. The 2019 Notes effectively rank junior to any of the Company's secured indebtedness (including unsecured indebtedness that the Company later secures) to the extent of the value of the assets securing such indebtedness. The 2019 Notes rank structurally junior to all existing and future indebtedness (including trade payables) incurred by the Company's subsidiaries, financing vehicles or similar facilities.
Interest on the 2019 Notes is paid semi-annually on March 1 and September 1 at a rate of 4.875% per annum. The 2019 Notes mature on March 1, 2019 and may be redeemed in whole or in part at any time or from time to time at the Company's option prior to maturity.
The 2019 Notes Indenture contains certain covenants, including covenants requiring the Company's compliance with (regardless of whether the Company is subject to) the asset coverage requirements set forth in Section 18(a)(1)(A) as modified by Section 61(a)(1) of the Investment Company Act or any successor provisions, as well as covenants requiring the Company to provide financial information to the holders of the 2019 Notes and the Trustee if the Company ceases to be subject to the reporting requirements of the Securities Exchange Act of 1934, as amended (the "Exchange Act"). These covenants are subject to limitations and exceptions that are described in the 2019 Notes Indenture. The Company may repurchase the 2019 Notes in accordance with the Investment Company Act and the rules promulgated thereunder. In addition, holders of the 2019 Notes can require the Company to repurchase the 2019 Notes at 100% of their principal amount upon the occurrence of certain change of control events as described in the 2019 Notes Indenture. The 2019 Notes were issued in minimum denominations of $2,000 and integral multiples of $1,000 in excess thereof. During the year ended September 30, 2018, the Company repurchased and subsequently canceled $21.2 million of the 2019 Notes. The Company recognized a loss of $0.1 million in connection with such transaction. There were no repurchases during the years ended September 30, 2017 and 2016.
For the years ended September 30, 2018, 2017 and 2016, the Company recorded interest expense of $12.6 million, $13.3 million and $13.3 million, respectively, related to the 2019 Notes.
As of September 30, 2018, there were $228.8 million of 2019 Notes outstanding, which had a carrying value and fair value of $228.3 million and $230.5 million, respectively. As of September 30, 2017, there were $250.0 million of 2019 Notes outstanding, which had a carrying value and fair value of $248.4 million and $250.6 million, respectively.
2024 Notes
On October 18, 2012, the Company issued $75.0 million in aggregate principal amount of its 5.875% unsecured 2024 Notes for net proceeds of $72.5 million after deducting underwriting commissions of $2.2 million and offering costs of $0.3 million.
The 2024 Notes were issued pursuant to an indenture, dated April 30, 2012, as supplemented by the first supplemental indenture, dated October 18, 2012 (collectively, the "2024 Notes Indenture"), between the Company and the Trustee. The 2024 Notes are the Company's unsecured obligations and rank senior in right of payment to the Company's existing and future indebtedness that is
143
OAKTREE SPECIALTY LENDING CORPORATION
NOTES TO CONSOLIDATED FINANCIAL STATEMENTS
(in thousands, except share and per share amounts, percentages and as otherwise indicated)
expressly subordinated in right of payment to the 2024 Notes; equal in right of payment to the Company's existing and future unsecured indebtedness that is not so subordinated; effectively junior in right of payment to any of the Company's secured indebtedness (including existing unsecured indebtedness that the Company later secures) to the extent of the value of the assets securing such indebtedness; and structurally junior to all existing and future indebtedness (including trade payables) incurred by the Company's subsidiaries or financing vehicles.
Interest on the 2024 Notes is paid quarterly in arrears on January 30, April 30, July 30 and October 30 at a rate of 5.875% per annum. The 2024 Notes mature on October 30, 2024 and may be redeemed in whole or in part at any time or from time to time at the Company's option on or after October 30, 2017. The 2024 Notes currently trade on the New York Stock Exchange under the symbol “OSLE” with a par value of $25.00 per note.
The 2024 Notes Indenture contains certain covenants, including covenants requiring the Company's compliance with (regardless of whether the Company is subject to) the asset coverage requirements set forth in Section 18(a)(1)(A) as modified by Section 61(a)(1) of the Investment Company Act or any successor provisions and with the restrictions on dividends, distributions and purchase of capital stock set forth in Section 18(a)(1)(B) as modified by Section 61(a)(1) of the Investment Company Act, as well as covenants requiring the Company to provide financial information to the holders of the 2024 Notes and the Trustee if the Company ceases to be subject to the reporting requirements of the Exchange Act. These covenants are subject to limitations and exceptions that are described in the 2024 Notes Indenture. The Company may repurchase the 2024 Notes in accordance with the Investment Company Act and the rules promulgated thereunder. Any 2024 Notes repurchased by the Company may, at the Company's option, be surrendered to the Trustee for cancellation, but may not be reissued or resold by the Company. Any 2024 Notes surrendered for cancellation will be promptly canceled and no longer outstanding under the 2024 Notes Indenture. During the years ended September 30, 2018, 2017 and 2016, the Company did not repurchase any of the 2024 Notes in the open market.
For each of the years ended September 30, 2018, 2017 and 2016, the Company recorded interest expense of $4.6 million related to the 2024 Notes.
As of September 30, 2018, there were $75.0 million of 2024 Notes outstanding, which had a carrying value and fair value of $73.7 million and $75.7 million, respectively. As of September 30, 2017, there were $75.0 million of 2024 Notes outstanding, which had a carrying value and fair value of $73.5 million and $76.0 million, respectively.
2028 Notes
In April and May 2013, the Company issued $86.3 million in aggregate principal amount of its 6.125% unsecured 2028 Notes for net proceeds of $83.4 million after deducting underwriting commissions of $2.6 million and offering costs of $0.3 million.
The 2028 Notes were issued pursuant to an indenture, dated April 30, 2012, as supplemented by the second supplemental indenture, dated April 4, 2013 (collectively, the "2028 Notes Indenture"), between the Company and the Trustee. The 2028 Notes are the Company's unsecured obligations and rank senior in right of payment to the Company's existing and future indebtedness that is expressly subordinated in right of payment to the 2028 Notes; equal in right of payment to the Company's existing and future unsecured indebtedness that is not so subordinated; effectively junior in right of payment to any of the Company's secured indebtedness (including existing unsecured indebtedness that it later secures) to the extent of the value of the assets securing such indebtedness; and structurally junior to all existing and future indebtedness (including trade payables) incurred by the Company's subsidiaries or financing vehicles.
Interest on the 2028 Notes is paid quarterly in arrears on January 30, April 30, July 30 and October 30 at a rate of 6.125% per annum. The 2028 Notes mature on April 30, 2028 and may be redeemed in whole or in part at any time or from time to time at the Company's option on or after April 30, 2018. The 2028 Notes currently trade on the Nasdaq Global Select Market under the symbol "OCSLL" with a par value of $25.00 per note.
The 2028 Notes Indenture contains certain covenants, including covenants requiring the Company's compliance with (regardless of whether it is subject to) the asset coverage requirements set forth in Section 18(a)(1)(A) as modified by Section 61(a)(1) of the Investment Company Act or any successor provisions, as well as covenants requiring the Company to provide financial information to the holders of the 2028 Notes and the Trustee if it ceases to be subject to the reporting requirements of the Exchange Act. These covenants are subject to limitations and exceptions that are described in the 2028 Notes Indenture. The Company may repurchase the 2028 Notes in accordance with the Investment Company Act and the rules promulgated thereunder. Any 2028 Notes repurchased by the Company may, at its option, be surrendered to the Trustee for cancellation, but may not be reissued or resold by the Company. Any 2028 Notes surrendered for cancellation will be promptly canceled and no longer outstanding under the 2028 Notes Indenture. During the years ended September 30, 2018, 2017 and 2016, the Company did not repurchase any of the 2028 Notes in the open market.
144
OAKTREE SPECIALTY LENDING CORPORATION
NOTES TO CONSOLIDATED FINANCIAL STATEMENTS
(in thousands, except share and per share amounts, percentages and as otherwise indicated)
For each of the years ended September 30, 2018, 2017 and 2016, the Company recorded interest expense of $5.5 million related to the 2028 Notes.
As of September 30, 2018, there were $86.3 million of 2028 Notes outstanding, which had a carrying value and fair value of $84.4 million and $86.9 million, respectively. As of September 30, 2017, there were $84.2 million of 2028 Notes outstanding, which had a carrying value and fair value of $84.2 million and $87.5 million, respectively.
Note 14. Secured Borrowings
See Note 2 "Secured Borrowings" for a description of the Company's accounting treatment of secured borrowings.
As of September 30, 2018, there were $12.3 million of secured borrowings outstanding. As of September 30, 2018, secured borrowings at fair value totaled $9.7 million and the fair value of the investment that is associated with these secured borrowings was $34.3 million. These secured borrowings were the result of the Company's completion of partial loan sales totaling $22.8 million of a senior secured debt investment during the fiscal year ended September 30, 2014 that did not meet the definition of a participating interest. As a result, sale treatment was not allowed and these partial loan sales were treated as secured borrowings. The Company receives loan servicing fees as it continues to serve as administrative agent for this investment. As a result, the Company earns servicing fees in connection with the loans that were partially sold. During the years ended September 30, 2018, 2017 and 2016, there were $1.2 million, $5.4 million and $2.9 million of net repayments on secured borrowings, respectively.
For the years ended September 30, 2018, 2017 and 2016, the secured borrowings bore interest at a weighted average interest rate of 5.34%, 8.08% and 7.26%, respectively. For the years ended September 30, 2018, 2017 and 2016, the Company recorded interest expense of $0.7 million, $1.2 million and $1.5 million, respectively, related to the secured borrowings. For the years ended September 30, 2018, 2017 and 2016, the Company recorded unrealized (appreciation) depreciation on secured borrowings of $2.4 million, $(0.3) million and $(0.1) million, respectively. For the year ended September 30, 2018, the unrealized depreciation on secured borrowings was primarily attributable to an increase in credit risk.
Note 15. Derivative Instruments
The Company enters into forward currency contracts from time to time to help mitigate the impact that an adverse change in foreign exchange rates would have on the value of the Company’s investments denominated in foreign currencies. As of September 30, 2018, the counterparty to these forward currency contracts was JPMorgan Chase Bank, N.A. Net unrealized gains or losses on foreign currency contracts are included in “net unrealized gains (losses) on investments and foreign currency” and net realized gains or losses on forward currency contracts are included in “net realized gains (losses) on investments, secured borrowings and foreign currency” in the accompanying consolidated statement of operations. Forward currency contracts and interest rate swaps are considered undesignated derivative instruments.
Certain information related to the Company’s foreign currency forward contracts is presented below as of September 30, 2018.
Description | Notional Amount to be Purchased | Notional Amount to be Sold | Maturity Date | Gross Amount of Recognized Assets | Gross Amount of Recognized Liabilities | Balance Sheet Location of Net Amounts | ||||||||||||||
Foreign currency forward contract | $ | 23,113 | £ | 17,579 | 10/26/2018 | $ | 162 | $ | — | Derivative asset | ||||||||||
Note 16. Commitments and Contingencies
SEC Examination and Investigation
On March 23, 2016, the Division of Enforcement of the SEC sent document subpoenas and document preservation notices to the Company, FSAM, FSCO GP LLC - General Partner of Fifth Street Opportunities Fund, L.P. ("FSOF") and OCSI. The subpoenas sought production of documents relating to a variety of issues principally related to the activities of the Former Adviser, including those raised in an ordinary-course examination of the Former Adviser by the SEC’s Office of Compliance Inspections and Examinations that began in October 2015, and in the previously disclosed securities class actions and other previously disclosed litigation. The subpoenas were issued pursuant to a formal order of private investigation captioned In the Matter of the Fifth Street Group of Companies, No. HO-12925, dated March 23, 2016, which addresses (among other things) (i) the valuation of the Company's portfolio companies and investments, (ii) the expenses allocated or charged to the Company and OCSI, (iii) FSOF’s trading in the securities of publicly traded Business Development Companies, (iv) statements to the Board of Directors, other representatives of pooled investment vehicles, investors, or prospective investors concerning the fair value of the Company's portfolio companies or investments as well as expenses allocated or charged to the Company and OCSI, (v) various issues relating to adoption and implementation of policies and procedures
145
OAKTREE SPECIALTY LENDING CORPORATION
NOTES TO CONSOLIDATED FINANCIAL STATEMENTS
(in thousands, except share and per share amounts, percentages and as otherwise indicated)
under the Investment Advisers Act of 1940, as amended (the “Advisers Act”), (vi) statements and/or potential omissions in the entities’ SEC filings, (vii) the entities’ books, records, and accounts and whether they fairly and accurately reflected the entities’ transactions and dispositions of assets, and (viii) several other issues relating to corporate books and records. The formal order cites various provisions of the Securities Act of 1933, as amended, the Exchange Act and the Advisers Act, as well as rules promulgated under those Acts, as the bases of the investigation. The Company is cooperating with the Division of Enforcement investigation, has produced requested documents, and believe our obligations with respect to the matter are concluded. Oaktree is not subject to these subpoenas.
Off-Balance Sheet Arrangements
The Company may be a party to financial instruments with off-balance sheet risk in the normal course of business to meet the financial needs of its companies. As of September 30, 2018, the Company's only off-balance sheet arrangements consisted of $52.7 million of unfunded commitments, which was comprised of $46.7 million to provide debt financing to certain of its portfolio companies, $1.3 million to provide equity financing to SLF JV I and $4.7 million related to unfunded limited partnership interests. As of September 30, 2017, the Company's only off-balance sheet arrangements consisted of $118.1 million of unfunded commitments, which was comprised of $107.3 million to provide debt financing to certain of its portfolio companies, $1.3 million to provide equity financing to SLF JV I and $9.5 million related to unfunded limited partnership interests. Such commitments are subject to its portfolio companies' satisfaction of certain financial and nonfinancial covenants and may involve, to varying degrees, elements of credit risk in excess of the amount recognized in the Company's Consolidated Statements of Assets and Liabilities.
A list of unfunded commitments by investment (consisting of revolvers, term loans with delayed draw components, SLF JV I LLC equity interests, and limited partnership interests) as of September 30, 2018 and September 30, 2017 is shown in the table below:
146
OAKTREE SPECIALTY LENDING CORPORATION
NOTES TO CONSOLIDATED FINANCIAL STATEMENTS
(in thousands, except share and per share amounts, percentages and as otherwise indicated)
September 30, 2018 | September 30, 2017 | |||||||
P2 Upstream Acquisition Co. | $ | 10,000 | $ | 10,000 | ||||
InMotion Entertainment Group, LLC | 7,534 | 7,544 | ||||||
EOS Fitness Opco Holdings, LLC | 5,000 | 5,000 | ||||||
Pingora MSR Opportunity Fund I, LP (limited partnership interest) | 4,656 | 2,760 | ||||||
Dominion Diagnostics, LLC | 4,180 | 4,180 | ||||||
TerSera Therapeutics, LLC | 3,281 | — | ||||||
Keypath Education, Inc. | 3,000 | 3,000 | ||||||
PLATO Learning Inc. (1) | 2,671 | 2,664 | ||||||
Datto Inc. | 2,356 | — | ||||||
4 Over International, LLC | 2,232 | 2,232 | ||||||
New IPT, Inc. | 2,229 | 2,229 | ||||||
Senior Loan Fund JV 1, LLC | 1,328 | 1,328 | ||||||
Thing5, LLC (1)(2) | 1,298 | 3,000 | ||||||
iCIMs, Inc. | 882 | — | ||||||
Access CIG LLC | 765 | — | ||||||
Ministry Brands, LLC | 700 | 1,708 | ||||||
Cenegenics, LLC (1)(2) | 297 | 297 | ||||||
GKD Index Partners LLC | 289 | — | ||||||
Refac Optical Group | — | 2,080 | ||||||
TransTrade Operators, Inc. | — | 1,052 | ||||||
Valet Merger Sub, Inc. | — | 9,326 | ||||||
Sterling Capital Partners IV, L.P. (limited partnership interest) | — | 490 | ||||||
ACON Equity Partners III, LP (limited partnership interest) | — | 239 | ||||||
Lift Brands Holdings, Inc. | — | 15,000 | ||||||
Edge Fitness, LLC | — | 8,353 | ||||||
Impact Sales, LLC | — | 3,234 | ||||||
WeddingWire, Inc. | — | 3,000 | ||||||
Motion Recruitment Partners LLC | — | 2,900 | ||||||
Traffic Solutions Holdings, Inc. | — | 2,998 | ||||||
OmniSYS Acquisition Corporation | — | 2,500 | ||||||
SPC Partners VI, L.P. (limited partnership interest) | — | 2,000 | ||||||
Metamorph US 3, LLC | — | 1,470 | ||||||
Riverside Fund V, LP (limited partnership interest) | — | 539 | ||||||
Webster Capital III, L.P. (limited partnership) | — | 736 | ||||||
Tailwind Capital Partners II, L.P. (limited partnership interest) | — | 391 | ||||||
Beecken Petty O'Keefe Fund IV, L.P. (limited partnership interest) | — | 472 | ||||||
Moelis Capital Partners Opportunity Fund I-B, L.P. (limited partnership interest) | — | 365 | ||||||
Riverside Fund IV, LP (limited partnership interest) | — | 254 | ||||||
Bunker Hill Capital II (QP), LP (limited partnership interest) | — | 183 | ||||||
SPC Partners V, L.P. (limited partnership interest) | — | 159 | ||||||
Riverlake Equity Partners II, LP (limited partnership interest) | — | 129 | ||||||
Milestone Partners IV, LP (limited partnership interest) | — | 180 | ||||||
BeyondTrust Software, Inc. | — | 5,995 | ||||||
Systems, Inc. | — | 3,030 | ||||||
Ping Identity Corporation | — | 2,500 | ||||||
Sailpoint Technologies, Inc. | — | 1,500 | ||||||
Garretson Firm Resolution Group, Inc. | — | 508 | ||||||
RCP Direct II, LP (limited partnership interest) | — | 364 | ||||||
RCP Direct, LP (limited partnership interest) | — | 184 | ||||||
Total | $ | 52,698 | $ | 118,073 | ||||
___________
(1) This investment was on cash or PIK non-accrual status as of September 30, 2018.
(2) This portfolio company does not have the ability to draw on this unfunded commitment as of September 30, 2018.
147
OAKTREE SPECIALTY LENDING CORPORATION
NOTES TO CONSOLIDATED FINANCIAL STATEMENTS
(in thousands, except share and per share amounts, percentages and as otherwise indicated)
Note 17. Selected Quarterly Financial Data (unaudited)
Selected unaudited quarterly financial data for Oaktree Specialty Lending Corporation for the years ended September 30, 2018, 2017 and 2016 are below:
For or as of the three months ended | ||||||||||||||||||||||||||||||||||||
(dollars in thousands, except per share amounts) | September 30, 2018 | June 30, 2018 | March 31, 2018 | December 31, 2017 | September 30, 2017 | June 30, 2017 | March 31, 2017 | December 31, 2016 | September 30, 2016 | June 30, 2016 | March 31, 2016 | December 31, 2015 | ||||||||||||||||||||||||
Total investment income | $ | 38,220 | $ | 31,847 | $ | 34,779 | $ | 33,876 | $ | 35,732 | $ | 44,917 | $ | 45,555 | $ | 51,760 | $ | 59,160 | $ | 64,026 | $ | 59,563 | $ | 65,122 | ||||||||||||
Net investment income | 17,031 | 14,430 | 15,263 | 13,322 | 11,464 | 19,390 | 18,504 | 23,294 | 25,695 | 29,106 | 25,343 | 26,582 | ||||||||||||||||||||||||
Net realized and unrealized loss, net of taxes | 16,300 | 9,822 | 4,357 | (43,763 | ) | (136,935 | ) | (25,447 | ) | (9,703 | ) | (97,536 | ) | (29,128 | ) | (34,324 | ) | (20,363 | ) | (89,468 | ) | |||||||||||||||
Net increase (decrease) in net assets resulting from operations | 33,331 | 24,252 | 19,620 | (30,441 | ) | (125,471 | ) | (6,057 | ) | 8,801 | (74,242 | ) | (3,433 | ) | (5,218 | ) | 4,980 | (62,886 | ) | |||||||||||||||||
Net assets | 858,035 | 838,095 | 827,234 | 819,595 | 867,657 | 1,010,750 | 1,019,626 | 1,030,272 | 1,142,288 | 1,184,376 | 1,225,974 | 1,263,113 | ||||||||||||||||||||||||
Total investment income per common share | $ | 0.27 | $ | 0.23 | $ | 0.25 | $ | 0.24 | $ | 0.25 | $ | 0.32 | $ | 0.32 | $ | 0.36 | $ | 0.41 | $ | 0.44 | $ | 0.40 | $ | 0.43 | ||||||||||||
Net investment income per common share | 0.12 | 0.10 | 0.11 | 0.09 | 0.08 | 0.14 | 0.13 | 0.16 | 0.18 | 0.20 | 0.17 | 0.18 | ||||||||||||||||||||||||
Earnings (losses) per common share | 0.24 | 0.17 | 0.14 | (0.22 | ) | (0.89 | ) | (0.04 | ) | 0.06 | (0.52 | ) | (0.02 | ) | (0.04 | ) | 0.03 | (0.42 | ) | |||||||||||||||||
Net asset value per common share at period end | 6.09 | 5.95 | 5.87 | 5.81 | 6.16 | 7.17 | 7.23 | 7.31 | 7.97 | 8.15 | 8.33 | 8.41 | ||||||||||||||||||||||||
Note 18. Subsequent Events
The Company’s management evaluated subsequent events through the date of issuance of the Consolidated Financial Statements. There have been no subsequent events that occurred during such period that would require disclosure in, or would be required to be recognized in the Consolidated Financial Statements as of and for the year ended September 30, 2018, except as discussed below:
Distribution Declaration
On November 19, 2018, the Company’s Board of Directors declared a quarterly distribution of $0.095 per share, payable on December 28, 2018 to stockholders of record on December 17, 2018.
148
Schedule 12-14
Oaktree Specialty Lending Corporation
Schedule of Investments in and Advances to Affiliates
(in thousands, except share and per share amounts, percentages and as otherwise indicated)
Year ended September 30, 2018
Portfolio Company/Type of Investment (1) | Cash Interest Rate | Industry | Principal | Net Realized Gain (Loss) | Amount of Interest, Fees or Dividends Credited in Income (2) | Fair Value at October 1, 2017 | Gross Additions (3) | Gross Reductions (4) | Fair Value at September 30, 2018 | % of Total Net Assets | ||||||||||||||||||||||||||
Control Investments | ||||||||||||||||||||||||||||||||||||
AdVenture Interactive, Corp. | Advertising | |||||||||||||||||||||||||||||||||||
9,073 shares of common units | $ | — | $ | — | $ | — | $ | 13,818 | $ | 136 | $ | (13,954 | ) | $ | — | — | % | |||||||||||||||||||
Ameritox Ltd. | Healthcare services | |||||||||||||||||||||||||||||||||||
First Lien Term Loan, LIBOR+5% (1% floor) cash 3% PIK due 4/11/2021 | — | (30,103 | ) | 75 | 4,445 | 33,094 | (37,539 | ) | — | — | % | |||||||||||||||||||||||||
14,090,126.4 Class A Preferred Units in Ameritox Holdings II, LLC | — | (14,090 | ) | — | — | 14,090 | (14,090 | ) | — | — | % | |||||||||||||||||||||||||
1,602,260.83 Class B Preferred Units in Ameritox Holdings II, LLC | — | (1,602 | ) | — | — | 1,602 | (1,602 | ) | — | — | % | |||||||||||||||||||||||||
4,930.03 Class A Units in Ameritox Holdings II, LLC | — | (29,049 | ) | — | — | 29,049 | (29,049 | ) | — | — | % | |||||||||||||||||||||||||
Eagle Hospital Physicians, LLC | Healthcare services | |||||||||||||||||||||||||||||||||||
Earn-out | — | (848 | ) | — | 4,986 | 3,017 | (8,003 | ) | — | — | % | |||||||||||||||||||||||||
First Star Bermuda Aviation Limited (5) | Airlines | |||||||||||||||||||||||||||||||||||
First Lien Term Loan, 9% cash 3% PIK due 8/19/2018 | — | 392 | 1,390 | 11,868 | 305 | (12,173 | ) | — | — | % | ||||||||||||||||||||||||||
100% equity interest | — | 808 | — | 2,323 | 5,543 | (7,866 | ) | — | — | % | ||||||||||||||||||||||||||
First Star Speir Aviation Limited (5) | Airlines | |||||||||||||||||||||||||||||||||||
First Lien Term Loan, 9% cash due 12/15/2020 | 32,510 | — | 2,050 | 41,395 | 1,557 | (10,442 | ) | 32,510 | 3.8 | % | ||||||||||||||||||||||||||
100% equity interest | — | — | — | 3,926 | 3,546 | (7,472 | ) | — | — | % | ||||||||||||||||||||||||||
Keypath Education, Inc. | Advertising | |||||||||||||||||||||||||||||||||||
First Lien Term Loan, LIBOR+7% (1% floor) cash due 4/3/2022 | 9.39 | % | 18,146 | — | 1,791 | 19,960 | — | (1,814 | ) | 18,146 | 2.1 | % | ||||||||||||||||||||||||
First Lien Revolver, LIBOR+7.75% (1% floor) cash due 4/3/2022 | — | — | 17 | — | 1 | (1 | ) | — | — | % | ||||||||||||||||||||||||||
9,073 Class A Units in FS AVI Holdco, LLC | — | — | — | 7,918 | 66 | — | 7,984 | 0.9 | % | |||||||||||||||||||||||||||
New IPT, Inc. | Oil & gas equipment services | |||||||||||||||||||||||||||||||||||
First Lien Term Loan, LIBOR+5% (1% floor) cash due 3/17/2021 | 7.39 | % | 4,107 | — | 303 | 4,107 | — | — | 4,107 | 0.5 | % | |||||||||||||||||||||||||
Second Lien Term Loan, LIBOR+5.1% (1% floor) cash due 9/17/2021 | 7.49 | % | 1,453 | — | 149 | 2,504 | — | (1,051 | ) | 1,453 | 0.2 | % | ||||||||||||||||||||||||
First Lien Revolver, LIBOR+5% (1% floor) cash due 3/17/2021 | 7.39 | % | 1,009 | — | 79 | 1,009 | — | — | 1,009 | 0.1 | % | |||||||||||||||||||||||||
50.087 Class A Common Units in New IPT Holdings, LLC | — | — | — | 736 | 1,555 | — | 2,291 | 0.3 | % | |||||||||||||||||||||||||||
Senior Loan Fund JV I, LLC (6) | Multi-sector holdings | |||||||||||||||||||||||||||||||||||
Class A Mezzanine Secured Deferrable Floating Rate Notes due 2036 in SLF Repack Issuer 2016 LLC | 8.33 | % | 99,813 | — | 9,014 | 101,030 | — | (1,217 | ) | 99,813 | 11.6 | % | ||||||||||||||||||||||||
Class B Mezzanine Secured Deferrable Fixed Rate Notes, 10% cash due 2036 in SLF Repack Issuer 2016 LLC | 29,520 | — | 3,814 | 27,641 | 2,057 | (178 | ) | 29,520 | 3.4 | % | ||||||||||||||||||||||||||
87.5% equity interest | — | — | — | 5,525 | — | (5,484 | ) | 41 | — | % | ||||||||||||||||||||||||||
149
Portfolio Company/Type of Investment (1) | Cash Interest Rate | Industry | Principal | Net Realized Gain (Loss) | Amount of Interest, Fees or Dividends Credited in Income (2) | Fair Value at October 1, 2017 | Gross Additions (3) | Gross Reductions (4) | Fair Value at September 30, 2018 | % of Total Net Assets | ||||||||||||||||||||||||||
Traffic Solutions Holdings, Inc. | Construction & engineering | |||||||||||||||||||||||||||||||||||
First Lien Term Loan, LIBOR+7% (1% floor) cash 2% PIK due 4/1/2021 | $ | — | $ | — | $ | 3,174 | $ | 36,568 | $ | 393 | $ | (36,961 | ) | $ | — | — | % | |||||||||||||||||||
First Lien Revolver, LIBOR+6% (1% floor) cash due 4/1/2021 | — | — | 85 | 1,250 | 753 | (2,003 | ) | — | — | % | ||||||||||||||||||||||||||
LC Facility, 6% cash due 4/1/2021 | — | — | 164 | 4,752 | 4 | (4,756 | ) | — | — | % | ||||||||||||||||||||||||||
746,114 Series A Preferred Units, 10% | — | (10,462 | ) | — | 7,700 | 12,329 | (20,029 | ) | — | — | % | |||||||||||||||||||||||||
746,114 Common Stock Unit | — | (5,316 | ) | — | — | 5,316 | (5,316 | ) | — | — | % | |||||||||||||||||||||||||
TransTrade Operators, Inc. | Air freight and logistics | |||||||||||||||||||||||||||||||||||
First Lien Term Loan, 5% cash due 12/31/2017 | — | (15,574 | ) | — | 1,810 | 15,574 | (17,384 | ) | — | — | % | |||||||||||||||||||||||||
First Lien Revolver, 8% cash due 12/31/2017 | — | (7,757 | ) | — | — | 8,497 | (8,497 | ) | — | — | % | |||||||||||||||||||||||||
596.67 Series A Common Units | — | — | — | — | — | — | — | — | % | |||||||||||||||||||||||||||
4,000 Series A Preferred Units in TransTrade Holdings LLC | — | (4,000 | ) | — | — | 4,000 | (4,000 | ) | — | — | % | |||||||||||||||||||||||||
5,200,000 Series B Preferred Units in TransTrade Holding LLC | — | (5,200 | ) | — | — | 5,200 | (5,200 | ) | — | — | % | |||||||||||||||||||||||||
Total Control Investments | $ | 186,558 | $ | (122,801 | ) | $ | 22,105 | $ | 305,271 | $ | 147,684 | $ | (256,081 | ) | $ | 196,874 | 22.9 | % | ||||||||||||||||||
Affiliate Investments | ||||||||||||||||||||||||||||||||||||
AmBath/ReBath Holdings, Inc. | Home improvement retail | |||||||||||||||||||||||||||||||||||
First Lien Term Loan B, 12.5% cash 2.5% PIK due 8/31/2018 | — | — | 1,738 | 22,957 | 308 | (23,265 | ) | — | — | % | ||||||||||||||||||||||||||
4,668,788 shares of Preferred Stock | — | 2,048 | — | 1,827 | 221 | (2,048 | ) | — | — | % | ||||||||||||||||||||||||||
Caregiver Services, Inc. | Healthcare services | |||||||||||||||||||||||||||||||||||
Second Lien Term Loan, 10% cash 2% PIK due 6/30/2019 | — | — | 753 | 9,665 | 216 | (9,881 | ) | — | — | % | ||||||||||||||||||||||||||
1,080,399 shares of Series A Preferred Stock, 10% | — | — | — | 2,534 | — | (373 | ) | 2,161 | 0.3 | % | ||||||||||||||||||||||||||
Total Affiliate Investments | $ | — | $ | 2,048 | $ | 2,491 | $ | 36,983 | $ | 745 | $ | (35,567 | ) | $ | 2,161 | 0.3 | % | |||||||||||||||||||
Total Control & Affiliate Investments | $ | 186,558 | $ | (120,753 | ) | $ | 24,596 | $ | 342,254 | $ | 148,429 | $ | (291,648 | ) | $ | 199,035 | 23.2 | % | ||||||||||||||||||
This schedule should be read in connection with the Company's Consolidated Financial Statements, including the Consolidated Schedules of Investments and Notes to the Consolidated Financial Statements.
______________________
(1) | The principal amount and ownership detail are shown in the Company's Consolidated Schedules of Investments. |
(2) | Represents the total amount of interest (net of non-accrual amounts), fees and dividends credited to income for the portion of the period an investment was included in the Control or Affiliate categories. |
(3) | Gross additions include increases in the cost basis of investments resulting from new portfolio investments, follow-on investments, accrued PIK interest (net of non-accrual amounts) and the exchange of one or more existing securities for one or more new securities. Gross additions also include net increases in unrealized appreciation or net decreases in unrealized depreciation as well as the movement of an existing portfolio company into this category or out of a different category. |
(4) | Gross reductions include decreases in the cost basis of investment resulting from principal payments or sales and exchanges of one or more existing securities for one or more new securities. Gross reductions also include net increases in unrealized depreciation or net decreases in unrealized appreciation as well as the movement of an existing portfolio company out of this category and into a different category. |
(5) | First Star Bermuda Aviation Limited and First Star Speir Aviation Limited are wholly-owned holding companies formed by the Company in order to facilitate its investment strategy. In accordance with ASU 2013-08, the Company has deemed the holding companies to be investment companies under GAAP and therefore deemed it appropriate to consolidate the financial results and financial position of the holding companies and to recognize dividend income versus a combination of interest income and dividend income. Accordingly, the debt and equity investments in the wholly-owned holding companies are disregarded for accounting purposes since the economic substance of these instruments are equity investments in the operating entities. |
(6) | Together with Kemper, the Company co-invests through SLF JV I. SLF JV I is capitalized as transactions are completed and all portfolio and investment decisions in respect to SLF JV I must be approved by the SLF JV I investment committee consisting of representatives of the Company and Kemper (with approval from a representative of each required). |
150
Schedule 12-14
Oaktree Specialty Lending Corporation
Schedule of Investments in and Advances to Affiliates
(in thousands, except share and per share amounts, percentages and as otherwise indicated)
Year ended September 30, 2017
Portfolio Company/Type of Investment (1) | Cash Interest Rate | Industry | Principal | Net Realized Gain (Loss) | Amount of Interest, Fees or Dividends Credited in Income (2) | Fair Value at October 1, 2016 | Gross Additions (3) | Gross Reductions (4) | Fair Value at September 30, 2017 | % of Total Net Assets | ||||||||||||||||||||||||||
Control Investments | ||||||||||||||||||||||||||||||||||||
Traffic Solutions Holdings, Inc. | Construction & engineering | |||||||||||||||||||||||||||||||||||
First Lien Term Loan, LIBOR+7% (1% floor) cash 2% PIK due 4/1/2021 | 8.34 | % | $ | 36,567 | $ | — | $ | 4,243 | $ | 36,328 | $ | 1,303 | $ | (1,063 | ) | $ | 36,568 | 4.2 | % | |||||||||||||||||
First Lien Revolver, LIBOR+6% (1% floor) cash due 4/1/2021 | 7.34 | % | 1,250 | — | 122 | 2,800 | 1,261 | (2,811 | ) | 1,250 | 0.1 | % | ||||||||||||||||||||||||
LC Facility, 6% cash due 4/1/2021 | 4,752 | — | 236 | 3,518 | 1,248 | (14 | ) | 4,752 | 0.5 | % | ||||||||||||||||||||||||||
746,114 Series A Preferred Units, 10% | — | — | 1,471 | 20,094 | 3,201 | (15,595 | ) | 7,700 | 0.9 | % | ||||||||||||||||||||||||||
746,114 Common Stock Units | — | — | — | — | 2,284 | (2,284 | ) | — | — | % | ||||||||||||||||||||||||||
TransTrade Operators, Inc. (7) | Air freight and logistics | |||||||||||||||||||||||||||||||||||
First Lien Term Loan, 5% cash due 12/31/2017 | 15,973 | — | 8 | 7,046 | 644 | (5,880 | ) | 1,810 | 0.2 | % | ||||||||||||||||||||||||||
First Lien Revolver, 8% cash due 12/31/2017 | 7,757 | — | (4 | ) | — | 2,680 | (2,680 | ) | — | — | % | |||||||||||||||||||||||||
596.67 Series A Common Units | — | — | — | — | — | — | — | % | ||||||||||||||||||||||||||||
4,000 Series A Preferred Units in TransTrade Holdings LLC | — | — | — | — | — | — | — | % | ||||||||||||||||||||||||||||
5,200,000 Series B Preferred Units in TransTrade Holdings LLC | — | — | — | — | — | — | — | % | ||||||||||||||||||||||||||||
First Star Aviation, LLC (6) | Airlines | |||||||||||||||||||||||||||||||||||
10,104,401 Common Units | — | (3,767 | ) | — | 2,413 | 3,120 | (5,533 | ) | — | — | % | |||||||||||||||||||||||||
First Star Speir Aviation Limited (6) | Airlines | |||||||||||||||||||||||||||||||||||
First Lien Term Loan, 9% cash due 12/15/2020 | 41,395 | — | 2,618 | 54,214 | 4,031 | (16,850 | ) | 41,395 | 4.8 | % | ||||||||||||||||||||||||||
100% equity interest | — | — | — | 2,839 | 8,500 | (7,413 | ) | 3,926 | 0.5 | % | ||||||||||||||||||||||||||
First Star Bermuda Aviation Limited (6) | Airlines | |||||||||||||||||||||||||||||||||||
First Lien Term Loan, 9% cash 3% PIK due 8/19/2018 | 11,868 | — | 915 | 11,851 | 179 | (162 | ) | 11,868 | 1.4 | % | ||||||||||||||||||||||||||
100% equity interest | — | — | — | 5,729 | 58 | (3,464 | ) | 2,323 | 0.3 | % | ||||||||||||||||||||||||||
Eagle Hospital Physicians, LLC | Healthcare services | |||||||||||||||||||||||||||||||||||
First Lien Term Loan A, 8% PIK due 4/30/2017 | — | (13,812 | ) | 571 | 13,875 | 1,058 | (14,933 | ) | — | — | % | |||||||||||||||||||||||||
First Lien Term Loan B, 8.1% PIK due 4/30/2017 | — | — | 81 | 3,887 | 4,189 | (8,076 | ) | — | — | % | ||||||||||||||||||||||||||
First Lien Revolver, 8% cash due 4/30/2017 | — | — | 156 | 1,913 | 2,257 | (4,170 | ) | — | — | % | ||||||||||||||||||||||||||
4,100,000 Class A Common Units | — | — | — | 7,421 | 4,100 | (11,521 | ) | — | — | % | ||||||||||||||||||||||||||
Earn-out | — | — | — | — | 7,851 | (2,865 | ) | 4,986 | 0.6 | % | ||||||||||||||||||||||||||
Senior Loan Fund JV I, LLC (5) | Multi-sector holdings | |||||||||||||||||||||||||||||||||||
Subordinated Notes, LIBOR+8% cash due 5/2/2021 | — | (19,857 | ) | 2,859 | 129,004 | 16,546 | (145,550 | ) | — | — | % | |||||||||||||||||||||||||
Class A Mezzanine Secured Deferrable Floating Rate Notes due 2036 in SLF Repack Issuer 2016 LLC | 6.88 | % | 101,030 | — | 5,225 | — | 101,030 | — | 101,030 | 11.6 | % | |||||||||||||||||||||||||
Class B Mezzanine Secured Deferrable Fixed Rate Notes, 15% PIK due 2036 in SLF Repack Issuer 2016 LLC | 27,641 | — | 2,977 | — | 27,641 | — | 27,641 | 3.2 | % | |||||||||||||||||||||||||||
87.5% LLC equity interest | — | — | 1,050 | 13,708 | 434 | (8,617 | ) | 5,525 | 0.6 | % | ||||||||||||||||||||||||||
Express Group Holdings LLC | Oil & gas equipment services | |||||||||||||||||||||||||||||||||||
First Lien Term Loan, LIBOR+6% (1% floor) cash due 9/3/2019 | — | (22,312 | ) | (110 | ) | 1,193 | 12,073 | (13,266 | ) | — | — | % | ||||||||||||||||||||||||
First Lien Revolver, LIBOR+4.5% (1% floor) cash due 3/4/2019 | — | — | (2 | ) | 6,090 | 5,211 | (11,301 | ) | — | — | % | |||||||||||||||||||||||||
Last-In Revolver, PRIME+3.5% (3.5% floor) cash due 10/7/2016 | — | — | 106 | 3,000 | — | (3,000 | ) | — | — | % | ||||||||||||||||||||||||||
14,033,391 Series B Preferred Units | — | — | — | — | 3,982 | (3,982 | ) | — | — | % | ||||||||||||||||||||||||||
280,668 Series A Preferred Units | — | — | — | — | 1,593 | (1,593 | ) | — | — | % | ||||||||||||||||||||||||||
1,456,344 Common Units | — | — | — | — | — | — | — | — | % | |||||||||||||||||||||||||||
151
Portfolio Company/Type of Investment (1) | Cash Interest Rate | Industry | Principal | Net Realized Gain (Loss) | Amount of Interest, Fees or Dividends Credited in Income (2) | Fair Value at October 1, 2016 | Gross Additions (3) | Gross Reductions (4) | Fair Value at September 30, 2017 | % of Total Net Assets | ||||||||||||||||||||||||||
Ameritox Ltd. (7) | Healthcare services | |||||||||||||||||||||||||||||||||||
First Lien Term Loan, LIBOR+5% (1% floor) cash 3% PIK due 4/11/2021 | 6.33 | % | $ | 38,338 | $ | — | $ | 2,428 | $ | 31,039 | $ | 9,151 | $ | (35,745 | ) | $ | 4,445 | 0.5 | % | |||||||||||||||||
14,090,126.4 Class A Preferred A Units in Ameritox Holdings II, LLC | — | — | — | 15,437 | 1,423 | (16,860 | ) | — | — | % | ||||||||||||||||||||||||||
1,602,260.83 Class B Preferred A Units in Ameritox Holdings II, LLC | — | — | — | 1,755 | 162 | (1,917 | ) | — | — | % | ||||||||||||||||||||||||||
4,930.03 Common Units in Ameritox Holdings II, LLC | — | — | — | 13,113 | — | (13,113 | ) | — | — | % | ||||||||||||||||||||||||||
New IPT, Inc. | Oil & gas equipment services | |||||||||||||||||||||||||||||||||||
First Lien Term Loan, LIBOR+5% (1% floor) cash due 3/17/2021 | 6.33 | % | 4,107 | — | 140 | — | 4,107 | — | 4,107 | 0.5 | % | |||||||||||||||||||||||||
Second Lien Term Loan, LIBOR+5.1% (1% floor) cash due 9/17/2021 | 6.43 | % | 2,504 | — | 87 | — | 2,504 | — | 2,504 | 0.3 | % | |||||||||||||||||||||||||
First Lien Revolver, LIBOR+5% (1% floor) cash due 3/17/2021 | 6.33 | % | 1,009 | 26 | 39 | — | 1,009 | — | 1,009 | 0.1 | % | |||||||||||||||||||||||||
50.087 Class A Common Units in New IPT Holdings, LLC | — | — | — | — | 736 | — | 736 | 0.1 | % | |||||||||||||||||||||||||||
AdVenture Interactive, Corp. | Advertising | |||||||||||||||||||||||||||||||||||
9,073 shares of common stock | — | — | — | — | 24,466 | (10,648 | ) | 13,818 | 1.6 | % | ||||||||||||||||||||||||||
Keypath Education, Inc. | Advertising | |||||||||||||||||||||||||||||||||||
First Lien Term Loan, LIBOR+7% (1% floor) cash due 4/3/2022 | 8.33 | % | 19,960 | — | 835 | — | 19,960 | — | 19,960 | 2.3 | % | |||||||||||||||||||||||||
First Lien Revolver, LIBOR+7% (1% floor) cash due 4/3/2022 | 8.33 | % | — | — | 8 | — | — | — | — | — | % | |||||||||||||||||||||||||
9,073 Class A Units in FS AVI Holdco, LLC | — | — | — | — | 10,648 | (2,730 | ) | 7,918 | 0.9 | % | ||||||||||||||||||||||||||
Total Control Investments | $ | 314,151 | $ | (59,722 | ) | $ | 26,059 | $ | 388,267 | $ | 290,640 | $ | (373,636 | ) | $ | 305,271 | 35.2 | % | ||||||||||||||||||
Affiliate Investments | ||||||||||||||||||||||||||||||||||||
Caregiver Services, Inc. | Healthcare services | |||||||||||||||||||||||||||||||||||
Second Lien Term Loan, 10% cash 2% PIK due 6/30/2019 | 9,719 | — | 1,170 | 9,549 | 232 | (116 | ) | 9,665 | 1.1 | % | ||||||||||||||||||||||||||
1,080,399 shares of Series A Preferred Stock, 10% | — | — | — | 4,079 | 5 | (1,550 | ) | 2,534 | 0.3 | % | ||||||||||||||||||||||||||
AmBath/ReBath Holdings, Inc. | Home improvement retail | |||||||||||||||||||||||||||||||||||
First Lien Term Loan B, 12.5% cash 2.5% PIK due 8/31/2018 | 22,956 | — | 4,310 | 24,268 | 995 | (2,306 | ) | 22,957 | 2.6 | % | ||||||||||||||||||||||||||
4,668,788 shares of Preferred Stock | — | — | — | 1,873 | 349 | (395 | ) | 1,827 | 0.2 | % | ||||||||||||||||||||||||||
Total Affiliate Investments | $ | 32,675 | $ | — | $ | 5,480 | $ | 39,769 | $ | 1,581 | $ | (4,367 | ) | $ | 36,983 | 4.3 | % | |||||||||||||||||||
Total Control & Affiliate Investments | $ | 346,826 | $ | (59,722 | ) | $ | 31,539 | $ | 428,036 | $ | 292,221 | $ | (378,003 | ) | $ | 342,254 | 39.4 | % | ||||||||||||||||||
This schedule should be read in connection with the Company's Consolidated Financial Statements, including the Consolidated Schedules of Investments and Notes to the Consolidated Financial Statements.
______________________
(1) | The principal amount and ownership detail are shown in the Company's Consolidated Schedules of Investments. |
(2) | Represents the total amount of interest, fees and dividends credited to income for the portion of the year an investment was included in the Control or Affiliate categories. |
(3) | Gross additions include increases in the cost basis of investments resulting from new portfolio investments, follow-on investments and accrued PIK interest (net of non-accrual amounts), and the exchange of one or more existing securities for one or more new securities. Gross additions also include net increases in unrealized appreciation or net decreases in unrealized depreciation as well as the movement of an existing portfolio company into this category or out of a different category. |
(4) | Gross reductions include decreases in the cost basis of investment resulting from principal payments or sales and exchanges of one or more existing securities for one or more new securities. Gross reductions also include net increases in unrealized depreciation or net |
152
decreases in unrealized appreciation as well as the movement of an existing portfolio company out of this category and into a different category.
(5) | Together with Kemper, the Company co-invests through SLF JV I. SLF JV I is capitalized as transactions are completed and all portfolio and investment decisions in respect to SLF JV I must be approved by the SLF JV I investment committee consisting of representatives of the Company and Kemper (with approval from a representative of each required). |
(6) | First Star Aviation, LLC, First Star Bermuda Aviation Limited and First Star Speir Aviation 1 Limited are wholly-owned holding companies formed by the Company in order to facilitate its investment strategy. In accordance with ASU 2013-08, the Company has deemed the holding companies to be investment companies under GAAP and therefore deemed it appropriate to consolidate the financial results and financial position of the holding companies and to recognize dividend income versus a combination of interest income and dividend income. Accordingly, the debt and equity investments in the wholly-owned holding companies are disregarded for accounting purposes since the economic substance of these instruments are equity investments in the operating entities. |
(7) | This investment was on cash non-accrual status as of September 30, 2017. |
153
Item 9. Changes in and Disagreements with Accountants on Accounting and Financial Disclosure
Not applicable.
Item 9A. Controls and Procedures
(a) Evaluation of Disclosure Controls and Procedures
Management, with the participation of the Company’s Chief Executive Officer and Chief Financial Officer, evaluated the effectiveness of our disclosure controls and procedures as of September 30, 2018. The term “disclosure controls and procedures,” as defined in Rules 13a-15(e) and 15d-15(e) under the Exchange Act, means controls and other procedures of a company that are designed to ensure that information required to be disclosed by a company in the reports that it files or submits under the Exchange Act is recorded, processed, summarized and reported, within the time periods specified in the SEC’s rules and forms. Disclosure controls and procedures include, without limitation, controls and procedures designed to ensure that information required to be disclosed by a company in the reports that it files or submits under the Exchange Act is accumulated and communicated to the company’s management, including its chief executive officer and chief financial officer, as appropriate to allow timely decisions regarding required disclosure. Management recognizes that any controls and procedures, no matter how well designed and operated, can provide only reasonable assurance of achieving their objectives. Based on the evaluation of our disclosure controls and procedures as of September 30, 2018, our Chief Executive Officer and Chief Financial Officer concluded that our disclosure controls and procedures were effective, at the reasonable assurance level, in timely identifying, recording, processing, summarizing and reporting any material information relating to us that is required to be disclosed in the reports we file or submit under the Exchange Act.
(b) Management's Report on Internal Control Over Financial Reporting
Management is responsible for establishing and maintaining adequate internal control over financial reporting, as such term is defined in Rules 13a-15(f) and 15d-15(f) under the Exchange Act. A company’s internal control over financial reporting is a process designed by, or under the supervision of, its chief executive officer and chief financial officer, and effected by such company's Board of Directors, management and other personnel to provide reasonable assurance regarding the reliability of financial reporting and the preparation of financial statements for external purposes in accordance with GAAP and includes those policies and procedures that:
(i) pertain to the maintenance of records that, in reasonable detail, accurately and fairly reflect the transactions and dispositions of the assets of the company;
(ii) provide reasonable assurance that transactions are recorded as necessary to permit preparation of financial statements in accordance with generally accepted accounting principles, and that receipts and expenditures of the company are being made only in accordance with authorizations of management and directors of the company; and
(iii) provide reasonable assurance regarding prevention or timely detection of unauthorized acquisition, use, or disposition of the company’s assets that could have a material effect on the financial statements.
Because of its inherent limitations, internal control over financial reporting may not prevent or detect misstatements. Also, projections of any evaluation of effectiveness to future periods are subject to the risk that controls may become inadequate because of changes in conditions, or that the degree of compliance with the policies or procedures may deteriorate.
Management, with the participation of our Chief Executive Officer and Chief Financial Officer, has conducted an evaluation of the effectiveness of our internal control over financial reporting as of September 30, 2018, based on the framework set forth in Internal Control-Integrated Framework (2013) issued by the Committee of Sponsoring Organizations of the Treadway Commission (COSO). Based on our evaluation, management concluded that our internal control over financial reporting was effective as of September 30, 2018.
The effectiveness of our internal control over financial reporting as of September 30, 2018 has been audited by Ernst & Young LLP, an independent registered public accounting firm, as stated in their report which appears herein.
154
(c) Changes in Internal Controls Over Financial Reporting
There were no changes in our internal control over financial reporting that occurred during the fourth fiscal quarter ended September 30, 2018 that have materially affected, or are reasonably likely to materially affect, our internal control over financial reporting.
Item 9B. Other Information
None.
PART III — OTHER INFORMATION
Item 10. Directors, Executive Officers and Corporate Governance
The information required by Item 10 is hereby incorporated by reference from our definitive Proxy Statement relating to our 2019 Annual Meeting of Stockholders, to be filed with the Securities and Exchange Commission within 120 days following the end of our fiscal year.
Item 11. Executive Compensation
The information required by Item 11 is hereby incorporated by reference from our definitive Proxy Statement relating to our 2019 Annual Meeting of Stockholders, to be filed with the Securities and Exchange Commission within 120 days following the end of our fiscal year.
Item 12. Security Ownership of Certain Beneficial Owners and Management and Related Stockholder Matters
The information required by Item 12 is hereby incorporated by reference from our definitive Proxy Statement relating to our 2019 Annual Meeting of Stockholders, to be filed with the Securities and Exchange Commission within 120 days following the end of our fiscal year.
Item 13. Certain Relationships and Related Transactions, and Director Independence
The information required by Item 13 is hereby incorporated by reference from our definitive Proxy Statement relating to our 2019 Annual Meeting of Stockholders, to be filed with the Securities and Exchange Commission within 120 days following the end of our fiscal year.
Item 14. Principal Accountant Fees and Services
The information required by Item 14 is hereby incorporated by reference from our definitive Proxy Statement relating to our 2019 Annual Meeting of Stockholders, to be filed with the Securities and Exchange Commission within 120 days following the end of our fiscal year.
PART IV
Item 15. Exhibits, Financial Statement Schedules
The following documents are filed or incorporated by reference as part of this Annual Report:
1. Consolidated Financial Statements
Reports of Independent Registered Public Accounting Firms | |
Consolidated Statements of Assets and Liabilities as of September 30, 2018 and 2017 | |
Consolidated Statements of Operations for the Years Ended September 30, 2018, 2017 and 2016 | |
Consolidated Statements of Changes in Net Assets for the Years Ended September 30, 2018, 2017 and 2016 | |
Consolidated Statements of Cash Flows for the Years Ended September 30, 2018, 2017 and 2016 | |
Consolidated Schedule of Investments as of September 30, 2018 | |
Consolidated Schedule of Investments as of September 30, 2017 | |
Notes to Consolidated Financial Statements | |
155
2. Financial Statement Schedule
The following financial statement schedule is filed herewith:
Schedule 12-14 — Investments in and advances to affiliates | |
156
3. Exhibits required to be filed by Item 601 of Regulation S-K
The following exhibits are filed as part of this report or hereby incorporated by reference to exhibits previously filed with the SEC:
Restated Certificate of Incorporation of the Registrant (Incorporated by reference to Exhibit 3.1 filed with Registrant’s Form 8-A (File No. 001-33901) filed on January 2, 2008). | ||
Certificate of Amendment to the Registrant’s Restated Certificate of Incorporation (Incorporated by reference to Exhibit (a)(2) filed with Registrant’s Registration Statement on Form N-2 (File No. 333-146743) filed on June 6, 2008). | ||
Certificate of Correction to the Certificate of Amendment to the Registrant’s Restated Certificate of Incorporation (Incorporated by reference to Exhibit (a)(3) filed with Registrant’s Registration Statement on Form N-2 (File No. 333-146743) filed on June 6, 2008). | ||
Certificate of Amendment to Registrant’s Restated Certificate of Incorporation (Incorporated by reference to Exhibit 3.1 filed with Registrant’s Quarterly Report on Form 10-Q (File No. 001-33901) filed on May 5, 2010). | ||
Certificate of Amendment to Registrant’s Certificate of Incorporation (Incorporated by reference to Exhibit (a)(5) filed with the Registrant’s Registration Statement on Form N-2 (File No. 333-180267) filed on April 2, 2013). | ||
Certificate of Amendment to the Restated Certificate of Incorporation of the Registrant, dated as of October 17, 2017 (Filed with the Registrant’s Form 8-K (File No. 814-00755) filed on October 17, 2017). | ||
Fourth Amended and Restated Bylaws of the Registrant (Incorporated by reference to Exhibit 3.1 filed with Registrant’s Form 8-K (File No. 814-00755) filed on January 29, 2018). | ||
Form of Common Stock Certificate (Incorporated by reference to Exhibit 4.1 filed with Registrant’s Form 8-A (File No. 001-33901) filed on January 2, 2008). | ||
Indenture, dated April 30, 2012, between Registrant and Deutsche Bank Trust Company Americas, as trustee (Incorporated by reference to Exhibit (d)(4) filed with Registrant’s Registration Statement on Form N-2 (File No. 333-180267) filed on July 27, 2012). | ||
Form of First Supplemental Indenture relating to the 5.875% Notes due 2024, between the Registrant and Deutsche Bank Trust Company Americas, as trustee (including Form of 5.875% Notes due 2024) (Incorporated by reference to Exhibit (d)(5) filed with the Registrant’s Registration Statement on Form N-2 (File No. 333-180267) filed on October 18, 2012). | ||
Form of Second Supplemental Indenture relating to the 6.125% Notes due 2028, between the Registrant and Deutsche Bank Trust Company Americas, as trustee (including Form of 6.125% Notes due 2028) (Incorporated by reference to Exhibit (d)(7) filed with the Registrant’s Registration Statement on Form N-2 (File No. 333-180267) filed on April 2, 2013). | ||
Form of Third Supplemental Indenture relating to the 4.875% Notes due 2019, between the Registrant and Deutsche Bank Trust Company Americas, as trustee (including Form of 4.875% Notes due 2019) (Incorporated by reference to Exhibit (d)(6) filed with the Registrant’s Registration Statement on Form N-2 (File No. 333-192770) filed on February 26, 2014). | ||
157
Fourth Supplemental Indenture, dated as of October 17, 2017, between Registrant and Deutsche Bank Trust Company Americas, as trustee (Incorporated by reference to Exhibit 4.1 filed with the Registrant’s Form 8-K (File No. 814-00755) filed on October 17, 2017). | ||
Form of Note relating to the 4.875% Notes due 2019, between Registrant and Deutsche Bank Trust Company Americas, as trustee (Incorporated by reference to Exhibit 4.2 filed with the Registrant’s Form 8-K (File No. 814-00755) filed on October 17, 2017). | ||
Form of Note relating to the 5.875% Notes due 2024, between Registrant and Deutsche Bank Trust Company Americas, as trustee (Incorporated by reference to Exhibit 4.3 filed with the Registrant’s Form 8-K (File No. 814-00755) filed on October 17, 2017). | ||
Form of Note relating to the 6.125% Notes due 2028, between Registrant and Deutsche Bank Trust Company Americas, as trustee (Incorporated by reference to Exhibit 4.4 filed with the Registrant’s Form 8-K (File No. 814-00755) filed on October 17, 2017). | ||
Investment Advisory Agreement, dated as of October 17, 2017, between the Registrant and Oaktree Capital Management, L.P. (Incorporated by reference to Exhibit 10.1 filed with the Registrant’s Form 8-K (File No. 814-00755) filed on October 17, 2017). | ||
Custody Agreement (Incorporated by reference to Exhibit 10.1 filed with Registrant’s Form 10-Q (File No. 001-33901) filed on January 31, 2011). | ||
Amended and Restated Dividend Reinvestment Plan (Incorporated by reference to Exhibit 10.1 filed with Registrant’s Form 8-K (File No. 001-33901) filed on October 28, 2010). | ||
Senior Loan Fund JV I, LLC Limited Liability Company Agreement, dated May 2, 2014, by and between Oaktree Specialty Lending Corporation and Trinity Universal Insurance Company (Incorporated by reference to Exhibit 10.1 filed with the Registrant’s Form 8-K (File No. 001-33901) filed on May 7, 2014). | ||
Purchase and Settlement Agreement, dated February 18, 2016, by and among Registrant, Fifth Street Holdings L.P., Leonard M. Tannenbaum, Fifth Street Asset Management Inc., RiverNorth Capital Management, LLC, RiverNorth Capital Partners, L.P., RiverNorth Institutional Partners, L.P., RiverNorth Core Opportunity Fund, RiverNorth/DoubleLine Strategic Income Fund, Randy I. Rochman, Fred G. Steingraber and Murray R. Wise (Incorporated by reference to Exhibit 10.1 filed with Registrant’s Form 8-K (File No. 001-33901) filed on February 19, 2016). | ||
Amendment No. 1 to the Purchase and Settlement Agreement, dated as of February 23, 2016, by and among Oaktree Specialty Lending Corporation, Fifth Street Holdings L.P., Leonard M. Tannenbaum, Fifth Street Asset Management Inc., RiverNorth Capital Management, LLC, RiverNorth Capital Partners, L.P., RiverNorth Institutional Partners, L.P., RiverNorth Core Opportunity Fund and RiverNorth/DoubleLine Strategic Income Fund, Randy I. Rochman, Fred G. Steingraber and Murray R. Wise (Incorporated by reference to Exhibit 10.2 filed with Registrant’s Form 8-K (File No. 001-33901) filed on February 24, 2016). | ||
Administration Agreement, dated as of October 17, 2017, between the Registrant and Oaktree Administrator (Incorporated by reference to Exhibit 10.2 filed with the Registrant’s Form 8-K (File No. 814-00755) filed on October 17, 2017). | ||
158
Pledge Agreement, dated as of October 17, 2017, between the Registrant and Fifth Street Holdings L.P. (Incorporated by reference to Exhibit 10.3 filed with the Registrant’s Form 8-K (File No. 814-00755) filed on October 17, 2017). | ||
Senior Secured Revolving Credit Agreement, dated as of November 30, 2017, among the Registrant, as Borrower, the lenders party thereto, ING Capital LLC, as administrative agent, ING Capital LLC, JPMorgan Chase Bank, N.A. and Merrill Lynch, Pierce, Fenner & Smith Incorporated as joint lead arrangers and joint bookrunners, and JPMorgan Chase Bank, N.A. and Bank of America, N.A., as syndication agents (Incorporated by reference to Exhibit 10.1 filed with the Registrant’s Current Report on Form 8-K (File No. 814-00755) filed on December 4, 2017). | ||
Amendment No. 1 to the Senior Secured Revolving Credit Agreement, dated July 10, 2018, by and among the Registrant, the lenders party thereto and ING Capital LLC as administrative agent for the lenders (Incorporated by reference to Exhibit 10.1 filed with the Registrant's Current Report on Form 8-K (File No. 814-00755) filed on July 11, 2018). | ||
Joint Code of Ethics of the Registrant and Oaktree Strategic Income Corporation (Incorporated by reference to Exhibit 14.1 filed with the Registrant's Form 10-K (File No. 814-00755) filed on November 29, 2017). | |||
Code of Ethics of Oaktree Capital Management, L.P. (Incorporated by reference to Exhibit 14.2 filed with the Registrant's Form 10-K (File No. 814-00755) filed on November 29, 2017). | |||
21 | Subsidiaries of Registrant and jurisdiction of incorporation/organizations: Fifth Street Funding, LLC — Delaware Fifth Street Fund of Funds LLC — Delaware Fifth Street Mezzanine Partners IV, L.P. — Delaware Fifth Street Mezzanine Partners V, L.P. — Delaware FSMP IV GP, LLC — Delaware FSMP V GP, LLC — Delaware FSFC Holdings, Inc. — Delaware | ||
Power of Attorney (included on the signature page hereto). | |||
Certification of Chief Executive Officer Pursuant to Rule 13a-14(a) under the Securities Exchange Act of 1934. | |||
Certification of Chief Financial Officer Pursuant to Rule 13a-14(a) under the Securities Exchange Act of 1934. | |||
Certification of Chief Executive Officer Pursuant to Section 906 of the Sarbanes-Oxley Act of 2002 (18 U.S.C. 1350). | |||
Certification of Chief Financial Officer Pursuant to Section 906 of the Sarbanes-Oxley Act of 2002 (18 U.S.C. 1350). | |||
* | Filed herewith. |
159
SIGNATURES
Pursuant to the requirements of Section 13 or 15(d) of the Securities Exchange Act of 1934, the registrant has duly caused this report to be signed on its behalf by the undersigned, thereunto duly authorized.
OAKTREE SPECIALTY LENDING CORPORATION | ||
By: | /s/ Edgar Lee | |
Edgar Lee | ||
Chief Executive Officer | ||
By: | /s/ Mel Carlisle | |
Mel Carlisle | ||
Chief Financial Officer and Treasurer | ||
Date: November 28, 2018
POWER OF ATTORNEY
KNOW ALL MEN BY THESE PRESENTS, that each person whose signature appears below hereby constitutes and appoints Edgar Lee, Mel Carlisle and Mathew Pendo, and each of them (with full power to each of them to act alone), his true and lawful attorneys-in-fact and agents, with full power of substitution and re-substitution, for him and on his behalf and in his name, place and stead, in any and all capacities, to sign, execute and file this Annual Report on Form 10-K for the fiscal year ended September 30, 2018, and any or all amendments to this Report, with all exhibits and any and all documents required to be filed with respect thereto, with the Securities and Exchange Commission or any other regulatory authority, granting unto such attorneys-in-fact and agents, and each of them, full power and authority to do and perform each and every act and thing appropriate or necessary to be done in order to effectuate the same, as fully to all intents and purposes as he himself might or could do in person, hereby ratifying and confirming all that such attorneys-in-fact and agents, or any of them, or their or his or her substitute or substitutes, may lawfully do or cause to be done by virtue hereof.
Pursuant to the requirements of the Securities Exchange Act of 1934, this report has been signed below by the following persons on behalf of the registrant and in the capacities and on the dates indicated.
160
Signature | Title | Date | ||
/s/ EDGAR LEE Edgar Lee | Chief Executive Officer (principal executive officer) | November 28, 2018 | ||
/s/ MEL CARLISLE Mel Carlisle | Chief Financial Officer and Treasurer (principal financial officer and principal accounting officer) | November 28, 2018 | ||
/s/ RICHARD P. DUTKIEWICZ Richard P. Dutkiewicz | Director | November 28, 2018 | ||
/s/ JOHN B. FRANK John B. Frank | Director | November 28, 2018 | ||
/s/ CRAIG JACOBSON Craig Jacobson | Director | November 28, 2018 | ||
/s/ RICHARD G. RUBEN Richard G. Ruben | Director | November 28, 2018 | ||
/s/ BRUCE ZIMMERMAN Bruce Zimmerman | Director | November 28, 2018 | ||
161