Attached files
| file | filename |
|---|---|
| 8-K - 8-K - PLANTRONICS INC /CA/ | q119earningsrelease8-k.htm |

PRESS RELEASE
INVESTOR CONTACT: Mike Iburg Vice President, Investor Relations (831) 458-7533 | MEDIA CONTACT: George Gutierrez Sr. Director, Global Communications & Content Strategy (831) 458-7537 |
Plantronics Announces First Quarter Fiscal Year 2019 Financial Results
Net Revenues Exceed Guidance Driven by Gaming, 8% Y/Y Enterprise Revenue Growth Driven by UC&C
SANTA CRUZ, Calif., - August 7, 2018 - Plantronics, Inc. (NYSE: PLT) today announced first quarter results for the period ending June 30, 2018. Highlights of the first quarter include the following (comparisons are against the first quarter Fiscal Year 2018):
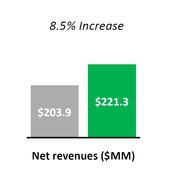
• | Net revenues were $221.3 million, an increase of 8.5% year-over-year, and above our guidance range of $205 million to $215 million |
• | GAAP gross margin was 49.6% compared with 50.6% |
◦ | Non-GAAP gross margin was 50.1% compared with 51.9% |
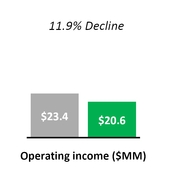
• | GAAP operating income was $20.6 million compared with $23.4 million, and within our guidance range of $17 to $23 million |
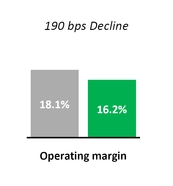
◦ | Non-GAAP operating income was $35.9 million compared with $36.9 million, and within our guidance range of $34 to $40 million |
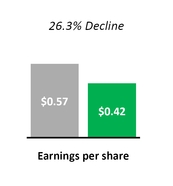
• | GAAP diluted earnings per share ("EPS") was $0.42 compared with $0.57, and above our guidance range of $0.29 to $0.41 |
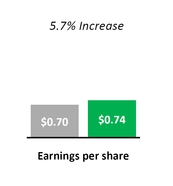
◦ | Non-GAAP diluted EPS was $0.74 compared with $0.70, and within our guidance range of $0.66 to $0.78 |
Year-over-year GAAP Results
Year-over-year Non-GAAP Results
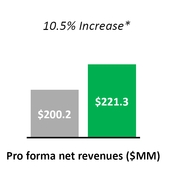


*For comparative purposes, prior year quarter has been adjusted to exclude approximately $3.7 million of revenues from our Clarity brand, which we divested in the first quarter of Fiscal Year 2018.
A reconciliation between our GAAP and non-GAAP results is provided in the tables at the end of this press release.
1
“We continued to see strong Enterprise growth driven by UC&C in the quarter,” stated Joe Burton, President and Chief Executive Officer. "As UC&C adoption increases across the market, Plantronics and Polycom are uniquely positioned to offer a more integrated and seamless experience for our customers as they work, share, collaborate, and play from any environment."
"Our strategy of focusing on the fast-growing UC&C market continues to build top line momentum for Plantronics," stated Pam Strayer, Executive Vice President and Chief Financial Officer. "As we work to integrate Plantronics and Polycom and deliver the cost synergies previously discussed, we expect to accelerate our long-term growth through innovations in endpoints, software and services, while improving profitability for the combined business."
Highlights for the First Quarter Fiscal Year 2019
• | The Company completed the acquisition of Polycom on July 2, 2018, which will accelerate and expand Plantronics vision and enable it to deliver the broadest portfolio of intelligent end points in the Unified Communications and Collaboration (UC&C) ecosystem. |
• | Net revenues exceeded the Company's guidance range primarily due to growth in Gaming. Gross margins were within the long-term target model despite significant growth in lower-margin Gaming revenues. Operating income was within our guidance range, however, operating margin was unfavorably impacted by increased Gaming revenue and higher operating expenses. |
• | Enterprise revenues grew 8% compared to the prior year quarter and matched our recent all-time record high revenues, driven primarily by higher UC&C sales. |
• | Polycom announced that RealConnect Service, its cloud-based interoperability solution, now supports Microsoft Teams along with the Polycom Trio and Polycom MSR. Additionally, Polycom continued to enhance its leadership in open collaboration endpoints with the launch of new Zoom Room bundles with the Polycom Trio "Smart Conference Phone" as the Zoom controller. |
• | Plantronics was honored with the Frost & Sullivan Company of the Year Award for the Global Professional Headset Industry. Frost & Sullivan noted our outstanding performance, vision, and innovation, as well as our transformative acquisition of Polycom. To receive the Frost & Sullivan Company of the Year Award a market participant must demonstrate excellence in growth, innovation, and leadership. |
Plantronics Announces Quarterly Dividend of $0.15
The Plantronics Board of Directors has declared a quarterly cash dividend of $0.15 per common share, to be paid on September 10, 2018, to all shareholders of record as of the close of market on August 20, 2018.
Business Outlook
The following statements are based on our current expectations, and many of these statements are forward-looking. Actual results are subject to a variety of risks and uncertainties and may differ materially from our expectations.
We are providing non-GAAP guidance for the combined companies in a manner that is comparable to past period results. Actual results will be different from this due to accounting adjustments made at the time of the acquisition of Polycom under U.S. GAAP accounting. For example, these acquisition-related accounting adjustments are expected to temporarily reduce revenue recognized from acquired deferred revenue balances, increase the value of acquired inventory, as well as add intangible assets to our balance sheet, which will be amortized over the future expected life of the assets. The specific impact of these adjustments is unknown at this time but will be recorded in our September quarter results when they are published.
We currently expect the following range of financial results for the second quarter of Fiscal Year 2019 (all amounts include the impact of the Polycom acquisition, which was completed on July 2, 2018, and assuming currency rates remain stable):
• | Non-GAAP adjusted net revenues of $500 million to $530 million; |
◦ | Organic growth of 1% at the midpoint |
• | Non-GAAP operating income of $74 million to $86 million; |
• | Assuming a non-GAAP tax rate of 19.0% and approximately 40.3 million diluted average weighted shares outstanding: |
• | Non-GAAP diluted EPS of $1.00 to $1.25 |
2
Our non-GAAP adjusted net revenue, operating income, and EPS outlook for the second quarter of Fiscal Year 2019 exclude the impact of above-mentioned acquisition-related accounting adjustments, which may be material. Given the proximity of the completion of the acquisition to our earnings release date, our assessment of the impact of these charges cannot be completed nor effectively forecasted at this time without unreasonable effort. Furthermore, with respect to our operating income and diluted EPS guidance, we will no longer provide forward-looking guidance on a GAAP basis. We have determined that we are unable to provide quantitative reconciliations of these forward-looking non-GAAP measures to the most directly comparable forward-looking GAAP measures with a reasonable degree of confidence in their accuracy without unreasonable effort, as items including stock based compensation, litigation gains and losses, and impacts from discrete tax adjustments and tax laws are inherently uncertain and depend on various factors, many of which are beyond our control.
Our business is inherently difficult to forecast, particularly with continuing uncertainty in regional economic conditions, currency fluctuations, customer cancellations and rescheduling, and there can be no assurance that expectations of incoming orders over the balance of the current quarter will materialize.
Conference Call and Prepared Remarks
Plantronics is providing an earnings overview in combination with its press release. The overview is offered to provide shareholders and analysts with additional detail for analyzing results in advance of our quarterly conference call. The overview will be available in the Investor Relations section of our corporate website at investor.plantronics.com along with this press release. A reconciliation between our GAAP and non-GAAP results is provided in the tables at the end of this press release.
We have scheduled a conference call to discuss first quarter of Fiscal Year 2019 financial results. The conference call will take place today, August 7, 2018 at 2:00 PM (Pacific Time). All interested investors and potential investors in our stock are invited to participate. To listen to the call, please dial in five to ten minutes prior to the scheduled starting time and refer to the “Plantronics Conference Call.” The dial-in from North America is (888) 301-8736 and the international dial-in is (706) 634-7260.
The conference call will also be simultaneously webcast in the Investor Relations section of our website. A replay of the call with the conference ID #55437192 will be available until October 6, 2018 at (855) 859-2056 for callers from North America and at (404) 537-3406 for all other callers.
Use of Non-GAAP Financial Information
To supplement our condensed consolidated financial statements presented on a GAAP basis, we use non-GAAP measures of operating results, including non-GAAP gross profit, non-GAAP operating income, non-GAAP net income and non-GAAP diluted EPS, which exclude certain unusual or non-cash expenses and charges that are included in the most directly comparable GAAP measure. These unusual or non-cash expenses and charges include stock-based compensation, acquisition related expenses, purchase accounting amortization, restructuring and other related charges and credits, asset impairments, executive transition charges, and the impact of participating securities, all net of any associated tax impact. We also exclude tax benefits from the release of tax reserves, discrete tax adjustments including transfer pricing, tax deduction and tax credit adjustments, and the impact of tax law changes. We exclude these expenses from our non-GAAP measures primarily because management does not believe they are part of our target operating model. We believe that the use of non-GAAP financial measures provides meaningful supplemental information regarding our performance and liquidity and helps investors compare actual results with our long-term target operating model goals. We believe that both management and investors benefit from referring to these non-GAAP financial measures in assessing our performance and when planning, forecasting and analyzing future periods; however, non-GAAP financial measures are not meant to be considered in isolation or as a substitute for, or superior to, gross margin, operating income, operating margin, net income or EPS prepared in accordance with GAAP.
Safe Harbor
This release contains forward-looking statements within the meaning of Section 27A of the Securities Act of 1933, as amended, and Section 21E of the Securities Exchange Act of 1934, as amended, including statements relating to: (i) our expectations regarding the adoption of UC&C and our related strategy to focus on UC&C solutions we believe customers desire; (ii) our expectations concerning the benefits of the acquisition of Polycom, cost synergies, profitability and growth; (iii) estimates of non-GAAP financial results for the second quarter of Fiscal Year 2019, including net revenues, operating income and diluted EPS; (iv) expectations for organic growth; (v) our estimates of stock-based compensation, as well as the impact of non-cash expenses on non-GAAP operating income and diluted EPS for the second quarter of Fiscal Year 2019; and (vi) our estimate of weighted average shares outstanding for the second quarter of Fiscal Year 2019, in addition to other matters discussed in this press release that are not purely historical data. We do not assume any obligation to update or revise any such forward-looking statements, whether as the result of new developments or otherwise.
3
Forward-looking statements involve risks and uncertainties that may cause actual results to differ materially from those contemplated by such statements. Among the factors that could cause actual results to differ materially from those contemplated are:
• | Micro and macro-economic conditions in our domestic and international markets; |
• | our ability to realize and achieve positive financial results projected to arise in the Enterprise market from UC&C adoption could be adversely affected by a variety of factors including the following: (i) as UC&C becomes more widely adopted, the risk that competitors will offer solutions that will effectively commoditize our products which, in turn, will reduce the sales prices for those products; (ii) our plans are dependent upon adoption of our UC&C solution by major platform providers and strategic partners such as Microsoft Corporation, Cisco Systems, Inc., Avaya, Inc., Alcatel-Lucent, and Huawei, and our influence over such providers with respect to the functionality of their platforms or their product offerings, their rate of deployment, and their willingness to integrate their platforms and product offerings with our solutions is limited; (iii) delays or limitations on our ability to timely introduce solutions that are cost effective, feature-rich, stable, and attractive to our customers within forecasted development budgets; (iv) our successful implementation and execution of new and different processes involving the design, development, and manufacturing of complex electronic systems composed of hardware, firmware, and software that works seamlessly and continuously in a wide variety of environments and with multiple devices; (v) failure of UC&C solutions generally, or our solutions in particular, to be adopted with the breadth and speed we anticipate; (vi) our sales model and expertise must successfully evolve to support complex integration of hardware, software, and services with UC&C infrastructure consistent with changing customer purchasing expectations; (vii) as UC&C becomes more widely adopted we anticipate that competition for market share will increase, particularly given that some competitors may have superior technical and economic resources; (viii) sales cycles for more complex UC&C deployments are longer as compared to our traditional Enterprise products; (ix) our inability to timely and cost-effectively adapt to changing business requirements may impact our profitability in this market and our overall margins; and (x) our failure to expand our technical support capabilities to support the complex and proprietary platforms in which our UC&C products are and will be integrated; |
• | regarding the Polycom acquisition: (i) we may be unable to integrate Polycom's business within our own in a timely and cost-efficient manner or do so without adversely impacting operations, including new product launches; (ii) expected synergies or operating efficiencies may fail to materialize in whole or part or may not occur within expected time-frames; (iii) the acquisition may adversely impact ours or Polycom's relationships with respective customers, suppliers and strategic partners and their operating results and businesses generally (including the diversion of management time on transaction-related issues); (iv) each company may be unable to retain and hire all or a portion of their respective key personnel; (v) legal and regulatory enforcement matters that are pending at Polycom may adversely impact the results of the combined company; (vi) our increased leverage as a result of the transaction will be substantially greater than prior to the acquisition which may pose risks, including reduced flexibility to make changes in our operations in response to business or economic conditions, increased borrowing costs, as well as penalties or costs should we fail to comply with terms of the financial agreements such as debt ratios and financial and operation performance targets; (vii) negative effects on the market price of our common stock as a result of the transaction, particularly in light of the issuance of our stock in the transaction; (viii) our financial reporting including those resulting from the adoption of new accounting pronouncements and associated system implementations in the context of the transaction, our ability to forecast financial results of the combined company and that we may be unable to successfully integrate our reporting system causing an adverse impact to our ability to make timely and accurate filings with the SEC and other domestic and foreign governmental agencies; (ix) the potential impact of the transaction on our future tax rate and payments based on the consolidation global entity and our ability to quickly integrate foreign operations; (x) the challenges of integrating the supply chains of the two companies; and (xi) the potential that our due diligence did not uncover risks and potential liabilities of Polycom; |
• | failure to match production to demand given long lead times and the difficulty of forecasting unit volumes and acquiring the component parts and materials to meet demand without having excess inventory or incurring cancellation charges; |
• | volatility in prices from our suppliers, including our manufacturers located in China, have in the past and could in the future negatively affect our profitability and/or market share; |
• | fluctuations in foreign exchange rates; |
• | new or greater tariffs on our products; |
• | with respect to our stock repurchase program, prevailing stock market conditions generally, and the price of our stock specifically; |
• | the bankruptcy or financial weakness of distributors or key customers, or the bankruptcy of or reduction in capacity of our key suppliers; |
• | additional risk factors including: interruption in the supply of sole-sourced critical components, continuity of component supply at costs consistent with our plans, and the inherent risks of our substantial foreign operations; and |
• | seasonality in one or more of our product categories. |
4
For more information concerning these and other possible risks, please refer to our Annual Report on Form 10-K filed with the Securities and Exchange Commission on May 9, 2018 and other filings with the Securities and Exchange Commission, as well as recent press releases. The Securities and Exchange Commission filings can be accessed over the Internet at http://www.sec.gov/edgar/searchedgar/companysearch.html.
Financial Summaries
The following related charts are provided:
• |
• |
• |
About Plantronics
Plantronics is an audio pioneer and a leader in the communications industry. Plantronics technology creates rich, natural, people-first audio and collaboration experiences so good ideas can be shared and heard-wherever, whenever and however they happen. The company’s portfolio of integrated communications and collaboration solutions spans headsets, software, desk phones, audio and video conferencing, analytics and services. Our solutions are used worldwide by consumers and businesses alike and are the leading choice for every kind of workspace. For more information visit plantronics.com.
Plantronics and Polycom are registered trademarks of Plantronics, Inc. The Bluetooth name and the Bluetooth trademarks are owned by Bluetooth SIG, Inc. and are used by Plantronics, Inc. under license. All other trademarks are the property of their respective owners.
PLANTRONICS, INC. / 345 Encinal Street / P.O. Box 1802 / Santa Cruz, California 95060
831-426-6060 / Fax 831-426-6098
5
PLANTRONICS, INC. | |||||||||
SUMMARY CONDENSED CONSOLIDATED FINANCIAL STATEMENTS | |||||||||
($ in thousands, except per share data) | |||||||||
UNAUDITED CONSOLIDATED STATEMENTS OF OPERATIONS | |||||||||
Three Months Ended | |||||||||
June 30, | |||||||||
2017 | 2018 | ||||||||
Net revenues | $ | 203,926 | $ | 221,309 | |||||
Cost of revenues | 100,643 | 111,466 | |||||||
Gross profit | 103,283 | 109,843 | |||||||
Gross profit % | 50.6 | % | 49.6 | % | |||||
Research, development, and engineering | 21,213 | 23,701 | |||||||
Selling, general, and administrative | 56,233 | 64,203 | |||||||
(Gain) loss, net from litigation settlements | (176 | ) | (30 | ) | |||||
Restructuring and other related charges (credits) | 2,573 | 1,320 | |||||||
Total operating expenses | 79,843 | 89,194 | |||||||
Operating income | 23,440 | 20,649 | |||||||
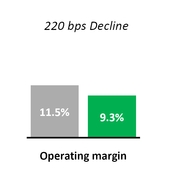
Operating income % | 11.5 | % | 9.3 | % | |||||
Interest expense | (7,303 | ) | (7,327 | ) | |||||
Other non-operating income, net | 914 | 1,996 | |||||||
Income before income taxes | 17,051 | 15,318 | |||||||
Income tax expense | (1,777 | ) | 847 | ||||||
Net income (loss) | $ | 18,828 | $ | 14,471 | |||||
% of net revenues | 9.2 | % | 6.5 | % | |||||
Earnings per common share: | |||||||||
Basic | $ | 0.58 | $ | 0.43 | |||||
Diluted | $ | 0.57 | $ | 0.42 | |||||
Shares used in computing earnings per common share: | |||||||||
Basic | 32,506 | 32,594 | |||||||
Diluted | 33,211 | 33,534 | |||||||
Effective tax rate | (10.4 | )% | 5.5 | % | |||||
6
PLANTRONICS, INC. | |||||||||
SUMMARY CONDENSED CONSOLIDATED FINANCIAL STATEMENTS | |||||||||
($ in thousands) | |||||||||
UNAUDITED CONSOLIDATED BALANCE SHEETS | |||||||||
March 31, | June 30, | ||||||||
2018 | 2018 | ||||||||
ASSETS | |||||||||
Cash and cash equivalents | $ | 390,661 | $ | 631,042 | |||||
Short-term investments | 269,313 | 14,147 | |||||||
Total cash, cash equivalents, and short-term investments | 659,974 | 645,189 | |||||||
Accounts receivable, net | 152,888 | 161,529 | |||||||
Inventory, net | 68,276 | 68,138 | |||||||
Other current assets | 18,588 | 55,265 | |||||||
Total current assets | 899,726 | 930,121 | |||||||
Property, plant, and equipment, net | 142,129 | 139,577 | |||||||
Goodwill and purchased intangibles, net | 15,498 | 15,498 | |||||||
Deferred tax assets | 17,873 | 13,737 | |||||||
Other assets | $ | 1,661 | $ | 975 | |||||
Total assets | $ | 1,076,887 | $ | 1,099,908 | |||||
LIABILITIES AND STOCKHOLDERS' EQUITY | |||||||||
Accounts payable | $ | 45,417 | $ | 50,349 | |||||
Accrued liabilities | 80,097 | 75,278 | |||||||
Total current liabilities | 125,514 | 125,627 | |||||||
Long-term debt, net of issuance costs | 492,509 | 492,871 | |||||||
Long-term income taxes payable | 87,328 | 87,495 | |||||||
Other long-term liabilities | 18,566 | 19,382 | |||||||
Total liabilities | 723,917 | 725,375 | |||||||
Stockholders' equity | 352,970 | 374,533 | |||||||
Total liabilities and stockholders' equity | $ | 1,076,887 | $ | 1,099,908 | |||||
7
PLANTRONICS, INC. | |||||||||
SUMMARY CONDENSED CONSOLIDATED FINANCIAL STATEMENTS | |||||||||
($ in thousands, except per share data) | |||||||||
UNAUDITED CONSOLIDATED STATEMENTS OF CASH FLOWS | |||||||||
Three Months Ended | |||||||||
June 30, | |||||||||
2017 | 2018 | ||||||||
Cash flows from operating activities | |||||||||
Net Income | $ | 18,828 | $ | 14,471 | |||||
Adjustments to reconcile net income to net cash provided by operating activities: | |||||||||
Depreciation and amortization | 5,382 | 5,248 | |||||||
Amortization of debt issuance cost | 362 | 362 | |||||||
Stock-based compensation | 9,256 | 8,150 | |||||||
Deferred income taxes | 6,606 | 4,632 | |||||||
Provision for excess and obsolete inventories | 529 | 612 | |||||||
Restructuring charges (credits) | 2,573 | 1,320 | |||||||
Cash payments for restructuring charges | (1,905 | ) | (835 | ) | |||||
Other operating activities | 503 | (274 | ) | ||||||
Changes in assets and liabilities: | |||||||||
Accounts receivable, net | 6,465 | 5,302 | |||||||
Inventory, net | (2,241 | ) | (400 | ) | |||||
Current and other assets | (2,704 | ) | 2,981 | ||||||
Accounts payable | 989 | 5,688 | |||||||
Accrued liabilities | (18,467 | ) | (7,300 | ) | |||||
Income taxes | (13,291 | ) | (7,875 | ) | |||||
Cash provided by operating activities | 12,885 | 32,082 | |||||||
Cash flows from investing activities | |||||||||
Proceeds from sale of investments | 21,571 | 124,640 | |||||||
Proceeds from maturities of investments | 58,298 | 131,017 | |||||||
Purchase of investments | (83,279 | ) | (394 | ) | |||||
Acquisitions, net of cash acquired | — | (33,550 | ) | ||||||
Capital expenditures | (3,047 | ) | (3,868 | ) | |||||
Cash provided by (used for) investing activities | (6,457 | ) | 217,845 | ||||||
Cash flows from financing activities | |||||||||
Repurchase of common stock | (13,492 | ) | — | ||||||
Employees' tax withheld and paid for restricted stock and restricted stock units | (10,485 | ) | (13,035 | ) | |||||
Proceeds from issuances under stock-based compensation plans | 9,204 | 10,558 | |||||||
Payment of cash dividends | (5,014 | ) | (5,014 | ) | |||||
Cash used for financing activities | (19,787 | ) | (7,491 | ) | |||||
Effect of exchange rate changes on cash and cash equivalents | 1,873 | (2,055 | ) | ||||||
Net increase in cash and cash equivalents | (11,486 | ) | 240,381 | ||||||
Cash and cash equivalents at beginning of period | 301,970 | 390,661 | |||||||
Cash and cash equivalents at end of period | $ | 290,484 | $ | 631,042 | |||||
8
PLANTRONICS, INC. | ||||||||
UNAUDITED RECONCILIATIONS OF GAAP MEASURES TO NON-GAAP MEASURES | ||||||||
($ in thousands, except per share data) | ||||||||
UNAUDITED CONSOLIDATED STATEMENTS OF OPERATIONS DATA | ||||||||
Three Months Ended | ||||||||
June 30, | ||||||||
2017 | 2018 | |||||||
GAAP Gross profit | $ | 103,283 | $ | 109,843 | ||||
Stock-based compensation | 902 | 963 | ||||||
Loss on sale of assets | 899 | — | ||||||
Impairment of indirect tax asset | 686 | — | ||||||
Non-GAAP Gross profit | $ | 105,770 | $ | 110,806 | ||||
Non-GAAP Gross profit % | 51.9 | % | 50.1 | % | ||||
GAAP Research, development, and engineering | $ | 21,213 | $ | 23,701 | ||||
Stock-based compensation | (2,101 | ) | (2,222 | ) | ||||
Purchase accounting amortization | (63 | ) | — | |||||
Non-GAAP Research, development, and engineering | $ | 19,049 | $ | 21,479 | ||||
GAAP Selling, general, and administrative | $ | 56,233 | $ | 64,203 | ||||
Stock-based compensation | (6,253 | ) | (4,965 | ) | ||||
Acquisition related fees | — | (5,803 | ) | |||||
Non-GAAP Selling, general, and administrative | $ | 49,980 | $ | 53,435 | ||||
GAAP Operating expenses | $ | 79,843 | $ | 89,194 | ||||
Stock-based compensation | (8,354 | ) | (7,187 | ) | ||||
Acquisition related fees | — | (5,803 | ) | |||||
Restructuring and other related (charges) credits | (2,573 | ) | (1,320 | ) | ||||
Purchase accounting amortization | (63 | ) | — | |||||
Non-GAAP Operating expenses | $ | 68,853 | $ | 74,884 | ||||
9
PLANTRONICS, INC. | ||||||||||
UNAUDITED RECONCILIATIONS OF GAAP MEASURES TO NON-GAAP MEASURES | ||||||||||
($ in thousands, except per share data) | ||||||||||
UNAUDITED CONSOLIDATED STATEMENTS OF OPERATIONS DATA (CONTINUED) | ||||||||||
Three Months Ended | ||||||||||
June 30, | ||||||||||
2017 | 2018 | |||||||||
GAAP Operating income | $ | 23,440 | $ | 20,649 | ||||||
Stock-based compensation | 9,256 | 8,150 | ||||||||
Acquisition related fees | — | 5,803 | ||||||||
Restructuring and other related charges (credits) | 2,573 | 1,320 | ||||||||
Loss on sale of assets | 899 | — | ||||||||
Impairment of indirect tax asset | 686 | — | ||||||||
Purchase accounting amortization | 63 | — | ||||||||
Non-GAAP Operating income | $ | 36,917 | $ | 35,922 | ||||||
GAAP Net income | $ | 18,828 | $ | 14,471 | ||||||
Stock-based compensation | 9,256 | 8,150 | ||||||||
Acquisition related fees | — | 5,803 | ||||||||
Restructuring and other related charges (credits) | 2,573 | 1,320 | ||||||||
Loss on sale of assets | 899 | — | ||||||||
Impairment of indirect tax asset | 686 | — | ||||||||
Purchase accounting amortization | 63 | — | ||||||||
Income tax effect of above items | (5,445 | ) | (4,866 | ) | ||||||
Income tax effect of unusual tax items | (3,661 | ) | 1 | (99 | ) | 2 | ||||
Non-GAAP Net income | $ | 23,199 | $ | 24,779 | ||||||
GAAP Diluted earnings per common share | $ | 0.57 | $ | 0.42 | ||||||
Stock-based compensation | 0.28 | 0.24 | ||||||||
Acquisition related fees | — | 0.17 | ||||||||
Restructuring and other related charges (credits) | 0.08 | 0.04 | ||||||||
Loss on sale of assets | 0.03 | — | ||||||||
Impairment of indirect tax asset | 0.02 | — | ||||||||
Income tax effect | (0.28 | ) | (0.14 | ) | ||||||
Effect of participating securities | — | 0.01 | ||||||||
Non-GAAP Diluted earnings per common share | $ | 0.70 | $ | 0.74 | ||||||
Shares used in diluted earnings per common share calculation: | 32,818 | 33,534 | ||||||||
1 | Excluded amounts represent tax benefits resulting from the correction of an immaterial error and the release of tax reserves. |
2 | Excluded amounts represent the release of tax reserves and federal return to provision adjustments. |
10
Summary of Unaudited Reconciliations of GAAP Measures to Non-GAAP Measures and other Unaudited GAAP Data | |||||||||||||||||||||
($ in thousands, except per share data) | |||||||||||||||||||||
Q118 | Q218 | Q318 | Q418 | Q119 | |||||||||||||||||
GAAP Gross profit | $ | 103,283 | $ | 107,632 | $ | 114,125 | $ | 114,075 | $ | 109,843 | |||||||||||
Stock-based compensation | 902 | 890 | 917 | 913 | 963 | ||||||||||||||||
Loss on sale of assets | 899 | — | — | — | — | ||||||||||||||||
Impairment of indirect tax asset | 686 | — | — | — | — | ||||||||||||||||
Non-GAAP Gross profit | $ | 105,770 | $ | 108,522 | $ | 115,042 | $ | 114,988 | $ | 110,806 | |||||||||||
Non-GAAP Gross profit % | 51.9 | % | 51.6 | % | 50.8 | % | 53.2 | % | 50.1 | % | |||||||||||
GAAP Operating expenses | $ | 79,843 | $ | 77,473 | $ | 77,354 | $ | 80,944 | $ | 89,194 | |||||||||||
Stock-based compensation | (8,354 | ) | (7,872 | ) | (7,112 | ) | (6,999 | ) | (7,187 | ) | |||||||||||
Acquisition related fees | — | — | — | (6,252 | ) | (5,803 | ) | ||||||||||||||
Restructuring and other related (charges) credits | (2,573 | ) | 51 | 84 | (13 | ) | (1,320 | ) | |||||||||||||
Executive transition costs | — | (549 | ) | — | — | — | |||||||||||||||
Purchase accounting amortization | (63 | ) | (17 | ) | — | — | — | ||||||||||||||
Non-GAAP Operating expenses | $ | 68,853 | $ | 69,086 | $ | 70,326 | $ | 67,680 | $ | 74,884 | |||||||||||
GAAP Operating income | $ | 23,440 | $ | 30,159 | $ | 36,771 | $ | 33,131 | $ | 20,649 | |||||||||||
Stock-based compensation | 9,256 | 8,762 | 8,029 | 7,912 | 8,150 | ||||||||||||||||
Acquisition related fees | — | — | — | 6,252 | 5,803 | ||||||||||||||||
Restructuring and other related charges (credits) | 2,573 | (51 | ) | (84 | ) | 13 | 1,320 | ||||||||||||||
Loss on sale of assets | 899 | — | — | — | — | ||||||||||||||||
Impairment of indirect tax asset | 686 | — | — | — | — | ||||||||||||||||
Executive transition costs | — | 549 | — | — | — | ||||||||||||||||
Purchase accounting amortization | 63 | 17 | — | — | — | ||||||||||||||||
Non-GAAP Operating income | $ | 36,917 | $ | 39,436 | $ | 44,716 | $ | 47,308 | $ | 35,922 | |||||||||||
Non-GAAP Operating income % | 18.1 | % | 18.8 | % | 19.7 | % | 21.9 | % | 16.2 | % | |||||||||||
GAAP Income before income taxes | $ | 17,051 | $ | 24,725 | $ | 31,920 | $ | 26,531 | $ | 15,318 | |||||||||||
Stock-based compensation | 9,256 | 8,762 | 8,029 | 7,912 | 8,150 | ||||||||||||||||
Acquisition related fees | — | — | — | 6,252 | 5,803 | ||||||||||||||||
Restructuring and other related charges (credits) | 2,573 | (51 | ) | (84 | ) | 13 | 1,320 | ||||||||||||||
Loss on sale of assets | 899 | — | — | — | — | ||||||||||||||||
Impairment of indirect tax asset | 686 | — | — | — | — | ||||||||||||||||
Executive transition costs | — | 549 | — | — | — | ||||||||||||||||
Purchase accounting amortization | 63 | 17 | — | — | — | ||||||||||||||||
Non-GAAP Income before income taxes | $ | 30,528 | $ | 34,002 | $ | 39,865 | $ | 40,708 | $ | 30,591 | |||||||||||
GAAP Income tax expense (benefit) | $ | (1,777 | ) | $ | 4,772 | $ | 81,424 | $ | 16,677 | $ | 847 | ||||||||||
Income tax effect of above items | 5,445 | 3,066 | (2,067 | ) | 2,572 | 4,866 | |||||||||||||||
Income tax effect of unusual tax items | 3,661 | — | (72,599 | ) | (13,142 | ) | 99 | ||||||||||||||
Non-GAAP Income tax expense | $ | 7,329 | $ | 7,838 | $ | 6,758 | $ | 6,107 | $ | 5,812 | |||||||||||
Non-GAAP Income tax expense as a % of Non-GAAP Income before income taxes | 24.0 | % | 23.1 | % | 17.0 | % | 15.0 | % | 19.0 | % | |||||||||||
11
Summary of Unaudited Reconciliations of GAAP Measures to Non-GAAP Measures and other Unaudited GAAP Data (Continued) | |||||||||||||||||||||
($ in thousands, except per share data) | |||||||||||||||||||||
Q118 | Q218 | Q318 | Q418 | Q119 | |||||||||||||||||
GAAP Net income | $ | 18,828 | $ | 19,953 | $ | (49,504 | ) | $ | 9,854 | $ | 14,471 | ||||||||||
Stock-based compensation | 9,256 | 8,762 | 8,029 | 7,912 | 8,150 | ||||||||||||||||
Restructuring and other related charges (credits) | 2,573 | (51 | ) | (84 | ) | 13 | 1,320 | ||||||||||||||
Acquisition related fees | — | — | — | 6,252 | 5,803 | ||||||||||||||||
Loss on sale of assets | 899 | — | — | — | — | ||||||||||||||||
Impairment of indirect tax asset | 686 | — | — | — | — | ||||||||||||||||
Executive transition costs | — | 549 | — | — | — | ||||||||||||||||
Purchase accounting amortization | 63 | 17 | — | — | — | ||||||||||||||||
Income tax effect of above items | (5,445 | ) | (3,066 | ) | 2,067 | (2,572 | ) | (4,866 | ) | ||||||||||||
Income tax effect of unusual tax items | (3,661 | ) | — | 72,599 | 13,142 | (99 | ) | ||||||||||||||
Non-GAAP Net income | $ | 23,199 | $ | 26,164 | $ | 33,107 | $ | 34,601 | $ | 24,779 | |||||||||||
GAAP Diluted earnings per common share | $ | 0.57 | $ | 0.59 | $ | (1.54 | ) | $ | 0.29 | $ | 0.42 | ||||||||||
Stock-based compensation | 0.28 | 0.27 | 0.25 | 0.24 | 0.24 | ||||||||||||||||
Acquisition related fees | — | — | — | 0.19 | 0.17 | ||||||||||||||||
Restructuring and other related charges (credits) | 0.08 | — | — | — | 0.04 | ||||||||||||||||
Loss on sale of assets | 0.03 | — | — | — | — | ||||||||||||||||
Impairment of indirect tax asset | 0.02 | — | — | — | — | ||||||||||||||||
Executive transition costs | — | 0.02 | — | — | — | ||||||||||||||||
Income tax effect | (0.28 | ) | (0.10 | ) | 2.29 | 0.32 | (0.14 | ) | |||||||||||||
Effect of participating securities | — | 0.02 | — | 0.01 | 0.01 | ||||||||||||||||
Effect of anti-dilutive securities | $ | — | $ | — | $ | 0.02 | $ | — | $ | — | |||||||||||
Non-GAAP Diluted earnings per common share | $ | 0.70 | $ | 0.80 | $ | 1.02 | $ | 1.05 | $ | 0.74 | |||||||||||
Shares used in diluted earnings per common share calculation: | |||||||||||||||||||||
GAAP | 33,211 | 32,809 | 32,075 | 32,924 | 33,534 | ||||||||||||||||
Non-GAAP | 32,496 | ||||||||||||||||||||
12
Summary of other Unaudited GAAP Data | |||||||||||||||||||||
($ in thousands) | Q118 | Q218 | Q318 | Q418 | Q119 | ||||||||||||||||
Net revenues from unaffiliated customers: | |||||||||||||||||||||
Enterprise | $ | 154,605 | $ | 162,907 | $ | 167,640 | $ | 164,587 | $ | 167,642 | |||||||||||
Consumer | 49,321 | 47,393 | 58,894 | 51,556 | 53,667 | ||||||||||||||||
Total net revenues | $ | 203,926 | $ | 210,300 | $ | 226,534 | $ | 216,143 | $ | 221,309 | |||||||||||
Net revenues by geographic area from unaffiliated customers: | |||||||||||||||||||||
Domestic | $ | 108,810 | $ | 111,095 | $ | 106,455 | $ | 107,693 | $ | 113,986 | |||||||||||
International | 95,116 | 99,205 | 120,079 | 108,450 | 107,323 | ||||||||||||||||
Total net revenues | $ | 203,926 | $ | 210,300 | $ | 226,534 | $ | 216,143 | $ | 221,309 | |||||||||||
Balance Sheet accounts and metrics: | |||||||||||||||||||||
Accounts receivable, net | $ | 134,833 | $ | 139,683 | $ | 143,919 | $ | 152,888 | $ | 161,529 | |||||||||||
Days sales outstanding (DSO) | 60 | 60 | 57 | 64 | 60 | ||||||||||||||||
Inventory, net | $ | 57,571 | $ | 60,999 | $ | 64,574 | $ | 68,276 | $ | 68,138 | |||||||||||
Inventory turns | 7.0 | 6.7 | 7.0 | 6.0 | 6.5 | ||||||||||||||||
13