Attached files
| file | filename |
|---|---|
| EX-99.2 - EXHIBIT 99.2 - MITEK SYSTEMS INC | mitk-20180803xexx992.htm |
| EX-23.1 - EXHIBIT 23.1 - MITEK SYSTEMS INC | mitk-20180803xexx231.htm |
| 8-K/A - 8-K/A - MITEK SYSTEMS INC | mitk-20180803x8kxa2ia.htm |
Exhibit 99.1
A2IA GROUP II AND SUBSIDIARIES
CONSOLIDATED FINANCIAL STATEMENTS
DECEMBER 31, 2017
Index to Consolidated Financial Statements
Page 2
Report of Independent Registered Public Accounting Firm
To the Board of Directors and Stockholders
A2IA Group II, SAS
We have audited the accompanying consolidated financial statements of A2iA Group II, SAS (a French company), which comprise the consolidated balance sheets as of December 31, 2017 and 2016, and the related consolidated statements of operations, reconciliation of consolidated net loss, changes in consolidated equity attributable to owners, and cash flows for the years then ended, and the related notes to the financial statements. We also have audited the reconciliation tables from French GAAP to US GAAP for the years then ended as disclosed in the note 3.26 to the consolidated financial statements of A2IA Group II SAS.
Management’s Responsibility for the Financial Statements
Management is responsible for the preparation and fair presentation of these financial statements in accordance with accounting principles generally accepted in France; this includes the design, implementation, and maintenance of internal control relevant to the preparation and fair presentation of financial statements that are free from material misstatement, whether due to fraud or error.
Auditors’ Responsibility
Our responsibility is to express an opinion on these financial statements and these reconciliation tables based on our audits. We conducted our audits in accordance with auditing standards generally accepted in the United States of America. Those standards require that we plan and perform the audit to obtain reasonable assurance about whether the financial statements are free from material misstatement.
An audit involves performing procedures to obtain audit evidence about the amounts and disclosures in the financial statements. The procedures selected depend on the auditors’ judgment, including the assessment of the risks of material misstatement of the financial statements, whether due to fraud or error. In making those risk assessments, the auditor considers internal control relevant to the entity’s preparation and fair presentation of the financial statements in order to design audit procedures that are appropriate in the circumstances, but not for the purpose of expressing an opinion on the effectiveness of the entity’s internal control. Accordingly, we express no such opinion. An audit also includes evaluating the appropriateness of accounting policies used and the reasonableness of significant accounting estimates made by management, as well as evaluating the overall presentation of the financial statements.
We believe that the audit evidence we have obtained is sufficient and appropriate to provide a basis for our audit opinion.
Opinions
• | In our opinion, the financial statements referred to above present fairly, in all material respects, the consolidated financial position of A2iA Group II SAS as of December 31, 2017 and 2016, and the consolidated results of its operations and its cash flows for the years then ended in accordance with accounting principles generally accepted in France. |
We did not audit the financial statements of A2IA Corp., a wholly-owned subsidiary, which statements reflect total assets constituting $3.277.432 and $2.788.098, respectively, of consolidated total assets as of December 31, 2017 and December 31, 2016 and total revenues of $6.523.586 and $6.901.974, respectively, of consolidated total revenues for the years ended December 31, 2017 and 2016. Those statements were audited by other auditors - Marks Paneth LLP- whose report has been furnished to us, and our opinion, insofar as it relates to the amounts included for A2IA Corp., is based solely on this report.
• | In our opinion, the reconciliation tables from French GAAP to US GAAP present fairly in all material respects, the significant adjustments between the two accounting standards for A2IA Group II SAS consolidated financial statements, as of December 31, 2017 and 2016. |
Page 3
In Paris on July 24, 2018 |
The independent auditor |
AUDIT ET CONSEIL UNION |
/s/ Jean-Marc FLEURY |
Jean-Marc FLEURY |
Page 4
CONSOLIDATED BALANCE SHEETS
AS OF DECEMBER 31, 2017 AND 2016
ASSETS
NET ASSETS (IN €) | 12/31/2017 | 12/31/2016 | |||||||
NON-CURRENT ASSETS | |||||||||
Goodwill | 3.1 | € | 9,548,869 | € | 10,653,219 | ||||
Intangible assets | 3.1 | 55,324 | 82,207 | ||||||
Property, plant and equipment | 3.1 | 275,013 | 306,752 | ||||||
Financial assets | 3.1 | 151,910 | 161,170 | ||||||
Investments in equity associates | 3.1 | — | — | ||||||
TOTAL NON-CURRENT ASSETS | 10,031,116 | 11,203,348 | |||||||
CURRENT ASSETS | |||||||||
Trade receivables and related accounts | 3.2 | 4,176,204 | 3,802,835 | ||||||
Other receivables, prepayments and accrued income | 3.3 | 1,164,180 | 1,263,747 | ||||||
Cash at bank and cash equivalents | 5,707,106 | 5,562,093 | |||||||
TOTAL CURRENT ASSETS | 11,047,490 | 10,628,675 | |||||||
TOTAL ASSETS | € | 21,078,606 | € | 21,832,023 | |||||
Page 5
CONSOLIDATED BALANCE SHEETS
AS OF DECEMBER 31, 2017 AND 2016
EQUITY AND LIABILITIES
EQUITY & LIABILITIES (IN €) | 12/31/2017 | 12/31/2016 | |||||||
EQUITY (attributable to owners of the Company) | |||||||||
Share capital | 3.4 | € | 9,937,620 | € | 9,937,620 | ||||
Additional paid-in capital | 3.4 | — | — | ||||||
Consolidated reserves | 3.4 | 2,753,798 | 2,724,148 | ||||||
Net income (loss) for the year | 3.4 | (64,375 | ) | 248,202 | |||||
EQUITY ATTRIBUTABLE TO OWNERS OF THE COMPANY | 12,627,043 | 12,909,970 | |||||||
EQUITY (attributable to minority interests) | |||||||||
Reserves attributable to minority interests | — | — | |||||||
Net income (loss) attributable to minority interests | — | — | |||||||
EQUITY ATTRIBUTABLE TO MINORITY INTERESTS | — | — | |||||||
EQUITY EQUIVALENTS | 3.5 | 262,218 | 288,332 | ||||||
PROVISIONS | 3.6 | 1,026,552 | 780,506 | ||||||
LIABILITIES | |||||||||
Bond issues | 3.7 | 551,401 | 551,401 | ||||||
Bank borrowings | 3.7 | 2,505,152 | 3,290,152 | ||||||
Other borrowings | 3.7 | 491,045 | 469,085 | ||||||
Trade payables and related accounts | 3.8 | 257,717 | 238,957 | ||||||
Other liabilities, accruals and deferred income | 3.9 | 3,357,478 | 3,303,620 | ||||||
TOTAL LIABILITIES | 7,162,793 | 7,853,215 | |||||||
TOTAL EQUITY AND LIABILITIES | € | 21,078,606 | € | 21,832,023 | |||||
Page 6
CONSOLIDATED STATEMENTS OF OPERATIONS
FOR THE YEARS ENDED DECEMBER 31, 2017 AND 2016
INCOME STATEMENT (IN €) | Year Ended 12/31/2017 | Year ended 12/31/2016 | |||||||
REVENUE | 3.11 | € | 12,857,201 | € | 12,594,550 | ||||
Other operating income | 3.12 | 49,993 | 55,374 | ||||||
OPERATING INCOME | 12,907,194 | 12,649,924 | |||||||
Cost of sales | 3.13 | 40,070 | 49,715 | ||||||
Other external charges | 3.14 | 2,860,565 | 2,634,668 | ||||||
Employee costs | 3.15 | 7,672,278 | 7,341,555 | ||||||
Other operating expenses | 23,025 | 2,589 | |||||||
Taxes and duties other than income tax | 246,079 | 177,403 | |||||||
Depreciation, amortization and provisions | 3.16 | 400,516 | 342,292 | ||||||
OPERATING EXPENSES | 11,242,533 | 10,548,222 | |||||||
NET OPERATING INCOME | 1,664,661 | 2,101,702 | |||||||
Financial expenses, net | 3.17 | (303,103 | ) | (231,286 | ) | ||||
NET INCOME FROM ORDINARY ACTIVITIES OF CONSOLIDATED COMPANIES | 1,361,558 | 1,870,416 | |||||||
Exceptional income and expenses, net | 3.18 | (235 | ) | 60 | |||||
Income tax | 3.19 | (321,348 | ) | (517,924 | ) | ||||
NET INCOME OF CONSOLIDATED COMPANIES | € | 1,039,975 | € | 1,352,552 | |||||
Share of net income of equity associates | — | — | |||||||
Amortization of goodwill | 3.1 | (1,104,350 | ) | (1,104,350 | ) | ||||
CONSOLIDATED NET INCOME (LOSS) | € | (64,375 | ) | € | 248,202 | ||||
Minority interests | — | — | |||||||
NET INCOME (LOSS) ATTRIBUTABLE TO OWNERS OF THE COMPANY | € | (64,375 | ) | € | 248,202 | ||||
Basic net income (loss) per share | 3.21 | € | (0.01 | ) | € | 0.03 | |||
Diluted net income (loss) per share | 3.21 | € | (0.01 | ) | € | 0.03 | |||
Page 7
CONSOLIDATED STATEMENTS OF CASH FLOWS
FOR THE YEARS ENDED DECEMBER 31, 2017 AND 2016
12/31/2017 | 12/31/2016 | |||||||
OPERATING ACTIVITIES | ||||||||
CONSOLIDATED NET INCOME (LOSS) | € | (64,375 | ) | € | 248,202 | |||
Share of non-recurring interests in the net income (loss) of consolidated companies | — | — | ||||||
Share of net income (loss) of equity associates | — | — | ||||||
Dividends received from equity associates | — | — | ||||||
Elim. of non-cash and non-operating items | — | — | ||||||
Income drift + dilution gains (losses) | — | — | ||||||
Charges to depreciation, amortization and provisions | 1,572,566 | 1,505,242 | ||||||
Reversals of depreciation, amortization and provisions | — | — | ||||||
Calculated income and expenses on stock options and equivalent | — | — | ||||||
Capital gains (losses) on disposals | — | (92 | ) | |||||
Deferred tax | (29,436 | ) | (45,332 | ) | ||||
Grants released to net income | — | — | ||||||
WORKING CAPITAL REQUIREMENTS | 1,478,755 | 1,708,020 | ||||||
Change in finance costs (excl. borrowings) | (392,151 | ) | 546,622 | |||||
Net change in operating items | ||||||||
Change in inventory | — | — | ||||||
Transfers of deferred charges | — | — | ||||||
Change in operating receivables | (380,302 | ) | 1,068,705 | |||||
Change in operating payables | (11,849 | ) | (522,083 | ) | ||||
Net change in non-operating items | 198,494 | (18,731 | ) | |||||
Change in non-operating receivables | 112,560 | (239,421 | ) | |||||
Change in non-operating payables | 25,262 | 42,046 | ||||||
Prepayments and deferred income | 60,672 | 178,644 | ||||||
Foreign exchange gains (losses) | — | — | ||||||
CHANGE IN WORKING CAPITAL REQUIREMENTS | (193,657 | ) | 527,891 | |||||
NET CASH FROM OPERATING ACTIVITIES | 1,285,098 | 2,235,911 | ||||||
INVESTING ACTIVITIES | ||||||||
Purchases of intangible assets | (32,220 | ) | (74,361 | ) | ||||
Purchases of property, plant and equipment | (118,134 | ) | (125,435 | ) | ||||
Proceeds from sales of intangible assets and PP&E | — | 1,850 | ||||||
Investment grants received | — | — | ||||||
Purchases of financial assets | (933 | ) | (3,733 | ) | ||||
Purchases of treasury shares | (74,700 | ) | — | |||||
Proceeds from sales of financial assets | 3,000 | 4,823 | ||||||
Net cash/ acquisitions and disposals of subsidiaries | — | — | ||||||
NET CASH USED IN INVESTING ACTIVITIES | (222,987 | ) | (196,856 | ) | ||||
Page 8
FINANCING ACTIVITIES | ||||||||
Proceeds from issuance of shares or contributions | — | — | ||||||
Amounts received on the exercise of stock options | — | — | ||||||
Dividends paid to parent company shareholders | (28,975 | ) | (30,241 | ) | ||||
Dividend paid to minority interests | — | — | ||||||
Change in equity equivalents | (26,114 | ) | — | |||||
Proceeds from new borrowings | 21,960 | 33,273 | ||||||
Principal payments on borrowings | (785,000 | ) | (1,424,848 | ) | ||||
Change in loan interest costs | — | — | ||||||
NET CASH USED IN FINANCING ACTIVITIES | (818,129 | ) | (1,421,816 | ) | ||||
INCREASE IN NET CASH | 243,982 | 617,239 | ||||||
Effect of exchange rate fluctuations | (98,969 | ) | 29,587 | |||||
NET CASH AT THE BEGINNING OF THE YEAR | 5,562,093 | 4,915,267 | ||||||
Reclassification of net cash | — | — | ||||||
NET CASH AT THE END OF THE YEAR | € | 5,707,106 | € | 5,562,093 | ||||
Page 9
RECONCILIATION OF COMPANY AND CONSOLIDATED NET INCOME (LOSS)
FOR THE YEARS ENDED DECEMBER 31, 2017 AND 2016
IN € | A2IA GROUP II | A2IA | A2IA CORP | A2IA LLC | TOTAL | |||||||||||||||
COMPANY NET INCOME (LOSS) TRANSLATED INTO EUROS | € | 1,819,997 | € | 1,166,294 | € | 565,148 | € | 549 | € | 3,551,988 | ||||||||||
Dividend distribution | (2,096,510 | ) | (351,403 | ) | — | — | (2,447,913 | ) | ||||||||||||
Tax-driven provisions | 346 | 8,464 | — | — | 8,810 | |||||||||||||||
Unrealized foreign exchange losses | — | (6,088 | ) | — | — | (6,088 | ) | |||||||||||||
Retirement benefit provisions | — | (96,258 | ) | — | — | (96,258 | ) | |||||||||||||
Amortization of goodwill | (881,535 | ) | (222,815 | ) | — | — | (1,104,350 | ) | ||||||||||||
Deferred tax | (115 | ) | 29,551 | — | — | 29,436 | ||||||||||||||
CONSOLIDATED NET INCOME (LOSS) | € | (1,157,817 | ) | € | 527,745 | € | 565,148 | € | 549 | € | (64,375 | ) | ||||||||
Minority interests | — | — | — | — | — | |||||||||||||||
CONSOLIDATED NET INCOME (LOSS) ATTRIBUTABLE TO OWNERS OF THE COMPANY | € | (1,157,817 | ) | € | 527,745 | € | 565,148 | € | 549 | € | (64,375 | ) | ||||||||
Page 10
CONSOLIDATED STATEMENTS OF CHANGES IN
CONSOLIDATED EQUITY ATTRIBUTABLE TO OWNERS OF
THE COMPANY FOR THE YEARS ENDED DECEMBER 31, 2017 AND 2016
IN € | Share Capital | Consolidated reserves | Net income (loss) for the year | Total equity attrib. to owners of the Company | |||||||||||||||||||||||||||
Reserves | Change in conso. scope | Treasury shares | Translation reserves | Total | |||||||||||||||||||||||||||
AS OF 01/01/2016 | 9,937,620 | € | (33,478 | ) | € | (898 | ) | € | 0 | € | 223,382 | € | 189,006 | € | 2,530,772 | € | 12,657,398 | ||||||||||||||
Appropriation of prior year net income | — | 2,500,529 | — | — | — | 2,500,529 | (2,530,772 | ) | (30,243 | ) | |||||||||||||||||||||
Consolidated net income for the year | — | — | — | — | — | — | 248,202 | 248,202 | |||||||||||||||||||||||
Change in forex translation gains, net | — | — | — | — | 34,613 | 34,613 | — | 34,613 | |||||||||||||||||||||||
AS OF 12/31/2016 | 9,937,620 | € | 2,467,051 | € | (898 | ) | € | 0 | € | 257,995 | € | 2,724,148 | € | 248,202 | € | 12,909,970 | |||||||||||||||
Appropriation of prior year net income | — | 219,227 | — | — | — | 219,227 | (248,202 | ) | (28,975 | ) | |||||||||||||||||||||
Consolidated net loss for the year | — | — | — | — | — | — | (64,375 | ) | (64,375 | ) | |||||||||||||||||||||
Treasury shares | — | — | — | (74,700 | ) | — | (74,700 | ) | — | (74,700 | ) | ||||||||||||||||||||
Change in forex translation losses, net | — | — | — | — | (114,877 | ) | (114,877 | ) | — | (114,877 | ) | ||||||||||||||||||||
AS OF 12/31/2017 | 9,937,620 | € | 2,686,278 | € | (898 | ) | € | (74,700 | ) | € | 143,118 | € | 2,753,798 | € | (64,375 | ) | € | 12,627,043 | |||||||||||||
Page 11
NOTES TO THE CONSOLIDATED FINANCIAL STATEMENTS
1 – INFORMATION ON THE SCOPE OF CONSOLIDATION |
1.1 CONSOLIDATED COMPANY ORGANIZATION CHART
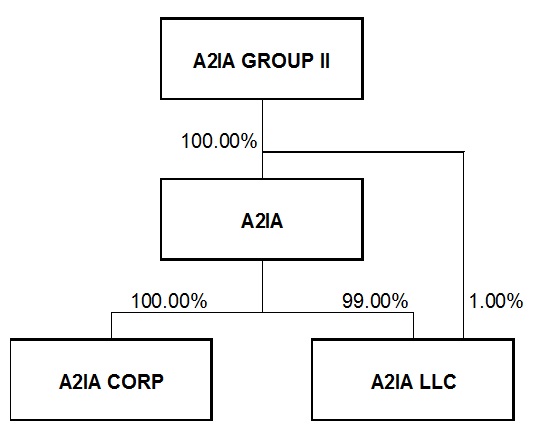
1.2 SCOPE OF CONSOLIDATION
Company | Fiscal year 12/31/2017 | Fiscal year 12/31/2016 | ||||||
Consolidation method | % control | % interest | Consolidation method | % control | % interest | |||
A2IA GROUP II | Parent company | - | - | Parent company | - | - | ||
A2IA | FC | 100.00% | 100.00% | FC | 100.00% | 100.00% | ||
A2IA CORP | FC | 100.00% | 100.00% | FC | 100.00% | 100.00% | ||
A2IA LLC | FC | 100.00% | 100.00% | FC | 100.00% | 100.00% | ||
1.3 ADDITIONAL INFORMATION ON CONSOLIDATED COMPANIES
A2IA GROUP II (France)
- Legal form: French Simplified joint stock company (Société par Actions Simplifiée)
- Registered office: 37/39, rue de la Bienfaisance – 75008 PARIS
- Company registration no. (SIREN): 807 617 378
A2IA (France)
- Legal form: French Simplified joint stock company (Société par Actions Simplifiée)
- Registered office: 37/39, rue de la Bienfaisance – 75008 PARIS
- Company registration no. (SIREN): 382 789 154
A2IA CORP. (United States)
- Registered office: 24 West 40th Street – 10018 NEW YORK, NY
Page 12
A2IA LLC (Russia)
- Registered office: 34 Ligne 9ia V.O. Bâtiment A – 199004 SAINT PETERSBOURG
1.4 GROUP BUSINESSES
Company | Main activity | |
A2IA GROUP II | Company administration | |
A2IA | Software publishing | |
A2IA CORP | Software publishing | |
A2IA LLC | Software publishing | |
1.5 MAJOR EVENTS OF THE YEAR
A tax audit was performed of the subsidiary A2IA covering the period January 1, 2014 to December 31, 2015 and the research tax credit return for fiscal year 2013.
The audit was completed on March 28, 2017 with the filing of a supplementary amended return for fiscal years 2013, 2014 and 2015. Additional tax of €68,998 was paid.
1.6 POST-BALANCE SHEET EVENTS
On May 23, 2018, Mitek Systems, a global leader in mobile capture and digital identity verification software solutions announced that it entered into a sale and purchase agreement of all the outstanding shares of the Group, as defined below, hereinafter to as the “Acquisition.”
Page 13
2 – ACCOUNTING POLICIES AND VALUATION METHODS |
2.1 INTRODUCTION
A2IA Group II (the “Parent Company” and together with the subsidiaries included in the scope of consolidation detailed in Note 1.4, the “Group”) prepares consolidated financial statements under accounting principles generally accepted in France (“French GAAP”) for the purposes of calculating covenants (the “Consolidated Financial Statements”). In addition, in conjunction with the Acquisition, the Consolidated Financial Statements also includes in Note 3.26 a net income and equity reconciliation between French GAAP and accounting principles generally accepted in the United States (“US GAAP”) in accordance with the rules and regulations of the US Securities and Exchange Commission.
2.2 CONSOLIDATION RULES
The consolidated financial statements have been prepared in accordance with French GAAP and the provisions of Comité de la Réglementation Comptable or CRC Regulation no. 99-02 issued by the French Accounting Regulation Committee (Autorité des Normes Comptables or “ANC”) on April 29, 1999 (Order of June 22, 1999).
Restatements and eliminations required by consolidation rules are not performed where their impact on the consolidated financial position, assets and net income is not material.
2.2.1 Consolidation methods
A2IA GROUP II directly or indirectly exercises exclusive control over all its subsidiaries through direct or indirect holding of voting rights. These companies are therefore fully consolidated.
2.2.2 Consolidation criteria
In principle, a company enters the consolidation scope when the group acquires controls of this company, irrespective of the legal terms and conditions under which control is achieved.
2.2.3 Year end
The consolidating company draws up its annual accounts to December 31, as do all other companies included in the scope of consolidation.
2.2.4 Internal transactions
Reciprocal transactions between consolidated group companies are eliminated.
Where appropriate, internal gains or losses on asset transfers between group companies are also eliminated.
2.3 ACCOUNTING POLICIES AND VALUATION METHODS
2.3.1 Change in accounting method
There were no changes in method during the period.
2.3.2 Goodwill
Where control is obtained through acquisition, the difference between the acquisition cost of securities and the share in net assets acquired and liabilities assumed, valued at fair value at the acquisition date, is recorded in “Goodwill” in balance sheet assets.
ANC Regulation no. 2015-07 of November 23, 2015 prospectively amended goodwill amortization and impairment rules for fiscal years beginning on or after January 1, 2016.
Page 14
The regulation classifies goodwill in two categories:
– | Goodwill with a limited useful life, amortized over the period of use; |
– | Goodwill with an unlimited useful life, not amortized and assessed for impairment annually. A provision for impairment is recorded, where appropriate, if a loss in value is identified. |
The regulation offers companies the option of continuing to account for existing goodwill balances as of January 1, 2016 in accordance with the initial amortization schedule or performing a new assessment of the limited nature of their useful life and potentially amending their amortization going forward.
A2IA GROUP II elected to continue the initial amortization schedules and not to perform a new assessment of the useful life of goodwill balances.
Goodwill is amortized, case-by-case, on a straight-line basis over periods not exceeding 20 years.
Impairment tests are performed annually to validate the consistency of the net carrying amount of goodwill and an additional impairment is recorded where appropriate.
2.3.3 Intangible assets
Concessions, patents, licenses and trademarks
“Concessions, patents, licenses and trademarks” mainly consist of purchased software, amortized on a straight-line basis over the period of use.
Research and development expenditure
The company does not capitalize research and development expenditure in accordance with the alternative method.
2.3.4 Property, plant and equipment
Property, plant and equipment are recorded in the balance sheet at acquisition cost and depreciated on a straight-line basis over their estimated useful life.
Long-term lease agreements are not restated as they do not meet capitalization criteria.
2.3.5 Financial assets
Financial assets consist of deposits and guarantees recorded at historical cost.
2.3.6 Receivables and payables
Receivables and payables are recorded at nominal value.
A provision for impairment is recorded in respect of receivables where their estimated recoverable amount is less than their net carrying amount.
2.3.7 Provisions for contingencies and losses
Provisions for contingencies and losses are recorded to cover risks that are precise in nature, considered probable as a result of past events and can be reliably estimated.
2.3.8 Revenue recognition
Revenue from the sale of software is recognized in the income statement on the transfer of ownership.
2.3.9 Borrowing costs
Page 15
The Group applies the preferred method set out in CRC Regulation no. 99-02 regarding the deferral of loan issue costs over the loan term.
2.3.10 Treasury shares
The Parent Company holds a portfolio of its own shares recorded in financial assets. These shares are eliminated in financial assets through a reduction in equity attributable to owners of the Company.
2.3.11 Deferred tax
Deferred tax is recognized in the consolidated income statement and balance sheet in respect of tax losses carried forward, timing differences between taxable net income and accounting net income, consolidation restatements and the elimination of the impact of transactions recorded solely to apply tax legislation.
Deferred tax is calculated using the liability method and the impact of any changes in tax rates on deferred tax balances recorded previously is recognized in net income in the year in which these changes enter into effect.
A deferred tax asset is only recognized in respect of tax losses carried forward if their utilization is considered highly probable.
2.3.12 Tax consolidation
The subsidiary, A2IA GROUP II, is the head of the tax group formed with its own subsidiary, A2IA.
The income tax expense is recognized for each tax group member as in the absence of tax consolidation. The tax saving is recognized in the A2IA GROUP II accounts.
2.3.13 Retirement benefit commitments
The group adopts the preferred method set out in CRC Regulation no.99-02 on the recognition of retirement benefit commitments, for French companies.
Commitments are assessed for all individuals holding a permanent employment contract and employed at the date of the consolidated financial statements.
They are measured using the projected unit credit method, assuming departure at the employee’s initiative and are recorded in provisions for losses.
The following assumptions are adopted:
Application of the SYNTEC Bureaux d’études collective bargaining agreement and the following assumptions:
Assumption | Management |
Retirement age | 67 years old |
Discount rate | 1.45% |
Social security contribution rate | 46.50% |
Turnover | Low |
Mortality table | INSEE 2014 |
No such commitments exist for foreign subsidiaries.
2.3.14 Exceptional items
Exceptional items are income and expense items relating to events or transactions clearly separate from the company’s activities and that are not intended to occur frequently or regularly.
Page 16
2.3.15 CICE employment tax credit
The Crédit d’Impôt Compétitivité Emploi or CICE employment tax credit is recognized as a reduction in social security contributions in “Employee costs.”
It is used to improve research and development, notably by investing in computer hardware and employee training.
Page 17
3 – NOTES TO THE BALANCE SHEET AND INCOME STATEMENT |
3.1 INTANGIBLE ASSETS, PROPERTY, PLANT AND EQUIPMENT AND FINANCIAL ASSETS
3.1.1 Gross non-current assets
In € | 12/31/2016 | Increase | Decrease | Other movements | Forex translation | 12/31/2017 | ||||||||||||||||||
Goodwill | ||||||||||||||||||||||||
A2IA GROUP goodwill | € | 3,925,411 | € | — | € | — | € | — | € | — | € | 3,925,411 | ||||||||||||
A2IA DEVELOPPEMENT goodwill | 9,764,359 | — | — | — | — | 9,764,359 | ||||||||||||||||||
A2IA goodwill | 4,456,304 | — | — | — | — | 4,456,304 | ||||||||||||||||||
Total goodwill | € | 18,146,074 | € | 0 | € | 0 | € | 0 | € | 0 | € | 18,146,074 | ||||||||||||
Intangible assets | ||||||||||||||||||||||||
Concessions, patents | 572,180 | 32,220 | — | — | (17,888 | ) | 586,512 | |||||||||||||||||
Total intangible assets | 572,180 | 32,220 | 0 | 0 | (17,888 | ) | 586,512 | |||||||||||||||||
Property, plant and equipment | ||||||||||||||||||||||||
Buildings | 275,360 | — | — | — | (15,921 | ) | 259,439 | |||||||||||||||||
Other PP&E | 953,652 | 117,796 | — | — | (43,529 | ) | 1,027,919 | |||||||||||||||||
Total property, plant and equipment | 1,229,012 | 117,796 | 0 | 0 | (59,450 | ) | 1,287,358 | |||||||||||||||||
Financial assets | ||||||||||||||||||||||||
Other financial assets | 161,170 | 933 | 3,000 | — | (7,193 | ) | 151,910 | |||||||||||||||||
Total financial assets | 161,170 | 933 | 3,000 | 0 | (7,193 | ) | 151,910 | |||||||||||||||||
Investments in equity associates | — | — | — | — | — | — | ||||||||||||||||||
TOTAL NON-CURRENT ASSETS | € | 20,108,436 | € | 150,949 | € | 3,000 | € | 0 | € | (84,531 | ) | € | 20,171,854 | |||||||||||
A2IA GROUP goodwill:
The A2IA GROUP initial difference on consolidation of €3,925,411 (gross) was calculated based on A2IA GROUP’s consolidated net assets at the date of acquisition of the securities, i.e. November 14, 2014.
On June 15, 2015, the entire assets of A2IA GROUP were transferred to A2IA GROUP II.
In the absence of identifiable valuation differences, the initial difference on consolidation was allocated in full to goodwill and is amortized over 10 years.
A2IA DEVELOPPEMENT goodwill:
On May 13, 2008, A2IA GROUP acquired 99.08% of the shares of A2IA DEVELOPPEMENT, the A2IA and A2IA CORP holding company. It then bought-out the remaining minority interests in 2010 and 2012.
On December 6, 2012, the entire assets of A2IA DEVELOPPEMENT were transferred to A2IA GROUP.
Page 18
The A2IA DEVELOPPEMENT initial difference on consolidation of €9,692,158 (gross) was calculated based on A2IA DEVELOPPEMENT’s consolidated net assets at the date of acquisition of the securities, i.e. May 13, 2008.
In the absence of identifiable valuation differences, the initial difference on consolidation was allocated in full to goodwill and is amortized over 20 years.
The buyout of minority interests in 2010 and 2012 generated additional goodwill of €72,201, increasing gross goodwill to €9,764,359. This additional goodwill is amortized over the residual amortization period of the initial goodwill.
A2IA goodwill:
On January 25, 2006, A2IA DEVELOPPEMENT acquired A2IA.
The A2IA initial difference on consolidation of €4,456,304 (gross) was calculated based on A2IA’s consolidated net assets as of December 31, 2005.
In the absence of identifiable valuation differences, the initial difference on consolidation was allocated in full to goodwill and is amortized over 20 years.
Impairment tests:
Impairment tests at the year-end did not call into question the net carrying amount of goodwill. No additional impairment was therefore recorded.
Page 19
3.1.2 Depreciation, amortization and provisions
In € | 12/31/2016 | Increase | Decrease | Other movements | Forex translation | 12/31/2017 | ||||||||||||||||||
Goodwill | ||||||||||||||||||||||||
A2IA GROUP goodwill | € | 835,628 | € | 392,541 | € | — | € | — | € | — | € | 1,228,169 | ||||||||||||
A2IA DEVELOPPEMENT goodwill | 4,206,261 | 488,994 | — | — | — | 4,695,255 | ||||||||||||||||||
A2IA goodwill | 2,450,966 | 222,815 | — | — | — | 2,673,781 | ||||||||||||||||||
Total goodwill | 7,492,855 | 1,104,350 | — | — | — | 8,597,205 | ||||||||||||||||||
Intangible assets | ||||||||||||||||||||||||
Concessions, patents | 489,973 | 57,510 | — | — | (16,295 | ) | 531,188 | |||||||||||||||||
Total intangible assets | 489,973 | 57,510 | — | — | (16,295 | ) | 531,188 | |||||||||||||||||
Property, plant and equipment | ||||||||||||||||||||||||
Buildings | 149,116 | 16,894 | — | — | (13,117 | ) | 152,893 | |||||||||||||||||
Other PP&E | 773,144 | 124,356 | — | — | (38,048 | ) | 859,452 | |||||||||||||||||
Total property, plant and equipment | 922,260 | 141,250 | — | — | (51,165 | ) | 1,012,345 | |||||||||||||||||
Financial assets | ||||||||||||||||||||||||
Other financial assets | — | — | — | — | — | — | ||||||||||||||||||
Total financial assets | — | — | — | — | — | — | ||||||||||||||||||
Investments in equity associates | — | — | — | — | — | — | ||||||||||||||||||
TOTAL DEPRECIATION, AMORTIZATION AND PROVISIONS | € | 8,905,088 | € | 1,303,110 | € | — | € | — | € | (67,460 | ) | € | 10,140,738 | |||||||||||
3.2 TRADE RECEIVABLES
In € | 12/31/2017 | 12/31/2016 | ||||||
Trade receivables | € | 3,861,000 | € | 3,513,185 | ||||
Doubtful receivables | — | — | ||||||
Sales invoice accruals | 315,204 | 289,650 | ||||||
TOTAL TRADE RECEIVABLES, GROSS | 4,176,204 | 3,802,835 | ||||||
Provision for impairment | — | — | ||||||
TOTAL TRADE RECEIVABLES, NET | € | 4,176,204 | € | 3,802,835 | ||||
Page 20
3.3 OTHER RECEIVABLES, PREPAYMENTS AND ACCRUED INCOME
In € | 12/31/2017 | 12/31/2016 | ||||||
Advances and payments on account | € | — | € | — | ||||
Employee-related receivables | 849 | 5,811 | ||||||
Tax receivables | 591,760 | 689,562 | ||||||
Sundry debtors | 4,471 | 7,334 | ||||||
Deferred tax assets | 261,849 | 232,413 | ||||||
Deferred charges | 78,924 | 100,833 | ||||||
Prepayments | 226,327 | 227,794 | ||||||
TOTAL RECEIVABLES, PREPAYMENTS AND ACCRUED INCOME, GROSS | 1,164,180 | 1,263,747 | ||||||
Provision for impairment of other receivables | — | — | ||||||
TOTAL RECEIVABLES, PREPAYMENTS AND ACCRUED INCOME, NET | € | 1,164,180 | € | 1,263,747 | ||||
Deferred charges:
Deferred charges primarily consist of implementation costs relating to the joint financing granted by the banks, CIC EST and SOCIETE GENERALE.
These costs are amortized over the period from November 14, 2014 to June 30, 2021.
In € | 12/31/2017 | 12/31/2016 | ||||||
Deferred charges, gross | € | 147,000 | € | 147,000 | ||||
Accumulated amortization | (68,076 | ) | (46,167 | ) | ||||
Deferred charges, net | € | 78,924 | € | 100,833 | ||||
3.4 EQUITY
3.4.1 Share capital
The share capital comprises 9,937,620 fully paid-up shares with a par value of one euro each.
3.4.2 Contribution to equity (attributable to owners of the Company)
The contribution of consolidated companies to equity (attributable to owners of the Company) breaks down as follows as of December 31, 2017:
Share capital | Consolidated reserves | Consolidated net income | Total | |||||||||||||||||||||||||
In € | Reserves | Treasury shares | Translation reserves | Total | ||||||||||||||||||||||||
A2IA GROUP II | € | 9,937,620 | € | 8,480,573 | € | (74,700 | ) | € | — | € | 8,405,873 | € | (1,157,817 | ) | € | 17,185,676 | ||||||||||||
A2IA | — | (5,980,761 | ) | — | — | (5,980,761 | ) | 527,745 | (5,453,016 | ) | ||||||||||||||||||
A2IA CORP | — | 194,380 | — | 143,939 | 338,319 | 565,148 | 903,467 | |||||||||||||||||||||
A2IA LLC | — | (8,812 | ) | — | (821 | ) | (9,633 | ) | 549 | (9,084 | ) | |||||||||||||||||
TOTAL EQUITY ATTRIB. TO OWNERS OF THE COMPANY | € | 9,937,620 | € | 2,685,380 | € | (74,700 | ) | € | 143,118 | € | 2,753,798 | € | (64,375 | ) | € | 12,627,043 | ||||||||||||
Page 21
3.5 EQUITY EQUIVALENTS
Equity equivalents consist of innovation assistance granted to A2IA.
Grant date | Max. amount of assistance granted | Cumulative assistance paid | Cumulative assistance repaid or transferred to income | As of 12/31/2017 | As of 12/31/2016 | |||||||||||||||||
In € | ||||||||||||||||||||||
BPIFRANCE agreement | 01/18/2011 | € | 450,002 | € | 249,962 | € | — | € | 249,962 | € | 249,962 | |||||||||||
ANR 10 CORD 013 agreement | 11/29/2010 | 40,855 | 32,682 | 20,426 | 12,256 | 32,682 | ||||||||||||||||
ANR 12 CORP 0010 agreement | 02/22/2013 | 18,959 | 5,688 | 5,688 | — | 5,688 | ||||||||||||||||
TOTAL | € | 509,816 | € | 288,332 | € | 26,114 | € | 262,218 | € | 288,332 | ||||||||||||
The assistance granted by BPIFRANCE is repayable in full in accordance with a 5-year fixed schedule commencing when revenue generated by the developed product reaches €1,000,000. If no repayments have been made within 10 years of the last assistance payment, the assistance will definitively vest to A2IA.
The subsidies granted by the Agence Nationale de la Recherche (“ANR”) definitively vest to A2IA (not repayable) on completion of the financed projects. These subsidies were partially released to income in the amount of €26,114 during the year.
3.6 PROVISIONS
In € | 12/31/2016 | Increase | Decrease | Other movements | Forex translation | 12/31/2017 | ||||||||||||||||||||||
Provisions used | Provisions not used | |||||||||||||||||||||||||||
Retirement benefit commitments | € | 665,506 | € | 96,258 | € | — | € | — | € | — | € | — | € | 761,764 | ||||||||||||||
Convertible bond non-conversion premium | 115,000 | 67,700 | — | — | — | — | 182,700 | |||||||||||||||||||||
Maintenance provision | — | 82,088 | — | — | — | — | 82,088 | |||||||||||||||||||||
TOTAL PROVISIONS | € | 780,506 | € | 246,046 | € | — | € | — | € | — | € | — | € | 1,026,552 | ||||||||||||||
Retirement benefit commitments:
Given the sensitivity of calculations, particularly with respect to discount rates, it is noted that the gross commitment would be €765,623 with a discount rate identical to that applied as of December 31, 2016, i.e. 1.42%.
Convertible bond non-conversion premium:
A2IA GROUP II recorded a provision to cover the risk of non-conversion of the bond issue performed on November 14, 2014 (see Note 3.7).
Maintenance provision:
The subsidiary A2IA recorded a provision to cover potential maintenance costs in coming years in connection with a specific contract.
Page 22
3.7 BORROWINGS
In € | 12/31/2017 | 12/31/2016 | ||||||
Bond issues | ||||||||
Bond issue of 11/14/2014 | € | 550,000 | € | 550,000 | ||||
Accrued interest | 1,401 | 1,401 | ||||||
Total bond issues | 551,401 | 551,401 | ||||||
Bank borrowings | ||||||||
CIC EST / SOCIETE GENERALE loan | 2,505,152 | 3,290,152 | ||||||
Total bank borrowings | 2,505,152 | 3,290,152 | ||||||
Other borrowings | ||||||||
BPIFRANCE FINANCEMENT loan | 400,000 | 400,000 | ||||||
COFACE assistance | 84,878 | 62,918 | ||||||
Guarantee deposits received | 6,167 | 6,167 | ||||||
Total other borrowings | 491,045 | 469,085 | ||||||
TOTAL BORROWINGS | € | 3,547,598 | € | 4,310,638 | ||||
Bond issues:
A2IA GROUP II performed a €550,000 convertible bond issue on November 14, 2014.
The terms and conditions of this issue are as follows:
- nominal value of €1;
- interest calculated at a rate of 3% and payable annually on November 30;
- redemption at par on November 30, 2022.
The bond issue is convertible at a rate of one share for one bond and is accompanied by a non-conversion premium bringing the gross actuarial rate of return on non-converted bonds to 12% per annum.
Early redemption at the request of bond holders is possible on the occurrence of certain events and notably if the senior debt becomes payable in full (see below).
Bank borrowings:
On November 14, 2014, A2IA GROUP II secured a €5,500,000 loan with a banking pool comprising CIC EST and SOCIETE GENERALE (50% each), to finance the acquisition of A2IA GROUP shares.
This loan is repayable in seven annual payments on June 30 of each year commencing June 30, 2015 and terminating June 30, 2021.
Interest is equal to 3 month EURIBOR plus a margin revised annually on June 30 (and for the first time on June 30, 2017) based on the consolidated financial statements for the previous fiscal year. The initial margin applied until the first review is 2.60%.
The loan is accompanied by a commitment to comply with financial ratios. Non-compliance may lead to the loan being called in whole or in part.
Page 23
Other borrowings:
On September 9, 2015, A2IA secured an interest-free “Avance Innovation” loan of €400,000 from BPIFRANCE FINANCEMENT to finance the development of a new project.
This loan is repayable in 20 quarterly installments commencing March 31, 2018 and terminating December 31, 2022.
3.8 TRADE PAYABLES AND RELATED ACCOUNTS
In € | 12/31/2017 | 12/31/2016 | ||||||
Trade payables | € | 93,008 | € | 72,538 | ||||
Purchase invoice accruals | 164,710 | 166,419 | ||||||
TOTAL TRADE PAYABLES AND RELATED ACCOUNTS | € | 257,718 | € | 238,957 | ||||
3.9 OTHER LIABILITIES, ACCRUALS AND DEFERRED INCOME
In € | 12/31/2017 | 12/31/2016 | ||||||
Advances and payments on account received on orders | € | 28,127 | € | 56,963 | ||||
Employee-related liabilities | 1,019,666 | 1,097,491 | ||||||
Tax liabilities | 381,885 | 292,007 | ||||||
Other liabilities | 11,498 | 62 | ||||||
Deferred income | 1,916,302 | 1,857,097 | ||||||
TOTAL OTHER LIABILITIES, ACCRUALS AND DEFERRED INCOME | € | 3,357,478 | € | 3,303,620 | ||||
3.10 DEBT MATURITY ANALYSIS
3.10.1 Receivables
In € | Gross | Maturing in 1 year or less | Maturing in more than 1 year | |||||||||
Other financial assets | € | 151,910 | € | — | € | 151,910 | ||||||
Trade receivables and related accounts | 4,176,204 | 4,176,204 | — | |||||||||
Employee-related receivables | 849 | 849 | — | |||||||||
Tax receivables | 591,760 | 591,760 | — | |||||||||
Deferred tax assets | 261,849 | 261,849 | — | |||||||||
Sundry debtors | 4,471 | 4,471 | — | |||||||||
Deferred charges | 78,924 | 21,910 | 57,014 | |||||||||
Prepaid expenses | 226,327 | 226,327 | — | |||||||||
TOTAL RECEIVABLES | € | 5,492,294 | € | 5,283,370 | € | 208,924 | ||||||
Page 24
3.10.2 Liabilities
In € | Gross | Maturing in less than 1 year | Maturing in 1 to 5 years | Maturing in more than 5 years | ||||||||||||
Convertible bond issues | € | 551,401 | € | 1,401 | € | — | € | 550,000 | ||||||||
Bank borrowings | 2,505,152 | 785,000 | 1,720,152 | — | ||||||||||||
Other borrowings | 491,045 | 80,000 | 411,045 | — | ||||||||||||
Trade payables and related accounts | 257,717 | 257,717 | — | — | ||||||||||||
Advances and payments on account received on orders | 28,127 | 28,127 | — | — | ||||||||||||
Employee-related liabilities | 1,019,666 | 1,019,666 | — | — | ||||||||||||
Tax liabilities | 381,885 | 381,885 | — | — | ||||||||||||
Other liabilities | 11,498 | 11,498 | — | — | ||||||||||||
Deferred income | 1,916,302 | 1,916,302 | — | — | ||||||||||||
TOTAL LIABILITIES | € | 7,162,793 | € | 4,481,596 | € | 2,131,197 | € | 550,000 | ||||||||
3.11 REVENUE
3.11.1 Breakdown of revenue by nature
In € | 12/31/2017 | 12/31/2016 | ||||||||||||||||||
France | World | Total | France | World | Total | |||||||||||||||
Sales of bought-in goods | € | 1,704,528 | € | 8,393,576 | € | 10,098,104 | € | 2,186,988 | € | 7,865,955 | € | 10,052,943 | ||||||||
Sales of products | — | — | — | — | — | — | ||||||||||||||
Sales of services | 995,351 | 1,763,746 | 2,759,097 | 765,940 | 1,775,667 | 2,541,607 | ||||||||||||||
TOTAL REVENUE | € | 2,699,879 | € | 10,157,322 | € | 12,857,201 | € | 2,952,928 | € | 9,641,622 | € | 12,594,550 | ||||||||
3.11.2 Contribution of consolidated companies to revenue
In € | 12/31/2017 | 12/31/2016 | ||||||||||||||||||
France | Rest of the world | Total | France | Rest of the world | Total | |||||||||||||||
A2IA | € | 2,699,879 | € | 4,370,641 | € | 7,070,520 | € | 2,952,928 | € | 3,405,275 | € | 6,358,203 | ||||||||
A2IA CORP | — | 5,786,681 | 5,786,681 | — | 6,236,347 | 6,236,347 | ||||||||||||||
TOTAL REVENUE | € | 2,699,879 | € | 10,157,322 | € | 12,857,201 | € | 2,952,928 | € | 9,641,622 | € | 12,594,550 | ||||||||
Page 25
3.12 OTHER OPERATING INCOME
In € | 12/31/2017 | 12/31/2016 | ||||||
Operating grants | € | 49,382 | € | 54,911 | ||||
Expense reclassifications | 467 | 361 | ||||||
Other operating income | 144 | 102 | ||||||
TOTAL OTHER OPERATING INCOME | € | 49,993 | € | 55,374 | ||||
3.13 COST OF SALES
In € | 12/31/2017 | 12/31/2016 | ||||||
Purchases of raw materials | € | 20,924 | € | 20,899 | ||||
Change in inventory of raw materials | — | — | ||||||
Cost of sales - raw materials | 20,924 | 20,899 | ||||||
Purchases of bought-in goods | 19,146 | 28,816 | ||||||
Change in inventory of bought-in goods | — | — | ||||||
Cost of sales - bought-in goods | 19,146 | 28,816 | ||||||
TOTAL COST OF SALES | € | 40,070 | € | 49,715 | ||||
3.14 OTHER EXTERNAL CHARGES
In € | 12/31/2017 | 12/31/2016 | ||||||
Sub-contracting | € | 124,998 | € | 96,921 | ||||
Equipment and supplies not for stock | 42,713 | 54,496 | ||||||
Real estate and moveable property lease costs | 681,428 | 644,438 | ||||||
Maintenance and repair | 44,550 | 56,855 | ||||||
Insurance | 199,238 | 184,256 | ||||||
External personnel | 58,923 | 84,485 | ||||||
Intermediary remuneration and professional fees | 885,119 | 792,870 | ||||||
Public relations | 253,509 | 201,815 | ||||||
Transport | 6,528 | 8,650 | ||||||
Travel and entertainment | 397,367 | 347,759 | ||||||
Post and telecommunication expenses | 115,326 | 108,971 | ||||||
Banking services | 24,684 | 26,157 | ||||||
Other | 26,182 | 26,995 | ||||||
TOTAL OTHER EXTERNAL CHARGES | € | 2,860,565 | € | 2,634,668 | ||||
Page 26
3.15 EMPLOYEE COSTS AND NUMBERS
3.15.1 Employee costs
In € | 12/31/2017 | 12/31/2016 | ||||||
Employee wages and salaries | € | 5,773,885 | € | 5,591,395 | ||||
Social security contributions | 1,898,393 | 1,750,160 | ||||||
Statutory employee profit-sharing | — | — | ||||||
TOTAL EMPLOYEE COSTS | € | 7,672,278 | € | 7,341,555 | ||||
3.15.2 Employee numbers
12/31/2017 | 12/31/2016 | |||||
A2IA | 56 | 54 | ||||
A2IA CORP | 16 | 16 | ||||
A2IA LLC | 15 | 15 | ||||
TOTAL EMPLOYEES | 87 | 85 | ||||
3.16 DEPRECIATION, AMORTIZATION AND PROVISIONS
In € | 12/31/2017 | 12/31/2016 | ||||||
Amortization of intangible assets | € | 57,863 | € | 56,473 | ||||
Depreciation of property, plant and equipment | 142,397 | 133,697 | ||||||
Amortization of deferred charges | 21,910 | 21,965 | ||||||
Charges to provisions for trade receivables | — | — | ||||||
Charges to provisions for contingencies and losses | 178,346 | 130,157 | ||||||
TOTAL DEPRECIATION, AMORTIZATION AND PROVISIONS | € | 400,516 | € | 342,292 | ||||
3.17 FINANCIAL INCOME AND EXPENSES
In € | 12/31/2017 | 12/31/2016 | ||||||
Foreign exchange gains | € | 6,034 | € | 37,440 | ||||
Other financial income | 15,278 | 21,436 | ||||||
FINANCIAL INCOME | 21,312 | 58,876 | ||||||
Interest and financial expenses | 92,962 | 128,042 | ||||||
Foreign exchange losses | 153,614 | 93,122 | ||||||
Other financial charges | 10,139 | 10,398 | ||||||
Charges to provisions for contingencies and losses | 67,700 | 58,600 | ||||||
FINANCIAL EXPENSES | 324,415 | 290,162 | ||||||
NET FINANCIAL EXPENSE | € | (303,103 | ) | € | (231,286 | ) | ||
Page 27
3.18 EXCEPTIONAL ITEMS
In € | 12/31/2017 | 12/31/2016 | ||||||
Proceeds from the disposal of intangible assets and PP&E | € | — | € | 1,850 | ||||
EXCEPTIONAL INCOME | — | 1,850 | ||||||
Exceptional expenses on management transactions | 235 | 32 | ||||||
NCA of intangible asset and PP&E disposals | — | 1,758 | ||||||
EXCEPTIONAL EXPENSES | 235 | 1,790 | ||||||
NET EXCEPTIONAL ITEMS | € | (235 | ) | € | 60 | |||
3.19 INCOME TAX EXPENSE
In € | 12/31/2017 | 12/31/2016 | ||||||||||||||||||
Tax payable | Deferred tax | Total | Tax payable | Deferred tax | Total | |||||||||||||||
A2IA GROUP II | € | (100,085 | ) | € | 115 | € | (99,970 | ) | € | (82,710 | ) | € | 116 | € | (82,594 | ) | ||||
A2IA | 183,762 | (29,551 | ) | 154,211 | 191,404 | (45,448 | ) | 145,956 | ||||||||||||
A2IA CORP | 265,079 | — | 265,079 | 453,389 | — | 453,389 | ||||||||||||||
A2IA LLC | 2,028 | — | 2,028 | 1,173 | — | 1,173 | ||||||||||||||
TOTAL INCOME TAX EXPENSE | € | 350,784 | € | (29,436 | ) | € | 321,348 | € | 563,256 | € | (45,332 | ) | € | 517,924 | ||||||
Page 28
3.20 PROOF OF TAX
In € | A2IA GROUP II | A2IA | A2IA CORP | A2IA LLC | Total | ||||||||||||||||
Net income for the year | A | € | (1,157,817 | ) | € | 527,745 | € | 565,148 | € | 549 | € | (64,375 | ) | ||||||||
Income tax expense in the company accounts | (100,085 | ) | 183,762 | 265,079 | 2,028 | 350,784 | |||||||||||||||
Deferred tax | 115 | (29,551 | ) | — | — | (29,436 | ) | ||||||||||||||
Income tax recognized | B | (99,970 | ) | 154,211 | 265,079 | 2,028 | 321,348 | ||||||||||||||
Net income (loss) before tax | C = A +B | (1,257,787 | ) | 681,956 | 830,227 | 2,577 | 256,973 | ||||||||||||||
Permanent differences | D | 977,515 | 189,494 | (6,571 | ) | 7,562 | 1,168,000 | ||||||||||||||
Excess interest on convertible bonds | 7,315 | — | — | — | 7,315 | ||||||||||||||||
Provision for non-conversion of convertible bonds | 67,700 | — | — | — | 67,700 | ||||||||||||||||
Share of costs and expenses on dividends | 20,965 | 17,570 | — | — | 38,535 | ||||||||||||||||
CICE tax credit | — | (50,891 | ) | — | — | (50,891 | ) | ||||||||||||||
New York City tax / New York State tax | — | — | (21,112 | ) | — | (21,112 | ) | ||||||||||||||
Tax depreciation books | — | — | 7,386 | — | 7,386 | ||||||||||||||||
50% meals & entertainment | — | — | 7,206 | — | 7,206 | ||||||||||||||||
Goodwill amortization | 881,535 | 222,815 | — | — | 1,104,350 | ||||||||||||||||
Other | — | — | (51 | ) | 7,562 | 7,511 | |||||||||||||||
— | |||||||||||||||||||||
Items taxed at reduced rates | E | — | — | — | — | — | |||||||||||||||
Provisions for securities | — | — | — | — | — | ||||||||||||||||
Net capital gains on disposals of non-current assets | — | — | — | — | — | ||||||||||||||||
Net income before tax liable to the standard tax rate | F = C + D - E | (280,272 | ) | 871,450 | 823,656 | 10,139 | 1,424,973 | ||||||||||||||
Tax rate | G | — | — | — | — | — | |||||||||||||||
Theoretical tax expense at the standard tax rate | H = F x G | (93,424 | ) | 290,483 | 280,043 | 2,028 | 479,130 | ||||||||||||||
Income tax expense at reduced rates | I | — | — | — | — | — | |||||||||||||||
Total theoretical tax expense | J = H + I | (93,424 | ) | 290,483 | 280,043 | 2,028 | 479,130 | ||||||||||||||
Adjustments | K | (6,546 | ) | (136,272 | ) | (14,964 | ) | — | (157,782 | ) | |||||||||||
Research tax credit / Innovation tax credit | — | (181,326 | ) | — | — | (181,326 | ) | ||||||||||||||
Family tax credit | (6,545 | ) | (23,948 | ) | — | — | (30,493 | ) | |||||||||||||
New York city tax / New York State tax | — | — | 21,112 | — | 21,112 | ||||||||||||||||
Revised tax assessment | — | 68,998 | — | — | 68,998 | ||||||||||||||||
Deferred tax in company accounts | — | — | (10,590 | ) | — | (10,590 | ) | ||||||||||||||
Adjustments to prior year tax liabilities | — | — | (25,481 | ) | — | (25,481 | ) | ||||||||||||||
Differences in rates and other | (1 | ) | 4 | (5 | ) | — | (2 | ) | |||||||||||||
Restated theoretical tax expense | L = J + K | € | (99,970 | ) | € | 154,211 | € | 265,079 | € | 2,028 | € | 321,348 | |||||||||
Difference | B - L | — | — | — | — | — | |||||||||||||||
Page 29
3.21 CALCULATION OF NET INCOME (LOSS) PER SHARE
Net income (loss) per share is calculated by dividing net income for the year (attributable to owners of the Company) by the weighted average number of shares outstanding during the period, determined on a time apportioned basis.
Diluted net income is calculated by increasing the weighted average number of shares outstanding by the weighted average number of rights to shares attached to convertible bonds issues (see Note 3.7) and restating net income for the post-tax financial expense associated with these borrowings.
Calculation of earnings per share | Fiscal year 12/31/2017 | Fiscal year 12/31/2016 | ||||||
Weighted average number of shares | 9,937,620 | 9,937,620 | ||||||
Weighted average number of rights to shares on convertible bonds | 550,000 | 550,000 | ||||||
TOTAL WEIGHTED AVERAGE NUMBER OF SHARES | 10,487,620 | 10,487,620 | ||||||
NET INCOME (ATTRIBUTABLE TO OWNERS OF THE COMPANY) | € | (64,375 | ) | € | 248,202 | |||
DILUTED NET INCOME (LOSS) | € | (50,937 | ) | € | 260,998 | |||
NET INCOME (LOSS) PER SHARE | € | (0.01 | ) | € | 0.03 | |||
DILUTED NET INCOME (LOSS) PER SHARE | € | (0.01 | ) | € | 0.03 | |||
3.22 MANAGEMENT COMPENSATION
Compensation paid to members of management bodies is not disclosed as it would result in the disclosure of individual compensation.
3.23 STATUTORY AUDIT FEES
Statutory audit fees expensed in 2017 total €47,283.
3.25 OFF-BALANCE SHEET COMMITMENTS
3.25.1 Commitments given
Financing commitments
A2IA GROUP II granted a pledge over its A2IA GROUP shares in favor of CIC EST and SOCIETE GENERALE in guarantee of the €5,500,000 loan granted by these banks to finance the acquisition of the A2IA GROUP shares.
This pledge was transferred to the A2IA shares by a deed dated June 15, 2015 following the comprehensive transfer of the assets of A2IA GROUP to A2IA GROUP II.
This loan was accompanied by a number of reporting commitments, commitments requiring or prohibiting actions and a commitment to comply with financial ratios.
3.25.2 Commitments received
None.
3.26 RECONCILIATION FROM FRENCH GAAP TO US GAAP
The Company’s accounting policies comply with generally accepted accounting principles in France (“French GAAP”) (see note 2.3). Elements of the Company’s accounting policies which differ significantly from generally accepted accounting principles in the United States (“US GAAP”) are described below:
Page 30
3.26.1 Revenue recognition
In the consolidated financial statements prepared under French GAAP, revenue from the maintenance can be recognized at the time of the sale of the software. Under US GAAP, the revenue allocated to the maintenance services should be recognized ratably over the period as the services are performed.
The impact is €210 thousand and €87 thousand on the net income for the years ended December 31, 2017 and 2016, respectively.
3.26.2 Accounting for goodwill
In the consolidated financial statements prepared under French GAAP, goodwill are amortized on a straight-line basis over their estimated useful lives, which generally does not exceed 20 years. Under US GAAP, goodwill are not amortized, but are tested for impairment annually and whenever there is an indication of impairment.
The impact is €1,104 thousand on net income for the periods presented, resulting from the derecognition of the amortization of goodwill in the consolidated income statement under French GAAP.
3.26.3 Deferred taxes
As a result of the French GAAP to US GAAP differences identified above that have affected the carrying amount of certain assets and liabilities, the deferred taxes asset and liability balances under US GAAP have been adjusted, resulting in negative impacts of €85 thousand and €29 thousand for the years ended December 31, 2017 and 2016, respectively.
Page 31
Reconciliation of the Unaudited Financial Information from French GAAP to US GAAP
Net income
(amounts are presented in thousands of euros) | Period ended December 31, | ||||||
2017 | 2016 | ||||||
As reported under French GAAP | € | (64 | ) | € | 248 | ||
Total adjustments of which: | 971 | 1,047 | |||||
Revenue recognition | (209) | (86) | |||||
Goodwill | 1,104 | 1,104 | |||||
Income tax expense | 76 | 29 | |||||
As reported under US GAAP | € | 907 | € | 1,295 | |||
Shareholders’ equity
(amounts are presented in thousands of euros) | As of December 31, | ||||||
2017 | 2016 | ||||||
As reported under French GAAP | € | 12,627 | € | 12,910 | |||
Total adjustments of which: | 8,246 | 7,433 | |||||
Goodwill | 8,597 | 7,493 | |||||
Revenue recognition | (351) | (59) | |||||
As reported under US GAAP | € | 20,873 | € | 20,344 | |||
Total assets
(amounts are presented in thousands of euros) | As of December 31, | ||||||
2017 | 2016 | ||||||
As reported under French GAAP | € | 21,079 | € | 21,832 | |||
Total adjustments of which: | 8,150 | 7,254 | |||||
Goodwill | 8,597 | 7,493 | |||||
Accounts receivable | (447) | (239) | |||||
As reported under US GAAP | € | 29,229 | € | 29,086 | |||
Page 32